Embed Size (px)
Citation preview

Consumer Staples
Chris Ensign
July 15, 2015

SIM Portfolio Holdings
• Whole Foods Market
• 3.86% in Portfolio
• Molson Coors
• 4.53% in Portfolio

Sector Weight Comparison
C Discret
C Staple
Energy
Financial
Health C
Indust
IT
Material
Telecom
Utilities
C Discret
C Staple
Energy
Financial
Health C
Indust
IT
Material
Telecom
Utilities
S&P 500
9.43%
SIM Portfolio
8.39%

Sector Overview
• Defensive / Non Cyclical
• Demand remains constant through good and bad economies
• Consumers are unwilling or unable to cut consumer staple products from shopping
• Part of routine buying
• Modest but consistent returns
• Mature products offer little growth opportunities
• Growth is often expansion in to new geographic territories or consolidation

Sector Components

Economic Factors & Industry Outlook
• Little relative economic exposure because of the nature of the products – Consumer Price Index
– Consumer Confidence
– Unemployment
– Commodity Prices
– Dollar Value
• High Intensity of Rivalry – Little differentiation
• High Buyer Power – Low switching costs
• Low Supplier Power – Many suppliers for few large
retailers
• Low Threat of New Entrants – High brand recognition
– Economies of scale
– Incumbent advantages
• Low Threat of Substitutes – Many brands are ingrained in
our culture

Valuation Metrics
0
5
10
15
20
25
P/E
P/B P/S
P/E
BIT
SA
High
Low
Median
Current
0
0.2
0.4
0.6
0.8
1
1.2
1.4
1.6
1.8
2
P/E
P/B
P/S
P/E
BIT
SA
High
Low
Median
Current
Absolute Relative to S&P

Summary of Recommendations
• – Hold
• – Sell
• – Buy

• Current Price = $71.09
• 52 week High = 79.18
• 52 week Low = 66.17
• Beta = 1.00
• Market Cap = 11,366.4
• Div Yield = 2.30% 50
55
60
65
70
75
80
Aug-1
4
Sep
-14
Oct
-14
Nov-
14
Dec
-14
Jan-
15
Feb-1
5
Mar
-15
Apr-
15
May
-15
Jun-1
5
Jul-1
5
One of the world’s largest beer producers, with brands such as Coors
Light, Molson Canadian, Carling, Blue Moon, Keystone Light and Cobra
as well as distributing other brands such as Miller and Heineken under
license
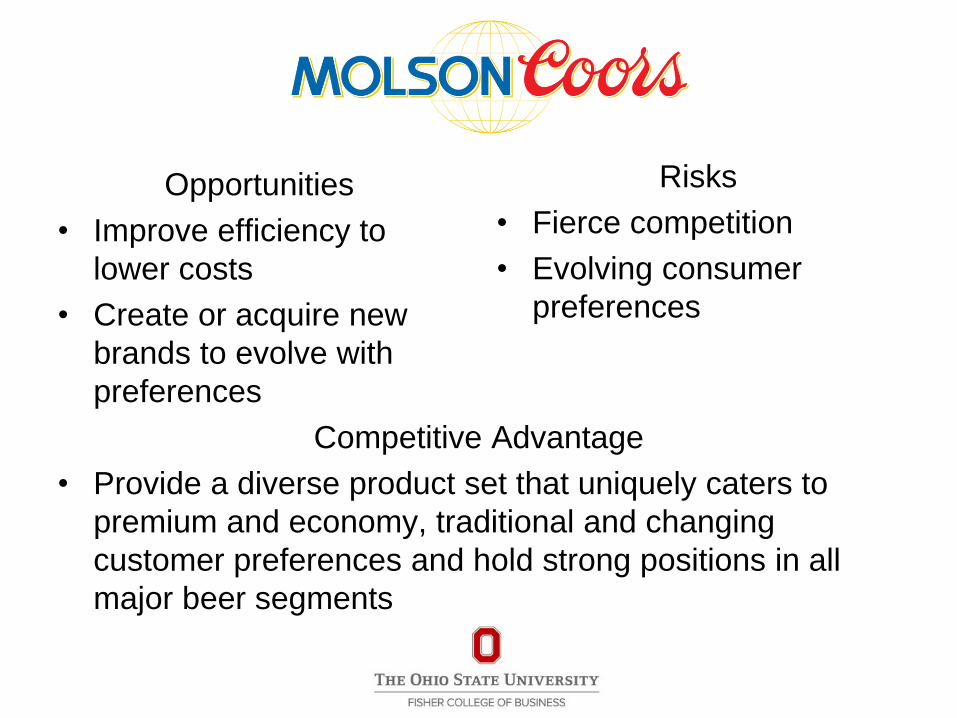
Opportunities
• Improve efficiency to
lower costs
• Create or acquire new
brands to evolve with
preferences
Risks
• Fierce competition
• Evolving consumer
preferences
Competitive Advantage
• Provide a diverse product set that uniquely caters to
premium and economy, traditional and changing
customer preferences and hold strong positions in all
major beer segments

Market
Cap
Revenue Gross
Margin
Net
Income
EPS P/E P/S
11.4 4.03 40% 0.427 2.31 30.73 3.28
203.51 46.91 60% 10.52 6.32 20.05 4.13
45.47 21.3 39% 1.68 2.91 27.19 2.05


Current Price = $71.09
Target Price = $72.71
Potential Upside = 2.3%
Recommendation
Hold at 4.58%

• Current Price = $40.80
• 52 week High = $57.57
• 52 week Low = $36.08
• Beta = 0.81
• Market Cap = 14,130.6
• Div Yield = 1.30%
30
35
40
45
50
55
60
Aug-1
4
Sep
-14
Oct
-14
Nov-
14
Dec
-14
Jan-
15
Feb-1
5
Mar
-15
Apr-
15
May
-15
Jun-1
5
Jul-1
5
The leading retailer of natural and organic foods, the first “Nationally
Certified” organic grocer, and uniquely positioned as “America’s Healthiest
Grocery Store.”

Opportunities
• Increasable Footprint
• Loyal customer base that
is willing to pay more for
premium products
Risks
• Increasing competition
from powerful retail giants
• Aggressive growth
strategy with unproven
new chain concept
Competitive Advantage
• Offer a rare set of premium health conscious consumer
products that are naturally, organically and locally
sourced with a unique shopping experience

Market
Cap
Revenue Gross
Margin
Net
Income
EPS P/E P/S
14.1 14.95 35% 0.605 1.66 24.59 0.98
37.08 108.56 22% 1.83 3.71 20.60 0.34
4.07 3.1 30% 0.111 0.72 36.78 1.32


Current Price = 40.80
Target Price = $38.62
Potential Downside = 5.3%
Recommendation
Sell all from 3.86% to 0%
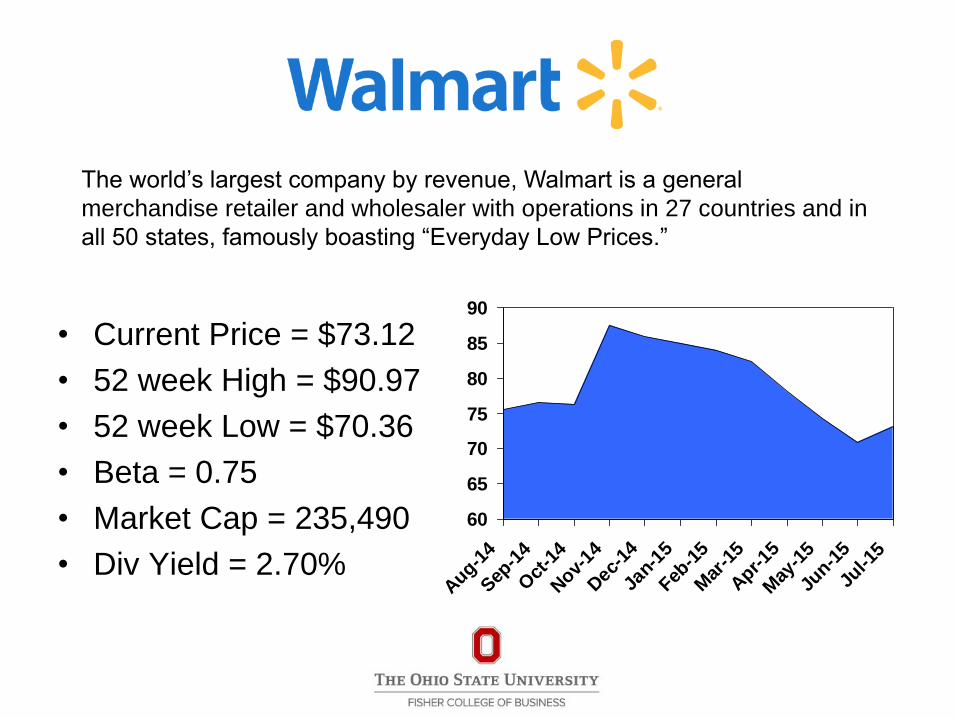
• Current Price = $73.12
• 52 week High = $90.97
• 52 week Low = $70.36
• Beta = 0.75
• Market Cap = 235,490
• Div Yield = 2.70%
60
65
70
75
80
85
90
Aug-1
4
Sep
-14
Oct
-14
Nov-
14
Dec
-14
Jan-
15
Feb-1
5
Mar
-15
Apr-
15
May
-15
Jun-1
5
Jul-1
5
The world’s largest company by revenue, Walmart is a general
merchandise retailer and wholesaler with operations in 27 countries and in
all 50 states, famously boasting “Everyday Low Prices.”

Opportunities
• Internet retailing
• Entering natural food
grocery market
• Incredible strength
among suppliers and
superior logistics
Risks
• Fierce competition among
peers
• Increased pressure to
raise wages
Competitive Advantage
• Offer everyday low prices, invest to differentiate on
access, be competitive on assortment and deliver a
great experience

Market
Cap
Revenue Gross
Margin
Net
Income
EPS P/E P/S
235.49 485.52 25% 15.84 4.98 14.69 0.48
65.72 115.94 13% 2.31 5.22 27.34 0.53
53.58 73.08 30% 2.53 3.92 21.39 0.73


Current Price = $73.12
Target Price = $84.09
Potential Upside = 15.0%
Recommendation
Buy – 4.5%

Conclusion
• Hold at 4.53 %
• Sell and decrease from 3.86% to 0%
• Buy and increase from 0% to 4.5%