Embed Size (px)
Citation preview

Deutsche Bank Markets Research
Europe United Kingdom Consumer Staples
Industry
European Consumer Staples
Date 25 March 2014
Recommendation Change
Emerging Exposure
We may not yet have reached the final impasse of investor capitulation in Staples. History suggests further EM related downgrades to come. Over the longer term, potential growth in EM per capita consumption is a very significant multi-year driver of all Staples categories; spirits and various home care and personal care categories appear best placed. Outright catalysts in Staples are rare. Opportunities are typically only 'obvious' in hindsight. EM sentiment will eventually turn playing to the per capita consumption opportunity. Recognising performance may be subdued for a number of months our top picks are BAT, Beiersdorf, Diageo, RB and Unilever.
Emerging Exposure
Gerry Gallagher
Research Analyst (+44) 20 754-50251 [email protected]
Harold Thompson
Research Analyst (+44) 20 754-51886 [email protected]
________________________________________________________________________________________________________________
Deutsche Bank AG/London
Deutsche Bank does and seeks to do business with companies covered in its research reports. Thus, investors should be aware that the firm may have a conflict of interest that could affect the objectivity of this report. Investors should consider this report as only a single factor in making their investment decision. DISCLOSURES AND ANALYST CERTIFICATIONS ARE LOCATED IN APPENDIX 1. MICA(P) 054/04/2013.


Deutsche Bank Markets Research
Europe United Kingdom Consumer Staples
Industry
European Consumer Staples
Date 25 March 2014
Recommendation Change
Emerging Exposure
Emerging Exposure
________________________________________________________________________________________________________________
Deutsche Bank AG/London
Deutsche Bank does and seeks to do business with companies covered in its research reports. Thus, investors should be aware that the firm may have a conflict of interest that could affect the objectivity of this report. Investors should consider this report as only a single factor in making their investment decision. DISCLOSURES AND ANALYST CERTIFICATIONS ARE LOCATED IN APPENDIX 1. MICA(P) 054/04/2013.
Gerry Gallagher
Research Analyst (+44) 20 754-50251 [email protected]
Harold Thompson
Research Analyst (+44) 20 754-51886 [email protected]
Key Changes
Company Target Price Rating
DGE.L 2,200.00 to 2,050.00(GBP)
-
PERP.PA - Sell to Hold
SWMA.ST NA to 193.00(SEK)
NR to Hold
CPRI.MI NA to 5.60(EUR) NR to Hold
HEIN.AS 60.00 to 50.00(EUR)
Buy to Hold
RCOP.PA NA to 56.50(EUR) NR to Hold
NESN.VX 60.00 to 65.00(CHF)
-
Source: Deutsche Bank
Top picks
BAT (BATS.L),GBP3,213.50 Buy
Beiersdorf (BEIG.DE),EUR68.93 Buy
Diageo (DGE.L),GBP1,819.50 Buy
RB (RB.L),GBP4,825.00 Buy
Unilever Plc (ULVR.L),GBP2,426.00 Buy
Source: Deutsche Bank
We may not yet have reached the final impasse of investor capitulation in Staples. History suggests further EM related downgrades to come. Over the longer term, potential growth in EM per capita consumption is a very significant multi-year driver of all Staples categories; spirits and various home care and personal care categories appear best placed. Outright catalysts in Staples are rare. Opportunities are typically only 'obvious' in hindsight. EM sentiment will eventually turn playing to the per capita consumption opportunity. Recognising performance may be subdued for a number of months our top picks are BAT, Beiersdorf, Diageo, RB and Unilever.
Balancing the near and long-term Staples valuations have become more attractive over the last 12 months but the risk to forecasts remains to the downside, largely driven by EMs. EM sentiment should change; it usually does. While cognisant of shorter-term considerations, over the longer-term a number of categories have exceptional EM growth opportunities based on per cap consumption relative to DMs. Analysing per capita consumption and US$ price/mix trends since 1998 we detail medium-term EM per cap growth forecasts for 22 Staples categories. Spirits and various home care and personal care categories appear best placed to exploit long term EM growth, with tobacco’s pricing model also supportive.
Exposed to the downside Post the 1997/8 EM crisis average EM per capita sales in our universe declined 2.4% pa to 2002 in US$ terms. We highlight beer (-4.2% pa) though other categories fared little better. The difference is beer is forecast as our lowest ranked EM growth category. We downgrade Heineken to HOLD. In a sub-sector of four Holds, SAB has the best EM profile and is our preferred stock.
Recommendation changes and top picks Heineken downgraded to HOLD from Buy (price target from €60 to €50). Pernod upgraded to HOLD from Sell (price target unchanged €75). We separately initiate Campari, Remy Cointreau and Swedish Match; all HOLD.
BAT (BUY; price target 3600p) Highest tobacco EM exposure. EM per caps to decline but tobacco price/mix best in Staples supporting strong growth in EM gross margins.
Beiersdorf (BUY; price target €85) EMs 45% of sales. Skin care focus. EM skin care per caps low with forecast medium term EM per cap revenue growth 8.1% pa.
Diageo (BUY; price target 2050p, revised from 2200p) Short term concerns though limited China cognac exposure. Longer term: EMs 41% of sales. Outstanding opportunity in whisky and vodka.
RB (BUY; price target 5100p) EMs 36% of sales. Exceptional opportunity in a number of categories with majority at or above Staples’ average EM per cap revenue forecasts (6.8% pa).
Unilever (BUY; price target €33) EMs 57% of sales with c. two-thirds in personal care where growth rates are potentially significantly higher than Staples’ average. High exposure to India.

25 March 2014
Consumer Staples
European Consumer Staples
Page 2 Deutsche Bank AG/London
Table Of Contents
Executive Summary ............................................................. 3 Short term concerns; long term rewards ............................................................. 3 Emerging Exposure .............................................................................................. 5 Favoured stocks ................................................................................................. 12 Recommendation changes ................................................................................. 14 Price target changes ........................................................................................... 15
Investment Thesis ............................................................. 17 EM per capita consumption and price/mix ........................................................ 18 Where are we now? ........................................................................................... 23 Déjà vu averted? ................................................................................................. 28
Methodology ..................................................................... 31 EMs the driver of growth ................................................................................... 31 Why per capita consumption matters: first principles ....................................... 34 DM pricing and FX .............................................................................................. 36
The House View ................................................................ 39 EM exposure now providing an opportunity? .................................................... 39
Per Capita Consumption .................................................... 43 Beverages: Beer .................................................................................................. 44 Beverages: Whisky ............................................................................................. 50 Beverages: Vodka ............................................................................................... 53 Beverages: CSDs ................................................................................................ 57 Beverages/Food: Bottled Water ......................................................................... 61 Food: Packaged Food (Pack. Food) .................................................................... 65 Food: Dairy ......................................................................................................... 69 Food: Yoghurt & Sour Milk Products (Yoghurt) ................................................. 72 Food: Infant Milk Formula (IMF) ......................................................................... 75 Food: Prepared Baby Food (PBF) ....................................................................... 78 Food: Chocolate Confectionary (Chocolate) ...................................................... 81 Food: Coffee ....................................................................................................... 85 Food: Pet Care .................................................................................................... 88 Food: Ice Cream ................................................................................................. 91 Home Care: Aggregate data ............................................................................... 94 Home Care: Auto Dishwash (Auto DW) ............................................................. 97 Home Care: Air Care ......................................................................................... 101 Personal Care .................................................................................................... 104 Personal Care: Deodorants ............................................................................... 107 Personal Care: Skin Care .................................................................................. 110 Personal Care: Shampoo .................................................................................. 113 Tobacco ............................................................................................................ 117
EM Exposure by Company .............................................. 123
Population 2012-2025 ..................................................... 143
Addendum: “What’s the catalyst?” ................................ 149
Addendum: Credit Impulse ............................................. 155
Addendum: Mr Market .................................................... 159
Addendum: Staples in Context ........................................ 161
Valuation & Risks ............................................................ 163

25 March 2014
Consumer Staples
European Consumer Staples
Deutsche Bank AG/London Page 3
Executive Summary
Short term concerns; long term rewards
Analysed 22 categories across 21 EMs We have analysed 22 consumer categories1 across 21 EMs2 ranging from shampoo to pet care; Bangladesh to Columbia. We have focussed on potential increases in per capita consumption based on DM3 levels and US$ price/mix trends.
Conclusions based on hard currency historical analysis are critical (as current concerns regarding EM currencies testify). We have analysed historical price/mix with reference to average US$ rates in each year 1998-2012 and broken our analysis down into various time frames.
Three key points First, Staples over index in EMs relative to the wider market. Prospects for growth in EMs are key to the short and long-term outlook for Staples. EMs are currently a recurring negative theme. We may not yet have reached the final impasse of investor capitulation in Staples.
We need to be clear: further earnings downgrades are very possible as a consequence of, but not restricted to: FX translation; short term weak EMs; weakness in some DM markets and category specific issues.
Despite sector valuations becoming more attractive (the 1 year prospective P/E relative of 132 is in line with the long-run average and below Jan 2013’s 156), until investors are more comfortable with EMs, Staples are likely to continue to underperform in the short term. As history has shown on numerous occasions, the market can take its interpretation of relative value to extremes.
Second, depending on the severity of current EM issues, US$ per capita sales in EMs may remain under pressure for some time. Recognising the EM crisis of 1997/8 was somewhat more extreme than the current outlook for EMs, of the 22 Staples categories we analysed only three saw EM per cap sales increase in US$ terms post the fall-out of the crisis over the period 1998-2002 (auto dishwash (+4.9%), prepared baby food (+2.8%) and skin care (+0.2)).
1 Beer, whisky, vodka, CSDs, bottled water, packaged food, dairy, yoghurt, infant milk formula, prepared baby food, chocolate confectionary, coffee, pet care, ice cream, home care, auto dishwash, air care, personal care, deodorant, skin care, shampoo, tobacco. 2 The selection of emerging markets (EMs) comprise: Argentina; Bangladesh; Brazil; China; Columbia; Egypt; Ethiopia; India; Indonesia; Kenya; Mexico; Nigeria; Pakistan; Philippines; Poland; Russia; South Africa; Thailand; Turkey; Ukraine; Vietnam and comprise 65% of the World Bank estimates for 2012 global population, i.e. 4566m against a world population of 7046m 3 The selection of developed markets (DMs) comprise: USA; UK; France; Germany; Japan; Australia
Figure 1: Staples PE relative
60
80
100
120
140
160
180
200Ja
n-01
Jul-0
1Ja
n-02
Jul-0
2Ja
n-03
Jul-0
3Ja
n-04
Jul-0
4Ja
n-05
Jul-0
5Ja
n-06
Jul-0
6Ja
n-07
Jul-0
7Ja
n-08
Jul-0
8Ja
n-09
Jul-0
9Ja
n-10
Jul-1
0Ja
n-11
Jul-1
1Ja
n-12
Jul-1
2Ja
n-13
Jul-1
3Ja
n-14
Historic Staples REL P/E Prospective Staples REL P/E
Avg Historic REL P/E Avg Prospective REL P/E
Source: Deutsche Bank; Datastream

25 March 2014
Consumer Staples
European Consumer Staples
Page 4 Deutsche Bank AG/London
Of the Staples sub-sectors beer appears most exposed to continued EM weakness: 1998-2002 beer per cap EM sales fell 4.2% pa. Surprisingly tobacco (ex China) sales fell more (5.0% pa). Despite this we are significantly more comfortable with tobacco in a prolonged EM.
Of the other weakest categories 1998-2002 (deodorant; vodka; coffee) those companies exposed to these categories have positive offsets elsewhere in their portfolio based on 1998-2002 performance (e.g. skin care vs. deodorant; whisky vs. vodka; yoghurt/prepared baby food/chocolate vs. coffee). In addition, vodka and deodorant are such immature categories in numerous markets that the data is potentially overstating the impact 1998-2002.
Within beer, SAB is our preferred stock given its exposure to low African per capita consumption.
Third, irrespective of short-term concerns the long term prognosis for Staples in EMs is extremely positive. Many categories have only just begun to penetrate EMs (see Figure 3). Our medium term EM per cap revenue growth forecasts range from +4.0% in beer (our relatively negative stance on beer is within Staples, not beer as a category in its own right) to +9.6% in auto dishwash (a key category for RB).
Figure 3: EM per capita consumption relative to DMs 2012
0%
10%
20%
30%
40%
50%
60%
70%
80%
90%
100%
Aut
o D
W
Vod
ka
Ice
Cre
am
Whi
sky
Air
Car
e
Pet
Car
e
Cho
cola
te
PB
F
Dai
ry
Ski
n C
are
Hom
e C
are
Cof
fee
Ave
rage
Yog
hurt
Deo
dora
nt
CS
Ds
Pac
k. F
ood
Per
s. C
are
Sha
mpo
o
Bee
r
IMF
Bot
. Wat
er
Toba
cco
Source: Deutsche Bank estimates; the lower the value, the greater the upside, i.e. auto dishwash has hardly begun to penetrate EMs, tobacco is the most penetrated product
We forecast EM per cap revenue growth over the medium term on average of 6.8% pa across the 22 categories we analysed with population growth of 0.9% taking EM revenue forecasts to 7.8% pa. Recognising shorter term concerns, our favoured stocks are BAT; Beiersdorf; Diageo; RB and Unilever.
Figure 2: EM per cap revenue growth 1998-2002 US$
-8%
-6%
-4%
-2%
0%
2%
4%
6%
Deo
dora
nt
Vod
ka
Toba
cco
Cof
fee
Beer
Per
s. C
are
Sham
poo
Ice
Cre
am
Dai
ry
Pac
k. F
ood
CSD
s
Whi
sky
Bot.
Wat
er
Ave
rage
Pet
Car
e
Hom
e C
are
Cho
c.
Air
Car
e
Yogh
urt
IMF
Ski
n C
are
PBF
Auto
DW
Source: Deutsche Bank estimates; Euromonitor; US$ average rates for each year; vodk ex Russia, Poland and Ukraine. Tobacco ex China.

25 March 2014
Consumer Staples
European Consumer Staples
Deutsche Bank AG/London Page 5
Our analysis in this note of Nestlé’s major categories confirms what Nestlé is in our view; a high quality business. We have increased our price target to CHF65 from CHF60. Within the confines of a current Hold recommendation we have little doubt of Nestlé’s ability to drive superior returns over the long term.
In Figure 4 we outline average growth for our Staples categories in DMs and EMs and see that EMs will grow almost twice as fast as DMs.
It is important to understand three key drivers. First, virtually all population growth through to 2025 will be in EMs. Second, our per capita consumption growth forecasts are not aggressive as compared to current EM per capita consumption relative to DMs. Third, and most important, we have modeled EMs in US$ terms based on historical average FX rates for each year.
Clearly performance will not be uniform from one year to the next. Nevertheless the end result of the respective compounding at 4.0% for DMs and 7.8% for EMs is that we estimate in 10 years DM per cap revenues will grow c48% and EMs c110% in US$ terms.
Figure 4: EM and DM Staples growth forecasts US$ terms EMs DMs
Per cap volume 3.9% 0.6%
Price/mix 2.8% 3.1%
Population 0.9% 0.3%
Revenue growth 7.8% 4.0%
DB forecasts Year 0 1 2 3 4 5 6 7 8 9 10
EMs 100.0 107.8 116.2 125.3 135.0 145.5 156.9 169.1 182.3 196.5 211.8
DMs 100.0 104.0 108.2 112.6 117.1 121.8 126.7 131.9 137.2 142.7 148.4
Difference 3.6% 7.4% 11.3% 15.3% 19.5% 23.8% 28.3% 32.9% 37.7% 42.7%Source: Deutsche Bank; unweighted, we have not weighted by category as two categories dominate; packaged food and tobacco
Emerging Exposure
c1bn new consumers by 2025 By 2025 the World Bank estimates global population will grow by 14%. The vast bulk of population growth will be in EMs with India, China and Nigeria contributing over 29%. Other major contributors are Pakistan, Indonesia, Ethiopia and, perhaps surprisingly, the USA.
While this note focuses on EMs we consider the US a favourable market for Staples companies: per capita consumption is high but population growth and political and economic stability compensate (the US$ remains the benchmark ‘hard currency’). By 2025 the USA remains the world’s third largest country by population (314m in 2012 to 342m in 2025).
From a population perspective Eastern Europe is not a favoured region. Of the 21 EMs we reviewed only three had forecast population declines to 2025: Russia (-12m); Ukraine (-6m) and Poland (-2m). Russia and Ukraine’s populations are forecast to decline at a faster rate than Japan’s to 2025.
Figure 5: Population growth (m people) 2012-2025
957m , 14% of 2012 world population
182(19%)
71(7%)
65(7%) 39
(4%)35
(4%)33
(3%)28
(3%)23
(2%)23
(2%)19
(2%)17
(2%)16
(2%)16
(2%)10
(1%)0
100
200
300
400
500
600
700
800
900
1000
Wor
ld
Indi
a
Nig
eria
Chi
na
Pak
ista
n
Indo
nesi
a
Eth
iopi
a
US
A
Bgl
dsh.
Phi
lpns
.
Bra
zil
Mex
ico
Egy
pt
Ken
ya
Turk
ey
Source: World Bank. Data for each country is m people population growth and % in parenthesis is contribution to world population growth of 957m people.

25 March 2014
Consumer Staples
European Consumer Staples
Page 6 Deutsche Bank AG/London
The sector is called ‘Staples’ for a reason People consume Staples products... a lot.... often on more than one occasion each day. Population drivers are important, but per capita consumption levels are critical. Low per capita consumption levels in EMs, supported by positive DM category fundamentals (indicating an attractive consumer proposition) can drive strong growth in EMs.
Per capita consumption forecasts Our per capita consumption growth forecasts in EMs range from +8.2% pa in auto dishwash to –2.5% pa in tobacco. EM population is forecast to grow 0.9% pa effectively adding c1% to all volume growth forecasts in EMs.
Price/mix forecasts Future price/mix conclusions range from +9.6% in tobacco (manufacturer pricing, not retail) to 0.6% in bottled water.
Price/mix has been subdued Over an extended period EM inflation can support pricing but invariably EM currency devaluations unwind perceived relative pricing power when compared to DMs. We have analysed price/mix over 14 years and conclude average price/mix across the categories and EM countries we have analysed was 2.6% in US$ terms; lower than the 3.1% (US$ terms) average of our DM comparator group, see Figure 6.
Figure 6 also shows price/mix was negative 1998-2002 following significant EM currency weakness post the 1997/8 EM crisis. Three key points can be made:
First, over the long-term, as the period 1998-2012 shows, EM growth in Staples relative to DMs is driven by population growth and higher per cap penetration; not perceived superior price/mix
Second, although price/mix is illusory over the very long-term, over an extended period EM price/mix can be high, and superior to DMs, via an extended mis-match of the inflation/FX trade-off. Figure 6 shows that price/mix in EMs was 1.4% points ahead of DMs each year for ten years 2002-2012, post the impact of the 1997/8 EM crisis. We currently appear to be in the process of seeing 10 years of FX/inflation mis-match in EMs unwinding
Third, (and rather obviously) as the period 1998-2002 shows, an extended period of EM currency weakness can undermine EM top line performance. Current EM concerns have been prevalent for c12 months, but as we argue in subsequent sections, EM concerns currently are somewhat less extreme than they were in 1997/8.
Figure 6: Staples Price/Mix in DMs and EMs (US$)
-1.1%
7.0%
2.6%
4.8%
3.1%
-5.8%
8.2%
4.2%
6.2%
2.6%
-4.7%
1.2% 1.7% 1.4%
-0.4%
-8%
-6%
-4%
-2%
0%
2%
4%
6%
8%
10%
1998-2002 2002-2007 2007-2012 2002-2012 1998-2012
DM Price/Mix EM Price/Mix Differential (EM less DM)
Source: Deutsche Bank estimates; rounding may impact differentials

25 March 2014
Consumer Staples
European Consumer Staples
Deutsche Bank AG/London Page 7
Favoured and Least favoured Categories Figure 7 details are most favoured and least favoured Staples categories in EMs over the medium term on a per capita revenue basis.
Figure 7: EM Per Capita Forecasts Volume Price/mix Revenue
Most Favoured
Auto dishwash 8.2% 1.3% 9.6%
Prepared baby food 5.5% 3.4% 9.1%
Whisky 6.5% 1.7% 8.3%
Skin care 6.0% 2.0% 8.1%
Vodka 7.0% 1.0% 8.1%
Least Favoured
Dairy* 2.4% 3.2% 5.7%
Packaged food 1.4% 3.7% 5.2%
Bottled water** 4.5% 0.6% 5.1%
CSDs*** 1.4% 3.2% 4.6%
Beer 1.5% 2.5% 4.0%Source: Deutsche Bank; *yoghurt more relevant to Danone and Nestle with forecast revenue growth of 7.0%; **see specific comments in bottled water section, we expect Danone and Nestle to outperform this rate of growth; ***we estimate CCH will slightly outperform and achieve c5% EM per cap sales growth. Vodka shown ex Russia, Poland and Ukraine. In all our calculations we use the equation (1+volume growth)*(1+revenue growth) -1 to derive our revenue growth forecast. Some commentators simply aggregate the volume and revenue growth. Here our calculation gives 4.04%, rounded to 4.0% as per the simple aggregation. Elsewhere our revenue growth forecasts are 0.1% or 0.2% points above the simple aggregation method. Vodka is shown ex Russia, Poland & Ukraine
Favoured: Auto dishwash and prepared baby food Auto dishwash and prepared baby food are not the biggest categories, but are important to three companies in our universe: RB; Nestle and Danone.
Per capita consumption in auto dishwash is currently only c6% in EMs relative to DMs, and DM per caps are growing steadily (0.8% CAGR pa). As Figure 7 shows, our price/mix assumptions are not aggressive (+1.3% pa). This is reflective of our data set where auto dishwash is the only category we have reviewed where EM price per unit appears to be materially above DMs in US$ terms.
While price per unit in EMs materially above DMs appears counter intuitive, we have nevertheless modelled price/mix based on our data set, resulting in a conservative forecast of 1.3% pa. Irrespective of auto dishwash being our most preferred category with revenue per cap growth forecast at 9.6%, the risk to our forecasts, we believe, is to the upside.
Prepared baby food EM per capita consumption has grown steadily but is still less than 25% of DMs hence our 5.5% pa forecast growth rate. We have also modelled based on historical EM growth rates. Price/mix in EM prepared baby food has been +5.1% pa in US$ terms over the last 14 years but pricing relative to DMs is high. Accordingly we model pricing in line with DMs’ historical average +3.4%.
Figure 8: Auto DW per cap. consumption indexed
0
20
40
60
80
100
120
1998
1999
2000
2001
2002
2003
2004
2005
2006
2007
2008
2009
2010
2011
2012
Developed Market universe Emerging Market universe
Source: Deutsche Bank; Euromonitor; index takes DM in 1998 as the base at 100

25 March 2014
Consumer Staples
European Consumer Staples
Page 8 Deutsche Bank AG/London
Favoured: whisky and vodka Whisky and vodka clearly support Diageo and Pernod. Whisky per capita consumption in EMs is only c16% of DMs. Per caps have grown steadily in EMs and are now set against a background of growing per caps in DMs. The outlook for whisky appears very positive in EMs though we recognise EM growth in 2014 is likely to be subdued.
We have considered vodka ex Eastern Europe where the data is distorted by low priced local brands and where the major players have no significant presence. On this basis the per cap outlook for vodka is even more encouraging than whisky, with the category consistently showing an ability to overcome what would otherwise appear to be significant structural hurdles4. DM per capita consumption has grown steadily over the last 14 years (c5% pa), as have those in EMs but EM per caps are only 8% of those in DMs (ex Russia, Poland and Ukraine).
Our price/mix forecasts for whisky and vodka are relatively low as pricing is already close to that of DMs indicating a disproportionate premiumisation of each category in EMs which, we assume, will unwind as each category matures.
Figure 9: Whisky per cap. consumption indexed Figure 10: Vodka per cap. consumption indexed
0
10
20
30
40
50
60
70
80
90
100
1998
1999
2000
2001
2002
2003
2004
2005
2006
2007
2008
2009
2010
2011
2012
Developed Market univerese Emerging Market universe
0
50
100
150
200
250
300
350
1998
1999
2000
2001
2002
2003
2004
2005
2006
2007
2008
2009
2010
2011
2012
DM universe EM universe EM universe (ex Russia, Ukraine and Poland)
Source: Deutsche Bank; Euromonitor; index takes DM in 1998 as the base at 100 Source: Deutsche Bank Euromonitor; index takes DM in 1998 as the base at 100
Favoured: skin care Skin care is positive for Beiersdorf, L’Oreal, Unilever and, to a small degree, Nestle. Relatively high EM skin care growth is supported by three factors: steadily increasing DM per capita consumption (2.8% CAGR); steadily increasing EM per caps (6.7% CAGR); still low relative EM per cap consumption rates (30% of those in DMs).
Least favoured: beer As Figure 7 and our population comments regarding Eastern Europe suggest, we see beer combined with a high Eastern European exposure as a negative. While this is not a new investor theme a significant element of investor concern has been based on excise driven price increases in Russia: we believe the issue for beer is more fundamental.
4 The USA government Code of Federal Regulations defines vodka as “...without distinctive character, aroma, taste or colour”.

25 March 2014
Consumer Staples
European Consumer Staples
Deutsche Bank AG/London Page 9
Though something of a consensual view, the outlook for Carlsberg remains difficult and Heineken’s exposure to Western Europe combined with some exposure to Eastern Europe has led us to cut our recommendation from Buy to Hold.
Although an extreme interpretation, we can argue that the multi-year opportunity in beer is somewhat shorter dated than other categories (though still beyond the time-frame of the vast majority of investors): there is an argument to suggest that as EM consumer and societal preferences reflect DMs, EM per caps will never reach the heights of current DM per caps, never mind those at the start of our 1998 reference period. As these changes take hold, DM and EM per cap consumption rates ‘meet in the middle’. That point, based on CAGR growth rates for EMs and declines for DMs is in 2030 (see Figure 11).
Per cap consumption has climbed every year in our EM universe from 1998 at an average rate of 1.9% points providing a degree of support to the assumption of medium term growth, but if there is logic in the ‘meet in the middle’ argument, then growth of 1.9% pa caps out in 2030 as DM per caps decline.
We can argue the same point for tobacco, more so. But there is one critical difference... tobacco has pricing power... and the discipline to use it. Figure 12 shows the different levels of price/mix for beer and tobacco where retail price/mix in EMs in tobacco has been over twice that in beer, and more so in DMs. Ignoring the issue of the tobacco multiplier (supportive to tobacco pricing, see later comments, offset by declining volumes and higher excise) beer price/mix continuing to compound at 2.0% and tobacco at 4.8% renders one unit of tobacco in 10 years time priced 32% higher than one unit of beer.
Tobacco has unique product and excise characteristics and is even more concentrated than beer globally, nevertheless, perhaps beer need to consider the pricing discipline of tobacco as a long run option.
Diageo has a c20% group exposure to beer though its EM exposure in beer is dominated by Africa where per cap trends are strong. Nigeria per caps have risen 14% pa over the fourteen years to 2012 and 13% in the five years to 2012. Price/mix has been c6%pa in Nigerian beer, though we recognise price competition has increased recently in the market.
While beer is our least preferred category we are making a relative call within Staples: we model EM per cap beer revenue growth of 4.0%. Regional differences in beer are important: African per caps are significantly below the EM average, and while we are Holders of the beer companies, SAB is our preferred play.
Figure 11: Potential beer per capita consumption scenario
0
10
20
30
40
50
60
70
80
90
1998
2000
2002
2004
2006
2008
2010
2012
2014
E
2016
E
2018
E
2020
E
2022
E
2024
E
2026
E
2028
E
2030
E
DM per caps EM per caps
Source: Deutsche Bank estimates; Euromonitor
Figure 12: Beer and Tob. EM & DM price/mix 1998-2012
2.2%2.0%
7.0%
4.8%
0%
1%
2%
3%
4%
5%
6%
7%
8%
DM Beer EM Beer DM Tobacco EM Tobacco ex China
Source: Deutsche Bank estimates; Euromonitor. US$ terms, converted at average rates for each year

25 March 2014
Consumer Staples
European Consumer Staples
Page 10 Deutsche Bank AG/London
Least favoured: CSDs CSDs are a relatively mature in EMs (c45% per capita consumption relative to DMs) and we see relatively low per capita growth over the medium term. In addition, we see the risk to our US$ price/mix assumptions to the downside. Whilst CCH will suffer from falling populations in Eastern Europe the per capita assumptions for its overall country universe indicate per capita revenue growth for CCH slightly above that for CSDs in Figure 7 and in the region of 5%.
We retain our hold on CCH.
Least favoured: bottled water Bottled water is more complicated than Figure 7 suggests for Nestle and Danone. Bottled water remains significantly under indexed in China and India (Figure 13). While in aggregate we model 4.5% pa per capita consumption growth across all EMs this is clearly too low for both China and India and thus Nestle and Danone given their respective businesses in these markets (China is more important for both companies). Adding 2% points of growth to bottled water per capita consumption for Nestle and Danone would take the category to 7.1% per cap revenue growth in EMs taking bottled water (as it is applicable to Nestle and Danone) to 7th in the ranking table of categories.
Least favoured: packaged food As regards packaged food, it is the one category where we see risk in both our volume and price/mix forecasts: per capita consumption forecasts are potentially understated and despite low category values relative to DMs, our price/mix forecast of +3.7% is the third highest in our universe (only tobacco and coffee are greater). The category is arguably more aligned to being a commodity than most and therefore +3.7% appears high. The net result however, +5.2% per cap revenue growth is a conclusion we are comfortable with.
Least favoured: dairy As regards dairy, this is the amalgamation of a number of categories (drinking milk products, cheese, yoghurt and sour milk drinks, and other dairy products). Yoghurt as a standalone category (important for Nestle and Danone) scores higher and ranks 8 in our universe of 22.
Deodorant, shampoo and tobacco Three categories outside our most and least favoured are worthy of specific comment.
For deodorants we model EM per capita revenue growth of 7.1% pa predicated on a per cap volume growth forecast of 5%. Deodorants have insufficiently penetrated high population markets such as China, India, Indonesia, Pakistan and Bangladesh to register. We have adjusted for this but nevertheless, our per capita consumption forecast for deodorant could be materially understated such that it may outperform our forecasts for auto dishwash.
Figure 13: Bottled water per cap consumption (indexed)
0
20
40
60
80
100
120
140
160
1998
1999
2000
2001
2002
2003
2004
2005
2006
2007
2008
2009
2010
2011
2012
DM China India
Source: Deutsche Bank; Euromonitor; index takes DM in 1998 as the base at 100

25 March 2014
Consumer Staples
European Consumer Staples
Deutsche Bank AG/London Page 11
Figure 14: Deodorant per capita consumption vs Developed Markets (indexed), 2012 Argentina Brazil S. Africa Thailand Turkey Nigeria China India Indonesia Bangl’sh Pakistan
Index relative to DM 163 143 97 40 27 10 NA NA NA NA NASource: Deutsche Bank; Euromonitor; measurement is ‘alternative units’
Shampoo per capita consumption in key markets such as China and Indonesia is approaching the EM average of 49% relative to DMs. China is 42%, Indonesia 37%. India is 12% and there are 1.3bn people in India (1.4bn by 2025). Unilever has a significant exposure to India. While we model EM per capita revenue growth in shampoo at 6.8% pa we estimate Unilever should achieve c7.5% pa over the medium term.
As regards, tobacco, we model per capita revenue growth of 6.9% (in line with the Staples average) based on per capita volume growth of -2.5%. In Figure 302 we model tobacco gross margins against other staples and explain that despite forecast EM volume declines, and only average EM revenue growth, we believe the category will remain highly profitable as a function of its best in class price/mix and superior gross margin growth.
Sector valuation more attractive: shorter term concerns Comments from various companies in recent weeks have suggested Q1 and H1 will be relatively weak, and slightly below previous market expectations. CCE, Diageo, L’Oreal, Nestle and SAB all referenced a weak calendar Q1 at the recent CAGE conference with various references to EMs.
With EM concerns still to play out our analysis of the 1998-2002 period in Staples is relevant. While current events in EMs are not as extreme as 1997/8, Staples nevertheless posted negative revenue per cap growth in US$ terms over the period 1998-2002 (see Figure 2). As long as EMs remain a negative for investors, the sector is likely to continue to underperform.
Turning to the longer term, recognising the potential for EM currencies to weaken further and undermine Staples' forecasts, the sector's valuation is becoming more attractive.
We are wary of historical comparators as it implies history is relevant: we are unconvinced that the market consistently values the long-term compounding characteristics of the category sufficiently highly. Nevertheless, the sector’s P/E relative stands at 132, in line with long run average of 128 and considerably lower than 12 months ago when it stood at 156: and this is after considerable FX related downgrades have impacted EPS.
Of more interest to us is the sector's valuation relative to other save havens and we note that Staples' earnings yield relative to 10 year bonds (government and corporate) has rarely been more attractive (see Figure 16).
Figure 15: Shampoo EM per caps relative to DMs
0%
10%
20%
30%
40%
50%
60%
70%
80%
90%
100%
1998
1999
2000
2001
2002
2003
2004
2005
2006
2007
2008
2009
2010
2011
2012
Emerging Market universe China Indonesia India
Source: Deutsche Bank estimates; Euromonitor
Figure 16: Staples relative to bonds
-6%
-4%
-2%
0%
2%
4%
6%
8%
10%
Jan-
73Ju
n-74
Nov
-75
Apr
-77
Sep
-78
Feb-
80Ju
l-81
Dec
-82
Ma y
-84
Oct
-85
Mar
-87
Aug
-88
Jan-
90Ju
n-91
Nov
-92
Apr
-94
Sep
-95
Feb-
97Ju
l-98
Dec
-99
May
-01
Oct
-02
Mar
-04
Aug
-05
Jan-
07Ju
n-08
Nov
-09
Apr
-11
Sep
-12
Feb-
14
Staples less BAA Corp Yield Staples less 10Y Treasury yield
Source: Deutsche Bank; Datastream; shows Staples earnings yield less relevant bond yield

25 March 2014
Consumer Staples
European Consumer Staples
Page 12 Deutsche Bank AG/London
Finally, without formally changing their current stance (underweight Staples) and recognising their comments are geared to macro plays, our strategists are nevertheless becoming increasingly comfortable with the valuation of EM exposed stocks "... it is important to appreciate that the stage is looking increasingly set for looking for opportunities across European stocks with EM exposure." (Global credit impulse - the already substantial EM adjustment." Only Technology and Basic Resources have a greater EM exposure than Staples in Stoxx 600 (Figure 27).
What’s the catalyst? More often than not we are asked what's the catalyst? The nature of Staples, as the name suggests, is that catalysts rarely exist. Rather opportunities emerge, which are not clear cut. As our strategists point out, an opportunity may be emerging. It is still too early in our view to call a turn in the relative performance of the sector, but those with longer term horizons should be circling Staples in our view.
Outlook comments when companies report Q1/H1 will be analysed for signs of a change in immediate outlook and thus, potentially, relative sector performance. Irrespective of the short-term nuances our stance is clear: Staples are very well placed to take further advantage of long term EM growth; per capita consumption levels remain significantly below DMs in many categories; EM per caps have risen steadily. We believe this will continue and drive multi-year growth in Staples.
Favoured stocks
BAT (3213p, BUY, target price 3600p) We estimate c55% of BAT's sales are in EMs. We forecast medium term EM revenue growth of 6.9% in tobacco. Despite falling volumes, in Figure 302, we show the power of the tobacco pricing model and its positive impact on gross margins. In addition c.10% of group net profits is derived from BAT’s US associate Reynolds American: we see considerable scope for higher prices in the US cigarette market. Finally we see BAT continuing to benefit from its ongoing cost saving programme to yield savings that help drive margins 50-100bps higher over a number of years.
We base our price target on a DCF-model, the core assumptions behind which are a WACC of 7.3% (incorporating a levered beta of 0.8, net debt/EV ratio of 13%, risk free rate of 4.0% and 4.0% cost of debt), medium-term cash flow growth of 4.7% a year, and a post year-10 terminal growth rate of -1% (due to regulatory and social pressures on tobacco consumption).
Investing in tobacco carries sector-specific risks including regulation, duty increases and volume declines in high-margin markets. In addition, BAT is exposed to adverse/positive currency movements, unexpected adverse US litigation developments, Canadian litigation, and possible overpayment for an acquisition.
Beiersdorf (€68.93, BUY, target price €85) Beiersdorf is arguably the best placed of all companies we have reviewed. EMs are 44% of sales with China the largest market notwithstanding Beiersdorf’s wide EM geographic spread. Skin care dominates Beiersdorf’s business and is forecast to grow 8.1% pa in EMs with upside risk.

25 March 2014
Consumer Staples
European Consumer Staples
Deutsche Bank AG/London Page 13
Given Beiersdorf’s growing cash flows over the long term, we favour a DCF methodology as our valuation tool. We also sense-check this against traditional multiple based valuations. Our Beiersdorf DCF-derived target price is based on 12% pa mid-term cash flow growth fading to 2% pa long-term growth. We also assume a WACC of 8.5% based on levered Beta 1, equity risk premium 4.3% and risk free rate 4.0%.
In terms of risks, M&A is part of the strategy and with such a high net cash position we believe M&A execution is key. Beiersdorf has a high profit exposure to one region, Western Europe. If Europe were to enter another deep recession, this would pressure group returns.
Diageo (1819p, BUY, target price 2050p from 2200p) We see spirits as one of the best placed categories in consumer goods and forecast EM whisky and vodka will see per cap revenue growth of 8.3% and 8.1% respectively. Unlike its immediate peer, Pernod, Diageo's exposure to falling cognac sales in China is materially lower (via its Moet Hennessy associate). We estimate 15% of Diageo's sales are in beer but its beer business (like SAB) is skewed to Africa where per caps remain low.
While we are positive on Diageo, we expect 2014 to be a relatively subdued. We model volume declines of -2.5%) and reported EPS -2%, 102.8p (-1% on 2013) with our forecasts in line with consensus of 102.7p (Reuters as at 24 March 2014). Perhaps more importantly, for 2015 we model organic volume growth of 0.8% and EPS of 105.2p against a current Reuters consensus of 111.8p (as at 24 March 2014); there could be further market downgrades.
Diageo has underperformed DJ Stoxx by 15% over 12 months with the market taking on board the impact of FX translation and a weaker 2014. A turn in sentiment toward EMs is likely to materially benefit Diageo.
Our revised price target (2050p vs. 2200p previously) reflects reduced forecasts following a weaker short term volume outlook (notwithstanding the long-term positive outlook for spirits) and the subsequent impact on our DCF where we model Diageo using a WACC of 8.4% (incorporating a levered beta of 0.95, net debt/EV ratio of 13%, risk-free rate of 4.0% and 4.0% cost of debt), medium-term cash flow growth at 8.5%, and a long term growth rate of 1.5%.
Key downside risks include prolonged EM weakness, excise tax increases (particularly FET in the US), a renewed downturn in the US which could trigger down-trading and acquisitions which may be value destructive.
RB (4826p, BUY, price target 5100p) 36% of RB’s sales are in EMs with a wide geographic spread including c16% of EM sales in China and India. Auto dishwash is our highest EM growth category and key for RB. In addition, RB has a high exposure to other personal and home care categories which we expect to grow in EMs above the Staples average. Finally, c25% of RBs business is in consumer health, a category which arguably has even better long term EM growth potential than either home or personal care.
We value RB using a DCF, but also sense-check this using traditional multiple valuations. Our core RB DCF is based on 7.0% pa mid-term cash flow growth, fading to 2.0% pa long term. We assume a WACC of 8.7% (based on Beta 1.1, equity risk premium 4.3% and risk free rate 4.0%.

25 March 2014
Consumer Staples
European Consumer Staples
Page 14 Deutsche Bank AG/London
Risks include rising oil prices which could slow gross margin progression; oil and oil derivatives account for c30% of cost of goods sold. There is a risk that RB pays too much for assets, but its track record in M&A is very strong. Other risks include intensified competition, consumer downtrading, emerging markets slowdown, exchange rates, and management departures.
Unilever (€28.26, BUY, price target €33) 57% of Unilever’s sales are in EMs with personal/home care estimated to be c75% of the EM business. Approaching 20% of EM sales are in China and India where per cap opportunities in personal care and home care are particularly high. Unilever operates in a number of categories that are growing above the Staples average where Unilever’s specific geographic profile generates higher growth than we modelled for the individual category. Categories such as deodorants and shampoo stand out.
Given Unilever's steady but growing cash flows over the long term, we favour DCF methodology as our valuation tool. Our Unilever DCF is based on 7.0% mid-term cash flow growth fading to 1.5% pa long-term growth. We model a WACC of 8.9% based on Beta 1.1, equity risk premium 4.3% and risk-free rate 4.0%.
The key risks are consumer pressures, raw material volatility (especially edible oils and oil) as well as risks associated with the management programme of change and potential acquisitions. Finally, the group's high exposure to emerging markets makes it exposed to EM growth, currency movements and investor sentiment toward EMs.
Recommendation changes
Pernod €81.10, Sell to HOLD, price target unchanged €75) As concerns relating to Chinese cognac sales have surfaced over the last year Pernod has underperformed DJ Stoxx by 25% over the last 12 months. Pernod is now within 10% of our price target and we move our recommendation to HOLD.
Our target price is DCF-based given the relative stability of cash flows. Key assumptions used in our DCF are a WACC of 8.35% (equity risk premium 4.3%, risk-free rate 4.0%, levered beta 1.2, cost of debt 4.0%) and a terminal growth rate of 1.5%. The 1.5% terminal growth rate is the rate we use for the sector and reflects the long-term growth of the industry as a result of population growth and mix improvements.
In terms of risk, upside would come from a reacceleration of Chinese growth offsetting current cognac declines. Further upside risk would come from a rapid return of buoyant trading conditions, particularly in terms of trading up in developed markets. Any significant deterioration in the outlook for EMs would put negative pressure on our forecasts and resultant valuation.
Heineken (€46.79, Buy to HOLD, price target €60 to €50) We recognise the relative attractiveness of Heineken’s Mexican and Nigerian businesses. Our downgrade to HOLD is reflective of c15% of sales in Central and Eastern Europe and our ongoing concerns as to Western Europe (c40% of sales). Per capita consumption in both these regions is in decline.

25 March 2014
Consumer Staples
European Consumer Staples
Deutsche Bank AG/London Page 15
In addition, we believe the long-term stance Heineken takes is at one in the same time supportive toward the long-term health of the business (in a relatively weak Staples category) but one which has potentially negative implications for the share price in the shorter term, where the time frame of the company is extended beyond the investment horizon of most investors.
We base our price target on a DCF-model, the core assumptions behind which are a WACC of 8.5% (incorporating a levered beta of 1.1, net debt/EV ratio of 20%, risk-free rate of 4.0%, risk premium of 4.3% and 4.3% cost of debt), medium-term cash flow growth of 4.7% a year, and a post year-10 terminal growth rate of 1.5% (reflects our long term consumption trends in the sector).
Key risks include the economic environment in Europe, competitor activity in key markets (Europe plus the Americas, Africa and Asia), and volatility in input costs. Additional potential risk factors include overpayment for an acquisition and institutional shareholders remaining a minority position.
Price target changes
Nestle (CHF64.80, HOLD, price target from CHF60 to CHF65) Notwithstanding short term concerns and FX related downgrades, Nestle is exposed to a number of categories generating long term EM per cap revenue growth in line with, or above, the Staples average of 6.8% including prepared baby food (9.6%), skin care (8.1%), yoghurt (7.0%), pet care (6.8%), chocolate (6.7%), coffee (6.8%) and infant milk formula (6.4%). Ice cream is 6.1%, the wider diary category 5.7%, packaged food 5.2% and bottled water 5.1%.
We have amended our forecasts accordingly and generate our revised price target of CHF65 via our DCF using a WACC of 8.2% (incorporating a levered beta of 0.8, net debt/EV ratio of 10%, risk-free rate of 4.0% and 3.0% cost of debt), medium-term cash flow growth at 7.5%, and a long term growth rate of 1.5%.
An analysis of Nestlé’s major categories suggests what Nestle is in our view, a high quality business. We have increased our price target. Within the confines of a current Hold recommendation we have little doubt of Nestlé’s ability to drive superior returns over the long term.
Nestle, is exposed to sector risks of trading down (especially to private label), input cost volatility, aggressive competitor activity and general emerging markets risk. The major downside risk is Nestle makes large value-destructive acquisitions by either paying too high a price or struggling to integrate a new business into the group. Upside risk would come from a combination of successful bolt-on deals and a rapid increase in organic growth.
All prices as at close 24 March 2014

25 March 2014
Consumer Staples
European Consumer Staples
Page 16 Deutsche Bank AG/London
This page has been left blank intentionally

25 March 2014
Consumer Staples
European Consumer Staples
Deutsche Bank AG/London Page 17
Investment Thesis
People consume Staples
More people = more consumption Global population is growing. The World Bank estimates world population will grow by 960m/14% between 2012 and 2025; from 7.05bn to 8.00bn. India contributes 182m people/19% of global growth, Nigeria 71m/7% and China 65m/7%. By 2025 India’s population is estimated to be marginally bigger than China’s: 1419m vs. 1416m.
The USA is still the world’s third largest country by population in 2025 at 342m; increasing by 28m and contributing 3% to global growth. Indonesia remains the fourth largest country at 282m contributing 4% to global growth. Nigeria moves from sixth to fifth over the period with 2025 population estimated at 240m.
From a population perspective Eastern Europe is not a good place to be. Of the 21 EMs we reviewed the World Bank estimates only three will see population declines; all of them in Eastern Europe: Russia (143m to 131m; -12m/-8%); Ukraine (45.6m to 39.8m; -5.8m/-13%); and Poland (38.5m to 36.9m; -1.6m/-4%). Unlike Eastern Europe, not only is the USA forecast to grow its population, so are the UK, France and Australia, albeit only marginally.
Our favoured markets/regions in relation to population are: India, China, Nigeria, Indonesia, USA (surprisingly?), Africa and South East Asia.
Global population has been climbing consistently over the lifetime of equity markets thereby raising the question: what’s new? We make two points:
Figure 17: Population growth (m people) 2012-2025 Figure 18: Global Private Consumption 1990-2013
US$trn
957m , 14% of 2012 world population
182(19%)
71(7%)
65(7%) 39
(4%)35
(4%)33
(3%)28
(3%)23
(2%)23
(2%)19
(2%)17
(2%)16
(2%)16
(2%)10
(1%)0
100
200
300
400
500
600
700
800
900
1000
Wor
ld
Indi
a
Nig
eria
Chi
na
Pak
ista
n
Indo
nesi
a
Eth
iopi
a
US
A
Bgl
dsh.
Phi
lpns
.
Bra
zil
Mex
ico
Egy
pt
Ken
ya
Turk
ey
12.4
17.2
26.2
35.3
38.7 39.9 41.1
0
5
10
15
20
25
30
35
40
45
1990 1995 2005 2010 2011 2012 2013
Source: World Bank. Data for each country is m people population growth and % in parenthesis is contribution to world population growth of 957m people. Source: Deutsche Bank; Euromonitor; World Consumer Income and Expenditure Patterns 2013. Data is
for the 71 largest consumer countries. US$ at current prices. Note different date parameters on x-axis.

25 March 2014
Consumer Staples
European Consumer Staples
Page 18 Deutsche Bank AG/London
Over the next 5, 10, 15 or 20 years, how many bottles of water will these incremental 950m people consume; or how many times will they wash their hair; or buy a chocolate bar, against for example, how many luxury hand bags they will buy or car insurance policies will they purchase?
Second, what’s new? Nothing (except the numbers get bigger). And nothing new is our point. We cite Figure 19 showing the significant outperformance of the sector and the opportunity the current pre-occupation with EMs as a negative potentially provides. This chart excludes reinvested dividends, which would further extend the sectors outperformance.
Concentrating on EMs... but don’t forget USA Before we delve into our discussion of EMs we need to be clear: we consider the USA a favoured market in the context of staples:
the third largest population in the world in 2012 and projected to remain so by the World Bank in 2025 (Figure 391)
highest population growth of our DM universe through to 2025 (28m people, 3% of global population growth)
economic and political stability
the benchmark hard currency
Per capita consumption levels in the USA obviously tend to be high but the relative lack of per capita growth is compensated for by hard currency earnings and forecast population growth. We consider exposure to USA/North America across the majority of categories as an investment positive.
EM per capita consumption and price/mix
Per caps relative to DMs It is important to understand the potential of EM per cap consumption benchmarked against DMs as shown in Figure 20. The potential of categories like auto dishwash, vodka, ice cream and whisky etc is clear. Tobacco being the most penetrated with relatively little upside is no surprise and perhaps neither is such a fundamental staple as water at the second highest relative penetration. This is the first stop in our analysis – a consideration of relative sizes and therefore an initial awareness of the potential upside.
Figure 19: EU Staples vs DJ Stoxx (US$) 2001 to date
80
100
120
140
160
180
200
220
240
260
280
Jan-
01Ju
l-01
Jan-
02Ju
l-02
Jan-
03Ju
l-03
Jan-
04Ju
l-04
Jan-
05Ju
l-05
Jan-
06Ju
l-06
Jan-
07Ju
l-07
Jan-
08Ju
l-08
Jan-
09Ju
l-09
Jan-
10Ju
l-10
Jan-
11Ju
l-11
Jan-
12Ju
l-12
Jan-
13Ju
l-13
Jan-
14
Source: Deutsche Bank; Datastream

25 March 2014
Consumer Staples
European Consumer Staples
Deutsche Bank AG/London Page 19
Figure 20: EM per capita consumption relative to DMs 2012
0%
10%
20%
30%
40%
50%
60%
70%
80%
90%
100%
Aut
o D
W
Vod
ka
Ice
Cre
am
Whi
sky
Air
Car
e
Pet
Car
e
Cho
c.
PB
F
Dai
ry
Ski
n C
are
Hom
e C
are
Cof
fee
Ave
rage
Yog
hurt
Deo
CS
Ds
Pac
k. F
ood
Per
s. C
are
Sha
mpo
o
Bee
r
IMF
Bot
. Wat
er
Toba
cco
Source: Deutsche Bank estimates; the lower the value, the greater the upside, i.e. auto dishwash has hardly begun to penetrate EMs, tobacco is the most penetrated product. Vodka ex Russia, Poland and Ukraine. Tobacco ex China.
Per capita growth 1998-2012 When assessing potential future growth the picture is more complicated than that painted in Figure 20. Figure 20 is a snap shot in time; we have to be aware of trends.
Figure 21 shows per capita consumption CAGR rates 1998-2012 in DMs and EMs. In addition we have broken down these growth rates into three periods in our detailed category analysis that follows (1998-2002, 2002-2007, 2007-2012) to get an even better picture of trends.
Referencing prepared baby food; not only is the potential upside significant but the category in DMs is growing (indicating strength) and significant in-roads are being made in EMs already, we can be comfortable with relatively high per cap growth rate assumptions.
In terms of beer, DM per capita consumption rates are declining (a clear negative) but we have the quandary of EM per caps climbing. Setting aside regional EM per cap differences (we discuss these in our beer section) we argue, given the starting point in Figure 20, that current trends indicate EM beer per caps could meet those of DMs in 2030. That is too simplistic, but it does give an indication of the relative strength of the category.
Finally whisky. Here we see DMs declining and EMs rising from a low level of relative per cap penetration to what is still only c16% relative to DMs. Declining DMs would normally be a concern but two factors mitigate: trends are changing in DMs – per caps have been rising since 2007 (Figure 76) and EM per cap growth is consistently strong (6.4% 2007-2012, also Figure 76). Accordingly we feel comfortable with our medium term EM per cap growth rate assumption of 6.5%.

25 March 2014
Consumer Staples
European Consumer Staples
Page 20 Deutsche Bank AG/London
Figure 21: DM and EM per capita consumption CAGR 1998-2012
-4%
-2%
0%
2%
4%
6%
8%
10%
PB
F
Aut
o D
W
Bot
. Wat
er
Air
Car
e
Ski
n C
are
Whi
sky
IMF
Cho
c.
Yog
hurt
Pet
Car
e
Sha
mpo
o
Hom
e C
are
Bee
r
Deo
Vod
ka
Per
s. C
are
Ice
Cre
am
Cof
fee
Dai
ry
CS
Ds
Pac
k. F
ood
Toba
cco
Developed Markets Emerging Markets
Source: Deutsche Bank estimates; Euromonitor; Vodka ex Russia, Poland and Ukraine. Tobacco ex China.
Price/mix illusory Turning to price/mix, which we discuss at some length in the methodology section; we conclude that price/mix in Staples in EMs is illusory. It is essential to appreciate that over the long-term inflation induced pricing in EMs is invariably unwound by bouts of EM currency devaluation, as we are currently seeing.
Figure 22 shows that over the 14 years in US$ terms (translated at average rates of exchange for each year) price/mix in EMs was lower than in DMs at 2.6% vs 3.1% in DMs. The absolute growth in EMs relative to DMs is volume driven via higher population and higher per cap penetration, not pricing; hence the importance of pe capita consumption.
That said, post the severe EM crisis of 1997/8 price/mix in EMs averaged 8.2% 2002-2007. Long term this was unsustainable but very profitable... while it lasted.
Value per unit relative to DMs (US$) Having de-bunked price/mix in EMs (in reality price, not mix) Figure 23 shows retail values per unit in US$ terms in EMs relative to DMs in 1998 and 2012.
Looking at auto dishwash; on the back of high per cap growth it would be easy to assume (without analysing the market and trends) that price/mix would be strong given the growth potential (i.e. high pricing power given rising demand). With caveats, our analysis suggests otherwise.
Figure 22: Staples Price/Mix in DMs and EMs (US$)
-1.1%
7.0%
2.6%
4.8%
3.1%
-5.8%
8.2%
4.2%
6.2%
2.6%
-4.7%
1.2% 1.7% 1.4%
-0.4%
-8%
-6%
-4%
-2%
0%
2%
4%
6%
8%
10%
1998-2002 2002-2007 2007-2012 2002-2012 1998-2012
DM Price/Mix EM Price/Mix Differential (EM less DM)
Source: Deutsche Bank estimates; Euromonitor

25 March 2014
Consumer Staples
European Consumer Staples
Deutsche Bank AG/London Page 21
Figure 23: EM retail value per unit (US$) relative to DMs
0%
10%
20%
30%
40%
50%
60%
70%
80%
90%
100%
Bee
r
Whi
sky
Vod
ka
CS
Ds
Bot
. Wat
er
Pac
k. F
ood
Dai
ry
Yog
hurt
IMF
PB
F
Cho
c.
Cof
fee
Pet
Car
e
Ice
Cre
am
Hom
e C
are
Aut
o D
W
Air
Car
e
Per
s. C
are
Deo
Ski
n C
are
Sha
mpo
o
Toba
cco
Ave
rage
1998 2012
1998: 269%; 2012 166%
Source: Deutsche Bank estimates; Euromonitor. Vodka ex Russia, Poland and Ukraine. Tobacco ex China. Auto dishwash is overstated; nevertheless we have been conservative with our price/mix per unit forecasts in EMs: we model +1.3% pa for auto dishwash.
US$ per unit prices are very high relative to DMs and have been declining relative to DMs (269% in 1998, 166% in 2012). EM price/mix has been 1.3% over 12 years and DM 4.6% (Figure 24).
Figure 24: Price/mix (US$ terms) CAGR 1998-2012
0%
1%
2%
3%
4%
5%
6%
7%
8%
Bee
r
Whi
sky
Vod
ka
CS
Ds
Bot
. Wat
er
Pac
k. F
ood
Dai
ry
Yog
hurt
IMF
PB
F
Cho
c.
Cof
fee
Pet
Car
e
Ice
Cre
am
Hom
e C
are
Aut
o D
W
Air
Car
e
Per
s. C
are
Deo
Ski
n C
are
Sha
mpo
o
Toba
cco
Ave
rage
Developed Markets Emerging Markets Markets
Source: Deutsche Bank estimates; Euromonitor. Vodka ex Russia, Poland and Ukraine. Tobacco ex China
Our data set for auto-dishwash shows that as EMs mature, mass market (lower priced) products will become increasingly prevalent in some categories potentially diluting price/mix. Accordingly, despite strong per cap growth, price/mix may lag and the relative high price when compared to DMs unwind. Recognising potential issues with the data (auto dishwash appears clear) for categories such as vodka and air care despite modelling some of the highest EM per cap volume growth across all categories our price/mix forecasts are relatively low given the apparent high price points in EMs relative to DMs.

25 March 2014
Consumer Staples
European Consumer Staples
Page 22 Deutsche Bank AG/London
To the extent in these specific instances (auto dishwash, vodka and air care) we have derived price/mix assumptions which are too low by function of the data, the net result is we are even more positive on three categories that rank toward the top end of our 22 categories (first, fifth and sixth respectively).
All other categories have been modelled using the same principles but where the relative price per unit starting point is less contentious resulting in a much higher level of comfort as to our (typically higher) price/mix forecasts.
Forecast category growth rates Following these principles, Figure 25 outlines our EM per cap volume, price/mix and revenue assumptions on a category by category basis. Additional detail is outlined in each category’s section.
Figure 25: Medium term EM per capita category growth forecasts Category Volume Price/mix (US$) Revenue (US$)
Auto dishwash 8.2% 1.3% 9.6%
Prepared baby food 5.5% 3.4% 9.1%
Whisky 6.5% 1.7% 8.3%
Skin care 6.0% 2.0% 8.1%
Vodka 7.0% 1.0% 8.1%
Air care 6.8% 1.0% 7.9%
Deodorant 5.0% 2.0% 7.1%
Yoghurt 3.6% 3.3% 7.0%
Personal care 3.0% 3.8% 6.9%
Tobacco -2.5% 9.6% 6.9%
Pet care 3.5% 3.2% 6.8%
Shampoo 4.7% 2.0% 6.8%
Chocolate 3.6% 3.0% 6.7%
Home care 3.5% 3.0% 6.6%
Coffee 2.5% 4.0% 6.6%
Infant milk formula 3.9% 2.4% 6.4%
Ice cream 3.0% 3.0% 6.1%
Dairy 2.4% 3.2% 5.7%
Packaged food 1.4% 3.7% 5.2%
Bottled water 4.5% 0.6% 5.1%
CSDs 1.4% 3.2% 4.6%
Beer 1.5% 2.5% 4.0%
Average 3.9% 2.8% 6.8%
Population 0.9%
Revenue 7.8%Source: Deutsche Bank estimates; *yoghurt more relevant to Danone and Nestle with forecast revenue growth of 7.0%; ** see comments specific comments in bottled water section, we expect Danone and Nestle to outperform this rate of growth; ***we estimate CCH will slightly outperform and achieve c5% EM per cap sales growth. Vodka ex Russia, Poland and Ukraine. Tobacco ex China
As outlined in Figure 25, our favoured categories are auto dishwash, prepared baby food, whisky, skin care and vodka with the risk to our auto dishwash and vodka price/mix assumptions likely to the upside. Our least favoured are beer, CSDs, bottled water, packaged food and dairy.

25 March 2014
Consumer Staples
European Consumer Staples
Deutsche Bank AG/London Page 23
Where are we now?
No leaking boat In his 1985 Berkshire Hathaway letter, Warren Buffett wrote...
“Some years ago I wrote: “When a management with a reputation for brilliance tackles a business with a reputation for poor fundamental economics, it is the reputation of the business that remains intact.”...Nothing has since changed my point of view on that matter. Should you find yourself in a chronically-leaking boat, energy is best devoted to changing vessels is likely to be more productive than energy devoted to patching leaks.”
Referencing Figure 19 over an extended period and Figure 26 over a shorter period we see the extent of the Staples underperformance since April 2013.
Given this relative under performance (primarily driven by Staples over-indexing in EMs relative to the market, Figure 27) we should ask the question, are Staples, as Mr Buffett puts it, “a leaking boat”? Given Mr Buffett’s ongoing extensive investments in consumer names (P&G, Coca-Cola, Heinz to name a few), we suspect his answer may be ‘no’.
Figure 27: Stoxx 600 Geographic exposure by sector (2012 sales (%)) ranked by RoW plus Asia-Pacific Stoxx 600 sectors Home
country Rest of Europe
Americas Asia/ Pacific
RoW/ Unspecifi
ed
RoW plus
Asia-Pac
Home country
YoY chg
Rest of Europe
YoY chg
Americas YoY chg
Asia/ Pacific
YoY chg
RoW/ Unspecifi
ed YoY chg
Technology 12 22 24 20 22 42 0.6 0.1 2.8 -2.2 -1.2
Basic Resources 5 38 19 27 10 37 -0.4 3 -0.6 -1.1 -0.9
Personal & Hhold Goods 12 32 23 21 12 33 -0.4 0 0.2 0.6 -0.4
Food & Beverage 7 30 30 8 25 33 -0.3 -1.5 0.5 1.2 0.1
Oil & Gas 19 29 20 3 29 32 -0.6 1.2 -0.1 0.5 -0.9
Construction & Matls 30 22 18 14 16 30 -1.4 -5.4 4.2 5.2 -2.6
Health Care 7 25 39 13 17 30 0 -2.5 0.7 -0.3 2.2
Industrial Gds & Servs 16 30 28 14 12 26 -1.6 0.7 3.5 1.3 -3.8
Chemicals 12 35 28 20 5 25 -0.7 -1.3 1 0.7 0.2
Automobiles & Parts 19 27 30 15 9 24 -3 -3.3 3.7 1 1.7
Stoxx 600 27 28 22 10 13 23 -1.3 -0.4 1.4 0.8 -0.4
Travel & Leisure 30 31 20 4 15 19 1 -1.5 0.1 0.1 0.3
Telecommunications 44 25 14 4 15 19 -0.7 -0.6 1.3 0.4 -0.4
Insurance 36 27 20 6 12 18 -3.4 -1 0.8 1.3 2.3
Financial Services 39 34 9 3 14 17 -0.4 -0.3 0.7 -0.3 0.3
Media 41 23 21 3 13 16 -0.7 -1.4 1.4 0.3 0.4
Banks 47 25 17 7 5 12 0.4 -1.4 0.6 0.6 -0.2
Retail 51 24 14 5 5 10 -0.9 -0.9 2 0.2 -0.4
Utilities 56 30 10 0 4 4 0.7 -0.6 -0.1 0 0
Real Estate 71 28 0 0 1 1 2.3 -1.5 -0.6 0 -0.2Source: Deutsche Bank Bloomberg, Company data
Figure 26: European Staples vs DJ Stoxx (US$ terms)
90
95
100
105
110
115
120
125
Jan-
12Fe
b-12
Mar
-12
Apr
-12
May
-12
Jun-
12Ju
l-12
Aug
-12
Sep-
12O
ct-1
2No
v-12
Dec-
12Ja
n-13
Feb-
13M
ar-1
3A
pr-1
3M
ay-1
3Ju
n-13
Jul-1
3A
ug-1
3Se
p-13
Oct
-13
Nov-
13De
c-13
Jan-
14Fe
b-14
Mar
-14
Source: Deutsche Bank; Datastream
25 March 2014
Consumer Staples
European Consumer Staples
Page 24 Deutsche Bank AG/London
Similarly, we suspect the answer for the vast majority of investors is also ‘no’. That said, time-frames are critical and whilst an investor may be right to hold a positive view of Staples over the long-term they can easily be ‘wrong’ (from a share-price perspective at least) over the short or medium term.
Few investors have the luxury of Mr Buffett’s time frame with the majority benchmarked in relative, not absolute, terms: being ‘right’ over the long-term, unfortunately, is not good enough for many; Staples having been relatively stable in absolute terms over the last 12 months (see Figure 40) is also little comfort to the majority of readers. We have to be cognisant of shorter-term drivers as well as strong long-term fundamentals.
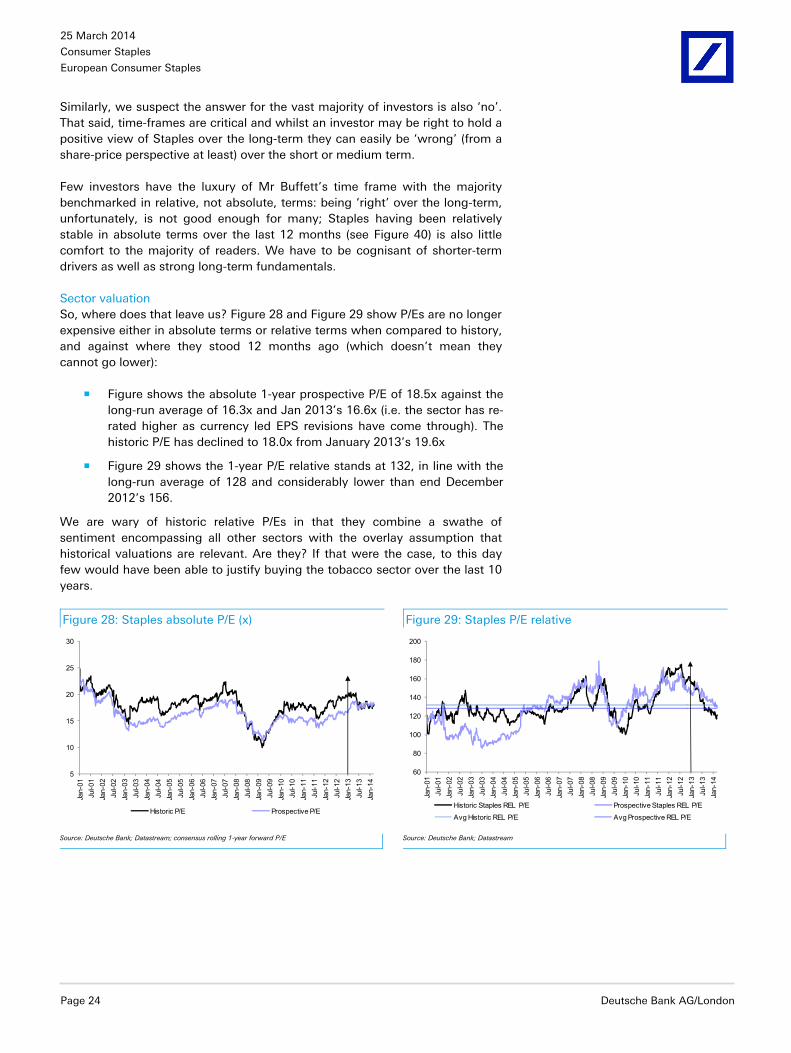
Sector valuation So, where does that leave us? Figure 28 and Figure 29 show P/Es are no longer expensive either in absolute terms or relative terms when compared to history, and against where they stood 12 months ago (which doesn’t mean they cannot go lower):
Figure shows the absolute 1-year prospective P/E of 18.5x against the long-run average of 16.3x and Jan 2013’s 16.6x (i.e. the sector has re-rated higher as currency led EPS revisions have come through). The historic P/E has declined to 18.0x from January 2013’s 19.6x
Figure 29 shows the 1-year P/E relative stands at 132, in line with the long-run average of 128 and considerably lower than end December 2012’s 156.
We are wary of historic relative P/Es in that they combine a swathe of sentiment encompassing all other sectors with the overlay assumption that historical valuations are relevant. Are they? If that were the case, to this day few would have been able to justify buying the tobacco sector over the last 10 years.
Figure 28: Staples absolute P/E (x) Figure 29: Staples P/E relative
5
10
15
20
25
30
Jan-
01Ju
l-01
Jan-
02Ju
l-02
Jan-
03Ju
l-03
Jan-
04Ju
l-04
Jan-
05Ju
l-05
Jan-
06Ju
l-06
Jan-
07Ju
l-07
Jan-
08Ju
l-08
Jan-
09Ju
l-09
Jan-
10Ju
l-10
Jan-
11Ju
l-11
Jan-
12Ju
l-12
Jan-
13Ju
l-13
Jan-
14
Historic P/E Prospective P/E
60
80
100
120
140
160
180
200
Jan-
01Ju
l-01
Jan-
02Ju
l-02
Jan-
03Ju
l-03
Jan-
04Ju
l-04
Jan-
05Ju
l-05
Jan-
06Ju
l-06
Jan-
07Ju
l-07
Jan-
08Ju
l-08
Jan-
09Ju
l-09
Jan-
10Ju
l-10
Jan-
11Ju
l-11
Jan-
12Ju
l-12
Jan-
13Ju
l-13
Jan-
14
Historic Staples REL P/E Prospective Staples REL P/E
Avg Historic REL P/E Avg Prospective REL P/E
Source: Deutsche Bank; Datastream; consensus rolling 1-year forward P/E Source: Deutsche Bank; Datastream

25 March 2014
Consumer Staples
European Consumer Staples
Deutsche Bank AG/London Page 25
We also debate how relevant P/Es are given the high cash generation of Staples relative to most sectors. Of more interest (to us at least) is Figure 30, which compares the earnings yield of Staples relative to government and corporate bonds. On this basis the sector has hardly been cheaper in the last 30 years.
Because of its relatively high cash generation, the earnings yield of Staples is more representative of a cash yield than most. As bond yields have compressed in recent years there is a strong argument to suggest cash yields in equity sectors such as Staples (that are proven long-term compounders of value) should be the chosen measure of value such that the market’s pre-occupation with the P/E and P/E relative is increasingly irrelevant. Even if this is happening it appears clear that it is taking an extended period to unwind the pre-occupation with P/Es. Figure 30 shows that the earnings yield is slightly higher than the corporate bond yield and nearly 4% points above the government bond yield.
What’s the P/E? It’s too aggressive to say ‘we don’t care’, but we have huge sympathy with the sentiment of the comment. Consensus suggests bond yields are not about to spike out anytime soon, and on that basis the argument to buy Staples (one of the best proxy’s) becomes ever more compelling: in our view there is a strong argument to suggest that the earnings yield/bond yield trade off should drive the P/E, not the other way round.
One other (obvious) factor to consider is that Staples companies grow, unlike bonds. Unlike many sectors, Staples’ earnings are a reasonable proxy for cash. Cash is handed back to shareholders (dividends) or reinvested back in the business to generate higher returns (A&P/Capex) or used to arbitrage this mis-pricing of a serially compounding sector (acquisitions and buy-backs). Perhaps it is little wonder Mr Buffett owns numerous consumer goods companies.
Later we discuss in more detail our strategists views but for our purposes here we take their closing comments in their recent note (Global credit impulse - the already substantial EM adjustment, 6 March), “...while our preference remains for domestically orientated cyclicals because we see greater visibility in the Euro area growth surprise, it is important to appreciate that the stage is looking increasingly set for looking for opportunities across European stocks with EM exposure”.
Figure 30: Staples relative to bonds
-6%
-4%
-2%
0%
2%
4%
6%
8%
10%
Jan-
73Ju
n-74
Nov
-75
Apr
-77
Sep
-78
Feb-
80Ju
l-81
Dec
-82
Ma y
-84
Oct
-85
Mar
-87
Aug
-88
Jan-
90Ju
n-91
Nov
-92
Apr
-94
Sep
-95
Feb-
97Ju
l-98
Dec
-99
May
-01
Oct
-02
Mar
-04
Aug
-05
Jan-
07Ju
n-08
Nov
-09
Apr
-11
Sep
-12
Feb-
14
Staples less BAA Corp Yield Staples less 10Y Treasury yield
Source: Deutsche Bank; Datastream; shows Staples earnings yield less relevant bond yield
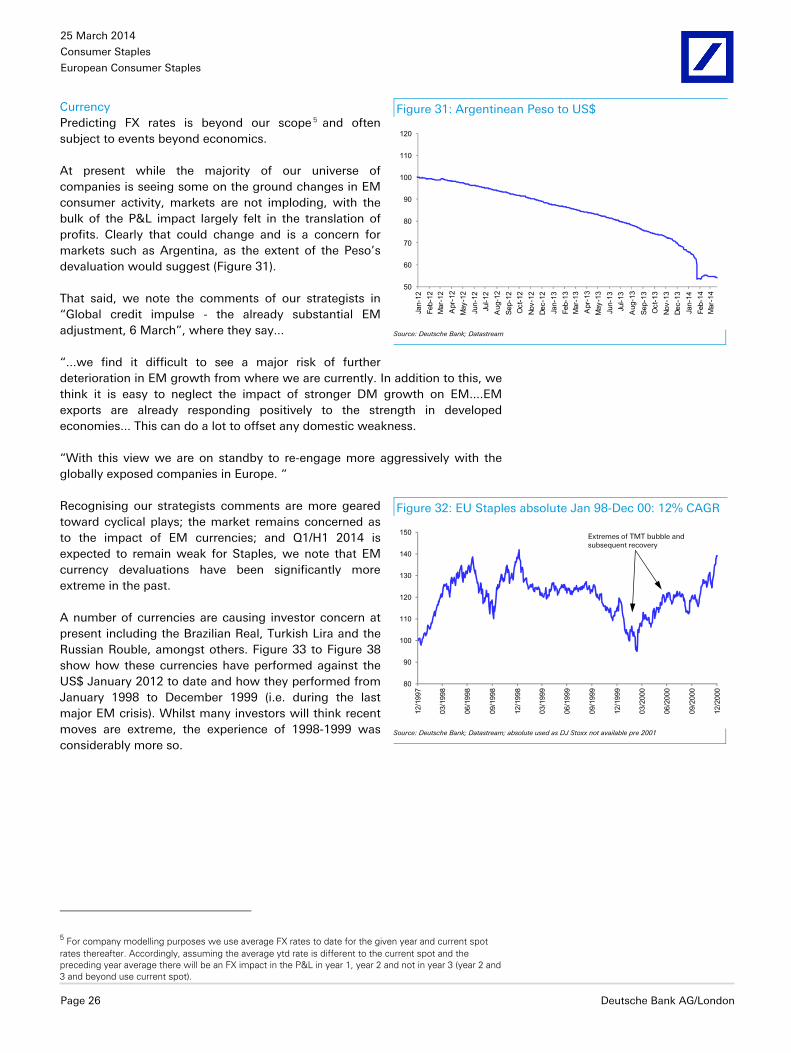
25 March 2014
Consumer Staples
European Consumer Staples
Page 26 Deutsche Bank AG/London
Currency Predicting FX rates is beyond our scope 5 and often subject to events beyond economics.
At present while the majority of our universe of companies is seeing some on the ground changes in EM consumer activity, markets are not imploding, with the bulk of the P&L impact largely felt in the translation of profits. Clearly that could change and is a concern for markets such as Argentina, as the extent of the Peso’s devaluation would suggest (Figure 31).
That said, we note the comments of our strategists in “Global credit impulse - the already substantial EM adjustment, 6 March”, where they say...
“...we find it difficult to see a major risk of further deterioration in EM growth from where we are currently. In addition to this, we think it is easy to neglect the impact of stronger DM growth on EM....EM exports are already responding positively to the strength in developed economies... This can do a lot to offset any domestic weakness.
“With this view we are on standby to re-engage more aggressively with the globally exposed companies in Europe. “
Recognising our strategists comments are more geared toward cyclical plays; the market remains concerned as to the impact of EM currencies; and Q1/H1 2014 is expected to remain weak for Staples, we note that EM currency devaluations have been significantly more extreme in the past.
A number of currencies are causing investor concern at present including the Brazilian Real, Turkish Lira and the Russian Rouble, amongst others. Figure 33 to Figure 38 show how these currencies have performed against the US$ January 2012 to date and how they performed from January 1998 to December 1999 (i.e. during the last major EM crisis). Whilst many investors will think recent moves are extreme, the experience of 1998-1999 was considerably more so.
5 For company modelling purposes we use average FX rates to date for the given year and current spot rates thereafter. Accordingly, assuming the average ytd rate is different to the current spot and the preceding year average there will be an FX impact in the P&L in year 1, year 2 and not in year 3 (year 2 and 3 and beyond use current spot).
Figure 31: Argentinean Peso to US$
50
60
70
80
90
100
110
120
Jan-
12Fe
b-12
Mar
-12
Apr
-12
May
-12
Jun-
12Ju
l-12
Aug
-12
Sep-
12O
ct-1
2No
v-12
Dec-
12Ja
n-13
Feb-
13M
ar-1
3A
pr-1
3M
ay-1
3Ju
n-13
Jul-1
3A
ug-1
3Se
p-13
Oct
-13
Nov-
13De
c-13
Jan-
14Fe
b-14
Mar
-14
Source: Deutsche Bank; Datastream
Figure 32: EU Staples absolute Jan 98-Dec 00: 12% CAGR
80
90
100
110
120
130
140
150
12/1
997
03/1
998
06/1
998
09/1
998
12/1
998
03/1
999
06/1
999
09/1
999
12/1
999
03/2
000
06/2
000
09/2
000
12/2
000
Extremes of TMT bubble and subsequent recovery
Source: Deutsche Bank; Datastream; absolute used as DJ Stoxx not available pre 2001

25 March 2014
Consumer Staples
European Consumer Staples
Deutsche Bank AG/London Page 27
Figure 33: Brazilian Real vs US$ from 1 Jan 2012 Figure 34: Brazilian Real vs US$ Jan 1998 to Dec 1999
40
50
60
70
80
90
100
110
120
Jan-
12Fe
b-12
Mar
-12
Apr
-12
May
-12
Jun-
12Ju
l-12
Aug
-12
Sep
-12
Oct
-12
Nov
-12
Dec
-12
Jan-
13Fe
b-13
Mar
-13
Apr
-13
May
-13
Jun-
13Ju
l-13
Aug
-13
Sep
-13
Oct
-13
Nov
-13
Dec
-13
Jan-
14Fe
b-14
Mar
-14
40
50
60
70
80
90
100
110
120
Dec
-97
Jan-
98Fe
b-98
Mar
-98
Apr
-98
May
-98
Jun-
98
Jul-9
8
Aug
-98
Sep
-98
Oct
-98
Nov
-98
Dec
-98
Jan-
99Fe
b-99
Mar
-99
Apr
-99
May
-99
Jun-
99
Jul-9
9
Aug
-99
Sep
-99
Oct
-99
Nov
-99
Dec
-99
Source: Deutsche Bank; Datastream; declining line shows depreciating value vs US$ Source: Deutsche Bank; Datastream; declining line shows depreciating value vs US$
Figure 35: Turkish Lira vs US$ from 1 Jan 2012 Figure 36: Turkish Lira vs US$ Jan 1998 to Dec 1999
80
85
90
95
100
105
110
115
120
Jan-
12Fe
b-12
Mar
-12
Apr
-12
May
-12
Jun-
12Ju
l-12
Aug-
12Se
p-12
Oct
-12
Nov
-12
Dec
-12
Jan-
13Fe
b-13
Mar
-13
Apr
-13
May
-13
Jun-
13Ju
l-13
Aug-
13Se
p-13
Oct
-13
Nov
-13
Dec
-13
Jan-
14Fe
b-14
Mar
-14
80
85
90
95
100
105
110
115
120
Dec
-97
Jan-
98Fe
b-98
Mar
-98
Apr
-98
May
-98
Jun-
98
Jul-9
8
Aug-
98
Sep-
98
Oct
-98
Nov
-98
Dec
-98
Jan-
99Fe
b-99
Mar
-99
Apr
-99
May
-99
Jun-
99
Jul-9
9
Aug-
99
Sep-
99
Oct
-99
Nov
-99
Dec
-99
Source: Deutsche Bank; Datastream; declining line shows depreciating value vs US$ Source: Deutsche Bank; Datastream; declining line shows depreciating value vs US$
Figure 37: Russian Rouble vs US$ from 1 Jan 2012 Figure 38: Russian Rouble vs US$ 1998 to Dec 1999
0
20
40
60
80
100
120
Jan-
12Fe
b-12
Mar
-12
Apr
-12
May
-12
Jun-
12Ju
l-12
Aug-
12Se
p-12
Oct
-12
Nov
-12
Dec
-12
Jan-
13Fe
b-13
Mar
-13
Apr
-13
May
-13
Jun-
13Ju
l-13
Aug-
13Se
p-13
Oct
-13
Nov
-13
Dec
-13
Jan-
14Fe
b-14
Mar
-14
0
20
40
60
80
100
120
Dec
-97
Jan-
98Fe
b-98
Mar
-98
Apr
-98
May
-98
Jun-
98
Jul-9
8
Aug-
98
Sep-
98
Oct
-98
Nov
-98
Dec
-98
Jan-
99Fe
b-99
Mar
-99
Apr
-99
May
-99
Jun-
99
Jul-9
9
Aug-
99
Sep-
99
Oct
-99
Nov
-99
Dec
-99
Source: Deutsche Bank; Datastream; declining line shows depreciating value vs US$ Source: Deutsche Bank; Datastream; declining line shows depreciating value vs US$
In this context, Figure 32 is worth considering.
From January 1998 to December 2000 the EU Staples sector rose 39% in absolute terms, a three year CAGR of 12% (with the dividend on top) whilst also contending with the extremes of the TMT bubble.
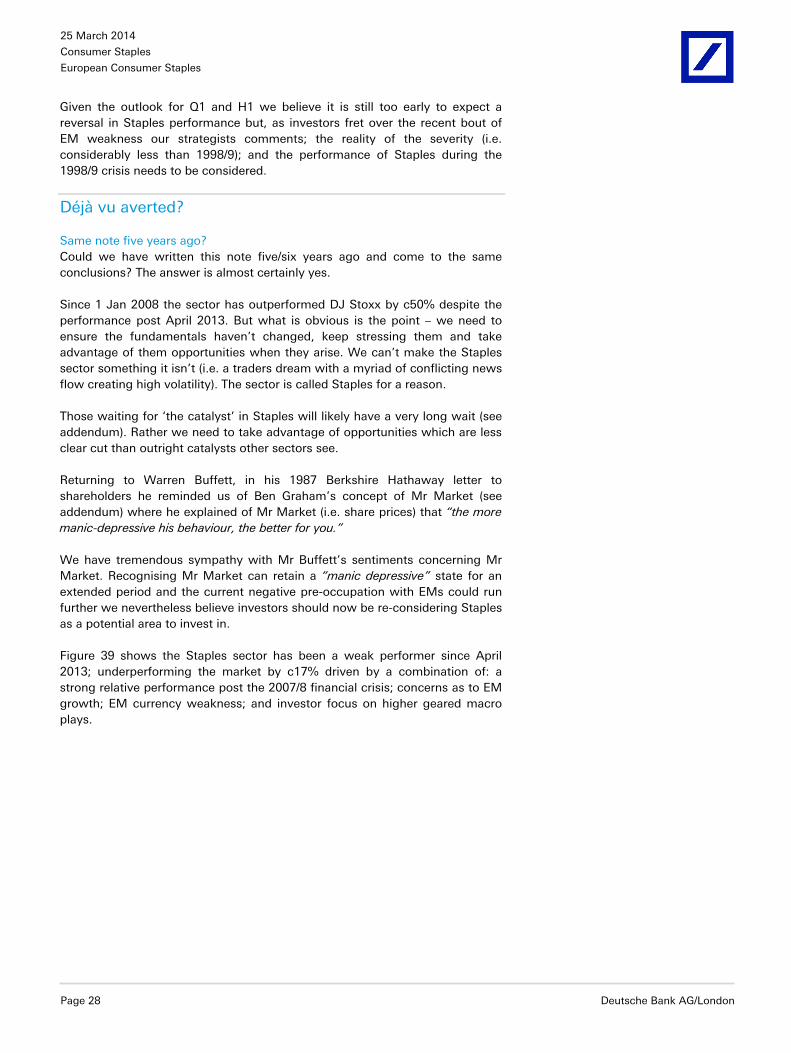
25 March 2014
Consumer Staples
European Consumer Staples
Page 28 Deutsche Bank AG/London
Given the outlook for Q1 and H1 we believe it is still too early to expect a reversal in Staples performance but, as investors fret over the recent bout of EM weakness our strategists comments; the reality of the severity (i.e. considerably less than 1998/9); and the performance of Staples during the 1998/9 crisis needs to be considered.
Déjà vu averted?
Same note five years ago? Could we have written this note five/six years ago and come to the same conclusions? The answer is almost certainly yes.
Since 1 Jan 2008 the sector has outperformed DJ Stoxx by c50% despite the performance post April 2013. But what is obvious is the point – we need to ensure the fundamentals haven’t changed, keep stressing them and take advantage of them opportunities when they arise. We can’t make the Staples sector something it isn’t (i.e. a traders dream with a myriad of conflicting news flow creating high volatility). The sector is called Staples for a reason.
Those waiting for ‘the catalyst’ in Staples will likely have a very long wait (see addendum). Rather we need to take advantage of opportunities which are less clear cut than outright catalysts other sectors see.
Returning to Warren Buffett, in his 1987 Berkshire Hathaway letter to shareholders he reminded us of Ben Graham’s concept of Mr Market (see addendum) where he explained of Mr Market (i.e. share prices) that “the more manic-depressive his behaviour, the better for you.”
We have tremendous sympathy with Mr Buffett’s sentiments concerning Mr Market. Recognising Mr Market can retain a “manic depressive” state for an extended period and the current negative pre-occupation with EMs could run further we nevertheless believe investors should now be re-considering Staples as a potential area to invest in.
Figure 39 shows the Staples sector has been a weak performer since April 2013; underperforming the market by c17% driven by a combination of: a strong relative performance post the 2007/8 financial crisis; concerns as to EM growth; EM currency weakness; and investor focus on higher geared macro plays.

25 March 2014
Consumer Staples
European Consumer Staples
Deutsche Bank AG/London Page 29
Figure 39: EU Staples relative to DJ Stoxx (indexed) Figure 40: EU Staples absolute performance (indexed)
90
95
100
105
110
115
120
125
Jan-
12Fe
b-12
Mar
-12
Apr
-12
May
-12
Jun-
12Ju
l-12
Aug
-12
Sep-
12O
ct-1
2No
v-12
Dec-
12Ja
n-13
Feb-
13M
ar-1
3A
pr-1
3M
ay-1
3Ju
n-13
Jul-1
3A
ug-1
3Se
p-13
Oct
-13
Nov-
13De
c-13
Jan-
14Fe
b-14
Mar
-14
90
100
110
120
130
140
150
160
Jan-
12Fe
b-12
Mar
-12
Apr
-12
May
-12
Jun-
12Ju
l-12
Aug
-12
Sep-
12O
ct-1
2No
v-12
Dec-
12Ja
n-13
Feb-
13M
ar-1
3A
pr-1
3M
ay-1
3Ju
n-13
Jul-1
3A
ug-1
3Se
p-13
Oct
-13
Nov-
13De
c-13
Jan-
14Fe
b-14
Mar
-14
Source: Deutsche Bank; Datastream Source: Deutsche Bank; Datastream
We suspect Figure 40 helps illustrates why Mr Buffett invests in numerous Staples companies. The sector may have underperformed the market impacting 1 year measurement statistics but for an investor with the time-frame of Mr Buffett they will take (considerable) solace from the absolute performance of the sector having been stable since April 2013. Of course, if we consider dividends the TSR of the sector has been higher in absolute terms over the last year.
So, in a year when Staples have caused investors considerable angst, absolute performance has held firm, before we consider the value of dividends... and since January 2012 Staples have risen c50% absolute (before dividends).
Time-frames are everything.
We may not yet have reached the final impasse of investor capitulation in Staples and we need to be clear: further earnings downgrades are very possible as a consequence of, but not restricted to: FX translation; weakness in some DM markets; short term weak EMs and category specific issues. As history has shown and as Mr Buffet so eloquently articulated... Mr Market can take his interpretation of events/value to extremes.
That said, no matter the extend of the market’s fixation with the fate of Staples in the context of an EM slow down, we are yet to meet any investor that sees the Staples malaise returning to the depths of the TMT bubble. We could take such a sanguine view as overly complacent but events such as TMT were so ‘black swan’ we feel (very) safe in suggesting we will not reach such an extreme interpretation of value, despite Mr Buffet’s reminder of how emotional Mr Market becomes: albeit impacted by USA litigation as well as the TMT bubble, in March 2000 BAT traded sub 250p and (very briefly) on a prospective P/E multiple of less than 5x and a dividend yield in excess of 13%.
25 March 2014
Consumer Staples
European Consumer Staples
Page 30 Deutsche Bank AG/London
So, whilst predicting when EM’s return to favour and thus those sectors with a disproportionate exposure seeing a benefit (such as Staples), is beyond our scope, we are aware of a number of factors:
demographics and per capita consumption is categorically in the industries favour
staples have materially underperformed (which of course does not mean they cannot continue to do so)
staples earnings yields are attractive relative to bonds
prospective P/E multiples are at long-run averages
despite market concerns the compounding of the Staples model continues (with some exceptions and some pit-falls along the way)
post the proliferation of December YE companies reporting, sell-side forecasts are up to speed with the implications of current spot rates
Q1/H1 being weaker for Staples than previously envisaged is seeping into market’s consciousness and thus, we assume, being discounted
Deutsche Bank’s strategists are considering EMs as a positive catalyst for stocks, not a negative catalyst, albeit biased to cyclical names
Given all these factors, and ourselves still saying it is too early to call a turn in Staples relative performance, we believe investors with longer time horizons should be considering the sector in a positive light.
Déjà vu averted? Yes... but we think we would have been right.

25 March 2014
Consumer Staples
European Consumer Staples
Deutsche Bank AG/London Page 31
Methodology
Not all EMs, categories or companies are equal
EM exposure by company is too simplistic Too often the market’s analysis of EMs and the Staples companies’ exposure to them is overly simplistic:
EMs are not uniform
EM populations and population growth prospects differ markedly
EM economies are not driven by uniform factors meaning long-term (invariably negative) FX drivers can vary
per cap penetration by category differs from market to market
market shares are not uniform
companies have different weightings in different categories in different markets
Accordingly we have considered EM population and population growth and established which markets will benefit (see from Figure 390) and which companies operate in these markets (see from Figure 313). We have looked at 22 consumer categories across our 21 country EM universe (see from Figure 56) to establish the best categories and from that, via company and country exposures established our Staples company preferences.
EMs the driver of growth
Per capita consumption has significant potential in EMs Meaningful population growth is non-existent in most large DMs, the USA aside. Per capita consumption generally, though not exclusively, is high and stable in DMs making DMs primarily a price/mix opportunity, with only marginal support from population growth. That said, not all category per caps are stagnating in DMs: compare beer and vodka in Figure 41.
In EMs the position is somewhat different: population is rising and per cap consumption, generally has significant potential. The World Bank forecasts global population to climb c1% pa from 7.1bn in 2012 to 8bn in 2025. The 21 EM countries we have analysed in this note compromise 58% of the World Bank’s global growth estimate.
In Figure 41 we have already seen the inexorable rise of vodka as a category in DMs.
Figure 41: Beer and Vodka DM per cap consumption
0
20
40
60
80
100
120
140
160
180
200
1998
1999
2000
2001
2002
2003
2004
2005
2006
2007
2008
2009
2010
2011
2012
Beer Vodka
Source: Deutsche Bank estimates; Euromonitor; each category re-based to its respective 1998 per cap consumption = 100

25 March 2014
Consumer Staples
European Consumer Staples
Page 32 Deutsche Bank AG/London
Taking that example further, Russian vodka is dominated by cheap local variants and is all but irrelevant to our basket of companies. Adjusting for this (and Poland and Ukraine) EM per cap consumption in vodka against 1998 DM per cap consumption as a benchmark of 100 had reached the heights of 16 in 2012 from 10 in 1998. There is significant EM potential in vodka. Vodka is just one of many examples we can cite in Staples. Add in population growth and, irrespective of short-term equity market jitters, EMs provide a compelling investment proposition for the Staples industry: they will be the long-term life blood of the sectors growth.
Limited support from price/mix EM growth will be dominated by volume through population and growth in per caps, not price/mix.
Deutsche Bank has written at length in the past as to pricing in Staples being artificially supported by inflation in the short term and over the long term FX adjusting to unwind the appearance of strong price/mix. Without re-tracing old, well established ground we wish to highlight that our work on per caps has served to categorically support Deutsche Bank’s long standing thesis.
First, a brief reiteration of the conclusions from previous work. Figure 43 sets out pricing reported by Colgate, Nestle and Unilever over 20 years. Mix is included in volume for these companies so we get a ‘clean’ price number which can then be disaggregated between reported prices and FX to get price net of FX, which we have shown on a rolling 5 year basis with an overall average as the last column.
We see on average for these companies (including our estimates for 2014) that pricing net of FX has cumulatively over the last 20 years been slightly negative. On a 5-year rolling basis 2007-2012 saw positive price but that was unwound in 2013 and even here the peak was less than 2.0% (2008). Interestingly, and supportive of our work in this note, price on a rolling five year basis started to climb in 2006 as price ‘recovered’ in EMs after the 1997/8 EM currency crisis. Reported revenue for these companies net of FX has grown over an extended period, but it has been dependent on mix, population growth and higher per caps, not price.
Turning to the findings in this note, outlined in Figure 44. Here our work concludes on price and mix in aggregate in US$ terms, and not price in isolation, but has the advantage of breaking price/mix into DMs and EMs.
We see in Figure 44 that price/mix in EMs over an extended period (1998-2012) is slightly below that of DMs at 2.6% versus 3.1%. Noting the positive impact of mix the results in Figure 44 are consistent with, and reiterate the conclusions, of Figure 47.
Figure 42: Vodka per cap consumption
0
20
40
60
80
100
120
140
160
180
200
1998 1999 2000 2001 2002 2003 2004 2005 2006 2007 2008 2009 2010 2011 2012
DM universe EM universe (ex Russia, Poland & Ukraine) relative to DMs
Source: Deutsche Bank estimates; Euromonitor; index takes DM in 1998 as the base at 100
Figure 43: Colgate, Nestle, Unilever cumulative pricing (%)
-2.0
-1.5
-1.0
-0.5
0.0
0.5
1.0
1.5
2.0
-6
-4
-2
0
2
4
6
1994
1995
1996
1997
1998
1999
2000
2001
2002
2003
2004
2005
2006
2007
2008
2009
2010
2011
2012
2013
2014
E
Avg.
FX (LHS) Price (LHS) Price net of FX rolling 5-year (RHS)
Source: Deutsche Bank; company data; un-weighted average across all three companies. Cumulative is the average of the rolled up years so 1996 is the average of price, FX and the net position for each company 1994, 1995 and 1996.

25 March 2014
Consumer Staples
European Consumer Staples
Deutsche Bank AG/London Page 33
Without the benefit of an extended time frame through which we can navigate the ‘FX cycle’ we see that over shorter time horizons investors can take a very different view: EM price/mix weakness in US$ terms 1998-2002 creating an air of EM pessimism and the ten years to 2012 excessive optimism (?).
The point remains the same: buy Staples with EM businesses for their exposure to rising populations; increasing rates of per cap consumption; the benefits of improving mix (which may be relatively long dated as categories take time to reach a critical level); but not pricing power – history shows it is an illusion of the FX/inflation trade-off that is ultimately corrected.
We can make three further points:
Having seen significant EM FX devaluations through 2013 we may be reaching a positive inflection point benefitting price/mix (until the cycle turns again)
Taking the analytical high ground can generate significant investment underperformance. As the FX cycle turned when markets emerged from the 1998-2002 period into 2002-2007 (per Figure 44) it would have been easy to argue “this price/mix isn’t real; it will all unwind”. It did unwind, but not until 2008 (the financial crisis) and again in 2013 (EM growth concerns). From an investment perspective, for those unfortunate enough to have time-frames less than the very long term, spotting the FX inflection point is potentially highly profitable
Having dismissed all Staples categories as having limited pricing power we make one very important caveat: tobacco has pricing power6.
Figure 45 looks at tobacco’s price/mix in EMs and DMs. Using retail prices we see DMs are 7.0% over the period 1998-2012 and EMs 4.8%. Retail pricing understates pricing to the manufacturers because of the excise multiplier in tobacco7.
6 Tobacco’s ability to pass on multi-year above inflation increases is predicated on an a number of factors including: (a) the nature of the product (addictive?) with no close substitutes – we believe the big 4 global tobacco companies will win in e-cigarettes against the smaller players because of superior distribution; (b) the excise burden, which in the majority of markets is specific biased facilitating above inflation price increases for the industry equating to inflation or a higher at the retail level; (c) because of the nature of the product, few new entrants to the core cigarette proposition 7 The excise multiplier drives higher pricing for tobacco than headline retail prices suggest as the majority of excise structures in the world are specific tax or specific tax biased. Assume excise is 75% of a pack; a pack costs 100 and all excise is specific. Assume retailers/wholesalers take 5% of the retail price. Pre price increase the manufacturer “take per pack” is 100 - 75 (excise) – 5 (retailer/wholesaler margin) = 20. Now assume retail prices increase 3% to 103. Specific tax is stable at 75 (until they inevitably increase [the vast majority of the time passed through to consumers]) and the retailer/wholesaler takes 5.15. The manufacturer is left with103 - 75 (excise) – 5.15 (retailer/wholesaler margin) = 22.85. Thus the manufacturers take has increased 22.85/20.00 = 14.25%. In this example the multiplier is 4.75x (14.25% to the manufacturer for a 3% retail price increase). In a real market context the value of this multiplier is diluted by downtrading and market volume declines in DMs.
Figure 44: Staples Price/Mix in DMs and EMs (US$)
-1.1%
7.0%
2.6%
4.8%
3.1%
-5.8%
8.2%
4.2%
6.2%
2.6%
-4.7%
1.2% 1.7% 1.4%
-0.4%
-8%
-6%
-4%
-2%
0%
2%
4%
6%
8%
10%
1998-2002 2002-2007 2007-2012 2002-2012 1998-2012
DM Price/Mix EM Price/Mix Differential (EM less DM)
Source: Deutsche Bank estimates; Euromonitor

25 March 2014
Consumer Staples
European Consumer Staples
Page 34 Deutsche Bank AG/London
We have assumed this is 2x to generate manufacturer pricing of 14% in DMs and 9.6% in EMs. We would immediately concede that this overstates DM price/mix because of downtrading but the impact of the change we have assumed is representative of the underlying market dynamics. The point is, tobacco manufacturer price/mix is materially ahead of that suggested by retail price changes.
Figure 45: Tobacco price/mix 1998-2012
Tobacco Developed Markets (Retail) 7.0%
Tobacco Emerging Markets (Retail) 4.8%
Tobacco multiplier 2x
Tobacco Price/Mix Manufacturer (DM) 14.0%
Tobacco Price/Mix Manufacturer (EM) 9.6%
Average for all categories DM 3.1%
Average for all categories EM 2.7%
Next Highest Category DM (Auto DW) 4.8%
Next Highest Category EM (Infant Milk Formula) 5.1%Source: Deutsche Bank estimates; Euromonitor; assumed neutral mix (there will be downtrading)
Why per capita consumption matters: first principles
A key growth variable: modelling the impact Volume/sales potential in a category is a variable dependent on a multitude of factors including, but not restricted to: economic growth; consumer preferences/needs; innovation and A&P.
In addition, population growth and per cap penetration/maturity of a category are also critical.
In Figure 46 we consider the impact of growing per caps in EMs.
Working through Figure 46, firstly in relation to DMs:
Per cap volumes in mature markets in a mature category will grow only slowly (if at all). Hence we have modelled per cap volumes in DMs climbing by their average 1998-2012 of 0.6% pa from 50.0 to 54.0 over 14 years. We believe the risk to this element of our forecast is marginally to the downside
We have set a price of 50 per unit and given assumed maturity of the category, limited price/mix to 3.1% as per our long term findings. Hence the price increases from 10.00 to 14.87 over time
Population in DMs climbs at 0.3% pa
All of which drives sales growth in the DM of 4.0% pa (0.6% per cap volume growth; 3.1% price/mix; 0.3% population growth).

25 March 2014
Consumer Staples
European Consumer Staples
Deutsche Bank AG/London Page 35
Figure 46: DM and EM per cap model Year 1 2 3 4 5 6 7 8 9 10 11 12 13 14
DM per cap vol. (units) 50.0 50.3 50.6 50.9 51.2 51.5 51.8 52.1 52.5 52.8 53.1 53.4 53.7 54.0
DM per cap vol growth 0.6% 0.6% 0.6% 0.6% 0.6% 0.6% 0.6% 0.6% 0.6% 0.6% 0.6% 0.6% 0.6%
EM per cap vol. (units) 15.0 15.6 16.2 16.8 17.5 18.2 18.9 19.6 20.4 21.2 22.0 22.8 23.7 24.7
EM per cap vol. growth 3.9% 3.9% 3.9% 3.9% 3.9% 3.9% 3.9% 3.9% 3.9% 3.9% 3.9% 3.9% 3.9%
EM vols. relative to DM 30.0% 31.0% 32.0% 33.1% 34.1% 35.3% 36.4% 37.6% 38.8% 40.1% 41.4% 42.8% 44.2% 45.6%
DM unit price 10.00 10.31 10.63 10.96 11.30 11.65 12.01 12.38 12.77 13.16 13.57 13.99 14.42 14.87
DM price/mix 3.1% 3.1% 3.1% 3.1% 3.1% 3.1% 3.1% 3.1% 3.1% 3.1% 3.1% 3.1% 3.1%
EM unit price 6.50 6.68 6.87 7.06 7.26 7.46 7.67 7.89 8.11 8.33 8.57 8.81 9.05 9.31
EM price/mix 2.8% 2.8% 2.8% 2.8% 2.8% 2.8% 2.8% 2.8% 2.8% 2.8% 2.8% 2.8% 2.8%
EM unit p. rel. to DM 65.0% 64.8% 64.6% 64.4% 64.2% 64.1% 63.9% 63.7% 63.5% 63.3% 63.1% 62.9% 62.8% 62.6%
DM population (m) 100.0 100.3 100.6 100.9 101.2 101.5 101.8 102.1 102.4 102.7 103.0 103.3 103.7 104.0
DM population growth 0.3% 0.3% 0.3% 0.3% 0.3% 0.3% 0.3% 0.3% 0.3% 0.3% 0.3% 0.3% 0.3% 0.3%
EM population (m) 200.0 201.8 203.6 205.4 207.3 209.2 211.0 212.9 214.9 216.8 218.7 220.7 222.7 224.7
EM population growth 0.9% 0.9% 0.9% 0.9% 0.9% 0.9% 0.9% 0.9% 0.9% 0.9% 0.9% 0.9% 0.9% 0.9%
DM revenues 50,000 52,015
54,111
56,291 58,560 60,920 63,375 65,928 68,585
71,349
74,224
77,215 80,327 83,564
DM rev growth 4.0% 4.0% 4.0% 4.0% 4.0% 4.0% 4.0% 4.0% 4.0% 4.0% 4.0% 4.0% 4.0%
EM revenues 19,500 21,015 22,648 24,408 26,305 28,349 30,552 32,926 35,484 38,241 41,213 44,415 47,867 51,586
EM rev growth 7.8% 7.8% 7.8% 7.8% 7.8% 7.8% 7.8% 7.8% 7.8% 7.8% 7.8% 7.8% 7.8%
EM revs/DM revs 39.0% 40.4% 41.9% 43.4% 44.9% 46.5% 48.2% 49.9% 51.7% 53.6% 55.5% 57.5% 59.6% 61.7%Source: Deutsche Bank
As regards EMs:
we have assumed the category is immature in EMs and set per cap consumption at 30% of that of DMs in year 1, i.e. 15 units per cap
given this relative immaturity, and assumed economic growth, we model per caps climbing 3.9% pa., in line with the average we model across our category universe
with DM per caps climbing at 0.6% pa and EMs at 3.9% EM volumes as a proportion of DM climbs steadily but over the 13 years to 2025 only narrows from 30% to 45.6% implying significant ongoing per cap growth in EMs relative to DMs
we have modelled US$ pricing at 65% of that in DMs in Year 1 (in line with the average across our categories in 2012), in this case 65 per unit
in addition, we have modelled hard currency EM price/mix of 2.8% pa, lower than in DMs, and in line with our forecasts. We have therefore assumed that EM pricing declines in perpetuity relative to DMs.

25 March 2014
Consumer Staples
European Consumer Staples
Page 36 Deutsche Bank AG/London
The perception of strong pricing in EMs is invariably driven by an assumption (whether explicit or implicit) of sustained currency appreciation over an extended period. The end result is complacency in times of EM growth (as we have witnessed since c2003) replaced by angst when the excessive growth is unwound sharply, as we are currently seeing.
We model hard currency EM price/mix of 2.8%, in line with our forecasts.
price/mix of 2.8% in EMs, takes the hard currency price per unit in EMs from 65% of that in DMs to 62.6% over 13 years – declining in relative terms in perpetuity
global population growth is skewed to EMs, as we discuss later. From a base of 100 in DMs we assume 0.3% pa population growth. From a base of 200 in EMs we assume population growth of 0.9% pa (in line with World Bank projections).
The end result is EMs grow c2x as fast as DMs at 7.8% pa (3.9% per cap growth; 2.8% price/mix and 0.9% population growth) and that is in hard currency terms at price per unit declining relative to DMs in perpetuity; not illusory inflation driven, short term, artificially and unsustainably high growth in EMs.
Clearly, the reality of world economics dictates that actual results will be more volatile than we have outlined but the point to point move from Year 1 in Figure 46 to Year 14 is, we believe, representative of many Staples categories.
DM pricing and FX
FX fluctuations impact DMs as well Our representative sample of DM markets is USA, UK, Germany, France, Australia and Japan.
For the purposes of our DM price/mix calculations we have modelled in US$ terms converted at the average rate for the given year.
We consistently model in US$ terms across EMs and DMs to derive ‘hard currency’ pricing: the logic being to unwind the impact of FX fluctuations on EM pricing. We believe there is little argument with this approach, but it does have an unintended consequence: we should be aware of the impact of fluctuations in US$/€, US$/£, US$/Yen and US$/AUS$ impacts on DM pricing.
FX fluctuations are very real within DMs, as recent history has shown: the US$ significantly appreciated against the €, AUS$ and £ in mid 2008 as the financial crisis impacted markets: this factor needs to be considered. Whether EM or DM based FX fluctuations impact a business one intractable fact remains: investors cannot buy constant currency earnings. FX matters.
Having made that categorical statement we now proceed to contradict ourselves.

25 March 2014
Consumer Staples
European Consumer Staples
Deutsche Bank AG/London Page 37
When comparing DMs and EMs there is a default mind-set that ‘hard currency’ earnings are free from FX impacts. They’re not. Modelling our categories across US, UK, Germany, France, Australia and Japan at actual rates for the period 1998-2002 shows price/mix as per Figure 47, and we see over the fourteen year period this was 3.1% in US$ terms.
Taking the mind-set of ‘EM is FX volatile, hard currency is hard currency’ (for that read hard currency is constant) we look at our DM price/mix on a constant currency basis in Figure 47 and see that price/mix over the period 1998-2012 was 2.5% in DMs against the 3.1% at actual rates. The difference is insufficient to alter our views but nevertheless should be considered.
Looking at distinct periods we see negative US$ pricing 1998-2002; once we adjust for aggregate depreciation of the AUS$, Yen and £ generates small positive price/mix of 0.4%. For 2002-2012 actual rate price/mix of 4.9% is 3.4% in constant currency terms as, despite the flight to the US$ in mid 2008, all our DM currencies appreciated against the US$ over the extended 10 year period to 2012.
Invariably when considering EM price/mix potential we have looked at price per unit relative to DMs (i.e. the absolute upside potential) and price/mix trends in the EM over an extended period to ‘iron-out’ as much short-term FX volatility as possible. For example 2002-2007 price/mix is artificially high as FX currencies rallied following the depreciation of the 1997/8 EM crisis: by extending 1998-2012 we arguably capture the full ‘FX cycle’.
Over the breadth of our 14 year time frame US$ depreciation against our DM universe has slightly inflated the DM price/mix to 3.1% from a constant currency DM price/mix of 2.5%. More conservative investors may wish to place a slight discount to the DM price/mix benchmark of 3.1% over 14 years we have used. Whether they do so or we envisage no change to our conclusions being materially different.
Global price/mix 2.5% pa? One final point strikes us: constant currency DM price/mix is in line with US$ EM price mix of 2.6%. Therein may lie the answer – price/mix globally is 2.5% pa.
Figure 47: DM US$ price/mix across all categories 1998-2002 2002-2012 1998-2012
At actual rates -1.1% 4.9% 3.1%
At constant rates 0.4% 3.4% 2.5%Source: Deutsche Bank estimates; Datastream; Euromonitor
To weight or not to weight
Impact of China and India We have focused our analysis on per capita consumption of Staples products across a number of EM markets. If we were to weight our analysis of each category we would do so by population (the obvious link to relative per cap consumption levels). Where we to adopt that methodology China and India combined (based on 2012 populations) would have a combined weighting of 57% and would dominate our conclusions.

25 March 2014
Consumer Staples
European Consumer Staples
Page 38 Deutsche Bank AG/London
Looking at the categories in the context of countries only and in isolation to our universe of companies’ exposure to those countries, weighting the countries via population would be a reasonable methodology.
Once we introduce the complication of our companies’ exposure we have to consider the impact of a potential mismatch between the population skew China and India has on country weightings against where our universe of companies operate.
Figure 48 shows the respective companies exposure to India and China combined and the proportion of our country universe population that comes from China and India.
Figure 48: Consumer Staples China/India proportion of EM sales
0%
10%
20%
30%
40%
50%
60%
Chi
na/In
dia
Rem
y
Per
nod
L'O
real
Nes
tle
Uni
leve
r
Hen
kel
Rec
kitt
Ave
rage
ex
Bei
ersd
orf
AB
I
Sta
ples
Avg
Dan
one
Dia
geo
Car
lsbe
rg
Hei
neke
n
SA
B
Cam
pari
Sw
. Mat
ch
Impe
rial
BA
T
CC
H
Source: Deutsche Bank estimates; company data; World Bank; excludes associates (e.g. ITC for BAT); China/India is the proportion of our EM universe population from China and India combined;’ average ex’ excludes CCH, BAT, Imperial, Campari and Remy on basis of exposure to China/India or size of company
The only companies that come close to this level as a proportion of their respective EM sales are Remy (a relatively small company with sales of c€1bn) and Pernod. Remy has no significant exposure to India. Both companies exposure in China is primarily via one product (Cognac) where the market has collapsed in the last 12 months: our data source is to 2012 only.
After Remy and Pernod, the next biggest is L’Oreal at 25% with Nestle next at 20% and Unilever at 17%.
The average is 14% and the average ex those with no exposure, Campari and Remy is 16%. Accordingly we chose not to weight China and India and by implication given them a combined 10% weighting. Where they have a significant impact on a given category we have discussed them in our conclusions to each category.
Market shares We assume no change in market shares with all companies growing in line with the category in each market.

25 March 2014
Consumer Staples
European Consumer Staples
Deutsche Bank AG/London Page 39
The House View
EM exposure now providing an opportunity?
Time to circle the Staples names Below we copy the front page of a note written by our European strategists on 6 March called “Global credit impulse – the already substantial EM adjustment”. In addition, as addendums at the end of this note we copy from the same note, our strategists view on various EM regions and an explanation of the credit impulse. For further detail contained within “Global credit impulse – the already substantial EM adjustment” please see Deutsche Bank’s research website.
Given the comments of our strategists and the extensive work we have done on per cap consumption, we believe it is time for investors to start circling the Staples names.
“Global credit impulse – the already substantial EM adjustment” 6 March 2014 In this quarterly publication we apply the credit impulse analysis to regions and countries globally. The credit impulse is the change in credit growth and we argue that this is the important variable for spending growth, not credit growth. We use the analysis to assess potential turning points and gauge the scope for economic surprise since we do not think the argument is well understood in the market. Economic surprises drive equities.
“We think the strength in global growth is underappreciated. Global GDP growth was robust in the second half of last year, averaging 3.9% qoq annualised on our estimates, and despite recent concerns around a weakening of EM, the global PMI actually rose further in February to a 34-month high of 53.3. This suggests global growth has the potential to accelerate further from that seen in 2H13.
“From a credit impulse perspective we see this better growth in 2014 as fully justified. The US credit impulse should remain positive on average and for the first time since 2010, the Euro area credit impulse should be positive too. China’s credit impulse has been negative since 2Q13 and been a concern for us for a long time now given the high level of credit growth there. But it is easy to neglect how this headwind can be partly offset by better growth from developed economies. EM export volumes are up 18% annualised (3m/3m).
“In addition to this, and perhaps more controversially, we see growth in EM (EMEA, LatAm, Asia ex-China) as being to an extent supported at current levels. In broad terms, credit growth has already been falling for over 2 years, the credit impulse is already negative, and economic growth has already adjusted down to the low levels that the negative credit impulse implies. Further falls in credit growth may come from hikes in rates, but this unlikely to translate into a more negative credit impulse than we have already. Bear in mind that credit growth across many emerging economies has already reached low levels relative to history. (Emphasis added)

25 March 2014
Consumer Staples
European Consumer Staples
Page 40 Deutsche Bank AG/London
“European equities have already moved to reflect concerns over EM. The DAX is at a substantial discount to Europe (8%) while the premium the Swedish market has commanded over Europe has narrowed to 2009 levels. We think EM has played a role in breaking apart previously correlated sectors. Healthcare (SXDP) has outperformed food & beverages (SX3P) by 12% over the last 12 months...
“Globally exposed stocks overall in Europe have now underperformed domestic stocks by 15% over the last 12 months... So while our preference remains for domestically orientated cyclicals because we see greater visibility in the Euro area growth surprise, it is important to appreciate that the stage is looking increasingly set for looking for opportunities across European stocks with EM exposure. (Emphasis added)
Later in the same note our strategists make the following additional comments...
“Our outlook for global growth ...this note is all about focusing on the potential for economic surprise globally, because European earnings are a global growth story... Figure 49 shows the broad relationship between earnings growth and global GDP growth.
“A rate of 4% global GDP growth (as implied by the global mfg PMI) should produce 10% real or 12% nominal earnings growth. 4% global GDP growth is just about possible if China does 7.5% growth the Euro area does 1.5% (our expectation on the back of a positive credit impulse) and the US does 3.2%.
Figure 49: Global GDP growth and European EPS growth
-40
-30
-20
-10
0
10
20
30
-1
0
1
2
3
4
5
6
80 82 84 86 88 90 92 94 96 98 00 02 04 06 08 10 12 14E
Global growth (PPP) DS Europe real EPS growth (rhs)
% yoy % yoy
Source: Deutsche Bank, Datastream
“We believe that the credit impulse work detailed in this note, gives us grounds to be confident around making this prediction. In the US the Fed’s Senior Loan Officers Survey shows how the US credit impulse is likely to remain positive and as a result US growth will likely prove resilient. In the Euro area the ECB lending survey tells us that a positive credit impulse lies ahead, having recovered from negative to neutral. While in the UK the credit impulse remains positive.

25 March 2014
Consumer Staples
European Consumer Staples
Deutsche Bank AG/London Page 41
“It is important to recognise, particularly at these times, that under these auspices, developed growth is being domestically driven. And this is indeed coming through in the data – during Q4, private final demand contributed positively to growth across of the big 4 Euro area economies, the first time we’ve seen this since 2010.
“So can developments across EM negatively feedback into global growth? The point we have attempted to make in the credit impulse section of this note is that we find it difficult to see a major risk of further deterioration in EM growth from where we are currently. In addition to this, we think it is easy to neglect the impact of stronger DM growth on EM.
Figure 50: The impact of DM on EM Figure 51: EM exports and EM equities
-8
-6
-4
-2
0
2
4
6
8
-40
-30
-20
-10
0
10
20
30
40
1992 1995 1998 2001 2004 2007 2010 2013
EM export volumes, % 3m/3m annualised
DM GDP, % qoq annualised (rhs)
-80
-60
-40
-20
0
20
40
60
80
100
-20
-10
0
10
20
30
1992 1995 1998 2001 2004 2007 2010 2013
EM export volumes, % yoy
MSCI EM, % yoy (rhs)
Source: Deutsche Bank, CPB, Haver Source: Deutsche Bank, CPB, Haver
“Figure 50 shows how EM exports are already responding positively to the strength in developed economies and Figure 51 shows how this can be important when thinking about the performance of EM equities. Export volumes are annualising a growth rate of 18% (3m/3m). This can do a lot to offset any domestic weakness. In fact Michael Spencer recently wrote about this in the Global Economic Perspectives, 28 February.
“Later in the year, given the fall we have already had in credit growth across many emerging economies (which we think goes underappreciated), we wouldn’t be surprised to see it start to stabilise. At which point there would be the possibility of a recovery in the credit impulse from negative to neutral across EM and we have seen what this has done to PMIs across the Euro area in the last 18 months. So we do not think EM will de-rail the global growth picture.
“European equities – capturing the response to EM weakness With this view we are on standby to re-engage more aggressively with the globally exposed companies in Europe. On our estimates they have underperformed domestic stocks in Europe by 15% over the last 12 months.”

25 March 2014
Consumer Staples
European Consumer Staples
Page 42 Deutsche Bank AG/London
This page has been left blank intentionally

25 March 2014
Consumer Staples
European Consumer Staples
Deutsche Bank AG/London Page 43
Per Capita Consumption
Covering the bases
EM exposure? To state what was deemed an investment ‘given’ (but is currently less so): EM exposure is a positive over the long-term. The view of EMs as a long-term positive can be punctuated by concerns emanating from economic growth; currency depreciation; governance and/or political and social unrest. We are in the midst of such concerns with investors focussing on reduced expectations for EM growth and 2014 forecasts being impacted by currency depreciation. Irrespective of current concerns, investors will inevitably return to seeing EM’s as a positive driver of growth.
Whether seen as a driver of growth or remaining a concern, the blanket question we are often asked concerning EM’s (“what’s its exposure?”) is too broad brush in our view: the question of what EM exposure means is not as simple as the “what’s the EM exposure?” infers. In the subsequent sections we lay out our growth assumptions for 22 Staples categories in EMs with reference to per cap growth rates in EMs and DMs, US$ pricing in both and 14 year trends. Figure 52 summarises our favoured and least favoured categories.
Figure 52: Category Growth Rate Forecasts in EMs Per Cap EM volume EM price/mix per unit EM per cap revenue
Most Favoured
Auto dishwash 8.2% 1.3% 9.6%
Prepared baby food 5.5% 3.4% 9.1%
Whisky 6.5% 1.7% 8.3%
Skin Care 6.0% 2.0% 8.1%
Vodka 7.0% 1.0% 8.1%
Least Favoured
Dairy 2.4% 3.2% 5.7%
Packaged food 1.4% 3.7% 5.2%
Bottled water 4.5% 0.6% 5.1%
CSDs* 1.4% 3.2% 4.6%
Beer 1.5% 2.5% 4.0%Source: Deutsche Bank; *we estimate CCH will slightly outperform and achieve c5% EM per cap sales growth
Data universe We have utilised Euromonitor’s database. The universe of EMs we will be referring to comprise: Argentina; Bangladesh; Brazil; China; Columbia; Egypt; Ethiopia; India; Indonesia; Kenya; Mexico; Nigeria; Pakistan; Philippines; Poland; Russia; South Africa; Thailand; Turkey; Ukraine; Vietnam and comprise 65% of the World Bank estimates for 2012 global population, i.e. 4566m against a world population of 7046m. The universe of DMs is: USA, UK, Germany, France, Australia and Japan.
We have made more extensive comments on beer and tobacco given their broadly generic category characteristics and these categories broadly matching the business profiles of seven companies in our universe (ABI, Carlsberg, Heineken, SAB, BAT, Imperial Tobacco and Swedish Match.

25 March 2014
Consumer Staples
European Consumer Staples
Page 44 Deutsche Bank AG/London
Beverages: Beer
Conclusions Beer has one of the weakest upside EM per cap profiles of all the categories we have reviewed; only tobacco, infant milk formula and bottled water are more developed in EMs (see Figure 20) with beer per cap consumption in EMs relative to DMs at c51% (see Figure 61). We believe better long-term value within Staples names sits outside the beer category; within beverages we favour the Spirits companies.
We estimate relatively low growth in beer per caps over the medium term in EMs; in the region of 1.5% pa. Beer is one of the few categories we have reviewed where DM per caps are declining (by 2.4% pa 2007-2012).
In addition, EMs pricing power in beer has been no stronger than in DMs (averaging price/mix of 2.0% in US$ terms since 1998 vs. 2.2% in DMs). Modelling 2.0% price/mix growth for beer in EMs over the medium term will imply relatively stable pricing in EMs relative to DMs (c45% in US$ terms). This may be too conservative. We model 2.5% price/mix (slightly higher than history for both EMs and DMs) taking our assumption for medium term per cap revenue growth in EMs to 4.0% pa. in beer.
Within beer, we are conscious that not all EMs are the same and those companies in the right geographies do stand to benefit. The difference in per cap consumption is marked: Russia is in line with DMs; China around 50% and Nigeria c15%. India hardly registers in per cap terms (but may never do so). Exposure to DMs and Eastern Europe in beer is a clear negative mix relative to other consumer categories and countries.
We see Eastern Europe and Russia as fully developed with limited per capita growth potential. Furthermore, there are cultural limits in Asian markets such as India and China capping per capita consumption seen at levels below developed markets we believe. Latin America and particularly Africa do stand to benefit from per capita growth from a very low base and the category switching from non-commercial alcohols.
Developed markets remain a concern, with limited upside potential due to population dynamics and the preferential shift to spirits. With a continued decline, in the long term, there is the possibility for DM and EM per capita consumption to ‘meet in the middle’ by 2030.
Figure 53: Global Retail Beer Market (US$277bn)
68
54
46 45
39
16
8
0
10
20
30
40
50
60
70
Asia Pacific North America
Latin America
Western Europe
Eastern Europe
Middle East and Africa
Australasia
Source: Deutsche Bank Deutsche Bank; Euromonitor; 2012 data
Figure 54: Beer per cap value (US$) by region
539
305 304
182163
41 28
0
100
200
300
400
500
600
Australasia North America
Western Europe
Latin America
Eastern Europe
Asia Pacific Middle East and Africa
Source: Deutsche Bank Deutsche Bank; Euromonitor; 2012 data
Figure 55: Beer per cap volume by region (litres)
75 7469
5653
18
11
0
10
20
30
40
50
60
70
80
North America
Eastern Europe
Australasia Western Europe
Latin America
Asia Pacific Middle East and Africa
Source: Deutsche Bank Deutsche Bank; Euromonitor; 2012 data

25 March 2014
Consumer Staples
European Consumer Staples
Deutsche Bank AG/London Page 45
With the lack of volume growth in DM and strong positions of the individual brewers in EM, we are concerned at the lack of real pricing in the category and do not forecast a significant change.
Figure 56: Beer medium term EM per cap revenue growth estimates Per cap volume growth 1.5%
Price/mix 2.5%
Per cap revenue growth 4.0%
Category Rank 22/22
Total EM sales exposure of relevant companies
SABMiller 63%
ABI 53%
Heineken 48%
Carlsberg 46%
Diageo 44%Source: Deutsche Bank estimates; India and China un-weighted;
Euromonitor definition An alcoholic drink usually brewed from malt, sugar, hops and water and fermented with yeast. Some beers are made by fermenting a cereal, especially barley, and therefore not flavoured by hops.
The limits of imposing ‘Western’ culture We have to be extremely careful in applying western culture and preferences on non-Western markets with the assumption that it is just a matter of time before all things western envelope the world: culture, consumer preferences and factors like religion are all drivers of differing market dynamics.
More fundamental is the importance of innate core beer drinking occasions within a market. As a publicly bought and publicly consumed good, the primary occasion for beer consumption is refreshment in a social setting. In most emerging markets, this tends to be people (typically male) bonding while drinking alcohol. Home-made sorghum beer in African markets, aquadiente in Latin American markets and locally distilled vodka in Eastern Europe are mostly drunk in social settings. As incomes rise an beer quality improves, there is a natural movement towards more hygienic, commercial long alcoholic drinks such as beer, though the social dynamics stay the same. The conversion of home-made/local alcohol drinks has historically driven the growth of beer, especially where beer seen as aspirational in public social settings.
The absence of such an occasion as is the case in India makes it similar pattern of converting unlikely. In such a situation, conversion from prevalent country liquor and other homemade products to beer will not happen as these drinks are often not drunk in social and public settings. Rather, the primary occasion in the lower income groups is one that centres on a quick consumption occasion to attain the effect of alcohol rather than as part of an extended social occasion.
Figure 57: Per Capita Beer Consumption 2011 (litres)
0
20
40
60
80
100
120
140
Cze
chA
ustri
aG
erm
any
Irela
ndEs
toni
aP
olan
dFi
nlan
dC
roat
ia
Slo
veni
aA
ustra
liaPa
nam
aV
enez
.
Bel
gium
Rom
ania
USA
Hol
land
Lith
uani
a
Bul
garia UK
Spa
inH
unga
rySl
ovak
ia
New
Z.
Latv
iaC
anad
aSource: Kirin Holdings

25 March 2014
Consumer Staples
European Consumer Staples
Page 46 Deutsche Bank AG/London
The visibility that accompanies the social consumption of beer also makes it more vulnerable to regulation. Again, as an example in India, the structural and regulatory environment will likely continue to hamper any potential growth in our view. Beer regulation in that market is, and will continue to be, determined at a state level. The result is a prevalence of dark marketing and over 30 different excise regimes, which remain varied and unpredictable. Government wholesalers account for the majority of the market and the lack of growth in licensed outlets furthermore hampers the ability of brewers to execute and influence the purchase environment.
Central/Eastern Europe and Russia beyond maturity With the core beer occasions in place, historically the beer culture has been very much entrenched in Central Europe. This most notably exemplified by the Czech Republic which has the highest global per cap consumption at 160 litres at its peak in 2007. The entry of the global brewers in the post-communist era and the subsequent professionalisation of the brewing industry accelerated the category switch from local, often unregulated vodka in Eastern Europe. Today, per capita consumption has matched and often exceeded developed markets, with Russia at 70 litres per cap and Poland close to 100 litres.
Current social and legislative trends will not help. The structural shift of beer consumption from the on-premise/out of home to the organised off-premise retail reduces the brewers’ ability to directly influence the consumer’s purchasing behaviour. Legislative pressure from marketing to sales restriction to packaging restrictions as most vividly illustrated in Russia will further inhibit any per capita growth.
Almost there in China Chinese beer consumption has grown strongly (per caps compounding at 23% pa) over 14 years off an extremely low base (10% of that of our declining DM universe) as Figure 59 shows. Much of this historic growth has been driven by the food occasion- The relatively low alcohol and low bitterness of Chinese beer sees beer play a prime role as an accompaniment in daily meals. Per caps of around 35 litres are hitting the normalised rates of developed Asiatic markets such as Japan at 45 litres. Considering the low cost of beer in China, pricing is not a barrier to consumption in China and we see limited per capita upside.
Room for growth in LatAm; strong growth in Africa There over 2 billion consumers in Africa and Latin America with favourable population dynamics who have yet to fully engage with the beer category and provide potential per capita growth for those companies in the right geographies. Notable exceptions are Brazil and South Africa where market leaders ABInBev and SABMiller respectively are unlikely to benefit from per capita growth which currently exceed 60 litres per capita, and could be considered mature beer markets.
Figure 58: Beer Consumption 2011 (bn litres)
0
5
10
15
20
25
30
35
40
45
50
Chi
na
US
A
Bra
zil
Rus
sia
Ger
m.
Mex
ico
Japa
n
Ukr
aine
Pola
nd
Spai
n
S. A
frica
Ukr
aine
Viet
nam
Can
ada
Col
omb.
Vene
z.
S. K
orea
Fran
ce
Arg.
Indi
a
Cze
ch
Aus
tralia
Italy
Thai
land
Rom
ania
2010 2011
Source: Kirin Holdings
Figure 59: Beer per cap consumption in selected markets
0
20
40
60
80
100
120
1998
1999
2000
2001
2002
2003
2004
2005
2006
2007
2008
2009
2010
2011
2012
UK USA Russia China Nigeria India
Source: Deutsche Bank: Euromonitor

25 March 2014
Consumer Staples
European Consumer Staples
Deutsche Bank AG/London Page 47
However, the Andean and Central American region still leave plenty of scope for per capita growth as GDP rises in the area. Current per capita consumption ex-Brazil is around 40 litres and beer is encroaching on occasions traditionally held by local spirits.
Africa provides the greatest potential with the fastest population growth and most favourable demographic profile. Additionally, as discussed above, we see sub-Saharan Africa as having a well entrenched social drinking culture and an informal, non-commercial alcohol market four times the size of beer. The category shift from informal alcohol to beer is well documented in markets such as South Africa where the 5:1 ratio of informal alcohol and beer reversed over a 20 year period. Nigeria, with the second highest absolute population growth of our universe, currently only registers 15% of the per cap consumption of developed markets. In addition, 40 other sub-Saharan markets in Africa on average have a per capita consumption below 10 litres per capita.
DMs remain a concern Beer is one of the few categories we have reviewed where DM per caps are declining (by 2.4% pa 2007-2012 see Figure 60 and Figure 65). The negative population dynamics and an increasing preference for spirits and wine we believe will continue to dampen any future prospects. The aging profile and negative population growth particularly hampers European consumers not helped by a shifting of consumer behaviour now also being seen in Eastern Europe. Beer maturing in EMs is not just about EM per cap growth rates: it is also potentially about the rate of decline in per caps in DMs.
Figure 60: Beer per cap. consumption (indexed) Figure 61: Beer per cap. consump. (EM relative to DM)
0
10
20
30
40
50
60
70
80
90
100
1998
1999
2000
2001
2002
2003
2004
2005
2006
2007
2008
2009
2010
2011
2012
Developed Market univerese Emerging Market universe
0%
10%
20%
30%
40%
50%
60%
70%
80%
90%
100%
1998
1999
2000
2001
2002
2003
2004
2005
2006
2007
2008
2009
2010
2011
2012
Source: Deutsche Bank; Euromonitor; index takes DM in 1998 as the base at 100 Source: Deutsche Bank; ; Euromonitor
EM pricing power underutilised Relative pricing in EMs immediately after the EM currency crisis of 1997/8 declined in US$ terms per capita from 1998 to 2004 (see Figure 63 and Figure 67). The period of relative EM stability 2002-2012 and 2002-2007 in particular may have left the perception of strong pricing (Figure 67). That said, an analysis over an extended period capturing the ‘cycle of FX volatility’ shows this to be an illusion. Figure 67 shows price mix in US$ terms 1998-2012 has, in fact, been marginally lower in EMs (2.0% vs 2.2% in DMs).

25 March 2014
Consumer Staples
European Consumer Staples
Page 48 Deutsche Bank AG/London
Figure 62: Beer retail value per unit (US$) Figure 63: Beer EM retail value per unit vs DM
0
20
40
60
80
100
120
140
160
1998
1999
2000
2001
2002
2003
2004
2005
2006
2007
2008
2009
2010
2011
2012
Developed Market univerese Emerging Market universe
0%
10%
20%
30%
40%
50%
60%
70%
80%
90%
100%
1998
1999
2000
2001
2002
2003
2004
2005
2006
2007
2008
2009
2010
2011
2012
Source: Deutsche Bank; Euromonitor; index takes DM in 1998 as the base at 100 Source: Deutsche Bank; Euromonitor
Modelling 2.0% price/mix growth for beer in EMs over the medium term will imply relatively stable pricing in EMs relative to DMs (c45% in US$ terms). This may be too conservative. We model 2.5% price/mix (slightly higher than history for both EMs and DMs) taking our assumption for medium term per cap revenue growth in EMs to 4.0% pa. in beer
Some of which, again, can be contributed to different dynamics in different EM zones. In Eastern Europe and Russia, a shift to the organised off-premise retail, the growth of large PET packaging formats, and the viability of the economy brands have proven to be revenue (and margin) dilutive. Though we have equal weighted China, its strong volume growth also has had a dilutive effect to the mix as revenue per unit is almost a third of other EMs.
However, considering often the strong market positions brewers enjoy in EMs, price mix growth has been meagre. The inflationary environments in many EMs should provide a safe platform for price increases. The brewers have not taken advantage and nor demonstrated any supposed pricing power, favouring the trade off for volume.
‘Meet in the middle’ in 2030? There is a strong argument to suggest that as EM consumer and societal preferences reflect DMs, that EM per caps will never reach the heights of current DM per caps, never mind those at the start of our reference period; 1998.
As these changes in societal preferences take hold DM and EM per cap consumption rates may ‘meet in the middle’ at some point in the future. That point, based on CAGR growth rates for EMs and declines for DMs is in 2030 (see Figure 64).
Per cap consumption has climbed every year in our EM universe from 1998 at an average rate of 1.9% points providing a degree of support to the assumption of medium term growth but if there is logic in the ‘meet in the middle’ argument then growth of 1.9% pa caps out in 2030 as DM per caps decline.
Figure 64: Potential beer per cap progression
0
10
20
30
40
50
60
70
80
90
1998
2000
2002
2004
2006
2008
2010
2012
2014
E
2016
E
2018
E
2020
E
2022
E
2024
E
2026
E
2028
E
2030
E
DM per caps EM per caps
Source: Deutsche Bank estimates; Euromonitor

25 March 2014
Consumer Staples
European Consumer Staples
Deutsche Bank AG/London Page 49
Holistically, we estimate relatively low growth in beer per caps over the medium term in EMs; in the region of 1.5% pa. However, the broad definition of EM requires caution.
This relatively low rate of growth could be capped by more established emerging markets as increased regulation (e.g. Russia) and changing consumer preferences potentially mimic changing DM consumer preferences away from beer toward spirits, wine and alternatively flavoured alcohol products with Africa and Latin America providing a positive offset.
Figure 65: Beer litres per cap. CAGR Figure 66: Beer value (US$) per cap CAGR
-0.8%-1.2%
-2.4%-1.8% -1.5%
4.0%
6.1%
1.4%
3.8% 3.8%
-3%
-2%
-1%
0%
1%
2%
3%
4%
5%
6%
7%
1998-2002 2002 -07 2007-12 2002-12 1998-2012
Developed Market universe Emerging Market universe
-2.9%
5.4%
-1.0%
2.1%0.7%
-4.2%
14.2%
6.3%
10.2%
5.9%
-10%
-5%
0%
5%
10%
15%
20%
1998-2002 2002 -07 2007-12 2002-12 1998-2012
Developed Market universe Emerging Market universe
Source: Deutsche Bank; Euromonitor Source: Deutsche Bank; Euromonitor
Figure 67: Beer retail price/mix CAGR (US$)
-2.1%
6.6%
1.4%
4.0%
2.2%
-7.9%
7.6%
4.8%6.2%
2.0%
-10%
-8%
-6%
-4%
-2%
0%
2%
4%
6%
8%
10%
1998-2002 2002 -07 2007-12 2002-12 1998-2012
Developed Market univerese Emerging Market universe
Source: Deutsche Bank; Euromonitor

25 March 2014
Consumer Staples
European Consumer Staples
Page 50 Deutsche Bank AG/London
Beverages: Whisky
Conclusions Whisky shows strong growth characteristics in EMs. EM per cap consumption has grown at a CAGR of 6.5% pa. This growth potential is supported by emerging positive recent trends in DMs: since 2007 per cap consumption in DMs has been increasing. Despite growth in EMs, per cap consumption relative to DMs is still low at only c17%. Price per unit in EMs are high and are not expected to climb significantly as the category matures to become increasingly ‘mass-market’.
Whisky is one of our favoured categories, though like all others, over an extended period US$ per unit revenue growth may be subdued: we have assumed 1.7% (see Figure 71) over the medium term given relatively high per unit price points (Figure 75). This is likely to prove too conservative over the very long-term as it implies EM whisky price/mix per cap will decline in perpetuity against DMs, which have grown five year per cap price/mix (2007-2012) at 2.1% (Figure 78).
Figure 69: Whisky per cap value (US$) by region Figure 70: Whisky per cap volume by region (litres)
108
53
44
19
10 105
0
20
40
60
80
100
120
Australasia North America
Western Europe
Latin America
Asia Pacific Eastern Europe
Middle East and Africa
1.4
1.2
0.8
0.40.3
0.20.1
0.0
0.2
0.4
0.6
0.8
1.0
1.2
1.4
1.6
North America
Australasia Western Europe
Asia Pacific Latin America
Eastern Europe
Middle East and Africa
Source: Deutsche Bank; Euromonitor; 2012 data Source: Deutsche Bank; Euromonitor; 2012 data
We model per cap revenue growth of 8.3% pa with the risk to our volume forecast (+6.5%) over the medium term likely to the downside and our price/mix forecast (+1.7%) likely to the upside. Irrespective of these opposing risks we are comfortable with our overall medium term revenue model.
Figure 71: Whisky medium term EM per cap revenue growth estimates Per cap volume growth 6.5%
Price/mix 1.7%
Per cap revenue growth 8.3%
Category Rank 3/22
Total EM sales exposure of relevant companies
Diageo 44%
Pernod 40%
Campari 26%Source: Deutsche Bank estimates; whisky exposure of Remy Cointreau in EMs immaterial; Remy’s EM business is driven by Cognac
Figure 68: Global Retail Whisky Market (US$43bn)
13.9
9.18.4
5.7
2.2 1.7 1.5
0
2
4
6
8
10
12
14
Asia Pacific North America
Western Europe
Latin America
Eastern Europe
Middle East and Africa
Australasia
Source: Deutsche Bank; Euromonitor; 2012 data

25 March 2014
Consumer Staples
European Consumer Staples
Deutsche Bank AG/London Page 51
Euromonitor definition The aggregation of single malt scotch whisky, blended scotch whisky, Bourbon/other US whiskey, Canadian whisky, Irish whiskey, Japanese whisky and Other whiskey.
Strong EM per cap growth from low base Per cap consumption in EMs for whisky have grown consistently since 1998 at a CAGR of 6.5% pa (Figure 72) to reach a position where consumption is still only c17% of that per capita in DMs.
Over the period from 1998 per cap consumption in DMs has declined at a CAGR of -0.6% pa but this hides growth of 1.1% CAGR since 2007 (Figure 72 and Figure 76). Therefore, not only is EM growth strong (and consistent) EMs have plenty of growth potential against where DM per cap rates currently sit and DM per cap rates have been improving over the last five years.
Figure 72: Whisky per cap. consumption indexed Figure 73: Whisky EM per cap. consump. rel. to DM
0
10
20
30
40
50
60
70
80
90
100
1998
1999
2000
2001
2002
2003
2004
2005
2006
2007
2008
2009
2010
2011
2012
Developed Market univerese Emerging Market universe
0%
10%
20%
30%
40%
50%
60%
70%
80%
90%
100%
1998
1999
2000
2001
2002
2003
2004
2005
2006
2007
2008
2009
2010
2011
2012
Source: Deutsche Bank; Euromonitor; index takes DM in 1998 as the base at 100 Source: Deutsche Bank; Euromonitor
Price/mix In Figure 74 and Figure 75 we look at whisky EM retail values per unit compared to DMs across our universe and see that EM retail values are high when compared to the Staples peer group; in 2012 they were 66% of DM prices (Figure 75).
On this basis EM volumes appear to be skewed to premium products meaning over time we would expect price/mix to decline as the category matures and becomes more mainstream as a middle class develops in respective EMs.
Figure 78 shows that price/mix in EM whisky has been relatively subdued at 1.7% since 1998, impacted by the 1997/1998 EM crisis which hit price/mix 1998-2002. Since 2002 price/mix has averaged 6.3%, albeit slower in the five years to 2012 than the prior five years.
We assume price/mix of +1.7% in EMs over the medium term implying relative pricing in EMs will fall from the currently relatively high level of 66% of DMs (assuming DM price/mix of +2.1%). This is feasible over the medium term, but over the long term either DM pricing falls, or, more likely +1.7% in EMs is too conservative.

25 March 2014
Consumer Staples
European Consumer Staples
Page 52 Deutsche Bank AG/London
Figure 74: Whisky retail value per unit (indexed) Figure 75: Whisky EM retail value per unit vs DM (US$)
0
20
40
60
80
100
120
140
160
180
1998
1999
2000
2001
2002
2003
2004
2005
2006
2007
2008
2009
2010
2011
2012
Developed Market univerese Emerging Market universe
0%
10%
20%
30%
40%
50%
60%
70%
80%
90%
100%
1998
1999
2000
2001
2002
2003
2004
2005
2006
2007
2008
2009
2010
2011
2012
Source: Deutsche Bank; Euromonitor; index takes DM in 1998 as the base at 100 Source: Deutsche Bank; Euromonitor
Figure 76: Whisky per cap volume Figure 77: Whisky per cap value (US$)
-1.0%-1.9%
1.1%
-0.4% -0.6%
2.8%
9.6%
6.4%
8.0%
6.5%
-4%
-2%
0%
2%
4%
6%
8%
10%
12%
1998-2002 2002 -07 2007-12 2002-12 1998-2012
Developed Market universe Emerging Market universe
-2.1%
5.7%
3.2%4.5%
2.5%
-2.9%
16.5%
9.8%
13.1%
8.3%
-5%
0%
5%
10%
15%
20%
1998-2002 2002 -07 2007-12 2002-12 1998-2012
Developed Market universe Emerging Market universe
Source: Deutsche Bank; Euromonitor Source: Deutsche Bank; Euromonitor
Figure 78: Whisky price/mix (US$)
-1.2%
7.7%
2.1%
4.9%
3.1%
-5.6%
6.3%
3.1%
4.7%
1.7%
-8%
-6%
-4%
-2%
0%
2%
4%
6%
8%
10%
1998-2002 2002 -07 2007-12 2002-12 1998-2012
Developed Market universe Emerging Market universe
Source: Deutsche Bank; Euromonitor

25 March 2014
Consumer Staples
European Consumer Staples
Deutsche Bank AG/London Page 53
Beverages: Vodka
Conclusions We have broken EM vodka down between EM’s per our universe and ex Russia, Poland and Ukraine given the preponderance of relatively low priced product in those markets.
All our comments re EMs are ex Russia, Poland and Ukraine: in a number of the accompanying charts we show EMs including and excluding these countries. The quoted companies’ exposure to these three markets is immaterial to our conclusions.
We believe Vodka volumes have the potential to grow significantly over the medium to long-term: the ongoing growth of vodka in DMs suggesting high consumer acceptance of the category; steady growth in EMs; still very low penetration of EMs.
Discounting Eastern Europe, we see that the category, in terms of per caps, is dominated by North America with Europe c30% of North American levels. LatAm, Asia-Pacific and Middle East & Africa hardly registering supports the long-term potential of the category.
Ex Russia, Ukraine and Poland EM per cap volumes have grown 3.5% pa since 1998. However, unlike most categories the rate of growth is accelerating. For the period 2002-07 volumes increased 2.4%; for 2007-2012 they grew 7.6%. Ex Russia, Poland and Ukraine EM per cap volumes relative to DMs are only 8%; the volume growth potential in EMs for vodka is extremely high. Rather than extend the volume trajectory 2002-2012 even further we have assumed EM per cap volume growth in vodka of 7% (below that seen 2007-2012).
Figure 80: Vodka per cap value (US$) by region Figure 81: Vodka per cap volume by region (litres)
69
56
35
29
62 2
0
10
20
30
40
50
60
70
80
Eastern Europe
North America
Australasia Western Europe
Latin America
Middle East and Africa
Asia Pacific
6.6
1.9
0.6 0.50.2 0.1 0.0
0.0
1.0
2.0
3.0
4.0
5.0
6.0
7.0
Eastern Europe
North America
Western Europe
Australasia Latin America
Asia Pacific Middle East and Africa
Source: Deutsche Bank Euromonitor; 2012 data; Eastern Europe includes Russia, Poland and Ukraine Source: Deutsche Bank Euromonitor; 2012 data; Eastern Europe includes Russia, Poland and Ukraine
That said, pricing in EMs for vodka (ex Russia, Poland and Ukraine) is very high compared to DMs (94%) and we have assumed price/mix only increases 1.0% pa from current levels: below both the US$ average seen since 1998 in DMs (1.4%) and in EMs (2.1%, see Figure 89) implying high relative pricing will decline slowly from current levels.
Figure 79: Global Retail Vodka Market (US$43bn)
19.8
8.8
4.8
2.7
0.9 0.5 0.40
2
4
6
8
10
12
14
16
18
20
Eastern Europe
North America
Western Europe
Asia Pacific Latin America
Middle East and Africa
Australasia
Source: Deutsche Bank; Euromonitor; 2012 data

25 March 2014
Consumer Staples
European Consumer Staples
Page 54 Deutsche Bank AG/London
Risk to our medium term volume forecast is likely to the upside (despite 7% being high) and our medium term price/mix to the downside despite +1% (even in US$ terms) being low. Ultimately the risk to our price/mix is to the upside as DMs are expected to grow slightly faster (+1.4%) implying M price/mix will decline in perpetuity to DMs.
Figure 82: Vodka medium term EM per cap revenue growth estimates Per cap volume growth 7.0%
Price/mix 1.0%
Per cap revenue growth 8.1%
Category Rank 5/22
Total EM sales exposure of relevant companies
Diageo 44%
Pernod 40%
Campari 26%Source: Deutsche Bank estimates; Remy Cointreau’s EM business is driven by Cognac; all assumption ex Russia, Poland & Ukraine
Euromonitor definition Vodka is an alcoholic drink made from distilling grain (most commonly rye or wheat).
An emerging EM category Ex Russia, Poland and Ukraine, per cap consumption in EMs is very low: across our universe it is only 8% of that in DMs. Per cap consumption has increased at an average rate of 3.5% in EMs ex Russia, Poland and Ukraine. Consumption in DMs on a per cap basis has climbed at a rate of 4.9% pa over the period providing support to the view of vodka being a relatively strong category where significant penetration of EMs could be a function of low current levels; high recent growth in EMs, and ongoing growth in DMs.
We see little risk to vodka replicating its characteristics in Russia, Poland and Ukraine given the lack of history of the category in EMs and the potential for the multi-national spirits companies to dictate the development of the category.
Figure 83: Vodka per cap. consumption indexed Figure 84: Vodka EM per cap. consump. rel. to DM
0
50
100
150
200
250
300
350
1998
1999
2000
2001
2002
2003
2004
2005
2006
2007
2008
2009
2010
2011
2012
DM universe EM universe EM universe (ex Russia, Ukraine and Poland)
0%
50%
100%
150%
200%
250%
300%
350%
1998
1999
2000
2001
2002
2003
2004
2005
2006
2007
2008
2009
2010
2011
2012
EM universe relative to DM EM universe (ex Russia, Ukraine and Poland) relative to DM
Source: Deutsche Bank Euromonitor; index takes DM in 1998 as the base at 100 Source: Deutsche Bank; Euromonitor

25 March 2014
Consumer Staples
European Consumer Staples
Deutsche Bank AG/London Page 55
Price/mix In Figure 85 and Figure 86 we look at vodka retail values where the picture is similar to whisky. Ex Russia, Poland and Ukraine, retail values are high: 90% of those in DMs implying the majority of product sold in EMs (ex Russia, Poland and Ukraine) is premium. While we see strong volume growth potential in EMs we recognise that the price points could be below current levels.
Figure 85: Vodka retail value per unit (indexed) Figure 86: Vodka EM retail value per unit vs DM (US$)
0
20
40
60
80
100
120
140
1998
1999
2000
2001
2002
2003
2004
2005
2006
2007
2008
2009
2010
2011
2012
DM universe EM universe EM universe (ex Russia, Ukraine and Poland)
0%
10%
20%
30%
40%
50%
60%
70%
80%
90%
100%
1998
1999
2000
2001
2002
2003
2004
2005
2006
2007
2008
2009
2010
2011
2012
EM universe relative to DM EM universe (ex Russia, Ukraine and Poland) relative to DM
Source: Deutsche Bank; Euromonitor; index takes DM in 1998 as the base at 100 Source: Deutsche Bank; Euromonitor
Figure 87: Vodka retail volume per capita Figure 88: Vodka per cap value (US$)
3.5%
7.3%
3.8%
5.5%4.9%
-1.4%
3.8%
-2.5%
0.6% 0.0%
0.0%
2.4%
7.6%
5.0%
3.5%
-4%
-2%
0%
2%
4%
6%
8%
10%
1998-2002 2002 -07 2007-12 2002-12 1998-2012
DM universe EM universe EM universe (ex Russia, Ukraine and Poland)
3.2%
12.6%
3.0%
7.7%
6.4%
-8.6%
13.2%
1.8%
7.4%2.5%
-5.5%
9.8%11.4%
10.6%
5.7%
-10%
-5%
0%
5%
10%
15%
1998-2002 2002 -07 2007-12 2002-12 1998-2012
DM universe EM universe EM universe (ex Russia, Ukraine and Poland)
Source: Deutsche Bank; Euromonitor Source: Deutsche Bank; Euromonitor
Figure 89 shows price/mix in our EM universe has been relatively pedestrian at 2.1% 1998-2012 against 1.4% in DMs; in line with our overall thesis that perceived pricing in EMs is eroded by currency devaluations (note the performance over the period 1998-2002). In addition, as Figure 86 shows, ex Russia, Poland and Ukraine, vodka is priced close to parity with DM pricing (and has been throughout the period since 1998): from this starting point we would not expect vodka pricing to out-strip DM pricing in US$ terms over the long term.
The critical aspect of our analysis of vodka is outlined in Figure 83 and Figure 86: per cap consumption ex Russia, Poland and Ukraine is only 8% of DM’s and DM per caps have been rising steadily suggesting significant volume growth potential in vodka, albeit with pricing likely to be subdued.

25 March 2014
Consumer Staples
European Consumer Staples
Page 56 Deutsche Bank AG/London
Cognac/Champagne We had considered modelling other categories such as Cognac and Champagne.
Cognac is perhaps an obvious category to review but it is dominated in EMs by China and the issues facing the category in China have been well documented. In addition, the current data we have available is restricted to 2012, before the recent issues emerged.
As regards champagne, it is a small category in EMs and too small within each of the companies we follow EM businesses to be an important variable.
Figure 89: Vodka price/mix (US$)
-0.3%
5.0%
-0.8%
2.1%1.4%
-7.3%
9.0%
4.4%
6.7%
2.5%
-5.5%
7.2%
3.5%
5.3%
2.1%
-10%
-8%
-6%
-4%
-2%
0%
2%
4%
6%
8%
10%
1998-2002 2002 -07 2007-12 2002-12 1998-2012
DM universe EM universe EM universe ex Russia, Ukraine and Poland
Source: Deutsche Bank; Euromonitor
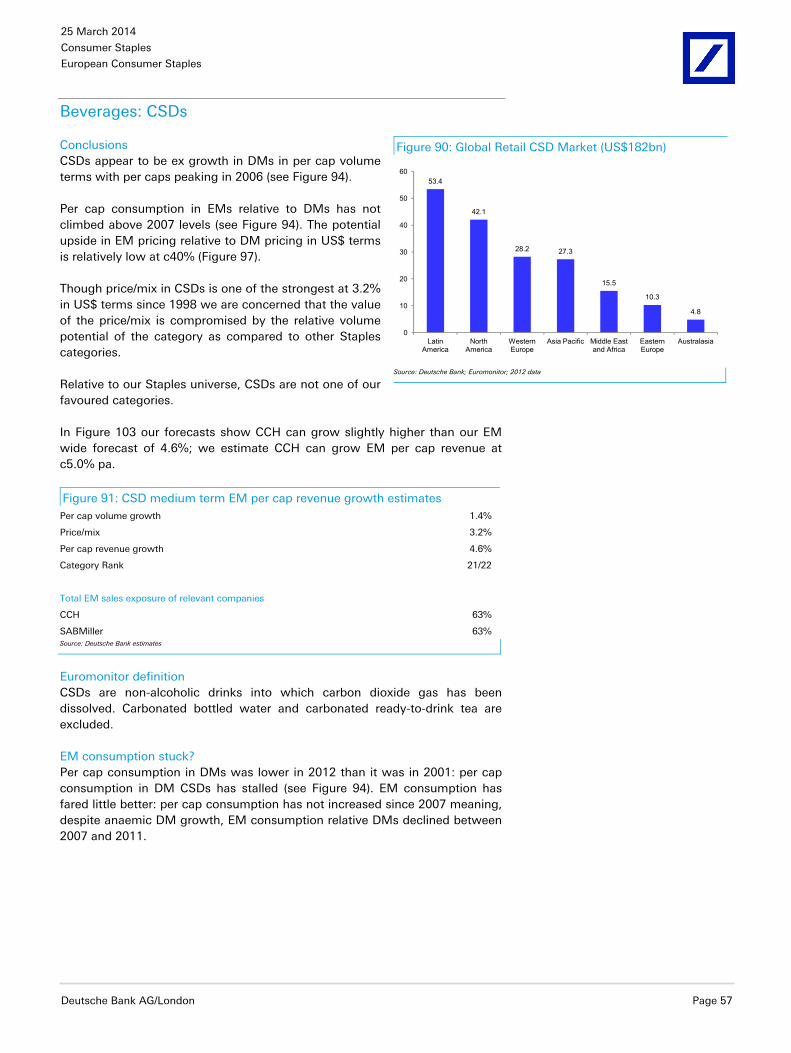
25 March 2014
Consumer Staples
European Consumer Staples
Deutsche Bank AG/London Page 57
Beverages: CSDs
Conclusions CSDs appear to be ex growth in DMs in per cap volume terms with per caps peaking in 2006 (see Figure 94).
Per cap consumption in EMs relative to DMs has not climbed above 2007 levels (see Figure 94). The potential upside in EM pricing relative to DM pricing in US$ terms is relatively low at c40% (Figure 97).
Though price/mix in CSDs is one of the strongest at 3.2% in US$ terms since 1998 we are concerned that the value of the price/mix is compromised by the relative volume potential of the category as compared to other Staples categories.
Relative to our Staples universe, CSDs are not one of our favoured categories.
In Figure 103 our forecasts show CCH can grow slightly higher than our EM wide forecast of 4.6%; we estimate CCH can grow EM per cap revenue at c5.0% pa.
Figure 91: CSD medium term EM per cap revenue growth estimates Per cap volume growth 1.4%
Price/mix 3.2%
Per cap revenue growth 4.6%
Category Rank 21/22
Total EM sales exposure of relevant companies
CCH 63%
SABMiller 63%Source: Deutsche Bank estimates
Euromonitor definition CSDs are non-alcoholic drinks into which carbon dioxide gas has been dissolved. Carbonated bottled water and carbonated ready-to-drink tea are excluded.
EM consumption stuck? Per cap consumption in DMs was lower in 2012 than it was in 2001: per cap consumption in DM CSDs has stalled (see Figure 94). EM consumption has fared little better: per cap consumption has not increased since 2007 meaning, despite anaemic DM growth, EM consumption relative DMs declined between 2007 and 2011.
Figure 90: Global Retail CSD Market (US$182bn)
53.4
42.1
28.2 27.3
15.5
10.3
4.8
0
10
20
30
40
50
60
Latin America
North America
Western Europe
Asia Pacific Middle East and Africa
Eastern Europe
Australasia
Source: Deutsche Bank; Euromonitor; 2012 data

25 March 2014
Consumer Staples
European Consumer Staples
Page 58 Deutsche Bank AG/London
Figure 92: CSD per cap value (US$) by region Figure 93: CSD per cap volume by region
265
223
150140
46
20 13
0
50
100
150
200
250
300
Australasia North America
Latin America
Western Europe
Eastern Europe
Middle East and Africa
Asia Pacific
157
94 93
67
40
178
0
20
40
60
80
100
120
140
160
180
North America
Australasia Latin America
Western Europe
Eastern Europe
Middle East and Africa
Asia Pacific
Source: Deutsche Bank; Euromonitor 2012 data Source: Deutsche Bank; Euromonitor 2012 data
Figure 94: CSDs per cap consumption indexed Figure 95: CSDs EM per cap consump. rel. to DM
0
10
20
30
40
50
60
70
80
90
100
110
1998
1999
2000
2001
2002
2003
2004
2005
2006
2007
2008
2009
2010
2011
2012
Developed Market univerese Emerging Market universe
0%
10%
20%
30%
40%
50%
60%
70%
80%
90%
100%
1998
1999
2000
2001
2002
2003
2004
2005
2006
2007
2008
2009
2010
2011
2012
Source: Deutsche Bank; Euromonitor; index takes DM in 1998 as the base at 100 Source: Deutsche Bank; Euromonitor
Figure 96: CSDs retail value per unit (indexed) Figure 97: CSDs EM retail value per unit vs DM (US$)
0
20
40
60
80
100
120
140
160
1998
1999
2000
2001
2002
2003
2004
2005
2006
2007
2008
2009
2010
2011
2012
Developed Market univerese Emerging Market universe
0%
10%
20%
30%
40%
50%
60%
70%
80%
90%
100%
1998
1999
2000
2001
2002
2003
2004
2005
2006
2007
2008
2009
2010
2011
2012
Source: Deutsche Bank; Euromonitor; index takes DM in 1998 as the base at 100 Source: Deutsche Bank; Euromonitor

25 March 2014
Consumer Staples
European Consumer Staples
Deutsche Bank AG/London Page 59
Figure 98: CSDs volume growth per cap. Figure 99: CSDs value per cap. (US$)
0.9%
0.1%
-0.3%-0.1%
0.2%0.3%
3.9%
0.0%
1.9%
1.4%
-1%
0%
1%
2%
3%
4%
5%
1998-2002 2002 -07 2007-12 2002-12 1998-2012
Developed Market universe Emerging Market universe
-0.6%
6.4%
1.4%
3.9%2.6%
-3.4%
10.9%
5.4%
8.1%
4.7%
-6%
-4%
-2%
0%
2%
4%
6%
8%
10%
12%
1998-2002 2002 -07 2007-12 2002-12 1998-2012
Developed Market universe Emerging Market universe
Source: Deutsche Bank; Euromonitor Source: Deutsche Bank; Euromonitor
Price/mix Current EM pricing suggests potential upside relative to DMs with EM prices in US$ terms c40% lower than DMs (see Figure 97). However, this upside is bettered by many of the categories we have reviewed and needs to be considered against the strength of the category in the context of low DM and EM volume growth
We can see from Figure 98 that volume growth per capita over the period 1998-2012 in EMs has been 1.4%. However, all this growth was seen 2002-2007 as EMs ‘bounced’ post the 1997/8 crisis. Since 2007 per cap consumption has been static: relative to other categories the growth profile of CSDs is relatively weak.
As with all the categories we have reviewed unless we see a significant reason not to, we assume pricing will be as per the average 1998-2012. Accordingly we assume +3.2% but suspect the risk to this number is to the downside.
Price/mix 2007-2012 has been 5.4% but we see from Figure 101 that it has been erratic, ranging from +3.9% in 2012 to +1.3% in 2012, which we consider a negative factor.
Figure 101: EM CSD price/mix (US$) 2007 2008 2009 2010 2011 2012
Price/Mix 11.3% 10.4% -6.1% 13.9% 8.9% 1.3%Source: Deutsche Bank; Euromonitor
CCH geography Figure 102 shows CCH’s EM markets are dominated by Eastern Europe and Nigeria.
Figure 103 shows CCH’s weighted per cap exposure relative to DMs in 2012 showing the weightings of Russia, Poland, Nigeria and Eastern Europe with their respective per caps relative to DMs.
We see that if we weight CCH’s business current CCH indexed per caps are in line with our EM average of DMs (47 vs. 45).
Figure 100: CSDs price/mix (US$)
-1.5%
6.2%
1.7%
4.0%
2.4%
-3.7%
6.8%
5.4%6.1%
3.2%
-6.0%
-4.0%
-2.0%
0.0%
2.0%
4.0%
6.0%
8.0%
1998-2002 2002 -07 2007-12 2002-12 1998-2012
Developed Market univerese Emerging Market universe
Source: Deutsche Bank; Euromonitor

25 March 2014
Consumer Staples
European Consumer Staples
Page 60 Deutsche Bank AG/London
Given the higher growth potential of Nigeria and, less so Russia, we believe CCH can grow EM per cap revenue slightly faster than our EM wide forecast of 4.6% pa: we estimate c5.0% pa.
We should note that DMs are dominated by North America where per caps are 2.5x those of Western Europe and LatAm is higher than Western Europe (see Figure 93). Taking Western Europe as our benchmark, Russia, Poland and Nigeria would benchmark slightly higher than we have shown in Figure 103.
Figure 103: CCH per cap volume (indexed) 1998 2012 CCH weight
DM 100 103
EM 38 45
CCH weighted 47
Russia 26 36 28%
Poland 45 68 11%
Eastern Europe 20 58 47%
Nigeria 9 12 14%Source: Deutsche Bank estimates; Euromonitor; index takes DMs in 1998 as the base
Figure 102: CCH Emerging Market Sales 2013
Russia28%
Nigeria14%
Poland11%
Romania11%
Serbia6%
Ukraine6%
Hungary5%
Bulgaria4%
Czech Republic4%
Belarus3%
Croatia2%
Lithuania, Latvia, Estonia
2%
Others4%
Source: Deutsche Bank estimates; company data; sales to December 2013

25 March 2014
Consumer Staples
European Consumer Staples
Deutsche Bank AG/London Page 61
Beverages/Food: Bottled Water
Conclusions (ex China and India) Bottled water has delivered strong volume growth but the value of that growth has been undermined by very low per unit revenue growth. In addition, the rate of volume growth is slowing.
Bottled water pricing has likely been undermined by poor mix trends as the category matures, as consumers have increasingly seen the product as a commodity, and local players undermine pricing initiatives.
Despite its strong volume growth, bottled water is not one of our favoured categories on a population un-weighted basis because of relatively weak price/mix.
That said, for this category we do need a separate analysis of India and China.
Figure 105: Bottled Water medium term EM per cap revenue growth Per cap volume growth 4.5%
Price/mix 0.6%
Per cap revenue growth 5.1%
Category Rank 20/22
Total EM sales exposure of relevant companies
CCH 63%
Danone 56%
Nestle 44%Source: Deutsche Bank estimates; China and India included on an unweighted basis
India & China: a caveat for Nestle and Danone Both Nestle and Danone have exposure to the Chinese and Indian bottled water market though China is considerably bigger for both.
In Figure 106 we show relative per cap consumption in DMs, China and India. Since 1998 DMs have compounded at 3.0%, with 1.2% in the last five years. China has compounded at 13.9% with 12.0% in the last five years. For the same periods India is compounding at 23.4% and 23.0%.
We have argued, given the breadth of our consumer universe, weighting categories by population will give rise to conclusions that bear no relation to the geographic make-up of our universe of companies: their businesses are not skewed in the same way populations are.
We should recognise that bottled water is one of the categories that has disproportionate growth in these two critical markets.
Figure 104: Global Retail Bottled Water Mkt. (US$103bn)
29
2120
16
9 8
1
0
5
10
15
20
25
30
Asia Pacific Western Europe
North America
Latin America
Middle East and Africa
Eastern Europe
Australasia
Source: Deutsche Bank; Euromonitor; 2012 data

25 March 2014
Consumer Staples
European Consumer Staples
Page 62 Deutsche Bank AG/London
For these markets, per cap trends are very positive. Figure 107 shows that over the last 14 years price/mix in US$ terms in China and India has been better than the 1.2% in our DM universe though still only 1.7% and 2.3% respectively. Though this is low, it is insufficient to undermine our positive view of Chinese and Indian bottled water.
Adding 2% points of growth to Nestle and Danone because of their China and India exposure to the category does not appear unreasonable. Given their geographic exposure we consider bottled water a positive category for Nestle and Danone. Adding 2% point to our per caps assumptions lifts bottled water comfortably into the top ten of categories we have reviewed.
Figure 107: Bottled Water price/mix (US$) 1998-2002 2002-2007 2007-2012 2002-2012 1998-2012
DMs -2.3% 4.9% 0.5% 2.7% 1.2%
China -4.2% 0.9% 7.5% 4.1% 1.7%
India 2.2% 6.3% -1.6% 2.3% 2.3%Source: Deutsche Bank estimates; Euromonitor
Figure 108: Bottled Water per cap value (US$) by region Figure 109: Bottled Water per cap volume by region
(litres)
115107
60
4232
10 10
0
20
40
60
80
100
120
140
North America
Western Europe
Australasia Latin America
Eastern Europe
Middle East and Africa
Asia Pacific
115106
71
49
3226
19
0
20
40
60
80
100
120
140
Western Europe
North America
Latin America
Eastern Europe
Middle East and Africa
Australasia Asia Pacific
Source: Deutsche Bank; Euromonitor; 2012 data Source: Deutsche Bank; Euromonitor; 2012 data
Euromonitor definition Bottled water includes sparkling water, spring water and purified/table water.
Figure 106: Bottled water per cap consumption (indexed)
0
20
40
60
80
100
120
140
160
1998
1999
2000
2001
2002
2003
2004
2005
2006
2007
2008
2009
2010
2011
2012
DM China India
Source: Deutsche Bank; Euromonitor index takes DM in 1998 as the base at 100

25 March 2014
Consumer Staples
European Consumer Staples
Deutsche Bank AG/London Page 63
Strong EM per cap growth... but rate slowing Since 1998 per cap consumption has increased 7.2% pa in EMs. This growth has been complemented by relatively strong growth in DM per cap consumption at 3% pa. EM per cap consumption has grown from c30% of that of DMs to be now at c55% (across our universe, see Figure 112).
However, as Figure 110 shows, the rate of growth of DM per cap consumption has slowed steadily since 2003.
From 2008 the rate of growth has been below the average. 2012’s rate of growth was relatively low at +4.2%. 2009 was lower at 3.4% but that followed prior year growth of 6.5% to give a two-year average of 5%. 2012’s 4.2% was preceded by 4.7% to give a two-year average of 4.4%.
Figure 111: Bottled Water per cap consumption indexed Figure 112: Bottled Wat. EM per cap consump. rel. to
DM
0
20
40
60
80
100
120
140
160
1998
1999
2000
2001
2002
2003
2004
2005
2006
2007
2008
2009
2010
2011
2012
0%
10%
20%
30%
40%
50%
60%
70%
80%
90%
100%19
98
1999
2000
2001
2002
2003
2004
2005
2006
2007
2008
2009
2010
2011
2012
Source: Deutsche Bank; Euromonitor index takes DM in 1998 as the base at 100 Source: Deutsche Bank; Euromonitor
Price/mix In addition, though DM per cap growth over the period from 1998 has been relatively strong at 3.0%, that rate of price/mix growth has slowed to, with four years since 2008 only growing at a CAGR of 1.2% and no year since 2008 growing at or above the 3.0% CAGR rate we have seen since 1998.
While the performance of per cap consumption in DMs and EMs has been encouraging (albeit the rate of growth slowing) the revenue per unit has been less so as shown in Figure 113.
Since 1998 DM price/mix values have only increased at a US$ CAGR of 1.2% and DMs at a CAGR of 0.6%.
Figure 110: Bottled Water EM per cap volume growth
0%
2%
4%
6%
8%
10%
12%
14%
1999
2000
2001
2002
2003
2004
2005
2006
2007
2008
2009
2010
2011
2012
CA
GR
Source: Deutsche Bank; Euromonitor
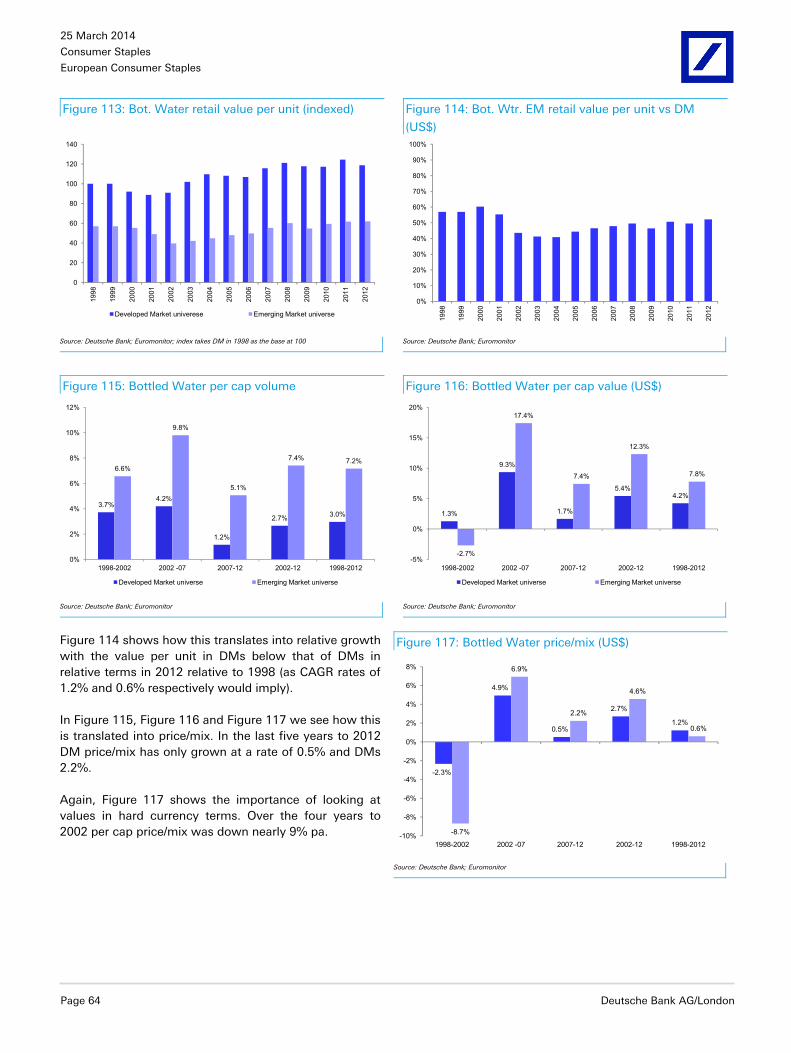
25 March 2014
Consumer Staples
European Consumer Staples
Page 64 Deutsche Bank AG/London
Figure 113: Bot. Water retail value per unit (indexed) Figure 114: Bot. Wtr. EM retail value per unit vs DM
(US$)
0
20
40
60
80
100
120
140
1998
1999
2000
2001
2002
2003
2004
2005
2006
2007
2008
2009
2010
2011
2012
Developed Market univerese Emerging Market universe
0%
10%
20%
30%
40%
50%
60%
70%
80%
90%
100%
1998
1999
2000
2001
2002
2003
2004
2005
2006
2007
2008
2009
2010
2011
2012
Source: Deutsche Bank; Euromonitor; index takes DM in 1998 as the base at 100 Source: Deutsche Bank; Euromonitor
Figure 115: Bottled Water per cap volume Figure 116: Bottled Water per cap value (US$)
3.7%4.2%
1.2%
2.7% 3.0%
6.6%
9.8%
5.1%
7.4% 7.2%
0%
2%
4%
6%
8%
10%
12%
1998-2002 2002 -07 2007-12 2002-12 1998-2012
Developed Market universe Emerging Market universe
1.3%
9.3%
1.7%
5.4%4.2%
-2.7%
17.4%
7.4%
12.3%
7.8%
-5%
0%
5%
10%
15%
20%
1998-2002 2002 -07 2007-12 2002-12 1998-2012
Developed Market universe Emerging Market universe
Source: Deutsche Bank; Euromonitor Source: Deutsche Bank; Euromonitor
Figure 114 shows how this translates into relative growth with the value per unit in DMs below that of DMs in relative terms in 2012 relative to 1998 (as CAGR rates of 1.2% and 0.6% respectively would imply).
In Figure 115, Figure 116 and Figure 117 we see how this is translated into price/mix. In the last five years to 2012 DM price/mix has only grown at a rate of 0.5% and DMs 2.2%.
Again, Figure 117 shows the importance of looking at values in hard currency terms. Over the four years to 2002 per cap price/mix was down nearly 9% pa.
Figure 117: Bottled Water price/mix (US$)
-2.3%
4.9%
0.5%
2.7%
1.2%
-8.7%
6.9%
2.2%
4.6%
0.6%
-10%
-8%
-6%
-4%
-2%
0%
2%
4%
6%
8%
1998-2002 2002 -07 2007-12 2002-12 1998-2012
Source: Deutsche Bank; Euromonitor

25 March 2014
Consumer Staples
European Consumer Staples
Deutsche Bank AG/London Page 65
Food
To state the obvious Food is a huge category. For the countries listed in Figure 118 the aggregate food market is US$4.22trn as at 2011.
To provide a comparison: for the same list of countries expenditure on non-alcoholic beverages totalled to $372bn in 2011: the global food market is over 11x the size of the global non-alcoholic beverages market.
Food: Packaged Food (Pack. Food)
Conclusions We provide data on this large aggregated category to provide a sense of the long-term prognosis of the global food category alongside more homogenous categories like beer and tobacco, though we note the difficulties of providing a consistent volume measure (Euromonitor uses kilograms).
Given the breadth of this category, its high maturity in DMs and it perhaps best described as being the ‘staple staple’ the data shows what we would intuitively expect: stability in DM per caps and steady (but unspectacular) growth in EM per caps.
Price/mix in EMs in US$ terms has been consistently strong since 2004, compounding at 7.3% as EM currencies have appreciated. Given the current economic turbulence in EMs the growth rate from 2004 appears to be unsustainable, at least in the immediate future.
Over the five years to 2012 price/mix in EMs was 4.6%. Incorporating the impact of EM currency weakness in the late 1990’s/early 2000’s our analysis shows price/mix of 3.7% over the longer term. Noting its breadth (and the complications that generates) we suspect 3.7% over an extended period, in US$ terms, is likely to prove a very strong result: the risk is likely to be to the downside.
Figure 120: Pack. Food medium term EM per cap revenue growth estimates Per cap volume growth 1.4%
Price/mix 3.7%
Per cap revenue growth 5.2%
Category Rank 19/22
Total EM sales exposure of relevant companies
Unilever 57%
Danone 56%
Nestle 44%Source: Deutsche Bank estimates; Applicability of category in order of relevance to EM business 1) Nestle; 2) Unilever; 3) Danone
Figure 118: Consumer Exp. on Food 2011 US$4220bn
0
100
200
300
400
500
600
700
USA
Chi
na
Japa
nIn
dia
Rus
sia
Ger
m.
Bra
zil
Fran
ceIta
ly
Mex
ico
Indo
n. UK
Spai
n
Turk
eyC
anad
aA
ustra
liaS
. Kor
ea
Pol
and
Phi
lip'n
sTh
aila
nd
Arg.
S. A
frica
Net
her's
Belg
ium
Sw
eden
Source: Deutsche Bank; World Consumer Income and Expenditure Patterns 2013; Euromonitor (US$bn, at current prices). Data is for private consumers
Figure 119: Global Packaged Food Market (US$2212bn)
590 572
402
288
187
129
45
0
100
200
300
400
500
600
Western Europe
Asia Pacific North America
Latin America
Eastern Europe
Middle East and Africa
Australasia
Source: Deutsche Bank; Euromonitor; 2012 data

25 March 2014
Consumer Staples
European Consumer Staples
Page 66 Deutsche Bank AG/London
Figure 121: Pack. Food per cap value (US$) by region Figure 122: Pack. Food per cap volume by region (kg)
1655
12071152
567480
145 100
0
200
400
600
800
1000
1200
1400
1600
1800
Australasia Western Europe
North America
Eastern Europe
Latin America
Asia Pacific Middle East and Africa
251 242
207
158146
5440
0
50
100
150
200
250
300
Western Europe
Australasia North America
Eastern Europe
Latin America
Middle East and Africa
Asia Pacific
Source: Deutsche Bank; Euromonitor; 2012 data Source: Deutsche Bank; Euromonitor; 2012 data
Euromonitor definition Packaged food includes retail and foodservice and encompasses the aggregation of Baby Food, Bakery, Canned/Preserved Food, Chilled Processed Food, Confectionery, Dairy, Dried Processed Food, Frozen Processed Food, Ice cream, Meal replacement, Noodles, Oils and fats, Pasta, Ready Meals, 'Sauces, Dressings and Condiments', Snack Bars, Soup, Spreads, and Sweet and Savoury Snacks.
In subsequent sections we look at a selection of these categories individually.
Stable DM per caps; modestly increasing EM Per cap consumption in DMs has been very stable, as would be expected with stable populations and a highly mature category.
Growth in per cap consumption in EMs has, similarly, been very uniform growing at a compound rate of 1.3% with fluctuations around this average relatively minor: the lowest growth rate over the period 1998-2012 was 0.3% in 2009, the highest 2.6% in 2004. The last three years (2010-2012) have seen growth rates of 1.4%, 1.3% and 1.4% respectively.
Driven by the differential in growth rates (DMs stable, EMs growing) the per cap consumption in DMs relative to EMs has climbed from c31% in 1998 to just over 38% in 2012.
Given the ‘highly staple’ nature of this category, its breadth, we expect to see little change to these trends over the medium to long-term: per cap consumption trends in EMs relative to DMs, are very stable (see Figure 121).

25 March 2014
Consumer Staples
European Consumer Staples
Deutsche Bank AG/London Page 67
Figure 123: Pack. Food per cap consumption indexed Figure 124: Pack. Food per cap consumption indexed
0
20
40
60
80
100
120
1998
1999
2000
2001
2002
2003
2004
2005
2006
2007
2008
2009
2010
2011
2012
Developed Market universe Emerging Market universe
0%
10%
20%
30%
40%
50%
60%
70%
80%
90%
100%
1998
1999
2000
2001
2002
2003
2004
2005
2006
2007
2008
2009
2010
2011
2012
Source: Deutsche Bank; Euromonitor; index takes DM in 1998 as the base at 100 Source: Deutsche Bank; Euromonitor
Price/mix Price/mix over the period has been 3.7% pa in US$ terms in EMs and 3.1% in DMs (see Figure 129). As with the majority of categories per unit prices declined (in US$ terms) 1998-2002 post the 1997/8 EM crisis but have since recovered.
There has been some volatility in price per unit across this large aggregated category such that price per unit in EMs relative to DMs has ranged from 47% (2012) to 35% (2004).
Figure 125: Pack. Food value per unit (indexed) Figure 126: Pack. Food EM value per unit vs DM (US$)
0
20
40
60
80
100
120
140
160
180
1998
1999
2000
2001
2002
2003
2004
2005
2006
2007
2008
2009
2010
2011
2012
Developed Market universe Emerging Market universe
0%
10%
20%
30%
40%
50%
60%
70%
80%
90%
100%
1998
1999
2000
2001
2002
2003
2004
2005
2006
2007
2008
2009
2010
2011
2012
Source: Deutsche Bank; Euromonitor; index takes DM in 1998 as the base at 100 Source: Deutsche Bank; Euromonitor
Figure 127, Figure 128 and Figure 129 break down our analysis of packaged food into volume, value and price/mix over various time periods.
Again, post the EM crisis of 1997/8, price/mix in US$ terms was negative (Figure 129), as it was in DMs. Stable volumes in DMs and 1.1% growth in EM volumes over the 1998-2002 period (Figure 127) was insufficient to drive higher per cap value levels (Figure 128).

25 March 2014
Consumer Staples
European Consumer Staples
Page 68 Deutsche Bank AG/London
Figure 127: Pack. Food per cap volume growth Figure 128: Pack. Food per cap value growth (US$)
-0.1%
0.0%
-0.2% -0.1% -0.1%
1.1%
1.9%
1.0%
1.4%1.3%
-0.5%
0.0%
0.5%
1.0%
1.5%
2.0%
2.5%
1998-2002 2002 -07 2007-12 2002-12 1998-2012
Developed Market universe Emerging Market universe
-1.1%
6.8%
2.6%
4.7%
3.0%
-3.5%
12.1%
5.6%
8.8%
5.1%
-6%
-4%
-2%
0%
2%
4%
6%
8%
10%
12%
14%
1998-2002 2002 -07 2007-12 2002-12 1998-2012
Developed Market universe Emerging Market universe
Source: Deutsche Bank; Euromonitor Source: Deutsche Bank; Euromonitor
As Figure 128 shows there was a strong rebound in per cap value growth 2002-2007, driven by the recovery in price/mix (Figure 129), not volumes (Figure 127), the growth of which only increased 80bps 2002-2007 vs 1998-2002 against pricing showing a turn in price/mix of 1460bps. Not surprisingly this price/mix trend proved unsustainable price/mix declined to 4.6% 2007-2012 from 10.0% in EMs.
Average price/mix in US$ terms over an extended period in EMs through a cycle of 14 years (covering bouts of EM currency appreciation and depreciation) as per Figure 129 of 3.7% appears relatively high, though we note relative pricing against DMs is not excessive (Figure 126). We model 3.7% but believe the risk is to the downside
Figure 129: Pack. Food retail price/mix (US$)
-1.0%
6.8%
2.7%
4.8%
3.1%
-4.6%
10.0%
4.6%
7.3%
3.7%
-6%
-4%
-2%
0%
2%
4%
6%
8%
10%
12%
1998-2002 2002 -07 2007-12 2002-12 1998-2012
Developed Market universe Emerging Market universe
Source: Deutsche Bank; Euromonitor

25 March 2014
Consumer Staples
European Consumer Staples
Deutsche Bank AG/London Page 69
Food: Dairy
Conclusions Here we look at dairy in aggregate. In the next section we look at yoghurt and sour milk products in isolation, which generate higher growth conclusions and are relevant to Danone and Nestle.
Dairy has been a strong category in EMs with per cap consumption rising steadily. In 1998 it was c20% of that in DMs; by 2012 that had climbed to 29% with every year seeing an increase, one of the few categories to show such a consistent trend.
Pricing is relatively high in EMs at c70% of that in DMs. Over the fourteen years to 2012 price mix has been 3.2% against 3.5% in DMs.
Despite being a relatively strong category, dairy was unable to withstand the impact of the 1997/8 EM crisis. Over the four years 1998-2002 EM per cap volumes increased 2.5% pa (Figure 138) but per cap values in US$ terms declined 3.7% with price/mix declining 6.1%.
In Figure 131 we outline our medium term growth forecasts. Given low per cap consumption we believe EM per caps can continue to grow at c2.4% pa (ahead of the last five years and in line with the fourteen year average). For price/mix we have assumed 3.2%, in line with the fourteen year average. In total we drive per cap revenue growth in dairy over the medium term of 5.5%.
Figure 131: Dairy medium term EM per cap revenue growth estimates Per cap volume growth 2.4%
Price/mix 3.2%
Per cap revenue growth 5.5%
Category Rank 18/22
Total EM sales exposure of relevant companies
Danone 56%
Nestle 44%Source: Deutsche Bank estimates
Euromonitor Definition Dairy is the aggregation of drinking milk products, cheese, yoghurt and sour milk drinks, and other dairy products.
Figure 130: Global Retail Dairy Market (US$440bn)
123
97
7066
43
30
11
0
20
40
60
80
100
120
140
Western Europe
Asia Pacific Latin America
North America
Eastern Europe
Middle East and Africa
Australasia
Source: Deutsche Bank; Euromonitor

25 March 2014
Consumer Staples
European Consumer Staples
Page 70 Deutsche Bank AG/London
Figure 132: Dairy per cap value (US$) by region Figure 133: Dairy per cap volume by region (kg)
407
252
188
131117
25 24
0
50
100
150
200
250
300
350
400
450
Australasia Western Europe
North America
Eastern Europe
Latin America
Asia Pacific Middle East and Africa
110
82
72
5145
13 13
0
20
40
60
80
100
120
Australasia Western Europe
North America
Eastern Europe
Latin America
Middle East and Africa
Asia Pacific
Source: Deutsche Bank; Euromonitor; 2012 data Source: Deutsche Bank; Euromonitor; 2012 data
Per caps: stable DMs; growing EMs In aggregate dairy product consumption has been declining very slightly in DMs though there has been stability since 2008 with per cap consumption c97% of that in 1998. As Figure 134 and Figure 135 show, consumption in EMs has been climbing steadily from 20% of that in DMs in 1998 to 29% in 2012. Compound growth in per cap consumption in EMs has been 2.4% since 1998 and the trend remains consistent with growth of 2.5% in 2010 and 2.4% in each of 2011 and 2012.
Figure 134: Dairy per cap consumption indexed Figure 135: Dairy EM per cap consump. rel. to DM
0
20
40
60
80
100
120
1998
1999
2000
2001
2002
2003
2004
2005
2006
2007
2008
2009
2010
2011
2012
Developed Market universe Emerging Market universe
0%
10%
20%
30%
40%
50%
60%
70%
80%
90%
100%
1998
1999
2000
2001
2002
2003
2004
2005
2006
2007
2008
2009
2010
2011
2012
Source: Deutsche Bank; Euromonitor; index takes DM in 1998 as the base at 100 Source: Deutsche Bank; Euromonitor
Retail value in EMs are high. Having declined relative to DMs over the period 2001-2004 they have increased steadily and now stand at c70% of DMs and have been at that level since 2010.
EM per cap consumption has risen every year Over the five separate time-frames we have analysed per cap consumption in dairy in EMs has risen in each (Figure 138). The lowest growth was seen 2007-2012 and even that was 1.7% pa.
In contrast, DM per consumption has fallen over each time period, though only marginally.

25 March 2014
Consumer Staples
European Consumer Staples
Deutsche Bank AG/London Page 71
Figure 136: Dairy retail value per unit (indexed) Figure 137: Dairy EM retail value per unit vs DM (US$)
0
20
40
60
80
100
120
140
160
180
1998
1999
2000
2001
2002
2003
2004
2005
2006
2007
2008
2009
2010
2011
2012
Developed Market universe Emerging Market universe
0%
10%
20%
30%
40%
50%
60%
70%
80%
90%
100%
1998
1999
2000
2001
2002
2003
2004
2005
2006
2007
2008
2009
2010
2011
2012
Source: Deutsche Bank; Euromonitor; index takes DM in 1998 as the base at 100 Source: Deutsche Bank; Euromonitor
Figure 138: Dairy per cap volume Figure 139: Dairy per cap value (US$)
-0.2%-0.3%
-0.1% -0.2% -0.2%
2.5%
3.0%
1.7%
2.3% 2.4%
-1%
0%
1%
1%
2%
2%
3%
3%
4%
1998-2002 2002 -07 2007-12 2002-12 1998-2012
Developed Market universe Emerging Market universe
-1.1%
7.8%
2.5%
5.1%3.3%
-3.7%
13.2%
6.3%
9.7%
5.7%
-6%
-4%
-2%
0%
2%
4%
6%
8%
10%
12%
14%
16%
1998-2002 2002 -07 2007-12 2002-12 1998-2012
Developed Market universe Emerging Market universe
Source: Deutsche Bank; Euromonitor Source: Deutsche Bank; Euromonitor
Price/mix Price/mix in dairy in EMs has been slightly below that of DMs at 3.2% over the fourteen years to 2012 (Figure 140), being materially impacted by the 1997/98 EM crisis through to 2002: over the four years to 2002 EM price mix was -6.1%.
Post this fall there was a steep recovery in EM pricing (as there was in DM) since when pricing has slowed in EMs (4.5% 2007-2012; 9.9% 2002-2007). Price/mix has varied from year to year but it is worth noting in 2012 it was negligible (+0.6%).
Figure 140: Dairy price/mix (US$)
-0.8%
8.2%
2.6%
5.4%
3.5%
-6.1%
9.9%
4.5%
7.2%
3.2%
-8%
-6%
-4%
-2%
0%
2%
4%
6%
8%
10%
1998-2002 2002 -07 2007-12 2002-12 1998-2012
Developed Market universe Emerging Market universe
Source: Deutsche Bank

25 March 2014
Consumer Staples
European Consumer Staples
Page 72 Deutsche Bank AG/London
Food: Yoghurt & Sour Milk Products (Yoghurt)
Conclusions Yoghurt is a relatively strong category with EM per cap consumption rising 5% pa since 1998 with ongoing growth in DM per caps (albeit at a lower rate). There remains significant growth potential with per cap consumption in EMs c35% of that in DMs. Pricing is relatively high in EMs (c55% of DMs) but has been relatively consistent at this level. Despite its relative strength and increasing per cap volumes over the period 1998-2002, post the last major EM crisis of 1997/98 price/mix 1998-2002 was still negative in US$ terms.
In terms of our forecasts for the category we model per cap volume growth of 3.6%, in line with the last five years and price/mix of 3.3%, in line with the 14-year average and slightly higher than the wider dairy category.
In Figure 144 we see that per caps in Asia-Pacific are c15% of those in Western Europe, even North America is only 50% of Western Europe.
Figure 142: Yoghurt medium term EM per cap revenue growth estimates Per cap volume growth 3.6%
Price/mix 3.3%
Per cap revenue growth 7.0%
Category Rank 8/22
Total EM sales exposure of relevant companies
Danone 56%
Nestle 44%Source: Deutsche Bank estimates;
Figure 143: Yoghurt per cap value (US$) by region Figure 144: Yoghurt per cap volume by region
52
44
30
25
18
6 6
0
10
20
30
40
50
60
Australasia Western Europe
North America
Eastern Europe
Latin America
Middle East and Africa
Asia Pacific
14
12
98
6
4
2
0
2
4
6
8
10
12
14
16
Western Europe
Eastern Europe
Australasia North America
Latin America
Middle East and Africa
Asia Pacific
Source: Deutsche Bank; Deutsche Bank, 2012 data Source: Deutsche Bank; Deutsche Bank, 2012 data
Euromonitor definition Yoghurt is the aggregation of yoghurt and sour milk drinks
Figure 141: Global Retail Yoghurt Market (US$84bn)
23.021.7
11.0 10.5
8.3 8.2
1.4
0
5
10
15
20
25
Asia Pacific Western Europe
Latin America
North America
Eastern Europe
Middle East and Africa
Australasia
Source: Deutsche Bank; Euromonitor; Yogurt & Sour Milk Products

25 March 2014
Consumer Staples
European Consumer Staples
Deutsche Bank AG/London Page 73
Stronger than wider dairy category Yoghurt per cap consumption in EMs is slightly higher than the wider dairy category at 36% of DMs having risen from 24% in 1998 (Figure 146). Per cap consumption in DMs has shown very consistent growth, climbing at 2% pa over the fourteen years to 2012 with only one year (2008) showing a decline (Figure 145). Over the same period per cap consumption in EMs has grown at 5% pa. Per cap consumption in EMs has grown every year. That said, every year from, and including 2008, has grown at a rate below that of the average over the fourteen years (Figure 147).
Figure 145: Yoghurt per cap consumption indexed Figure 146: Yoghurt per cap consumption relative to DM
0
20
40
60
80
100
120
140
1998
1999
2000
2001
2002
2003
2004
2005
2006
2007
2008
2009
2010
2011
2012
Developed Market universe Emerging Market universe
0%
10%
20%
30%
40%
50%
60%
70%
80%
90%
100%
1998
1999
2000
2001
2002
2003
2004
2005
2006
2007
2008
2009
2010
2011
2012
Source: Deutsche Bank; Euromonitor; index takes DM in 1998 as the base at 100 Source: Deutsche Bank; Euromonitor
Figure 147: Yoghurt EM per cap consumption growth 2008 2009 2010 2011 2012 Average
1998-2012
EM growth 3.5% 2.4% 4.8% 3.8% 3.4% 5.1%Source: Deutsche Bank; Euromonitor
Retail values per unit in EMs have generally risen in line with DMs. Both DMs and EMs saw declines 1998-2001 (EMs extending to 2002) from which there has been a steady increase with EM values stable at c55% of DM for the last three years (Figure 149).
Figure 148: Yoghurt retail value per unit (indexed) Figure 149: Yoghurt EM retail value per unit vs DM (US$)
0
20
40
60
80
100
120
140
160
180
1998
1999
2000
2001
2002
2003
2004
2005
2006
2007
2008
2009
2010
2011
2012
Developed Market universe Emerging Market universe
0%
10%
20%
30%
40%
50%
60%
70%
80%
90%
100%
1998
1999
2000
2001
2002
2003
2004
2005
2006
2007
2008
2009
2010
2011
2012
Source: Deutsche Bank; Euromonitor; index takes DM in 1998 as the base at 100 Source: Deutsche Bank; Euromonitor

25 March 2014
Consumer Staples
European Consumer Staples
Page 74 Deutsche Bank AG/London
Illustrative of the strength of the category, per cap volumes have not only risen steadily but also grew over the period 1998-2002 (at 4.8% pa, see Figure 150).
Despite this consistency and strength in per cap volumes, yet again we see a decline in US$ terms in per cap values sold in EMs 1998-2002 with the value sold on a unit basis over this period declining, albeit marginally, by 0.8%. Like a number of categories this was followed by a strong rebound over the period 2002-2007 with per cap values rising 17% pa as volumes grew faster and price/mix rebounded significantly.
In Figure 152 we see the decline in price/mix 1998-2002 of 5.4% implied by Figure 150 and Figure 151 with a strong recovery 2002-2007 (in both DMs and EMs).
Figure 150: Yoghurt per cap volume Figure 151: Yoghurt per cap value (US$)
2.4% 2.3%
1.5%1.9% 2.0%
4.8%
6.8%
3.6%
5.2% 5.1%
0%
1%
2%
3%
4%
5%
6%
7%
8%
1998-2002 2002 -07 2007-12 2002-12 1998-2012
Developed Market universe Emerging Market universe
0.7%
9.8%
4.4%
7.1%
5.2%
-0.8%
17.2%
8.1%
12.6%
8.6%
-2%
0%
2%
4%
6%
8%
10%
12%
14%
16%
18%
20%
1998-2002 2002 -07 2007-12 2002-12 1998-2012
Developed Market universe Emerging Market universe
Source: Deutsche Bank; Euromonitor Source: Deutsche Bank; Euromonitor
Figure 152: Yoghurt per unit price/mix (US$)
-1.6%
7.4%
2.9%
5.1%
3.1%
-5.4%
9.8%
4.4%
7.0%
3.3%
-8%
-6%
-4%
-2%
0%
2%
4%
6%
8%
10%
12%
1998-2002 2002 -07 2007-12 2002-12 1998-2012
Developed Market universe Emerging Market universe
Source: Deutsche Bank; Euromonitor

25 March 2014
Consumer Staples
European Consumer Staples
Deutsche Bank AG/London Page 75
Food: Infant Milk Formula (IMF)
Conclusions Population growth is one of the main tenets of our Staples investment case. Population growth is driven by EMs, not DMs and by birth, as well as longevity. More births leads to higher Infant Milk Formula (IMF) sales.
IMF has seen steady increases in EM per cap consumption rates but they still remain 50% below DMs. Pricing in EMs relative to DMs is high when compared to other categories. Despite this price/mix has been very stable in the 10 years to 2012 in EMs (averaging 4.4% pa). In the four years to 2002 when the majority of categories saw price/mix decline in the region of 5%, IMF saw declines of ‘only’ 3.1% pa in US$ terms.
IMF is one of our favoured categories. In Figure 154 we model per cap volume growth of 3.9% (in line with the last five years) and price/mix of 2.4% over the medium term (slightly ahead of the EM 14 year average but in line with the DM average thereby maintaining current relative pricing) to generate per cap revenue growth of 6.4% pa.
Figure 154: IMF medium term EM per cap revenue growth estimates Per cap volume growth 3.9%
Price/mix 2.4%
Per cap revenue growth 6.4%
Category Rank 16/22
Total EM sales exposure of relevant companies
Danone 56%
Nestle 44%Source: Deutsche Bank estimates;
Figure 155: IMF per cap value (US$) by region Figure 156: IMF per cap volume by region (kg)
19
15
7
55 4
2
0
2
4
6
8
10
12
14
16
18
20
Australasia North America
Western Europe
APAC Latin America
Eastern Europe
Middle East and Africa
0.8 0.8
0.5
0.3
0.2 0.2
0.1
0.00
0.10
0.20
0.30
0.40
0.50
0.60
0.70
0.80
0.90
Australasia Western Europe
North America
APAC Eastern Europe
Latin America
Middle East and Africa
Source: Deutsche Bank; Euromonitor; 2012 data Source: Deutsche Bank; Deutsche Bank; Euromonitor; 2012 data
Figure 153: Global Retail IMF Market (US$36bn)
20.5
5.23.5 2.8 2.2
1.40.5
0
5
10
15
20
25
Asia Pacific North America
Western Europe
Latin America
Middle East and Africa
Eastern Europe
Australasia
Source: Deutsche Bank; Euromonitor

25 March 2014
Consumer Staples
European Consumer Staples
Page 76 Deutsche Bank AG/London
Euromonitor Definition Infant Milk Formula (IMF) is the aggregation of standard, follow-on, toddler and special milk formula.
Strong growth in EM per cap consumption EM per cap consumption has risen steadily and in excess of DMs; at 5.5% pa for EMs against 1.8% for DMs (Figure 157). EM consumption is now 52% of DMs having been 31% in 1998 (Figure 158). DM consumption was stable 2008-2011 but climbed again in 2012. The rate of per cap consumption in EMs has slowed in recent years: only in 2011 was the rate of growth (7.6%) greater than the average over the 5.5% fourteen year period.
Figure 157: IMF per cap consumption indexed Figure 158: IMF per cap consumption. relative to DM
0
20
40
60
80
100
120
140
1998
1999
2000
2001
2002
2003
2004
2005
2006
2007
2008
2009
2010
2011
2012
Developed Market universe Emerging Market universe
0%
10%
20%
30%
40%
50%
60%
70%
80%
90%
100%
1998
1999
2000
2001
2002
2003
2004
2005
2006
2007
2008
2009
2010
2011
2012
Source: Deutsche Bank estimates; Euromonitor; index takes DM in 1998 as the base at 100 Source: Deutsche Bank estimates; Euromonitor
Figure 159: IMF retail value per unit (indexed) Figure 160: IMF EM retail value per unit vs DM (US$)
0
20
40
60
80
100
120
140
160
1998
1999
2000
2001
2002
2003
2004
2005
2006
2007
2008
2009
2010
2011
2012
Developed Market universe Emerging Market universe
0%
10%
20%
30%
40%
50%
60%
70%
80%
90%
100%
1998
1999
2000
2001
2002
2003
2004
2005
2006
2007
2008
2009
2010
2011
2012
Source: Deutsche Bank estimates; Euromonitor; index takes DM in 1998 as the base at 100 Source: Deutsche Bank estimates; Euromonitor
Retail values in IMF are relatively high in EMs and are currently 81% of those of DMs having been as high as 86% (in 2000) and as low as 68% (in 2004). EM prices relative to DMs have been in the region of 80% for the last three years.

25 March 2014
Consumer Staples
European Consumer Staples
Deutsche Bank AG/London Page 77
Price/mix negative 1998-2002 in DMs IMF is one of the few categories to see stable or increasing EM per cap volumes each year of the entire period 1998-2014 (Figure 161). In the last five years to 2012 per cap volume growth in EMs has slowed to (a still healthy) 3.9% with recent years still relatively healthy (2010 3.1%, 2011 7.6% and 2012 4.2%).
Despite this underlying strength in the category, again we see that the category was insufficiently strong against the impact of the last EM currency crisis to withstand declines in per unit values as a consequence of price/mix declines in US$ terms (Figure 162 and Figure 163).
Figure 161: IMF per cap volume Figure 162: IMF per cap unit value (US$)
1.5%
3.3%
0.5%
1.9% 1.8%
2.7%
9.4%
3.9%
6.6%
5.5%
0%
1%
2%
3%
4%
5%
6%
7%
8%
9%
10%
1998-2002 2002 -07 2007-12 2002-12 1998-2012
Developed Market universe Emerging Market universe
0.6%
8.6%
3.1%
5.8%
4.3%
-0.5%
13.9%
8.7%
11.3%
7.8%
-2%
0%
2%
4%
6%
8%
10%
12%
14%
1998-2002 2002 -07 2007-12 2002-12 1998-2012
Developed Market universe Emerging Market universe
Source: Deutsche Bank estimates; Euromonitor Source: Deutsche Bank estimates; Euromonitor
In the period 1998-2002 per cap volumes in IMF increased 1.5% in DMs and 2.7% in EMs. Per cap unit values only increased 0.6% in DMs and declined 0.5% in EMs as a result of negative price/mix of 0.9% in DMs and 3.1% in EMs.
Excluding the period 1998-2002 price/mix has been very stable over the 10 years since growing 4.2% in the five years to 2007 and 4.6% in the five years to 2012.
Figure 163: IMF price/mix (US$)
-0.9%
5.1%
2.6%
3.8%
2.4%
-3.1%
4.2%4.6% 4.4%
2.2%
-4%
-3%
-2%
-1%
0%
1%
2%
3%
4%
5%
6%
1998-2002 2002 -07 2007-12 2002-12 1998-2012
Developed Market universe Emerging Market universe
Source: Deutsche Bank estimates; Euromonitor

25 March 2014
Consumer Staples
European Consumer Staples
Page 78 Deutsche Bank AG/London
Food: Prepared Baby Food (PBF)
Conclusions PBF is a relatively small market; estimated at US$9bn pa.
EM Prepared Baby Food (PBF) is relatively immature when considered against DMs with per cap consumption in EMs only 26% of that in DMs, having risen steadily from 1998. The trajectory of EM per cap consumption is sufficiently consistent that we would expect it to continue over the medium to long term. Figure 167 shows markets are non-existent in Asia-Pacific and Middle East & Africa.
Price/mix in EMs in US$ terms has been relatively strong since 1998 averaging just over 5% pa against 3.4% in DMs. Like the majority of categories PBF was unable to combat the impact of the EM currency crisis in 1997/98 and price mix declined 1998-2002.
There is further scope for pricing to progress in EMs but it is already relatively high at c80% of that in DMs and would expect the rate of EM price/mix to decline from the rate of c5% over the last 14 years. Like many categories that process has started with price/mix in the last five years (6%) considerably less than that over the preceding 5 years of nearly 11% (benefitting from a “catch-up” following the price/mix declines in US$ terms seen 1998-2002).
In terms of our medium term projections, given current low EM per cap consumption we model volume growth in line with the last five years (5.5%) and per cap price/mix at 3.4% (in line with the last 14 years in DMs). This is below the 5.1% seen in EMs in the last 14 years, but we believe is justified given high EM pricing relative to DMs. We may be too conservative in price/mix assumptions; irrespective of this we still drive per cap revenue growth of over 9%.
PBF is a small category but valuable to those companies with exposure (Nestle and Danone).
Figure 165: PBF medium term EM per cap revenue growth estimates Per cap volume growth 5.5%
Price/mix 3.4%
Per cap revenue growth 9.1%
Category Rank 2/22
Total EM sales exposure of relevant companies
Danone 56%
Nestle 44%Source: Deutsche Bank estimates
Euromonitor Definition Prepared baby food is baby products sold in jars, cans or retort flexible pouches which do not require any cooking preparation other than heating. Includes pureed food, yoghurts, chilled desserts, soup, desserts, ice cream marketed for babies.
Figure 164: Global Retail PBF Market (US$9bn)
2.8 2.8
1.5
0.70.6
0.2 0.2
0.0
0.5
1.0
1.5
2.0
2.5
3.0
Western Europe
Eastern Europe
North America
Latin America
Asia Pacific Australasia Middle East and Africa
Source: Deutsche Bank; Euromonitor

25 March 2014
Consumer Staples
European Consumer Staples
Deutsche Bank AG/London Page 79
Figure 166: PBF per cap value (US$) by region Figure 167: PBF per cap volume by region (kg)
8.4
6.0 5.8
4.4
1.1
0.1 0.10
1
2
3
4
5
6
7
8
9
Eastern Europe
Australasia Western Europe
North America
Latin America Asia Pacific Middle East and Africa
1.0
0.6
0.5 0.5
0.1
0.0 0.00.0
0.2
0.4
0.6
0.8
1.0
1.2
Eastern Europe
Western Europe
Australasia North America
Latin America
Asia Pacific Middle East and Africa
Source: Deutsche Bank; Euromonitor; 2012 data Source: Deutsche Bank; Euromonitor; 2012 data
EM per caps growing... with limited support from DM growth Per cap PBF consumption in EMs is still relatively low at 26% of DMs in 2012. However, there has been consistent growth in EM per caps from just under 10% in 1998. This growth in EMs has been achieved despite no growth in per cap consumption in DMs since 2006.
Figure 168: PBF per cap consumption indexed Figure 169: PBF EM per cap consump. rel. to DM
0
20
40
60
80
100
120
1998
1999
2000
2001
2002
2003
2004
2005
2006
2007
2008
2009
2010
2011
2012
Developed Market universe Emerging Market universe
0%
10%
20%
30%
40%
50%
60%
70%
80%
90%
100%
1998
1999
2000
2001
2002
2003
2004
2005
2006
2007
2008
2009
2010
2011
2012
Source: Deutsche Bank; Euromonitor; index takes DM in 1998 as the base at 100 Source: Deutsche Bank; Euromonitor
Per unit values in EMs are relatively high at c80% of DMs in US$ terms. Having risen steadily since a low in 2004 they have been stable relative to DMs since 2008 (Figure 171).
The scope to outpace DM pricing from here appears relatively limited.
Price/mix In Figure 172, Figure 173 and Figure 174 we look at growth rates over our time horizon with Figure 172 confirming the steady (but low) per cap growth from DMs with materially stronger growth in EMs, though the rate of growth is slowing (2007-2012 vs 2002-2007). Again the period 1998-2002 saw negative price/mix (compensated for in subsequent years) and further supported by strong per cap volume growth 2002-2007 of over 12% in EMs.

25 March 2014
Consumer Staples
European Consumer Staples
Page 80 Deutsche Bank AG/London
Figure 170: PBF retail value per unit (indexed) Figure 171: PBF EM retail value per unit vs DM (US$)
0
20
40
60
80
100
120
140
160
180
1998
1999
2000
2001
2002
2003
2004
2005
2006
2007
2008
2009
2010
2011
2012
Developed Market universe Emerging Market universe
0%
10%
20%
30%
40%
50%
60%
70%
80%
90%
100%
1998
1999
2000
2001
2002
2003
2004
2005
2006
2007
2008
2009
2010
2011
2012
Source: Deutsche Bank; Euromonitor; index takes DM in 1998 as the base at 100 Source: Deutsche Bank; Euromonitor
Figure 172: PBF per cap volume Figure 173: PBF per cap value (US$)
0.9%
2.5%
-0.6%
1.0% 0.9%
6.8%
12.1%
5.5%
8.7%8.2%
-2%
0%
2%
4%
6%
8%
10%
12%
14%
1998-2002 2002 -07 2007-12 2002-12 1998-2012
Developed Market universe Emerging Market universe
0.4%
10.1%
1.9%
5.9%4.3%
2.8%
25.4%
11.8%
18.4%
13.7%
0%
5%
10%
15%
20%
25%
30%
1998-2002 2002 -07 2007-12 2002-12 1998-2012
Developed Market universe Emerging Market universe
Source: Deutsche Bank; Euromonitor Source: Deutsche Bank; Euromonitor
Figure 174: PBF price/mix (US$)
-0.5%
7.4%
2.5%
4.9%3.4%
-3.7%
11.9%
6.0%
8.9%
5.1%
-6%
-4%
-2%
0%
2%
4%
6%
8%
10%
12%
14%
1998-2002 2002 -07 2007-12 2002-12 1998-2012
Developed Market universe Emerging Market universe
Source: Deutsche Bank; Euromonitor

25 March 2014
Consumer Staples
European Consumer Staples
Deutsche Bank AG/London Page 81
Food: Chocolate Confectionary (Chocolate)
Conclusions Against stable per cap DM consumption, per caps in EMs have been rising steadily. Nevertheless they are still less than 22% of that in DMs. EM per cap consumption growth rates have slowed in recent years but the potential remains very significant.
On a regional basis, Figure 178 illustrates there are substantial long-term growth opportunities in LatAm, Asia-Pacific and Middle East &Africa. We also note the consistency of per caps in Australasia, North America and Western Europe which may provide some indication of the potential of chocolate outside these mature markets.
The value of per cap product sold in EMs has risen 8.5% CAGR in US$ terms since 1998 with 5.1% of the growth from volume (as per caps have expanded) and 3.2% from price/mix.
Retail values per unit relative to DMs have remained very stable at c70% (as price mix of 3.0% in DMs and 3.2% in EMs implies). Price/mix potential in EMs (in US$ terms) relative to DMs is subdued but DMs have compounded at 3% pa over the long term.
We model EM per cap volumes climbing 3.6% pa (in line with the last five years) and materially below the 14 year average of 5.1%. We suspect over the medium term we may be too conservative. We model price/mix of 3.0% to maintain relatively high pricing as compared to DMs.
Despite relatively high price/mix assumptions we firmly believe the risk to our forecasts is to the upside. We may have materially understated chocolate confectionary’s potential.
Figure 176: Chocolate medium term EM per cap revenue growth estimates Per cap volume growth 3.6%
Price/mix 3.0%
Per cap revenue growth 6.7%
Category Rank 13/22
Total EM sales exposure of relevant companies
Nestle 44%Source: Deutsche Bank estimates
Figure 175: Global Retail Chocolate Market (US$105bn)
37.6
19.616.8
12.910.7
4.43.0
0
5
10
15
20
25
30
35
40
Western Europe
North America
Eastern Europe
Asia Pacific Latin America
Middle East and Africa
Australasia
Source: Deutsche Bank; Euromonitor

25 March 2014
Consumer Staples
European Consumer Staples
Page 82 Deutsche Bank AG/London
Figure 177: Chocolate per cap value (US$) by region Figure 178: Chocolate per cap volume by region (kg)
112
77
5651
18
3 3
0
20
40
60
80
100
120
Australasia Western Europe
North America
Eastern Europe
Latin America
Middle East and Africa
Asia Pacific
4.7 4.64.4
4.1
1.1
0.2 0.2
0.0
0.5
1.0
1.5
2.0
2.5
3.0
3.5
4.0
4.5
5.0
Australasia Western Europe
North America
Eastern Europe
Latin America
Asia Pacific Middle East and Africa
Source: Deutsche Bank; Euromonitor; 2012 data Source: Deutsche Bank; Euromonitor; 2012 data
Euromonitor Definition Chocolate Confectionary is the aggregation of tablets, countlines, bagged selflines/softlines, boxed assortments, seasonal chocolate, chocolate with toys, alfajores and other chocolate confectionery.
Steady DM per caps; rising EMs DM per cap consumption has held steady since 1998 with very limited variability between the intervening years (Figure 179). Per cap consumption in EMs has risen steadily at a rate of just over 3% pa to reach per cap consumption rates c22% of those of DMs (Figure 180).
The highest rate of per cap consumption growth in EMs was seen over the period 2003-2008 when per caps rose from 12% of DMs in 2002 to just below 20% in 2008: Figure 183 shows this in more detail.
The rate of growth of per cap consumption in EMs has slowed in recent years (averaging 2.6% in the four years to 2012) suggesting growth rates may continue to moderate. That said, relative to DMs the potential of the category in terms of EM per cap consumption remains very significant.
In terms of retail values per unit both DMs and EMs fell post 1998, DMs to 2001 and DMs to 2002. Post 2001/2002 both DMs and EMs have posted consistent growth in overall value: by 3% in DMs and 8.5% in EMs. On a per unit basis (given the per cap growth in EMs) this has resulted retail values per unit in EMs being very stable relative to DMs at c70% in US$ terms.

25 March 2014
Consumer Staples
European Consumer Staples
Deutsche Bank AG/London Page 83
Figure 179: Chocolate per cap consumption indexed Figure 180: Chocolate EM per cap consump. rel. to DM
0
20
40
60
80
100
120
1998
1999
2000
2001
2002
2003
2004
2005
2006
2007
2008
2009
2010
2011
2012
Developed Market universe Emerging Market universe
0%
10%
20%
30%
40%
50%
60%
70%
80%
90%
100%
1998
1999
2000
2001
2002
2003
2004
2005
2006
2007
2008
2009
2010
2011
2012
Source: Deutsche Bank; Euromonitor; index takes DM in 1998 as the base at 100 Source: Deutsche Bank; Euromonitor
Figure 181: Chocolate retail value per unit (indexed) Figure 182: Choc. EM retail value per unit vs DM (US$)
0
20
40
60
80
100
120
140
160
1998
1999
2000
2001
2002
2003
2004
2005
2006
2007
2008
2009
2010
2011
2012
Developed Market universe Emerging Market universe
0%
10%
20%
30%
40%
50%
60%
70%
80%
90%
100%
1998
1999
2000
2001
2002
2003
2004
2005
2006
2007
2008
2009
2010
2011
2012
Source: Deutsche Bank; Euromonitor Source: Deutsche Bank; Euromonitor
Figure 183: Chocolate per cap volume Figure 184: Chocolate per cap value (US$)
0.2% 0.0%
-0.3% -0.2% 0.0%
3.7%
7.8%
3.6%
5.7%5.1%
-1%
0%
1%
2%
3%
4%
5%
6%
7%
8%
9%
1998-2002 2002 -07 2007-12 2002-12 1998-2012
Developed Market universe Emerging Market universe
-1.5%
8.0%
1.6%
4.8%2.9%
-1.3%
18.7%
7.0%
12.7%
8.5%
-5%
0%
5%
10%
15%
20%
1998-2002 2002 -07 2007-12 2002-12 1998-2012
Developed Market universe Emerging Market universe
Source: Deutsche Bank; Euromonitor Source: Deutsche Bank; Euromonitor

25 March 2014
Consumer Staples
European Consumer Staples
Page 84 Deutsche Bank AG/London
Figure 183, Figure 184 and Figure 185 look at data across DMs and EMs broken down into various year groups... and the pattern remains very consistent with other categories. Again we see in the period 1998-2002 price/mix was negative in EMs and also in DMs with per cap values down c1.5% in each case.
Figure 185: Chocolate price/mix (US$)
-1.7%
8.0%
2.0%
4.9%
3.0%
-4.8%
10.1%
3.3%
6.7%
3.2%
-6%
-4%
-2%
0%
2%
4%
6%
8%
10%
12%
1998-2002 2002 -07 2007-12 2002-12 1998-2012
Developed Market universe Emerging Market universe
Source: Deutsche Bank; Euromonitor

25 March 2014
Consumer Staples
European Consumer Staples
Deutsche Bank AG/London Page 85
Food: Coffee
Conclusions Per cap coffee consumption in EMs has risen steadily but is still relatively low at 32% of that in DMs; we expect per cap volumes to continue to increase in EMs despite low growth in DMs (+0.4% pa). Figure 189 shows Middle East & Africa and Asia-Pacific being particularly low at c10% of Western Europe.
Over the last fourteen years price/mix in DMs has been +3.7% and in EMs has been +4.6%; we expect continued positive price/mix in both DMs and EMs with EMs continuing to outpace DMs in US$ terms.
In terms of modelling medium term growth we have used the average per cap growth rate over the last fourteen years (2.5%, in line with the last five years, 2.4%). With per caps relative to DMs of only 32%, this feels conservative.
In terms of price/mix we have used 4.0%, below the average of the last 14 years and only marginally above the 14 year average achieved in DMs of 3.7% thereby only slowly increasing the relative unit value in EMs from the current 66%. We should note that coffee pricing is in a large part dependent on the underlying commodity price.
Figure 187: Coffee medium term EM per cap revenue growth estimates Per cap volume growth 2.5%
Price/mix 4.0%
Per cap revenue growth 6.6%
Category Rank 15/22
Total EM sales exposure of relevant companies
Nestle 44%Source: Deutsche Bank estimates
Figure 188: Coffee per cap value (US$) by region Figure 189: Coffee per cap volume by region
48 47
38
30
21
4 3
0
10
20
30
40
50
Australasia Western Europe
North America
Eastern Europe
Latin America
Middle East and Africa
Asia Pacific
2.6
2.4
1.7
1.4
1.1
0.30.2
0.0
0.5
1.0
1.5
2.0
2.5
3.0
Western Europe
North America
Latin America
Eastern Europe
Australasia Middle East and Africa
Asia Pacific
Source: Deutsche Bank; Euromonitor; 2012 data Source: Deutsche Bank; Euromonitor; 2012 data
Figure 186: Global Retail Coffee Market (US$77bn)
22.8
13.1 12.8 12.6
10.0
4.7
1.3
0
5
10
15
20
25
Western Europe
North America
Asia Pacific Latin America
Eastern Europe
Middle East and Africa
Australasia
Source: Euromonitor; on and off trade

25 March 2014
Consumer Staples
European Consumer Staples
Page 86 Deutsche Bank AG/London
Euromonitor Definition Coffee is the aggregation of fresh and instant coffee. Fresh coffee includes fresh ground coffee and fresh coffee beans.
The global market is split approximately two-thirds fresh coffee and one-third instant.
Steady EM per cap growth Per cap consumption in DMs has been very stable, growing at 0.4% pa since 1998, not an unexpected result. Growth in DMs has been consistent with only three years seeing declines (2003, 2005 and 2011). 2011 was the highest DM decline (-1.6%).
Per cap consumption in EMs has risen at a compound rate of 2.5% pa with no year seeing a decline (Figure 190). Relative to DMs, per cap consumption in EMs still has considerable growth opportunities with per caps only c30% of those in DMs (Figure 191) with growth skewed to Asia-Pacific and Middle East & Africa.
Figure 190: Coffee per cap consumption indexed Figure 191: Coffee per cap consump. rel. to DM
0
10
20
30
40
50
60
70
80
90
100
110
1998
1999
2000
2001
2002
2003
2004
2005
2006
2007
2008
2009
2010
2011
2012
Developed Market universe Emerging Market universe
0%
10%
20%
30%
40%
50%
60%
70%
80%
90%
100%19
98
1999
2000
2001
2002
2003
2004
2005
2006
2007
2008
2009
2010
2011
2012
Source: Deutsche Bank; Euromonitor; index takes DM in 1998 as the base at 100; excludes Ethiopia. Source: Deutsche Bank; Euromonitor; excludes Ethiopia.
Retail value in EM coffee has remained relatively stable at c60% of that in DMs (Figure 193) with the pattern in pricing very much reflecting that of DMs (Figure 192) (with the commodity price the underlying driver). Clearly there is scope for EM pricing to increase relative to DMs but we believe the process will continue to be relatively slow.
Price/mix In Figure 194, Figure 195 and Figure 196 we break down our analysis of coffee into further detail. Per cap volume growth in EMs has slowed 2007-2012 relative to the prior five years (2002-2007) following relatively low growth 1998-2002 (Figure 194). Though per cap growth has slowed 2007-2012 in EMs it has been relatively consistent and has grown in all five years (ranging from +0.8% (2009) to 3.4% (2007)); growth in 2012 was 3.0%.
Again we see negative price mix in DMs and EMs 1998-2002 followed by a significant rebound 2002-2007, subsequently followed by more subdued growth 2007-2012 (Figure 196).

25 March 2014
Consumer Staples
European Consumer Staples
Deutsche Bank AG/London Page 87
Figure 192: Coffee retail value per unit (indexed) Figure 193: Coffee EM retail value per unit vs DM (US$)
0
20
40
60
80
100
120
140
160
180
1998
1999
2000
2001
2002
2003
2004
2005
2006
2007
2008
2009
2010
2011
2012
Developed Market universe Emerging Market universe
0%
10%
20%
30%
40%
50%
60%
70%
80%
90%
100%
1998
1999
2000
2001
2002
2003
2004
2005
2006
2007
2008
2009
2010
2011
2012
Source: Deutsche Bank; Euromonitor; index takes DM in 1998 as the base at 100; excludes Ethiopia Source: Deutsche Bank; Euromonitor; excludes Ethiopia
Figure 194: Coffee per cap volume Figure 195: Coffee per cap value (US$)
0.5%
0.2%
0.6%0.4% 0.4%
1.1%
3.9%
2.4%
3.1%
2.5%
0%
1%
1%
2%
2%
3%
3%
4%
4%
5%
1998-2002 2002 -07 2007-12 2002-12 1998-2012
Developed Market universe Emerging Market universe
-3.1%
8.2%6.1%
7.2%
4.1%
-4.3%
16.1%
8.5%
12.3%
7.3%
-10%
-5%
0%
5%
10%
15%
20%
1998-2002 2002 -07 2007-12 2002-12 1998-2012
Developed Market universe Emerging Market universe
Source: Deutsche Bank; Euromonitor; excludes Ethiopia Source: Deutsche Bank; Euromonitor; excludes Ethiopia
Figure 196: Coffee price/mix (US$)
-3.6%
8.0%
5.5%6.7%
3.7%
-5.3%
11.8%
6.0%
8.9%
4.6%
-8%
-6%
-4%
-2%
0%
2%
4%
6%
8%
10%
12%
14%
1998-2002 2002 -07 2007-12 2002-12 1998-2012
Developed Market universe Emerging Market universe
Source: Deutsche Bank; Euromonitor; excludes Ethiopia

25 March 2014
Consumer Staples
European Consumer Staples
Page 88 Deutsche Bank AG/London
Food: Pet Care
Conclusions Pet care is measured on a per household basis.
Pet care has been a consistent growth category in EMs on a per household basis. Despite the growth relative penetration of EM households is low as Figure 200 shows (perhaps not unexpectedly). Pet care is almost non-existent on a per household basis in Asia-Pacific and Middle East & Africa compared to North America. Per household consumption in EMs is still only 20% of that in DMs. Price/mix has slowed in recent years in EMs but is still relatively strong at 4.0% 2007-2012. We expect further long-term per household consumption growth in EM pet care supported by ongoing positive pricing. We regard Pet Care as a strong category with only Nestle of our coverage universe exposed.
In terms of medium term EM forecasts we model 3.5% per household volume growth (below both the average over the last five years (4.0%) and the 14 year average of 5.0%). This may prove too conservative over the medium term but should be considered against per household DM volumes declining. At growth rates of 3.5% in EMs and -1.0% in DMs per household, consumption in EMs will still only be 30% of those in DMs in 10 years against the current 20%. Our 3.5% pa volume growth forecast may be too low.
In terms of price/mix we model 3.2% pa. in EMs, the 14 year average, against a 14 year average in DMs of 3.9%. Continuation of these trends would see per unit values increase in DMs relative to EMs: we see greater risk in the long-term DM average than we do our assumption for EM pricing. Overall the risk is to the upside in our pet care model, driven by stronger per household growth than we have assumed.
Figure 198: Pet Care medium term EM per cap revenue growth estimates Per cap volume growth 3.5%
Price/mix 3.2%
Per cap revenue growth 6.8%
Category Rank 11/22
Total EM sales exposure of relevant companies
Nestle 44%Source: Deutsche Bank estimates
Euromonitor Definition Pet care is measured on a per household basis. Pet care is the aggregation of pet food and pet products. Pet food is the aggregation of dog, cat and other pet food. Pet products include cat litter, healthcare, dietary supplements and other pet products.
Figure 197: Global Retail Pet Care Market (US$92bn)
31.6
28.6
11.5 11.3
5.33.0
1.0
0
5
10
15
20
25
30
35
North America
Western Europe
Latin America
Asia Pacific Eastern Europe
Australasia Middle East and Africa
Source: Deutsche Bank; Euromonitor

25 March 2014
Consumer Staples
European Consumer Staples
Deutsche Bank AG/London Page 89
Figure 199: Pet Care per h/h value (US$) by region Figure 200: Pet Care per h/h volume by region (kg)
308
235
141
69
41
11 40
50
100
150
200
250
300
350
Australasia North America
Western Europe
Latin America
Eastern Europe
Asia Pacific Middle East and Africa
65
54
2924
10
1 10
10
20
30
40
50
60
70
North America
Australasia Western Europe
Latin America
Eastern Europe
Asia Pacific Middle East and Africa
Source: Deutsche Bank; Euromonitor; 2012 data Source: Deutsche Bank; Euromonitor; 2012 data
Low but increasing per cap consumption DM per household consumption is declining steadily. Despite this decline EM consumption has increased steadily at 5.0% pa, from a low base (Figure 201): per cap consumption in DMs is now 19% of DMs having been less than 9% in 1998 (Figure 202). Irrespective of this per household decline in DMs we expect the rising trend in per cap consumption in EMs to continue.
Figure 201: Pet Care per h/h consumption indexed Figure 202: Pet care per h/h consump. relative to DMs
0
10
20
30
40
50
60
70
80
90
100
1998
1999
2000
2001
2002
2003
2004
2005
2006
2007
2008
2009
2010
2011
2012
Developed Market universe Emerging Market universe
0%
10%
20%
30%
40%
50%
60%
70%
80%
90%
100%
1998
1999
2000
2001
2002
2003
2004
2005
2006
2007
2008
2009
2010
2011
2012
Source: Deutsche Bank; Euromonitor; index takes DM in 1998 as the base at 100; excludes Ethiopia. Source: Deutsche Bank; Euromonitor; excludes Ethiopia.
Though per household volumes have been declining in DMs, price/mix has increased steadily post 2001 (Figure 203) and compounded in US$ terms at 3.9% pa.
In Figure 205 we see the consistency of per household volume declines in DMs and increases in EMs. In terms of value, again we see the declines 1998-2002 predicated on weak price/mix in DMs and EMs with the subsequent recovery 2002-2007. Though lower than during the period 2002-2007, 2007-2012 price/mix in EMs (and DMs) remains relatively healthy at 5.1% and 4.0% respectively.

25 March 2014
Consumer Staples
European Consumer Staples
Page 90 Deutsche Bank AG/London
Figure 203: Pet Care retail value per unit (indexed) Figure 204: Pet Care EM retail val. per unit vs DM (US$)
0
20
40
60
80
100
120
140
160
180
200
1998
1999
2000
2001
2002
2003
2004
2005
2006
2007
2008
2009
2010
2011
2012
Developed Market universe Emerging Market universe
0%
10%
20%
30%
40%
50%
60%
70%
80%
90%
100%
1998
1999
2000
2001
2002
2003
2004
2005
2006
2007
2008
2009
2010
2011
2012
Source: Deutsche Bank; Euromonitor; index takes DM in 1998 as the base at 100 Source: Deutsche Bank; Euromonitor
Figure 205: Pet Care per h/h volume growth Figure 206: Pet care per h/h value (US$)
-0.8% -0.8% -1.1% -0.9% -0.9%
5.1%
5.9%
4.0%
4.9% 5.0%
-2%
-1%
0%
1%
2%
3%
4%
5%
6%
7%
1998-2002 2002 -07 2007-12 2002-12 1998-2012
Developed Market universe Emerging Market universe
-1.9%
7.2%
2.9%
5.0%
3.0%
-1.9%
16.2%
9.4%
12.8%
8.4%
-4%
-2%
0%
2%
4%
6%
8%
10%
12%
14%
16%
18%
1998-2002 2002 -07 2007-12 2002-12 1998-2012
Developed Market universe Emerging Market universe
Source: Deutsche Bank; Euromonitor Source: Deutsche Bank; Euromonitor
Figure 207: Pet Care price/mix (US$)
-1.1%
8.1%
4.0%
6.0%
3.9%
-6.7%
9.8%
5.1%
7.4%
3.2%
-8%
-6%
-4%
-2%
0%
2%
4%
6%
8%
10%
12%
1998-2002 2002 -07 2007-12 2002-12 1998-2012
Developed Market universe Emerging Market universe
Source: Deutsche Bank; Euromonitor

25 March 2014
Consumer Staples
European Consumer Staples
Deutsche Bank AG/London Page 91
Food: Ice Cream
Conclusions Ice cream per caps are stable in DMs but increasing steadily in EMs (3% pa), from a low base. This rate of growth appears sustainable – per caps in EMs are only 16% of those in DMs having risen from 11% in 1998.
Price/mix in EMs over our fourteen year time horizon has matched that of DMs (2.9% vs. 3.0%). We see ice cream as an attractive long-term category though a number of other categories appear better placed. In Figure 211 we see that Eastern Europe is c55% of Western Europe with LatAm and Middle East & Africa considerably lower.
In Figure 209 we model 3.0% EM per cap volume growth and 3.0% price/mix. Based on price/mix history (Figure 218) and low relative consumption (Figure 213) this is reasonable in our view. Though there was only growth in per cap consumption of 2.2% in EMs 2007-2012, given low relative consumption, we suspect the risk to our per cap assumption is to the upside.
We model price/mix of 3% in line with 14 year history in EMs and DMs driving per cap revenue growth of 6.1% in EMs. W
Figure 209: Ice Cream medium term EM per cap revenue growth estimates Per cap volume growth 3.0%
Price/mix 3.0%
Per cap revenue growth 6.1%
Category Rank 17/22
Total EM sales exposure of relevant companies
Unilever 57%
Nestle 44%Source: Deutsche Bank estimates
Figure 210: Ice Cream per cap value (US$) by region Figure 211: Ice Cream per cap volume by region (litres)
91
47 44
1611
4 3
0
10
20
30
40
50
60
70
80
90
100
Australasia Western Europe
North America
Eastern Europe
Latin America
Asia Pacific Middle East and Africa
8.8 8.5
4.0
2.2
1.1 0.90.4
0.0
1.0
2.0
3.0
4.0
5.0
6.0
7.0
8.0
9.0
10.0
Australasia North America
Western Europe
Eastern Europe
Latin America
Asia Pacific Middle East and Africa
Source: Deutsche Bank Source: Deutsche Bank
Figure 208: Ice Cream Global Retail market (US$74bn)
22.0
16.915.6
7.15.8
3.92.5
0
5
10
15
20
25
Western Europe
Asia Pacific North America
Latin America
Eastern Europe
Middle East and Africa
Australasia
Source: Deutsche Bank; Euromonitor
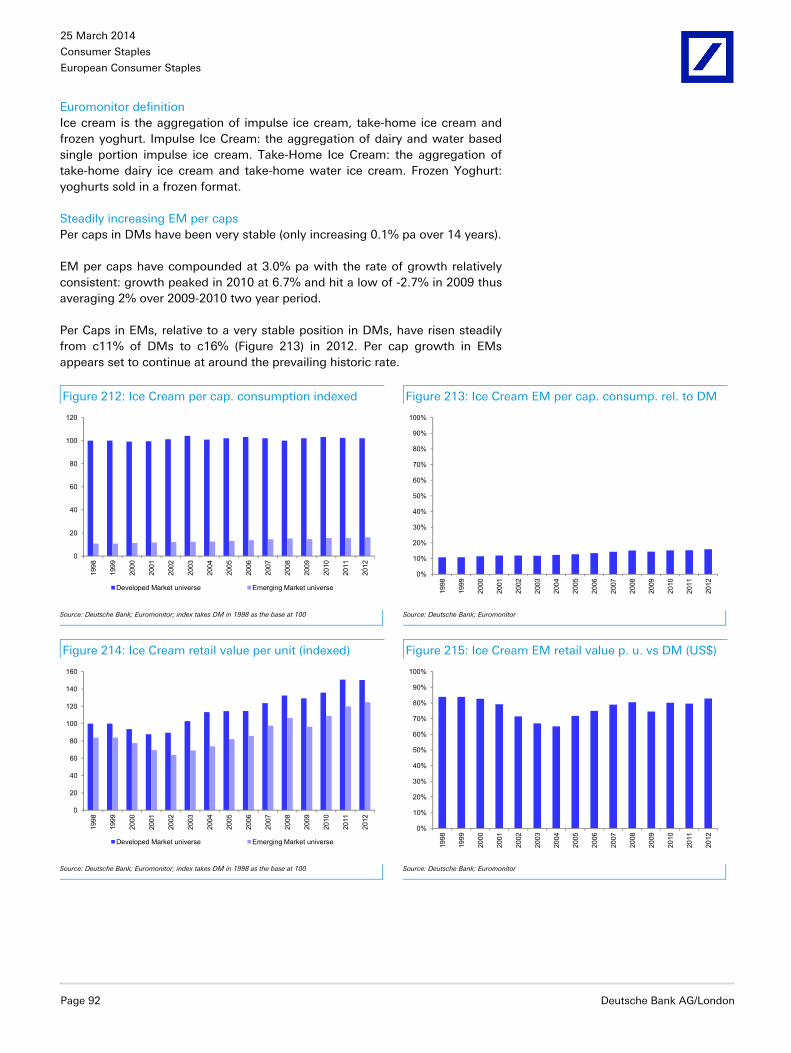
25 March 2014
Consumer Staples
European Consumer Staples
Page 92 Deutsche Bank AG/London
Euromonitor definition Ice cream is the aggregation of impulse ice cream, take-home ice cream and frozen yoghurt. Impulse Ice Cream: the aggregation of dairy and water based single portion impulse ice cream. Take-Home Ice Cream: the aggregation of take-home dairy ice cream and take-home water ice cream. Frozen Yoghurt: yoghurts sold in a frozen format.
Steadily increasing EM per caps Per caps in DMs have been very stable (only increasing 0.1% pa over 14 years).
EM per caps have compounded at 3.0% pa with the rate of growth relatively consistent: growth peaked in 2010 at 6.7% and hit a low of -2.7% in 2009 thus averaging 2% over 2009-2010 two year period.
Per Caps in EMs, relative to a very stable position in DMs, have risen steadily from c11% of DMs to c16% (Figure 213) in 2012. Per cap growth in EMs appears set to continue at around the prevailing historic rate.
Figure 212: Ice Cream per cap. consumption indexed Figure 213: Ice Cream EM per cap. consump. rel. to DM
0
20
40
60
80
100
120
1998
1999
2000
2001
2002
2003
2004
2005
2006
2007
2008
2009
2010
2011
2012
Developed Market universe Emerging Market universe
0%
10%
20%
30%
40%
50%
60%
70%
80%
90%
100%
1998
1999
2000
2001
2002
2003
2004
2005
2006
2007
2008
2009
2010
2011
2012
Source: Deutsche Bank; Euromonitor; index takes DM in 1998 as the base at 100 Source: Deutsche Bank; Euromonitor
Figure 214: Ice Cream retail value per unit (indexed) Figure 215: Ice Cream EM retail value p. u. vs DM (US$)
0
20
40
60
80
100
120
140
160
1998
1999
2000
2001
2002
2003
2004
2005
2006
2007
2008
2009
2010
2011
2012
Developed Market universe Emerging Market universe
0%
10%
20%
30%
40%
50%
60%
70%
80%
90%
100%
1998
1999
2000
2001
2002
2003
2004
2005
2006
2007
2008
2009
2010
2011
2012
Source: Deutsche Bank; Euromonitor; index takes DM in 1998 as the base at 100 Source: Deutsche Bank; Euromonitor

25 March 2014
Consumer Staples
European Consumer Staples
Deutsche Bank AG/London Page 93
Value per unit in EMs has grown 3% pa since 1998 very much in line with DMs such that, with intermittent variances, US$ EM retail value relative to DMs has been stable at c83% point to point, 1998 and 2012. The EM low was in 2004 post the EM crisis of 1997/8 when relative pricing in EMs fell to 65% of that in DMs: from 1998 to 2004 per unit pricing in EMs fell 18% in US$ terms
Figure 216: Ice Cream per cap volume growth Figure 217: Ice Cream per cap value growth (US$)
0.3% 0.2%0.0%
0.1% 0.1%
2.9%
3.9%
2.2%
3.0% 3.0%
0%
1%
2%
3%
4%
5%
1998-2002 2002 -07 2007-12 2002-12 1998-2012
Developed Market universe Emerging Market universe
-2.5%
6.9%
4.0%5.4%
3.1%
-3.9%
13.2%
7.3%
10.2%
6.0%
-6%
-4%
-2%
0%
2%
4%
6%
8%
10%
12%
14%
1998-2002 2002 -07 2007-12 2002-12 1998-2012
Developed Market universe Emerging Market universe
Source: Deutsche Bank; Euromonitor Source: Deutsche Bank; Euromonitor
Figure 216, Figure 217 and Figure 218 breakdown 1998-2012 by per cap volume, value and price/mix growth into various time periods with the theme consistent: weak 1998-2002, strong recovery 2002-2007 and moderation in recovery 2007-2012 with EMs out-performing DMs in all periods ex 1998-2002. Continued volume growth 1998-2002 was undermined by hard currency pricing, with US$ price/mix declining 6.6% in EMs over the period such that per cap values sold fell 3.9% pa 1998-2002.
Figure 218: Ice Cream retail price/mix (US$)
-2.8%
6.7%
4.0%5.3%
3.0%
-6.6%
8.9%
5.0%
6.9%
2.9%
-8%
-6%
-4%
-2%
0%
2%
4%
6%
8%
10%
1998-2002 2002 -07 2007-12 2002-12 1998-2012
Developed Market universe Emerging Market universe
Source: Deutsche Bank; Euromonitor

25 March 2014
Consumer Staples
European Consumer Staples
Page 94 Deutsche Bank AG/London
Home Care: Aggregate data
Aggregate Home Care data In this section we provide aggregate data for air care, toilet care, hand dishwash and auto dishwash, which is more representative of our universe of stocks. In addition, in the subsequent sections we discuss in more detail the individual auto dishwash and air care.
There is a measurement factor in home care we have to be cognisant off: Euromonitor (not unreasonably) measures volume in kilograms. However, as the category develops (products become concentrated; move from powder to liquids/tabs etc) the kilogram weight reduces but the volume (in terms of consumer usage from the lower weight) increases, as does the value per unit.
Taking the reasonable assumption that concentrated products have greater penetration in DMs as opposed to EMs all our conclusions need to be cognisant of this variable: we believe per cap consumption levels in DMs are understated over time and the relative penetration of EMs against DMs overstated with the potential growth of EM per caps greater than appears in the subsequent charts.
We consider home care a strong category irrespective of this negative factor. In subsequent sections we look at auto dishwash and air care individually in an attempt to unwind some of these potential discrepancies and in doing so we conclude they are attractive categories.
Conclusions Noting the caveats above, against slightly declining per cap DM consumption EM per caps have risen steadily from 18% of DMs in 1998 to 31% in 2012. EM per cap growth rates have slowed slightly but are still 3.0% pa over the last five years.
Ex the recurrent theme of weak price/mix 1998-02 EM price/mix in US$ terms has exceeded that of DMs. EM price/mix was 5.9% 2002-2012 against 5.3% in DMs. Over five years to 2012 price/mix slowed to 3.3% in EMs (2.4% in DMs).
Noting we have to be aware of the measurement variables outlined above, price/mix is almost certainly understated in EMs relative to DMs and we would expect to see consistently strong price/mix in EMs, and ahead of that in DMs.
In terms of our medium term assumption we model per cap volume growth of 3.5%. This is higher than the last five years’ 3.0% (impacted by one weak year (2010 – growth of 0.9%)) but lower than the 14 year average of 3.9%. In addition we believe per caps relative of 30% to DMs supports our view – i.e. the relative is set to climb, albeit supported by low per cap growth in DMs.
In terms of price/mix we model 3.0%, slightly above the 2.7% EM average over the last 14 years, but considerably below the DM average of 4.1%.
Figure 219: Home Care Aggregate* retail value (US$46bn)
12.0 11.8
8.3
5.6
3.6 3.4
1.1
0.0
2.0
4.0
6.0
8.0
10.0
12.0
14.0
Asia Pacific Western Europe
North America
Latin America
Middle East and Africa
Eastern Europe
Australasia
Source: Deutsche Bank; Euromonitor; 2012 data; *encompassing Air Care, Toilet Care, Hand Dishwash and Auto Dishwash. Note also includes Insecticides and Polishes; all other data in this section is ex Insecticides and Polishes.

25 March 2014
Consumer Staples
European Consumer Staples
Deutsche Bank AG/London Page 95
Figure 220: Home Care medium term EM per cap revenue growth estimates Per cap volume growth 3.5%
Price/mix 3.0%
Per cap revenue growth 6.6%
Category Rank 14/22
Total EM sales exposure of relevant companies
Unilever 57%
Henkel 45%
RB 36%Source: Deutsche Bank estimates
Figure 221: Home Care* per cap value (US$) by region Figure 222: Home Care* per cap volume by region (kg) 99
81
72
3935
10 9
0
10
20
30
40
50
60
70
80
90
100
Australasia North America
Western Europe
Latin America
Eastern Europe
Asia Pacific Middle East and Africa
21
20
16
13
10
4 4
0
5
10
15
20
25
North America
Western Europe
Latin America
Australasia Eastern Europe
Asia Pacific Middle East and Africa
Source: Deutsche Bank; Euromonitor; 2012 data; *encompassing Air Care, Toilet Care, Hand Dishwash and Auto Dishwash. Note also includes Insecticides and Polishes; all other data in this section is ex Insecticides and Polishes.
Source: Deutsche Bank; Euromonitor; 2012 data; *encompassing Air Care, Toilet Care, Hand Dishwash and Auto Dishwash. Note also includes Insecticides and Polishes; all other data in this section is ex Insecticides and Polishes.
Figure 223: Home Care per cap. consumption indexed Figure 224: Home Care EM per cap. consump. rel. to DM
0
20
40
60
80
100
120
1998
1999
2000
2001
2002
2003
2004
2005
2006
2007
2008
2009
2010
2011
2012
Developed Market universe Emerging Market universe
0%
10%
20%
30%
40%
50%
60%
70%
80%
90%
100%
1998
1999
2000
2001
2002
2003
2004
2005
2006
2007
2008
2009
2010
2011
2012
Source: Deutsche Bank; Euromonitor; encompassing Air Care, Toilet Care, Hand Dishwash and Auto Dishwash. Index takes DM in 1998 as the base at 100 Source: Deutsche Bank; Euromonitor; encompassing Air Care, Toilet Care, Hand Dishwash and Auto
Dishwash

25 March 2014
Consumer Staples
European Consumer Staples
Page 96 Deutsche Bank AG/London
Figure 225: Home Care retail value per unit (indexed) Figure 226: Home Care EM value per unit vs DM (US$)
0
20
40
60
80
100
120
140
160
180
1998
1999
2000
2001
2002
2003
2004
2005
2006
2007
2008
2009
2010
2011
2012
Developed Market universe Emerging Market universe
0%
10%
20%
30%
40%
50%
60%
70%
80%
90%
100%
1998
1999
2000
2001
2002
2003
2004
2005
2006
2007
2008
2009
2010
2011
2012
Source: Deutsche Bank; Euromonitor; encompassing Air Care, Toilet Care, Hand Dishwash and Auto Dishwash. Index takes DM in 1998 as the base at 100 Source: Deutsche Bank; Euromonitor; encompassing Air Care, Toilet Care, Hand Dishwash and Auto
Dishwash
Figure 227: Home Care per cap volume growth Figure 228: Home Care per cap value growth (US$)
-0.1%
0.0% 0.2% 0.1% 0.0%
3.7%
5.0%
3.0%
4.0% 3.9%
-1%
0%
1%
2%
3%
4%
5%
6%
1998-2002 2002 -07 2007-12 2002-12 1998-2012
Developed Market universe Emerging Market universe
1.0%
8.2%
2.6%
5.4%4.1%
-1.6%
14.0%
6.4%
10.1%
6.6%
-4%
-2%
0%
2%
4%
6%
8%
10%
12%
14%
1998-2002 2002 -07 2007-12 2002-12 1998-2012
Developed Market universe Emerging Market universe
Source: Deutsche Bank; Euromonitor; encompassing Air Care, Toilet Care, Hand Dishwash and Auto Dishwash. Source: Deutsche Bank; Euromonitor; encompassing Air Care, Toilet Care, Hand Dishwash and Auto
Dishwash.
EM per caps overstated? Noting our caveats re measurement, per cap volumes in DMs have been flat and in EMs increased by 3.9% pa since 1998 such that EM per cap consumption relative to DMs is now 31%.
Retail value per unit has climbed 2.7% in EMs in US$ terms and 4.1% in DMs reflecting, in our view, trading up in DMs relative to EMs; trading up that will migrate to EMs over time but with an ongoing lag as DMs continue to develop: i.e. EMs are likely to be in ‘catch-up mode’ re innovation for a number of years.
This dynamic has seen the EM retail value per unit relative to DMs decline from c56% in 1998 to 46% in 2012 (Figure 226).
We can argue that this trading up in EMs has started to emerge in that the lower price/mix in EMs relative to DMs over our extended 14 year period is distorted by 1998-2002 where weak EMs impacted pricing in US$ terms. Post 2002 EM US$ pricing has exceeded DMs.
Figure 229: Home Care retail price/mix (US$)
1.1%
8.2%
2.4%
5.3%4.1%
-5.1%
8.6%
3.3%
5.9%
2.7%
-6%
-4%
-2%
0%
2%
4%
6%
8%
10%
1998-2002 2002 -07 2007-12 2002-12 1998-2012
Developed Market universe Emerging Market universe
Source: Deutsche Bank; Euromonitor; encompassing Air Care, Toilet Care, Hand Dishwash and Auto Dishwash.

25 March 2014
Consumer Staples
European Consumer Staples
Deutsche Bank AG/London Page 97
Home Care: Auto Dishwash (Auto DW)
Conclusions While auto-dishwash is currently a small category, it is highly relevant to RB.
We could spend considerable time discussing our analysis of auto-dishwash. Only one conclusion really matters: EM per cap consumption in auto-dishwash (in market’s that are measurable) is 6% of that in DMs. Per cap consumption is too small for Euromonitor to measure in India, China, Nigeria, Pakistan and Indonesia. Figure 230 alone is probably sufficient to establish the potential: Western Europe, North America and Australasia are 88% of global sales: Middle East & Africa and Asia-Pacific (75% of global population) hardly register, as Figure 233 illustrates.
Across our DM universe 50.5% of households own a dishwasher; in India it is 0.7%; in China it is 0.4%.
Additionally, this significant (though perhaps not unexpected) observation in terms of the categories potential almost certainly overstates EM per cap consumption as Euromonitor measures auto dishwash in kilograms. Euromonitor is thus likely to be overstating EM consumption relative to DM as DM’s move to concentrated products.
Finally, taking washing machine penetration in EMs (accepting many washing machines are manual) relative to dish washer penetration (Figure 236), the significant potential of the dishwash category in EMs is even more evident.
The lack of EM data is important and means the analysis in this section is heavily caveated - but not the conclusions - they are clear – this is a strong Staples category in EMs.
Noting caveats concerning the lack of data we model per cap volume growth of 8.2% but with pricing of only 1.3%. The net result is per cap revenue growth approaching 10%. Despite modelling high growth, we believe the risk to our forecasts is to the upside.
Figure 231: Auto DW medium term EM per cap revenue growth estimates Per cap volume growth 8.2%
Price/mix 1.3%
Per cap revenue growth 9.6%
Category Rank 1/22
Total EM sales exposure of relevant companies
RB 36%Source: Deutsche Bank estimates
Euromonitor definition Auto dishwash includes all detergents used in automatic dishwashers.
Figure 230: Auto DW Global retail value (US$6bn)
3.3
1.4
0.3 0.3 0.2 0.2 0.10.0
0.5
1.0
1.5
2.0
2.5
3.0
3.5
Western Europe
North America
Australasia Eastern Europe
Middle East and Africa
Asia Pacific Latin America
Source: Deutsche Bank; Euromonitor; 2012 data

25 March 2014
Consumer Staples
European Consumer Staples
Page 98 Deutsche Bank AG/London
Figure 232: Auto Dishwash per cap value (US$) by region Figure 233: Auto DW per cap volume by region (kg)
10
7
4
10 0 0
0
2
4
6
8
10
12
Australasia Western Europe
North America
Eastern Europe
Latin America
Middle East and Africa
Asia Pacific
1.1
1.0
0.6
0.1
0.0 0.0 0.00.0
0.2
0.4
0.6
0.8
1.0
1.2
North America
Western Europe
Australasia Eastern Europe
Asia Pacific Latin America
Middle East and Africa
Source: Deutsche Bank; Euromonitor; 2012 data Source: Deutsche Bank; Euromonitor; 2012 data
Very significant growth potential Noting the caveats as to data collection, Figure 234 and Figure 235 amply illustrates the potential of Auto Dishwash across our EM universe.
Figure 234: Auto DW per cap. consumption indexed Figure 235: Auto DW EM per cap. consump. rel. to DM
0
20
40
60
80
100
120
1998
1999
2000
2001
2002
2003
2004
2005
2006
2007
2008
2009
2010
2011
2012
Developed Market universe Emerging Market universe
0%
10%
20%
30%
40%
50%
60%
70%
80%
90%
100%19
98
1999
2000
2001
2002
2003
2004
2005
2006
2007
2008
2009
2010
2011
2012
Source: Deutsche Bank; Euromonitor; index takes DM in 1998 as the base at 100 Source: Deutsche Bank; Euromonitor
Per cap consumption relative to DMs across our EM universe is only 3% noting there is insufficient data in a number of markets including India, China, Indonesia, Nigeria and Pakistan (in reality with more data, we may conclude penetration is higher than we disclose here, but we suspect it is only marginal) Ex these markets EM penetration across our universe of EMs was 6%.
In 2025 these markets are respectively the number one, two, four, five and six biggest populations in the world. Together they represent 70% of the world’s population today, and in 2025, with incremental absolute population growth of 552m people to 2025 (176% of the current size of the USA) yet each of these markets is currently too small to register on Euromonitor’s database of auto dishwash consumption.
Clearly macro factors will be a driver of growth but the potential of the auto dishwash category in home care is clearly very significant.

25 March 2014
Consumer Staples
European Consumer Staples
Deutsche Bank AG/London Page 99
Figure 236 serves to illustrate the point further. Recognising that a significant number of washing machines in EMs are manual Figure 236 shows the relative lack of penetration of dishwashers compared to washing machines.
For the EMs shown in Figure 236 the average washing machine penetration is 60%; for dishwashers it is just under 9%. Recognising significant numbers of manual washing machines, washing machine penetration in China is 75% and dishwashers 0.4%. In India, the same stats are 7.3% and 0.7%.
Retail value data: treat with caution Again, noting our caveats, Euromonitor data shows retail values per unit significantly higher in US$ terms in EMs than in DMs (see Figure 237 and Figure 238). This is at odds with what we would expect and is in part likely due to the lack of available data. Given this issue our forecast price/mix assumptions for auto dishwash are very low – we could be materially understating the potential.
Figure 237: Auto DW retail value per unit (indexed) Figure 238: Auto DW EM retail value p. u. vs DM (US$)
0
50
100
150
200
250
300
350
400
1998
1999
2000
2001
2002
2003
2004
2005
2006
2007
2008
2009
2010
2011
2012
Developed Market universe Emerging Market universe
0%
50%
100%
150%
200%
250%
300%
350%
400%
1998
1999
2000
2001
2002
2003
2004
2005
2006
2007
2008
2009
2010
2011
2012
Source: Deutsche Bank ; Euromonitor Source: Deutsche Bank; Euromonitor
Figure 239: Auto DW per cap volume growth Figure 240: Auto DW per cap value growth (US$)
1.4%1.1%
0.0%0.5% 0.8%
10.7% 10.8%
3.7%
7.2%
8.2%
0.0%
2.0%
4.0%
6.0%
8.0%
10.0%
12.0%
1998-2002 2002 -07 2007-12 2002-12 1998-2012
Developed Market universe Emerging Market universe
2.2%
10.2%
4.0%
7.1%
5.6%4.9%
15.9%
7.2%
11.4%
9.5%
0.0%
2.0%
4.0%
6.0%
8.0%
10.0%
12.0%
14.0%
16.0%
18.0%
1998-2002 2002 -07 2007-12 2002-12 1998-2012
Developed Market universe Emerging Market universe
Source: Deutsche Bank; Euromonitor Source: Deutsche Bank; Euromonitor
Figure 236: Penetration per 100 households
0
1020304050
60708090
100
Rus
sia
Arge
ntin
a
Turk
ey
Pola
nd
Chi
na
Mex
ico
Thai
land
Bra
zil
Phi
lippi
nes
Indo
nesi
a
Sout
h Af
rica
Indi
a
Ave
rage
Dishwasher Washing machine
Source: Deutsche Bank; Euromonitor

25 March 2014
Consumer Staples
European Consumer Staples
Page 100 Deutsche Bank AG/London
In terms of volume growth, Figure 239 supports the potential of EMs with volume growth 1998-2012 at 8.2% though we note some slowing in the last five years (to 3.7% against 0% growth in our DM universe) but again the lack of data could be a major distortion.
Figure 241: Auto Dishwash retail price/mix (US$)
0.7%
9.0%
4.0%
6.5%
4.8%
-5.2%
4.6%
3.4%4.0%
1.3%
-6%
-4%
-2%
0%
2%
4%
6%
8%
10%
1998-2002 2002 -07 2007-12 2002-12 1998-2012
Developed Market universe Emerging Market universe
Source: Deutsche Bank; Euromonitor

25 March 2014
Consumer Staples
European Consumer Staples
Deutsche Bank AG/London Page 101
Home Care: Air Care
Conclusions Though not as pronounced air care suffers, like auto dishwash from a lack of data and all conclusions carry a caveat. Irrespective of these caveats air care is a small, but attractive category.
Air care offers similar (though not as pronounced) growth opportunities as auto dishwash. Air care has shown steady per cap growth in EMs from 8% in 1998 to c17% in 2012. Similarly, retail value per cap has increased 11% in US$ terms over the 10 years to 2012.
As Figure 245 shows, the market is all but non-existent on a per cap basis in Asia-Pacific and Middle East & Africa.
In terms of our medium term growth forecasts we model 6.8% for per cap volumes (EM penetration is only 16% of DMs) and pricing, conservatively at 1.0% to generate EM growth of 7.9%. We believe the risk to our forecasts is to the upside, particularly in respect of our price/mix forecasts.
Figure 243: Air Care medium term EM per cap revenue growth estimates Per cap volume growth 6.8%
Price/mix 1.0%
Per cap revenue growth 7.9%
Category Rank 6/22
Total EM sales exposure of relevant companies
Henkel 45%
RB 36%Source: Deutsche Bank estimates
Figure 244: Air Care per cap value (US$) by region Figure 245: Air Care per cap volume by region (kg)
9.5
8.7
5.5
2.0
1.00.5 0.3
0
1
2
3
4
5
6
7
8
9
10
North America
Australasia Western Europe
Eastern Europe
Latin America
Asia Pacific Middle East and Africa
0.4
0.2 0.2
0.1 0.1
0.0 0.00.0
0.1
0.2
0.3
0.4
0.5
North America
Australasia Western Europe
Eastern Europe
Latin America
Asia Pacific Middle East and Africa
Source: Deutsche Bank; Euromonitor; 2012 data Source: Deutsche Bank; Euromonitor; 2012 data
Euromonitor definition Air care is the aggregation of spray/aerosol air fresheners, electric air fresheners, gel air fresheners, liquid air fresheners, candles, car air fresheners and other air care.
Figure 242: Air Care Global retail market (US$10bn)
3.3
2.7
1.9
0.7 0.60.4
0.2
0.0
0.5
1.0
1.5
2.0
2.5
3.0
3.5
North America
Western Europe
Asia Pacific Eastern Europe
Latin America
Middle East and Africa
Australasia
Source: Deutsche Bank; Euromonitor; 2012 data

25 March 2014
Consumer Staples
European Consumer Staples
Page 102 Deutsche Bank AG/London
Consistent Growth in EMs Air care volume per capita in EMs has grown c7% pa since 2002 though growth has slowed in the five years to 2012 (2.1% per cap from 12.5% in the five years to 2007). Similarly, there has been steady growth in DM per cap consumption, rising 1.4% CAGR over the period, although per cap volumes declined 2007-2012. Note that Euromonitor measures volume in kilograms and as products become concentrated this may explain the decline in DMs and lower growth in EMs in recent years.
Despite the stronger growth in EMs per cap consumption is still only 17% of that in DMs, offering substantial scope for growth.
Figure 246: Air Care per cap. consumption indexed Figure 247: Air Care EM per cap. consump. rel. to DM
0
20
40
60
80
100
120
140
1998
1999
2000
2001
2002
2003
2004
2005
2006
2007
2008
2009
2010
2011
2012
Developed Market univerese Emerging Market universe
0%
10%
20%
30%
40%
50%
60%
70%
80%
90%
100%
1998
1999
2000
2001
2002
2003
2004
2005
2006
2007
2008
2009
2010
2011
2012
Source: Deutsche Bank; Euromonitor; index takes DM in 1998 as the base at 100 Source: Deutsche Bank; Euromonitor
Retail values have increased in DMs at a compound rate of 5% pa since 1998, with mix (innovation) a major driver. Values slowed in 2007-2012 following strong growth 2002-2007. Retail values in our EM universe have climbed 11% in the last 10 years though the rate has slowed over the last five (to 6.1%) it remains very healthy. EM prices are currently c59% of DM in US$ terms having been stable around this level since 2007.
Figure 248: Air Care retail value per unit US$ (indexed) Figure 249: Air Care EM retail value per unit vs DM (US$)
0
20
40
60
80
100
120
140
160
180
1998
1999
2000
2001
2002
2003
2004
2005
2006
2007
2008
2009
2010
2011
2012
Developed Market univerese Emerging Market universe
0%
10%
20%
30%
40%
50%
60%
70%
80%
90%
100%
1998
1999
2000
2001
2002
2003
2004
2005
2006
2007
2008
2009
2010
2011
2012
Source: Deutsche Bank ; Euromonitor; index takes DM in 1998 as the base at 100 Source: Deutsche Bank; Euromonitor

25 March 2014
Consumer Staples
European Consumer Staples
Deutsche Bank AG/London Page 103
Figure 250: Air Care per cap volume growth Figure 251: Air Care per cap value growth (US$)
3.4%2.4%
-1.1%
0.6%1.4%
5.7%
12.5%
2.1%
7.2% 6.8%
-2%
0%
2%
4%
6%
8%
10%
12%
14%
1998-2002 2002 -07 2007-12 2002-12 1998-2012
Developed Market universe Emerging Market universe
3.3%
10.1%
1.8%
5.9%5.1%
-1.2%
16.5%
6.1%
11.2%
7.5%
-4%
-2%
0%
2%
4%
6%
8%
10%
12%
14%
16%
18%
1998-2002 2002 -07 2007-12 2002-12 1998-2012
Developed Market universe Emerging Market universe
Source: Deutsche Bank; Euromonitor Source: Deutsche Bank; Euromonitor
Figure 252 shows price/mix in Air Care in EMs has been low since 1998 in US$ terms at only 0.8% pa impacted significantly by the post EM crisis of 1997/8. Since then, prices have risen consistently: 3.6% pa for the five years to 2007 and 3.9% for the five years to 2012.
Figure 252: Air Care per cap price/mix (US$)
-0.1%
7.5%
3.0%
5.2%
3.7%
-6.5%
3.6% 3.9% 3.7%
0.7%
-8%
-6%
-4%
-2%
0%
2%
4%
6%
8%
1998-2002 2002 -07 2007-12 2002-12 1998-2012
Developed Market universe Emerging Market universe
Source: Deutsche Bank; Euromonitor

25 March 2014
Consumer Staples
European Consumer Staples
Page 104 Deutsche Bank AG/London
Personal Care
Conclusions We believe Euromonitor data likely overstates personal care EM per caps and understates DMs on a ‘like-for-like’ basis.
In terms of medium term growth we model per cap volumes in EMs climbing 3.2% and price/mix of 3.0%. 3.2% volume growth is in line with the 14 year average albeit slightly ahead of the last five year (3.0%). Per caps in EMs relative to DMs are approaching 50% but the progression upward has been very consistent; we expect it to continue. Middle East & Africa dominate the potential of the category (Figure 256).
Price/mix of 3.8% is above the 14 year average, 2.7% and is in line with the last five years. This may be considered aggressive but the risk to our per cap volume growth is likely to the upside and price/mix of 3.8% is supported by unit values in EMs currently less than 40% of those in DMs. In addition, DM price/mix has been 2.9% over the last 14 years.
Figure 254: Personal Care medium term EM per cap revenue growth ests. Per cap volume growth 3.0%
Price/mix 3.8%
Per cap revenue growth 6.9%
Category Rank 9/22
Total EM sales exposure of relevant companies
Unilever 57%
Henkel 45%
Beiersdorf 45%
L’Oreal 36%
RB 36%Source: Deutsche Bank estimates
Figure 255: Personal Care per cap value (US$) by region Figure 256: Personal Care per cap volume by region
278
223204
127
83
3118
0
50
100
150
200
250
300
Australasia North America
Western Europe
Latin America
Eastern Europe
Asia Pacific Middle East and Africa
3937
33 33
24
15
6
0
5
10
15
20
25
30
35
40
North America
Western Europe
Australasia Latin America
Eastern Europe
Asia Pacific Middle East and Africa
Source: Deutsche Bank; Euromonitor; 2012 data; ; the aggregation of baby and child-specific products, bath & shower, deodorants, hair care, colour cosmetics, men's grooming, oral hygiene, fragrances, skin care, depilatories and sun care.
Source: Deutsche Bank; Euromonitor; 2012 data; the aggregation of baby and child-specific products, bath & shower, deodorants, hair care, colour cosmetics, men's grooming, oral hygiene, fragrances, skin care, depilatories and sun care. Measured by Euromonitor as ‘alternative units’
Figure 253: Global Personal Care Mkt. (US$433bn)
122
100
78 76
2823
8
0
25
50
75
100
125
Asia Pacific Western Europe
North America
Latin America
Eastern Europe
Middle East and Africa
Australasia
Source: Deutsche Bank; Euromonitor; 2012 data; The aggregation of baby and child-specific products, bath & shower, deodorants, hair care, colour cosmetics, men's grooming, oral hygiene, fragrances, skin care, depilatories and sun care.

25 March 2014
Consumer Staples
European Consumer Staples
Deutsche Bank AG/London Page 105
Euromonitor definition Personal care is the aggregation of baby and child-specific products, bath & shower, deodorants, hair care, colour cosmetics, men's grooming, oral hygiene, fragrances, skin care, depilatories and sun care. Accordingly, it is representative of the personal care category in aggregate rather than reflective of any individual category. In the subsequent sections we consider skin care and shampoo as individual categories.
We discussed in some detail the measurement issues faced in HPC earlier, we face the same issues here (Euromonitor measures Beauty & Personal care in ‘retail volume alternative units’) with EMs likely to be overstated in terms of per caps.
EM Per Cap growth but potential remains DM per cap consumption has grown over the last fourteen years at a CAGR of 0.6% pa. The growth rate has been very consistent: over the 14-year period 1998-2012 all but three years were between 0% and 1.5% growth per annum. EM per cap volumes have grown at rate of 3.2% pa. Again the rate of growth has been relatively consistent with 9 years between 2.8% and 3.9%.
Noting our view per caps are understated in DMs and overstated in EMs, per cap consumption in EMs relative to DMs is now 49% of those in DMs against 35% in 1998.
Figure 257: Personal Care per cap consumption Figure 258: Personal Care per cap consumption
0
10
20
30
40
50
60
70
80
90
100
110
120
1998
1999
2000
2001
2002
2003
2004
2005
2006
2007
2008
2009
2010
2011
2012
0%
10%
20%
30%
40%
50%
60%
70%
80%
90%
100%
1998
1999
2000
2001
2002
2003
2004
2005
2006
2007
2008
2009
2010
2011
2012
Source: Indexed; Deutsche Bank; Euromonitor; index takes DM in 1998 as the base at 100; The aggregation of baby and child-specific products, bath & shower, deodorants, hair care, colour cosmetics, men's grooming, oral hygiene, fragrances, skin care, depilatories and sun care.
Source: Indexed; Deutsche Bank; Euromonitor; The aggregation of baby and child-specific products, bath & shower, deodorants, hair care, colour cosmetics, men's grooming, oral hygiene, fragrances, skin care, depilatories and sun care. Measured by Euromonitor as ‘alternative units’
In terms of value per unit sold, EMs have grown 2.7% over the last fourteen years, marginally behind developed markets at 2.9%. As a consequence unit values in EMs were 39% of those in DMs against 40% in 1998 in US$ terms.
As EMs develop there is a two-way pull:
existing consumers trade up to higher products
new consumers enter at (very) low price points.
Noting we believe EM per caps are overstated this maturing process is almost certainly diluting the underlying price/mix story in EM beauty/personal care.

25 March 2014
Consumer Staples
European Consumer Staples
Page 106 Deutsche Bank AG/London
Figure 259: Personal Care retail value per unit Figure 260: Personal Care EM value p.u. vs DM US$
0
20
40
60
80
100
120
140
160
1998
1999
2000
2001
2002
2003
2004
2005
2006
2007
2008
2009
2010
2011
2012
Developed Market universe Emerging Market universe
0%
10%
20%
30%
40%
50%
60%
70%
80%
90%
100%
1998
1999
2000
2001
2002
2003
2004
2005
2006
2007
2008
2009
2010
2011
2012
Source: Indexed; Deutsche Bank; Euromonitor; index takes DM in 1998 as the base at 100; The aggregation of baby and child-specific products, bath & shower, deodorants, hair care, colour cosmetics, men's grooming, oral hygiene, fragrances, skin care, depilatories and sun care.
Source: Deutsche Bank; Euromonitor; The aggregation of baby and child-specific products, bath & shower, deodorants, hair care, colour cosmetics, men's grooming, oral hygiene, fragrances, skin care, depilatories and sun care.
Figure 261: Personal Care per cap volume growth Figure 262: Personal Care per cap value growth (US$)
1.3%
0.7%
0.1%0.4%
0.6%
2.2%
4.1%
3.0%
3.6%
3.2%
0%
1%
2%
3%
4%
5%
1998-2002 2002 -07 2007-12 2002-12 1998-2012
Developed Market universe Emerging Market universe
1.1%
7.2%
2.0%
4.6%3.6%
-4.2%
13.8%
6.9%
10.3%
6.0%
-6%
-4%
-2%
0%
2%
4%
6%
8%
10%
12%
14%
16%
1998-2002 2002 -07 2007-12 2002-12 1998-2012
Developed Market universe Emerging Market universe
Source: Deutsche Bank; Euromonitor; The aggregation of baby and child-specific products, bath & shower, deodorants, hair care, colour cosmetics, men's grooming, oral hygiene, fragrances, skin care, depilatories and sun care. Measured by Euromonitor as ‘alternative units’
Source: Deutsche Bank; Euromonitor; The aggregation of baby and child-specific products, bath & shower, deodorants, hair care, colour cosmetics, men's grooming, oral hygiene, fragrances, skin care, depilatories and sun care.
In Figure 261, Figure 262 and Figure 263 we break down the development of the personal care category into various time frames 1998-2002.
As discussed earlier we see consistent volume growth in EMs with DM growth slowing (subject to our earlier caveats). Again 1998-2002 saw negative pricing in EMs in US$ terms.
As we have argued with other categories, data within the period 2007-2012 is probably most representative of the potential in personal Care over the long term as the recovery post the EM crisis of 1997/8 unwound and markets returned to steady state. Here we see volumes grew 3% pa (Figure 261), price/mix was 3.8% to drive US$ revenue growth per capita of 6.9%.
Figure 263: Personal Care retail price/mix (US$)
-0.2%
6.5%
1.9%
4.2%2.9%
-6.2%
9.3%
3.8%
6.5%
2.7%
-8%
-6%
-4%
-2%
0%
2%
4%
6%
8%
10%
1998-2002 2002 -07 2007-12 2002-12 1998-2012
Source: Deutsche Bank; Euromonitor; The aggregation of baby and child-specific products, bath & shower, deodorants, hair care, colour cosmetics, men's grooming, oral hygiene, fragrances, skin care, depilatories and sun care.
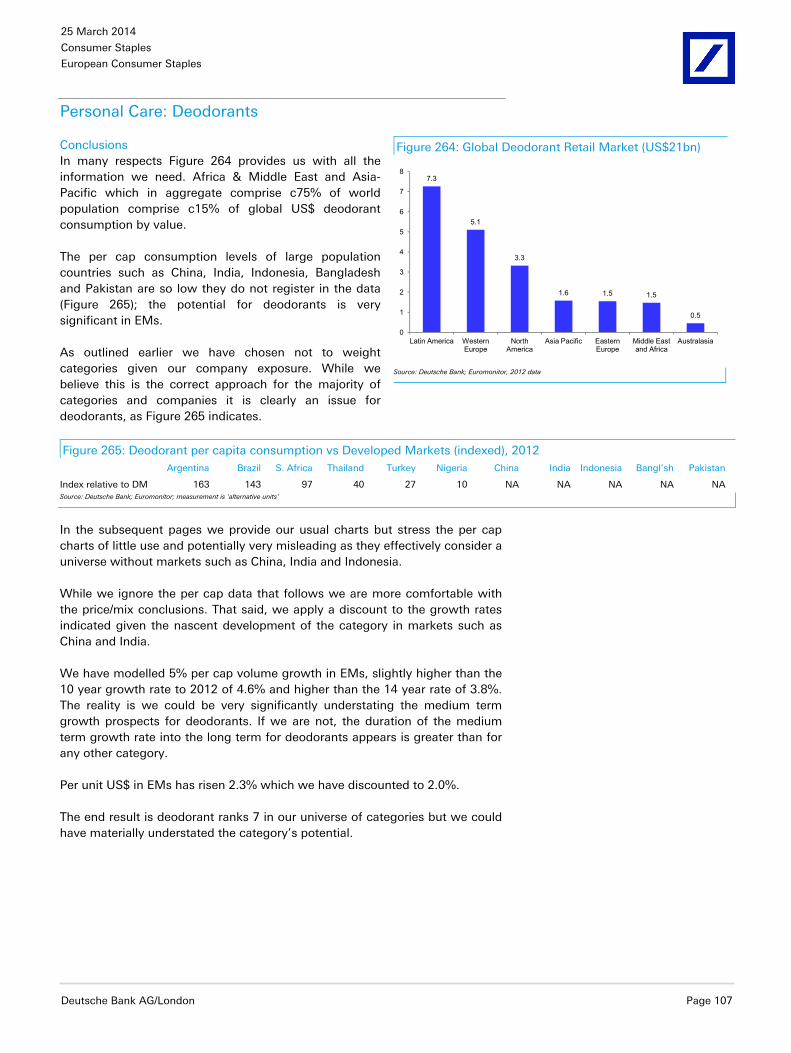
25 March 2014
Consumer Staples
European Consumer Staples
Deutsche Bank AG/London Page 107
Personal Care: Deodorants
Conclusions In many respects Figure 264 provides us with all the information we need. Africa & Middle East and Asia-Pacific which in aggregate comprise c75% of world population comprise c15% of global US$ deodorant consumption by value.
The per cap consumption levels of large population countries such as China, India, Indonesia, Bangladesh and Pakistan are so low they do not register in the data (Figure 265); the potential for deodorants is very significant in EMs.
As outlined earlier we have chosen not to weight categories given our company exposure. While we believe this is the correct approach for the majority of categories and companies it is clearly an issue for deodorants, as Figure 265 indicates.
Figure 265: Deodorant per capita consumption vs Developed Markets (indexed), 2012 Argentina Brazil S. Africa Thailand Turkey Nigeria China India Indonesia Bangl’sh Pakistan
Index relative to DM 163 143 97 40 27 10 NA NA NA NA NASource: Deutsche Bank; Euromonitor; measurement is ‘alternative units’
In the subsequent pages we provide our usual charts but stress the per cap charts of little use and potentially very misleading as they effectively consider a universe without markets such as China, India and Indonesia.
While we ignore the per cap data that follows we are more comfortable with the price/mix conclusions. That said, we apply a discount to the growth rates indicated given the nascent development of the category in markets such as China and India.
We have modelled 5% per cap volume growth in EMs, slightly higher than the 10 year growth rate to 2012 of 4.6% and higher than the 14 year rate of 3.8%. The reality is we could be very significantly understating the medium term growth prospects for deodorants. If we are not, the duration of the medium term growth rate into the long term for deodorants appears is greater than for any other category.
Per unit US$ in EMs has risen 2.3% which we have discounted to 2.0%.
The end result is deodorant ranks 7 in our universe of categories but we could have materially understated the category’s potential.
Figure 264: Global Deodorant Retail Market (US$21bn)
7.3
5.1
3.3
1.6 1.5 1.5
0.5
0
1
2
3
4
5
6
7
8
Latin America Western Europe
North America
Asia Pacific Eastern Europe
Middle East and Africa
Australasia
Source: Deutsche Bank; Euromonitor, 2012 data

25 March 2014
Consumer Staples
European Consumer Staples
Page 108 Deutsche Bank AG/London
Figure 266: Deodorant medium term EM per cap revenue growth ests. Per cap volume growth 5.0%
Price/mix 2.0%
Per cap revenue growth 7.1%
Category Rank 7/22
Total EM sales exposure of relevant companies
Unilever 57%
Henkel 45%
Beiersdorf 45%
L’Oreal 36%Source: Deutsche Bank estimates
Figure 267: Deodorant per cap value (US$) by region Figure 268: Deodorant per cap volume by region
16.6
12.1
10.49.5
4.7
1.10.4
0
2
4
6
8
10
12
14
16
18
Australasia Latin America
Western Europe
North America
Eastern Europe
Middle East and Africa
Asia Pacific
3.3
2.8 2.8
1.9
1.6
0.40.2
0.0
0.5
1.0
1.5
2.0
2.5
3.0
3.5
Australasia Latin America
Western Europe
North America
Eastern Europe
Middle East and Africa
Asia Pacific
Source: Deutsche Bank; Euromonitor; 2012 data Source: Deutsche Bank; Euromonitor; 2012 data; measurement is ‘alternative units’
Euromonitor definition The deodorant category includes deodorants and antiperspirants in cream, pump, roll-on, spray, stick and wipe format.
Charts To reiterate the comment above, we consider US$ per unit value data to be relevant. Per cap data is potentially very misleading: we believe the growth rate potential of deodorant is significantly greater than the following charts would suggest.
Figure 269: Deodorant per cap consumption indexed Figure 270: Deodorant EM per cap. consum. rel. to DM
0
20
40
60
80
100
120
140
160
1998
1999
2000
2001
2002
2003
2004
2005
2006
2007
2008
2009
2010
2011
2012
Developed Market universe Emerging Market universe
0%
10%
20%
30%
40%
50%
60%
70%
80%
90%
100%
1998
1999
2000
2001
2002
2003
2004
2005
2006
2007
2008
2009
2010
2011
2012
Source: Deutsche Bank; Euromonitor; index takes DM in 1998 as the base at 100 Source: Deutsche Bank; Euromonitor; measurement is ‘alternative units’

25 March 2014
Consumer Staples
European Consumer Staples
Deutsche Bank AG/London Page 109
Figure 271: Deodorant retail value per unit (indexed) Figure 272: Deodorant EM retail val. p.u. vs DM US$
0
20
40
60
80
100
120
140
1998
1999
2000
2001
2002
2003
2004
2005
2006
2007
2008
2009
2010
2011
2012
Developed Market universe Emerging Market universe
0%
10%
20%
30%
40%
50%
60%
70%
80%
90%
100%
1998
1999
2000
2001
2002
2003
2004
2005
2006
2007
2008
2009
2010
2011
2012
Source: Deutsche Bank; Euromonitor; index takes DM in 1998 as the base at 100 Source: Deutsche Bank; Euromonitor
Figure 273: Deodorant per cap volume growth Figure 274: Deodorant per cap value growth (US$)
2.6%
2.0% 2.3% 2.1% 2.2%
1.6%
5.8%
3.5%
4.6%
3.8%
0%
1%
2%
3%
4%
5%
6%
1998-2002 2002 -07 2007-12 2002-12 1998-2012
Developed Market universe Emerging Market universe
1.2%
7.8%
2.5%
5.1%4.0%
-6.0%
14.0%
8.8%
11.4%
6.1%
-8%
-4%
0%
4%
8%
12%
16%
1998-2002 2002 -07 2007-12 2002-12 1998-2012
Developed Market universe Emerging Market universe
Source: Deutsche Bank; Euromonitor; measurement is ‘alternative units’ Source: Deutsche Bank; Euromonitor
Figure 275: Deodorant retail price/mix (US$)
-1.3%
5.7%
0.3%
3.0%1.7%
-7.5%
7.8%
5.1%
6.4%
2.3%
-8%
-6%
-4%
-2%
0%
2%
4%
6%
8%
1998-2002 2002 -07 2007-12 2002-12 1998-2012
Developed Market universe Emerging Market universe
Source: Deutsche Bank; Euromonitor

25 March 2014
Consumer Staples
European Consumer Staples
Page 110 Deutsche Bank AG/London
Personal Care: Skin Care
Conclusions Per cap consumption in EMs is 30% of that in DMs. DM per cap volumes have been stable the last five years having risen steadily prior to 2007. EM per cap consumption has climbed 6.7% over the last fourteen years and 4.9% in the last five.
Consumption has been strong; pricing (surprisingly) less so. Price/mix in DMs has averaged 2.0% in US$ terms and 1.5% in EMs. That said, DM price/mix has been 3.8% over the last 10 years in US$ terms and EM 4.4%.
Over the medium term we model per cap consumption in EMs increasing 6.0% pa, below the 14 year average but ahead of the last five years (4.9%). 2009 per caps grew 1% but 2008, 2010, 2011 and 2012 grew 7.5%, 5.6%, 5.6% and 5.3% respectively.
6.0% is relatively aggressive but is supported by EM per cap consumption relative to DMs of only 30%; relatives which have climbed every year ex 1999 (when EM per caps climbed but for that one year climbed at a lower rate than in DMs). In addition, absolute EM skin care per cap consumption has climbed every year since 1998.
To the extent we may have been aggressive with EM per caps (we argue not) our pricing assumption is not aggressive: we model price/mix only increasing 2.0% pa. This is ahead of the last 14 years (1.5%) but is in line with DMs over the last 14 years (noting DMs were 3.8% over the last 10 years). In line with DMs at 2.0% is only sufficient to maintain relative per unit pricing (EMs vs DMs) at 43%: this is likely too low – our skin care price/mix assumptions are conservative.
In aggregate we are very comfortable with our medium term US$ skin care EM per cap revenue growth assumptions.
Figure 277: Skin Care medium term EM per cap revenue growth ests. Per cap volume growth 6.0%
Price/mix 2.0%
Per cap revenue growth 8.1%
Category Rank 4/22
Total EM sales exposure of relevant companies
Unilever 57%
Beiersdorf 45%
L’Oreal 36%Source: Deutsche Bank estimates
Figure 276: Global Skin Care Market (US$99bn)
45
21
1310
53 2
0
5
10
15
20
25
30
35
40
45
50
Asia Pacific Western Europe
North America
Latin America
Eastern Europe
Middle East and Africa
Australasia
Source: Deutsche Bank; Euromonitor

25 March 2014
Consumer Staples
European Consumer Staples
Deutsche Bank AG/London Page 111
China & India Chinese per caps are just below the EM average of 24% against DMs having compounded at 14.3% over the last 14 years and 12.5% in the last 10. India is considerably less developed. Per caps are 7% of those in DMs with India’s growth below China’s: 5.1% pa over the last 14 years and 7.2% pa over the last 10.
China offers marginally higher growth on a per cap basis than the EM average but India is considerably behind. Unilever is particularly well placed with its Indian skew via Hindustan Lever though L’Oreal and Beiersdorf have some upside via India but have a greater skew to China. Though compound growth in India is just in line with the EM average the immaturity of the market on a per cap basis suggests Unilever’s skin care business will grow faster than the assumptions outlined in Figure 277 and could approach 9.0%.
Figure 278: Skin Care per cap value (US$) by region Figure 279: Skin Care per cap volume by region
27.6
24.823.7
5.5 4.7 4.3
1.1
0
5
10
15
20
25
30
Australasia North America
Western Europe
Latin America
Eastern Europe
Asia Pacific Middle East and Africa
3.3
2.9
2.5
1.2
0.70.5
0.1
0.0
0.5
1.0
1.5
2.0
2.5
3.0
3.5
North America
Western Europe
Australasia Eastern Europe
Latin America
Asia Pacific Middle East and Africa
Source: Deutsche Bank; Euromonitor; 2012 data Source: Deutsche Bank; Euromonitor; 2012 data; measurement is ‘alternative units’
Euromonitor Definition Skin care is the aggregation of facial care, body care and hand care and includes: firming/anti-cellulite products; general purpose body care; acne treatments; facial moisturisers; anti-agers; facial cleansers; toners; face masks; lip care; hand moisturisers; combination hand and nail products; therapeutic and emollient moisturisers formulated to sooth and hydrate very dry skin or skin prone to redness, irritation or eczema.
Figure 280: Skin Care per cap consumption indexed Figure 281: Skin Care EM per cap. consum. rel. to DM
0
20
40
60
80
100
120
140
160
1998
1999
2000
2001
2002
2003
2004
2005
2006
2007
2008
2009
2010
2011
2012
Developed Market universe Emerging Market universe
0%
10%
20%
30%
40%
50%
60%
70%
80%
90%
100%
1998
1999
2000
2001
2002
2003
2004
2005
2006
2007
2008
2009
2010
2011
2012
Source: Deutsche Bank; Euromonitor; index takes DM in 1998 as the base at 100 Source: Deutsche Bank; Euromonitor
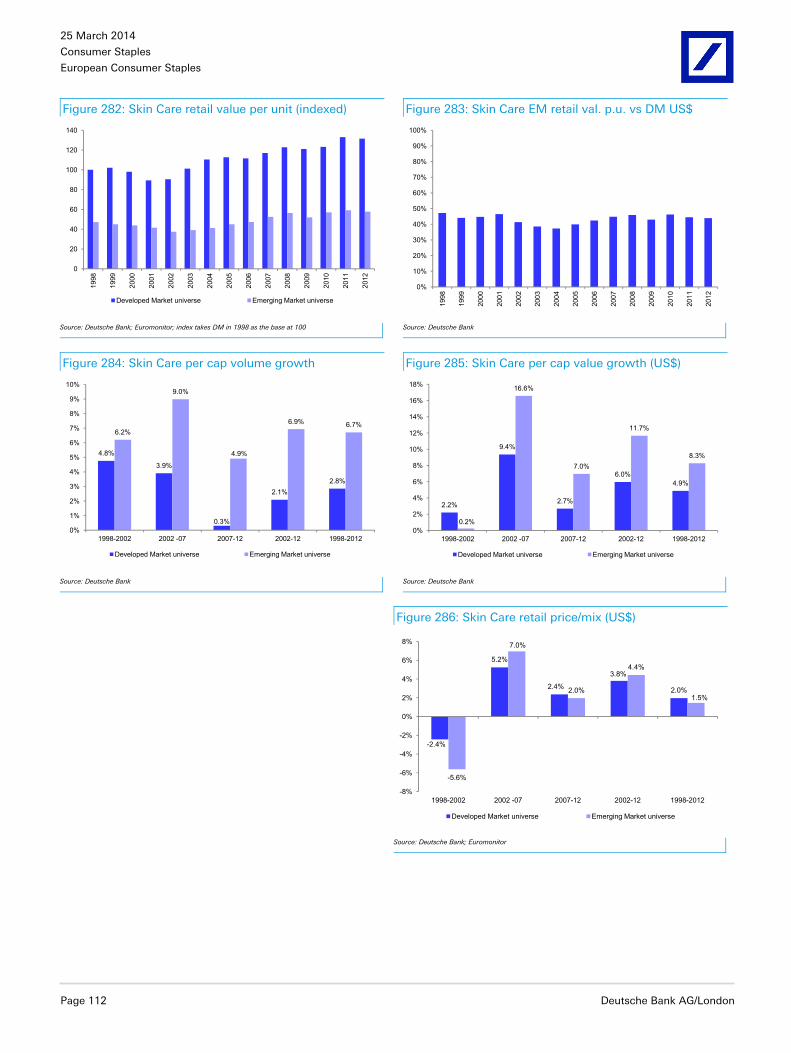
25 March 2014
Consumer Staples
European Consumer Staples
Page 112 Deutsche Bank AG/London
Figure 282: Skin Care retail value per unit (indexed) Figure 283: Skin Care EM retail val. p.u. vs DM US$
0
20
40
60
80
100
120
140
1998
1999
2000
2001
2002
2003
2004
2005
2006
2007
2008
2009
2010
2011
2012
Developed Market universe Emerging Market universe
0%
10%
20%
30%
40%
50%
60%
70%
80%
90%
100%
1998
1999
2000
2001
2002
2003
2004
2005
2006
2007
2008
2009
2010
2011
2012
Source: Deutsche Bank; Euromonitor; index takes DM in 1998 as the base at 100 Source: Deutsche Bank
Figure 284: Skin Care per cap volume growth Figure 285: Skin Care per cap value growth (US$)
4.8%
3.9%
0.3%
2.1%2.8%
6.2%
9.0%
4.9%
6.9% 6.7%
0%
1%
2%
3%
4%
5%
6%
7%
8%
9%
10%
1998-2002 2002 -07 2007-12 2002-12 1998-2012
Developed Market universe Emerging Market universe
2.2%
9.4%
2.7%
6.0%4.9%
0.2%
16.6%
7.0%
11.7%
8.3%
0%
2%
4%
6%
8%
10%
12%
14%
16%
18%
1998-2002 2002 -07 2007-12 2002-12 1998-2012
Developed Market universe Emerging Market universe
Source: Deutsche Bank Source: Deutsche Bank
Figure 286: Skin Care retail price/mix (US$)
-2.4%
5.2%
2.4%
3.8%
2.0%
-5.6%
7.0%
2.0%
4.4%
1.5%
-8%
-6%
-4%
-2%
0%
2%
4%
6%
8%
1998-2002 2002 -07 2007-12 2002-12 1998-2012
Developed Market universe Emerging Market universe
Source: Deutsche Bank; Euromonitor

25 March 2014
Consumer Staples
European Consumer Staples
Deutsche Bank AG/London Page 113
Personal Care: Shampoo
Conclusions Per cap consumption in shampoos is c50% of that in DMs leaving significant scope for growth. Per caps have climbed from less than 30% in EMs in 1998 to their current levels suggesting strong fundamentals in EMs. Price/mix per unit has been 1.2% pa in EMs with EM pricing in US$ terms c70% of that in DMs.
EM per cap’s are higher than we may have expected but that does not deter a positive stance given the basic consumer need met by shampoo (if, sadly, irrelevant to the author).
Based on recent data (2007-2012) we expect per caps in EMs to limb 4.7% pa over the medium/long-term and price/mix to be in the region of 2% providing per cap value growth in EMs in the region of 6.8% pa.
Figure 288: Shampoo medium term EM per cap revenue growth ests. Per cap volume growth 4.7%
Price/mix 2.0%
Per cap revenue growth 6.8%
Category Rank 12/22
Total EM sales exposure of relevant companies
Unilever 57%
Henkel 45%
L’Oreal 36%Source: Deutsche Bank estimates
China, India and Indonesia: L’Oreal and Unilever to outperform EM universe A number of the companies in our universe have sizeable shampoo businesses in China, India and Indonesia including L’Oreal and Unilever. L’Oreal’s EM sales are c33% in these three markets and Unilever c25%.
Figure 289 and Figure 290 breakout China, India and Indonesia alongside the total EM universe showing per cap consumption and retail value per unit relative to DMs.
We see that while China and Indonesia are below, but close to the EM universe in terms of per cap consumption relative and value per unit relative to DMs, India lags significantly in terms of per cap penetration. EM per caps were c49% of those of DMs in 2012, China was 42%, Indonesia 37%. India was 12% having grown from 5% in 1998... and there are 1.3bn people in India.
In terms of retail value per unit, in 2012 EMs were 62% of DMs, China 55%, Indonesia 41% and India 51% in US$ terms
Unilever is extremely well placed (primarily because of India) and is likely to grow its EM shampoo EM per capita revenue materially ahead of the EM average; we estimate Unilever will grow its EM shampoo business by c7.5% pa.
Figure 287: Global Shampoo Retail Market (US$26bn)
9.6
5.14.7
2.9
2.01.4
0.3
0
1
2
3
4
5
6
7
8
9
10
Asia Pacific Latin America
Western Europe
North America
Eastern Europe
Middle East and Africa
Australasia
Source: Deutsche Bank; Euromonitor, 2012 data

25 March 2014
Consumer Staples
European Consumer Staples
Page 114 Deutsche Bank AG/London
Figure 289: Shampoo EM per caps relative to DMs Figure 290: Shampoo EM value per unit relative to DMs
0%
10%
20%
30%
40%
50%
60%
70%
80%
90%
100%
1998
1999
2000
2001
2002
2003
2004
2005
2006
2007
2008
2009
2010
2011
2012
Emerging Market universe China Indonesia India
0%
10%
20%
30%
40%
50%
60%
70%
80%
90%
100%
1998
1999
2000
2001
2002
2003
2004
2005
2006
2007
2008
2009
2010
2011
2012
Emerging Market universe China Indonesia India
Source: Deutsche Bank estimates; Euromonitor Source: Deutsche Bank estimates; Euromonitor (US$ terms)
Euromonitor Definition Shampoo includes standard shampoos and medicated shampoos.
Steadily increasing EM per cap penetration Per cap consumption has increased steadily in EMs (4.7% pa) with per cap growth in DMs of 0.6% pa (Figure 293 and Figure 294). As a consequence per caps in our EM universe are now just under 50% of those in DMs, having risen from 28% in 1998. EM per caps in our universe has increased in all but two of the last fourteen years (1999 and 2011).
Figure 291: Shampoo per cap value (US$) by region Figure 292: Shampoo per cap volume by region (ml) 11.9
9.7
8.5 8.3
5.9
2.4
1.1
0
2
4
6
8
10
12
Australasia Western Europe
Latin America
North America
Eastern Europe
Asia Pacific Middle East and Africa
790 787 761
558 553
218
96
0
100
200
300
400
500
600
700
800
Latin America
Western Europe
North America
Australasia Eastern Europe
Asia Pacific Middle East and Africa
Source: Deutsche Bank; Euromonitor; 2012 data Source: Deutsche Bank; Euromonitor; 2012 data

25 March 2014
Consumer Staples
European Consumer Staples
Deutsche Bank AG/London Page 115
Figure 293: Shampoo per cap consumption indexed Figure 294: Shampoo EM p. c. consump. rel. to DM (ltrs)
0
20
40
60
80
100
120
1998
1999
2000
2001
2002
2003
2004
2005
2006
2007
2008
2009
2010
2011
2012
Developed Market universe Emerging Market universe
0%
10%
20%
30%
40%
50%
60%
70%
80%
90%
100%
1998
1999
2000
2001
2002
2003
2004
2005
2006
2007
2008
2009
2010
2011
2012
Source: Deutsche Bank; Euromonitor; index takes DM in 1998 as the base at 100; ex India and Philippines from our EM universe Source: Deutsche Bank; Euromonitor; ex India and Philippines from our EM universe
In terms of price/mix we see a familiar pattern with price/mix in US$ terms decreasing in DMs and EMs before increasing to 2008 from which time it has been stable point to point 2008 and 2012. EM pricing over the period has averaged 1.2% pa and in DMs 2% per annum such that price per unit in EMs has been c60% of that in DMs since 2007 (Figure 296).
Figure 295: Shampoo retail value per unit (indexed) Figure 296: Shampoo EM retail val. per unit. vs DM US$
0
20
40
60
80
100
120
140
160
1998
1999
2000
2001
2002
2003
2004
2005
2006
2007
2008
2009
2010
2011
2012
Developed Market universe Emerging Market universe
0%
10%
20%
30%
40%
50%
60%
70%
80%
90%
100%
1998
1999
2000
2001
2002
2003
2004
2005
2006
2007
2008
2009
2010
2011
2012
Source: Deutsche Bank; Euromonitor; index takes DM in 1998 as the base at 100; ex India and Philippines from our EM universe Source: Deutsche Bank; Euromonitor; ex India and Philippines from our EM universe
Figure 297: Shampoo per cap volume growth Figure 298: Shampoo per cap value growth (US$)
1.7%
0.6%
-0.3%
0.1%0.6%
4.0%
6.0%
4.0%
5.0%4.7%
-1%
0%
1%
2%
3%
4%
5%
6%
7%
1998-2002 2002 -07 2007-12 2002-12 1998-2012
Developed Market universe Emerging Market universe
-0.3%
6.1%
1.5%
3.8%2.6%
-4.2%
14.0%
6.6%
10.2%
5.9%
-6%
-4%
-2%
0%
2%
4%
6%
8%
10%
12%
14%
16%
1998-2002 2002 -07 2007-12 2002-12 1998-2012
Developed Market universe Emerging Market universe
Source: Deutsche Bank; Euromonitor; ex India and Philippines from our EM universe Source: Deutsche Bank; Euromonitor; ex India and Philippines from our EM universe

25 March 2014
Consumer Staples
European Consumer Staples
Page 116 Deutsche Bank AG/London
Adjusting for the distortion of 1998-2002 (on the downside) and 2002-20007 (the subsequent recovery) 2007-2012 is perhaps indicative of the long-term potential of EM volume/value and price/mix as per Figure 297 to Figure 299; ie 4% volume, 2-2.5% price/mix c6.5% value growth per cap.
Figure 299: Shampoo retail price/mix (US$)
-1.9%
5.5%
1.8%
3.6%2.0%
-7.8%
7.6%
2.5%
5.0%
1.2%
-10%
-8%
-6%
-4%
-2%
0%
2%
4%
6%
8%
10%
1998-2002 2002 -07 2007-12 2002-12 1998-2012
Developed Market universe Emerging Market universe
Source: Deutsche Bank; Euromonitor; ex India and Philippines from our EM universe

25 March 2014
Consumer Staples
European Consumer Staples
Deutsche Bank AG/London Page 117
Tobacco
Conclusions Tobacco is different; it has pricing power.
We caution against underestimating, over time, the value of that difference witness the sector’s share price performance in since it came into being with the de-merger of BAT Industries in September 1998.
Tobacco has the strongest pricing power of any consumer category based on:
the nature of the product
excise structures
highly consolidated industry
no new entrants in cigarette (we note the potential of new e-cigarette entrants)
The extent of that pricing power is in excess of that shown in Figure 301. Figure 301 shows changes in retail prices. Over the period 1998-2012 tobacco is 4.8% with CSDs and Chocolate Confectionary at 3.2%; but Tobacco benefits from the excise buffer offered by predominately specific excise structures.
Pricing for the manufacturer in tobacco is likely to be in the region of 2x that shown in Figure 301 in EMs, i.e. nearer 10% pa than 5%.
The market is pre-occupied with volume growth in Staples’ EMs (and DMs for that matter). This is a valid premise upon which to invest across the majority of Staples categories, though we are not sure the market really appreciates why; it’s as if volume has become the default mantra without the market thinking (or forgetting) why.
We believe the reason the market focuses on volume, is it is the default measure of growth and by default, quality. In addition:
the market assumes volume growth in DMs is minimal (a very dangerous catch all assumption to apply across all Staples’ categories) and thus when volumes exceed expectations in DMs it is taken well
Figure 300: Global Retail Tobacco market (US$700bn)
295
173
103
61
29 2614
0
50
100
150
200
250
300
Asia Pacific Western Europe
North America
Eastern Europe
Latin America
Middle East and Africa
Australasia
Source: Deutsche Bank; Euromonitor; 2012 data
Figure 301: Retail EM price/mix CAGR (US$)
4.8%
-10%
-8%
-6%
-4%
-2%
0%
2%
4%
6%
8%
10%
12%
1998-2002 2002 -07 2007-12 2002-12 1998-2012
Tob. (ex China) Beer CSDs Bot. W. Whisky Vodka Inst. Coff. Choc. Confec.
Values are retail prices; this materially understates the relative pricing of Tobacco given the excise multiplier. Manufacturer pricing for Tobacco is estimated to be c2x the figure shown
2.2% ex Tobacco
Source: Deutsche Bank; Euromonitor

25 March 2014
Consumer Staples
European Consumer Staples
Page 118 Deutsche Bank AG/London
perceived pricing power in EM’s (as we have discussed) is eroded over time by currency8; though we are far from convinced that the market understands this, rather it is a default position arrived at as EM currencies have de-valued/re-valued with the market overly optimistic when the FX/inflation trade-off is in favour of EMs and excessively pessimistic when this unwinds.
What the market still doesn’t fully appreciate in our view (despite over 15 years of a pure Tobacco sector existing in Europe post the demerger of BAT Industries) is the value of the Tobacco pricing model.
Figure 302: Tobacco and Staples Gross Margin models Tobacco “Average” Staple
Year 1 P&L
Price per unit ($) 1.00 1.00
Volume 1000 1000
CoGS per unit ($) 0.25 0.35
Gross Margin per unit ($)
0.75 0.65
Gross Margin (%) 75% 65%
Gross Margin ($) 750 650
Year 2
Pricing 9.6% 2.2%
Volume -1.5% 5.0%
CoGS 2.0% 2.0%
Year 2 P&L
Price per unit ($) 1.10 1.02
Volume 985 1050
CoGS per unit 0.255 0.357
Gross Margin per unit 0.84 0.66
Gross Margin ($) 829 698
Gross Margin growth 10.5% 7.4%Source: Deutsche Bank
Figure 302 shows a simple gross margin model for Tobacco and the ‘average’ Staples category based on Figure 301. Both categories in Year 1 have a price of $1.00 volume of 1000 with Tobacco’s gross margin 75% and the average Staple 65%. In Year 2 pricing in Tobacco is 9.6% (2x that shown in Figure 301 to account for the Tobacco multiplier premised on specific duty regimes) and 2.2% in ‘average’ Staples. We model volume growth of -1.5% pa in Tobacco (-2.5% per cap plus population growth of c1% pa) and 5% in ‘average’ Staples (against our own 4.2% forecasts ex tobacco). We assume 2% inflation in CoGS for both categories.
Figure 302 shows that despite no volume growth with ‘average’ Staples volumes up 5% the pricing power of Tobacco drives gross margins up by 10.5% with the ‘average’ Staples category ‘only’ growing c7.5%.
8 Noting that if EM currencies are in your favour the combination of volume growth and some underlying pricing can be very powerful, e.g. 2002-2012 as EMs emerged in 2002 from the 1997/8 currency crisis.

25 March 2014
Consumer Staples
European Consumer Staples
Deutsche Bank AG/London Page 119
In terms of our medium term assumption we model per cap EM volumes (ex China) in tobacco declining 2.5% pa, a slightly faster decline than over the last five years. This may be considered aggressive (to the downside) but with more EMs using tobacco excise as a revenue gathering tool (Russia, Brazil, Philippines to name three) we consider it reasonable. In terms of price/mix, as outlined above, we model 2x retail price/mix at the manufacturer level over the last 14 years to drive 6.9% per cap revenue growth in EMs in tobacco.
Euromonitor definition Tobacco covers the three major tobacco sectors: cigarettes, cigars/cigarillos, and smoking tobacco (made up of pipe tobacco and RYO tobacco).
Figure 303: Tobacco medium term EM per cap revenue growth ests. Per cap volume growth -2.5%
Price/mix 9.6%
Per cap revenue growth 6.9%
Category Rank 10/22
Total EM sales exposure of relevant companies
BAT 56%
Imperial 40%Source: Deutsche Bank estimates
High per cap EM consumption Per cap consumption in EMs in Tobacco is relatively high (even adjusting for China in Figure 304 and Figure 305) which will undermine volume growth relative to other categories.
Figure 304: Tobacco per cap. consumption (indexed) Figure 305: Tobacco per cap. consump. (EM rel. to DM)
0
10
20
30
40
50
60
70
80
90
100
1998
1999
2000
2001
2002
2003
2004
2005
2006
2007
2008
2009
2010
2011
2012
DM univerese EM universe EM universe (ex China)
0%
20%
40%
60%
80%
100%
120%
140%
160%
180%
200%
1998
1999
2000
2001
2002
2003
2004
2005
2006
2007
2008
2009
2010
2011
2012
EM univ. consump. rel. to DM China consump. rel. to DMEM univ. consump. rel. to DM (ex China)
Source: Deutsche Bank Euromonitor; index takes DM in 1998 as the base at 100 Source: Deutsche Bank; Euromonitor
Despite a relatively weak volume outlook relative to other Staples categories, the value outlook for tobacco based on Figure 306 and Figure 307 is significant with EM pricing around 20% of DMs. That said, we need to expand on that statement with two observations:

25 March 2014
Consumer Staples
European Consumer Staples
Page 120 Deutsche Bank AG/London
Figure 306: Tobacco retail value per capita (US$) Figure 307: Tobacco EM retail value per unit vs DM
(US$)
0
50
100
150
200
250
300
1998
1999
2000
2001
2002
2003
2004
2005
2006
2007
2008
2009
2010
2011
2012
DM universe EM universe China EM universe ex China
0%
5%
10%
15%
20%
25%
30%
35%
1998
1999
2000
2001
2002
2003
2004
2005
2006
2007
2008
2009
2010
2011
2012
EM universe China EM universe ex China
Source: Deutsche Bank; Euromonitor; index takes DM in 1998 as the base at 100 Source: Deutsche Bank; Euromonitor
A significant element of the upside in retail value is taken by significant hikes in excise in DMs which serves to overstate the potential of EMs;
Offset by the multiplier impact at the manufacturer level of retail price increases, which for the purposes of Figure 302, we assumed was 2x.
Figure 309 and Figure 310 highlight that per cap consumption growth in tobacco in EMs has been zero and the per cap increase value is derived from price/mix, as shown in Figure 311. Though across our universe per cap consumption in tobacco is high, we need to appreciate (to state the obvious) that not all EMs are the same.
Figure 309: Tobacco per cap volume CAGR Figure 310: Tobacco per cap value (US$)
-2.2%
-4.2%
-3.4%-3.8%
-3.4%
0.7%
1.6%
-1.7% -0.1% 0.1%
0.6%
1.5%
-2.3%
-0.4%-0.1%
-5%
-4%
-3%
-2%
-1%
0%
1%
2%
1998-2002 2002 -07 2007-12 2002-12 1998-2012
DM universe EM universe EM universe ex china
-0.2%
6.6%
3.1%
4.9%
3.4%
-4.6%
13.4%
5.1%
9.2%
5.0%
-5.0%
13.5%
4.3%
8.8%
4.7%
-10%
-5%
0%
5%
10%
15%
1998-2002 2002 -07 2007-12 2002-12 1998-2012
DM universe EM universe Emerging Market universe (Ex China)
Source: Deutsche Bank; Euromonitor Source: Deutsche Bank; Euromonitor
Figure 308: EM per unit retail value (US$) relative to DM
0
10
20
30
40
50
60
1998 1999 2000 2001 2002 2003 2004 2005 2006 2007 2008 2009 2010 2011 2012
Russia China Nigeria India Pakistan
Source: Deutsche Bank; India ex Biddis

25 March 2014
Consumer Staples
European Consumer Staples
Deutsche Bank AG/London Page 121
Figure 311: Tobacco retail price/mix (US$) Figure 312: Selected Tobacco per caps relative to DMs
2.0%
11.3%
6.8%
9.0%
7.0%
-5.2%
11.6%
7.0%
9.3%
4.9%
1.0%
7.2%
12.3%9.7%
7.2%
-5.6%
11.9%
6.7%
9.3%
4.8%
-8%
-6%
-4%
-2%
0%
2%
4%
6%
8%
10%
12%
14%
1998-2002 2002 -07 2007-12 2002-12 1998-2012
Developed Market univerese Emerging Market universe China EM universe ex China
0
50
100
150
200
250
1998
1999
2000
2001
2002
2003
2004
2005
2006
2007
2008
2009
2010
2011
2012
Russia China Nigeria India
Source: Deutsche Bank Source: Deutsche Bank; India is ex Biddis
From Figure 312 we can see that Russia per caps are materially in excess of mature markets with China not far behind but India, with highest absolute population growth in the world through to 2025 with per caps only 10% of those of DMs (ex Biddis) and Nigeria, the third largest absolute population growth market also at c10% (with no substitute such as Biddis).

25 March 2014
Consumer Staples
European Consumer Staples
Page 122 Deutsche Bank AG/London
This page has been left blank intentionally

25 March 2014
Consumer Staples
European Consumer Staples
Deutsche Bank AG/London Page 123
EM Exposure by Company
Headlines vs. detail
In the following pages we show headline EM exposure by company with reference to sales of the latest available financial year-end or half-year, depending on the latest available. We provide:
a break down sales between developed and emerging markets
a break down EM sales into the major markets
regional sales as disclosed by the company
category sales as disclosed by the company
Figure 313: EM sales by company
0%
10%
20%
30%
40%
50%
60%
70%
80%
90%
100%
CC
H
SA
B
Uni
leve
r
Dan
one
BA
T
AB
I
Hei
neke
n
Car
lsbe
rg
Hen
kel
Bei
ersd
orf
Nes
tle
Dia
geo
Per
nod
Impe
rial
Rem
y
L'O
real
Rec
kitt
Cam
pari
Sw
. Mat
ch
Source: Deutsche Bank estimates

25 March 2014
Consumer Staples
European Consumer Staples
Page 124 Deutsche Bank AG/London
Beverages, Spirits: Campari
Figure 314: Campari Sales 9M 2013 Figure 315: Campari Emerging Market Sales 9M 2013
Developed markets
74%
Emerging markets26%
Jamaica35%
Brazil20%
Russia14%
Argentina10%
Other LatAm6%
South Africa4%
Other E. Europe4%
Mexico3%
Nigeria3%
China1%
Source: Company; Deutsche Bank; sales to December 2013E Source: Company; Deutsche Bank; sales to December 2013E
Figure 316: Campari 9M 2013 sales by region Figure 317: Campari 9M 2013 sales by category
Americas43%
Italy25%
Europe22%
RoW/Duty Free10%
Spirits75%
Wines12%
Soft Drinks6%
Others7%
Source: Deutsche Bank Source: Deutsche Bank
Of the four Spirits companies Campari has the lowest exposure to EMs, we estimate at 26% (Figure 314).
Jamaica (rum), Brazil, Russia and Argentina together represent over 75% of the group’s EM exposure Figure 315).
Exposure to the core Spirits category is in line with the peer group at 75% (Figure 317).

25 March 2014
Consumer Staples
European Consumer Staples
Deutsche Bank AG/London Page 125
Spirits: Diageo
Figure 318: Diageo H1 2014 Sales Figure 319: Diageo Emerging Market Sales H1 2014
Developed markets
59%
Emerging markets41%
Nigeria10%
China8%
Brazil8%
Turkey7%
Venezuela7%
Columbia6%Kenya
6%S. Africa
5%
Mexico5%
Russia4%
Thailand3%
India2%
Other29%
Source: Deutsche Bank estimates; Company data; sales to Dec 2013; Venezuela has been adjusted by DB to reflect current FX rates Source: Deutsche Bank estimates; Company data; sales to Dec 2013; Venezuela has been adjusted by
DB to reflect current FX rates
Figure 320: Diageo H1 2014 sales by region Figure 321: Diageo H1 2014 sales by category
North America28%
W. Europe17%
AEE&T17%
Lat Am13%
Asia-Pac25%
Spirits75%
Beer21%
Wine4%
Source: Deutsche Bank estimates; Company data; sales to Dec 2013 Source: Deutsche Bank estimates; Company data; sales to Dec 2013
All sales estimates are before the consolidation of USL.
Diageo’s business is split approximately 40% EMs and 60% DMs. The USA is Diageo’s single largest market: North America (including USA) is 32% of Diageo sales. The USA is one of our favoured geographies irrespective ‘emerging’ or ‘developed’ status, offering political stability; stable currency; economic growth; and significant population growth.
Figure 319 illustrates the very wide breadth of Diageo’s EM businesses. Diageo is not reliant on any one market. Africa and Asia-Pacific are c60% of sales and Eastern Europe, our least favoured EM region is only 6% of sales.
Four markets represent 39% of Diageo’s EM sales: Nigeria, China, Brazil and Turkey. A further seven markets represent 36% of EM sales (Venezuela; Columbia; Kenya; South Africa; Mexico; Russia Thailand and India). Other notable markets include Ghana, Uganda, Malaysia, Indonesia and Philippines.
Category and geography both play positively to Diageo: we consider it one of our favoured stocks.

25 March 2014
Consumer Staples
European Consumer Staples
Page 126 Deutsche Bank AG/London
Spirits: Pernod
Figure 322: Pernod Sales H1 2014 Figure 323: Pernod Emerging Market Sales H1 2014
Developed markets
61%
Emerging markets39%
China26%
India16%
Russia10%
Thailand7%
Brazil6%
Mexico5%
Argentina3%
Malaysia3%
Vietnam3%
South Africa3%
Venezuela2%
Cuba2%
Poland2%
Others12%
Source: Deutsche Bank estimates; Company data; sales to Dec 2013 Source: Deutsche Bank estimates; Company data; sales to Dec 2013
Pernod’s sales breakdown between EM and DM is very similar to Diageo’s, as shown in Figure 322.
Pernod has a slightly higher skew to its core spirits business at 82% (Figure 325) against 75% at Diageo. We consider this higher skew a positive for Pernod: in general we favour the per cap potential of spirits over beer before consideration of individual geographies.
In terms of major EMs, China, India and Russia represent 50% of EM sales. Other major EM markets include Thailand, Brazil and Mexico.
We see two major contrasts with Diageo in terms of their respective EM businesses:
25% of Pernod’s EM business is in China, materially higher than Diageo’s and thus with a greater exposure to the impact of anti-corruption measures. That said, we may be nearer the end of the impact of this change than the start, but the confidence with which such a statement can be made is limited; we are barely a year into the clampdown; two years (with the second materially better than the first) may provide some confidence in future projections for the Chinese market but at present investors’ visibility (certainly as to recovery) is limited despite the significant downgrades seen in the last 12 months
Pernod’s exposure to the USA is smaller than Diageo’s: North America is 17% of Pernod
Figure 324: Pernod Sales by Region H1 2014
Asia/RoW38%
Europe35%
Americas27%
Source: Deutsche Bank estimates; Company data; sales to Dec 2013
Figure 325: Pernod Sales by Category H1 2014
Spirtis82%
Wine10%
Champagne8%
Source: Deutsche Bank estimates; Company data; sales to Dec 2013

25 March 2014
Consumer Staples
European Consumer Staples
Deutsche Bank AG/London Page 127
Spirits: Remy Cointreau
Figure 326: Remy Cointreau Sales H1 2014 Figure 327: Remy Cointreau EM Sales H1 2014
Developing markets
64%
Emerging markets36%
China52%
Other SE Asia11%
Russia10%
Caribbean9%
Vietnam7%
Czech3%
Slovakia2%
Other EMEA2%
Mexico2% S. Africa
2%
Source: Deutsche Bank estimates; Company data; sales to September 2013 Source: Deutsche Bank estimates; Company data; sales to September 2013
Remy is slightly more skewed to DMs than either Diageo or Pernod,
However, the mix within EMs (even with recent volume and sales weakness) is still heavily biased to China. In H1 2014, China comprised 52% of EM sales (see comments re China within our discussion of Pernod).
SE Asia is a further 11% of EM sales and Russia 10% with the Caribbean (rum) 9% of sales.
Figure 329 breaks down Remy’s sales: ignoring Partner Brands (as we have in Figure 329) Remy is a pure spirits business having sold its champagne business a couple of years ago.
Figure 328: Remy Cointreau Sales by Region H1 2014
EMEA27%
Americas33%
Asia-Pac40%
Source: Deutsche Bank estimates; Company data; sales to September 2013
Figure 329: Remy Cointreau Sales by Category H1 2014
Remy Martin Cognac
73%
Liqueurs & Spirits27%
Source: Deutsche Bank Deutsche Bank estimates; Company data; sales to Sept. 2013; ex Partner Brands

25 March 2014
Consumer Staples
European Consumer Staples
Page 128 Deutsche Bank AG/London
Beverages, Brewers: ABI
Figure 330: ABI Sales 2013 Figure 331: ABI Emerging Market Sales 2013
Developed markets
47%Emerging markets53%
Brazil45%
China15%
Mexico13%
Argentina9%
Other LatAm6%
Russia4%
Ukraine2%
Dominican Rep.2%
Bolivia2%
Paraguay1% Other Asia
1%
Source: Deutsche Bank Estimates; Company Data; sales to December 2013 Source: Deutsche Bank Estimates; Company Data; sales to December 2013
Figure 332: ABI 2013 sales by region Figure 333: ABI 2013 sales by category
North America39%
LatAm - North26%
Western Europe9%
Asia Pac8%
LatAm - South8%
Mexico7%
CE Europe3%
Beer93%
Other Beverages7%
Source: Deutsche Bank estimates; Company data; sales to Dec 2013; ex. Global Exports & Holding Cos Source: Deutsche Bank estimates; Company data; sales to Dec 2013
Brewers generally have larger EM exposure when compared to Spirits. ABI’s business is split in 53% EMs and 47% DMs.
Figure 332 breaks down ABI’s sales by regions. The USA is ABI’s single largest market; North America (including USA) is 39% of ABI’s sales. As we have argued earlier the USA is one of our preferred geographies, and is a positive for ABI from a population/economic growth perspective, independent of category volume and competitive trends in the domestic US beer market. However, ABI’s top four EMs (Brazil, China, Mexico and Argentina) comprise more than 75% of ABI’s EM exposure. Other important EM markets for ABI are Russia, Ukraine, Bolivia, and Dominican Republic.
ABI’s EM exposure is skewed towards LatAm with 34% of total sales and exposure to Eastern Europe is limited with only 3% of total sales.
In terms of business by category, we estimate ABI has 93% of sales from Beer and 7% from other beverages mainly comprising soft drinks.

25 March 2014
Consumer Staples
European Consumer Staples
Deutsche Bank AG/London Page 129
Brewers: Carlsberg
Figure 334: Carlsberg Sales 2013 Figure 335: Carlsberg Emerging Market Sales 2013
Developed markets
54%
Emerging markets46%
Russia45%
Poland9%
Ukraine6%
China6%
Vietnam6%
Malaysia5%
Estonia2%
India2%
Laos2%
Latvia1%
Cambodia1%
Nepal1%
Others14%
Source: Deutsche Bank Estimates; Company Data; sales to December 2013 Source: Deutsche Bank Estimates; Company Data; sales to December 2013
Figure 336: Carlsberg 2013 sales by region Figure 337: Carlsberg 2013 sales by category
Western Europe58%
Eastern Europe28%
Asia14%
Beer90%
Others10%
Source: Deutsche Bank estimates; Company data; sales to Dec 2013; Excludes ‘Unallocated Sales’ Source: Deutsche Bank estimates; Company data; sales to Dec 2013
Carlsberg’s sales are split 54% DMs; 46% EMs. Beer dominates Carlsberg’s business with c90% of sales.
Figure 336 shows the regional split of Carlsberg’s business. Carlsberg’s exposure to Western Europe is the highest among the EU based brewers we cover.
We see two negatives for Carlsberg in terms of regional exposures:
• Carlsberg’s regional exposure is limited to Western Europe, Eastern Europe and Asia. Carlsberg has no presence in LatAm and USA.
• In terms of major EMs, Russia, Poland and Ukraine represents 60% of EM sales. Carlsberg is highly exposed to Russia (Figure 335), which is 45% of its EM sales with associated regulatory and economic risks. Eastern Europe, comprises 32% of Carlsberg’s total sales. Note that Poland, Estonia and Latvia are included in Western Europe by Carlsberg.

25 March 2014
Consumer Staples
European Consumer Staples
Page 130 Deutsche Bank AG/London
Brewers: Heineken
Figure 338: Heineken Sales 2013 Figure 339: Heineken Emerging Market Sales 2013
Developed markets
52%
Emerging markets48%
Mexico29%
Nigeria19%
Poland6%
Brazil6%
Russia6%
Vietnam5%
Indonesia3%
Papua New Guinea
2%
Romania2%
China2%
Egypt2%
South Africa2%
Others16%
Source: Deutsche Bank Estimates; Company Data; sales to December 2013 Source: Deutsche Bank Estimates; Company Data; sales to December 2013
Figure 340: Heineken 2013 sales by region Figure 341: Heineken 2013 sales by category
Western Europe38%
Americas23%
CE Europe16%
Africa, Middle East13%
Asia Pac10%
Beer90%
Others10%
Source: Deutsche Bank; Company data; sales to Dec 2013 Source: Deutsche Bank estimates; Company data; sales to Dec 2013
Heineken’s business is split 48% EMs and 52% DMs: similar to Carlsberg’s. However, the exposure differs in terms of wider breadth of regional exposure and mix of EMs.
As shown in Figure 340, Heineken’s highest exposure is in Western Europe (38%) followed by Americas (23%), C&E Europe (16%), Africa and Middle East (13%) and Asia Pacific (10%).
Within EMs the top markets are Mexico, Nigeria, Poland, Brazil and Russia, together comprising c65% of EM sales. Mexico is the largest EM exposure representing 29% of EM sales. Other important emerging markets for Heineken are Vietnam, Indonesia, Papua New Guinea, Romania, China and Egypt.
Figure 340 shows Heineken has 16% exposure to Central and Eastern Europe. Eastern Europe, which we least prefer among EM, is only 8.6% of the sales.
In terms of Category split Heineken is similar to ABI and Carlsberg with only 10% of sales from other beverages.

25 March 2014
Consumer Staples
European Consumer Staples
Deutsche Bank AG/London Page 131
Brewers: SABMiller
Figure 342: SABMiller Sales 2013 Figure 343: SABMiller Emerging Market Sales 2013
Developed markets
37%
Emerging markets63%
South Africa27%
Colombia26%
Poland9%
Peru8%
Czech Republic5%
Tanzania5%
India2%
Ecuador2%
Romania2%
Hungary1%
Mozambique1%
Zambia1%
Botsw ana1%
Others10%
Source: Deutsche Bank Estimates; Company Data; sales to March 2013 Source: Deutsche Bank Estimates; Company Data; sales to March 2013
Figure 344: SABMiller 2013 sales by region Figure 345: SABMiller 2013 sales by category
LatAm21%
Europe20%
Asia17%
North America17%
SA Beverages13%
Africa11%
SA Hotels & Gaming
1%
Beer84%
Soft Drinks15%
Other alcoholic beverages
1%
Source: Deutsche Bank; Company Data; sales to March 2013 Source: Deutsche Bank Estimates; Company Data; sales to March 2013
Among the four brewers, SABMiller has the largest EM exposure, which we estimate at 63% (Figure 342). Across all companies in this note CCH also EM exposure of 63% with Unilever the next largest at 57%.
As shown in Figure 344, SABMiller has a wide and balanced regional exposure: Latin America (21%) followed by Europe (20%), Asia (17%), North America (17%) and Africa (25%).
Within SAB’s EMs the top two markets, South Africa and Colombia, constitute 53% of EM sales. Other important EM markets for SABMiller are Poland, Peru, Czech and Tanzania, which make up 27% of EM sales. Similar to Heineken, SABMiller is also less reliant on any one EM market when compared to ABI and Carlsberg.
Nearly 80% of SABMiller’s EM exposure is in Africa and Latin America.
In terms of sales breakdown by category, SABMiller is slightly more skewed towards other beverages (16%) than the other three brewers.

25 March 2014
Consumer Staples
European Consumer Staples
Page 132 Deutsche Bank AG/London
Beverages, Soft Drinks: CCH
Figure 346: CCH Sales 2013 Figure 347: CCH Emerging Market Sales 2013
Developed markets
37%
Emerging markets63%
Russia28%
Nigeria14%
Poland11%
Romania11%
Serbia6%
Ukraine6%
Hungary5%
Bulgaria4%
Czech Republic4%
Belarus3%
Croatia2%
Lithuania, Latvia, Estonia
2%
Others4%
Source: Deutsche Bank Estimates; Company Data; sales to December 2013 Source: Deutsche Bank Estimates; Company Data; sales to December 2013
Figure 348: CCH 2013 sales by region Figure 349: CCH 2013 sales by category
Emerging47%
Established37%
Developing16%
Sparkling Drinks70%
Water15%
Juices and RTDs15%
Source: Deutsche Bank; Company Data; sales to December 2013; Emerging countries: Armenia, Belarus, Bosnia, Bulgaria, Moldova, Nigeria, Romania, Russia, Serbia, and Ukraine. Established countries: Austria, Cyprus, Greece, Italy, Ireland, and Switzerland. Developing countries: Baltic’s, Croatia, Czech, Hungary, Poland, Slovakia, Slovenia
Source: Deutsche Bank Estimates, Company Data, sales to December 2013
We estimate 63% of CCH’s business in EMs. In terms of regional exposure, CCH is present primarily in Europe, with some presence in Africa (mainly Nigeria). CCH reports its regional exposure as Established, Developing and Emerging as shown in Figure 348. The established region is made up of Western European countries. The Eastern European countries and Nigeria are included in Developing and Emerging regions.
Within EMs, the top markets are Russia, Nigeria, Poland, Romania, Serbia and Ukraine which make up 76% of CCH’s EM exposure. Russia is the largest EM market with 28% of CCH’s EM revenues.
Eastern Europe, which we least prefer among EMs, forms c85% of CCH’s EM revenues.
We estimate CSDs are 70% of CCH’s sales. Water, Juices and RTDs together contribute the remaining 30%.

25 March 2014
Consumer Staples
European Consumer Staples
Deutsche Bank AG/London Page 133
Food: Danone
Figure 350: Danone Sales 2013 Figure 351: Danone Emerging Market Sales 2013
Developed markets
44%
Emerging markets56%
Russia19%
China12%
Indonesia11%
Mexico10%
Argentina9%
Brazil8%
Poland5%
Morocco4%
South Africa3%
Turkey3%
UAE3%
Ukraine2%
Egypt2%
Others9%
Source: Deutsche Bank Estimates; Company Data; sales to December 2013 Source: Deutsche Bank Estimates; Company Data; sales to December 2013
Figure 352: Danone 2013 sales by region Figure 353: Danone 2013 sales by category
ALMA39%
Europe39%
CIS + Noram22%
Fresh Dairy Products
56%
Early Life Nutrition20%
Waters18%
Medical Nutrition6%
Source: Deutsche Bank; Company Data; sales to December 2013; Source: Deutsche Bank; Company Data; sales to December 2013
We estimate 56% of Danone’s business is in EMs, by revenue. In terms of regional exposure, Danone reports three regions: Europe; CIS & NORAM; and ALMA. Europe is mostly Western Europe (33% of sales). CIS is 12.9% of sales which includes Russia, Ukraine, and Kazakhstan. NORAM includes US (8% of sales) and Canada. ALMA comprises Asia-Pacific, Latin America, Middle East and Africa.
Within EMs, Danone’s top markets are Russia, China, Indonesia, Mexico, Argentina and Brazil, which make up 70% of EM sales. Russia, 10% of sales, is the largest market for Danone followed by the USA. We estimate that Eastern Europe contributes 19% to Danone’s total sales.
In terms of breakdown of sales by category, ‘Fresh Dairy Products’ is the largest segment with 56% of sales representing a greater skew to one category than we see in other Food companies we cover.

25 March 2014
Consumer Staples
European Consumer Staples
Page 134 Deutsche Bank AG/London
Food: Nestle
Figure 354: Nestle Sales 2013 Figure 355: Nestle Emerging Market Sales 2013
Developed markets
56%
Emerging markets44%
China17%
Other Americas16%
Brazil13%
Mexico8%
Middle East7%
Philippines6%
Other E Europe6%
Russia5%
Other Africa5%
Other AOA5%
India4%
Malaysia3%
Ivory Coast3%
Pakistan2%
Source: Deutsche Bank Estimates; Company Data; sales to December 2013 Source: Deutsche Bank Estimates; Company Data; sales to December 2013
Figure 356: Nestle 2013 sales by region Figure 357: Nestle 2013 sales by category
Americas43%
Asia, Oceania & Africa29%
Europe28%
Pow dered & Liquid Beverages
22%
Milk products & Ice Cream19%
Prepared Dishes & Cooking Aids
16%
Nutrition & Health Care13%
Pet Care12%
Confectionery 11%
Waters7%
Source: Deutsche Bank; Company Data; sales to December 2013 Source: Deutsche Bank; Company data; sales to December 2013
Nestle is skewed towards DMs compared to Danone and Unilever. We estimate 56% of Nestle’s sales are in DMs and 44% in EMs. The USA is Nestle’s single largest market representing 25% of sales and is one of our preferred geographies.
Within EMs four markets represent 44% of overall EM sales: China, Brazil, Mexico and Philippines. A further five markets represent 17% of EM sales (Russia; India; Malaysia; Ivory Coast; and Pakistan). The remaining c.40% of EM sales is split between a wide set of countries, see Figure 355.
7% of group sales are from China. With the exception of USA and China, Nestle’s exposure to any one country is limited: Eastern Europe is only 5% of sales.
In terms of category breakdown, Nestle’s exposure is much wider than that of Danone. Powdered & Liquid Beverages (22% of sales) is the largest category followed by Milk Products & Ice Cream (19%), see Figure 357.
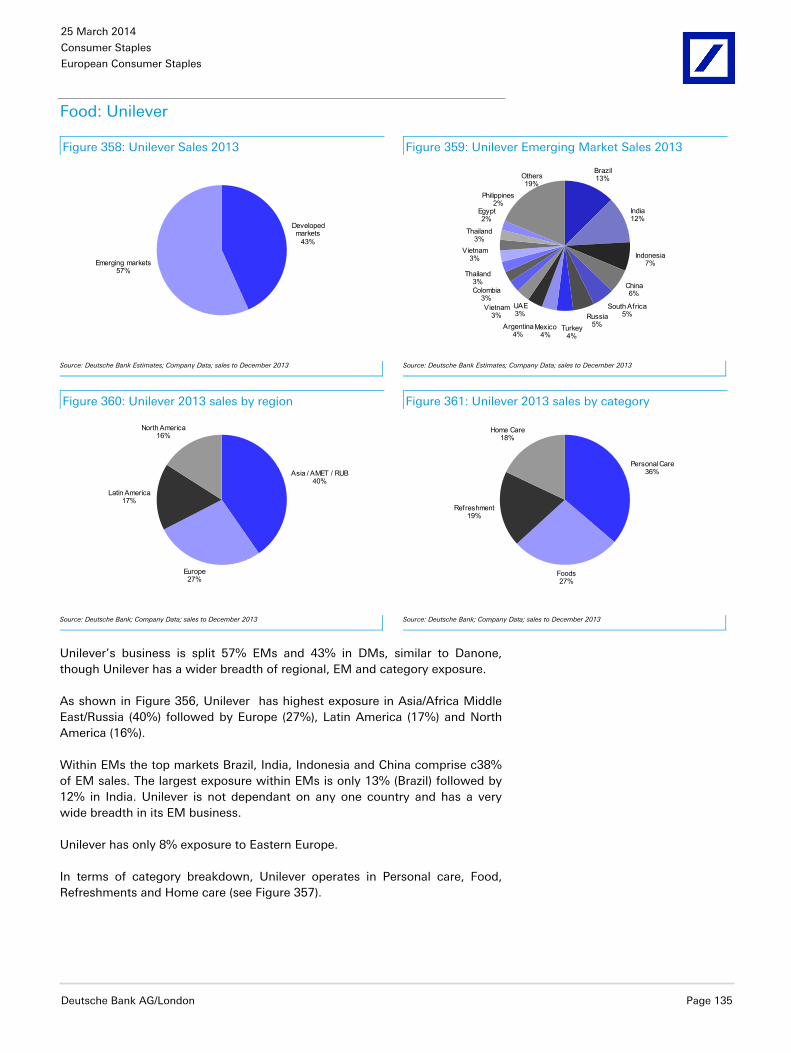
25 March 2014
Consumer Staples
European Consumer Staples
Deutsche Bank AG/London Page 135
Food: Unilever
Figure 358: Unilever Sales 2013 Figure 359: Unilever Emerging Market Sales 2013
Developed markets
43%
Emerging markets57%
Brazil13%
India12%
Indonesia7%
China6%
South Africa5%Russia
5%Turkey4%
Mexico4%
Argentina4%
UAE3%
Vietnam3%
Colombia3%
Thailand3%
Vietnam3%
Thailand3%
Egypt2%
Philippines2%
Others19%
Source: Deutsche Bank Estimates; Company Data; sales to December 2013 Source: Deutsche Bank Estimates; Company Data; sales to December 2013
Figure 360: Unilever 2013 sales by region Figure 361: Unilever 2013 sales by category
Asia / AMET / RUB40%
Europe27%
Latin America17%
North America16%
Personal Care36%
Foods27%
Refreshment19%
Home Care18%
Source: Deutsche Bank; Company Data; sales to December 2013 Source: Deutsche Bank; Company Data; sales to December 2013
Unilever’s business is split 57% EMs and 43% in DMs, similar to Danone, though Unilever has a wider breadth of regional, EM and category exposure.
As shown in Figure 356, Unilever has highest exposure in Asia/Africa Middle East/Russia (40%) followed by Europe (27%), Latin America (17%) and North America (16%).
Within EMs the top markets Brazil, India, Indonesia and China comprise c38% of EM sales. The largest exposure within EMs is only 13% (Brazil) followed by 12% in India. Unilever is not dependant on any one country and has a very wide breadth in its EM business.
Unilever has only 8% exposure to Eastern Europe.
In terms of category breakdown, Unilever operates in Personal care, Food, Refreshments and Home care (see Figure 357).

25 March 2014
Consumer Staples
European Consumer Staples
Page 136 Deutsche Bank AG/London
Home & Personal Care: Beiersdorf
Figure 362: Beiersdorf Sales 2013 Figure 363: Beiersdorf Emerging Market Sales 2013
Developed markets
56%
Emerging markets44%
China12%
Russia12%
Brazil9%
Poland9%
Thailand7%Mexico
5%Malaysia
4%
South Africa4%
AED4%
India3%
Chile3%
Argentina3%
Ukraine3%
Egypt3%
Others19%
Source: Deutsche Bank Estimates; Company data; sales to December 2013 Source: Deutsche Bank Estimates; Company data; sales to December 2013
Figure 364: Beiersdorf 2013 sales by region Figure 365: Beiersdorf 2013 sales by category
Europe55%
Africa, Asia, Australia
27%
Americas18%
Consumer83%
Tesa adhesives17%
Source: Deutsche Bank; Company Data; sales to December 2013 Source: Deutsche Bank; Company Data; sales to December 2013; Consumer division consists primarily Personal Care
Beiersdorf’s sales are marginally skewed towards DM with a 56% exposure while EM is 44%.
Figure 363 shows Beiersdorf has a wide breadth across its EM business though Beiersdorf’s top five EM markets China, Russia, Brazil, Poland and Thailand together represent 50% of overall EM sales: China, its largest EM market represents 12% of EM sales, or 5% of group sales. Other notable markets include Mexico, Malaysia, and South Africa.
Europe is Beiersdorf’s biggest region with 55% of group sales followed by Africa/Asia/Australia (27%) and the Americas (18%). Although Europe is still twice as large as the other regions, it has reduced from a high of 75% a decade ago. Also, the mix within Europe has become more favourable.
We also like Beiersdorf for its category breakdown. The Consumer division, which is primarily a personal care business, constitutes 83% of sales, while the adhesives business Tesa makes up 17%.

25 March 2014
Consumer Staples
European Consumer Staples
Deutsche Bank AG/London Page 137
Home & Personal Care: Henkel
Figure 366: Henkel Sales 2013 Figure 367: Henkel Emerging Market Sales 2013
Developed markets
55%
Emerging markets45%
China16%
Russia13%
Poland12%
Mexico6%Egypt
6%AED5%
Turkey5%
Colombia4%
Thailand3%
Brazil3%
Ukraine3%
Malaysia3%
Taiw an2%
South Africa2%
Romania2%
Others14%
Source: Deutsche Bank Estimates; Company data; sales to December 2013 Source: Deutsche Bank Estimates; Company data; sales to December 2013
Figure 368: Henkel 2013 sales by region Figure 369: Henkel 2013 sales by category
Western Europe34%
Eastern Europe19%
North America18%
Asia/Pacific16%
Africa/Middle East7%
Latin America6%
Industrial Adhesives
38%
Laundry & Home Care28%
Beauty Care22%
Consumer Adhesives
12%
Source: Deutsche Bank; Company Data; sales to December 2013 Source: Deutsche Bank; Company Data; sales to December 2013
Henkel’s sales exposure breaks down into 55% from DM and 45% from EM. Henkel is targeting to achieve 50% of turnover from EMs by 2016.
Like its European HPC peers, Henkel also has a broad spectrum of EM countries in its portfolio, see Figure 367. China ranks top, with a 16% share of EM sales, followed by Russia (13%), Poland (12%) and Mexico (6%).
Figure 368 looks at Henkel’s sales by region. Perhaps a function of greater disclosure as opposed to any significant differences with the Staples peer group, Henkel’s sales are well balanced across the globe.
Category wise, Henkel is skewed towards Adhesives. Industrial and Consumer adhesives together make up 50% of group sales. Laundry & Home care and Beauty care businesses comprise 28% and 22% respectively, see Figure 369.

25 March 2014
Consumer Staples
European Consumer Staples
Page 138 Deutsche Bank AG/London
Home & Personal care: L’Oreal
Figure 370: L’Oréal Sales 2013 Figure 371: L’Oréal Emerging Market Sales 2013
Developed markets
64%
Emerging markets36%
China20%
Brazil10%
Indonesia9%
Russia9%
Thailand8%
India6%
Mexico5%
Poland4%
Argentina3%
South Africa3%
Turkey3%
Chile2%
Ukraine1%
Colombia1%
Others16%
Source: Deutsche Bank Estimates; Company data; sales to December 2013 Source: Deutsche Bank Estimates; Company data; sales to December 2013
Figure 372: L’Oréal 2013 sales by region (Cosmetics) Figure 373: L’Oréal 2013 sales by category
Western Europe35%
North America25%
Asia-Pacif ic21%
Latin America9%
Eastern Europe8%
Africa, Middle East2%
Consumer Products
47%
L'Oreal Luxe25%
Professional Products
13%
Active Cosmetics7%
The Body shop4%
Dermatology4%
Source: Deutsche Bank; Company data; sale to December 2013; Source: Deutsche Bank; Company Data; sales to December 2013
We estimate L’Oreal’s EM exposure to be relatively low at 36%.
In terms of regional exposure Western Europe is the largest market with 35% of sales followed by North America at 25%.
China is its largest EM market constituting 20% of EM sales. The next 3 markets (Brazil, Indonesia and Russia) together represent 28% of EM sales. The other half of EM sales mainly comes from markets in Asia Pacific and Latin America, with Eastern Europe contributing only 8% to group sales.
Almost half of L’Oreal’s sales is from the Consumer Products category with 47% of sales. Luxury and Professional products together contribute 38% of sales.

25 March 2014
Consumer Staples
European Consumer Staples
Deutsche Bank AG/London Page 139
Home & Personal Care: RB
Figure 374: RB Sales 2013 Figure 375: RB Emerging Market Sales 2013
Developed markets
64%
Emerging markets36%
Russia10%
Poland9%
Turkey9%
Brazil9%
India8%China
8%
Mexico7%
South Africa6%
Indonesia5%
Ukraine3%
Nigeria3%
Egypt2%
UAE2%
Other19%
Source: Deutsche Bank Estimates; Company data; sales to December 2013 Source: Deutsche Bank Estimates; Company data; sales to December 2013
Figure 376: Reckitt core 2013 sales by region Figure 377: Reckitt 2013 sales by category
ENA57%LAPAC
28%
RUMEA15%
Hygiene38%
Health26%
Home20%
RB Pharma8%
Portfolio Brands5%
Food3%
Source: Deutsche Bank; Company Data; sales to December 2013; Excluding Pharma and Food; ENA includes Europe and North America; RUMEA includes Russia and CIS, Middle East, North Africa, Turkey and Sub-Saharan Africa; LAPAC includes Latin America, North Asia, South East Asia, and Australia and New Zealand
Source: Deutsche Bank; Company Data; sales to December 2013
RB sales is split into 64% in DM and 36% in EM.
Although RB’s EM exposure of 36% is low when compared with peers it is similar in terms of a well diversified EM portfolio. Russia is RB’s biggest EM market (10% of EM sales) followed by Brazil, Poland, and Turkey(9% of EM sales each).India, China, Mexico and South Africa are other notable markets.
As shown in Figure 376, Europe and North America (ENA) constitute a significant (57%) part of RB Core sales. RB targets RUMEA and LAPAC (the prime EM regions) to 50% of RB’s core’s sales by 2015 from the current 43%.
Figure 377 shows Health, Hygiene and Home being the three largest divisions together comprising 84% of sales. The DM-focussed Pharma, Portfolio Brands and Food businesses together comprise around 16% of sales highlighting EB has a greater exposure in EMs in its core Health, Hygiene and Home business than the group average of 36%. In simple terms assuming all Pharma, Portfolio and Food sales are in DMs (we estimate the vast majority are) implies 43% of the core categories are in EMs.

25 March 2014
Consumer Staples
European Consumer Staples
Page 140 Deutsche Bank AG/London
Tobacco: BAT
Figure 378: BAT Sales 2013 Figure 379: BAT Emerging Market Sales 2013
Developed markets
44%
Emerging markets56%
South Africa17%
Brazil16%
Russia15%
Malaysia8%
Nigeria5%
Turkey3%
Indonesia3%
Caribbean3%
Mexico2%
Chile2%
Venezuela2%
Pakistan2%
Bangladesh2%
Vietnam2%
Others18%
Source: Deutsche Bank estimates; company data; excludes associates Source: Deutsche Bank estimates; company data; excludes associates
Figure 380: BAT 2013 sales by region Figure 381: BAT 2013 sales 100% Tobacco
Asia-Pacific27%
EEMEA27%
Western Europe24%
Americas22%
Tobacco100%
Source: Deutsche Bank estimates; company data; excludes associates Source: Deutsche Bank estimates; company data; excludes associates
Excluding associates we estimate 56% of BAT’s sales are in EMs per Figure 378. Figure 380 may suggest a greater proportion than we have estimated but Asia-Pacific includes large businesses in Japan and Australia and America’s includes a significant business in Canada. Consideration of associates would increase overall DM exposure with Reynolds American (100% USA) the dominant associate.
In Figure 379 we estimate BAT’s largest EMs as South Africa, Brazil, Russia and Malaysia which together account for c60% of BATs EM business. Other important EMs for BAT not separately shown in Figure 379 include Argentina, Colombia, Egypt, Ukraine, Kazakhstan, Czech, Philippines, Poland, Romania, Taiwan, and GCC.
In terms of BATs business by category there are some small businesses in distribution and tobacco leaf sales with further small business within tobacco outside the core cigarette business (in categories such as fine cut tobacco and snus) but all are Tobacco related and in totality immaterial to the group. For the purposes of our analysis it is reasonable to assume BAT is a 100% Tobacco business (Figure 381).

25 March 2014
Consumer Staples
European Consumer Staples
Deutsche Bank AG/London Page 141
Tobacco: Imperial Tobacco
Figure 382: Imperial Tobacco Sales 2013 Figure 383: Imperial Tobacco EM Sales 2013
Developed markets
52%
Emerging markets48%
Russia8%
Morocco8%
Iraq6%
Algeria5%
Poland4%
Taiwan4%
Senegal3%
Ukraine3%
Turkey2%
Saudi A.2%
Hung'y2%
Czech2%
Azerb.2%
Laos2%
Others47%
Source: Deutsche Bank estimates; company data; excludes logistics (all revenue is DMs), cigar and global duty free; year to Sept 2013; number of central EU markets treated as EMs Source: Deutsche Bank estimates; company data; excludes logistics (all revenue is DMs), cigar and
global duty free; year to Sept 2013; number of central EU markets treated as EMs
Figure 384: Imperial Tobacco Sales 2013 by region Figure 385: Imperial Tobacco sales 2013 by category
EU54%
Americas9%
RoW37%
Tobacco88%
Logistics12%
Source: Deutsche Bank estimates; company data; excludes logistics; year to Sept 2013 Source: Deutsche Bank estimates; company data; Logistics includes re-allocation of distribution revenues included in Tobacco (primarily Morocco)
Imperial’s sales are split approximately 60% DM; 40% EM (ex Logistics) with profits showing a greater skew to DMs.
Our analysis indicates Imperial’s major EMs are estimated to be Morocco, Algeria, Senegal, Russia, Poland, Taiwan and Ukraine.
Figure 384 shows Imperial’s sales under its former disclosure which the company provided for the last time with the 2013 results. Figure 382, Figure 383 and Figure 384 exclude Logistics. Imperial’s America’s exposure is virtually all in the USA. In its Rest of World business Imperial has no exposure to China, India, Indonesia, Nigeria, Philippines or in DMs, Japan.
Including Logistics we estimate Tobacco is 88% of Imperial’s business (Figure 385). This is slightly less than that disclosed by Imperial as we have adjusted for our estimate of (small) Logistics sales disclosed with Tobacco revenues (primarily Morocco). Cigarettes dominate Imperial’s Tobacco business though it also has a significant presence in fine cut tobacco in the EU. Imperial has some exposure to cigars through its Habanos JC and its USA business (c50% of USA sales). In group terms Imperial’s snus business remains very small (significantly less than 5% of group sales).

25 March 2014
Consumer Staples
European Consumer Staples
Page 142 Deutsche Bank AG/London
Tobacco: Swedish Match
Figure 386: Swedish Match Sales 2013 Figure 387: Swedish Match Emerging Market Sales 2013
Developed markets
94%
Emerging markets6%
Brazil37%
Russia27%
Malaysia18%
Others18%
Source: Deutsche Bank Estimates; Company data; sales to December 2013 Source: Deutsche Bank Estimates; Company data; sales to December 2013
Figure 388: Swedish Match 2013 sales by region Figure 389: Swedish Match 2013 sales by category
Sw eden58%
United States30%
Others12%
Snus & Snuff39%
Other Tobacco Products
20%
Lights11%
Other Operations30%
Source: Deutsche Bank Estimates; Company Data; sales to December 2013 Source: Deutsche Bank; Company Data; sales to December 2013
Swedish Match sales are split in 6% EM and 94% DM. Swedish Match’s EM exposure is the least among the staples we cover.
In terms of regional exposure, Swedish Match is mainly present in Sweden and in the USA, which together comprises 88% of sales. Among EMs, we estimate that Brazil is their largest EM market followed by Russia and Malaysia.
Snus & Snuff is the largest category with 39% of Swedish Match sales followed by other tobacco products with 20% of sales. Lights comprises 11% of sales and rest is other operations which includes distribution of tobacco products in Sweden, and corporate overhead costs.

25 March 2014
Consumer Staples
European Consumer Staples
Deutsche Bank AG/London Page 143
Population 2012-2025
Conclusions
Absolute not percentage growth Population matters in consumer goods: the more people the greater potential for the Staples companies products to be consumed. We have to caveat our conclusions with the word “potential”. Economics matter: GDP growth is critical in EMs and currency devaluations can undermine the potential of population growth
Growth in absolute numbers of people matter; not growth rates within a country.
The fasted growing countries in the world over the period 2012-2025 by numbers of people are shown in Figure 390.
Figure 390: Population growth Country Incremental
growth (m) % of global
growthAggregate (m) Aggregate
as % of global growth
1 India 182.0 19% 182.0 19%
2 Nigeria 71.1 7% 253.1 26%
3 China 65.2 7% 318.3 33%
4 Pakistan 38.9 4% 357.2 37%
5 Indonesia 35.1 4% 392.3 41%
6 Ethiopia 32.8 3% 425.1 44%
7 United States 28.3 3% 453.4 47%
8 Bangladesh 23.2 2% 476.6 50%
9 Philippines 22.5 2% 499.1 52%
10 Brazil 18.8 2% 517.9 54%
11 Mexico 17.4 2% 535.3 56%
12 Egypt 16.3 2% 551.6 58%
13 Kenya 16.2 2% 567.8 59%
14 Turkey 9.7 1% 577.5 60%Source: Deutsche Bank
14 countries contribute population growth of 577m or 60% of the world’s total 2012-2025
India’s population contributes 19% of global population growth 2012-2025
India, Nigeria and China together represent a third of global growth 2012-2025
the USA’s population will grow by 28.3m people 2012-2025 and contribute 3% to global population growth over the period
Brazil’s population growth is less in absolute terms than the USA
though one of the BRIC countries, Russia’s population is declining
What can we conclude from this analysis?

25 March 2014
Consumer Staples
European Consumer Staples
Page 144 Deutsche Bank AG/London
With the obvious caveats around population growth being potentially compromised by anaemic GDP growth and/or perpetual currency devaluations exposure to growing populations is clearly positive. It therefore follows that an exposure to the countries listed in Figure 390 is desirable for any Staples business. Though the US contributes only 3% of global population growth through to 2025 its relatively high economic stability and ‘hard currency’ warrants a higher premium than this 3% contribution warrants in our view.
Population maters
People consume staples products All too often commentary launches into a debate on Staples without consideration of one very basic fact: people consume staple products; the more people on the planet the greater the opportunity for Staples companies to sell more units of their products.
As we have previously discussed, population growth is critical because the value of pricing tends to be lost in EMs through sporadic bouts of currency devaluation rendering pricing much lower than generally perceived in hard currency (US Dollar) terms: they are as reliant on mix and volume as DMs. What helps volume alongside growth in per caps as economies mature? More people.
Country analysis Figure 391 shows population growth for our sample of 21 major EMs and 6 major DMs. A number of observations can be made from an EM perspective:
global population is forecast to grow by 957m people over the period 2012-2025: 13.6% at a CAGR of 1.0%
over 95% of this growth is from EMs
India and China dwarf all other markets representing 57% of our EM basket in 2012 and 55% in 2025. As a proportion of world population they represent 37% in 2012 and 35% in 2025
in 2025 India is bigger than China
India contributes population growth of 182m over the period, 19% of global growth
despite China only growing at a CAGR of 0.4%, India and China represent 45% of our EM basket growth and 26% of global growth
Nigeria’s population is growing the fastest in percentage terms followed by Kenya and Ethiopia (i.e. three African countries)
in 2025 Nigeria is the fourth largest country in the world by population; bigger than Indonesia and Brazil
in absolute terms Nigeria’s population growth (71.1m) is faster than China’s (65.2m)
Nigeria represents 13% of our EM basket growth and 7% of global population growth
only three of our EMs are seeing declining populations: two in Eastern Europe, one in Central Europe being Russia, Ukraine and Poland
Russia and Ukraine’s populations are falling faster than Japan’s.

25 March 2014
Consumer Staples
European Consumer Staples
Deutsche Bank AG/London Page 145
From a mature market perspective:
Japan and Germany’s populations are declining
the USA is still the third largest market in the world by population in 2025 with a CAGR of 0.7%
the USA and Australia’s population is growing faster than China’s in percentage terms
Australia is growing at a faster rate than China, Indonesia, Brazil, Mexico, Russia, Vietnam, Turkey, Thailand, South Africa, Argentina, Ukraine and Poland
Figure 391: Population ordered by 2025E (m) 2012
(m) Rank in basket
2025 (m)
Rank in basket
CAGR Incremental growth (m)
Selected EMs
India 1236.7 2 1418.7 1 1.1% 182.0
China 1350.7 1 1415.9 2 0.4% 65.2
Indonesia 246.9 4 282.0 4 1.0% 35.1
Nigeria 168.8 6 239.9 5 2.7% 71.1
Pakistan 179.2 7 218.1 6 1.5% 38.9
Brazil 198.7 5 217.5 7 0.7% 18.8
Bangladesh 154.7 8 177.9 8 1.1% 23.2
Mexico 120.8 10 138.2 9 1.0% 17.4
Russia 143.5 9 131.1 10 -0.7% -12.4
Ethiopia 91.7 13 124.5 11 2.4% 32.8
Philippines 96.7 12 119.2 12 1.6% 22.5
Egypt 80.7 15 97.0 14 1.4% 16.3
Vietnam 88.8 14 95.8 15 0.6% 7.0
Turkey 74.0 17 83.7 16 1.0% 9.7
Thailand 66.8 18 67.9 19 0.1% 1.1
Kenya 43.2 22 59.4 21 2.5% 16.2
Colombia 47.7 23 55.0 22 1.1% 7.3
South Africa 51.2 21 54.3 23 0.5% 3.1
Argentina 41.1 24 45.4 24 0.8% 4.3
Ukraine 45.6 25 39.8 25 -1.0% -5.8
Poland 38.5 26 36.9 26 -0.3% -1.6
Total of selected EMs 4566.0 5118.2 0.9%
Proportion of World 64.8% 63.9%
Selected DMs
United States 313.9 3 342.2 3 0.7% 28.3
Japan 127.6 11 118.1 13 -0.6% -9.5
Germany 81.9 16 77.4 17 -0.4% -4.5
France 65.7 19 68.2 18 0.3% 2.5
United Kingdom 63.2 20 66.1 20 0.3% 2.9
Australia 22.7 27 26.2 27 1.1% 3.5
Total of selected DMs 675.0 698.2 0.3%
Proportion of World 9.6% 8.7%
World 7046.4 8003.8 1.0%Source: Deutsche Bank

25 March 2014
Consumer Staples
European Consumer Staples
Page 146 Deutsche Bank AG/London
Figure 392: Population CAGR 2012-2025 Figure 393: Population growth 2012-2025 (m)
-1.5%
-1.0%
-0.5%
0.0%
0.5%
1.0%
1.5%
2.0%
2.5%
3.0%
Nig
eria
Ken
yaE
thio
pia
Phi
lippi
nes
Paki
stan
Egy
ptA
ustra
liaC
olom
bia
Ban
glad
esh
Indi
aM
exic
oIn
done
sia
Wor
ldTu
rkey
EM
Tot
alA
rgen
tina
Bra
zil
US
AV
ietn
amR
SA
Chi
na UK
Fran
ceD
M T
otal
Thai
Pol
and
Ger
man
yJa
pan
Rus
sia
Ukr
aine
-50
0
50
100
150
200
Indi
aN
iger
iaC
hina
Pak
ista
nIn
done
sia
Eth
iopi
aU
nite
d S
tate
sB
angl
ades
hPh
ilippi
nes
Braz
ilM
exic
oE
gypt
Keny
aTu
rkey
Col
ombi
aV
ietn
amAr
gent
ina
Aust
ralia
Sou
th A
frica
Uni
ted
Kin
gdom
Fran
ceTh
aila
ndP
olan
dG
erm
any
Ukr
aine
Japa
nR
ussi
a
Source: World Bank; EM Total is shown in grey and is weighted and is per our sample of 21 countries (all shown in the chart);DM total is shown in grey and is weighted and is as per our DM sample; EM countries in blue; DM countries in light blue; World in black
Source: World Bank; DM countries in light blue
Figure 394: Population by country 2012 and 2025 (m) Figure 395: Population by country 2012 and 2025 (m)
0
250
500
750
1000
1250
1500
Indi
aC
hina
US
AIn
done
sia
Nig
eria
Pak
ista
nBr
azil
Bang
lade
shM
exic
oR
ussi
aE
thio
pia
Philip
pine
sJa
pan
Egyp
tVi
etna
mTu
rkey
Ger
man
yFr
ance
Thai
land UK
Ken
yaC
olom
bia
Sou
th A
frica
Arge
ntin
aU
krai
neP
olan
dA
ustra
lia
2012 2025
0
50
100
150
200
250
300
350
USA
Indo
nesi
a
Nig
eria
Pak
ista
n
Bra
zil
Ban
glad
esh
Mex
ico
Rus
sia
Eth
iopi
a
Phi
lippi
nes
Japa
n
Egy
pt
Vie
tnam
Turk
ey
Ger
man
y
Fran
ce
Thai
land UK
Ken
ya
Col
ombi
a
Sout
h A
frica
Arg
entin
a
Ukr
aine
Pol
and
Aus
tralia
2012 2025
Source: World Bank Source: World Bank; ex India & China
Regional picture
While cautioning against a broad brush analysis it is nevertheless helpful to look at population growth from a regional perspective: see Figure 396 to Figure 397. A number of observations can be made:
Africa & ME dominates global population growth contributing 46% of growth
Nigeria, Kenya and Ethiopia alone contribute 13% of global growth
of the Asia ex SE Asia region, India dominates contributing 66% of the region’s growth
Eastern Europe’s population is declining

25 March 2014
Consumer Staples
European Consumer Staples
Deutsche Bank AG/London Page 147
Figure 396: Regional population growth 2012-2025 (m)
-50
0
50
100
150
200
250
300
350
400
450
500
Afri
ca &
ME
Asi
a ex
SE
SE
Asi
a
Cen
t. &
Lat
Am
Chi
na
N. A
mer
ica
Aus
trala
sia
W. E
urop
e
Japa
n
E. E
urop
e
Source: Deutsche Bank
Figure 397: Regional population growth 2012-2025 Figure 398: Contribution to population growth 2012-2025
-10%
-5%
0%
5%
10%
15%
20%
25%
30%
35%
Afri
ca &
ME
Asi
a ex
SE
Aus
trala
sia
SE
Asi
a
Cen
t. &
Lat
Am
N. A
mer
ica
Chi
na
W. E
urop
e
E. E
urop
e
Japa
n
-10%
0%
10%
20%
30%
40%
50%A
frica
& M
E
Asi
a ex
SE
SE
Asi
a
Cen
t. &
Lat
Am
Chi
na
N. A
mer
ica
Aust
rala
sia
W. E
urop
e
Japa
n
E. E
urop
e
Source: World Bank Source: World Bank

25 March 2014
Consumer Staples
European Consumer Staples
Page 148 Deutsche Bank AG/London
This page has been left blank intentionally

25 March 2014
Consumer Staples
European Consumer Staples
Deutsche Bank AG/London Page 149
Addendum: “What’s the catalyst?”
There isn’t one
Positive outlook but no catalyst... so what; there rarely is We have painted a positive outlook for Staples over the long-term. When outlining our views and discussing Staples many ask (and not just those with a relatively short time horizon) invariably ask: “What’s the catalyst?”
The vast majority of times this question is asked (and it’s asked a lot) the only answer we can provide is “there isn’t one”. That said, we can be, and are, more helpful. Let’s take the European Tobacco sub-sector as a case in point.
Tobacco: a case in point
Significant outperformance Since its formation in September 19989 the sub-sector has out-performed the EU market by close to 300% in US Dollar terms, see Figure 399. This outperformance ignores the significantly higher dividend yield tobacco offers when compared to the market, which reinvested in tobacco, would materially advance the outperformance. This outperformance has been despite recent debates concerning e-cigarettes, EM currency downgrades and mature market volumes, all of which has seen the sub-sector underperform, since late 201210.
One question this long-dated outperformance raises for an investor looking back to 1998 from an underweight position (there has been plenty of them) is, “when should I have bought?”
We can be slightly more helpful than offering the glib response, “At the bottom”, but only slightly. And we say only slightly because the answer is somewhat frustrating for those looking for a continual flow of catalysts.
9 Until September 1998 the ‘European Tobacco sector’ was dominated by a conglomerate, BAT Industries. Only with the demerger of BAT Industries into British American Tobacco and the insurance arm being merged with Zurich did a real Tobacco sector emerge. Until that point the debate around European Tobacco was as much about the combined ratio of the Farmers P&C exchanges (and how much capital BAT Industries would have to contribute) and Eagle Star’s UK mortgage indemnity exposure as it was about the pricing power of Tobacco and the opportunities in emerging markets. As a consequence of the rather unique (to be polite) combination of tobacco and insurance, valuation methodologies were extremely unsophisticated with an over-reliance on dividend yield and dividend yield relative measures. The true value of the tobacco business was hidden by the conglomerate structure; the complexities of insurance; and what appeared to be an ongoing need for capital injection into the insurance businesses. Though Imperial, Gallaher, Seita, Tabacalera and Swedish Match existed they were (combined) much smaller than BAT Industries and two of the companies, Imperial and Gallaher had been listed in their then form for less than two years: to the extent the other companies impacted investors view of the sector there was very limited history upon which to gauge that view. 10 This current period of underperformance is not without precedent. From the middle of 1999 to early 2000 the sector underperformed through a combination of perceived litigation risk (primarily in the USA but also in UK/Europe) and a fixation with TMT stocks (note the scaling in Figure 399 understates the extent of the underperformance). Following the equity market’s initial reaction to the financial crisis of 2007/8 when Staples materially outperformed because of their ‘defensive’ characteristics the sector underperformed from March 2009 to September 2011 as the market bought into the recovery and favoured more highly geared macro plays, which had materially underperformed tobacco.

25 March 2014
Consumer Staples
European Consumer Staples
Page 150 Deutsche Bank AG/London
Staples news-flow is intermittent and more often than not, immaterial to the fundamental value of the business, despite the best efforts of many to create a story. Tobacco is probably the ultimate illustration of that view, but the rest of the Staples sector is not far behind.
Figure 399: European Tobacco Sector relative to MSCI Europe (US$ terms)
0
100
200
300
400
500
600
700
Sep-
98
May
-99
Jan-
00
Sep-
00
May
-01
Jan-
02
Sep-
02
May
-03
Jan-
04
Sep-
04
May
-05
Jan-
06
Sep-
06
May
-07
Jan-
08
Sep-
08
May
-09
Jan-
10
Sep-
10
May
-11
Jan-
12
Sep-
12
May
-13
Jan-
14Source: Datastream; Deutsche Bank
Only three real catalysts in the last 15 years Perhaps an extreme interpretation, but one we believe holds a high degree of credibility, is the view that there has only ever been three significant catalysts in Tobacco since September 1998:
First, BAT Industries’ demerger to effectively create the sector in 1998 when the true value of BAT Industries’ Tobacco business became obvious from the demise of the conglomerate structure: i.e. the value of the Tobacco business did not have to be deduced from the BAT Industries and Zurich share prices; on 8 September 1998 British American Tobacco had a standalone share price. On that day the shares rose c30% as the value of the tobacco business became evident as a standalone business.
The demerger was closely followed by the acquisition of Rothmans by BAT in January 1999 (see Figure 400). Some may argue that this transaction should have made our list. We argue that it is all but inconceivable that the owners of Rothmans would have countenanced a deal with BAT Industries: the demerger of BAT Industries was the catalyst to the Rothmans transaction hence its over-riding importance.

25 March 2014
Consumer Staples
European Consumer Staples
Deutsche Bank AG/London Page 151
Figure 400: BAT implied and actual share price (p) Dec 1997-Jan 1999
200
250
300
350
400
450
500
550
600
650
700
23-D
ec-9
7
23-J
an-9
8
23-F
eb-9
8
23-M
ar-9
8
23-A
pr-9
8
23-M
ay-9
8
23-J
un-9
8
23-J
ul-9
8
23-A
ug-9
8
23-S
ep-9
8
23-O
ct-9
8
23-N
ov-9
8
23-D
ec-9
8
Proposed BAT Industries demerger/merger with Zurich announced 23 December 1997
Last dealing as BAT Industries on Friday 4th
September 1998. Demerger/merger completed
Monday 7th September 1998. Dealings as British American
Tobacco start Tuesday September 8th. Implied British American Tobacco price 301p on 4th, closed at 466p on 8th
Acquisition of Rothmans announced
Share price moves froman implied price via BAT Industries/ Zurich to an actual market quote asBritish American Tobacco
Source: Datastream; Deutsche Bank
Second, Imperial’s acquisition of Reemtsma in March 2002, which transformed Imperial overnight and immediately illustrated the continued mis-pricing of tobacco assets, and therefore the upside potential of the sector.
Our only gripe on the announcement of the deal (and still our only gripe) was a £1bn rights issue to help fund the deal: we saw no need for it.
Ignoring why, or who, forced the capital raising our lack of understanding of why the additional capital was required is probably vindicated by the fact that having completed the acquisition in May 2002 Imperial was buying back its own equity in February 2005, less than three years later. By March 2007 Imperial had repurchased shares to the value of £862m (i.e. 86% of the Reemtsma rights issue) and this despite spending £368m to acquire the worldwide Davidoff cigarette trademark in 2006. The buy-back was only suspended because of the initial approach to Altadis in March 2007.

25 March 2014
Consumer Staples
European Consumer Staples
Page 152 Deutsche Bank AG/London
Figure 401: IMT rel. to MSCI Europe (US$ terms) post Reemtsma acquisition
0
50
100
150
200
250
300
350
Mar
-02
Sep
-02
Mar
-03
Sep
-03
Mar
-04
Sep
-04
Mar
-05
Sep
-05
Mar
-06
Sep
-06
Mar
-07
Sep
-07
Mar
-08
Sep
-08
Mar
-09
Sep
-09
Mar
-10
Sep
-10
Mar
-11
Sep
-11
Mar
-12
Sep
-12
Mar
-13
Sep
-13
Mar
-14
Source: Datastream; Deutsche Bank
Finally, BATs investor event in Rome in May 2005 when then CFO Paul Rayner first laid out in detail the cost saving potential of the business; today shareholders are still seeing incremental savings from that initial articulation of BAT’s cost optimisation plan.
Figure 402: BAT rel. to MSCI Europe (US$) post Rome investor event May ‘05
0
50
100
150
200
250
300
350
May
-05
Oct
-05
Mar
-06
Aug
-06
Jan-
07
Jun-
07
Nov
-07
Apr
-08
Sep
-08
Feb-
09
Jul-0
9
Dec
-09
May
-10
Oct
-10
Mar
-11
Aug
-11
Jan-
12
Jun-
12
Nov
-12
Apr
-13
Sep
-13
Feb-
14
Source: Datastream; Deutsche Bank
Compounding the model So despite ‘only’ three catalysts the sector has significantly outperformed. Why?
Because of an incessant flow of positive news?
No, there has been plenty of news flow perceived by many as negative. Rather, because of the inevitable value creation of the ongoing compounding of the tobacco/Staples model to generate top line and free cash flow growth.

25 March 2014
Consumer Staples
European Consumer Staples
Deutsche Bank AG/London Page 153
Not a lot has changed in tobacco over the last 15 years:
volumes decline in mature markets; pricing compensates; revenues increase
volumes are stable/slightly increasing in emerging markets; prices rise; consumers trade up; revenues increase at a faster rate than in mature markets
capex requirements are limited with a tight control on working capital
cash conversion is strong and free cash flow per share growth closely matches EPS growth
virtually all free cash flow is returned to shareholders via the dividend and share buy-backs
that’s it. Many have tried to complicate the story (sometimes with valid reason, e.g. US litigation) but the value creation of the incessant compounding has won through...
... see Figure 403 showing BAT’s EPS progression
So, we return to the original question: what’s the catalyst?
Answer, more often than not: there isn’t one. Which means at any point there is no immediate perceived need, or perhaps desire, to own tobacco because no catalyst is imminent.
Irrespective of this lack of need/desire on a multi-year view history has proven investors should be overweight tobacco.
Why, when there is no catalyst?
Because of the inexorable compounding, see Figure 403.
Figure 403: BAT EPS compound growth 12.1% (DPS 13.9%) since 2003
69.2 76.6 89.3
98.1 108.5
128.8
153.0
175.7 194.6
205.2 216.6
38.8 41.9 47.0 55.9
66.2 83.7
99.5 114.2
126.5 134.9 142.4
0
50
100
150
200
250
2003 2004 2005 2006 2007 2008 2009 2010 2011 2012 2013
EPS DPS
Source: BAT; Deutsche Bank

25 March 2014
Consumer Staples
European Consumer Staples
Page 154 Deutsche Bank AG/London
What is true for tobacco is true for Staples in aggregate... but every so often the market makes the investor’s decision to take the multi-year view easier. It would be too aggressive to say the market ‘gets it ‘wrong’ re staples when it makes the multi-year decision easier, more it is a question of time-frames.
We return to the comments of Warren Buffett in the Berkshire Hathaway shareholder letter of 2004, “...be fearful when others are greedy and greedy only when others are fearful.”
While we have focussed on sector induced catalysts arguably catalysts can be two-fold:
sector driven as we have discussed above in the context of tobacco (of which we have argued that there have only been three real catalysts in 14 years tobacco) or
market induced: when the market reacts to short/medium term pressures such as the current EM induced impact on Staples where the negative market reaction provides the opportunity of a suitable entry point to take advantage of the serial compounding of Staples
We may be in the midst of the second. Catalysts are rare in Staples, opportunities less so. The current opportunity may remain for a number of months (i.e. the sector continues to underperform) but we have little doubt investor should be circling the Staples names.
25 March 2014
Consumer Staples
European Consumer Staples
Deutsche Bank AG/London Page 155
Addendum: Credit Impulse
Demand growth is related to changes in the flow of credit
Convention The conventional approach when associating developments in credit and demand is to compare credit growth with demand growth. This suggests that for economic growth to resume after a credit crisis, credit growth needs to turn positive.
Flawed convention? In our view this comparison is flawed – developments in a flow variable (domestic demand) are being compared to developments in a stock variable (credit). To the extent that spending is credit-financed, demand should be related to new borrowing, or the flow of credit. Consequently, demand growth should be related to changes in the flow of credit, rather than changes in the stock (credit growth).
The Credit Impulse Spending at any time depends on the amount of new borrowing that takes place at that time, and therefore spending growth depends on the change in new borrowing. If new borrowing is negative but rising, spending growth can be strong even as credit growth is negative. To see this, assume households have income of 100 in year 1 but pay down debt by 40, they may spend 60. If households still have an income of 100 in year 2 and they pay down debt by 20, they may spend 80. In year 2 households are paying down debt by 20 and credit growth is negative but, because they are paying down debt more slowly than in year 1, new borrowing rises (from -40 to -20) and spending rises from 60 to 80. Spending rises because the pace of de-leveraging slows.
The change in GDP is related to the second derivative of credit (the credit impulse) rather than credit growth. Or, to put it another way, spending growth depends not on the level of credit growth, but on whether credit growth is rising or falling.
To illustrate this point, perhaps two analogies might be useful. Firstly, the real economy analogy of the credit impulse is the inventory cycle. Inventories are a stock concept, and it is the change in inventories (stock-building) that enters into GDP. And because it is the change in inventories that has an impact on GDP, it is the change in the change in inventories (the change in stock- building) that has an impact on GDP growth. Inventories can be falling but, if they are falling by less this year than they did last year, inventories make a positive contribution to GDP growth.
Secondly, the public sector equivalent of the credit impulse is the fiscal impulse, or the change in the budget deficit. Assume a government was running a budget surplus of 10% of GDP, and they chose to cut taxes so that the surplus fell to 5% of GDP. These tax cuts would likely boost real domestic demand growth. However, because the government is still running a surplus, public sector debt is still falling. The narrowing in the budget surplus would allow governments to de-lever and boost demand at the same time.

25 March 2014
Consumer Staples
European Consumer Staples
Page 156 Deutsche Bank AG/London
This has an important implication for the impact of credit on spending in general, but in particular on recoveries after credit crises. After a credit crisis all that is required for a recovery in demand growth is that new borrowing rises – it is not necessary that the level of new borrowing (and therefore credit growth) is positive. If households are de-leveraging, then a slowdown in the pace of de-leveraging will be sufficient to boost demand growth. A credit-led rebound in domestic demand growth can occur even while credit growth is negative and debt levels fall.
Figure 404: US private sector demand growth and the credit impulse
-12
-8
-4
0
4
8
12
16
-12
-8
-4
0
4
8
1928 1938 1948 1958 1968 1978 1988 1998 2008
Credit impulse, % of GDP
Real consumption + investment (rhs)
% yoychange, % of GDP
United States
Source: Deutsche Bank, US Bureau of the Census, BEA
As empirical support for this view, we show the credit impulse for the US against real private sector demand growth since 1928 (Figure 404). In our view the correlation is excellent.
The numerical example
Figure 405: Credit & spending growth Year Income New
borrowing Spending Stock of
debtSpending
growthCredit
growthCredit
impulse*
0 200
1 100 0 100 200
2 100 10 110 210 10.0% 5.0% 10
3 100 10 110 220 0.0% 4.8% 0
4 100 5 105 225 -4.5% 2.3% -5
5 100 -10 90 215 -14.3% -4.4% -15
6 100 -5 95 210 5.6% -2.3% 5Source: Deutsche Bank; *The credit impulse is the change in new borrowing
In year 1, the household has an income of 100, but it is unable to borrow. It spends 100 and, because it did not borrow, its debt level remains at 200.
In year 2 the household earns 100 again, but is able to borrow 10. It spends 110, debt increases by 10, and spending and credit growth are 10.0% and 5.0% respectively.

25 March 2014
Consumer Staples
European Consumer Staples
Deutsche Bank AG/London Page 157
In year 3, the household again borrows 10 and spends it. However, while this pushes total debt up by a further 10, total spending remains unchanged at 110. Credit growth falls only mildly from 5.0% to 4.8%, but spending growth falls from 10.0% to 0.0%. The reason for this is that while the flow of credit increased by 10 in year 2 relative to year 1, it is unchanged at 10 in year 3 relative to year 2. Credit growth is positive, but growth in new credit has fallen to 0.0%.
Assume that in year 4 households are only able to borrow 5. Spending falls to 105 from 110, but debt levels rise from 220 to 225. Credit growth is positive (+2.3%), but spending growth is negative (-4.5%).
If households have to pay back 10 of their debt in year 5, credit growth falls from 2.3% to -4.4%, and spending growth from -4.5% to -14.3%. Credit growth is still falling, and consequently spending growth falls further.
In year 6, if households only have to pay back 5 of their debt, the flow of credit increases from -10 to -5. The pace of de-leveraging slows, and consequently spending growth rebounds. However, while credit growth increases, it is still negative.
The fluctuations in spending growth are not at all well correlated with fluctuations in credit growth, but they are extremely well correlated with changes in the credit impulse.

25 March 2014
Consumer Staples
European Consumer Staples
Page 158 Deutsche Bank AG/London
This page has been left blank intentionally

25 March 2014
Consumer Staples
European Consumer Staples
Deutsche Bank AG/London Page 159
Addendum: Mr Market
Berkshire Hathaway Shareholder Letter 1987
Emphasis added
“Ben Graham, my friend and teacher, long ago described the mental attitude toward market fluctuations that I believe to be most conducive to investment success. He said that you should imagine market quotations as coming from a remarkably accommodating fellow named Mr. Market who is your partner in a private business. Without fail, Mr. Market appears daily and names a price at which he will either buy your interest or sell you his.
“Even though the business that the two of you own may have economic characteristics that are stable, Mr. Market's quotations will be anything but. For, sad to say, the poor fellow has incurable emotional problems. At times he feels euphoric and can see only the favourable factors affecting the business. When in that mood, he names a very high buy-sell price because he fears that you will snap up his interest and rob him of imminent gains. At other times he is depressed and can see nothing but trouble ahead for both the business and the world. On these occasions he will name a very low price, since he is terrified that you will unload your interest on him.
“Mr. Market has another endearing characteristic: He doesn't mind being ignored. If his quotation is uninteresting to you today, he will be back with a new one tomorrow. Transactions are strictly at your option. Under these conditions, the more manic-depressive his behaviour, the better for you.
“But, like Cinderella at the ball, you must heed one warning or everything will turn into pumpkins and mice: Mr. Market is there to serve you, not to guide you. It is his pocketbook, not his wisdom, that you will find useful. If he shows up some day in a particularly foolish mood, you are free to ignore him or to take advantage of him, but it will be disastrous if you fall under his influence. Indeed, if you aren't certain that you understand and can value your business far better than Mr. Market, you don't belong in the game. As they say in poker, "If you've been in the game 30 minutes and you don't know who the patsy is, you're the patsy”.
“...[A]n investor will succeed by coupling good business judgment with an ability to insulate his thoughts and behaviour from the super-contagious emotions that swirl about the marketplace. In my own efforts to stay insulated, I have found it highly useful to keep Ben's Mr. Market concept firmly in mind.”

25 March 2014
Consumer Staples
European Consumer Staples
Page 160 Deutsche Bank AG/London
This page has been left blank intentionally
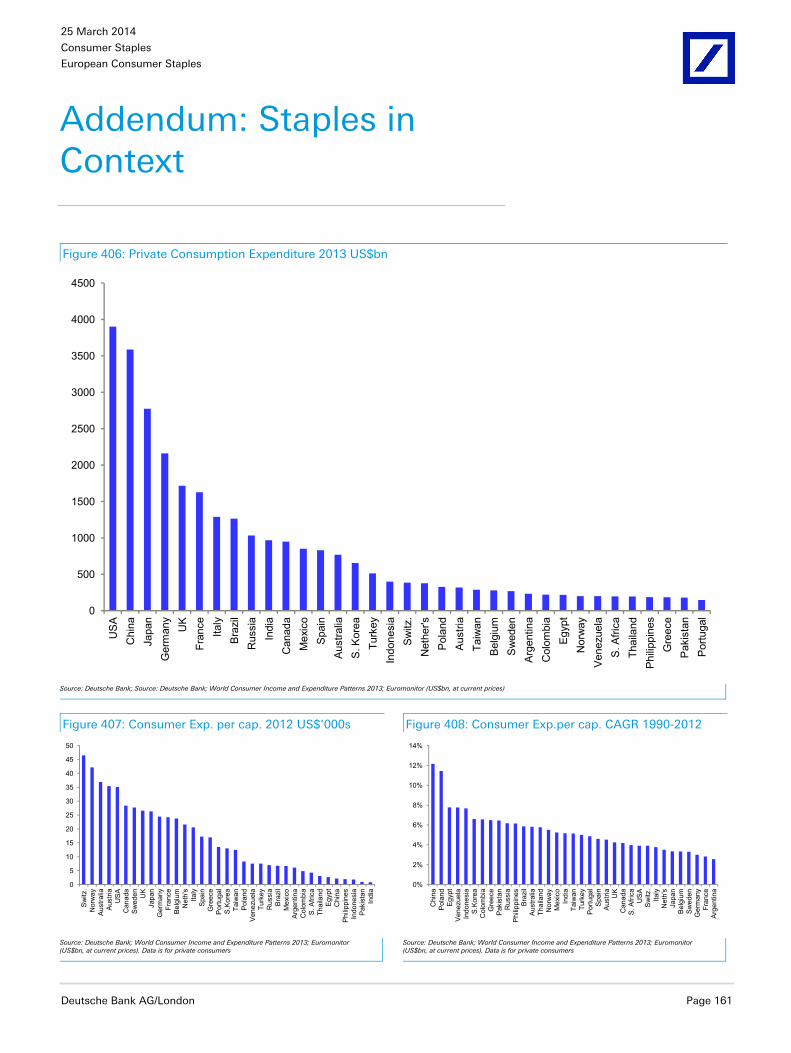
25 March 2014
Consumer Staples
European Consumer Staples
Deutsche Bank AG/London Page 161
Addendum: Staples in Context
Figure 406: Private Consumption Expenditure 2013 US$bn
0
500
1000
1500
2000
2500
3000
3500
4000
4500
US
AC
hina
Japa
nG
erm
any
UK
Fran
ceIta
lyB
razi
lR
ussi
aIn
dia
Can
ada
Mex
ico
Spa
inA
ustra
liaS
. Kor
eaTu
rkey
Indo
nesi
aS
witz
.N
ethe
r'sP
olan
dA
ustri
aTa
iwan
Bel
gium
Sw
eden
Arg
entin
aC
olom
bia
Egy
ptN
orw
ayV
enez
uela
S. A
frica
Thai
land
Phi
lippi
nes
Gre
ece
Pak
ista
nP
ortu
gal
Source: Deutsche Bank; Source: Deutsche Bank; World Consumer Income and Expenditure Patterns 2013; Euromonitor (US$bn, at current prices)
Figure 407: Consumer Exp. per cap. 2012 US$’000s Figure 408: Consumer Exp.per cap. CAGR 1990-2012
0
5
10
15
20
25
30
35
40
45
50
Sw
itz.
Nor
way
Aus
tralia
Aus
tria
US
AC
anad
aS
wed
en UK
Japa
nG
erm
any
Fran
ceB
elgi
umN
eth'
sIta
lyS
pain
Gre
ece
Por
tuga
lS
.Kor
eaTa
iwan
Pola
ndV
enez
uela
Turk
eyR
ussi
aB
razi
lM
exic
oA
rgen
tina
Col
ombi
aS
. Afri
caTh
aila
ndE
gypt
Chi
naP
hilip
pine
sIn
done
sia
Pak
ista
nIn
dia
0%
2%
4%
6%
8%
10%
12%
14%
Chi
naP
olan
dE
gypt
Ven
ezue
laIn
done
sia
S.K
orea
Col
ombi
aG
reec
eP
akis
tan
Rus
sia
Phi
lippi
nes
Bra
zil
Aus
tralia
Thai
land
Nor
way
Mex
ico
Indi
aTa
iwan
Turk
eyP
ortu
gal
Spa
inA
ustri
aU
KC
anad
aS
. Afri
caU
SA
Sw
itz.
Italy
Net
h's
Japa
nB
elgi
umS
wed
enG
erm
any
Fran
ceA
rgen
tina
Source: Deutsche Bank; World Consumer Income and Expenditure Patterns 2013; Euromonitor (US$bn, at current prices). Data is for private consumers Source: Deutsche Bank; World Consumer Income and Expenditure Patterns 2013; Euromonitor
(US$bn, at current prices). Data is for private consumers

25 March 2014
Consumer Staples
European Consumer Staples
Page 162 Deutsche Bank AG/London
Figure 409: Consumer exp. by purpose 2011 US$bn Figure 410: Consumer exp. by purpose 2011 US$bn
0
5
10
15
20
25
30
35
40
US
A
Chi
na
Japa
n
Ger
m.
Bra
zil
Rus
sia
Indi
a
Fran
ce
Italy
UK
Mex
ico
Can
ada
Spa
in
Indo
n.
Turk
ey
Aus
tralia
S. K
orea
Pol
and
Thai
land
S. A
frica
Arg
.
Net
h's
Belg
ium
Phi
lip'e
s
Sw
eden
Alcohol, beverages, tobacco Food, non-alcoholic beverages
Health goods, medical services Household goods and services
0%
10%
20%
30%
40%
50%
60%
US
AC
hina
Japa
nG
erm
.Br
azil
Rus
sia
Indi
aFr
ance
Italy
UK
Mex
ico
Can
ada
Spa
inIn
don.
Turk
eyA
ustra
liaS.
Kor
eaP
olan
dTh
aila
ndS
. Afri
caA
rg.
Net
h's
Bel
gium
Phi
lip'e
sS
wed
en
Alcohol, beverages, tobacco Food, non-alcoholic beverages
Health goods, medical services Household goods and services
Source: Deutsche Bank; World Consumer Income and Expenditure Patterns 2013; Euromonitor (US$bn, at current prices). Data is for private consumers Source: Deutsche Bank; World Consumer Income and Expenditure Patterns 2013; Euromonitor
(US$bn, at current prices). Data is for private consumers
Figure 411: World Alcohol and Tobacco Consumption
USA20%
Japan12%
Russia11%
China2%Germany
10%
UK6%
France5%
Italy3%
India1%
RoW30%
1990: total spend US$450bn
USA19%
Japan9%
Russia6%
China6%
Germany5%
UK5%
France4%
Italy3%
India3%
RoW40%
2011: total spend US$1106bn
Source: Deutsche Bank; World Consumer Income and Expenditure Patterns 2013; Euromonitor (US$bn, at current prices). Data is for private consumers
Figure 412: World Food and Non-Alcoholic Beverage Consumption
USA17%
China4%
Japan13%
Russia4%
India5%
Brazil2%Germany
7%France
5%
Italy5%
Mexico2%
RoW36%
1990: total spend US2062bn
USA12%
China11%
Japan9%
Russia5%
India5%Brazil4%Germany
4%France
4%
Italy4%
Mexico3%
RoW39%
2011: total spend US$5627bn
Source: Deutsche Bank; World Consumer Income and Expenditure Patterns 2013; Euromonitor (US$bn, at current prices). Data is for private consumers

25 March 2014
Consumer Staples
European Consumer Staples
Deutsche Bank AG/London Page 163
Valuation & Risks
Campari (€5.710, Target Price €5.60, HOLD)
Valuation Our TP is DCF based. It is calculated using a WACC of 8.4% (incorporating risk premium of 4.3%, risk-free rate 4.0%, cost of debt of 4.5% and levered beta 1.1), mid term cash flow growth of 5.0% and a LTGR of 1.5%.
Risks Italy and the US are the group's principal markets, accounting for around 25% and 20% of sales, respectively. As such the company could be vulnerable to any major duty increases, downturn in consumer expenditure or aggressive competitive activity in those markets. Upside risk comes from management's ability to build brands and find additional value enhancing acquisitions. Movement in the US dollar/Brazilian real relative to the Euro is a further risk.
Remy (€58.71, Target Price €56.5, HOLD)
Valuation Our target price is DCF driven and calculated via a WACC of 8.4% (incorporating a levered beta of 1.1, net debt/EV ratio of 20%, risk-free rate of 4.0% and 5.0% cost of debt), medium-term cash flow growth at 6.5%, and a long term growth rate of 1.5%.
Risks Major downside risks revolve around the growth of Cognac in China, competitor activities in key regions and M&A. Key upside risk is faster recovery in China than expected.
ABI (€73.55, Target Price €70, HOLD)
Valuation We base our price target on a DCF model, the core assumptions being a WACC of 7.2% (incorporating a levered beta of 0.75, net debt/EV ratio of 20%, risk-free rate of 4.0% and 4.25% cost of debt), medium-term cash flow growth of 2.5% a year, and a post year-10 terminal growth rate of 1.5%.
Risk Major risks include volume declines, price deflation and competition in its major mature markets; on the upside, larger cash returns to shareholders; involvement in further large-scale M&A (upside and downside risk). At the macro level, both upside and downside risks include economic growth in key markets (particularly the US, Brazil and Mexico) and currency movements.

25 March 2014
Consumer Staples
European Consumer Staples
Page 164 Deutsche Bank AG/London
Carlsberg (DKK 513.5, Target Price DKK600, HOLD)
Valuation We base our price target on a DCF-model, the core assumptions behind which are a WACC of 9.21% (incorporating a levered beta of 1.22, net debt / EV ratio of 15%, risk-free rate of 4%, risk premium rate of 4.3% and 4.5% cost of debt), medium-term cash flow growth of 5% a year, and a post year-10 terminal growth rate of 1.5%, which reflects our long term view of the sector.
Risk Key upside and downside risks relate to macroeconomic factors and competitive dynamics in Russia, input costs, and the volume outlook and competitive intensity in Carlsberg's mature Western European markets.
SABMiller (2835p, Target Price 3000p, HOLD)
Valuation We base our price target on a DCF model, the core assumptions behind which are a WACC of 9.0% (incorporating a levered beta of 1.2, net debt/ EV of 15%, risk-free rate of 4.0%, risk premium of 4.3% and 4.5% cost of debt), medium-term cash flow growth of 7.5% a year, and a post year-10 terminal growth rate of 1.5% (reflects our long term consumption trends in the sector)
Risk Key risks (both upside and downside) include macroeconomic and exchange rate volatility (SAB generates a significant portion of its income from emerging markets, and reports in US$ although its share price is quoted in sterling), potential overpayment for an acquisition (downside) and an improved margin performance from cost-control initiatives and reducing input cost inflation (upside).
CCH (1477p, Target Price 1700p, HOLD)
Valuation We base our price target on a DCF model, the core assumptions behind which are a WACC of 9.8% (incorporating a levered beta of 1.5, net debt/EV of 20%, risk-free rate of 4.0%, risk premium of 4.3% and 4.5% cost of debt), medium-term cash flow growth of 7.5% pa and a post year-10 terminal growth rate of 2.5%.
Risks Risks (upside and downside) include macroeconomic developments in the EU and C&E Europe, movements in raw material prices, long-term consumer trends in carbonated soft drinks, and corporate activity. Finally, institutional shareholders remain in a minority position.

25 March 2014
Consumer Staples
European Consumer Staples
Deutsche Bank AG/London Page 165
Danone (€49.78, €50, HOLD)
Valuation Given Danone's steadily growing cash flows over the long term, we favour DCF methodology as our valuation tool. Our Danone DCF is based on 7% pa mid-term cash flow growth fading to 1.5% pa long-term growth. We also assume a WACC of 8.6% (based on a levered beta of 1, equity risk premium 4.3% and risk free rate 4.0% as we do for all food stocks.
Risks There are several upside/downside risks. These principally concern turnaround in its key dairy division, success of product launches, conditions in key countries like Spain, France and Russia; the main raw material risks are on PET, sugar, fruit and milk costs; regulatory risks; supply risks include concern over mineral water availability. Finally Danone has a healthy FCF position and its reinvestment is a risk.
Henkel (€75.05, Target price €85, BUY)
Valuation Given Henkel's steadily growing cash flows over the long term, we favour DCF methodology as our valuation tool. We also sense-check our DCF outcome against traditional multiple valuation. Our Henkel DCF-derived target price is based on 5.5% pa midterm cash flow growth fading to 1.5% pa long-term. This is based on our growth analysis of Henkel's three divisions. We also assume a WACC of 8.6% based on a levered Beta of 1.1, equity risk premium 4.3% and risk free rate of 4.0%, as we do for all HPC companies.
Risk Henkel's profits are partly driven by successive restructuring programs. As a result, execution of these plans on time is crucial to forecasts. 30% of Henkel's cost base is oil-related and therefore the oil price environment can add volatility to the gross profit performance. However, we think the major key risk to our target price is expected margin progress we forecast up to 2016 fails to occur. Execution of M&A strategy is an additional risk.
L’Oreal (€115.20, Target price €115, HOLD)
Valuation Given L'Oreal's steady but growing cash flows over the long term, we favour DCF methodology as our valuation tool. We also sense-check our DCF outcome against traditional multiple valuation. Our L'Oreal DCF is based on 8% pa midterm cashflow growth fading to 2% pa long term growth. We use an 87% equity funded WACC of 8.75% based on a risk free rate of 4.0%, an equity risk premium of 4.3% and beta 1.1x. Our terminal growth rate of 2.0% reflects our long-term industry volume growth view.
Risk There are several upside and downside risks to our target price that include: 1) the possible impact of a change in the value of Sanofi, c.10% of L'Oreal's total market cap; 2) the potential volatility which any M&A transaction could bring, something management has said it is considering; 3) an improvement or slowing in the consumer spending outlook, especially in developed markets; and 4) currency moves.

25 March 2014
Consumer Staples
European Consumer Staples
Page 166 Deutsche Bank AG/London
Imperial Tobacco (2425p, Target Price 3000p, BUY)
Valuation Our price target is based on a DCF model, the key assumptions for which are a WACC of 7.3% (using a levered beta of 0.9, a net debt/EV ratio of 28%, risk-free rate of 4.0% and a cost of debt of 4.0%), ungeared cash flow growth in years 6-10 of 3.7% a year, and a terminal growth rate of -1% (in line with the sector, due to regulatory and social pressures on tobacco consumption).
Risk Investing in cigarette biased tobacco carries specific risks (regulation, duty increases, volume declines in high-margin markets, etc). In addition to these general sector risks, Imperial, is exposed to macroeconomic challenges in the Eurozone, exchange rate movements (particularly euro/sterling) and competition in key markets.
Swedish Match (SEK204.60, Target price SEK193, HOLD)
Valuation Our target price is based on DCF valuation given the stability of cash flows. The core assumptions behind our DCF are a WACC of 7.8% (incorporating a levered beta of 0.8, risk-free rate of 4%, equity risk premium of 4.3%, net debt/EV ratio of 15% and cost of debt of 5%), medium-term cash flow growth of 1.8% per annum, and a post year-10 terminal growth rate of 0% assuming no growth in the snus/tobacco business in long term.
Risks All the European tobacco stocks face risks from regulation and taxation; in addition SWMA faces competition in Nordic markets and US snuff markets, and is exposed to currency movements which offer upside and downside risks. Given the long-term trend towards consolidation, SWMA is often considered an acquisition target; an upside risk.
All prices as at close 24 March 2014.

25 March 2014
Consumer Staples
European Consumer Staples
Deutsche Bank AG/London Page 167
The authors of this report wish to acknowledge the contributions made by Archit Agarwal, Shwetha Ramachandran and Meera Mohan, employees of Irevna Limited, a third-party provider to Deutsche Bank of offshore research support services.

25 March 2014
Consumer Staples
European Consumer Staples
Page 168 Deutsche Bank AG/London
This page has been left blank intentionally

25 March 2014
Consumer Staples
European Consumer Staples
Deutsche Bank AG/London Page 169
Appendix 1
Important Disclosures Additional information available upon request Disclosure checklist
Company Ticker Recent price* Disclosure
Remy Cointreau RCOP.PA 58.71 (EUR) 24 Mar 14 14
Campari Group CPRI.MI 5.71 (EUR) 24 Mar 14 NA
Swedish Match SWMA.ST 204.60 (SEK) 24 Mar 14 6,7,14 *Prices are sourced from local exchanges via Reuters, Bloomberg and other vendors. Data is sourced from Deutsche Bank and subject companies
Important Disclosures Required by U.S. Regulators
Disclosures marked with an asterisk may also be required by at least one jurisdiction in addition to the United States. See Important Disclosures Required by Non-US Regulators and Explanatory Notes.
6. Deutsche Bank and/or its affiliate(s) owns one percent or more of any class of common equity securities of this company calculated under computational methods required by US law.
7. Deutsche Bank and/or its affiliate(s) has received compensation from this company for the provision of investment banking or financial advisory services within the past year.
14. Deutsche Bank and/or its affiliate(s) has received non-investment banking related compensation from this company within the past year.
Important Disclosures Required by Non-U.S. Regulators
Please also refer to disclosures in the Important Disclosures Required by US Regulators and the Explanatory Notes.
6. Deutsche Bank and/or its affiliate(s) owns one percent or more of any class of common equity securities of this company calculated under computational methods required by US law.
7. Deutsche Bank and/or its affiliate(s) has received compensation from this company for the provision of investment banking or financial advisory services within the past year.
For disclosures pertaining to recommendations or estimates made on securities other than the primary subject of this research, please see the most recently published company report or visit our global disclosure look-up page on our website at http://gm.db.com/ger/disclosure/DisclosureDirectory.eqsr Analyst Certification
The views expressed in this report accurately reflect the personal views of the undersigned lead analyst about the subject issuers and the securities of those issuers. In addition, the undersigned lead analyst has not and will not receive any compensation for providing a specific recommendation or view in this report. Gerry Gallagher

25 March 2014
Consumer Staples
European Consumer Staples
Page 170 Deutsche Bank AG/London
Historical recommendations and target price: Remy Cointreau (RCOP.PA) (as of 3/24/2014)
12
3
4
5
67
89
0.00
20.00
40.00
60.00
80.00
100.00
120.00
Mar 11 Jun 11 Sep 11 Dec 11 Mar 12 Jun 12 Sep 12 Dec 12 Mar 13 Jun 13 Sep 13 Dec 13
Sec
uri
ty P
rice
Date
Previous Recommendations
Strong Buy Buy Market Perform Underperform Not Rated Suspended Rating
Current Recommendations
Buy Hold Sell Not Rated Suspended Rating
*New Recommendation Structure as of September 9,2002
1. 10/06/2011: Buy, Target Price Change EUR65.00 6. 28/11/2012: Hold, Target Price Change EUR83.00
2. 21/07/2011: Buy, Target Price Change EUR70.00 7. 07/02/2013: Downgrade to Sell, Target Price Change EUR80.00
3. 24/04/2012: Buy, Target Price Change EUR75.00 8. 18/04/2013: Sell, Target Price Change EUR75.00
4. 19/07/2012: Downgrade to Hold, Target Price Change EUR95.00 9. 21/06/2013: No Recommendation, Target Price Change EUR0.00
5. 18/10/2012: Hold, Target Price Change EUR85.00 Historical recommendations and target price: Campari Group (CPRI.MI) (as of 3/24/2014)
1
23 4
5
6
7
89
0.00
1.00
2.00
3.00
4.00
5.00
6.00
7.00
Mar 11 Jun 11 Sep 11 Dec 11 Mar 12 Jun 12 Sep 12 Dec 12 Mar 13 Jun 13 Sep 13 Dec 13
Sec
uri
ty P
rice
Date
Previous Recommendations
Strong Buy Buy Market Perform Underperform Not Rated Suspended Rating
Current Recommendations
Buy Hold Sell Not Rated Suspended Rating
*New Recommendation Structure as of September 9,2002
1. 12/05/2011: Hold, Target Price Change EUR5.10 6. 03/09/2012: Buy, Target Price Change EUR6.20
2. 21/07/2011: Hold, Target Price Change EUR5.25 7. 28/10/2012: Downgrade to Hold, EUR6.20
3. 04/08/2011: Hold, Target Price Change EUR5.70 8. 12/11/2012: Hold, Target Price Change EUR6.00
4. 05/11/2011: Upgrade to Buy, Target Price Change EUR6.40 9. 21/06/2013: No Recommendation, Target Price Change EUR0.00
5. 29/04/2012: Buy, Target Price Change EUR6.00

25 March 2014
Consumer Staples
European Consumer Staples
Deutsche Bank AG/London Page 171
Historical recommendations and target price: Swedish Match (SWMA.ST) (as of 3/24/2014)
12
3
45
67
8
0.00
50.00
100.00
150.00
200.00
250.00
300.00
350.00
Mar 11 Jun 11 Sep 11 Dec 11 Mar 12 Jun 12 Sep 12 Dec 12 Mar 13 Jun 13 Sep 13 Dec 13
Sec
uri
ty P
rice
Date
Previous Recommendations
Strong Buy Buy Market Perform Underperform Not Rated Suspended Rating
Current Recommendations
Buy Hold Sell Not Rated Suspended Rating
*New Recommendation Structure as of September 9,2002
1. 19/04/2011: Downgrade to Sell, SEK205.00 5. 03/07/2012: Sell, Target Price Change SEK250.00
2. 21/07/2011: Sell, Target Price Change SEK217.00 6. 31/10/2012: Upgrade to Hold, Target Price Change SEK230.00
3. 23/02/2012: Sell, Target Price Change SEK225.00 7. 20/02/2013: Hold, Target Price Change SEK225.00
4. 04/05/2012: Sell, Target Price Change SEK240.00 8. 21/06/2013: No Recommendation, Target Price Change SEK0.00 Equity rating key Equity rating dispersion and banking relationships
Buy: Based on a current 12- month view of total share-holder return (TSR = percentage change in share price from current price to projected target price plus pro-jected dividend yield ) , we recommend that investors buy the stock. Sell: Based on a current 12-month view of total share-holder return, we recommend that investors sell the stock Hold: We take a neutral view on the stock 12-months out and, based on this time horizon, do not recommend either a Buy or Sell. Notes:
1. Newly issued research recommendations and target prices always supersede previously published research. 2. Ratings definitions prior to 27 January, 2007 were:
Buy: Expected total return (including dividends) of 10% or more over a 12-month period Hold: Expected total return (including dividends) between -10% and 10% over a 12-month period Sell: Expected total return (including dividends) of -10% or worse over a 12-month period
36 %
56 %
8 %53 % 37 %
30 %0
50100150200250300
350400
Buy Hold Sell
European Universe
Companies Covered Cos. w/ Banking Relationship

25 March 2014
Consumer Staples
European Consumer Staples
Page 172 Deutsche Bank AG/London
Regulatory Disclosures
1. Important Additional Conflict Disclosures
Aside from within this report, important conflict disclosures can also be found at https://gm.db.com/equities under the "Disclosures Lookup" and "Legal" tabs. Investors are strongly encouraged to review this information before investing.
2. Short-Term Trade Ideas
Deutsche Bank equity research analysts sometimes have shorter-term trade ideas (known as SOLAR ideas) that are consistent or inconsistent with Deutsche Bank's existing longer term ratings. These trade ideas can be found at the SOLAR link at http://gm.db.com.
3. Country-Specific Disclosures
Australia and New Zealand: This research, and any access to it, is intended only for "wholesale clients" within the meaning of the Australian Corporations Act and New Zealand Financial Advisors Act respectively. Brazil: The views expressed above accurately reflect personal views of the authors about the subject company(ies) and its(their) securities, including in relation to Deutsche Bank. The compensation of the equity research analyst(s) is indirectly affected by revenues deriving from the business and financial transactions of Deutsche Bank. In cases where at least one Brazil based analyst (identified by a phone number starting with +55 country code) has taken part in the preparation of this research report, the Brazil based analyst whose name appears first assumes primary responsibility for its content from a Brazilian regulatory perspective and for its compliance with CVM Instruction # 483. EU countries: Disclosures relating to our obligations under MiFiD can be found at http://www.globalmarkets.db.com/riskdisclosures. Japan: Disclosures under the Financial Instruments and Exchange Law: Company name - Deutsche Securities Inc. Registration number - Registered as a financial instruments dealer by the Head of the Kanto Local Finance Bureau (Kinsho) No. 117. Member of associations: JSDA, Type II Financial Instruments Firms Association, The Financial Futures Association of Japan, Japan Investment Advisers Association. Commissions and risks involved in stock transactions - for stock transactions, we charge stock commissions and consumption tax by multiplying the transaction amount by the commission rate agreed with each customer. Stock transactions can lead to losses as a result of share price fluctuations and other factors. Transactions in foreign stocks can lead to additional losses stemming from foreign exchange fluctuations. "Moody's", "Standard & Poor's", and "Fitch" mentioned in this report are not registered credit rating agencies in Japan unless Japan or "Nippon" is specifically designated in the name of the entity. Reports on Japanese listed companies not written by analysts of Deutsche Securities Inc. (DSI) are written by Deutsche Bank Group's analysts with the coverage companies specified by DSI. Qatar: Deutsche Bank AG in the Qatar Financial Centre (registered no. 00032) is regulated by the Qatar Financial Centre Regulatory Authority. Deutsche Bank AG - QFC Branch may only undertake the financial services activities that fall within the scope of its existing QFCRA license. Principal place of business in the QFC: Qatar Financial Centre, Tower, West Bay, Level 5, PO Box 14928, Doha, Qatar. This information has been distributed by Deutsche Bank AG. Related financial products or services are only available to Business Customers, as defined by the Qatar Financial Centre Regulatory Authority. Russia: This information, interpretation and opinions submitted herein are not in the context of, and do not constitute, any appraisal or evaluation activity requiring a license in the Russian Federation. Kingdom of Saudi Arabia: Deutsche Securities Saudi Arabia LLC Company, (registered no. 07073-37) is regulated by the Capital Market Authority. Deutsche Securities Saudi Arabia may only undertake the financial services activities that fall within the scope of its existing CMA license. Principal place of business in Saudi Arabia: King Fahad Road, Al Olaya District, P.O. Box 301809, Faisaliah Tower - 17th Floor, 11372 Riyadh, Saudi Arabia. United Arab Emirates: Deutsche Bank AG in the Dubai International Financial Centre (registered no. 00045) is regulated by the Dubai Financial Services Authority. Deutsche Bank AG - DIFC Branch may only undertake the financial services activities that fall within the scope of its existing DFSA license. Principal place of business in the DIFC: Dubai International Financial Centre, The Gate Village, Building 5, PO Box 504902, Dubai, U.A.E. This information has been distributed by Deutsche Bank AG. Related financial products or services are only available to Professional Clients, as defined by the Dubai Financial Services Authority.

GRCM2014PROD031690
David Folkerts-Landau
Group Chief Economist Member of the Group Executive Committee
Guy Ashton
Global Chief Operating Officer Research
Marcel Cassard Global Head
FICC Research & Global Macro Economics
Richard Smith and Steve Pollard Co-Global Heads Equity Research
Michael Spencer Regional Head
Asia Pacific Research
Ralf Hoffmann Regional Head
Deutsche Bank Research, Germany
Andreas Neubauer Regional Head
Equity Research, Germany
Steve Pollard Regional Head
Americas Research
International locations
Deutsche Bank AG Deutsche Bank Place Level 16 Corner of Hunter & Phillip Streets Sydney, NSW 2000 Australia Tel: (61) 2 8258 1234
Deutsche Bank AG Große Gallusstraße 10-14 60272 Frankfurt am Main Germany Tel: (49) 69 910 00
Deutsche Bank AG Filiale Hongkong International Commerce Centre, 1 Austin Road West,Kowloon, Hong Kong Tel: (852) 2203 8888
Deutsche Securities Inc. 2-11-1 Nagatacho Sanno Park Tower Chiyoda-ku, Tokyo 100-6171 Japan Tel: (81) 3 5156 6770
Deutsche Bank AG London 1 Great Winchester Street London EC2N 2EQ United Kingdom Tel: (44) 20 7545 8000
Deutsche Bank Securities Inc. 60 Wall Street New York, NY 10005 United States of America Tel: (1) 212 250 2500
Global Disclaimer The information and opinions in this report were prepared by Deutsche Bank AG or one of its affiliates (collectively "Deutsche Bank"). The information herein is believed to be reliable and has been obtained from public sources believed to be reliable. Deutsche Bank makes no representation as to the accuracy or completeness of such information.
Deutsche Bank may engage in securities transactions, on a proprietary basis or otherwise, in a manner inconsistent with the view taken in this research report. In addition, others within Deutsche Bank, including strategists and sales staff, may take a view that is inconsistent with that taken in this research report.
Opinions, estimates and projections in this report constitute the current judgement of the author as of the date of this report. They do not necessarily reflect the opinions of Deutsche Bank and are subject to change without notice. Deutsche Bank has no obligation to update, modify or amend this report or to otherwise notify a recipient thereof in the event that any opinion, forecast or estimate set forth herein, changes or subsequently becomes inaccurate. Prices and availability of financial instruments are subject to change without notice. This report is provided for informational purposes only. It is not an offer or a solicitation of an offer to buy or sell any financial instruments or to participate in any particular trading strategy. Target prices are inherently imprecise and a product of the analyst judgement.
As a result of Deutsche Bank’s March 2010 acquisition of BHF-Bank AG, a security may be covered by more than one analyst within the Deutsche Bank group. Each of these analysts may use differing methodologies to value the security; as a result, the recommendations may differ and the price targets and estimates of each may vary widely.
In August 2009, Deutsche Bank instituted a new policy whereby analysts may choose not to set or maintain a target price of certain issuers under coverage with a Hold rating. In particular, this will typically occur for "Hold" rated stocks having a market cap smaller than most other companies in its sector or region. We believe that such policy will allow us to make best use of our resources. Please visit our website at http://gm.db.com to determine the target price of any stock.
The financial instruments discussed in this report may not be suitable for all investors and investors must make their own informed investment decisions. Stock transactions can lead to losses as a result of price fluctuations and other factors. If a financial instrument is denominated in a currency other than an investor's currency, a change in exchange rates may adversely affect the investment. Past performance is not necessarily indicative of future results. Deutsche Bank may with respect to securities covered by this report, sell to or buy from customers on a principal basis, and consider this report in deciding to trade on a proprietary basis.
Unless governing law provides otherwise, all transactions should be executed through the Deutsche Bank entity in the investor's home jurisdiction. In the U.S. this report is approved and/or distributed by Deutsche Bank Securities Inc., a member of the NYSE, the NASD, NFA and SIPC. In Germany this report is approved and/or communicated by Deutsche Bank AG Frankfurt authorized by the BaFin. In the United Kingdom this report is approved and/or communicated by Deutsche Bank AG London, a member of the London Stock Exchange and regulated by the Financial Conduct Authority for the conduct of investment business in the UK and authorized by the BaFin. This report is distributed in Hong Kong by Deutsche Bank AG, Hong Kong Branch, in Korea by Deutsche Securities Korea Co. This report is distributed in Singapore by Deutsche Bank AG, Singapore Branch or Deutsche Securities Asia Limited, Singapore Branch (One Raffles Quay #18-00 South Tower Singapore 048583, +65 6423 8001), and recipients in Singapore of this report are to contact Deutsche Bank AG, Singapore Branch or Deutsche Securities Asia Limited, Singapore Branch in respect of any matters arising from, or in connection with, this report. Where this report is issued or promulgated in Singapore to a person who is not an accredited investor, expert investor or institutional investor (as defined in the applicable Singapore laws and regulations), Deutsche Bank AG, Singapore Branch or Deutsche Securities Asia Limited, Singapore Branch accepts legal responsibility to such person for the contents of this report. In Japan this report is approved and/or distributed by Deutsche Securities Inc. The information contained in this report does not constitute the provision of investment advice. In Australia, retail clients should obtain a copy of a Product Disclosure Statement (PDS) relating to any financial product referred to in this report and consider the PDS before making any decision about whether to acquire the product. Deutsche Bank AG Johannesburg is incorporated in the Federal Republic of Germany (Branch Register Number in South Africa: 1998/003298/10). Additional information relative to securities, other financial products or issuers discussed in this report is available upon request. This report may not be reproduced, distributed or published by any person for any purpose without Deutsche Bank's prior written consent. Please cite source when quoting.
Copyright © 2014 Deutsche Bank AG