Embed Size (px)
Citation preview
August 13, 2016
China: Consumer Staples
Equity Research
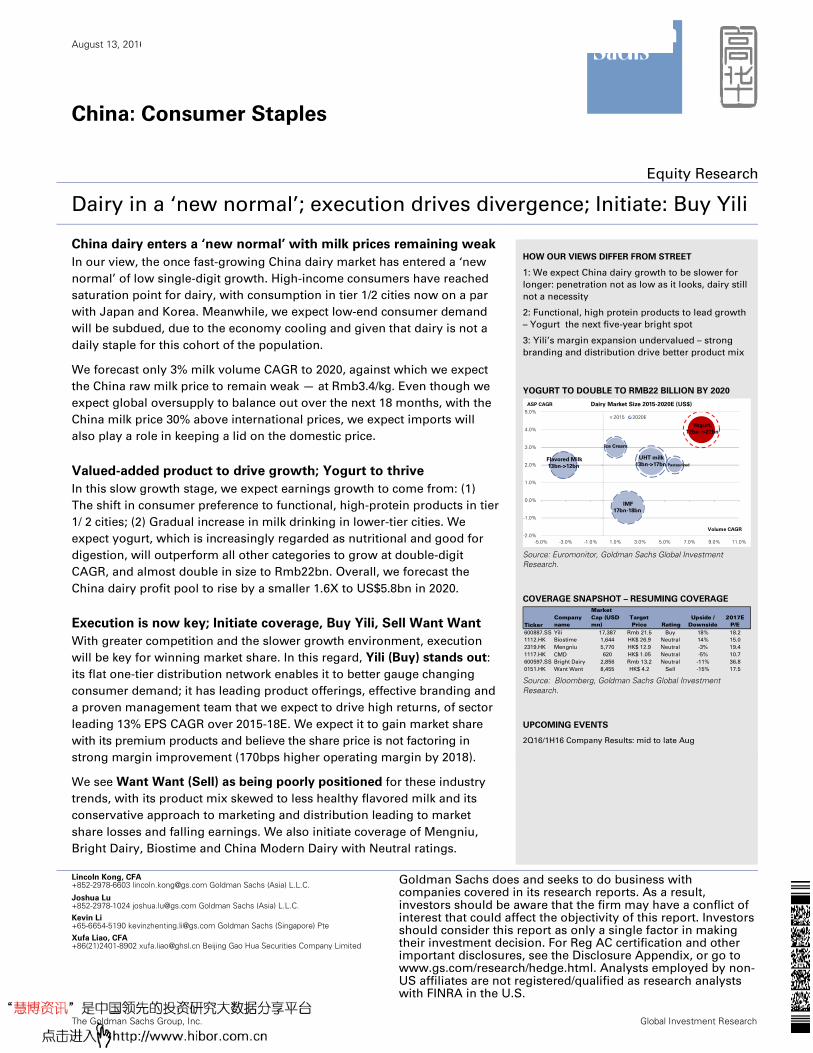
Dairy in a ‘new normal’; execution drives divergence; Initiate: Buy Yili
China dairy enters a ‘new normal’ with milk prices remaining weak
In our view, the once fast-growing China dairy market has entered a ‘new
normal’ of low single-digit growth. High-income consumers have reached
saturation point for dairy, with consumption in tier 1/2 cities now on a par
with Japan and Korea. Meanwhile, we expect low-end consumer demand
will be subdued, due to the economy cooling and given that dairy is not a
daily staple for this cohort of the population.
We forecast only 3% milk volume CAGR to 2020, against which we expect
the China raw milk price to remain weak — at Rmb3.4/kg. Even though we
expect global oversupply to balance out over the next 18 months, with the
China milk price 30% above international prices, we expect imports will
also play a role in keeping a lid on the domestic price.
Valued-added product to drive growth; Yogurt to thrive
In this slow growth stage, we expect earnings growth to come from: (1)
The shift in consumer preference to functional, high-protein products in tier
1/ 2 cities; (2) Gradual increase in milk drinking in lower-tier cities. We
expect yogurt, which is increasingly regarded as nutritional and good for
digestion, will outperform all other categories to grow at double-digit
CAGR, and almost double in size to Rmb22bn. Overall, we forecast the
China dairy profit pool to rise by a smaller 1.6X to US$5.8bn in 2020.
Execution is now key; Initiate coverage, Buy Yili, Sell Want Want
With greater competition and the slower growth environment, execution
will be key for winning market share. In this regard, Yili (Buy) stands out:
its flat one-tier distribution network enables it to better gauge changing
consumer demand; it has leading product offerings, effective branding and
a proven management team that we expect to drive high returns, of sector
leading 13% EPS CAGR over 2015-18E. We expect it to gain market share
with its premium products and believe the share price is not factoring in
strong margin improvement (170bps higher operating margin by 2018).
We see Want Want (Sell) as being poorly positioned for these industry
trends, with its product mix skewed to less healthy flavored milk and its
conservative approach to marketing and distribution leading to market
share losses and falling earnings. We also initiate coverage of Mengniu,
Bright Dairy, Biostime and China Modern Dairy with Neutral ratings.
HOW OUR VIEWS DIFFER FROM STREET
1: We expect China dairy growth to be slower for
longer: penetration not as low as it looks, dairy still
not a necessity
2: Functional, high protein products to lead growth
– Yogurt the next five-year bright spot
3: Yili’s margin expansion undervalued – strong
branding and distribution drive better product mix
YOGURT TO DOUBLE TO RMB22 BILLION BY 2020
Source: Euromonitor, Goldman Sachs Global Investment Research.
COVERAGE SNAPSHOT – RESUMING COVERAGE
Source: Bloomberg, Goldman Sachs Global Investment Research.
UPCOMING EVENTS
2Q16/1H16 Company Results: mid to late Aug
Lincoln Kong, CFA +852-2978-6603 [email protected] Goldman Sachs (Asia) L.L.C. Goldman Sachs does and seeks to do business with
companies covered in its research reports. As a result, investors should be aware that the firm may have a conflict of interest that could affect the objectivity of this report. Investors should consider this report as only a single factor in making their investment decision. For Reg AC certification and other important disclosures, see the Disclosure Appendix, or go to www.gs.com/research/hedge.html. Analysts employed by non-US affiliates are not registered/qualified as research analysts with FINRA in the U.S.
Joshua Lu +852-2978-1024 [email protected] Goldman Sachs (Asia) L.L.C. Kevin Li +65-6654-5190 [email protected] Goldman Sachs (Singapore) Pte
Xufa Liao, CFA +86(21)2401-8902 [email protected] Beijing Gao Hua Securities Company Limited
The Goldman Sachs Group, Inc. Global Investment Research
Pasteurized
UHT milk
13bn->17bnFlavored Milk
13bn->12bn
Yogurt,
12bn ->22bn
IMF
17bn-18bn
Ice Cream
-2.0%
-1.0%
0.0%
1.0%
2.0%
3.0%
4.0%
5.0%
-5.0% -3.0% -1.0% 1.0% 3.0% 5.0% 7.0% 9.0% 11.0%
Dairy Market Size 2015-2020E (US$)
2015 2020E
Volume CAGR
ASP CAGR
TickerCompany name
Market Cap (USD mn)
Target Price Rating
Upside / Downside
2017E P/E
600887.SS Yili 17,387 Rmb 21.5 Buy 18% 18.2
1112.HK Biostime 1,644 HK$ 26.9 Neutral 14% 15.0
2319.HK Mengniu 5,770 HK$ 12.9 Neutral -3% 19.4
1117.HK CMD 620 HK$ 1.05 Neutral -5% 10.7
600597.SS Bright Dairy 2,856 Rmb 13.2 Neutral -11% 36.8
0151.HK Want Want 8,455 HK$ 4.2 Sell -15% 17.5
August 13, 2016 China: Consumer Staples
Goldman Sachs Global Investment Research 2
Contents
Our thesis in 6 charts 4
China dairy enters a ‘new normal’ stage; milk price to remain weak 5
Slower growth for longer 5
Global milk price recovering in 2017, but China raw milk price to remain weak 7
Next growth driver: high protein, functional; Yogurt the bright spot 11
China profit pool to increase 1.6X by 2020 to Rmb5.8bn 11
Yogurt will be the bright spot 13
Execution is now the key: Yili stands out on distribution, branding 16
Products, branding, distribution, mgmt. comparison 16
Dairy 2020: Yili to gain market share in key product categories 24
Valuation: Yili our top pick, Want Want overvalued 29
Yili (Buy): A long-term stand-out leader; fastest sales/EPS growth 33
Want Want (Sell): Weaker brand could lead to further sales drop 40
Mengniu (Neutral): Sales recovering, but margin drags earnings 46
Biostime (Neutral): Swisse offset by weak IMF; Policy the key focus 51
Bright Dairy (Neutral): Stalled sales, GPM expansion offset by ANP 57
CMD (Neutral): Weak upstream to persist, brand expansion slower 62
Appendix: China dairy overview 68
Disclosure Appendix 74
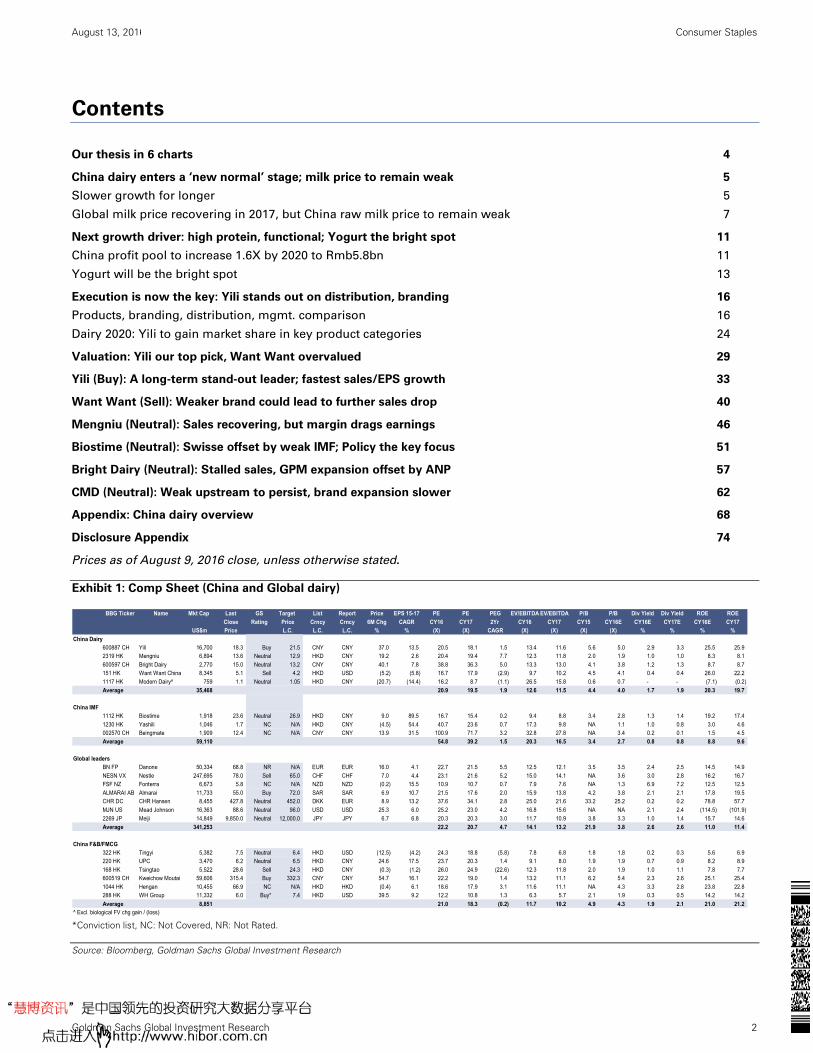
Prices as of August 9, 2016 close, unless otherwise stated.
Exhibit 1: Comp Sheet (China and Global dairy)
*Conviction list, NC: Not Covered, NR: Not Rated.
Source: Bloomberg, Goldman Sachs Global Investment Research
BBG Ticker Name Mkt Cap Last GS Target List Report EPS 15-17 PE PE PEG EV/EBITDA EV/EBITDA P/B P/B Div Yield Div Yield ROE ROE
Close Rating Price Crncy Crncy 6M Chg CAGR CY16 CY17 2Yr CY16 CY17 CY15 CY16E CY16E CY17E CY16E CY17
US$m Price L.C. L.C. L.C. % % (X) (X) CAGR (X) (X) (X) (X) % % % %
China Dairy
600887 CH Yili 16,700 18.3 Buy 21.5 CNY CNY 37.0 13.5 20.5 18.1 1.5 13.4 11.6 5.6 5.0 2.9 3.3 25.5 25.9
2319 HK Mengniu 6,894 13.6 Neutral 12.9 HKD CNY 19.2 2.6 20.4 19.4 7.7 12.3 11.8 2.0 1.9 1.0 1.0 8.3 8.1
600597 CH Bright Dairy 2,770 15.0 Neutral 13.2 CNY CNY 40.1 7.8 38.8 36.3 5.0 13.3 13.0 4.1 3.8 1.2 1.3 8.7 8.7
151 HK Want Want China 8,345 5.1 Sell 4.2 HKD USD (5.2) (5.8) 16.7 17.9 (2.9) 9.7 10.2 4.5 4.1 0.4 0.4 26.0 22.2
1117 HK Modern Dairy^ 759 1.1 Neutral 1.05 HKD CNY (20.7) (14.4) 16.2 8.7 (1.1) 26.5 15.8 0.6 0.7 - - (7.1) (0.2)
Average 35,468 20.9 19.5 1.9 12.6 11.5 4.4 4.0 1.7 1.9 20.3 19.7
China IMF
1112 HK Biostime 1,918 23.6 Neutral 26.9 HKD CNY 9.0 89.5 16.7 15.4 0.2 9.4 8.8 3.4 2.8 1.3 1.4 19.2 17.4
1230 HK Yashili 1,046 1.7 NC N/A HKD CNY (4.5) 54.4 40.7 23.6 0.7 17.3 9.8 NA 1.1 1.0 0.8 3.0 4.6
002570 CH Beingmate 1,909 12.4 NC N/A CNY CNY 13.9 31.5 100.9 71.7 3.2 32.8 27.8 NA 3.4 0.2 0.1 1.5 4.5
Average 59,110 54.8 39.2 1.5 20.3 16.5 3.4 2.7 0.8 0.8 8.8 9.6
Global leaders
BN FP Danone 50,334 68.8 NR N/A EUR EUR 16.0 4.1 22.7 21.5 5.5 12.5 12.1 3.5 3.5 2.4 2.5 14.5 14.9
NESN VX Nestle 247,695 78.0 Sell 65.0 CHF CHF 7.0 4.4 23.1 21.6 5.2 15.0 14.1 NA 3.6 3.0 2.8 16.2 16.7
FSF NZ Fonterra 6,673 5.8 NC N/A NZD NZD (0.2) 15.5 10.9 10.7 0.7 7.9 7.6 NA 1.3 6.9 7.2 12.5 12.5
ALMARAI AB Almarai 11,733 55.0 Buy 72.0 SAR SAR 6.9 10.7 21.5 17.6 2.0 15.9 13.8 4.2 3.8 2.1 2.1 17.8 19.5
CHR DC CHR Hansen 8,455 427.8 Neutral 452.0 DKK EUR 8.9 13.2 37.6 34.1 2.8 25.0 21.6 33.2 25.2 0.2 0.2 78.8 57.7
MJN US Mead Johnson 16,363 88.6 Neutral 96.0 USD USD 25.3 6.0 25.2 23.0 4.2 16.8 15.6 NA NA 2.1 2.4 (114.5) (101.9)
2269 JP Meiji 14,849 9,850.0 Neutral 12,000.0 JPY JPY 6.7 6.8 20.3 20.3 3.0 11.7 10.9 3.8 3.3 1.0 1.4 15.7 14.6
Average 341,253 22.2 20.7 4.7 14.1 13.2 21.9 3.8 2.6 2.6 11.0 11.4
China F&B/FMCG
322 HK Tingyi 5,382 7.5 Neutral 6.4 HKD USD (12.5) (4.2) 24.3 18.8 (5.8) 7.8 6.8 1.8 1.8 0.2 0.3 5.6 6.9
220 HK UPC 3,470 6.2 Neutral 6.5 HKD CNY 24.6 17.5 23.7 20.3 1.4 9.1 8.0 1.9 1.9 0.7 0.9 8.2 8.9
168 HK Tsingtao 5,522 28.6 Sell 24.3 HKD CNY (0.3) (1.2) 26.0 24.9 (22.6) 12.3 11.8 2.0 1.9 1.0 1.1 7.8 7.7
600519 CH Kweichow Moutai 59,606 315.4 Buy 332.3 CNY CNY 54.7 16.1 22.2 19.0 1.4 13.2 11.1 6.2 5.4 2.3 2.6 25.1 25.4
1044 HK Hengan 10,455 66.9 NC N/A HKD HKD (0.4) 6.1 18.6 17.9 3.1 11.6 11.1 NA 4.3 3.3 2.8 23.8 22.8
288 HK WH Group 11,332 6.0 Buy* 7.4 HKD USD 39.5 9.2 12.2 10.8 1.3 6.3 5.7 2.1 1.9 0.3 0.5 14.2 14.2
Average 8,851 21.0 18.3 (0.2) 11.7 10.2 4.9 4.3 1.9 2.1 21.0 21.2 ^ Excl. biological FV chg gain / (loss)
Price
August 13, 2016 China: Consumer Staples
Goldman Sachs Global Investment Research 3
PM Summary
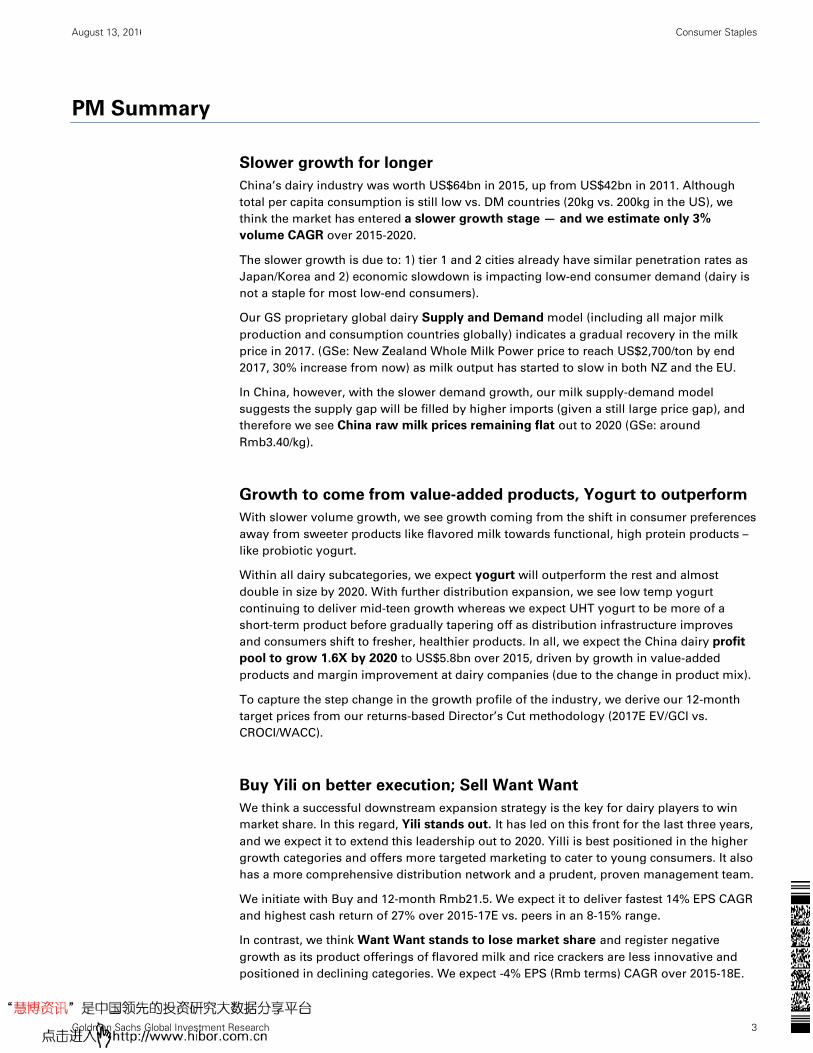
Slower growth for longer
China’s dairy industry was worth US$64bn in 2015, up from US$42bn in 2011. Although
total per capita consumption is still low vs. DM countries (20kg vs. 200kg in the US), we
think the market has entered a slower growth stage — and we estimate only 3%
volume CAGR over 2015-2020.
The slower growth is due to: 1) tier 1 and 2 cities already have similar penetration rates as
Japan/Korea and 2) economic slowdown is impacting low-end consumer demand (dairy is
not a staple for most low-end consumers).
Our GS proprietary global dairy Supply and Demand model (including all major milk
production and consumption countries globally) indicates a gradual recovery in the milk
price in 2017. (GSe: New Zealand Whole Milk Power price to reach US$2,700/ton by end
2017, 30% increase from now) as milk output has started to slow in both NZ and the EU.
In China, however, with the slower demand growth, our milk supply-demand model
suggests the supply gap will be filled by higher imports (given a still large price gap), and
therefore we see China raw milk prices remaining flat out to 2020 (GSe: around
Rmb3.40/kg).
Growth to come from value-added products, Yogurt to outperform
With slower volume growth, we see growth coming from the shift in consumer preferences
away from sweeter products like flavored milk towards functional, high protein products –
like probiotic yogurt.
Within all dairy subcategories, we expect yogurt will outperform the rest and almost
double in size by 2020. With further distribution expansion, we see low temp yogurt
continuing to deliver mid-teen growth whereas we expect UHT yogurt to be more of a
short-term product before gradually tapering off as distribution infrastructure improves
and consumers shift to fresher, healthier products. In all, we expect the China dairy profit
pool to grow 1.6X by 2020 to US$5.8bn over 2015, driven by growth in value-added
products and margin improvement at dairy companies (due to the change in product mix).
To capture the step change in the growth profile of the industry, we derive our 12-month
target prices from our returns-based Director’s Cut methodology (2017E EV/GCI vs.
CROCI/WACC).
Buy Yili on better execution; Sell Want Want
We think a successful downstream expansion strategy is the key for dairy players to win
market share. In this regard, Yili stands out. It has led on this front for the last three years,
and we expect it to extend this leadership out to 2020. Yilli is best positioned in the higher
growth categories and offers more targeted marketing to cater to young consumers. It also
has a more comprehensive distribution network and a prudent, proven management team.
We initiate with Buy and 12-month Rmb21.5. We expect it to deliver fastest 14% EPS CAGR
and highest cash return of 27% over 2015-17E vs. peers in an 8-15% range.
In contrast, we think Want Want stands to lose market share and register negative
growth as its product offerings of flavored milk and rice crackers are less innovative and
positioned in declining categories. We expect -4% EPS (Rmb terms) CAGR over 2015-18E.
August 13, 2016 China: Consumer Staples
Goldman Sachs Global Investment Research 4
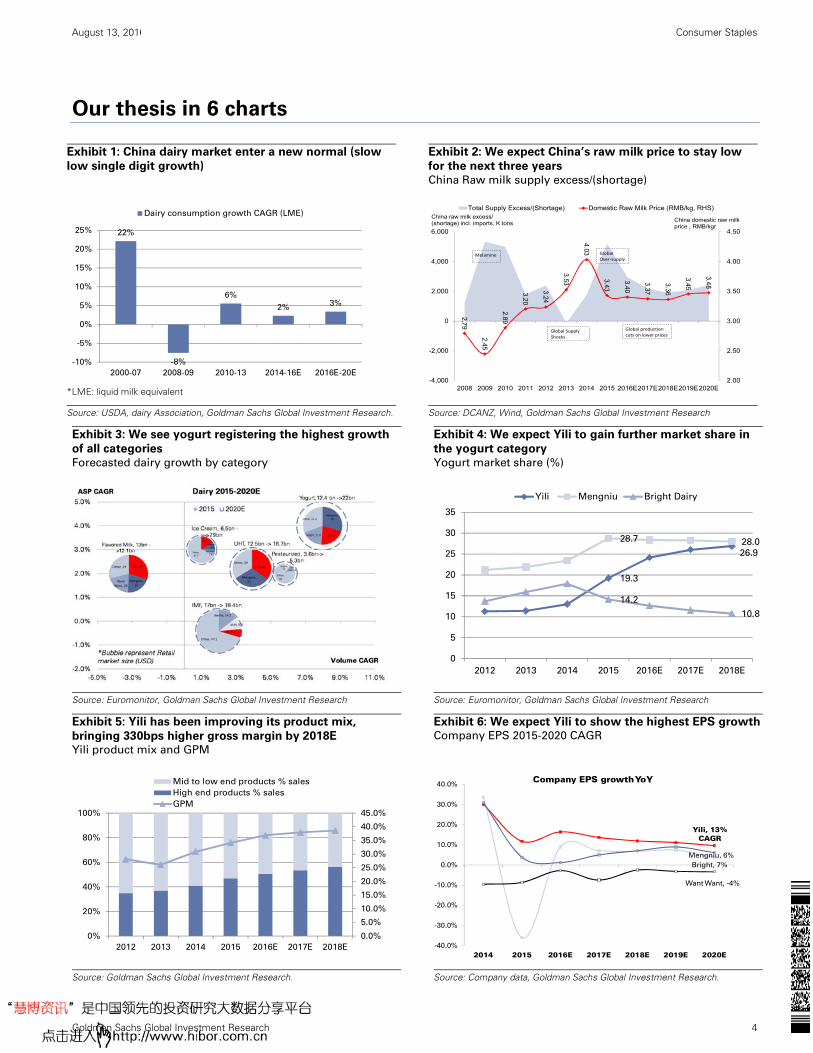
Our thesis in 6 charts
Exhibit 3: We see yogurt registering the highest growth
of all categories
Forecasted dairy growth by category
Exhibit 4: We expect Yili to gain further market share in
the yogurt category
Yogurt market share (%)
Source: Euromonitor, Goldman Sachs Global Investment Research
Source: Euromonitor, Goldman Sachs Global Investment Research
Exhibit 5: Yili has been improving its product mix,
bringing 330bps higher gross margin by 2018E Yili product mix and GPM
Exhibit 6: We expect Yili to show the highest EPS growth Company EPS 2015-2020 CAGR
Source: Goldman Sachs Global Investment Research.
Source: Company data, Goldman Sachs Global Investment Research.
19.3
26.9
28.7 28.0
14.2
10.8
0
5
10
15
20
25
30
35
2012 2013 2014 2015 2016E 2017E 2018E
Yili Mengniu Bright Dairy
0.0%
5.0%
10.0%
15.0%
20.0%
25.0%
30.0%
35.0%
40.0%
45.0%
0%
20%
40%
60%
80%
100%
2012 2013 2014 2015 2016E 2017E 2018E
Mid to low end products % sales
High end products % sales
GPM
Yili, 13% CAGR
Bright, 7%
Mengniu, 6%
Want Want, -4%
-40.0%
-30.0%
-20.0%
-10.0%
0.0%
10.0%
20.0%
30.0%
40.0%
2014 2015 2016E 2017E 2018E 2019E 2020E
Company EPS growth YoY
Exhibit 1: China dairy market enter a new normal (slow
low single digit growth)
Exhibit 2: We expect China’s raw milk price to stay low
for the next three years
China Raw milk supply excess/(shortage)
*LME: liquid milk equivalent
Source: USDA, dairy Association, Goldman Sachs Global Investment Research.
Source: DCANZ, Wind, Goldman Sachs Global Investment Research
22%
-8%
6%
2%3%
-10%
-5%
0%
5%
10%
15%
20%
25%
2000-07 2008-09 2010-13 2014-16E 2016E-20E
Dairy consumption growth CAGR (LME)
2.79
2.45
2.89
3.20
3.24
3.53
4.03
3.43
3.40
3.37
3.36
3.45
3.48
2.00
2.50
3.00
3.50
4.00
4.50
-4,000
-2,000
0
2,000
4,000
6,000
2008 2009 2010 2011 2012 2013 2014 2015 2016E2017E2018E2019E2020E
Total Supply Excess/(Shortage) Domestic Raw Milk Price (RMB/kg, RHS)
Melamine
China raw milk excess/ (shortage) incl. imports, K tons
China domestic raw milk price , RMB/kgr
Global Supply Shocks
Global Over‐supply
Global production cuts on lower prices

August 13, 2016 China: Consumer Staples
Goldman Sachs Global Investment Research 5
China dairy enters a ‘new normal’ stage; milk price to remain weak
We see China dairy industry growth having entered a ‘new normal’ stage and expect low
single digit volume growth over the next 3-4 years. Per capita diary penetration for high tier
cities is already comparable with levels in Japan and Korea level and in our view therefore
has reached equilibrium. On the other hand, demand in lower tier cities are more a
function of economic growth as dairy is not yet a staple among lower-income Chinese.
With the slower demand, we see the China raw milk price remaining weak even though we
expect the global S/D backdrop to gradually recover. In light of this, we are cautious on
upstream dairy farming companies.
As the industry shift from high growth to low growth, we see the earning growth driver for
dairy companies also changing. It is more difficult for companies to grow if they simply
expand their distribution network or push new products into existing channels. Going
forward we think execution will be the key to winning market share, Yili stands out with
strong results in the past years.
Slower growth for longer
China dairy: double digit volume growth before 2014, but subdued in past 2 years
The China dairy market has grown nine-fold in the past 15 years with a total addressable
market of US$64bn currently. Before 2014, dairy demand growth average 12% for more
than 10 years, with Yili and Mengniu growing their sales six-fold.
Per capita comparison not always correct, high tier city consumption already on par
with overseas peers
Compared with US/EU, China’s per capita consumption is low (roughly 20kg per person vs.
200kg in the US). Among staples categories, dairy is also one of the least penetrated at
only avg. 22% of US/EU level. However, in light of their different dietary habits, we think
US/EU’s dairy consumption is not a good comparable for China and think Japan/Korea are
better benchmarks.
Exhibit 10 shows that for liquid milk (fresh + UHT milk), China per capita is about 46% of
the Japan/Korea avg. and if we include the flavored milk, then China is already 76%. This is
higher than the relative penetration for RTD tea or instant noodles.
Exhibit 7: China dairy market enter a slow growth stage
Exhibit 8: China dairy market volume comparable with
US/W. Europe
Source: Euromonitor
Source: Euromonitor
22%
-8%
6%
2%3%
-10%
-5%
0%
5%
10%
15%
20%
25%
2000-07 2008-09 2010-13 2014-16E 2016E-20E
Dairy consumption growth CAGR (LME)
34,205
19,347
27,386
3,9641,419
0
5,000
10,000
15,000
20,000
25,000
30,000
35,000
40,000
WesternEurope
USA China Japan S. Korea
Total Dairy Market Volume ('000 Tonnes)
August 13, 2016 China: Consumer Staples
Goldman Sachs Global Investment Research 6
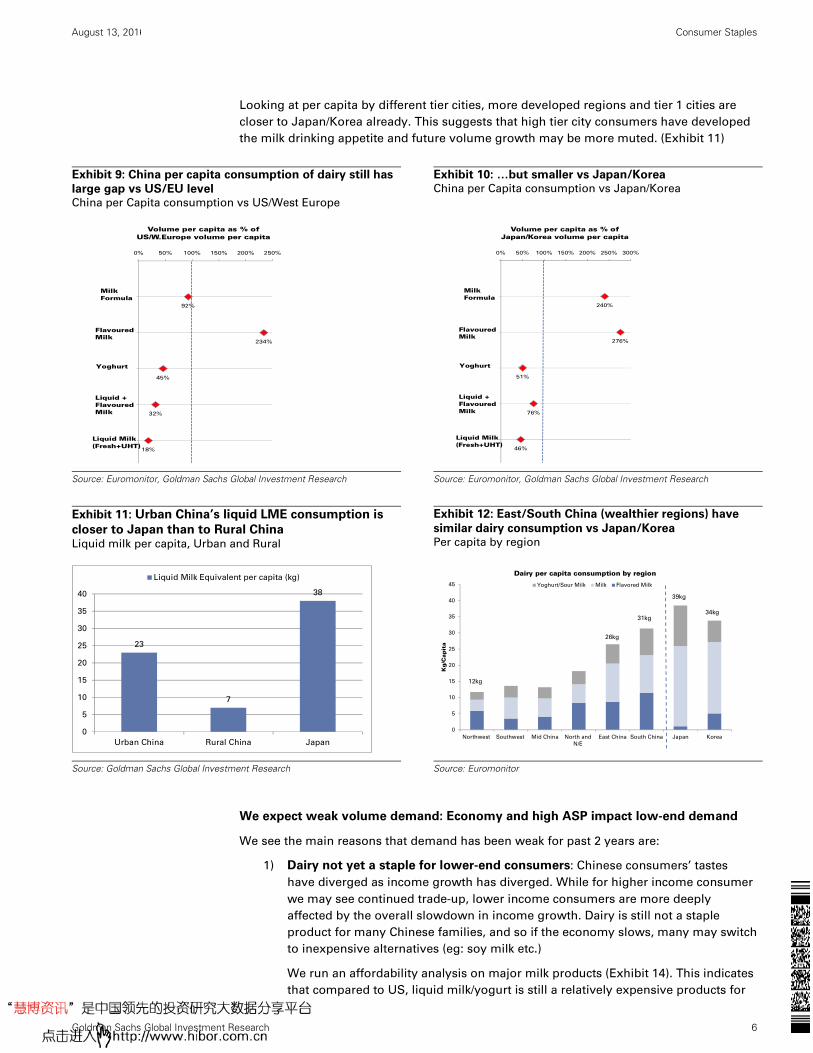
Looking at per capita by different tier cities, more developed regions and tier 1 cities are
closer to Japan/Korea already. This suggests that high tier city consumers have developed
the milk drinking appetite and future volume growth may be more muted. (Exhibit 11)
Exhibit 9: China per capita consumption of dairy still has
large gap vs US/EU level China per Capita consumption vs US/West Europe
Exhibit 10: …but smaller vs Japan/Korea China per Capita consumption vs Japan/Korea
Source: Euromonitor, Goldman Sachs Global Investment Research
Source: Euromonitor, Goldman Sachs Global Investment Research
Exhibit 11: Urban China’s liquid LME consumption is
closer to Japan than to Rural China
Liquid milk per capita, Urban and Rural
Exhibit 12: East/South China (wealthier regions) have
similar dairy consumption vs Japan/Korea Per capita by region
Source: Goldman Sachs Global Investment Research
Source: Euromonitor
We expect weak volume demand: Economy and high ASP impact low-end demand
We see the main reasons that demand has been weak for past 2 years are:
1) Dairy not yet a staple for lower-end consumers: Chinese consumers’ tastes
have diverged as income growth has diverged. While for higher income consumer
we may see continued trade-up, lower income consumers are more deeply
affected by the overall slowdown in income growth. Dairy is still not a staple
product for many Chinese families, and so if the economy slows, many may switch
to inexpensive alternatives (eg: soy milk etc.)
We run an affordability analysis on major milk products (Exhibit 14). This indicates
that compared to US, liquid milk/yogurt is still a relatively expensive products for
92%
234%
45%
32%
18%
0% 50% 100% 150% 200% 250%
0
1
2
3
4
5
Volume per capita as % of US/W.Europe volume per capita
Milk Formula
FlavouredMilk
Yoghurt
Liquid + Flavoured Milk
Liquid Milk (Fresh+UHT)
240%
276%
51%
76%
46%
0% 50% 100% 150% 200% 250% 300%
0
1
2
3
4
5
Volume per capita as % of Japan/Korea volume per capita
Milk Formula
FlavouredMilk
Yoghurt
Liquid + Flavoured Milk
Liquid Milk (Fresh+UHT)
23
7
38
0
5
10
15
20
25
30
35
40
Urban China Rural China Japan
Liquid Milk Equivalent per capita (kg)
0
5
10
15
20
25
30
35
40
45
Northwest Southwest Mid China North and
N/E
East China South China Japan Korea
Kg/C
apit
a
Dairy per capita consumption by region
Yoghurt/Sour Milk Milk Flavored Milk
26kg
31kg
39kg
34kg
12kg
August 13, 2016 China: Consumer Staples
Goldman Sachs Global Investment Research 7
Chinese’s hourly earnings, especially for the urban mass (annual income of
US$2,500-4,000.)
Additionally, spending on food is already over indexed in China vs. other
developed countries, and so as income grow, the incremental money spent on
food will be proportionally less than overall income growth.
2) High-tier city close to saturation: Although overall per capita consumption still
has growth potential, urban consumption, especially in tier 1 cities has already
reached a similar level as in Japan, and so we think the incremental volume
growth there will be more subdued.
In conclusion, we see China dairy demand growth to be slower for longer at about 3.5%
volume CAGR over 2015-2020E.
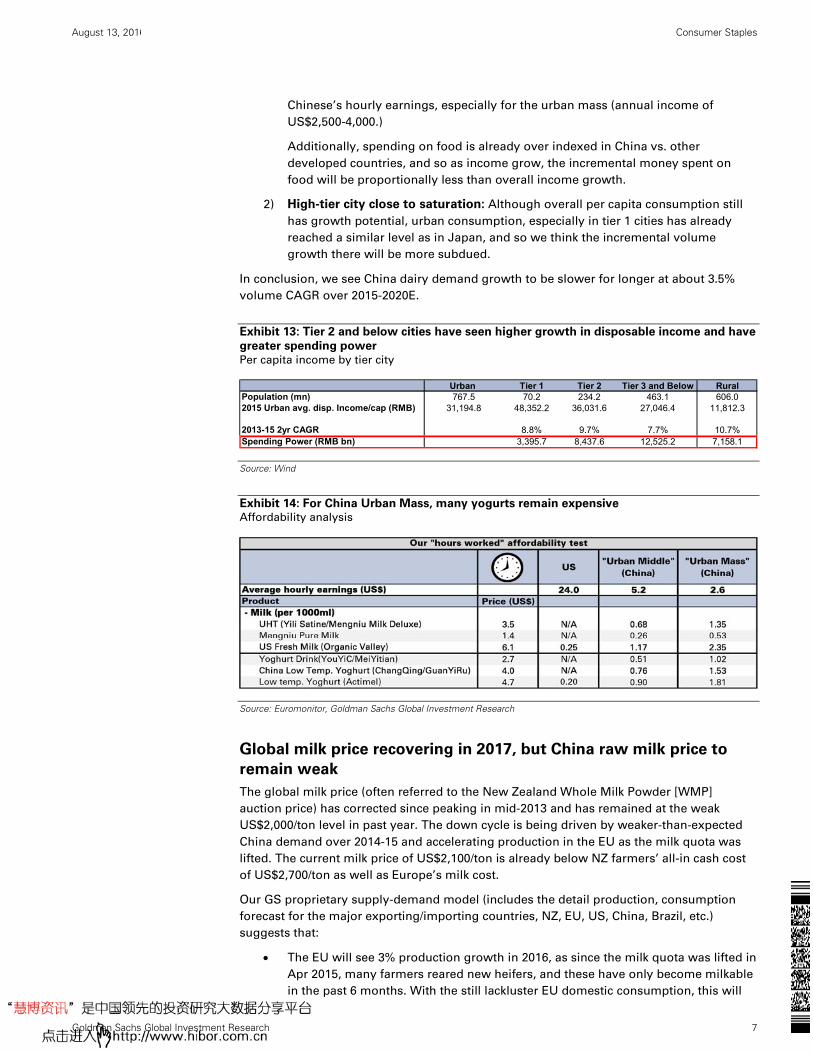
Exhibit 13: Tier 2 and below cities have seen higher growth in disposable income and have
greater spending power
Per capita income by tier city
Source: Wind
Exhibit 14: For China Urban Mass, many yogurts remain expensive Affordability analysis
Source: Euromonitor, Goldman Sachs Global Investment Research
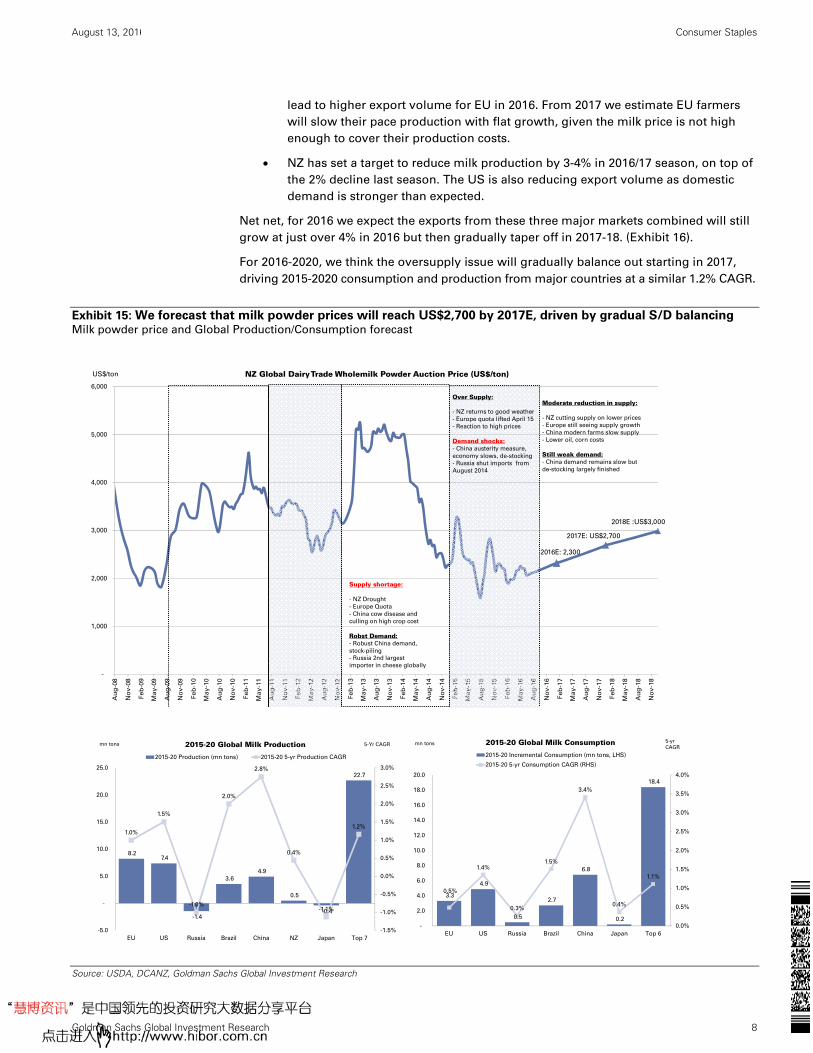
Global milk price recovering in 2017, but China raw milk price to
remain weak
The global milk price (often referred to the New Zealand Whole Milk Powder [WMP]
auction price) has corrected since peaking in mid-2013 and has remained at the weak
US$2,000/ton level in past year. The down cycle is being driven by weaker-than-expected
China demand over 2014-15 and accelerating production in the EU as the milk quota was
lifted. The current milk price of US$2,100/ton is already below NZ farmers’ all-in cash cost
of US$2,700/ton as well as Europe’s milk cost.
Our GS proprietary supply-demand model (includes the detail production, consumption
forecast for the major exporting/importing countries, NZ, EU, US, China, Brazil, etc.)
suggests that:
The EU will see 3% production growth in 2016, as since the milk quota was lifted in
Apr 2015, many farmers reared new heifers, and these have only become milkable
in the past 6 months. With the still lackluster EU domestic consumption, this will
Urban Tier 1 Tier 2 Tier 3 and Below RuralPopulation (mn) 767.5 70.2 234.2 463.1 606.02015 Urban avg. disp. Income/cap (RMB) 31,194.8 48,352.2 36,031.6 27,046.4 11,812.3
2013-15 2yr CAGR 8.8% 9.7% 7.7% 10.7%Spending Power (RMB bn) 3,395.7 8,437.6 12,525.2 7,158.1
August 13, 2016 China: Consumer Staples
Goldman Sachs Global Investment Research 8
lead to higher export volume for EU in 2016. From 2017 we estimate EU farmers
will slow their pace production with flat growth, given the milk price is not high
enough to cover their production costs.
NZ has set a target to reduce milk production by 3-4% in 2016/17 season, on top of
the 2% decline last season. The US is also reducing export volume as domestic
demand is stronger than expected.
Net net, for 2016 we expect the exports from these three major markets combined will still
grow at just over 4% in 2016 but then gradually taper off in 2017-18. (Exhibit 16).
For 2016-2020, we think the oversupply issue will gradually balance out starting in 2017,
driving 2015-2020 consumption and production from major countries at a similar 1.2% CAGR.
Exhibit 15: We forecast that milk powder prices will reach US$2,700 by 2017E, driven by gradual S/D balancing
Milk powder price and Global Production/Consumption forecast
Source: USDA, DCANZ, Goldman Sachs Global Investment Research
2016E: 2,300
2017E: US$2,700
2018E :US$3,000
-
1,000
2,000
3,000
4,000
5,000
6,000
Au
g-0
8
No
v-0
8
Fe
b-0
9
Ma
y-0
9
Au
g-0
9
No
v-0
9
Fe
b-1
0
Ma
y-1
0
Au
g-1
0
No
v-1
0
Fe
b-1
1
Ma
y-1
1
Au
g-1
1
No
v-1
1
Fe
b-1
2
Ma
y-1
2
Au
g-1
2
No
v-1
2
Fe
b-1
3
Ma
y-1
3
Au
g-1
3
No
v-1
3
Fe
b-1
4
Ma
y-1
4
Au
g-1
4
No
v-1
4
Fe
b-1
5
Ma
y-1
5
Au
g-1
5
No
v-1
5
Fe
b-1
6
Ma
y-1
6
Au
g-1
6
No
v-1
6
Fe
b-1
7
Ma
y-1
7
Au
g-1
7
No
v-1
7
Fe
b-1
8
Ma
y-1
8
Au
g-1
8
No
v-1
8
NZ Global Dairy Trade Wholemilk Powder Auction Price (US$/ton)
Supply shortage:
- NZ Drought
- Europe Quota
- China cow disease and
culling on high crop cost
Robst Demand:- Robust China demand,
stock-piling
- Russia 2nd largest
importer in cheese globally
Over Supply:
- NZ returns to good weather
- Europe quota lifted April 15
- Reaction to high prices
Demand shocks:- China austerity measure,
economy slows, de-stocking
- Russia shut imports from
August 2014
Moderate reduction in supply:
- NZ cutting supply on lower prices
- Europe still seeing supply growth
- China modern farms slow supply
- Lower oil, corn costs
Still weak demand:- China demand remains slow but
de-stocking largely finished
US$/ton
8.2 7.4
-1.4
3.6
4.9
0.5
-0.4
22.7
1.0%
1.5%
-1.0%
2.0%
2.8%
0.4%
-1.1%
1.2%
-1.5%
-1.0%
-0.5%
0.0%
0.5%
1.0%
1.5%
2.0%
2.5%
3.0%
-5.0
-
5.0
10.0
15.0
20.0
25.0
EU US Russia Brazil China NZ Japan Top 7
2015-20 Global Milk Production
2015-20 Production (mn tons) 2015-20 5-yr Production CAGR
mn tons 5-Yr CAGR
3.3
4.9
0.5
2.7
6.8
0.2
18.4
0.5%
1.4%
0.3%
1.5%
3.4%
0.4%
1.1%
0.0%
0.5%
1.0%
1.5%
2.0%
2.5%
3.0%
3.5%
4.0%
-
2.0
4.0
6.0
8.0
10.0
12.0
14.0
16.0
18.0
20.0
EU US Russia Brazil China Japan Top 6
2015-20 Global Milk Consumption
2015-20 Incremental Consumption (mn tons, LHS)
2015-20 5-yr Consumption CAGR (RHS)
mn tons 5-yr
CAGR

August 13, 2016 China: Consumer Staples
Goldman Sachs Global Investment Research 9
Global milk price to recover: Although China demand has not yet picked up, with the
more radical supply side reduction, we estimate NZ WMP price will slowly recover starting
2H16 and reach US$2,700/ton by the end of 2017 (NZ farmer’s breakeven point).
Exhibit 16: We expect exports from EU/US/NZ to grow at
4% for 2016E then taper off to 0.9% in 2018E Export growth by EU/US/NZ
Exhibit 17: China’s raw milk continues to trade at a
premium against Global milk prices China raw milk price vs. Global
Source: Goldman Sachs Global Investment Research, DCANZ
Source: Bloomberg
China milk prices to flat line
For China, given demand has been weaker than expected in the past 2 years, milk
oversupply has driven excess inventory and a lower milk price (down 20% from peaks). Our
China supply-demand model estimates currently there’s about 3.3mn tons of liquid milk
equivalent inventory in the market, vs. China’s annual demand of 37-38mn ton. The
excessive inventory is mostly poured into milk powder format so it can be stored for more
than 18 months.
Milk price has also been in a down cycle since 1H14 due to the industry oversupply.
Following the smaller farmers exiting market last year, in 2016 we have started to see large
scale farmers also sharply slowing down the dairy farm expansion and are having trouble
selling raw milk. (China Modern dairy poured about 11% of its milk production into milk
powder in 1H16). Therefore, we estimate in 2016 domestic supply will be reduced by 1.3%.
However, due to higher feed cost and land prices, China raw milk price has consistently
been much higher than global prices. Currently it’s still running at 55% premium to global
prices (Exhibit 17, including all transport, tariff expenses), thus we see the imports will
continue to be strong and sufficient to fill the China supply gap. (Exhibit 18) This will drive
China raw milk price to be lower for longer at around Rmb3.35-3.45/kg level, in our
view.
We are cautious about upstream dairy companies, as they will continue to have very tight
cash margin and will need to more aggressively expand into the branded milk market to
earn cash flow.
45.5 45.5
52.6
57.060.0 61.3
68.670.9
73.775.5 76.2
-0.1%
15.7%
8.3%
5.4%
2.1%
12.0%
3.3%4.0%
2.4%
0.9%
-2%
0%
2%
4%
6%
8%
10%
12%
14%
16%
18%
0.0
10.0
20.0
30.0
40.0
50.0
60.0
70.0
80.0
2008 2009 2010 2011 2012 2013 2014 2015 2016E 2017E 2018E
Mn Tonnes
Dairy Export Market (3 major exporters) EU US NZ yoy growth
1.00
1.50
2.00
2.50
3.00
3.50
4.00
4.50
5.00
5.50
6.00
China raw milk price (Rmb/Kg)
NZ WMP equivalent price (auction only)
NZ WMP equivalent price (auction plus transport, VAT)
August 13, 2016 China: Consumer Staples
Goldman Sachs Global Investment Research 10
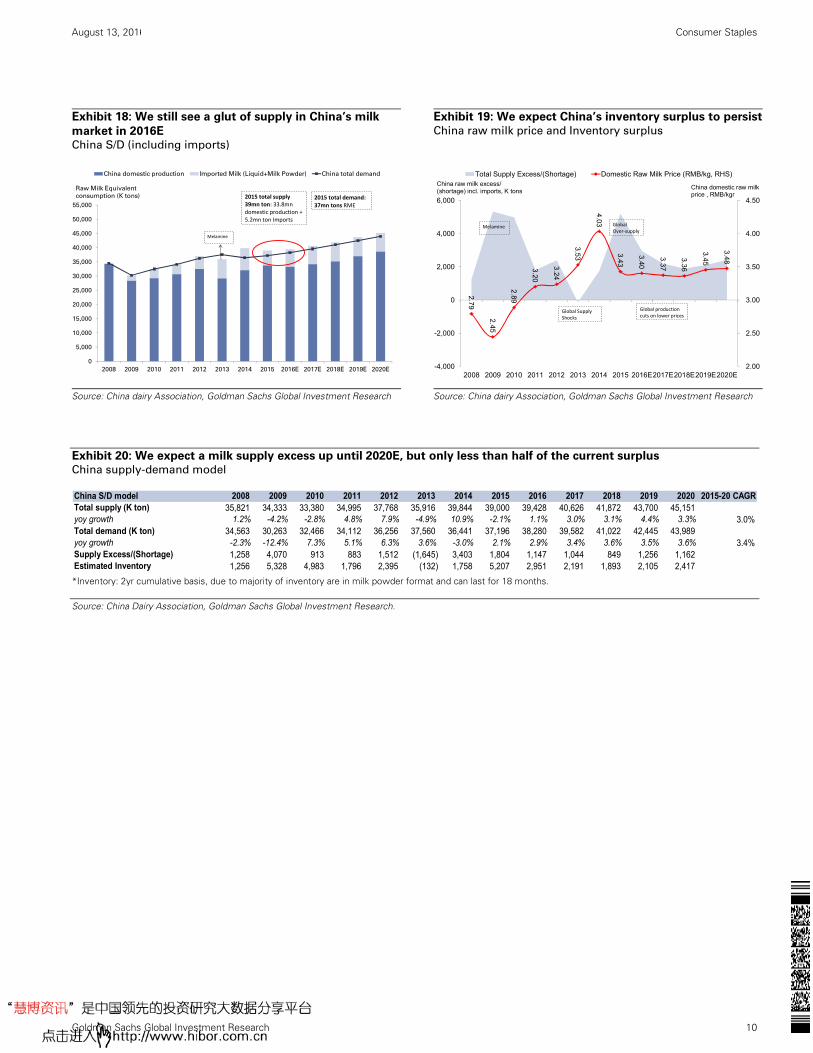
Exhibit 18: We still see a glut of supply in China’s milk
market in 2016E China S/D (including imports)
Exhibit 19: We expect China’s inventory surplus to persist
China raw milk price and Inventory surplus
Source: China dairy Association, Goldman Sachs Global Investment Research
Source: China dairy Association, Goldman Sachs Global Investment Research
Exhibit 20: We expect a milk supply excess up until 2020E, but only less than half of the current surplus China supply-demand model
*Inventory: 2yr cumulative basis, due to majority of inventory are in milk powder format and can last for 18 months.
Source: China Dairy Association, Goldman Sachs Global Investment Research.
0
5,000
10,000
15,000
20,000
25,000
30,000
35,000
40,000
45,000
50,000
55,000
2008 2009 2010 2011 2012 2013 2014 2015 2016E 2017E 2018E 2019E 2020E
China domestic production Imported Milk (Liquid+Milk Powder) China total demand
Raw Milk Equivalent
consumption (K tons)
Melamine
2015 total supply 39mn ton: 33.8mn domestic production + 5.2mn ton Imports
2015 total demand: 37mn tons RME
2.79
2.45
2.89
3.20
3.24
3.53
4.03
3.43
3.40
3.37
3.36
3.45
3.48
2.00
2.50
3.00
3.50
4.00
4.50
-4,000
-2,000
0
2,000
4,000
6,000
2008 2009 2010 2011 2012 2013 2014 2015 2016E2017E2018E2019E2020E
Total Supply Excess/(Shortage) Domestic Raw Milk Price (RMB/kg, RHS)
Melamine
China raw milk excess/ (shortage) incl. imports, K tons
China domestic raw milk price , RMB/kgr
Global Supply Shocks
Global Over‐supply
Global production cuts on lower prices
China S/D model 2008 2009 2010 2011 2012 2013 2014 2015 2016 2017 2018 2019 2020 2015-20 CAGRTotal supply (K ton) 35,821 34,333 33,380 34,995 37,768 35,916 39,844 39,000 39,428 40,626 41,872 43,700 45,151 yoy growth 1.2% -4.2% -2.8% 4.8% 7.9% -4.9% 10.9% -2.1% 1.1% 3.0% 3.1% 4.4% 3.3% 3.0%Total demand (K ton) 34,563 30,263 32,466 34,112 36,256 37,560 36,441 37,196 38,280 39,582 41,022 42,445 43,989 yoy growth -2.3% -12.4% 7.3% 5.1% 6.3% 3.6% -3.0% 2.1% 2.9% 3.4% 3.6% 3.5% 3.6% 3.4%Supply Excess/(Shortage) 1,258 4,070 913 883 1,512 (1,645) 3,403 1,804 1,147 1,044 849 1,256 1,162 Estimated Inventory 1,256 5,328 4,983 1,796 2,395 (132) 1,758 5,207 2,951 2,191 1,893 2,105 2,417
August 13, 2016 China: Consumer Staples
Goldman Sachs Global Investment Research 11
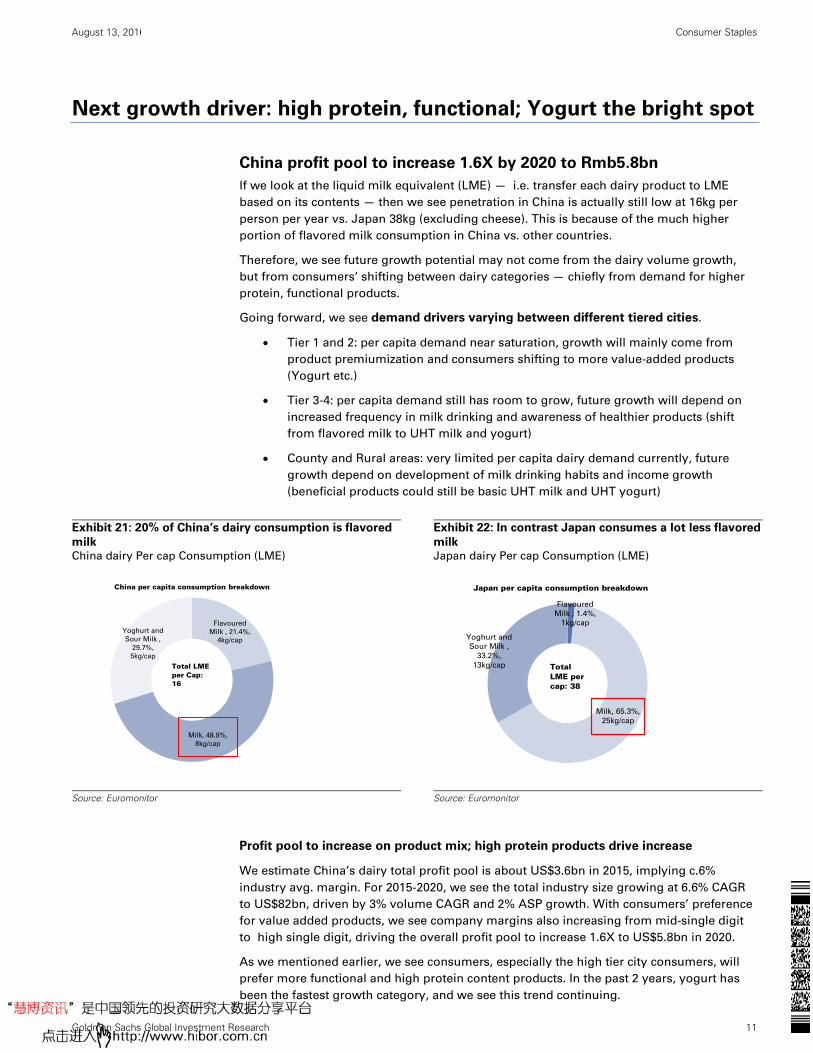
Next growth driver: high protein, functional; Yogurt the bright spot
China profit pool to increase 1.6X by 2020 to Rmb5.8bn
If we look at the liquid milk equivalent (LME) — i.e. transfer each dairy product to LME
based on its contents — then we see penetration in China is actually still low at 16kg per
person per year vs. Japan 38kg (excluding cheese). This is because of the much higher
portion of flavored milk consumption in China vs. other countries.
Therefore, we see future growth potential may not come from the dairy volume growth,
but from consumers’ shifting between dairy categories — chiefly from demand for higher
protein, functional products.
Going forward, we see demand drivers varying between different tiered cities.
Tier 1 and 2: per capita demand near saturation, growth will mainly come from
product premiumization and consumers shifting to more value-added products
(Yogurt etc.)
Tier 3-4: per capita demand still has room to grow, future growth will depend on
increased frequency in milk drinking and awareness of healthier products (shift
from flavored milk to UHT milk and yogurt)
County and Rural areas: very limited per capita dairy demand currently, future
growth depend on development of milk drinking habits and income growth
(beneficial products could still be basic UHT milk and UHT yogurt)
Exhibit 21: 20% of China’s dairy consumption is flavored
milk China dairy Per cap Consumption (LME)
Exhibit 22: In contrast Japan consumes a lot less flavored
milk Japan dairy Per cap Consumption (LME)
Source: Euromonitor
Source: Euromonitor
Profit pool to increase on product mix; high protein products drive increase
We estimate China’s dairy total profit pool is about US$3.6bn in 2015, implying c.6%
industry avg. margin. For 2015-2020, we see the total industry size growing at 6.6% CAGR
to US$82bn, driven by 3% volume CAGR and 2% ASP growth. With consumers’ preference
for value added products, we see company margins also increasing from mid-single digit
to high single digit, driving the overall profit pool to increase 1.6X to US$5.8bn in 2020.
As we mentioned earlier, we see consumers, especially the high tier city consumers, will
prefer more functional and high protein content products. In the past 2 years, yogurt has
been the fastest growth category, and we see this trend continuing.
Flavoured
Milk , 21.4%,
4kg/cap
Milk, 48.9%,
8kg/cap
Yoghurt and
Sour Milk ,
29.7%,
5kg/cap
China per capita consumption breakdown
Total LMEper Cap:16
Flavoured
Milk , 1.4%,
1kg/cap
Milk, 65.3%,
25kg/cap
Yoghurt and
Sour Milk ,
33.2%,
13kg/cap
Japan per capita consumption breakdown
Total LME per cap: 38

August 13, 2016 China: Consumer Staples
Goldman Sachs Global Investment Research 12
Exhibit 23: We forecast Yogurt to be the fastest growing category with double digit volume growth, driving the China
profit pool to increase by 1.6X by 2020 Market size, volume, profit pool forecast by category
Source: Euromonitor, Goldman Sachs Global Investment Research.
August 13, 2016 China: Consumer Staples
Goldman Sachs Global Investment Research 13
By subcategory, we see the yogurt segment nearly doubling its market size to US$22bn in
2020, driven by strong volume growth. UHT milk will continue to be the dominant liquid
milk product given its convenience and consumers’ established drinking habits; hence we
see the similar volume growth as the industry average and expect roughly US$17bn in
annual sales by 2020.
On the other hand, we see flavored milk and IMF as the two categories that will shrink over
next few years. China’s flavored milk penetration is already one of highest in the world,
and with the increasing awareness of healthy and less sweet preference, we expect the size
of flavored milk to shrink by 1.3%.
For IMF, China is among the world’s largest market with annual sales of US$16bn in 2015.
This is due to per baby penetration is on par with world average and average IMF product
ASP is 50% above the EU/NZ level. For the next 5 years, we see IMF pricing remaining
under pressure with the proliferation of online and cross border channels. Absolute ASP
for IMF products, especially premium products will decline yoy, in our view; however this
will be partially offset by the product mix upgrade, driving about 1% ASP fall yoy to 2020.
The impact from the removal of the ‘one child’ policy”, initiated in 2016 will start to kick in
from the end of year, however given the trend of number of new births and increasing
promotion of breast feeding, we expect IMF volume growth to be more muted in the next 5
years at low single digits.
Yogurt will be the bright spot
In beverages, we have seen a clear trend of consumers moving to healthier, less-sweet and
functional products. In the past two years, Sports drink and Water recorded mid-to-high
single digit growth vs. Carbonates and RTD tea posting negative growth.
We expect a similar trend in dairy products. Specifically, yogurt in China is usually
considered a healthier product, and beneficial to health. In China, the perception of yogurt
is different from Western style or Greek yogurt. In China, low temp yogurt (Exhibit 24,
fourth column) is what consumers typically perceive as real ‘Yogurt’, which is usually the
drinkable yogurt. It generally has higher sugar content than Greek yogurt.
In the past few years, hot categories have been 1) Drinking yogurt and 2) UHT yogurt. The
former has been led by Japanese brand Yakult and promoted as ‘good for digestion’, while
the latter became very popular only from 2014, led by Bright Dairy, Yili and Mengniu
products, advertised as high nutrition and easy to carry yogurt. As it is stored and
consumed at room temperature, UHT yogurt can be rapidly and easily distributed into
lower tier cities and has gained popularity as the big dairy companies aggressively
promote them.
Similar to beverages, we expect consumers to gradually turn to less-sweet and more
functional products, i.e. move towards the low temp yogurt or the Western style yogurt
(eg: Bright Dairy introduced a plain yogurt last year called ‘Rushi’) Thus, we expect low
temp yogurt to record rapid 13% sales CAGR for 2016-2020E, but for yogurt drinks to show
limited growth as consumers switch.
August 13, 2016 China: Consumer Staples
Goldman Sachs Global Investment Research 14
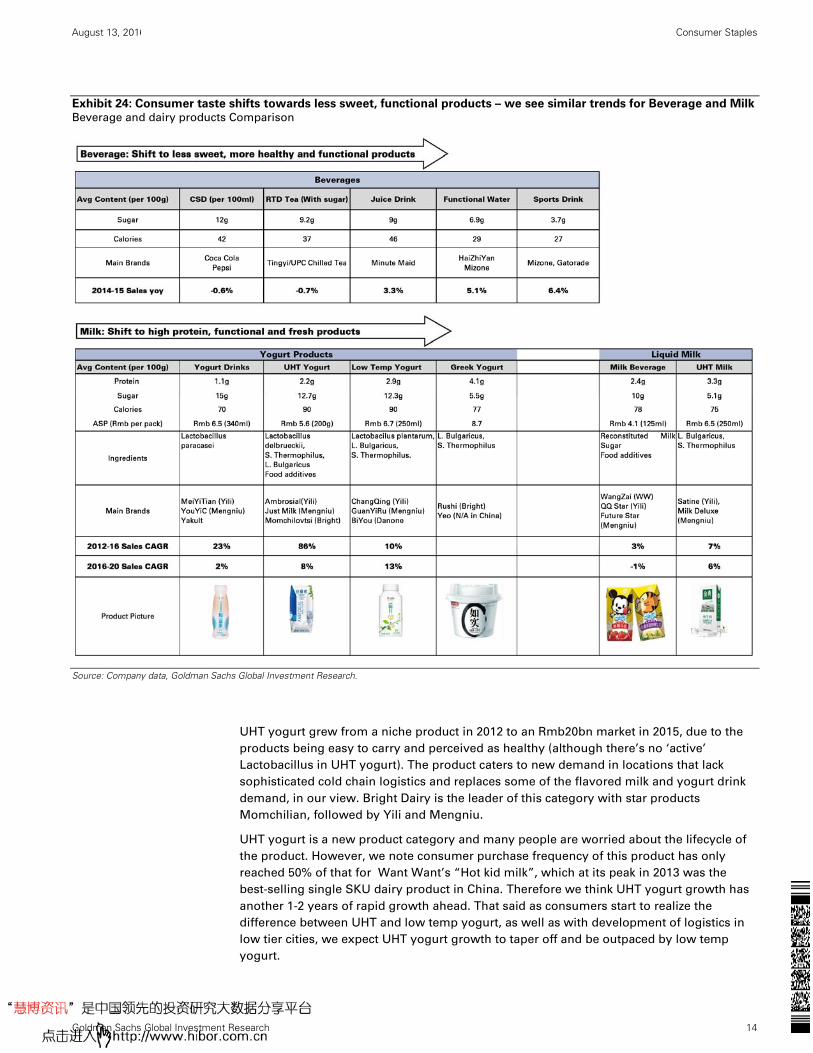
Exhibit 24: Consumer taste shifts towards less sweet, functional products – we see similar trends for Beverage and Milk Beverage and dairy products Comparison
Source: Company data, Goldman Sachs Global Investment Research.
UHT yogurt grew from a niche product in 2012 to an Rmb20bn market in 2015, due to the
products being easy to carry and perceived as healthy (although there’s no ‘active’
Lactobacillus in UHT yogurt). The product caters to new demand in locations that lack
sophisticated cold chain logistics and replaces some of the flavored milk and yogurt drink
demand, in our view. Bright Dairy is the leader of this category with star products
Momchilian, followed by Yili and Mengniu.
UHT yogurt is a new product category and many people are worried about the lifecycle of
the product. However, we note consumer purchase frequency of this product has only
reached 50% of that for Want Want’s “Hot kid milk”, which at its peak in 2013 was the
best-selling single SKU dairy product in China. Therefore we think UHT yogurt growth has
another 1-2 years of rapid growth ahead. That said as consumers start to realize the
difference between UHT and low temp yogurt, as well as with development of logistics in
low tier cities, we expect UHT yogurt growth to taper off and be outpaced by low temp
yogurt.
August 13, 2016 China: Consumer Staples
Goldman Sachs Global Investment Research 15
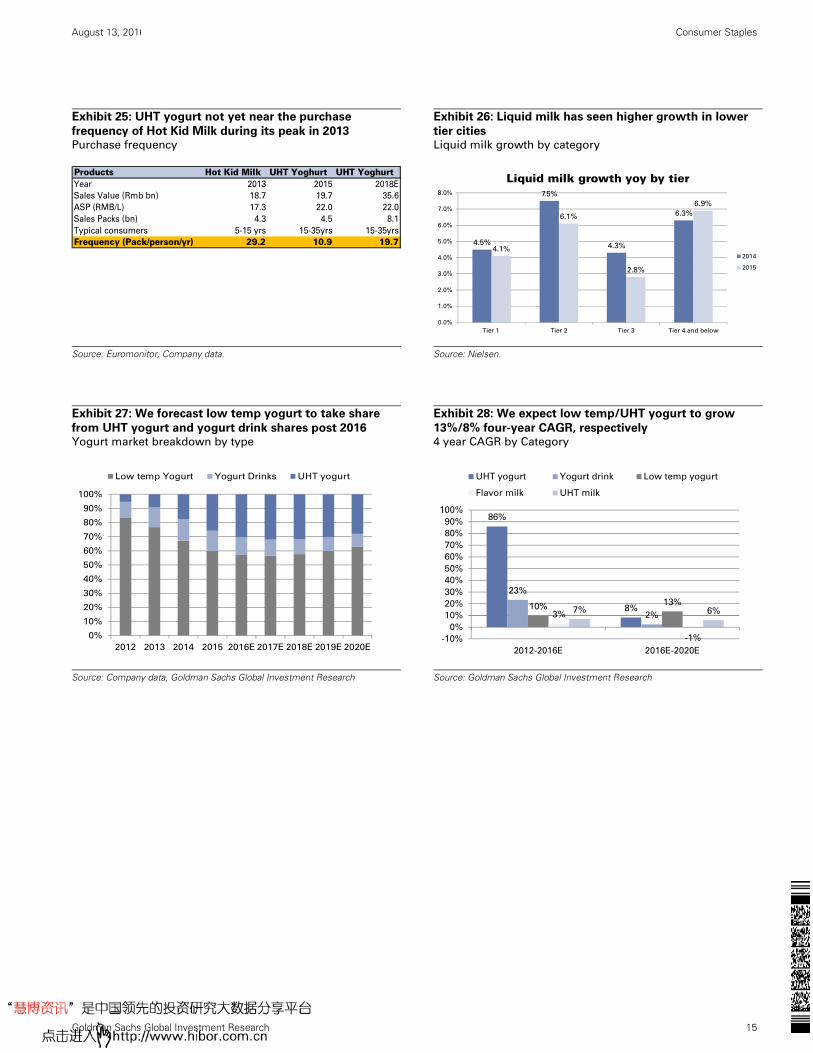
Exhibit 25: UHT yogurt not yet near the purchase
frequency of Hot Kid Milk during its peak in 2013 Purchase frequency
Exhibit 26: Liquid milk has seen higher growth in lower
tier cities Liquid milk growth by category
Source: Euromonitor, Company data.
Source: Nielsen.
Exhibit 27: We forecast low temp yogurt to take share
from UHT yogurt and yogurt drink shares post 2016 Yogurt market breakdown by type
Exhibit 28: We expect low temp/UHT yogurt to grow
13%/8% four-year CAGR, respectively 4 year CAGR by Category
Source: Company data, Goldman Sachs Global Investment Research
Source: Goldman Sachs Global Investment Research
Products Hot Kid Milk UHT Yoghurt UHT YoghurtYear 2013 2015 2018E
Sales Value (Rmb bn) 18.7 19.7 35.6
ASP (RMB/L) 17.3 22.0 22.0
Sales Packs (bn) 4.3 4.5 8.1
Typical consumers 5-15 yrs 15-35yrs 15-35yrs
Frequency (Pack/person/yr) 29.2 10.9 19.7 4.5%
7.5%
4.3%
6.3%
4.1%
6.1%
2.8%
6.9%
0.0%
1.0%
2.0%
3.0%
4.0%
5.0%
6.0%
7.0%
8.0%
Tier 1 Tier 2 Tier 3 Tier 4 and below
Liquid milk growth yoy by tier
2014
2015
0%
10%
20%
30%
40%
50%
60%
70%
80%
90%
100%
2012 2013 2014 2015 2016E 2017E 2018E 2019E 2020E
Low temp Yogurt Yogurt Drinks UHT yogurt
86%
8%
23%
2%10%
13%
3%
-1%
7% 6%
-10%
0%
10%
20%
30%
40%
50%
60%
70%
80%
90%
100%
2012-2016E 2016E-2020E
UHT yogurt Yogurt drink Low temp yogurt
Flavor milk UHT milk
August 13, 2016 China: Consumer Staples
Goldman Sachs Global Investment Research 16
Execution is now the key: Yili stands out on distribution, branding
Since the 2008-2009 melamine incident, China consumers’ demand for quality milk has
increased substantially. Yili and Mengniu’s premium UHT milk products all gained market
share with strong growth after that event.
However, in past two years, China dairy demand has been weaker than expected and
posted subdued volume growth. But upstream dairy supply is still growing rapidly, leading
to high milk inventory in the market and increasing competition. Mengniu saw greater
challenge to its growth and its stock price corrected as much as 50% during 2014-15.
As the China dairy market has now entered a slower growth stage, individual companies’
performances have diverged more and more. The future growth and market share
dynamics depend on each company’s specific strategy on product offering, marketing and
branding and their effective execution.
We compare in detail the 4 downstream branded dairy companies and conclude that Yili as
industry leader is set to extend its leading position and gain further market share in most
categories.
Products, branding, distribution, mgmt. comparison
#1: Products: Yili and Mengniu better exposed to high-growth categories
Yili and Mengniu, as leading national players, have key products in most categories. They
both have more than 50% of their sales in the higher growth UHT milk and yogurt, with the
rest in milk beverage and milk powder. Both companies have been gaining market share in
the yogurt category.
In comparison, Want Want’s sales are more skewed to flavored milk sales, accounting for
50% with the rest rick crackers or snacks. Therefore Want Want’s dairy sales are under
significant pressure as the flavored milk market continues to shrink and the company faces
more competition from Yili/Mengniu’s children’s milk products.
Bright Dairy is a more of a regional player focusing on East China and pasteurized milk. In
the past 3 years it has successfully launched and led the UHT yogurt market with its star
product Momchilovtsi. However, as competition intensifies in the UHT yogurt market, we
see Bright’s growth coming under pressure from its dependence on a single SKU product.
(We estimate in 2016 Yili’s UHT yogurt Ambrosial will surpass the scale of Bright Dairy’s
UHT yogurt sales).
August 13, 2016 China: Consumer Staples
Goldman Sachs Global Investment Research 17
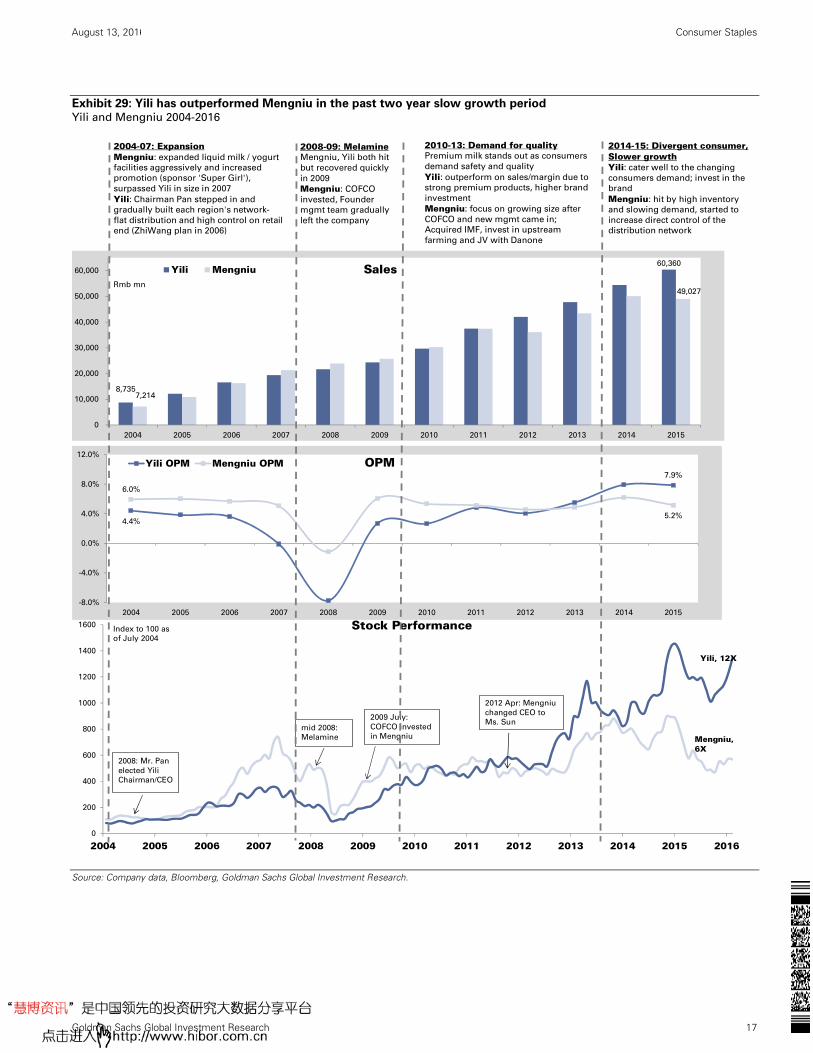
Exhibit 29: Yili has outperformed Mengniu in the past two year slow growth period Yili and Mengniu 2004-2016
Source: Company data, Bloomberg, Goldman Sachs Global Investment Research.
8,735
60,360
7,214
0
10,000
20,000
30,000
40,000
50,000
60,000
2004 2005 2006 2007 2008 2009 2010 2011 2012 2013 2014 2015
Rmb mn
Sales Yili Mengniu
49,027
4.4%
7.9%
6.0%
5.2%
-8.0%
-4.0%
0.0%
4.0%
8.0%
12.0%
2004 2005 2006 2007 2008 2009 2010 2011 2012 2013 2014 2015
OPMYili OPM Mengniu OPM
0
200
400
600
800
1000
1200
1400
1600
2004 2005 2006 2007 2008 2009 2010 2011 2012 2013 2014 2015 2016
Stock Performance
Mengniu, 6X
Yili, 12X
mid 2008:
Melamine
2009 July:
COFCO invested
in Mengniu
2012 Apr: Mengniu
changed CEO to
Ms. Sun
2008: Mr. Pan
elected Yili
Chairman/CEO
Index to 100 as
of July 2004
2004-07: ExpansionMengniu: expanded liquid milk / yogurt
facilities aggressively and increased
promotion (sponsor 'Super Girl'),
surpassed Yili in size in 2007
Yili: Chairman Pan stepped in and
gradually built each region's network-
flat distribution and high control on retail
end (ZhiWang plan in 2006)
2008-09: MelamineMengniu, Yili both hit
but recovered quickly
in 2009
Mengniu: COFCO
invested, Founder
mgmt team gradually
left the company
2010-13: Demand for qualityPremium milk stands out as consumers
demand safety and quality
Yili: outperform on sales/margin due to
strong premium products, higher brand
investment
Mengniu: focus on growing size after
COFCO and new mgmt came in;
Acquired IMF, invest in upstream
farming and JV with Danone
2014-15: Divergent consumer, Slower growthYili: cater well to the changing
consumers demand; invest in the
brand
Mengniu: hit by high inventory
and slowing demand, started to
increase direct control of the
distribution network

August 13, 2016 China: Consumer Staples
Goldman Sachs Global Investment Research 18
Exhibit 30: Yili and Mengniu has biggest exposure to Yogurt Sales by product type (2015)
Source: Company data.
#2: Branding: more effective and targeted branding crucial for young consumers
For dairy products, typical consumers are children/ students for flavored milk and
teenagers or millennials for yogurt etc. Hence we think marketing and branding aimed at
younger consumers will become more important for dairy companies. From 2013, we have
seen increasing number of dairy companies investing in the popular TV or entertainment
programs.
Yili, starting from 2014, has greatly increased its A&P expenses as they promote their star
products. Its A&P ratio reached 12% in 2015 and we expect it to continue to rise over 2016-
18E vs. Mengniu’s 8-9% and Want Want and Bright at less than 4%. Yili has invested in
television programs with higher viewership (avg. 3.0 rating vs. Mengniu’s 1.5) and has
greater presence on social media (sponsoring online video program and engaging in
WeChat events).
Also Yili spends about 60% more on advertising and roughly Rmb1bn on TV sponsorship
each year. This has translated into higher sales growth for the last two years (Exhibit 34).
Want Want on the other hand, spent less than 4% of sales on A&P, as it relies rely more on
distributors’ effort to push products. In our opinion this puts them at a disadvantage to win
market share.
36%42%
28% 20%
49%
18%27%
37%
9%
8%10%
4%
51%
26%
37%
0%
10%
20%
30%
40%
50%
60%
70%
80%
90%
100%
Yili Mengniu Want Want Bright
Sales Exposure by Category
UHT Milk Milk Beverage Yogurt IMF Others Past. Milk

August 13, 2016 China: Consumer Staples
Goldman Sachs Global Investment Research 19
Exhibit 31: Yili’s higher spending on A&P has led to
higher incremental sales growth A&P comparison
Exhibit 32: Most of Yili’s selling expenses are advertising
2015 Yili vs Mengniu Selling Expenses Breakdown
Source: Company data, Goldman Sachs Global Investment Research
Source: Company data
Exhibit 33: Yili sponsored TV programs have had higher
ratings than Mengniu’s TV program sponsorship
Exhibit 34: Yili’s higher ANP spending has led to higher
sales growth vs Mengniu Yili/Mengniu A&P ratio vs Abs. sales increase
Source: tvtv.hk
Source: Company data, Goldman Sachs Global Investment Research
Yili, 13.6%
Bright, 3.6%
Mengniu, 8.9%
Want Want, 3.6%
0.0%
2.0%
4.0%
6.0%
8.0%
10.0%
12.0%
14.0%
16.0%
2010 2011 2012 2013 2014 2015 2016E 2017E 2018E
A&P as % of Sales
2,183
7,276
3,139
233 427806
4,085
2,310
789
2,994
0
1,000
2,000
3,000
4,000
5,000
6,000
7,000
8,000
Salary Advertising Transportation Rental Others
Rmb mn
Yili Selling Expenses Breakdown
Yili Mengniu
150
610
430390
976
1275
1.6
1.3
3.53.3
2.0
0
0.5
1
1.5
2
2.5
3
3.5
4
0
200
400
600
800
1,000
1,200
1,400
2014 2015 2016
Rating pts.Rmb mnA&P expenses on TV program sponsorship
Mengniu Yili Mengniu ratings (RHS) Yili ratings (RHS)
Yili, 13.7%
Mengniu, 8.9%
-2,000
0
2,000
4,000
6,000
8,000
10,000
2%
4%
6%
8%
10%
12%
14%
16%
2010 2011 2012 2013 2014 2015 2016E 2017E 2018E
Rmb mnA&P as % of Sales vs Abs. Sales increase
Yili Abs Sales Increase Mengniu Abs. Sales Increase Yili Mengniu
August 13, 2016 China: Consumer Staples
Goldman Sachs Global Investment Research 20
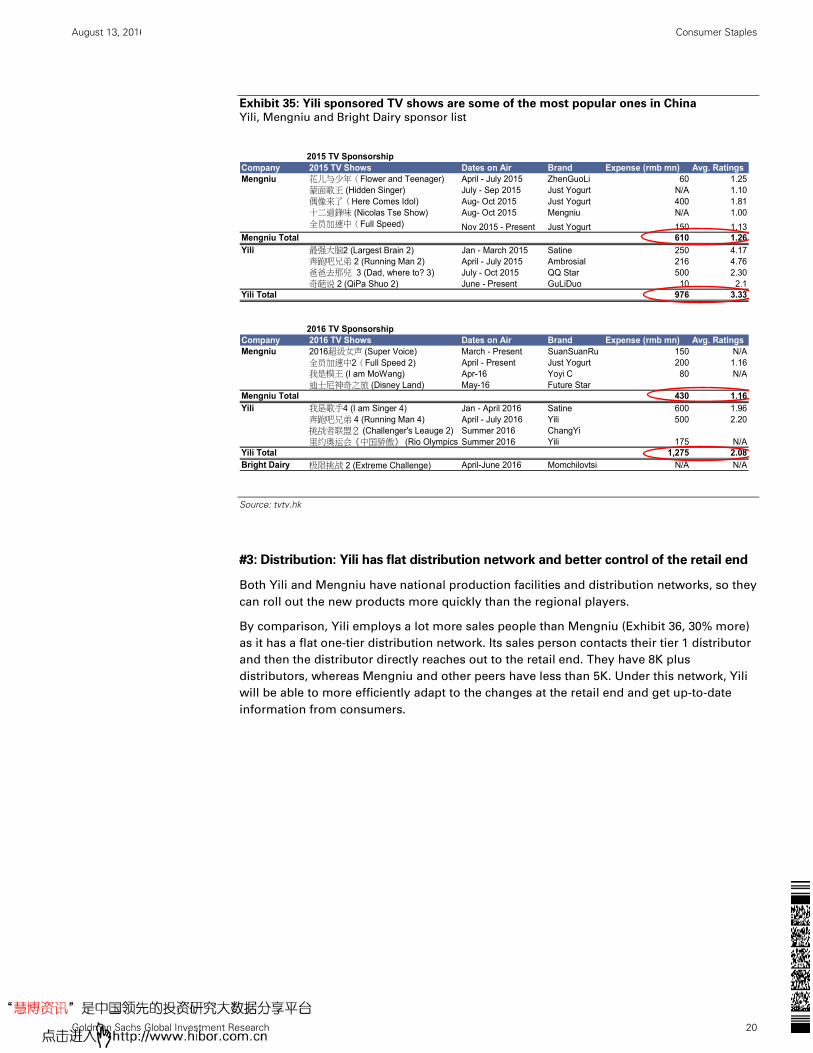
Exhibit 35: Yili sponsored TV shows are some of the most popular ones in China Yili, Mengniu and Bright Dairy sponsor list
Source: tvtv.hk
#3: Distribution: Yili has flat distribution network and better control of the retail end
Both Yili and Mengniu have national production facilities and distribution networks, so they
can roll out the new products more quickly than the regional players.
By comparison, Yili employs a lot more sales people than Mengniu (Exhibit 36, 30% more)
as it has a flat one-tier distribution network. Its sales person contacts their tier 1 distributor
and then the distributor directly reaches out to the retail end. They have 8K plus
distributors, whereas Mengniu and other peers have less than 5K. Under this network, Yili
will be able to more efficiently adapt to the changes at the retail end and get up-to-date
information from consumers.
Company 2015 TV Shows Dates on Air Brand Expense (rmb mn) Avg. RatingsMengniu 花儿与少年(Flower and Teenager) April - July 2015 ZhenGuoLi 60 1.25
蒙面歌王 (Hidden Singer) July - Sep 2015 Just Yogurt N/A 1.10偶像来了(Here Comes Idol) Aug- Oct 2015 Just Yogurt 400 1.81十二道鋒味 (Nicolas Tse Show) Aug- Oct 2015 Mengniu N/A 1.00全员加速中(Full Speed) Nov 2015 - Present Just Yogurt 150 1.13
Mengniu Total 610 1.26Yili 最强大脑2 (Largest Brain 2) Jan - March 2015 Satine 250 4.17
奔跑吧兄弟 2 (Running Man 2) April - July 2015 Ambrosial 216 4.76爸爸去那兒 3 (Dad, where to? 3) July - Oct 2015 QQ Star 500 2.30奇葩说 2 (QiPa Shuo 2) June - Present GuLiDuo 10 2.1
Yili Total 976 3.33
Company 2016 TV Shows Dates on Air Brand Expense (rmb mn) Avg. RatingsMengniu 2016超级女声 (Super Voice) March - Present SuanSuanRu 150 N/A
全员加速中2(Full Speed 2) April - Present Just Yogurt 200 1.16我是模王 (I am MoWang) Apr-16 Yoyi C 80 N/A迪士尼神奇之旅 (Disney Land) May-16 Future Star
Mengniu Total 430 1.16Yili 我是歌手4 (I am Singer 4) Jan - April 2016 Satine 600 1.96
奔跑吧兄弟 4 (Running Man 4) April - July 2016 Yili 500 2.20挑战者联盟2 (Challenger's Leauge 2) Summer 2016 ChangYi里约奥运会《中国骄傲》 (Rio Olympics)Summer 2016 Yili 175 N/A
Yili Total 1,275 2.08Bright Dairy 极限挑战 2 (Extreme Challenge) April-June 2016 Momchilovtsi N/A N/A
2015 TV Sponsorship
2016 TV Sponsorship

August 13, 2016 China: Consumer Staples
Goldman Sachs Global Investment Research 21
Exhibit 36: Yili is more directly involved in each POS, vs
Mengniu’s distributor driven model Yili vs Mengniu sales employees (2015)
Exhibit 37: Want Want still has limited exposure in
modern trade channel vs. other large staples companiesSales by channels (2015)
Source: Company data
Source: Company data, Goldman Sachs Global Investment Research.
With its wider distribution system, Yili has greater presence in lower tier cities and
traditional channels than Mengniu.
Mengniu, due to its relatively higher exposure in tier 1 and 2 cities, will face more intense
competition vs. upstream dairy players or import player on the premium UHT milk side.
This is because smaller, newer players usually have fewer resources to distribute products
into low tier city and therefore focus on premium end products. In past 12 months,
Mengniu has also started to reform its distribution network by increasing the portion of
direct selling and simplifying its layers of distributors. We think this will take time to have a
material impact on the company.
Want Want has been in China since the early 1990s and hence is well penetrated into
traditional channels. However, it is having difficulty penetrating into new channels such as
supermarkets or convenience stores in the past decade. More than 90% of its sales still
come through traditional channels as they want to protect their distributor margin.
However this makes Want Want less effective in launching new products or catering to
young consumers, in our view.
Exhibit 38: Yili has greater premium milk market share in
tier 3 and below cities Market share in different tier cities
Exhibit 39: Mengniu has a greater share in offline
channels than Yili Market share by channels
Source: Modern Dairy.
Source: Modern Dairy.
57,971
39,683
5,372
15,60411,905
1,834
0
10,000
20,000
30,000
40,000
50,000
60,000
70,000
Yili Mengniu Bright Dairy
# of Employees Total employees Sales employees
95%
45% 50% 55%45%
0%
10%
20%
30%
40%
50%
60%
70%
80%
90%
100%
WW Mengniu Yili Tingyi UPC
Traditional channel Modern trade Online and others
28.8 31.7 36.2 38.2
37.4
50.147.8 47.9
0
10
20
30
40
50
60
70
80
90
100
Tier 1 Tier 2 Tier 3 Tier 4 and below
(%) Yili Mengniu
32.7 35.2 33.2 29.939.7
39.942.3
54.8 57.950.6
0
10
20
30
40
50
60
70
80
90
100
Hypermarket Supermarket Small
supermarket
Convenience
store
Brick and
Mortar
(%) Yili Mengniu
August 13, 2016 China: Consumer Staples
Goldman Sachs Global Investment Research 22
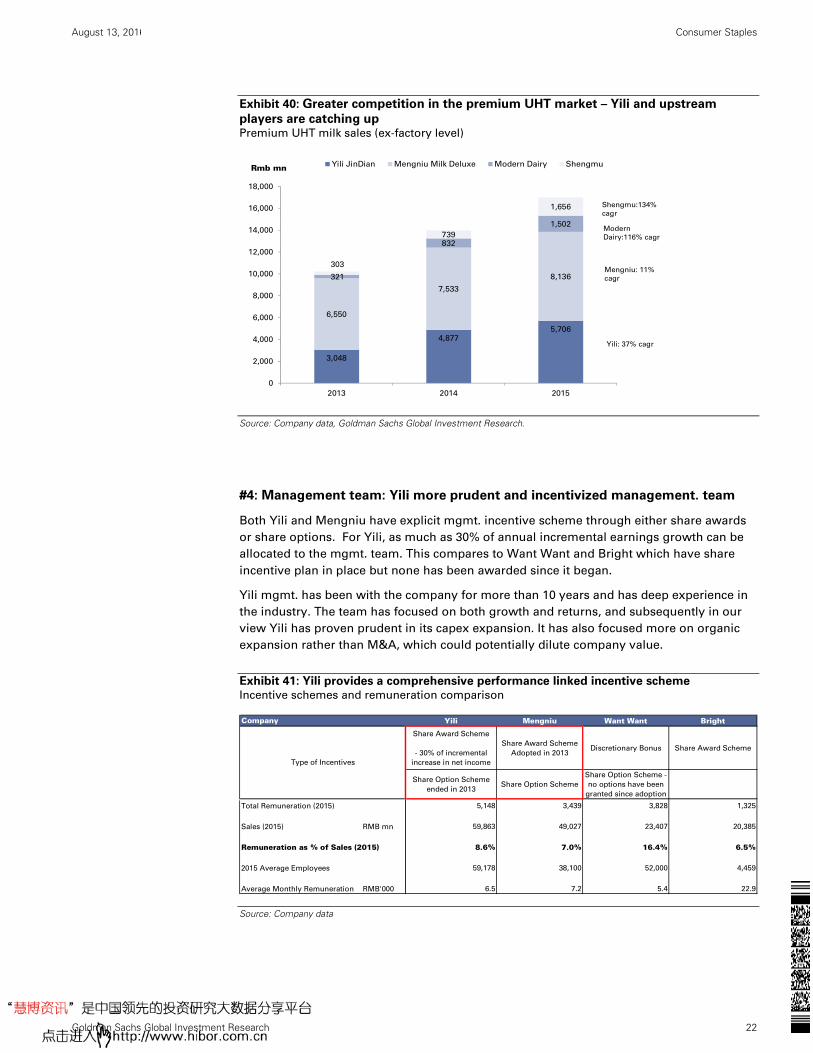
Exhibit 40: Greater competition in the premium UHT market – Yili and upstream
players are catching up
Premium UHT milk sales (ex-factory level)
Source: Company data, Goldman Sachs Global Investment Research.
#4: Management team: Yili more prudent and incentivized management. team
Both Yili and Mengniu have explicit mgmt. incentive scheme through either share awards
or share options. For Yili, as much as 30% of annual incremental earnings growth can be
allocated to the mgmt. team. This compares to Want Want and Bright which have share
incentive plan in place but none has been awarded since it began.
Yili mgmt. has been with the company for more than 10 years and has deep experience in
the industry. The team has focused on both growth and returns, and subsequently in our
view Yili has proven prudent in its capex expansion. It has also focused more on organic
expansion rather than M&A, which could potentially dilute company value.
Exhibit 41: Yili provides a comprehensive performance linked incentive scheme
Incentive schemes and remuneration comparison
Source: Company data
3,048
4,8775,706
6,550
7,533
8,136321
832
1,502
303
739
1,656
0
2,000
4,000
6,000
8,000
10,000
12,000
14,000
16,000
18,000
2013 2014 2015
Rmb mn Yili JinDian Mengniu Milk Deluxe Modern Dairy Shengmu
Shengmu:134%
cagr
Modern
Dairy:116% cagr
Mengniu: 11%
cagr
Yili: 37% cagr
Company Yili Mengniu Want Want Bright
Share Award Scheme
- 30% of incremental
increase in net income
Share Award Scheme
Adopted in 2013Discretionary Bonus Share Award Scheme
Share Option Scheme
ended in 2013Share Option Scheme
Share Option Scheme -
no options have been
granted since adoption
Total Remuneration (2015) 5,148 3,439 3,828 1,325
Sales (2015) RMB mn 59,863 49,027 23,407 20,385
Remuneration as % of Sales (2015) 8.6% 7.0% 16.4% 6.5%
2015 Average Employees 59,178 38,100 52,000 4,459
Average Monthly Remuneration RMB'000 6.5 7.2 5.4 22.9
Type of Incentives

August 13, 2016 China: Consumer Staples
Goldman Sachs Global Investment Research 23
Exhibit 42: Yili has one of the highest free floats of all China dairy companies, while mgmt.
still holds nearly 8% Share ownership of each company
Source: Bloomberg
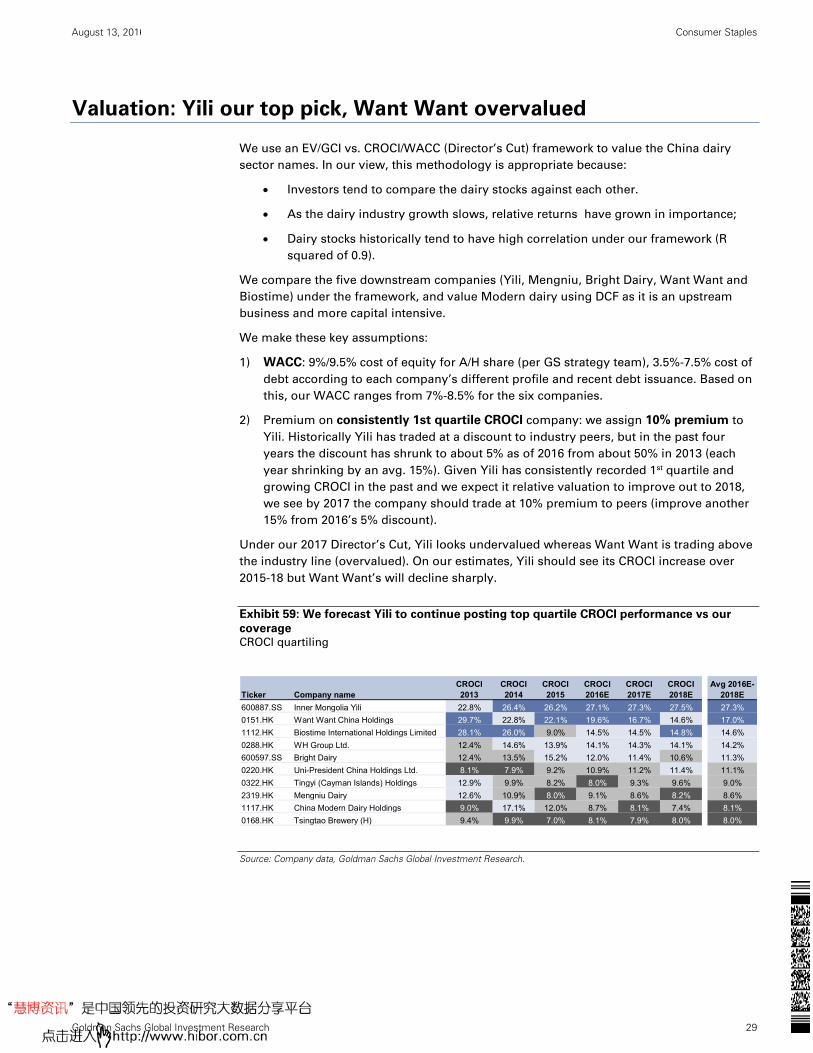
Compared with China and Global dairy companies, Yili has the highest CROCI (26%) due to
its high asset turnover. It deploys a light asset model due to years of prudence on capex
and working capital. Over 2011-2015, Yili’s CROCI grew from 15% to 26% on the back of
70% increase in Gross Cash Invested (GCI). Most of the incremental capital growth has
come from PPE investment or organic capacity expansion. We expect Yili to retain its high
CROCI of c.27% over 2016-18E.
This compares to Mengniu’s 3X higher GCI, which mainly come from higher intangibles
and working capital, as the company made a series of acquisitions in last 3 years and also
saw inventory levels go up due to milk oversupply.
Exhibit 43: Yili has highest CROCI among of peers, mainly driven by higher asset turnover
2015 CROCI breakdown comparison
Source: Company data, Goldman Sachs Global Investment Research
Dairy Companies Ownership Structure
Hohhot
Investment,
7.5%
China Security
Fund, 3.0%
China Securities
Finance, 4.3%
Gang Pan, 3.9%
Other
Executives,
4.1%
Public Investors,
77.2%
Yili
Founder
Bright Food
Group, 54.4%
Public
Investors,
43.6%
Bright Dairy
Sun Yi
Ping*(CEO),
0.4%
Public
Investors,
68.1%
COFCO Dairy
Invst. (JV of
COFCO, Arla,
Danone), 31.5%
Mengniu
Tsai Eng Meng
(Chairman),
49.8%
IWATSUKA
CONFECTIONE
RY , 5.0%JPMORGAN ,
5.0%
Public
Investors, 40.2%
Want Want
6%
8%
26%
8%
22%
15%
0.6x
1.0x
2.3x
1.2x1.1x
2.0x
17.2%
9.8%
11.2%
8.3%
28.7%
7.4%
0.6x
0.8x
0.9x
0.8x
0.7x
1.0x
0.0x
0.5x
1.0x
1.5x
2.0x
2.5x
3.0x
3.5x
4.0x
0%
5%
10%
15%
20%
25%
30%
Danone Meiji Yili Mengniu
2015 CROCI Breakdown ComparisonCROCI Asset Turnover EBITDA Margin Cash Conversion
Want Want Bright

August 13, 2016 China: Consumer Staples
Goldman Sachs Global Investment Research 24
Exhibit 44: Yili’s increase in GCI driven by Fixed Asset
investments, leading to higher CROCI Yili CROCI/GCI breakdown
Exhibit 45: Mengniu’s acquisition in last few years
increased its intangibles, but brought down its CROCI Mengniu CROCI/GCI breakdown
Source: Company data, Goldman Sachs Global Investment Research.
Source: Company data, Goldman Sachs Global Investment Research.
Dairy 2020: Yili to gain market share in key product categories
For next 3 years, as the dairy market enters slow growth stage, we expect Yili will continue
to gain market share on the back of its better execution.
We expect Yili to maintain its dominant market share in UHT milk and flavored milk, and
shrink the gap vs. Mengniu in the yogurt segment. We think Yili’s UHT yogurt will take
No.1 position in the market due to its wide-spread branding and strong distribution, and
that Yili’s low temp yogurt products can catch up with Mengniu from better logistics and
further penetration. In the IMF segment, with the further influx of overseas IMF, we expect
foreign brands to continue taking share from domestic brands.
We expect Mengniu to face intense competition in the UHT milk segment; especially the
premium UHT as more upstream and import companies compete with them in the tier 1
and 2 cities.
Exhibit 46: We expect Yili to maintain market share and
Mengniu to further lose in UHT milk market
Market share – UHT milk
Exhibit 47: We expect Yili to gain market share Market share – Yogurt
Source: Goldman Sachs Global Investment Research
Source: Goldman Sachs Global Investment Research
25,805
14,168
10,740
372 0 526
CROCI, 14.9%
CROCI, 26.2%
0%
5%
10%
15%
20%
25%
30%
0
5,000
10,000
15,000
20,000
25,000
30,000
2011 Fixed Assets GrossIntangibles
NetOperating WC
Others 2015 GCI
Rm
b m
n
Yili (Historical) Gross Cash Invested & Cash Return on Cash Invested Growth
* Due to
negative Net
Operating WC
41,342
13,548
10,595
6,975
4,209
6,015 CROCI, 20.7%
CROCI, 8.0%
0%
5%
10%
15%
20%
25%
0
5,000
10,000
15,000
20,000
25,000
30,000
35,000
40,000
45,000
2011 GCI FixedAssets
GrossIntangibles
NetOperating
WC
Others 2015 GCI
Rm
b m
n
Mengniu (Historical) Gross Cash Invested & Cash Return on Cash Invested Growth
33.634.6 34.9
36.6 36.4 36.2 36.6
33.934.5 34.3
31.2 30.3
29.3 29.0
25.0
27.0
29.0
31.0
33.0
35.0
37.0
39.0
2012 2013 2014 2015 2016E 2017E 2018E
Yili UHT Mengniu UHT
11.3 11.413.0
19.3 24.2 26.0
26.9 21.2 21.923.4
28.7 28.4 28.3 28.0
13.7
15.917.9
14.2 12.6 11.5 10.8
0
5
10
15
20
25
30
35
2012 2013 2014 2015 2016E 2017E 2018E
Yili Mengniu Bright Dairy

August 13, 2016 China: Consumer Staples
Goldman Sachs Global Investment Research 25
Exhibit 48: We expect Yili and Mengniu to gain market
share, but Yili to gain more Market share – Flavored milk
Exhibit 49: We expect Yili to maintain its leading
domestic position Infant Milk Formula market Market share – IMF
Source: Goldman Sachs Global Investment Research
Source: Goldman Sachs Global Investment Research
Earnings forecasts: Yili to deliver 13% EPS 3-year CAGR while Want Want will be
in negative territory
We expect Yili to deliver the fastest 7% sales 3yr CAGR 2015-2018E, driven by stronger
Yogurt and UHT premium product growth. We expect Yili to take over Bright Dairy to have
the No.1 UHT yogurt position in 2016 and narrow the gap between Mengniu for premium
UHT and yogurt products.
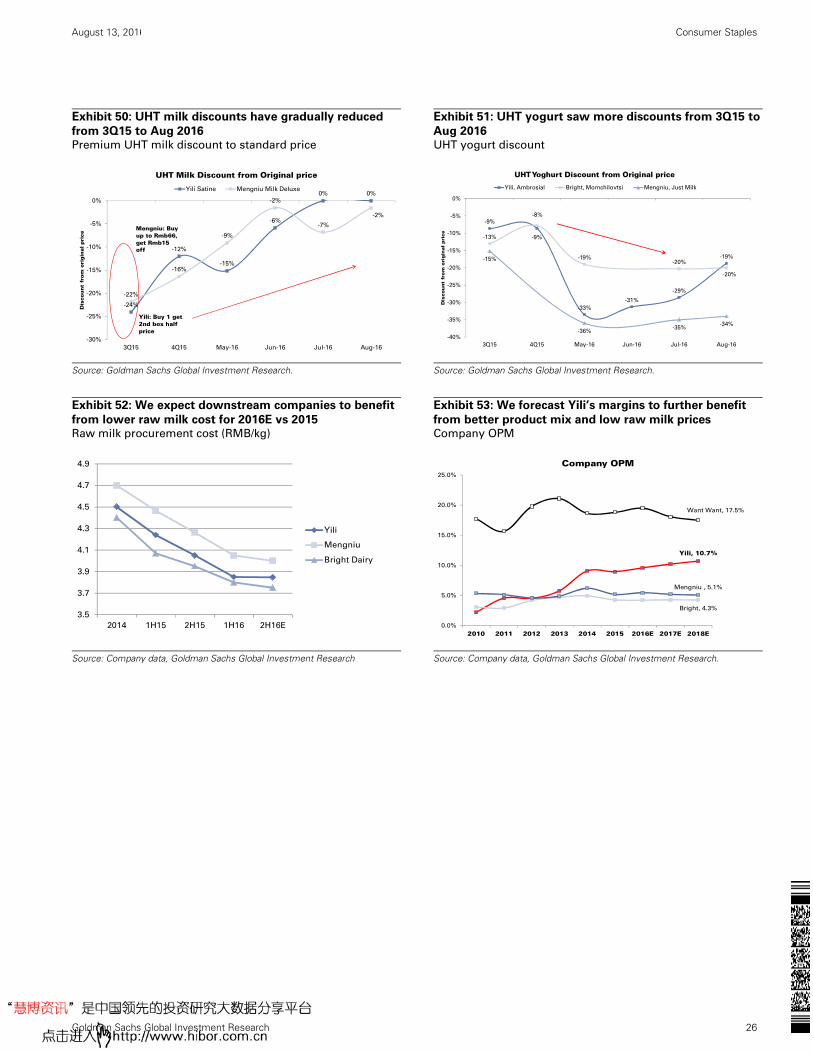
Margin wise, with the lower upstream raw milk price, we expect most downstream
companies to have lower raw milk procurement cost vs. 2015 (Exhibit 52). Mengniu will
benefit less vs. Yili and Bright due to its tighter connections with upstream companies
(China Modern Dairy etc.) so they need to protect their raw milk suppliers’ interest to some
extent. We expect Yili to deliver a strong 330bps GPM improvement from a better product
mix and further benefit from lower raw milk prices.
With more promotions being rolled out, there was high competitive intensity starting from
2H15 as companies aimed to clear up their excessive inventory. YTD, however, our channel
checks show that for UHT milk, especially premium milk, the discount has been reduced
(about 5% now vs. 20% in 3Q15). This suggests market inventory levels are not getting
worse in 2016. For UHT yogurt categories, there have been significant discounts, of up to
35% this year to its original price.
Net net, we expect Yili to deliver the strongest 12% CAGR 2015-2020E, vs. Mengniu’s 6%
and Want Want’s 4% decline.
25.4 26.128.1
31.6 32.3 34.0
36.1
20.321.2
22.5
20.0 20.4 20.8 21.3
10
15
20
25
30
35
40
2012 2013 2014 2015 2016E 2017E 2018E
Yili Mengniu Want Want
6.06.3
6.0 6.0
5.3 5.3 5.3
0.4
5.65.4
4.1 4.5
4.7 4.8
0.0
1.0
2.0
3.0
4.0
5.0
6.0
7.0
2012 2013 2014 2015 2016E 2017E 2018E
Yili Mengniu
August 13, 2016 China: Consumer Staples
Goldman Sachs Global Investment Research 26
Exhibit 50: UHT milk discounts have gradually reduced
from 3Q15 to Aug 2016 Premium UHT milk discount to standard price
Exhibit 51: UHT yogurt saw more discounts from 3Q15 to
Aug 2016 UHT yogurt discount
Source: Goldman Sachs Global Investment Research.
Source: Goldman Sachs Global Investment Research.
Exhibit 52: We expect downstream companies to benefit
from lower raw milk cost for 2016E vs 2015 Raw milk procurement cost (RMB/kg)
Exhibit 53: We forecast Yili’s margins to further benefit
from better product mix and low raw milk prices Company OPM
Source: Company data, Goldman Sachs Global Investment Research
Source: Company data, Goldman Sachs Global Investment Research.
-24%
-12%
-15%
-6%
0% 0%
-22%
-16%
-9%
-2%
-7%
-2%
-30%
-25%
-20%
-15%
-10%
-5%
0%
3Q15 4Q15 May-16 Jun-16 Jul-16 Aug-16
Dis
cou
nt
fro
m o
rig
inal
pri
ce
UHT Milk Discount from Original price
Yili Satine Mengniu Milk Deluxe
Yili: Buy 1 get 2nd box half price
Mengniu: Buy up to Rmb66, get Rmb15 off
-9%
-9%
-33%
-31%
-29%
-19%
-13%
-8%
-19%-20%
-20%
-15%
-36%-35%
-34%
-40%
-35%
-30%
-25%
-20%
-15%
-10%
-5%
0%
3Q15 4Q15 May-16 Jun-16 Jul-16 Aug-16
Dis
cou
nt
fro
m o
rigin
al
pri
ce
UHT Yoghurt Discount from Original price
Yili, Ambrosial Bright, Momchilovtsi Mengniu, Just Milk
3.5
3.7
3.9
4.1
4.3
4.5
4.7
4.9
2014 1H15 2H15 1H16 2H16E
Yili
Mengniu
Bright DairyYili, 10.7%
Bright, 4.3%
Mengniu , 5.1%
Want Want, 17.5%
0.0%
5.0%
10.0%
15.0%
20.0%
25.0%
2010 2011 2012 2013 2014 2015 2016E 2017E 2018E
Company OPM
August 13, 2016 China: Consumer Staples
Goldman Sachs Global Investment Research 27
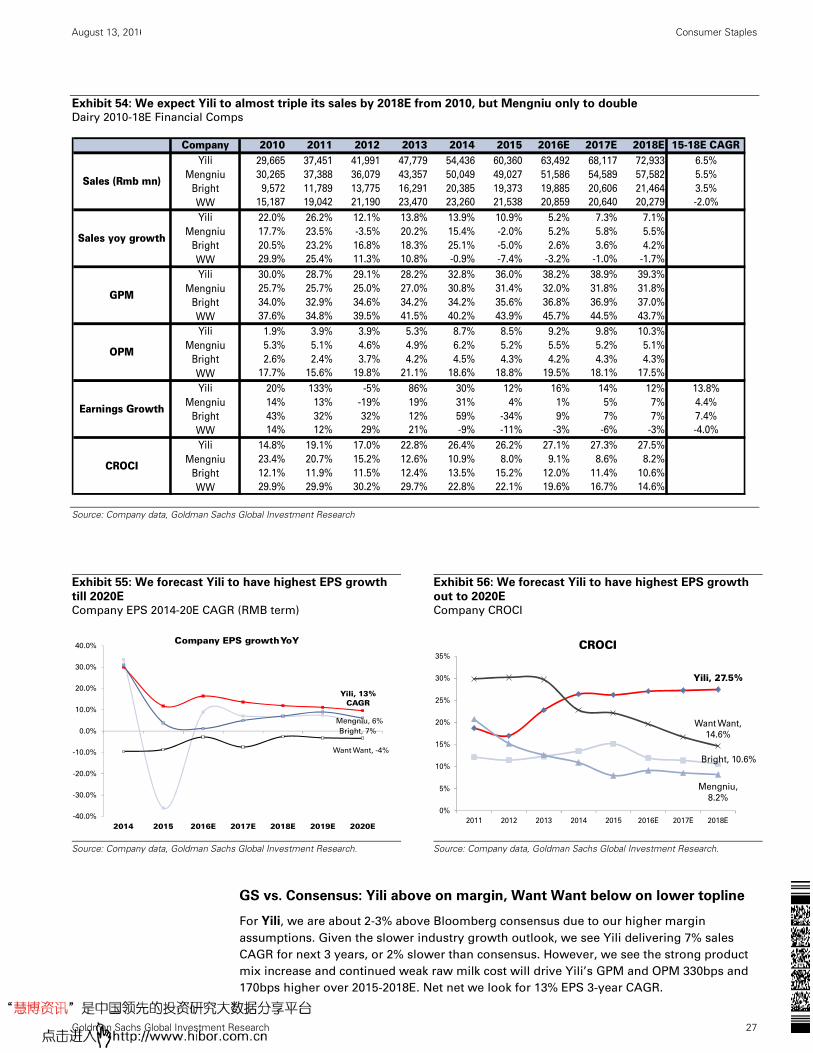
Exhibit 54: We expect Yili to almost triple its sales by 2018E from 2010, but Mengniu only to double Dairy 2010-18E Financial Comps
Source: Company data, Goldman Sachs Global Investment Research
Exhibit 55: We forecast Yili to have highest EPS growth
till 2020E Company EPS 2014-20E CAGR (RMB term)
Exhibit 56: We forecast Yili to have highest EPS growth
out to 2020E Company CROCI
Source: Company data, Goldman Sachs Global Investment Research.
Source: Company data, Goldman Sachs Global Investment Research.
GS vs. Consensus: Yili above on margin, Want Want below on lower topline
For Yili, we are about 2-3% above Bloomberg consensus due to our higher margin
assumptions. Given the slower industry growth outlook, we see Yili delivering 7% sales
CAGR for next 3 years, or 2% slower than consensus. However, we see the strong product
mix increase and continued weak raw milk cost will drive Yili’s GPM and OPM 330bps and
170bps higher over 2015-2018E. Net net we look for 13% EPS 3-year CAGR.
Company 2010 2011 2012 2013 2014 2015 2016E 2017E 2018E 15-18E CAGR Yili 29,665 37,451 41,991 47,779 54,436 60,360 63,492 68,117 72,933 6.5%
Mengniu 30,265 37,388 36,079 43,357 50,049 49,027 51,586 54,589 57,582 5.5%
Bright 9,572 11,789 13,775 16,291 20,385 19,373 19,885 20,606 21,464 3.5%
WW 15,187 19,042 21,190 23,470 23,260 21,538 20,859 20,640 20,279 -2.0%
Yili 22.0% 26.2% 12.1% 13.8% 13.9% 10.9% 5.2% 7.3% 7.1%
Mengniu 17.7% 23.5% -3.5% 20.2% 15.4% -2.0% 5.2% 5.8% 5.5%
Bright 20.5% 23.2% 16.8% 18.3% 25.1% -5.0% 2.6% 3.6% 4.2%
WW 29.9% 25.4% 11.3% 10.8% -0.9% -7.4% -3.2% -1.0% -1.7%
Yili 30.0% 28.7% 29.1% 28.2% 32.8% 36.0% 38.2% 38.9% 39.3%
Mengniu 25.7% 25.7% 25.0% 27.0% 30.8% 31.4% 32.0% 31.8% 31.8%
Bright 34.0% 32.9% 34.6% 34.2% 34.2% 35.6% 36.8% 36.9% 37.0%
WW 37.6% 34.8% 39.5% 41.5% 40.2% 43.9% 45.7% 44.5% 43.7%
Yili 1.9% 3.9% 3.9% 5.3% 8.7% 8.5% 9.2% 9.8% 10.3%
Mengniu 5.3% 5.1% 4.6% 4.9% 6.2% 5.2% 5.5% 5.2% 5.1%
Bright 2.6% 2.4% 3.7% 4.2% 4.5% 4.3% 4.2% 4.3% 4.3%
WW 17.7% 15.6% 19.8% 21.1% 18.6% 18.8% 19.5% 18.1% 17.5%
Yili 20% 133% -5% 86% 30% 12% 16% 14% 12% 13.8%
Mengniu 14% 13% -19% 19% 31% 4% 1% 5% 7% 4.4%
Bright 43% 32% 32% 12% 59% -34% 9% 7% 7% 7.4%
WW 14% 12% 29% 21% -9% -11% -3% -6% -3% -4.0%
Yili 14.8% 19.1% 17.0% 22.8% 26.4% 26.2% 27.1% 27.3% 27.5%
Mengniu 23.4% 20.7% 15.2% 12.6% 10.9% 8.0% 9.1% 8.6% 8.2%
Bright 12.1% 11.9% 11.5% 12.4% 13.5% 15.2% 12.0% 11.4% 10.6%
WW 29.9% 29.9% 30.2% 29.7% 22.8% 22.1% 19.6% 16.7% 14.6%
Sales (Rmb mn)
Sales yoy growth
GPM
OPM
Earnings Growth
CROCI
Yili, 13% CAGR
Bright, 7%
Mengniu, 6%
Want Want, -4%
-40.0%
-30.0%
-20.0%
-10.0%
0.0%
10.0%
20.0%
30.0%
40.0%
2014 2015 2016E 2017E 2018E 2019E 2020E
Company EPS growth YoY
Yili, 27.5%
Bright, 10.6%
Mengniu,
8.2%
Want Want,
14.6%
0%
5%
10%
15%
20%
25%
30%
35%
2011 2012 2013 2014 2015 2016E 2017E 2018E
CROCI
August 13, 2016 China: Consumer Staples
Goldman Sachs Global Investment Research 28
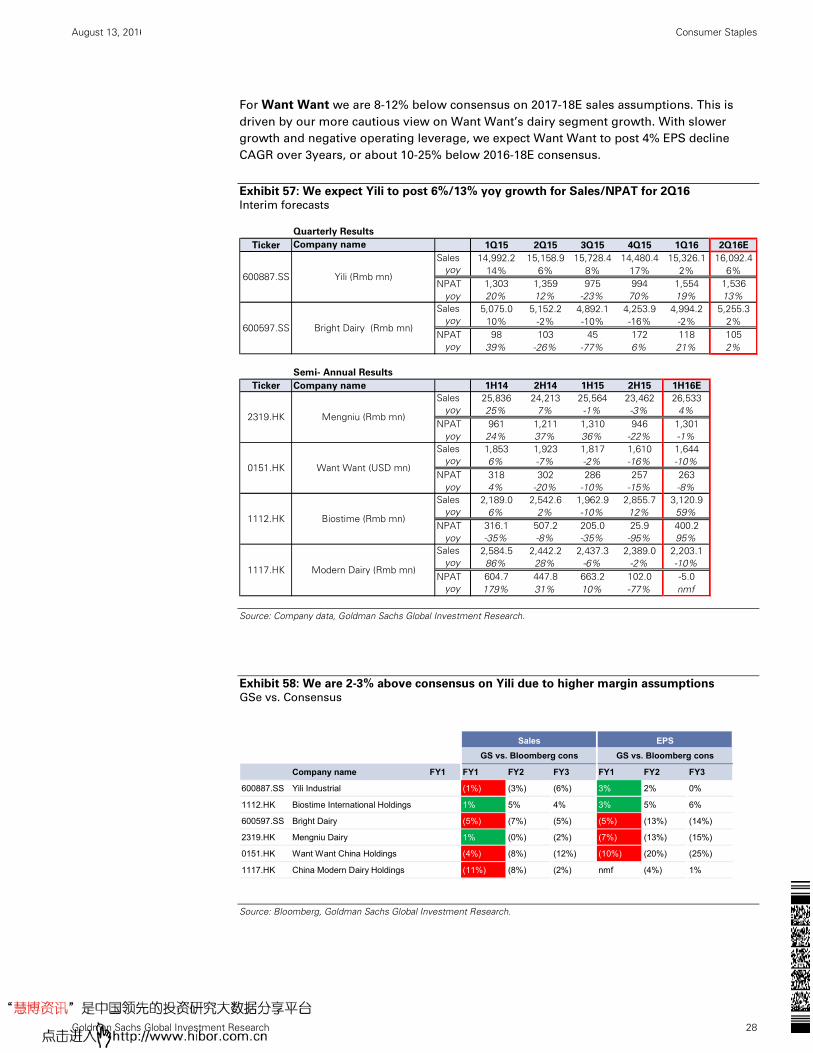
For Want Want we are 8-12% below consensus on 2017-18E sales assumptions. This is
driven by our more cautious view on Want Want’s dairy segment growth. With slower
growth and negative operating leverage, we expect Want Want to post 4% EPS decline
CAGR over 3years, or about 10-25% below 2016-18E consensus.
Exhibit 57: We expect Yili to post 6%/13% yoy growth for Sales/NPAT for 2Q16 Interim forecasts
Source: Company data, Goldman Sachs Global Investment Research.
Exhibit 58: We are 2-3% above consensus on Yili due to higher margin assumptions GSe vs. Consensus
Source: Bloomberg, Goldman Sachs Global Investment Research.
Quarterly Results
Ticker Company name 1Q15 2Q15 3Q15 4Q15 1Q16 2Q16E
Sales 14,992.2 15,158.9 15,728.4 14,480.4 15,326.1 16,092.4 yoy 14% 6% 8% 17% 2% 6%
NPAT 1,303 1,359 975 994 1,554 1,536 yoy 20% 12% -23% 70% 19% 13%
Sales 5,075.0 5,152.2 4,892.1 4,253.9 4,994.2 5,255.3 yoy 10% -2% -10% -16% -2% 2%
NPAT 98 103 45 172 118 105 yoy 39% -26% -77% 6% 21% 2%
Ticker Company name 1H14 2H14 1H15 2H15 1H16E
Sales 25,836 24,213 25,564 23,462 26,533 yoy 25% 7% -1% -3% 4%
NPAT 961 1,211 1,310 946 1,301 yoy 24% 37% 36% -22% -1%
Sales 1,853 1,923 1,817 1,610 1,644 yoy 6% -7% -2% -16% -10%
NPAT 318 302 286 257 263 yoy 4% -20% -10% -15% -8%
Sales 2,189.0 2,542.6 1,962.9 2,855.7 3,120.9 yoy 6% 2% -10% 12% 59%
NPAT 316.1 507.2 205.0 25.9 400.2 yoy -35% -8% -35% -95% 95%
Sales 2,584.5 2,442.2 2,437.3 2,389.0 2,203.1 yoy 86% 28% -6% -2% -10%
NPAT 604.7 447.8 663.2 102.0 -5.0 yoy 179% 31% 10% -77% nmf
Mengniu (Rmb mn)2319.HK
600887.SS Yili (Rmb mn)
Semi- Annual Results
1112.HK Biostime (Rmb mn)
600597.SS Bright Dairy (Rmb mn)
0151.HK Want Want (USD mn)
1117.HK Modern Dairy (Rmb mn)
Sales EPS
GS vs. Bloomberg cons GS vs. Bloomberg cons
Company name FY1 FY1 FY2 FY3 FY1 FY2 FY3
600887.SS Yili Industrial (1%) (3%) (6%) 3% 2% 0%
1112.HK Biostime International Holdings 1% 5% 4% 3% 5% 6%
600597.SS Bright Dairy (5%) (7%) (5%) (5%) (13%) (14%)
2319.HK Mengniu Dairy 1% (0%) (2%) (7%) (13%) (15%)
0151.HK Want Want China Holdings (4%) (8%) (12%) (10%) (20%) (25%)
1117.HK China Modern Dairy Holdings (11%) (8%) (2%) nmf (4%) 1%
August 13, 2016 China: Consumer Staples
Goldman Sachs Global Investment Research 29
Valuation: Yili our top pick, Want Want overvalued
We use an EV/GCI vs. CROCI/WACC (Director’s Cut) framework to value the China dairy
sector names. In our view, this methodology is appropriate because:
Investors tend to compare the dairy stocks against each other.
As the dairy industry growth slows, relative returns have grown in importance;
Dairy stocks historically tend to have high correlation under our framework (R
squared of 0.9).
We compare the five downstream companies (Yili, Mengniu, Bright Dairy, Want Want and
Biostime) under the framework, and value Modern dairy using DCF as it is an upstream
business and more capital intensive.
We make these key assumptions:
1) WACC: 9%/9.5% cost of equity for A/H share (per GS strategy team), 3.5%-7.5% cost of
debt according to each company’s different profile and recent debt issuance. Based on
this, our WACC ranges from 7%-8.5% for the six companies.
2) Premium on consistently 1st quartile CROCI company: we assign 10% premium to
Yili. Historically Yili has traded at a discount to industry peers, but in the past four
years the discount has shrunk to about 5% as of 2016 from about 50% in 2013 (each
year shrinking by an avg. 15%). Given Yili has consistently recorded 1st quartile and
growing CROCI in the past and we expect it relative valuation to improve out to 2018,
we see by 2017 the company should trade at 10% premium to peers (improve another
15% from 2016’s 5% discount).
Under our 2017 Director’s Cut, Yili looks undervalued whereas Want Want is trading above
the industry line (overvalued). On our estimates, Yili should see its CROCI increase over
2015-18 but Want Want’s will decline sharply.
Exhibit 59: We forecast Yili to continue posting top quartile CROCI performance vs our
coverage CROCI quartiling
Source: Company data, Goldman Sachs Global Investment Research.
Ticker Company nameCROCI 2013
CROCI 2014
CROCI 2015
CROCI 2016E
CROCI 2017E
CROCI 2018E
Avg 2016E-2018E
600887.SS Inner Mongolia Yili 22.8% 26.4% 26.2% 27.1% 27.3% 27.5% 27.3%
0151.HK Want Want China Holdings 29.7% 22.8% 22.1% 19.6% 16.7% 14.6% 17.0%
1112.HK Biostime International Holdings Limited 28.1% 26.0% 9.0% 14.5% 14.5% 14.8% 14.6%
0288.HK WH Group Ltd. 12.4% 14.6% 13.9% 14.1% 14.3% 14.1% 14.2%
600597.SS Bright Dairy 12.4% 13.5% 15.2% 12.0% 11.4% 10.6% 11.3%
0220.HK Uni-President China Holdings Ltd. 8.1% 7.9% 9.2% 10.9% 11.2% 11.4% 11.1%
0322.HK Tingyi (Cayman Islands) Holdings 12.9% 9.9% 8.2% 8.0% 9.3% 9.6% 9.0%
2319.HK Mengniu Dairy 12.6% 10.9% 8.0% 9.1% 8.6% 8.2% 8.6%
1117.HK China Modern Dairy Holdings 9.0% 17.1% 12.0% 8.7% 8.1% 7.4% 8.1%
0168.HK Tsingtao Brewery (H) 9.4% 9.9% 7.0% 8.1% 7.9% 8.0% 8.0%
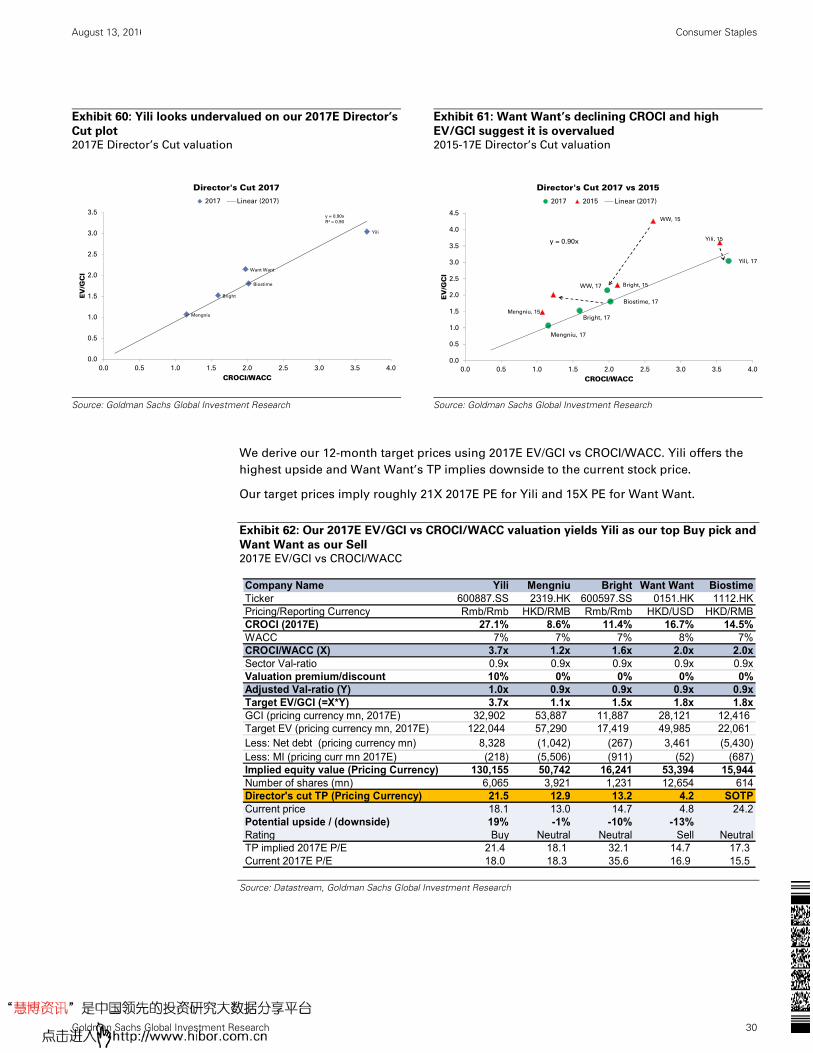
August 13, 2016 China: Consumer Staples
Goldman Sachs Global Investment Research 30
Exhibit 60: Yili looks undervalued on our 2017E Director’s
Cut plot 2017E Director’s Cut valuation
Exhibit 61: Want Want’s declining CROCI and high
EV/GCI suggest it is overvalued 2015-17E Director’s Cut valuation
Source: Goldman Sachs Global Investment Research
Source: Goldman Sachs Global Investment Research
We derive our 12-month target prices using 2017E EV/GCI vs CROCI/WACC. Yili offers the
highest upside and Want Want’s TP implies downside to the current stock price.
Our target prices imply roughly 21X 2017E PE for Yili and 15X PE for Want Want.
Exhibit 62: Our 2017E EV/GCI vs CROCI/WACC valuation yields Yili as our top Buy pick and
Want Want as our Sell 2017E EV/GCI vs CROCI/WACC
Source: Datastream, Goldman Sachs Global Investment Research
y = 0.90x
R² = 0.90
0.0
0.5
1.0
1.5
2.0
2.5
3.0
3.5
0.0 0.5 1.0 1.5 2.0 2.5 3.0 3.5 4.0
EV
/GC
I
CROCI/WACC
Director's Cut 2017
2017 Linear (2017)
Yili
Want Want
Mengniu
Bright
Biostime
Yili, 17
WW, 17
Mengniu, 17
Bright, 17
Biostime, 17
y = 0.90x
0.0
0.5
1.0
1.5
2.0
2.5
3.0
3.5
4.0
4.5
0.0 0.5 1.0 1.5 2.0 2.5 3.0 3.5 4.0
EV
/GC
I
CROCI/WACC
Director's Cut 2017 vs 2015
2017 2015 Linear (2017)
Yili, 15
WW, 15
Mengniu, 15
Bright, 15
Company Name Yili Mengniu Bright Want Want BiostimeTicker 600887.SS 2319.HK 600597.SS 0151.HK 1112.HKPricing/Reporting Currency Rmb/Rmb HKD/RMB Rmb/Rmb HKD/USD HKD/RMBCROCI (2017E) 27.1% 8.6% 11.4% 16.7% 14.5%WACC 7% 7% 7% 8% 7%CROCI/WACC (X) 3.7x 1.2x 1.6x 2.0x 2.0xSector Val-ratio 0.9x 0.9x 0.9x 0.9x 0.9xValuation premium/discount 10% 0% 0% 0% 0%Adjusted Val-ratio (Y) 1.0x 0.9x 0.9x 0.9x 0.9xTarget EV/GCI (=X*Y) 3.7x 1.1x 1.5x 1.8x 1.8xGCI (pricing currency mn, 2017E) 32,902 53,887 11,887 28,121 12,416 Target EV (pricing currency mn, 2017E) 122,044 57,290 17,419 49,985 22,061 Less: Net debt (pricing currency mn) 8,328 (1,042) (267) 3,461 (5,430) Less: MI (pricing curr mn 2017E) (218) (5,506) (911) (52) (687) Implied equity value (Pricing Currency) 130,155 50,742 16,241 53,394 15,944Number of shares (mn) 6,065 3,921 1,231 12,654 614Director's cut TP (Pricing Currency) 21.5 12.9 13.2 4.2 SOTPCurrent price 18.1 13.0 14.7 4.8 24.2Potential upside / (downside) 19% -1% -10% -13%Rating Buy Neutral Neutral Sell NeutralTP implied 2017E P/E 21.4 18.1 32.1 14.7 17.3 Current 2017E P/E 18.0 18.3 35.6 16.9 15.5
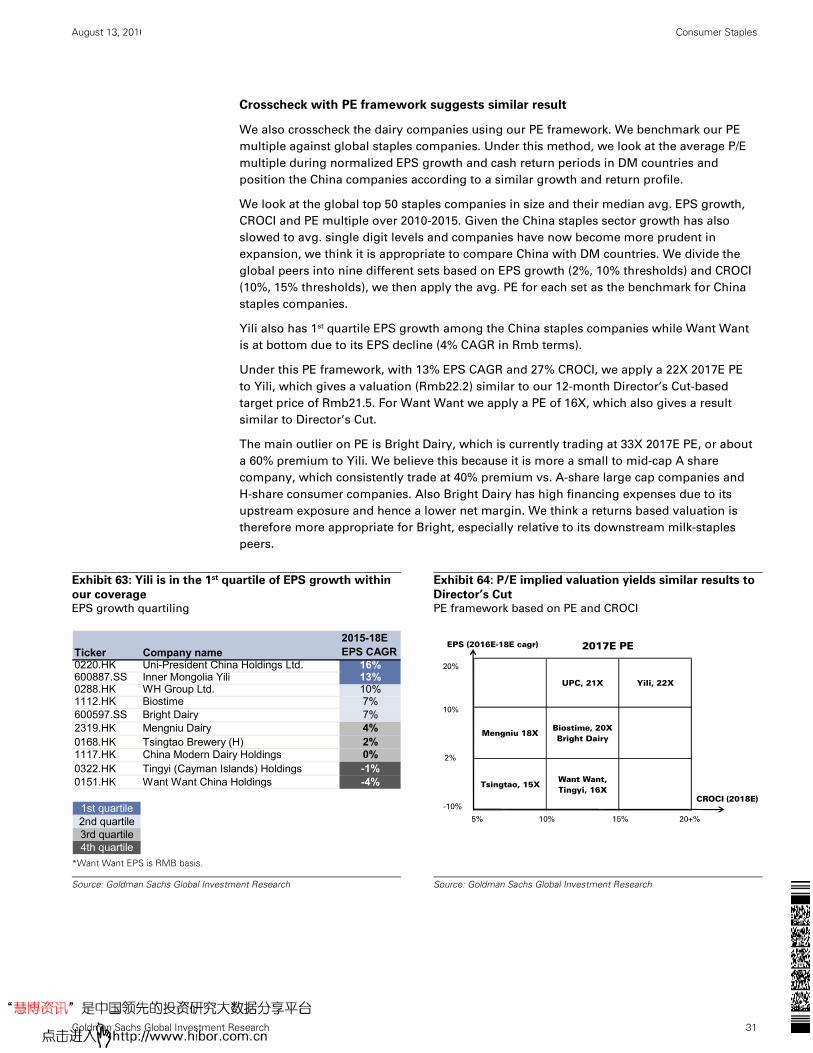
August 13, 2016 China: Consumer Staples
Goldman Sachs Global Investment Research 31
Crosscheck with PE framework suggests similar result
We also crosscheck the dairy companies using our PE framework. We benchmark our PE
multiple against global staples companies. Under this method, we look at the average P/E
multiple during normalized EPS growth and cash return periods in DM countries and
position the China companies according to a similar growth and return profile.
We look at the global top 50 staples companies in size and their median avg. EPS growth,
CROCI and PE multiple over 2010-2015. Given the China staples sector growth has also
slowed to avg. single digit levels and companies have now become more prudent in
expansion, we think it is appropriate to compare China with DM countries. We divide the
global peers into nine different sets based on EPS growth (2%, 10% thresholds) and CROCI
(10%, 15% thresholds), we then apply the avg. PE for each set as the benchmark for China
staples companies.
Yili also has 1st quartile EPS growth among the China staples companies while Want Want
is at bottom due to its EPS decline (4% CAGR in Rmb terms).
Under this PE framework, with 13% EPS CAGR and 27% CROCI, we apply a 22X 2017E PE
to Yili, which gives a valuation (Rmb22.2) similar to our 12-month Director’s Cut-based
target price of Rmb21.5. For Want Want we apply a PE of 16X, which also gives a result
similar to Director’s Cut.
The main outlier on PE is Bright Dairy, which is currently trading at 33X 2017E PE, or about
a 60% premium to Yili. We believe this because it is more a small to mid-cap A share
company, which consistently trade at 40% premium vs. A-share large cap companies and
H-share consumer companies. Also Bright Dairy has high financing expenses due to its
upstream exposure and hence a lower net margin. We think a returns based valuation is
therefore more appropriate for Bright, especially relative to its downstream milk-staples
peers.
Exhibit 63: Yili is in the 1st quartile of EPS growth within
our coverage EPS growth quartiling
Exhibit 64: P/E implied valuation yields similar results to
Director’s Cut PE framework based on PE and CROCI
*Want Want EPS is RMB basis.
Source: Goldman Sachs Global Investment Research
Source: Goldman Sachs Global Investment Research
Ticker Company name2015-18E EPS CAGR
0220.HK Uni-President China Holdings Ltd. 16%600887.SS Inner Mongolia Yili 13%0288.HK WH Group Ltd. 10%1112.HK Biostime 7%600597.SS Bright Dairy 7%2319.HK Mengniu Dairy 4%0168.HK Tsingtao Brewery (H) 2%1117.HK China Modern Dairy Holdings 0%0322.HK Tingyi (Cayman Islands) Holdings -1%0151.HK Want Want China Holdings -4%
1st quartile2nd quartile3rd quartile4th quartile
UPC, 21X Yili, 22X
Mengniu 18XBiostime, 20XBright Dairy
Tsingtao, 15XWant Want, Tingyi, 16X
5% 10% 15%
CROCI (2018E)
EPS (2016E-18E cagr)
-10%
2%
10%
20%
20+%
2017E PE
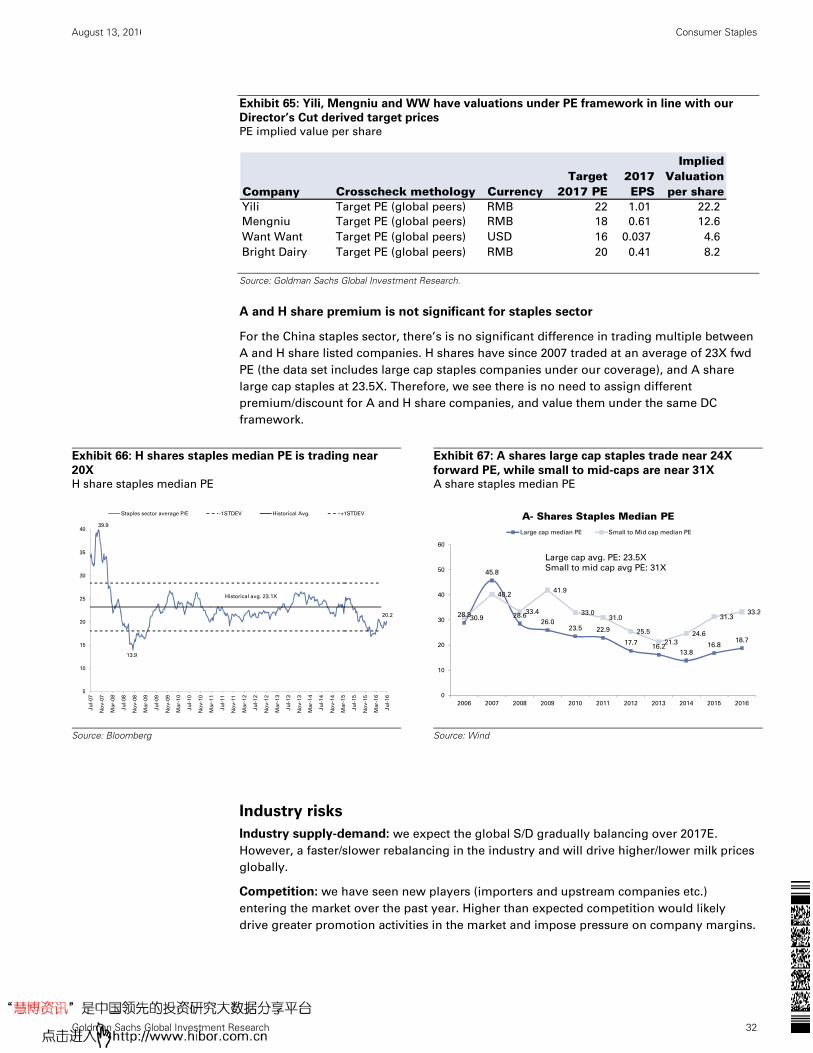
August 13, 2016 China: Consumer Staples
Goldman Sachs Global Investment Research 32
Exhibit 65: Yili, Mengniu and WW have valuations under PE framework in line with our
Director’s Cut derived target prices PE implied value per share
Source: Goldman Sachs Global Investment Research.
A and H share premium is not significant for staples sector
For the China staples sector, there’s is no significant difference in trading multiple between
A and H share listed companies. H shares have since 2007 traded at an average of 23X fwd
PE (the data set includes large cap staples companies under our coverage), and A share
large cap staples at 23.5X. Therefore, we see there is no need to assign different
premium/discount for A and H share companies, and value them under the same DC
framework.
Exhibit 66: H shares staples median PE is trading near
20X H share staples median PE
Exhibit 67: A shares large cap staples trade near 24X
forward PE, while small to mid-caps are near 31X A share staples median PE
Source: Bloomberg
Source: Wind
Industry risks
Industry supply-demand: we expect the global S/D gradually balancing over 2017E.
However, a faster/slower rebalancing in the industry and will drive higher/lower milk prices
globally.
Competition: we have seen new players (importers and upstream companies etc.)
entering the market over the past year. Higher than expected competition would likely
drive greater promotion activities in the market and impose pressure on company margins.
Company Crosscheck methology CurrencyTarget
2017 PE2017 EPS
Implied Valuation per share
Yili Target PE (global peers) RMB 22 1.01 22.2
Mengniu Target PE (global peers) RMB 18 0.61 12.6
Want Want Target PE (global peers) USD 16 0.037 4.6
Bright Dairy Target PE (global peers) RMB 20 0.41 8.2
39.9
13.9
20.2
5
10
15
20
25
30
35
40
Ju
l-07
No
v-0
7
Mar-
08
Ju
l-08
No
v-0
8
Mar-
09
Ju
l-09
No
v-0
9
Mar-
10
Ju
l-10
No
v-1
0
Mar-
11
Ju
l-11
No
v-1
1
Mar-
12
Ju
l-12
No
v-1
2
Mar-
13
Ju
l-13
No
v-1
3
Mar-
14
Ju
l-14
No
v-1
4
Mar-
15
Ju
l-15
No
v-1
5
Mar-
16
Ju
l-16
Staples sector average P/E -1STDEV Historical Avg. +1STDEV
Historical avg. 23.1X
28.9
45.8
28.626.0
23.5 22.9
17.716.2
13.816.8
18.7
30.9
40.2
33.4
41.9
33.031.0
25.5
21.3
24.6
31.333.2
0
10
20
30
40
50
60
2006 2007 2008 2009 2010 2011 2012 2013 2014 2015 2016
A- Shares Staples Median PELarge cap median PE Small to Mid cap median PE
Large cap avg. PE: 23.5X
Small to mid cap avg PE: 31X
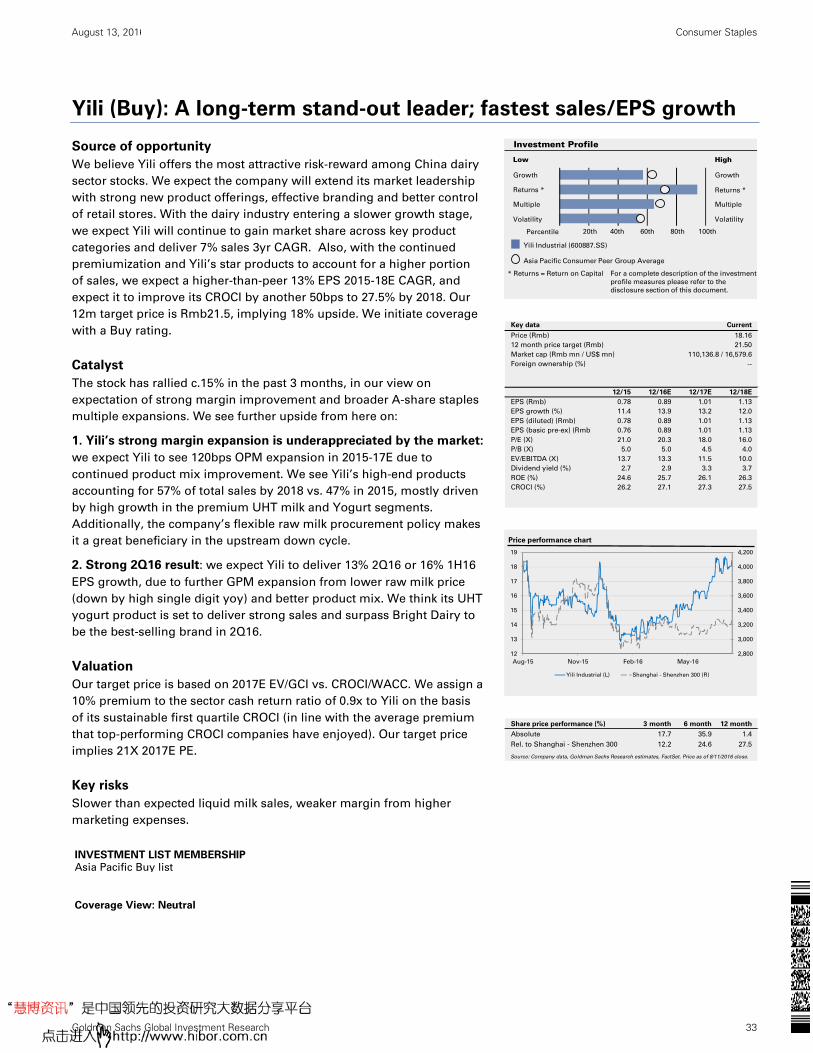
August 13, 2016 China: Consumer Staples
Goldman Sachs Global Investment Research 33
Yili (Buy): A long-term stand-out leader; fastest sales/EPS growth
Source of opportunity
We believe Yili offers the most attractive risk-reward among China dairy
sector stocks. We expect the company will extend its market leadership
with strong new product offerings, effective branding and better control
of retail stores. With the dairy industry entering a slower growth stage,
we expect Yili will continue to gain market share across key product
categories and deliver 7% sales 3yr CAGR. Also, with the continued
premiumization and Yili’s star products to account for a higher portion
of sales, we expect a higher-than-peer 13% EPS 2015-18E CAGR, and
expect it to improve its CROCI by another 50bps to 27.5% by 2018. Our
12m target price is Rmb21.5, implying 18% upside. We initiate coverage
with a Buy rating.
Catalyst
The stock has rallied c.15% in the past 3 months, in our view on
expectation of strong margin improvement and broader A-share staples
multiple expansions. We see further upside from here on:
1. Yili’s strong margin expansion is underappreciated by the market:
we expect Yili to see 120bps OPM expansion in 2015-17E due to
continued product mix improvement. We see Yili’s high-end products
accounting for 57% of total sales by 2018 vs. 47% in 2015, mostly driven
by high growth in the premium UHT milk and Yogurt segments.
Additionally, the company’s flexible raw milk procurement policy makes
it a great beneficiary in the upstream down cycle.
2. Strong 2Q16 result: we expect Yili to deliver 13% 2Q16 or 16% 1H16
EPS growth, due to further GPM expansion from lower raw milk price
(down by high single digit yoy) and better product mix. We think its UHT
yogurt product is set to deliver strong sales and surpass Bright Dairy to
be the best-selling brand in 2Q16.
Valuation
Our target price is based on 2017E EV/GCI vs. CROCI/WACC. We assign a
10% premium to the sector cash return ratio of 0.9x to Yili on the basis
of its sustainable first quartile CROCI (in line with the average premium
that top-performing CROCI companies have enjoyed). Our target price
implies 21X 2017E PE.
Key risks
Slower than expected liquid milk sales, weaker margin from higher
marketing expenses.
INVESTMENT LIST MEMBERSHIP
Asia Pacific Buy list
Coverage View: Neutral
Growth
Returns *
Multiple
Volatility Volatility
Multiple
Returns *
Growth
Investment Profile
Low High
Percentile 20th 40th 60th 80th 100th
* Returns = Return on Capital For a complete description of the investment
profile measures please refer to the
disclosure section of this document.
Yili Industrial (600887.SS)
Asia Pacific Consumer Peer Group Average
Key data Current
Price (Rmb) 18.16
12 month price target (Rmb) 21.50
Market cap (Rmb mn / US$ mn) 110,136.8 / 16,579.6
Foreign ownership (%) --
12/15 12/16E 12/17E 12/18E
EPS (Rmb) 0.78 0.89 1.01 1.13
EPS growth (%) 11.4 13.9 13.2 12.0
EPS (diluted) (Rmb) 0.78 0.89 1.01 1.13
EPS (basic pre-ex) (Rmb) 0.76 0.89 1.01 1.13
P/E (X) 21.0 20.3 18.0 16.0
P/B (X) 5.0 5.0 4.5 4.0
EV/EBITDA (X) 13.7 13.3 11.5 10.0
Dividend yield (%) 2.7 2.9 3.3 3.7
ROE (%) 24.6 25.7 26.1 26.3
CROCI (%) 26.2 27.1 27.3 27.5
2,800
3,000
3,200
3,400
3,600
3,800
4,000
4,200
12
13
14
15
16
17
18
19
Aug-15 Nov-15 Feb-16 May-16
Price performance chart
Yili Industrial (L) Shanghai - Shenzhen 300 (R)
Share price performance (%) 3 month 6 month 12 month
Absolute 17.7 35.9 1.4
Rel. to Shanghai - Shenzhen 300 12.2 24.6 27.5
Source: Company data, Goldman Sachs Research estimates, FactSet. Price as of 8/11/2016 close.
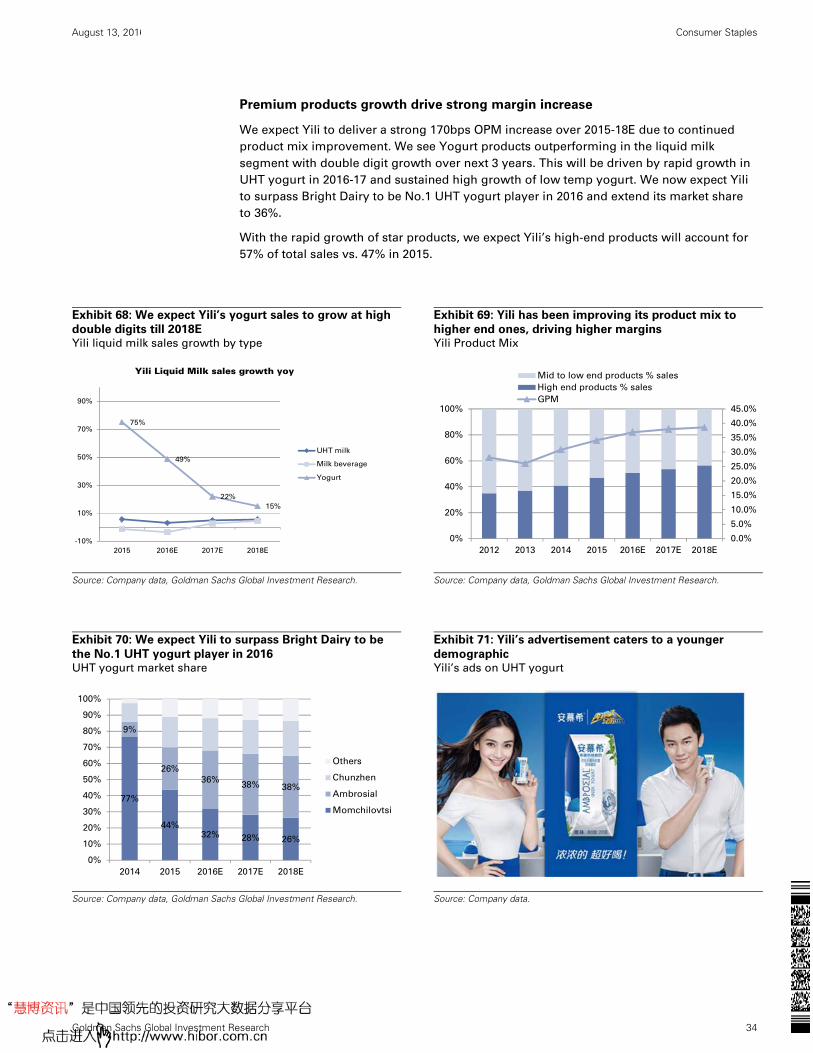
August 13, 2016 China: Consumer Staples
Goldman Sachs Global Investment Research 34
Premium products growth drive strong margin increase
We expect Yili to deliver a strong 170bps OPM increase over 2015-18E due to continued
product mix improvement. We see Yogurt products outperforming in the liquid milk
segment with double digit growth over next 3 years. This will be driven by rapid growth in
UHT yogurt in 2016-17 and sustained high growth of low temp yogurt. We now expect Yili
to surpass Bright Dairy to be No.1 UHT yogurt player in 2016 and extend its market share
to 36%.
With the rapid growth of star products, we expect Yili’s high-end products will account for
57% of total sales vs. 47% in 2015.
Exhibit 68: We expect Yili’s yogurt sales to grow at high
double digits till 2018E Yili liquid milk sales growth by type
Exhibit 69: Yili has been improving its product mix to
higher end ones, driving higher margins Yili Product Mix
Source: Company data, Goldman Sachs Global Investment Research.
Source: Company data, Goldman Sachs Global Investment Research.
Exhibit 70: We expect Yili to surpass Bright Dairy to be
the No.1 UHT yogurt player in 2016 UHT yogurt market share
Exhibit 71: Yili’s advertisement caters to a younger
demographic Yili’s ads on UHT yogurt
Source: Company data, Goldman Sachs Global Investment Research.
Source: Company data.
75%
49%
22%
15%
-10%
10%
30%
50%
70%
90%
2015 2016E 2017E 2018E
Yili Liquid Milk sales growth yoy
UHT milk
Milk beverage
Yogurt
0.0%
5.0%
10.0%
15.0%
20.0%
25.0%
30.0%
35.0%
40.0%
45.0%
0%
20%
40%
60%
80%
100%
2012 2013 2014 2015 2016E 2017E 2018E
Mid to low end products % sales
High end products % sales
GPM
77%
44%32% 28% 26%
9%
26%
36%38% 38%
0%
10%
20%
30%
40%
50%
60%
70%
80%
90%
100%
2014 2015 2016E 2017E 2018E
Others
Chunzhen
Ambrosial
Momchilovtsi
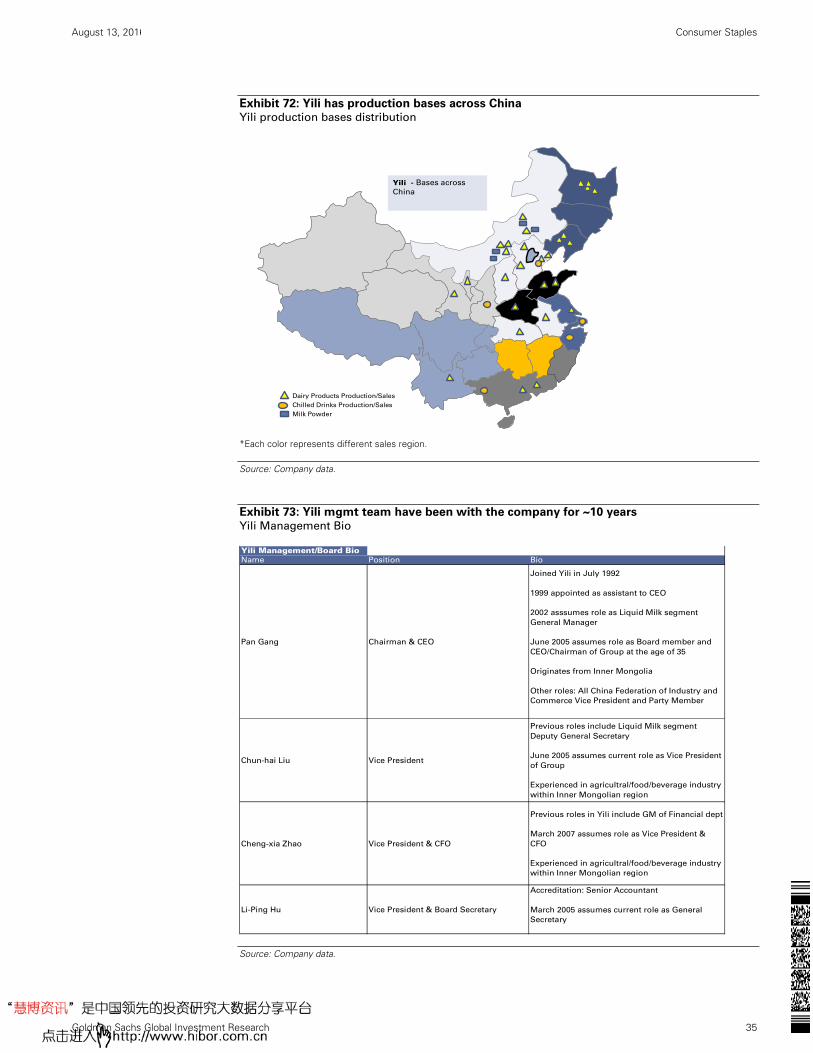
August 13, 2016 China: Consumer Staples
Goldman Sachs Global Investment Research 35
Exhibit 72: Yili has production bases across China Yili production bases distribution
*Each color represents different sales region.
Source: Company data.
Exhibit 73: Yili mgmt team have been with the company for ~10 years Yili Management Bio
Source: Company data.
Dairy Products Production/Sales
Chilled Drinks Production/Sales
Milk Powder
Yili - Bases across
China
Yili Management/Board BioName Position Bio
Pan Gang Chairman & CEO
Joined Yili in July 1992
1999 appointed as assistant to CEO
2002 asssumes role as Liquid Milk segment
General Manager
June 2005 assumes role as Board member and
CEO/Chairman of Group at the age of 35
Originates from Inner Mongolia
Other roles: All China Federation of Industry and
Commerce Vice President and Party Member
Chun-hai Liu Vice President
Previous roles include Liquid Milk segment
Deputy General Secretary
June 2005 assumes current role as Vice President
of Group
Experienced in agricultral/food/beverage industry
within Inner Mongolian region
Cheng-xia Zhao Vice President & CFO
Previous roles in Yili include GM of Financial dept
March 2007 assumes role as Vice President &
CFO
Experienced in agricultral/food/beverage industry
within Inner Mongolian region
Li-Ping Hu Vice President & Board Secretary
Accreditation: Senior Accountant
March 2005 assumes current role as General
Secretary
August 13, 2016 China: Consumer Staples
Goldman Sachs Global Investment Research 36
Financials: 14% EPS 2yr CAGR from further market share gain and
GPM expansion
Income Statement
Sales: We expect Yili to deliver 7% sales CAGR over 2015-18E, driven by continued market
share gain in the liquid milk segment. For 2016, we expect 5.4% sales or 8% organic growth
(Yili disposed of the Youran Farming in 1Q16).
Liquid milk: expect 9% sales three-year CAGR driven by the rapid yogurt growth and
recovery of UHT milk.
For yogurt, we see company’s UHT yogurt will surpass Bright Dairy to become No.1
selling brand in 2016 and reach close to RMB8bn scale by 2017. Over the longer term,
we see low temp yogurt will be the bright spot with above 20% CAGR as consumers
shift to functional products.
For UHT milk, we see Satine to continue the strong low teen growth and close its gap
with Mengniu’s Milk Deluxe over next 3yrs. With the smaller discount in 2016-17, we
expect also sales recovery for other UHT products.
Milk powder: we expect sales to drop by 9% in 2016 due to higher competition and
consumer’s shift to online channels.
Margin: we expect Yili’s GPM to further increase by 220bps/70bps in 2016/17E, driven by
lower raw milk price and product mix improvement. We see a 4% drop in raw milk price in
2016. Therefore, despite the increase in SG&A expenses (mainly higher A&P spend), we
see company will still have 120bps OPM increase over 2015-17E.
Net net, we look for 14%/13%/12% recurring EPS growth for 2016-18E, and 2-3% above
consensus for 2016-17E.
Cash Flow Statement
Capex: expect stable capex trend over 2016-17E with Rmb3.5-3.6bn/year, as the company
does not have an aggressive plant expansion plan in near term.
FCF: with improved profit margin, we see Yili will deliver stronger free cash flow each year,
from Rmb3.2bn in 2016 to Rmb6.4bn in 2018.
Balance Sheet
Net cash: Yili has strong cash position and current net cash is close to Rmb7bn in 2015.
We see further net cash increase given no massive capex plan. Potential M&A may also be
an option for the company.
ROE and CROCI: expect company’s return to slightly increase over next 3yrs, driven by
improved margin and slower capital base increase.
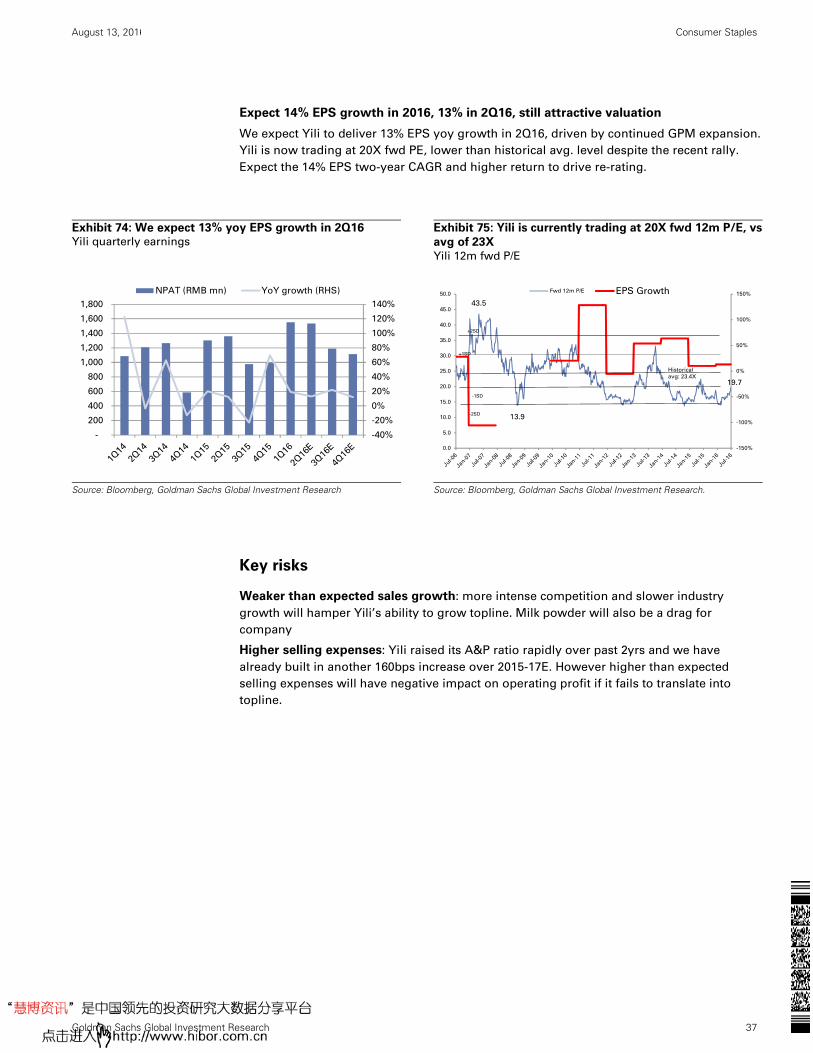
August 13, 2016 China: Consumer Staples
Goldman Sachs Global Investment Research 37
Expect 14% EPS growth in 2016, 13% in 2Q16, still attractive valuation
We expect Yili to deliver 13% EPS yoy growth in 2Q16, driven by continued GPM expansion.
Yili is now trading at 20X fwd PE, lower than historical avg. level despite the recent rally.
Expect the 14% EPS two-year CAGR and higher return to drive re-rating.
Exhibit 74: We expect 13% yoy EPS growth in 2Q16 Yili quarterly earnings
Exhibit 75: Yili is currently trading at 20X fwd 12m P/E, vs
avg of 23X
Yili 12m fwd P/E
Source: Bloomberg, Goldman Sachs Global Investment Research
Source: Bloomberg, Goldman Sachs Global Investment Research.
Key risks
Weaker than expected sales growth: more intense competition and slower industry
growth will hamper Yili’s ability to grow topline. Milk powder will also be a drag for
company
Higher selling expenses: Yili raised its A&P ratio rapidly over past 2yrs and we have
already built in another 160bps increase over 2015-17E. However higher than expected
selling expenses will have negative impact on operating profit if it fails to translate into
topline.
-40%
-20%
0%
20%
40%
60%
80%
100%
120%
140%
-
200
400
600
800
1,000
1,200
1,400
1,600
1,800
NPAT (RMB mn) YoY growth (RHS)
Hi t
+ 1
STDV
- 1
STDV- 2
STDV
43.5
13.9
19.7
-150%
-100%
-50%
0%
50%
100%
150%
0.0
5.0
10.0
15.0
20.0
25.0
30.0
35.0
40.0
45.0
50.0Fwd 12m P/E EPS Growth
Historical
avg: 23.4X
+1SD
-1SD
+2SD
-2SD
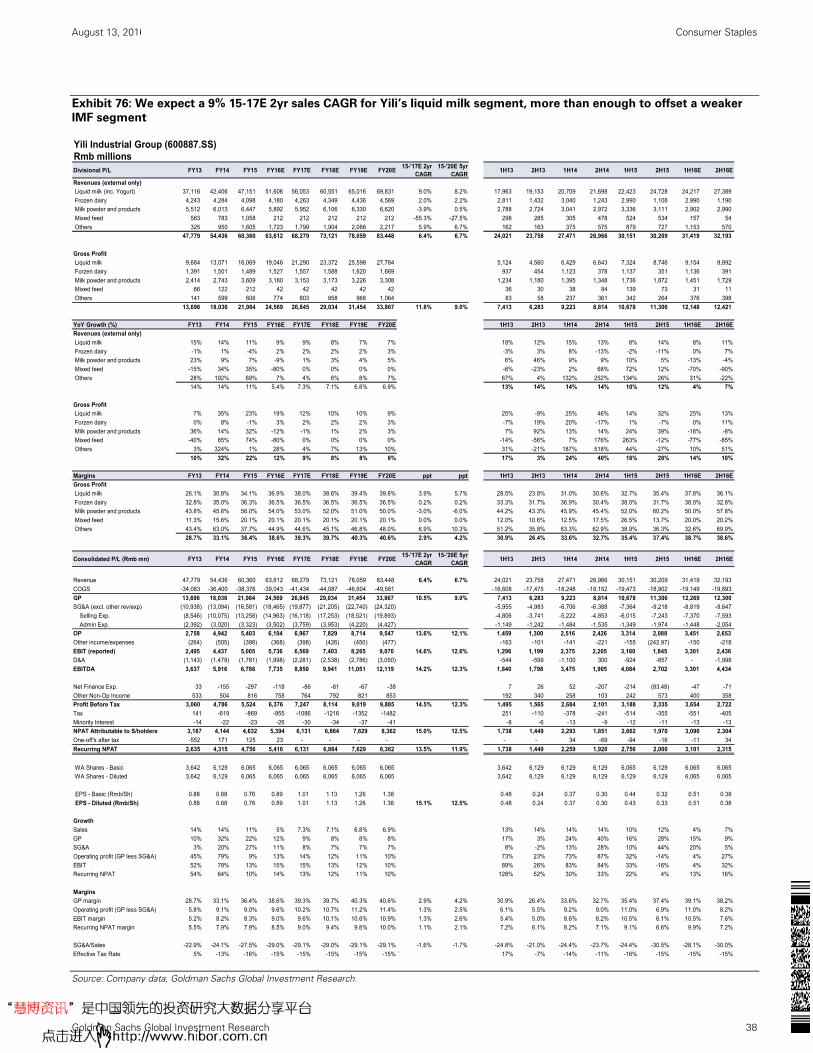
August 13, 2016 China: Consumer Staples
Goldman Sachs Global Investment Research 38
Exhibit 76: We expect a 9% 15-17E 2yr sales CAGR for Yili’s liquid milk segment, more than enough to offset a weaker
IMF segment
Source: Company data, Goldman Sachs Global Investment Research.
Yili Industrial Group (600887.SS)Rmb millionsDivisional P/L FY13 FY14 FY15 FY16E FY17E FY18E FY19E FY20E
15-'17E 2yr CAGR
15-'20E 5yr CAGR
1H13 2H13 1H14 2H14 1H15 2H15 1H16E 2H16E
Revenues (external only)
Liquid milk (inc. Yogurt) 37,116 42,406 47,151 51,606 56,053 60,551 65,016 69,831 9.0% 8.2% 17,963 19,153 20,709 21,698 22,423 24,728 24,217 27,389
Frozen dairy 4,243 4,284 4,098 4,180 4,263 4,349 4,436 4,569 2.0% 2.2% 2,811 1,432 3,040 1,243 2,990 1,108 2,990 1,190
Milk powder and products 5,512 6,013 6,447 5,892 5,952 6,106 6,330 6,620 -3.9% 0.5% 2,788 2,724 3,041 2,972 3,336 3,111 2,902 2,990
Mixed feed 583 783 1,058 212 212 212 212 212 -55.3% -27.5% 298 285 305 478 524 534 157 54
Others 325 950 1,605 1,723 1,799 1,904 2,066 2,217 5.9% 6.7% 162 163 375 575 879 727 1,153 570
47,779 54,436 60,360 63,612 68,279 73,121 78,059 83,448 6.4% 6.7% 24,021 23,758 27,471 26,966 30,151 30,209 31,419 32,193
Gross Profit
Liquid milk 9,684 13,071 16,069 19,046 21,290 23,372 25,598 27,784 5,124 4,560 6,429 6,643 7,324 8,746 9,154 9,892
Forzen dairy 1,391 1,501 1,489 1,527 1,557 1,588 1,620 1,669 937 454 1,123 378 1,137 351 1,136 391
Milk powder and products 2,414 2,743 3,609 3,180 3,153 3,173 3,226 3,308 1,234 1,180 1,395 1,348 1,736 1,872 1,451 1,729
Mixed feed 66 122 212 42 42 42 42 42 36 30 38 84 139 73 31 11
Others 141 599 606 774 803 858 968 1,064 83 58 237 361 342 264 376 398
13,696 18,036 21,984 24,569 26,845 29,034 31,454 33,867 11.8% 9.0% 7,413 6,283 9,223 8,814 10,678 11,306 12,148 12,421
YoY Growth (%) FY13 FY14 FY15 FY16E FY17E FY18E FY19E FY20E 1H13 2H13 1H14 2H14 1H15 2H15 1H16E 2H16E
Revenues (external only)
Liquid milk 15% 14% 11% 9% 9% 8% 7% 7% 18% 12% 15% 13% 8% 14% 8% 11%
Frozen dairy -1% 1% -4% 2% 2% 2% 2% 3% -3% 3% 8% -13% -2% -11% 0% 7%
Milk powder and products 23% 9% 7% -9% 1% 3% 4% 5% 6% 46% 9% 9% 10% 5% -13% -4%
Mixed feed -15% 34% 35% -80% 0% 0% 0% 0% -6% -23% 2% 68% 72% 12% -70% -90%
Others 28% 192% 69% 7% 4% 6% 8% 7% 67% 4% 132% 252% 134% 26% 31% -22%
14% 14% 11% 5.4% 7.3% 7.1% 6.8% 6.9% 13% 14% 14% 14% 10% 12% 4% 7%
Gross Profit
Liquid milk 7% 35% 23% 19% 12% 10% 10% 9% 25% -9% 25% 46% 14% 32% 25% 13%
Forzen dairy 0% 8% -1% 3% 2% 2% 2% 3% -7% 19% 20% -17% 1% -7% 0% 11%
Milk powder and products 36% 14% 32% -12% -1% 1% 2% 3% 7% 92% 13% 14% 24% 39% -16% -8%
Mixed feed -40% 85% 74% -80% 0% 0% 0% 0% -14% -56% 7% 176% 263% -12% -77% -85%
Others 3% 324% 1% 28% 4% 7% 13% 10% 31% -21% 187% 518% 44% -27% 10% 51%
10% 32% 22% 12% 9% 8% 8% 8% 17% 3% 24% 40% 16% 28% 14% 10%
Margins FY13 FY14 FY15 FY16E FY17E FY18E FY19E FY20E ppt ppt 1H13 2H13 1H14 2H14 1H15 2H15 1H16E 2H16E
Gross Profit
Liquid milk 26.1% 30.8% 34.1% 36.9% 38.0% 38.6% 39.4% 39.8% 3.9% 5.7% 28.5% 23.8% 31.0% 30.6% 32.7% 35.4% 37.8% 36.1%
Forzen dairy 32.8% 35.0% 36.3% 36.5% 36.5% 36.5% 36.5% 36.5% 0.2% 0.2% 33.3% 31.7% 36.9% 30.4% 38.0% 31.7% 38.0% 32.8%
Milk powder and products 43.8% 45.6% 56.0% 54.0% 53.0% 52.0% 51.0% 50.0% -3.0% -6.0% 44.2% 43.3% 45.9% 45.4% 52.0% 60.2% 50.0% 57.8%
Mixed feed 11.3% 15.6% 20.1% 20.1% 20.1% 20.1% 20.1% 20.1% 0.0% 0.0% 12.0% 10.6% 12.5% 17.5% 26.5% 13.7% 20.0% 20.2%
Others 43.4% 63.0% 37.7% 44.9% 44.6% 45.1% 46.8% 48.0% 6.9% 10.3% 51.2% 35.8% 63.3% 62.9% 38.9% 36.3% 32.6% 69.9%
28.7% 33.1% 36.4% 38.6% 39.3% 39.7% 40.3% 40.6% 2.9% 4.2% 30.9% 26.4% 33.6% 32.7% 35.4% 37.4% 38.7% 38.6%
Consolidated P/L (Rmb mn) FY13 FY14 FY15 FY16E FY17E FY18E FY19E FY20E15-'17E 2yr
CAGR15-'20E 5yr
CAGR1H13 2H13 1H14 2H14 1H15 2H15 1H16E 2H16E
Revenue 47,779 54,436 60,360 63,612 68,279 73,121 78,059 83,448 6.4% 6.7% 24,021 23,758 27,471 26,966 30,151 30,209 31,419 32,193
COGS -34,083 -36,400 -38,376 -39,043 -41,434 -44,087 -46,604 -49,581 -16,608 -17,475 -18,248 -18,152 -19,473 -18,902 -19,149 -19,893
GP 13,696 18,036 21,984 24,569 26,845 29,034 31,454 33,867 10.5% 9.0% 7,413 6,283 9,223 8,814 10,678 11,306 12,269 12,300
SG&A (excl. other rev/exp) (10,938) (13,094) (16,581) (18,465) (19,877) (21,205) (22,740) (24,320) -5,955 -4,983 -6,706 -6,388 -7,364 -9,218 -8,819 -9,647
Selling Exp. (8,546) (10,075) (13,258) (14,963) (16,118) (17,253) (18,521) (19,893) -4,806 -3,741 -5,222 -4,853 -6,015 -7,243 -7,370 -7,593
Admin Exp. (2,392) (3,020) (3,323) (3,502) (3,759) (3,953) (4,220) (4,427) -1,149 -1,242 -1,484 -1,535 -1,349 -1,974 -1,448 -2,054
OP 2,758 4,942 5,403 6,104 6,967 7,829 8,714 9,547 13.6% 12.1% 1,459 1,300 2,516 2,426 3,314 2,088 3,451 2,653
Other income/expenses (264) (505) (398) (368) (398) (426) (450) (477) -163 -101 -141 -221 -155 (242.97) -150 -218
EBIT (reported) 2,495 4,437 5,005 5,736 6,569 7,403 8,265 9,070 14.6% 12.6% 1,296 1,199 2,375 2,205 3,160 1,845 3,301 2,436
D&A (1,143) (1,479) (1,781) (1,998) (2,281) (2,538) (2,786) (3,050) -544 -599 -1,100 300 -924 -857 - -1,998
EBITDA 3,637 5,916 6,786 7,735 8,850 9,941 11,051 12,119 14.2% 12.3% 1,840 1,798 3,475 1,905 4,084 2,702 3,301 4,434
Net Finance Exp. 33 -155 -297 -118 -86 -81 -67 -38 7 26 52 -207 -214 (83.48) -47 -71
Other Non-Op Income 533 504 816 758 764 792 821 853 192 340 258 103 242 573 400 358
Profit Before Tax 3,060 4,786 5,524 6,376 7,247 8,114 9,019 9,885 14.5% 12.3% 1,495 1,565 2,684 2,101 3,188 2,335 3,654 2,722
Tax 141 -619 -869 -955 -1086 -1216 -1352 -1482 251 -110 -378 -241 -514 -355 -551 -405
Minority Interest -14 -22 -23 -26 -30 -34 -37 -41 -8 -6 -13 -9 -12 -11 -13 -13
NPAT Attributable to S/holders 3,187 4,144 4,632 5,394 6,131 6,864 7,629 8,362 15.0% 12.5% 1,738 1,449 2,293 1,851 2,662 1,970 3,090 2,304
One-off's after tax -552 171 125 23 - - - - - - 34 -69 -94 -16 -11 34
Recurring NPAT 2,635 4,315 4,756 5,416 6,131 6,864 7,629 8,362 13.5% 11.9% 1,738 1,449 2,259 1,920 2,756 2,000 3,101 2,315
WA Shares - Basic 3,642 6,129 6,065 6,065 6,065 6,065 6,065 6,065 3,642 6,129 6,129 6,129 6,065 6,129 6,065 6,065
WA Shares - Diluted 3,642 6,129 6,065 6,065 6,065 6,065 6,065 6,065 3,642 6,129 6,129 6,129 6,129 6,129 6,065 6,065
EPS - Basic (Rmb/Sh) 0.88 0.68 0.76 0.89 1.01 1.13 1.26 1.38 0.48 0.24 0.37 0.30 0.44 0.32 0.51 0.38
EPS - Diluted (Rmb/Sh) 0.88 0.68 0.76 0.89 1.01 1.13 1.26 1.38 15.1% 12.5% 0.48 0.24 0.37 0.30 0.43 0.33 0.51 0.38
Growth
Sales 14% 14% 11% 5% 7.3% 7.1% 6.8% 6.9% 13% 14% 14% 14% 10% 12% 4% 7%
GP 10% 32% 22% 12% 9% 8% 8% 8% 17% 3% 24% 40% 16% 28% 15% 9%
SG&A 3% 20% 27% 11% 8% 7% 7% 7% 8% -2% 13% 28% 10% 44% 20% 5%
Operating profit (GP less SG&A) 45% 79% 9% 13% 14% 12% 11% 10% 73% 23% 73% 87% 32% -14% 4% 27%
EBIT 52% 78% 13% 15% 15% 13% 12% 10% 89% 26% 83% 84% 33% -16% 4% 32%
Recurring NPAT 54% 64% 10% 14% 13% 12% 11% 10% 128% 52% 30% 33% 22% 4% 13% 16%
Margins
GP margin 28.7% 33.1% 36.4% 38.6% 39.3% 39.7% 40.3% 40.6% 2.9% 4.2% 30.9% 26.4% 33.6% 32.7% 35.4% 37.4% 39.1% 38.2%
Operating profit (GP less SG&A) 5.8% 9.1% 9.0% 9.6% 10.2% 10.7% 11.2% 11.4% 1.3% 2.5% 6.1% 5.5% 9.2% 9.0% 11.0% 6.9% 11.0% 8.2%
EBIT margin 5.2% 8.2% 8.3% 9.0% 9.6% 10.1% 10.6% 10.9% 1.3% 2.6% 5.4% 5.0% 8.6% 8.2% 10.5% 6.1% 10.5% 7.6%
Recurring NPAT margin 5.5% 7.9% 7.9% 8.5% 9.0% 9.4% 9.8% 10.0% 1.1% 2.1% 7.2% 6.1% 8.2% 7.1% 9.1% 6.6% 9.9% 7.2%
SG&A/Sales -22.9% -24.1% -27.5% -29.0% -29.1% -29.0% -29.1% -29.1% -1.6% -1.7% -24.8% -21.0% -24.4% -23.7% -24.4% -30.5% -28.1% -30.0%
Effective Tax Rate 5% -13% -16% -15% -15% -15% -15% -15% ` 17% -7% -14% -11% -16% -15% -15% -15%
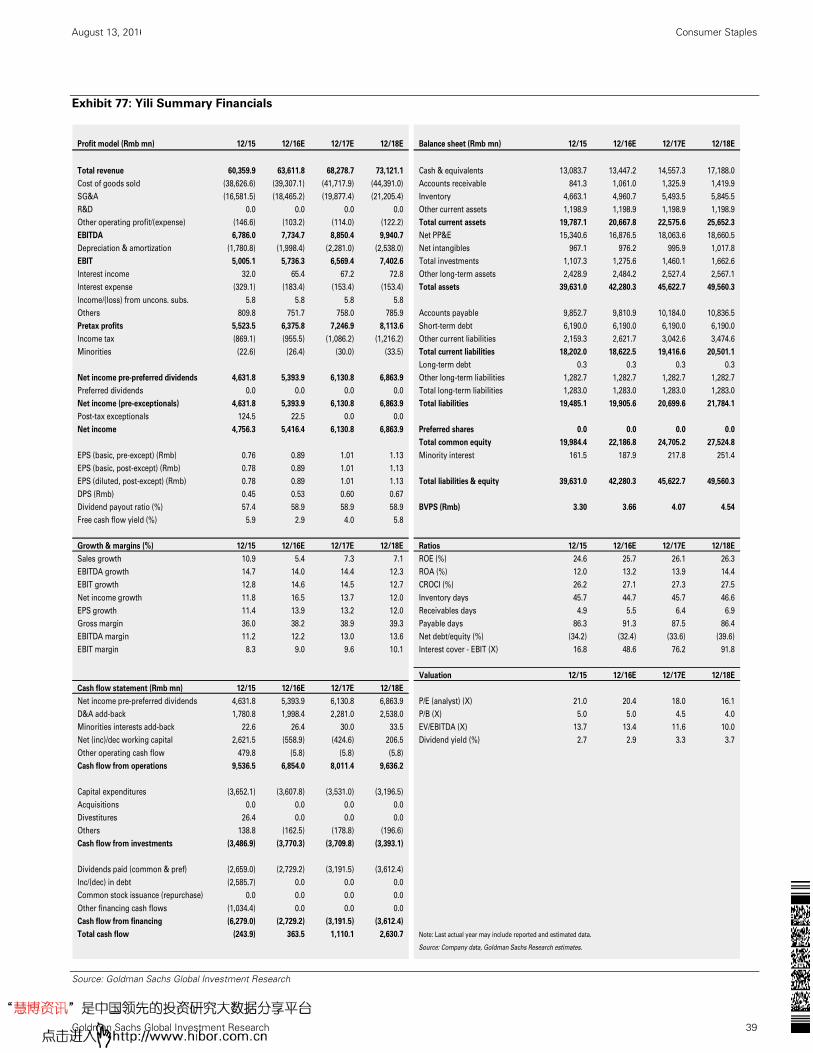
August 13, 2016 China: Consumer Staples
Goldman Sachs Global Investment Research 39
Exhibit 77: Yili Summary Financials
Source: Goldman Sachs Global Investment Research
Profit model (Rmb mn) 12/15 12/16E 12/17E 12/18E Balance sheet (Rmb mn) 12/15 12/16E 12/17E 12/18E
Total revenue 60,359.9 63,611.8 68,278.7 73,121.1 Cash & equivalents 13,083.7 13,447.2 14,557.3 17,188.0
Cost of goods sold (38,626.6) (39,307.1) (41,717.9) (44,391.0) Accounts receivable 841.3 1,061.0 1,325.9 1,419.9
SG&A (16,581.5) (18,465.2) (19,877.4) (21,205.4) Inventory 4,663.1 4,960.7 5,493.5 5,845.5
R&D 0.0 0.0 0.0 0.0 Other current assets 1,198.9 1,198.9 1,198.9 1,198.9
Other operating profit/(expense) (146.6) (103.2) (114.0) (122.2) Total current assets 19,787.1 20,667.8 22,575.6 25,652.3
EBITDA 6,786.0 7,734.7 8,850.4 9,940.7 Net PP&E 15,340.6 16,876.5 18,063.6 18,660.5
Depreciation & amortization (1,780.8) (1,998.4) (2,281.0) (2,538.0) Net intangibles 967.1 976.2 995.9 1,017.8
EBIT 5,005.1 5,736.3 6,569.4 7,402.6 Total investments 1,107.3 1,275.6 1,460.1 1,662.6
Interest income 32.0 65.4 67.2 72.8 Other long-term assets 2,428.9 2,484.2 2,527.4 2,567.1
Interest expense (329.1) (183.4) (153.4) (153.4) Total assets 39,631.0 42,280.3 45,622.7 49,560.3
Income/(loss) from uncons. subs. 5.8 5.8 5.8 5.8
Others 809.8 751.7 758.0 785.9 Accounts payable 9,852.7 9,810.9 10,184.0 10,836.5
Pretax profits 5,523.5 6,375.8 7,246.9 8,113.6 Short-term debt 6,190.0 6,190.0 6,190.0 6,190.0
Income tax (869.1) (955.5) (1,086.2) (1,216.2) Other current liabilities 2,159.3 2,621.7 3,042.6 3,474.6
Minorities (22.6) (26.4) (30.0) (33.5) Total current liabilities 18,202.0 18,622.5 19,416.6 20,501.1
Long-term debt 0.3 0.3 0.3 0.3
Net income pre-preferred dividends 4,631.8 5,393.9 6,130.8 6,863.9 Other long-term liabilities 1,282.7 1,282.7 1,282.7 1,282.7
Preferred dividends 0.0 0.0 0.0 0.0 Total long-term liabilities 1,283.0 1,283.0 1,283.0 1,283.0
Net income (pre-exceptionals) 4,631.8 5,393.9 6,130.8 6,863.9 Total liabilities 19,485.1 19,905.6 20,699.6 21,784.1
Post-tax exceptionals 124.5 22.5 0.0 0.0
Net income 4,756.3 5,416.4 6,130.8 6,863.9 Preferred shares 0.0 0.0 0.0 0.0
Total common equity 19,984.4 22,186.8 24,705.2 27,524.8
EPS (basic, pre-except) (Rmb) 0.76 0.89 1.01 1.13 Minority interest 161.5 187.9 217.8 251.4
EPS (basic, post-except) (Rmb) 0.78 0.89 1.01 1.13
EPS (diluted, post-except) (Rmb) 0.78 0.89 1.01 1.13 Total liabilities & equity 39,631.0 42,280.3 45,622.7 49,560.3
DPS (Rmb) 0.45 0.53 0.60 0.67
Dividend payout ratio (%) 57.4 58.9 58.9 58.9 BVPS (Rmb) 3.30 3.66 4.07 4.54
Free cash flow yield (%) 5.9 2.9 4.0 5.8
Growth & margins (%) 12/15 12/16E 12/17E 12/18E Ratios 12/15 12/16E 12/17E 12/18E
Sales growth 10.9 5.4 7.3 7.1 ROE (%) 24.6 25.7 26.1 26.3
EBITDA growth 14.7 14.0 14.4 12.3 ROA (%) 12.0 13.2 13.9 14.4
EBIT growth 12.8 14.6 14.5 12.7 CROCI (%) 26.2 27.1 27.3 27.5
Net income growth 11.8 16.5 13.7 12.0 Inventory days 45.7 44.7 45.7 46.6
EPS growth 11.4 13.9 13.2 12.0 Receivables days 4.9 5.5 6.4 6.9
Gross margin 36.0 38.2 38.9 39.3 Payable days 86.3 91.3 87.5 86.4
EBITDA margin 11.2 12.2 13.0 13.6 Net debt/equity (%) (34.2) (32.4) (33.6) (39.6)
EBIT margin 8.3 9.0 9.6 10.1 Interest cover - EBIT (X) 16.8 48.6 76.2 91.8
Valuation 12/15 12/16E 12/17E 12/18E
Cash flow statement (Rmb mn) 12/15 12/16E 12/17E 12/18E
Net income pre-preferred dividends 4,631.8 5,393.9 6,130.8 6,863.9 P/E (analyst) (X) 21.0 20.4 18.0 16.1
D&A add-back 1,780.8 1,998.4 2,281.0 2,538.0 P/B (X) 5.0 5.0 4.5 4.0
Minorities interests add-back 22.6 26.4 30.0 33.5 EV/EBITDA (X) 13.7 13.4 11.6 10.0
Net (inc)/dec working capital 2,621.5 (558.9) (424.6) 206.5 Dividend yield (%) 2.7 2.9 3.3 3.7
Other operating cash flow 479.8 (5.8) (5.8) (5.8)
Cash flow from operations 9,536.5 6,854.0 8,011.4 9,636.2
Capital expenditures (3,652.1) (3,607.8) (3,531.0) (3,196.5)
Acquisitions 0.0 0.0 0.0 0.0
Divestitures 26.4 0.0 0.0 0.0
Others 138.8 (162.5) (178.8) (196.6)
Cash flow from investments (3,486.9) (3,770.3) (3,709.8) (3,393.1)
Dividends paid (common & pref) (2,659.0) (2,729.2) (3,191.5) (3,612.4)
Inc/(dec) in debt (2,585.7) 0.0 0.0 0.0
Common stock issuance (repurchase) 0.0 0.0 0.0 0.0
Other financing cash flows (1,034.4) 0.0 0.0 0.0
Cash flow from financing (6,279.0) (2,729.2) (3,191.5) (3,612.4)
Total cash flow (243.9) 363.5 1,110.1 2,630.7 Note: Last actual year may include reported and estimated data.
Source: Company data, Goldman Sachs Research estimates.
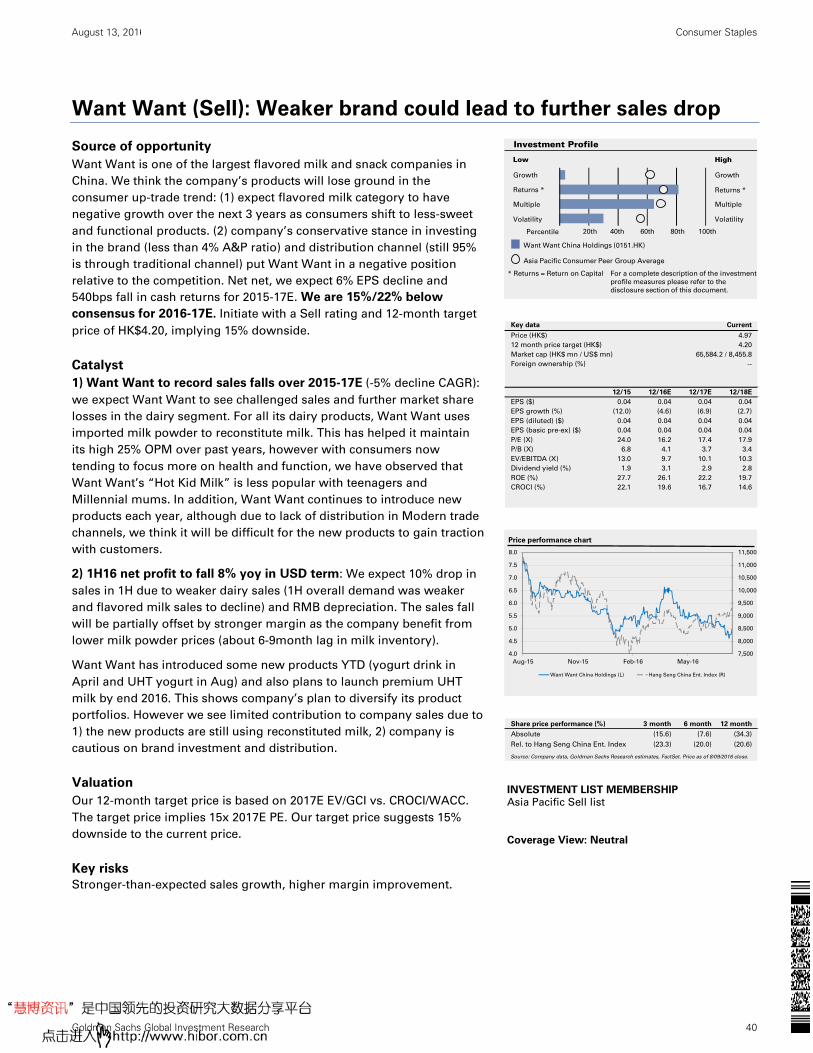
August 13, 2016 China: Consumer Staples
Goldman Sachs Global Investment Research 40
Want Want (Sell): Weaker brand could lead to further sales drop
Source of opportunity
Want Want is one of the largest flavored milk and snack companies in
China. We think the company’s products will lose ground in the
consumer up-trade trend: (1) expect flavored milk category to have
negative growth over the next 3 years as consumers shift to less-sweet
and functional products. (2) company’s conservative stance in investing
in the brand (less than 4% A&P ratio) and distribution channel (still 95%
is through traditional channel) put Want Want in a negative position
relative to the competition. Net net, we expect 6% EPS decline and
540bps fall in cash returns for 2015-17E. We are 15%/22% below
consensus for 2016-17E. Initiate with a Sell rating and 12-month target
price of HK$4.20, implying 15% downside.
Catalyst
1) Want Want to record sales falls over 2015-17E (-5% decline CAGR):
we expect Want Want to see challenged sales and further market share
losses in the dairy segment. For all its dairy products, Want Want uses
imported milk powder to reconstitute milk. This has helped it maintain
its high 25% OPM over past years, however with consumers now
tending to focus more on health and function, we have observed that
Want Want’s “Hot Kid Milk” is less popular with teenagers and
Millennial mums. In addition, Want Want continues to introduce new
products each year, although due to lack of distribution in Modern trade
channels, we think it will be difficult for the new products to gain traction
with customers.
2) 1H16 net profit to fall 8% yoy in USD term: We expect 10% drop in
sales in 1H due to weaker dairy sales (1H overall demand was weaker
and flavored milk sales to decline) and RMB depreciation. The sales fall
will be partially offset by stronger margin as the company benefit from
lower milk powder prices (about 6-9month lag in milk inventory).
Want Want has introduced some new products YTD (yogurt drink in
April and UHT yogurt in Aug) and also plans to launch premium UHT
milk by end 2016. This shows company’s plan to diversify its product
portfolios. However we see limited contribution to company sales due to
1) the new products are still using reconstituted milk, 2) company is
cautious on brand investment and distribution.
Valuation
Our 12-month target price is based on 2017E EV/GCI vs. CROCI/WACC.
The target price implies 15x 2017E PE. Our target price suggests 15%
downside to the current price.
Key risks
Stronger-than-expected sales growth, higher margin improvement.
Growth
Returns *
Multiple
Volatility Volatility
Multiple
Returns *
Growth
Investment Profile
Low High
Percentile 20th 40th 60th 80th 100th
* Returns = Return on Capital For a complete description of the investment
profile measures please refer to the
disclosure section of this document.
Want Want China Holdings (0151.HK)
Asia Pacific Consumer Peer Group Average
Key data Current
Price (HK$) 4.97
12 month price target (HK$) 4.20
Market cap (HK$ mn / US$ mn) 65,584.2 / 8,455.8
Foreign ownership (%) --
12/15 12/16E 12/17E 12/18E
EPS ($) 0.04 0.04 0.04 0.04
EPS growth (%) (12.0) (4.6) (6.9) (2.7)
EPS (diluted) ($) 0.04 0.04 0.04 0.04
EPS (basic pre-ex) ($) 0.04 0.04 0.04 0.04
P/E (X) 24.0 16.2 17.4 17.9
P/B (X) 6.8 4.1 3.7 3.4
EV/EBITDA (X) 13.0 9.7 10.1 10.3
Dividend yield (%) 1.9 3.1 2.9 2.8
ROE (%) 27.7 26.1 22.2 19.7
CROCI (%) 22.1 19.6 16.7 14.6
7,500
8,000
8,500
9,000
9,500
10,000
10,500
11,000
11,500
4.0
4.5
5.0
5.5
6.0
6.5
7.0
7.5
8.0
Aug-15 Nov-15 Feb-16 May-16
Price performance chart
Want Want China Holdings (L) Hang Seng China Ent. Index (R)
Share price performance (%) 3 month 6 month 12 month
Absolute (15.6) (7.6) (34.3)
Rel. to Hang Seng China Ent. Index (23.3) (20.0) (20.6)
Source: Company data, Goldman Sachs Research estimates, FactSet. Price as of 8/09/2016 close.
INVESTMENT LIST MEMBERSHIP
Asia Pacific Sell list
Coverage View: Neutral
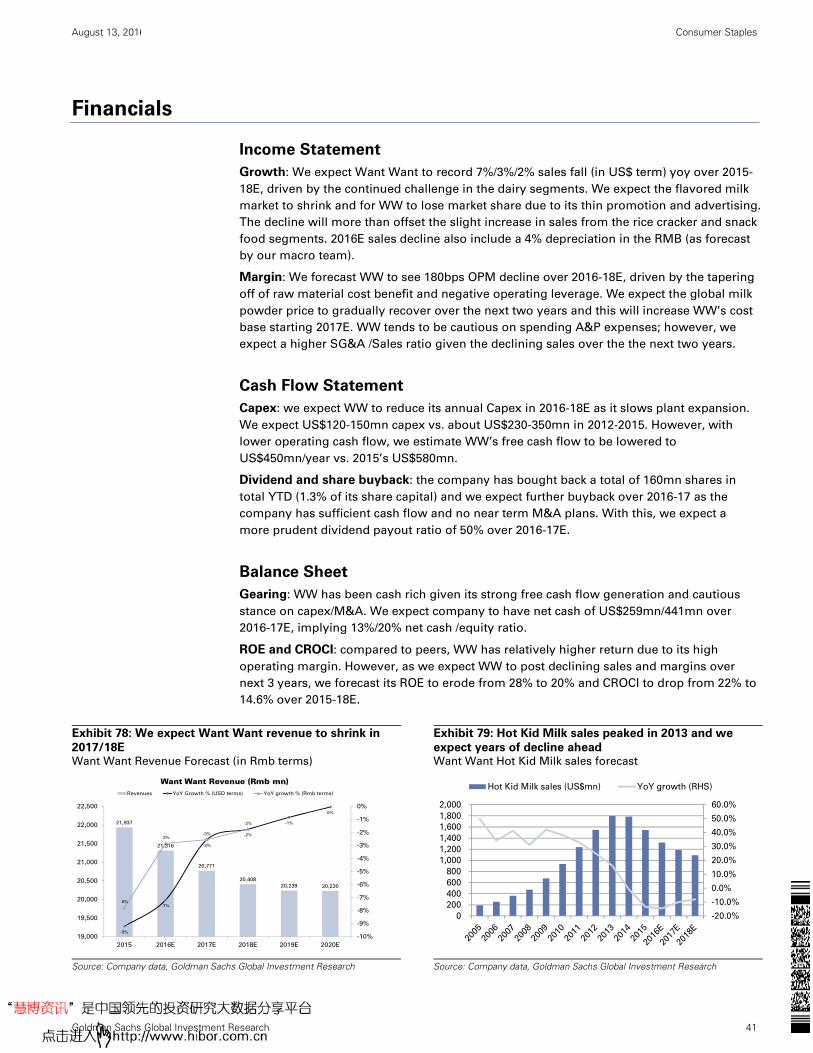
August 13, 2016 China: Consumer Staples
Goldman Sachs Global Investment Research 41
Financials
Income Statement
Growth: We expect Want Want to record 7%/3%/2% sales fall (in US$ term) yoy over 2015-
18E, driven by the continued challenge in the dairy segments. We expect the flavored milk
market to shrink and for WW to lose market share due to its thin promotion and advertising.
The decline will more than offset the slight increase in sales from the rice cracker and snack
food segments. 2016E sales decline also include a 4% depreciation in the RMB (as forecast
by our macro team).
Margin: We forecast WW to see 180bps OPM decline over 2016-18E, driven by the tapering
off of raw material cost benefit and negative operating leverage. We expect the global milk
powder price to gradually recover over the next two years and this will increase WW’s cost
base starting 2017E. WW tends to be cautious on spending A&P expenses; however, we
expect a higher SG&A /Sales ratio given the declining sales over the the next two years.
Cash Flow Statement
Capex: we expect WW to reduce its annual Capex in 2016-18E as it slows plant expansion.
We expect US$120-150mn capex vs. about US$230-350mn in 2012-2015. However, with
lower operating cash flow, we estimate WW’s free cash flow to be lowered to
US$450mn/year vs. 2015’s US$580mn.
Dividend and share buyback: the company has bought back a total of 160mn shares in
total YTD (1.3% of its share capital) and we expect further buyback over 2016-17 as the
company has sufficient cash flow and no near term M&A plans. With this, we expect a
more prudent dividend payout ratio of 50% over 2016-17E.
Balance Sheet
Gearing: WW has been cash rich given its strong free cash flow generation and cautious
stance on capex/M&A. We expect company to have net cash of US$259mn/441mn over
2016-17E, implying 13%/20% net cash /equity ratio.
ROE and CROCI: compared to peers, WW has relatively higher return due to its high
operating margin. However, as we expect WW to post declining sales and margins over
next 3 years, we forecast its ROE to erode from 28% to 20% and CROCI to drop from 22% to
14.6% over 2015-18E.
Exhibit 78: We expect Want Want revenue to shrink in
2017/18E Want Want Revenue Forecast (in Rmb terms)
Exhibit 79: Hot Kid Milk sales peaked in 2013 and we
expect years of decline ahead Want Want Hot Kid Milk sales forecast
Source: Company data, Goldman Sachs Global Investment Research Source: Company data, Goldman Sachs Global Investment Research
21,937
21,316
20,771
20,408
20,239 20,230
-9%
-7%
-3%
-2%
-1%
0%
-8%
-3%-3%
-2%
-10%
-9%
-8%
-7%
-6%
-5%
-4%
-3%
-2%
-1%
0%
19,000
19,500
20,000
20,500
21,000
21,500
22,000
22,500
2015 2016E 2017E 2018E 2019E 2020E
Want Want Revenue (Rmb mn)Revenues YoY Growth % (USD terms) YoY growth % (Rmb terms)
-20.0%
-10.0%
0.0%
10.0%
20.0%
30.0%
40.0%
50.0%
60.0%
0
200
400
600
800
1,000
1,200
1,400
1,600
1,800
2,000
Hot Kid Milk sales (US$mn) YoY growth (RHS)
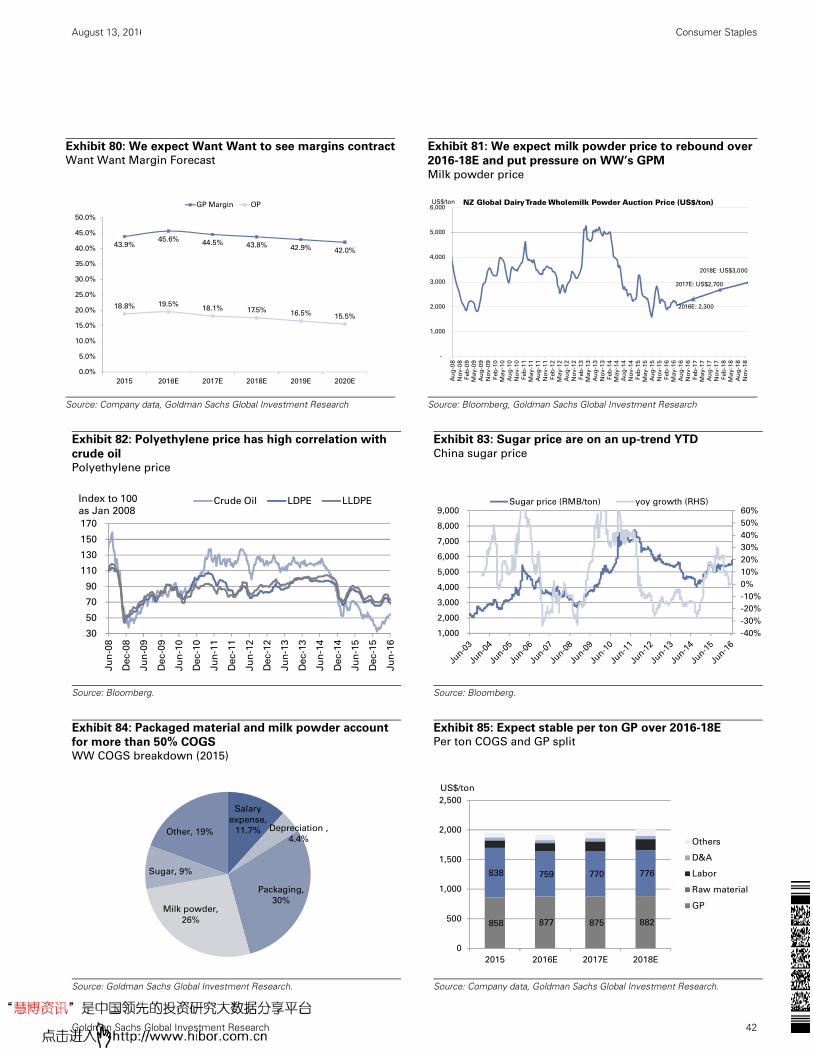
August 13, 2016 China: Consumer Staples
Goldman Sachs Global Investment Research 42
Exhibit 82: Polyethylene price has high correlation with
crude oil Polyethylene price
Exhibit 83: Sugar price are on an up-trend YTD
China sugar price
Source: Bloomberg.
Source: Bloomberg.
Exhibit 84: Packaged material and milk powder account
for more than 50% COGS WW COGS breakdown (2015)
Exhibit 85: Expect stable per ton GP over 2016-18E Per ton COGS and GP split
Source: Goldman Sachs Global Investment Research.
Source: Company data, Goldman Sachs Global Investment Research.
30
50
70
90
110
130
150
170
Ju
n-0
8
Dec-0
8
Ju
n-0
9
Dec-0
9
Ju
n-1
0
Dec-1
0
Ju
n-1
1
Dec-1
1
Ju
n-1
2
Dec-1
2
Ju
n-1
3
Dec-1
3
Ju
n-1
4
Dec-1
4
Ju
n-1
5
Dec-1
5
Ju
n-1
6
Crude Oil LDPE LLDPEIndex to 100
as Jan 2008
-40%
-30%
-20%
-10%
0%
10%
20%
30%
40%
50%
60%
1,000
2,000
3,000
4,000
5,000
6,000
7,000
8,000
9,000Sugar price (RMB/ton) yoy growth (RHS)
Salary
expense,
11.7% Depreciation ,
4.4%
Packaging,
30%Milk powder,
26%
Sugar, 9%
Other, 19%
858 877 875 882
838 759 770 776
0
500
1,000
1,500
2,000
2,500
2015 2016E 2017E 2018E
Others
D&A
Labor
Raw material
GP
US$/ton
Exhibit 80: We expect Want Want to see margins contractWant Want Margin Forecast
Exhibit 81: We expect milk powder price to rebound over
2016-18E and put pressure on WW’s GPM
Milk powder price
Source: Company data, Goldman Sachs Global Investment Research
Source: Bloomberg, Goldman Sachs Global Investment Research
43.9%45.6% 44.5% 43.8% 42.9% 42.0%
18.8% 19.5%18.1% 17.5% 16.5% 15.5%
0.0%
5.0%
10.0%
15.0%
20.0%
25.0%
30.0%
35.0%
40.0%
45.0%
50.0%
2015 2016E 2017E 2018E 2019E 2020E
GP Margin OP
2016E: 2,300
2017E: US$2,700
2018E :US$3,000
-
1,000
2,000
3,000
4,000
5,000
6,000
Au
g-0
8
No
v-0
8
Feb
-09
May
-09
Au
g-0
9
No
v-0
9
Feb
-10
May
-10
Au
g-1
0
No
v-1
0
Feb
-11
May
-11
Au
g-1
1
No
v-1
1
Feb
-12
May
-12
Au
g-1
2
No
v-1
2
Feb
-13
May
-13
Au
g-1
3
No
v-1
3
Feb
-14
May
-14
Au
g-1
4
No
v-1
4
Feb
-15
May
-15
Au
g-1
5
No
v-1
5
Feb
-16
May
-16
Au
g-1
6
No
v-1
6
Feb
-17
May
-17
Au
g-1
7
No
v-1
7
Feb
-18
May
-18
Au
g-1
8
No
v-1
8
NZ Global Dairy Trade Wholemilk Powder Auction Price (US$/ton)US$/ton
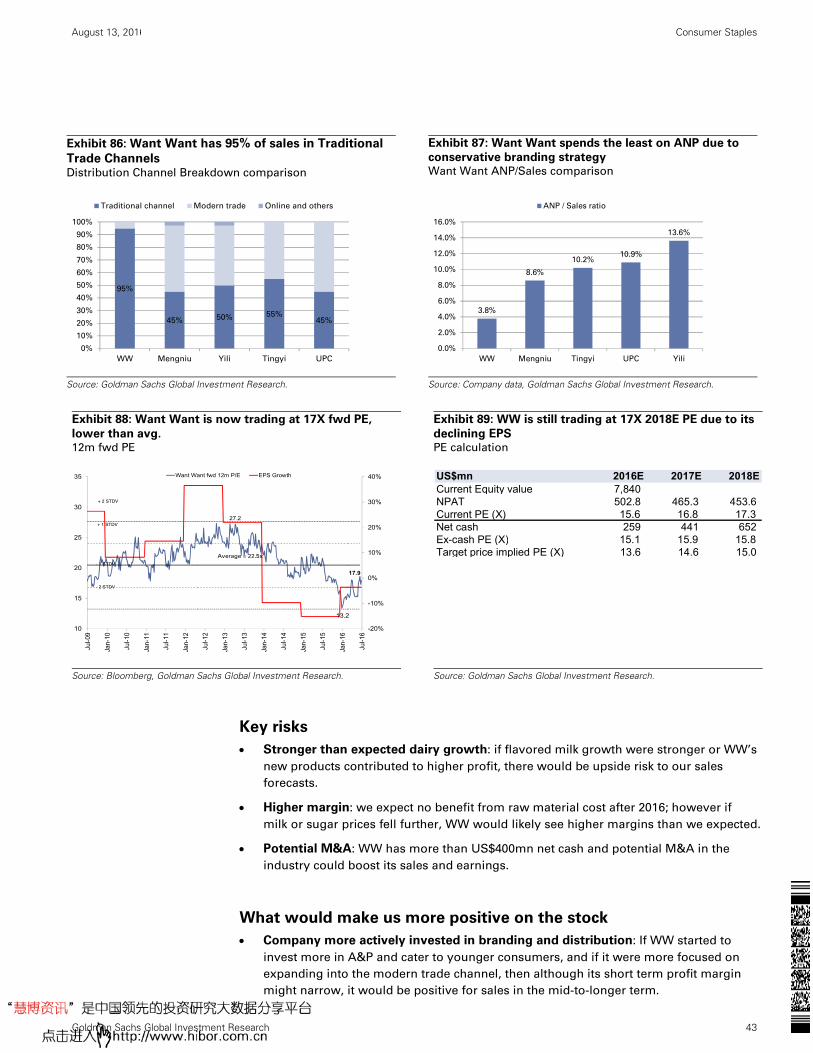
August 13, 2016 China: Consumer Staples
Goldman Sachs Global Investment Research 43
Exhibit 88: Want Want is now trading at 17X fwd PE,
lower than avg. 12m fwd PE
Exhibit 89: WW is still trading at 17X 2018E PE due to its
declining EPS PE calculation
Source: Bloomberg, Goldman Sachs Global Investment Research.
Source: Goldman Sachs Global Investment Research.
Key risks
Stronger than expected dairy growth: if flavored milk growth were stronger or WW’s
new products contributed to higher profit, there would be upside risk to our sales
forecasts.
Higher margin: we expect no benefit from raw material cost after 2016; however if
milk or sugar prices fell further, WW would likely see higher margins than we expected.
Potential M&A: WW has more than US$400mn net cash and potential M&A in the
industry could boost its sales and earnings.
What would make us more positive on the stock
Company more actively invested in branding and distribution: If WW started to
invest more in A&P and cater to younger consumers, and if it were more focused on
expanding into the modern trade channel, then although its short term profit margin
might narrow, it would be positive for sales in the mid-to-longer term.
27.2
17.9
13.2
-20%
-10%
0%
10%
20%
30%
40%
10
15
20
25
30
35
Jul-0
9
Jan-
10
Jul-1
0
Jan-
11
Jul-1
1
Jan-
12
Jul-1
2
Jan-
13
Jul-1
3
Jan-
14
Jul-1
4
Jan-
15
Jul-1
5
Jan-
16
Jul-1
6
Want Want fwd 12m P/E EPS Growth
+ 1 STDV
+ 2 STDV
- 1 STDV
- 2 STDV
Average = 22.5x
US$mn 2016E 2017E 2018ECurrent Equity value 7,840 NPAT 502.8 465.3 453.6 Current PE (X) 15.6 16.8 17.3 Net cash 259 441 652 Ex-cash PE (X) 15.1 15.9 15.8 Target price implied PE (X) 13.6 14.6 15.0
Exhibit 86: Want Want has 95% of sales in Traditional
Trade Channels Distribution Channel Breakdown comparison
Exhibit 87: Want Want spends the least on ANP due to
conservative branding strategy
Want Want ANP/Sales comparison
Source: Goldman Sachs Global Investment Research.
Source: Company data, Goldman Sachs Global Investment Research.
95%
45% 50% 55%45%
0%
10%
20%
30%
40%
50%
60%
70%
80%
90%
100%
WW Mengniu Yili Tingyi UPC
Traditional channel Modern trade Online and others
3.8%
8.6%
10.2%10.9%
13.6%
0.0%
2.0%
4.0%
6.0%
8.0%
10.0%
12.0%
14.0%
16.0%
WW Mengniu Tingyi UPC Yili
ANP / Sales ratio
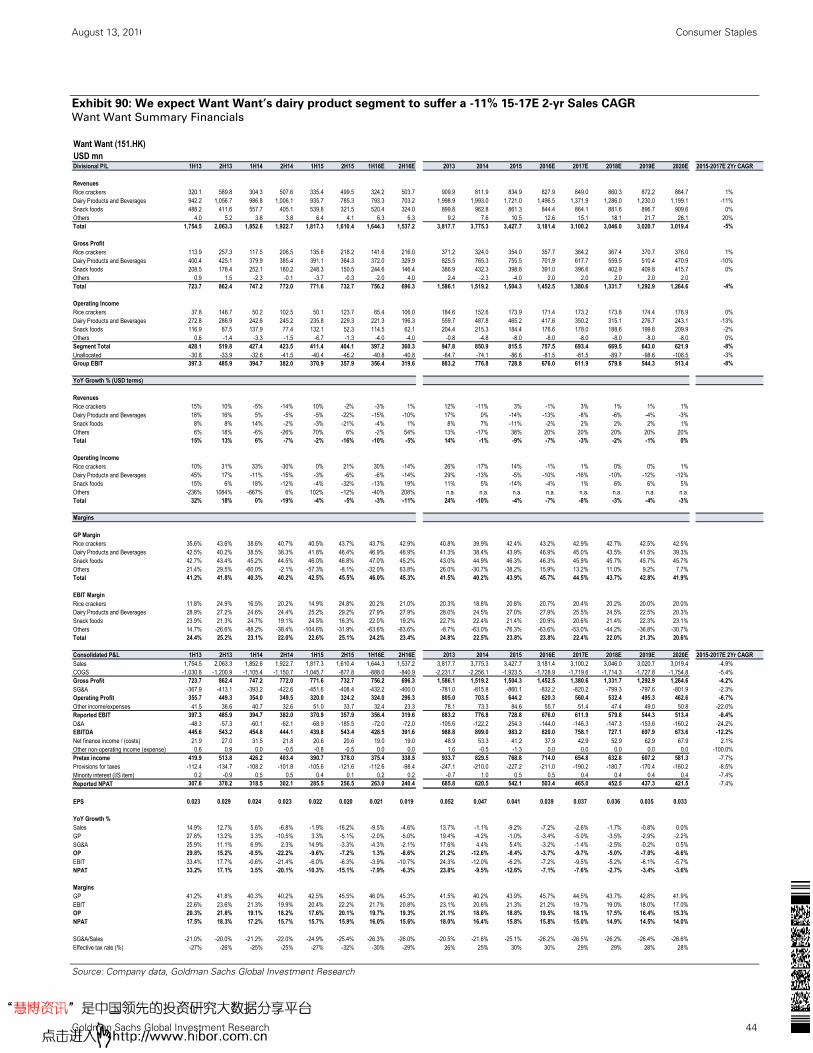
August 13, 2016 China: Consumer Staples
Goldman Sachs Global Investment Research 44
Exhibit 90: We expect Want Want’s dairy product segment to suffer a -11% 15-17E 2-yr Sales CAGR Want Want Summary Financials
Source: Company data, Goldman Sachs Global Investment Research
Want Want (151.HK)USD mnDivisional P/L 1H13 2H13 1H14 2H14 1H15 2H15 1H16E 2H16E 2013 2014 2015 2016E 2017E 2018E 2019E 2020E 2015-2017E 2Yr CAGR
RevenuesRice crackers 320.1 589.8 304.3 507.6 335.4 499.5 324.2 503.7 909.9 811.9 834.9 827.9 849.0 860.3 872.2 884.7 1%Dairy Products and Beverages 942.2 1,056.7 986.8 1,006.1 935.7 785.3 793.3 703.2 1,998.9 1,993.0 1,721.0 1,496.5 1,371.9 1,286.0 1,230.0 1,199.1 -11%Snack foods 488.2 411.6 557.7 405.1 539.8 321.5 520.4 324.0 899.8 962.8 861.3 844.4 864.1 881.6 896.7 909.6 0%Others 4.0 5.2 3.8 3.8 6.4 4.1 6.3 6.3 9.2 7.6 10.5 12.6 15.1 18.1 21.7 26.1 20%Total 1,754.5 2,063.3 1,852.6 1,922.7 1,817.3 1,610.4 1,644.3 1,537.2 3,817.7 3,775.3 3,427.7 3,181.4 3,100.2 3,046.0 3,020.7 3,019.4 -5%
Gross ProfitRice crackers 113.9 257.3 117.5 206.5 135.8 218.2 141.6 216.0 371.2 324.0 354.0 357.7 364.2 367.4 370.7 376.0 1%Dairy Products and Beverages 400.4 425.1 379.9 385.4 391.1 364.3 372.0 329.9 825.5 765.3 755.5 701.9 617.7 559.5 510.4 470.9 -10%Snack foods 208.5 178.4 252.1 180.2 248.3 150.5 244.6 146.4 386.9 432.3 398.8 391.0 396.6 402.9 409.8 415.7 0%Others 0.9 1.5 -2.3 -0.1 -3.7 -0.3 -2.0 4.0 2.4 -2.3 -4.0 2.0 2.0 2.0 2.0 2.0Total 723.7 862.4 747.2 772.0 771.6 732.7 756.2 696.3 1,586.1 1,519.2 1,504.3 1,452.5 1,380.6 1,331.7 1,292.9 1,264.6 -4%
Operating IncomeRice crackers 37.8 146.7 50.2 102.5 50.1 123.7 65.4 106.0 184.6 152.6 173.9 171.4 173.2 173.8 174.4 176.9 0%Dairy Products and Beverages 272.8 286.9 242.6 245.2 235.8 229.3 221.3 196.3 559.7 487.8 465.2 417.6 350.2 315.1 276.7 243.1 -13%Snack foods 116.9 87.5 137.9 77.4 132.1 52.3 114.5 62.1 204.4 215.3 184.4 176.6 178.0 188.6 199.8 209.9 -2%Others 0.6 -1.4 -3.3 -1.5 -6.7 -1.3 -4.0 -4.0 -0.8 -4.8 -8.0 -8.0 -8.0 -8.0 -8.0 -8.0 0%Segment Total 428.1 519.8 427.4 423.5 411.4 404.1 397.2 360.3 947.8 850.9 815.5 757.5 693.4 669.5 643.0 621.9 -8%Unallocated -30.8 -33.9 -32.6 -41.5 -40.4 -46.2 -40.8 -40.8 -64.7 -74.1 -86.6 -81.5 -81.5 -89.7 -98.6 -108.5 -3%Group EBIT 397.3 485.9 394.7 382.0 370.9 357.9 356.4 319.6 883.2 776.8 728.8 676.0 611.9 579.8 544.3 513.4 -8%
YoY Growth % (USD terms)
RevenuesRice crackers 15% 10% -5% -14% 10% -2% -3% 1% 12% -11% 3% -1% 3% 1% 1% 1%Dairy Products and Beverages 18% 16% 5% -5% -5% -22% -15% -10% 17% 0% -14% -13% -8% -6% -4% -3%Snack foods 8% 8% 14% -2% -3% -21% -4% 1% 8% 7% -11% -2% 2% 2% 2% 1%Others 6% 18% -6% -26% 70% 6% -2% 54% 13% -17% 38% 20% 20% 20% 20% 20%Total 15% 13% 6% -7% -2% -16% -10% -5% 14% -1% -9% -7% -3% -2% -1% 0%
Operating IncomeRice crackers 10% 31% 33% -30% 0% 21% 30% -14% 26% -17% 14% -1% 1% 0% 0% 1%Dairy Products and Beverages 45% 17% -11% -15% -3% -6% -6% -14% 29% -13% -5% -10% -16% -10% -12% -12%Snack foods 15% 6% 18% -12% -4% -32% -13% 19% 11% 5% -14% -4% 1% 6% 6% 5%Others -236% 1084% -667% 6% 102% -12% -40% 208% n.a. n.a. n.a. n.a. n.a. n.a. n.a. n.a.Total 32% 18% 0% -19% -4% -5% -3% -11% 24% -10% -4% -7% -8% -3% -4% -3%
Margins
GP MarginRice crackers 35.6% 43.6% 38.6% 40.7% 40.5% 43.7% 43.7% 42.9% 40.8% 39.9% 42.4% 43.2% 42.9% 42.7% 42.5% 42.5%Dairy Products and Beverages 42.5% 40.2% 38.5% 38.3% 41.8% 46.4% 46.9% 46.9% 41.3% 38.4% 43.9% 46.9% 45.0% 43.5% 41.5% 39.3%Snack foods 42.7% 43.4% 45.2% 44.5% 46.0% 46.8% 47.0% 45.2% 43.0% 44.9% 46.3% 46.3% 45.9% 45.7% 45.7% 45.7%Others 21.4% 29.5% -60.0% -2.1% -57.3% -8.1% -32.0% 63.8% 26.0% -30.7% -38.2% 15.9% 13.2% 11.0% 9.2% 7.7%Total 41.2% 41.8% 40.3% 40.2% 42.5% 45.5% 46.0% 45.3% 41.5% 40.2% 43.9% 45.7% 44.5% 43.7% 42.8% 41.9%
EBIT MarginRice crackers 11.8% 24.9% 16.5% 20.2% 14.9% 24.8% 20.2% 21.0% 20.3% 18.8% 20.8% 20.7% 20.4% 20.2% 20.0% 20.0%Dairy Products and Beverages 28.9% 27.2% 24.6% 24.4% 25.2% 29.2% 27.9% 27.9% 28.0% 24.5% 27.0% 27.9% 25.5% 24.5% 22.5% 20.3%Snack foods 23.9% 21.3% 24.7% 19.1% 24.5% 16.3% 22.0% 19.2% 22.7% 22.4% 21.4% 20.9% 20.6% 21.4% 22.3% 23.1%Others 14.7% -26.6% -88.2% -38.4% -104.6% -31.9% -63.6% -63.6% -8.7% -63.0% -76.3% -63.6% -53.0% -44.2% -36.8% -30.7%Total 24.4% 25.2% 23.1% 22.0% 22.6% 25.1% 24.2% 23.4% 24.8% 22.5% 23.8% 23.8% 22.4% 22.0% 21.3% 20.6%
Consolidated P&L 1H13 2H13 1H14 2H14 1H15 2H15 1H16E 2H16E 2013 2014 2015 2016E 2017E 2018E 2019E 2020E 2015-2017E 2Yr CAGRSales 1,754.5 2,063.3 1,852.6 1,922.7 1,817.3 1,610.4 1,644.3 1,537.2 3,817.7 3,775.3 3,427.7 3,181.4 3,100.2 3,046.0 3,020.7 3,019.4 -4.9%COGS -1,030.8 -1,200.9 -1,105.4 -1,150.7 -1,045.7 -877.8 -888.0 -840.9 -2,231.7 -2,256.1 -1,923.5 -1,728.9 -1,719.6 -1,714.3 -1,727.8 -1,754.8 -5.4%Gross Profit 723.7 862.4 747.2 772.0 771.6 732.7 756.2 696.3 1,586.1 1,519.2 1,504.3 1,452.5 1,380.6 1,331.7 1,292.9 1,264.6 -4.2%SG&A -367.9 -413.1 -393.2 -422.6 -451.6 -408.4 -432.2 -400.0 -781.0 -815.8 -860.1 -832.2 -820.2 -799.3 -797.6 -801.9 -2.3%Operating Profit 355.7 449.3 354.0 349.5 320.0 324.2 324.0 296.3 805.0 703.5 644.2 620.3 560.4 532.4 495.3 462.6 -6.7%Other income/expenses 41.5 36.6 40.7 32.6 51.0 33.7 32.4 23.3 78.1 73.3 84.6 55.7 51.4 47.4 49.0 50.8 -22.0%Reported EBIT 397.3 485.9 394.7 382.0 370.9 357.9 356.4 319.6 883.2 776.8 728.8 676.0 611.9 579.8 544.3 513.4 -8.4%D&A -48.3 -57.3 -60.1 -62.1 -68.9 -185.5 -72.0 -72.0 -105.6 -122.2 -254.3 -144.0 -146.3 -147.3 -153.6 -160.2 -24.2%EBITDA 445.6 543.2 454.8 444.1 439.8 543.4 428.5 391.6 988.8 899.0 983.2 820.0 758.1 727.1 697.9 673.6 -12.2%Net finance income / (costs) 21.9 27.0 31.5 21.8 20.6 20.6 19.0 19.0 48.9 53.3 41.2 37.9 42.9 52.9 62.9 67.9 2.1%Other non-operating income (expense) 0.6 0.9 0.0 -0.5 -0.8 -0.5 0.0 0.0 1.6 -0.5 -1.3 0.0 0.0 0.0 0.0 0.0 -100.0%Pretax income 419.9 513.8 426.2 403.4 390.7 378.0 375.4 338.5 933.7 829.5 768.8 714.0 654.8 632.8 607.2 581.3 -7.7%Provisions for taxes -112.4 -134.7 -108.2 -101.8 -105.6 -121.6 -112.6 -98.4 -247.1 -210.0 -227.2 -211.0 -190.2 -180.7 -170.4 -160.2 -8.5%Minority interest (I/S item) 0.2 -0.9 0.5 0.5 0.4 0.1 0.2 0.2 -0.7 1.0 0.5 0.5 0.4 0.4 0.4 0.4 -7.4%Reported NPAT 307.6 378.2 318.5 302.1 285.5 256.5 263.0 240.4 685.8 620.5 542.1 503.4 465.0 452.5 437.3 421.5 -7.4%
EPS 0.023 0.029 0.024 0.023 0.022 0.020 0.021 0.019 0.052 0.047 0.041 0.039 0.037 0.036 0.035 0.033
YoY Growth %Sales 14.9% 12.7% 5.6% -6.8% -1.9% -16.2% -9.5% -4.6% 13.7% -1.1% -9.2% -7.2% -2.6% -1.7% -0.8% 0.0%GP 27.8% 13.2% 3.3% -10.5% 3.3% -5.1% -2.0% -5.0% 19.4% -4.2% -1.0% -3.4% -5.0% -3.5% -2.9% -2.2%SG&A 25.9% 11.1% 6.9% 2.3% 14.9% -3.3% -4.3% -2.1% 17.6% 4.4% 5.4% -3.2% -1.4% -2.5% -0.2% 0.5%OP 29.8% 15.2% -0.5% -22.2% -9.6% -7.2% 1.3% -8.6% 21.2% -12.6% -8.4% -3.7% -9.7% -5.0% -7.0% -6.6%EBIT 33.4% 17.7% -0.6% -21.4% -6.0% -6.3% -3.9% -10.7% 24.3% -12.0% -6.2% -7.2% -9.5% -5.2% -6.1% -5.7%NPAT 33.2% 17.1% 3.5% -20.1% -10.3% -15.1% -7.9% -6.3% 23.8% -9.5% -12.6% -7.1% -7.6% -2.7% -3.4% -3.6%
MarginsGP 41.2% 41.8% 40.3% 40.2% 42.5% 45.5% 46.0% 45.3% 41.5% 40.2% 43.9% 45.7% 44.5% 43.7% 42.8% 41.9%EBIT 22.6% 23.6% 21.3% 19.9% 20.4% 22.2% 21.7% 20.8% 23.1% 20.6% 21.3% 21.2% 19.7% 19.0% 18.0% 17.0%OP 20.3% 21.8% 19.1% 18.2% 17.6% 20.1% 19.7% 19.3% 21.1% 18.6% 18.8% 19.5% 18.1% 17.5% 16.4% 15.3%NPAT 17.5% 18.3% 17.2% 15.7% 15.7% 15.9% 16.0% 15.6% 18.0% 16.4% 15.8% 15.8% 15.0% 14.9% 14.5% 14.0%
SG&A/Sales -21.0% -20.0% -21.2% -22.0% -24.9% -25.4% -26.3% -26.0% -20.5% -21.6% -25.1% -26.2% -26.5% -26.2% -26.4% -26.6%Effective tax rate (%) -27% -26% -25% -25% -27% -32% -30% -29% 26% 25% 30% 30% 29% 29% 28% 28%
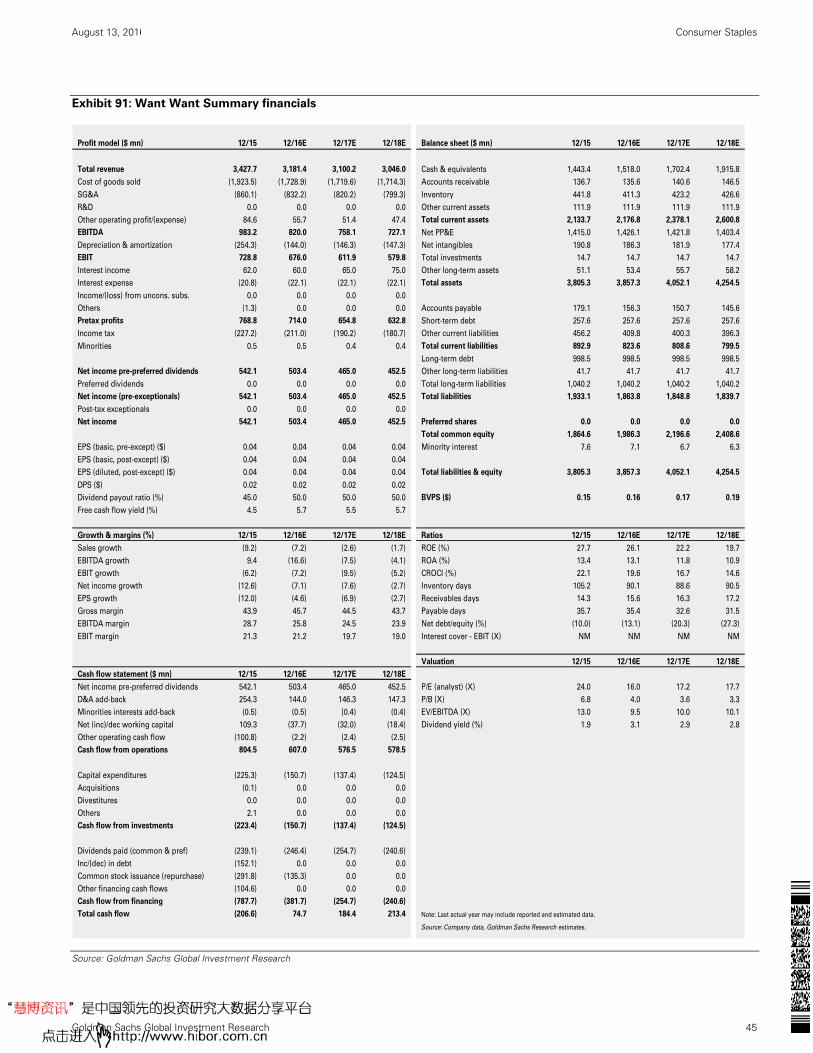
August 13, 2016 China: Consumer Staples
Goldman Sachs Global Investment Research 45
Exhibit 91: Want Want Summary financials
Source: Goldman Sachs Global Investment Research
Profit model ($ mn) 12/15 12/16E 12/17E 12/18E Balance sheet ($ mn) 12/15 12/16E 12/17E 12/18E
Total revenue 3,427.7 3,181.4 3,100.2 3,046.0 Cash & equivalents 1,443.4 1,518.0 1,702.4 1,915.8
Cost of goods sold (1,923.5) (1,728.9) (1,719.6) (1,714.3) Accounts receivable 136.7 135.6 140.6 146.5
SG&A (860.1) (832.2) (820.2) (799.3) Inventory 441.8 411.3 423.2 426.6
R&D 0.0 0.0 0.0 0.0 Other current assets 111.9 111.9 111.9 111.9
Other operating profit/(expense) 84.6 55.7 51.4 47.4 Total current assets 2,133.7 2,176.8 2,378.1 2,600.8
EBITDA 983.2 820.0 758.1 727.1 Net PP&E 1,415.0 1,426.1 1,421.8 1,403.4
Depreciation & amortization (254.3) (144.0) (146.3) (147.3) Net intangibles 190.8 186.3 181.9 177.4
EBIT 728.8 676.0 611.9 579.8 Total investments 14.7 14.7 14.7 14.7
Interest income 62.0 60.0 65.0 75.0 Other long-term assets 51.1 53.4 55.7 58.2
Interest expense (20.8) (22.1) (22.1) (22.1) Total assets 3,805.3 3,857.3 4,052.1 4,254.5
Income/(loss) from uncons. subs. 0.0 0.0 0.0 0.0
Others (1.3) 0.0 0.0 0.0 Accounts payable 179.1 156.3 150.7 145.6
Pretax profits 768.8 714.0 654.8 632.8 Short-term debt 257.6 257.6 257.6 257.6
Income tax (227.2) (211.0) (190.2) (180.7) Other current liabilities 456.2 409.8 400.3 396.3
Minorities 0.5 0.5 0.4 0.4 Total current liabilities 892.9 823.6 808.6 799.5
Long-term debt 998.5 998.5 998.5 998.5
Net income pre-preferred dividends 542.1 503.4 465.0 452.5 Other long-term liabilities 41.7 41.7 41.7 41.7
Preferred dividends 0.0 0.0 0.0 0.0 Total long-term liabilities 1,040.2 1,040.2 1,040.2 1,040.2
Net income (pre-exceptionals) 542.1 503.4 465.0 452.5 Total liabilities 1,933.1 1,863.8 1,848.8 1,839.7
Post-tax exceptionals 0.0 0.0 0.0 0.0
Net income 542.1 503.4 465.0 452.5 Preferred shares 0.0 0.0 0.0 0.0
Total common equity 1,864.6 1,986.3 2,196.6 2,408.6
EPS (basic, pre-except) ($) 0.04 0.04 0.04 0.04 Minority interest 7.6 7.1 6.7 6.3
EPS (basic, post-except) ($) 0.04 0.04 0.04 0.04
EPS (diluted, post-except) ($) 0.04 0.04 0.04 0.04 Total liabilities & equity 3,805.3 3,857.3 4,052.1 4,254.5
DPS ($) 0.02 0.02 0.02 0.02
Dividend payout ratio (%) 45.0 50.0 50.0 50.0 BVPS ($) 0.15 0.16 0.17 0.19
Free cash flow yield (%) 4.5 5.7 5.5 5.7
Growth & margins (%) 12/15 12/16E 12/17E 12/18E Ratios 12/15 12/16E 12/17E 12/18E
Sales growth (9.2) (7.2) (2.6) (1.7) ROE (%) 27.7 26.1 22.2 19.7
EBITDA growth 9.4 (16.6) (7.5) (4.1) ROA (%) 13.4 13.1 11.8 10.9
EBIT growth (6.2) (7.2) (9.5) (5.2) CROCI (%) 22.1 19.6 16.7 14.6
Net income growth (12.6) (7.1) (7.6) (2.7) Inventory days 105.2 90.1 88.6 90.5
EPS growth (12.0) (4.6) (6.9) (2.7) Receivables days 14.3 15.6 16.3 17.2
Gross margin 43.9 45.7 44.5 43.7 Payable days 35.7 35.4 32.6 31.5
EBITDA margin 28.7 25.8 24.5 23.9 Net debt/equity (%) (10.0) (13.1) (20.3) (27.3)
EBIT margin 21.3 21.2 19.7 19.0 Interest cover - EBIT (X) NM NM NM NM
Valuation 12/15 12/16E 12/17E 12/18E
Cash flow statement ($ mn) 12/15 12/16E 12/17E 12/18E
Net income pre-preferred dividends 542.1 503.4 465.0 452.5 P/E (analyst) (X) 24.0 16.0 17.2 17.7
D&A add-back 254.3 144.0 146.3 147.3 P/B (X) 6.8 4.0 3.6 3.3
Minorities interests add-back (0.5) (0.5) (0.4) (0.4) EV/EBITDA (X) 13.0 9.5 10.0 10.1
Net (inc)/dec working capital 109.3 (37.7) (32.0) (18.4) Dividend yield (%) 1.9 3.1 2.9 2.8
Other operating cash flow (100.8) (2.2) (2.4) (2.5)
Cash flow from operations 804.5 607.0 576.5 578.5
Capital expenditures (225.3) (150.7) (137.4) (124.5)
Acquisitions (0.1) 0.0 0.0 0.0
Divestitures 0.0 0.0 0.0 0.0
Others 2.1 0.0 0.0 0.0
Cash flow from investments (223.4) (150.7) (137.4) (124.5)
Dividends paid (common & pref) (239.1) (246.4) (254.7) (240.6)
Inc/(dec) in debt (152.1) 0.0 0.0 0.0
Common stock issuance (repurchase) (291.8) (135.3) 0.0 0.0
Other financing cash flows (104.6) 0.0 0.0 0.0
Cash flow from financing (787.7) (381.7) (254.7) (240.6)
Total cash flow (206.6) 74.7 184.4 213.4 Note: Last actual year may include reported and estimated data.
Source: Company data, Goldman Sachs Research estimates.
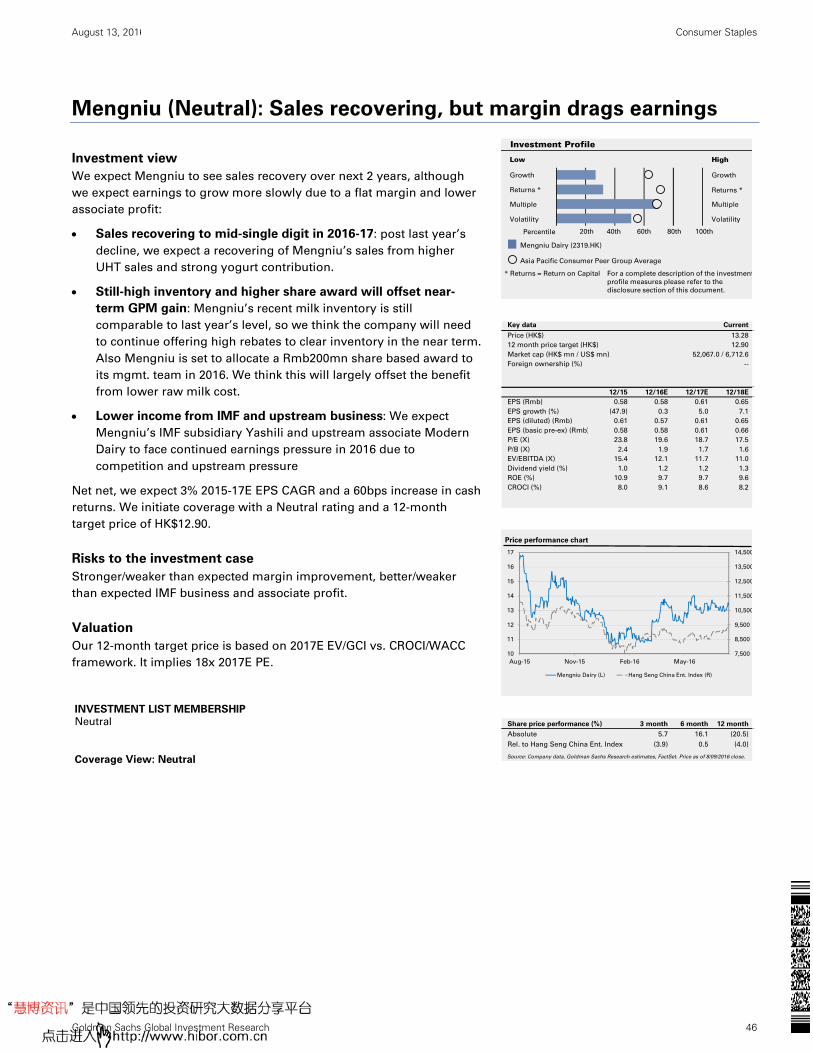
August 13, 2016 China: Consumer Staples
Goldman Sachs Global Investment Research 46
Mengniu (Neutral): Sales recovering, but margin drags earnings
Investment view
We expect Mengniu to see sales recovery over next 2 years, although
we expect earnings to grow more slowly due to a flat margin and lower
associate profit:
Sales recovering to mid-single digit in 2016-17: post last year’s
decline, we expect a recovering of Mengniu’s sales from higher
UHT sales and strong yogurt contribution.
Still-high inventory and higher share award will offset near-
term GPM gain: Mengniu’s recent milk inventory is still
comparable to last year’s level, so we think the company will need
to continue offering high rebates to clear inventory in the near term.
Also Mengniu is set to allocate a Rmb200mn share based award to
its mgmt. team in 2016. We think this will largely offset the benefit
from lower raw milk cost.
Lower income from IMF and upstream business: We expect
Mengniu’s IMF subsidiary Yashili and upstream associate Modern
Dairy to face continued earnings pressure in 2016 due to
competition and upstream pressure
Net net, we expect 3% 2015-17E EPS CAGR and a 60bps increase in cash
returns. We initiate coverage with a Neutral rating and a 12-month
target price of HK$12.90.
Risks to the investment case
Stronger/weaker than expected margin improvement, better/weaker
than expected IMF business and associate profit.
Valuation
Our 12-month target price is based on 2017E EV/GCI vs. CROCI/WACC
framework. It implies 18x 2017E PE.
INVESTMENT LIST MEMBERSHIP
Neutral
Coverage View: Neutral
Growth
Returns *
Multiple
Volatility Volatility
Multiple
Returns *
Growth
Investment Profile
Low High
Percentile 20th 40th 60th 80th 100th
* Returns = Return on Capital For a complete description of the investment
profile measures please refer to the
disclosure section of this document.
Mengniu Dairy (2319.HK)
Asia Pacific Consumer Peer Group Average
Key data Current
Price (HK$) 13.28
12 month price target (HK$) 12.90
Market cap (HK$ mn / US$ mn) 52,067.0 / 6,712.6
Foreign ownership (%) --
12/15 12/16E 12/17E 12/18E
EPS (Rmb) 0.58 0.58 0.61 0.65
EPS growth (%) (47.9) 0.3 5.0 7.1
EPS (diluted) (Rmb) 0.61 0.57 0.61 0.65
EPS (basic pre-ex) (Rmb) 0.58 0.58 0.61 0.66
P/E (X) 23.8 19.6 18.7 17.5
P/B (X) 2.4 1.9 1.7 1.6
EV/EBITDA (X) 15.4 12.1 11.7 11.0
Dividend yield (%) 1.0 1.2 1.2 1.3
ROE (%) 10.9 9.7 9.7 9.6
CROCI (%) 8.0 9.1 8.6 8.2
7,500
8,500
9,500
10,500
11,500
12,500
13,500
14,500
10
11
12
13
14
15
16
17
Aug-15 Nov-15 Feb-16 May-16
Price performance chart
Mengniu Dairy (L) Hang Seng China Ent. Index (R)
Share price performance (%) 3 month 6 month 12 month
Absolute 5.7 16.1 (20.5)
Rel. to Hang Seng China Ent. Index (3.9) 0.5 (4.0)
Source: Company data, Goldman Sachs Research estimates, FactSet. Price as of 8/09/2016 close.

August 13, 2016 China: Consumer Staples
Goldman Sachs Global Investment Research 47
Financials
Income Statement
Sales: we expect Mengniu 2016/17E sales to increase by 5.2%/5.8% yoy. This is driven by
2% UHT sales CAGR and 18% yogurt CAGR.
1) Yogurt: we expect Mengniu to maintain the leading position in yogurt market with
its strong footprint in low temp yogurt and rapid growth of UHT yogurt over 2016-
17E. We expect Just Yogurt to reach Rmb4bn sales in 2016.
2) UHT: expect Milk Deluxe to maintain mid to high single digit sales growth,
although we expect basic milk will continue to see subdued growth given the
slower industry demand.
3) Milk Beverage: expect a smaller 3% sales drop in 2016 vs. 12.5% decline last year.
The sequential better performance is due to company’s increased investment in
SuanSuanRu etc. (sponsoring the Super Girl program this summer).
4) Milk powder: expect Yashili to see continued organic sales drop in 2016 due to
the high competition.
Margin: we see Mengniu’s OPM to slightly decline by 40bps over 2015-17E, due to higher
A&P expenses and larger restricted share expenses. This will more than offset the GPM
expansion from lower raw milk prices.
Associate profit: we expect a Rmb230mn lower associate profit, mainly dragged down by
Modern Dairy’s weak performance.
Cash Flow Statement
Free cash flow: expect gradual improvement of FCF from 1) lower capex of Rmb1.6-1.8bn
over the next two years, and 2) less working capital drag vs. 2015.
Dividend: expect stable payout ratio of 23% over next 3 yrs.
Balance Sheet
Gearing: with slower capex and no major M&A expected over the next two years, we see
Mengniu’s net gearing will gradually reduce to 25% in 2018E vs. 29% in 2015.
ROE and CROCI: expect 80bps ROE drop over 2015-18E due to lower margin and lower
leverage ratio. CROCI is more flattish over three years.
Key risks to our rating, TP and earnings estimates
1. Stronger/Weaker than expected liquid milk sales: if the UHT milk or yogurt
business saw stronger or weaker growth as the company gained/lost market share,
it would has significant impact on company’s topline.
2. Slower turnaround of IMF and upstream dairy business: if the IMF business or
upstream farming had further weakness before recovery, it might drag on
Mengniu’s near term earnings.

August 13, 2016 China: Consumer Staples
Goldman Sachs Global Investment Research 48
Exhibit 94: We see intensifying competition in the
premium UHT market Premium UHT milk market share
Exhibit 95: IMF and Associate loss (upstream) is a near
term drag for the company IMF and associate income
Source: Company data, Goldman Sachs Global Investment Research.
Source: Company data, Goldman Sachs Global Investment Research
Exhibit 96: We expect Mengniu EPS to fall 1% in 1H16 Mengniu interim earnings growth yoy
Exhibit 97: Mengniu is now trading at 20X 12m fwd
P/E Mengniu 12m fwd P/E
Source: Bloomberg
Source: Bloomberg, Goldman Sachs Global Investment Research
43%36%
32% 30% 28% 28%
20%
23%
22% 23% 23% 23%
12% 15%18% 20% 22% 22%
0%
10%
20%
30%
40%
50%
60%
70%
80%
90%
100%
2013 2014 2015 2016E 2017E 2018E
Other domestic
Modern Dairy
Imports
Yili JinDian
Mengniu Milk Deluxe
-1,000
-500
0
500
1,000
1,500
2,000
2,500
3,000
3,500
4,000
4,500
2014 2015 2016E 2017E 2018E
Liquid Milk Associate profit (CMD) Ice cream Milk powder
24%
37% 36.4%
-21.9%
-0.7%
3.9%
-30%
-20%
-10%
0%
10%
20%
30%
40%
50%
1H14 2H14 1H15 2H15 1H16E 2H16E
Recurring NPAT yoy growth
36.0
12.2
19.5
-120%
-100%
-80%
-60%
-40%
-20%
0%
20%
40%
60%
80%
6.0
11.0
16.0
21.0
26.0
31.0
36.0
Jul
-07
Jan
-08
Jul
-08
Jan
-09
Jul
-09
Jan
-10
Jul
-10
Jan
-11
Jul
-11
Jan
-12
Jul
-12
Jan
-13
Jul
-13
Jan
-14
Jul
-14
Jan
-15
Jul
-15
Jan
-16
Jul
-16
Mengniu Fwd 12m P/E EPS Growth
+ 1 STDV
- 1 STDV
Hist. avg 22x
Exhibit 92: We expect Mengniu sales to grow at 5-6% out
to 2020 Mengniu Sales Forecast
Exhibit 93: We expect Mengniu margins to stay relatively
flat Mengniu Margins Forecast
Source: Company data, Goldman Sachs Global Investment Research
Source: Company data, Goldman Sachs Global Investment Research
49,027
51,58654,589
57,827 61,356 64,854
-2%
5.2%
5.8% 5.9% 6.1%5.7%
-3%
-2%
-1%
0%
1%
2%
3%
4%
5%
6%
7%
0
10,000
20,000
30,000
40,000
50,000
60,000
70,000
2015 2016E 2017E 2018E 2019E 2020E
Mengniu Sales (Rmb mn)
31.4% 32.0% 31.8% 31.9% 32.5% 33.1%
5.2% 5.5% 5.2% 5.1% 5.4% 5.7%
0%
5%
10%
15%
20%
25%
30%
35%
2015 2016E 2017E 2018E 2019E 2020E
GP OPM
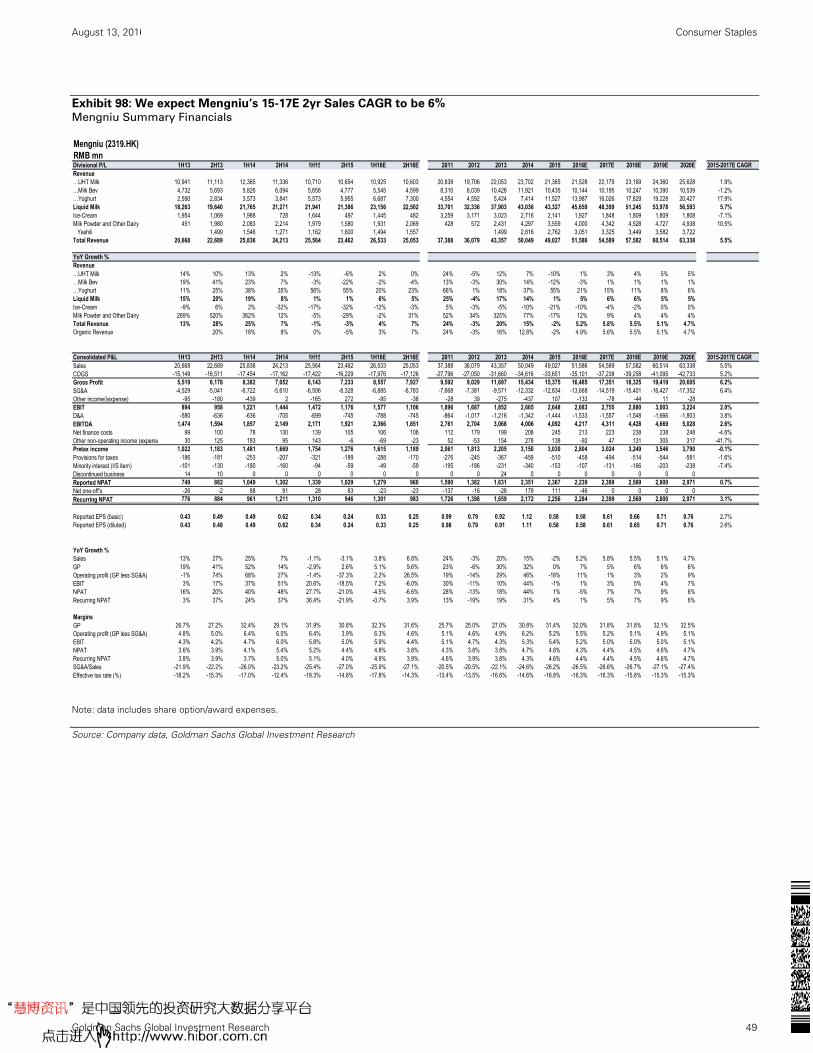
August 13, 2016 China: Consumer Staples
Goldman Sachs Global Investment Research 49
Exhibit 98: We expect Mengniu’s 15-17E 2yr Sales CAGR to be 6% Mengniu Summary Financials
Note: data includes share option/award expenses.
Source: Company data, Goldman Sachs Global Investment Research
Mengniu (2319.HK)RMB mnDivisional P/L 1H13 2H13 1H14 2H14 1H15 2H15 1H16E 2H16E 2011 2012 2013 2014 2015 2016E 2017E 2018E 2019E 2020E 2015-2017E CAGRRevenue…UHT Milk 10,941 11,113 12,365 11,336 10,710 10,654 10,925 10,603 20,838 19,706 22,053 23,702 21,365 21,528 22,179 23,169 24,360 25,628 1.9%…Milk Bev 4,732 5,693 5,826 6,094 5,658 4,777 5,545 4,599 8,310 8,039 10,426 11,921 10,435 10,144 10,195 10,247 10,390 10,539 -1.2%…Yoghurt 2,590 2,834 3,573 3,841 5,573 5,955 6,687 7,300 4,554 4,592 5,424 7,414 11,527 13,987 16,026 17,829 19,228 20,427 17.9%Liquid Milk 18,263 19,640 21,765 21,271 21,941 21,386 23,156 22,502 33,701 32,336 37,903 43,036 43,327 45,659 48,399 51,245 53,978 56,593 5.7%Ice-Cream 1,954 1,069 1,988 728 1,644 497 1,445 482 3,259 3,171 3,023 2,716 2,141 1,927 1,848 1,809 1,809 1,808 -7.1%Milk Powder and Other Dairy 451 1,980 2,083 2,214 1,979 1,580 1,931 2,069 428 572 2,431 4,297 3,559 4,000 4,342 4,528 4,727 4,938 10.5%
Yashili 1,499 1,546 1,271 1,162 1,600 1,494 1,557 1,499 2,816 2,762 3,051 3,325 3,449 3,582 3,722Total Revenue 20,668 22,689 25,836 24,213 25,564 23,462 26,533 25,053 37,388 36,079 43,357 50,049 49,027 51,586 54,589 57,582 60,514 63,338 5.5%
YoY Growth %Revenue…UHT Milk 14% 10% 13% 2% -13% -6% 2% 0% 24% -5% 12% 7% -10% 1% 3% 4% 5% 5%…Milk Bev 19% 41% 23% 7% -3% -22% -2% -4% 13% -3% 30% 14% -12% -3% 1% 1% 1% 1%…Yoghurt 11% 25% 38% 35% 56% 55% 20% 23% 66% 1% 18% 37% 55% 21% 15% 11% 8% 6%Liquid Milk 15% 20% 19% 8% 1% 1% 6% 5% 25% -4% 17% 14% 1% 5% 6% 6% 5% 5%Ice-Cream -9% 6% 2% -32% -17% -32% -12% -3% 5% -3% -5% -10% -21% -10% -4% -2% 0% 0%Milk Powder and Other Dairy 269% 520% 362% 12% -5% -29% -2% 31% 52% 34% 325% 77% -17% 12% 9% 4% 4% 4%Total Revenue 13% 28% 25% 7% -1% -3% 4% 7% 24% -3% 20% 15% -2% 5.2% 5.8% 5.5% 5.1% 4.7%Organic Revenue 20% 18% 8% 0% -5% 3% 7% 24% -3% 16% 12.8% -2% 4.9% 5.6% 5.5% 5.1% 4.7%
Consolidated P&L 1H13 2H13 1H14 2H14 1H15 2H15 1H16E 2H16E 2011 2012 2013 2014 2015 2016E 2017E 2018E 2019E 2020E 2015-2017E CAGRSales 20,668 22,689 25,836 24,213 25,564 23,462 26,533 25,053 37,388 36,079 43,357 50,049 49,027 51,586 54,589 57,582 60,514 63,338 5.5%COGS -15,149 -16,511 -17,454 -17,162 -17,422 -16,229 -17,976 -17,126 -27,796 -27,050 -31,660 -34,616 -33,651 -35,101 -37,238 -39,258 -41,095 -42,733 5.2%Gross Profit 5,519 6,178 8,382 7,052 8,143 7,233 8,557 7,927 9,592 9,029 11,697 15,434 15,375 16,485 17,351 18,325 19,419 20,605 6.2%SG&A -4,529 -5,041 -6,722 -5,610 -6,506 -6,328 -6,885 -6,783 -7,668 -7,381 -9,571 -12,332 -12,834 -13,668 -14,519 -15,401 -16,427 -17,352 6.4%Other income/(expense) -95 -180 -439 2 -165 272 -95 -38 -28 39 -275 -437 107 -133 -78 -44 11 -28EBIT 894 958 1,221 1,444 1,472 1,176 1,577 1,106 1,896 1,687 1,852 2,665 2,648 2,683 2,755 2,880 3,003 3,224 2.0%D&A -580 -636 -636 -705 -699 -745 -788 -745 -864 -1,017 -1,216 -1,342 -1,444 -1,533 -1,557 -1,548 -1,666 -1,803 3.8%EBITDA 1,474 1,594 1,857 2,149 2,171 1,921 2,366 1,851 2,761 2,704 3,068 4,006 4,092 4,217 4,311 4,428 4,669 5,028 2.6%Net finance costs 99 100 78 130 139 105 106 106 112 179 199 208 245 213 223 238 238 248 -4.6%Other non-operating income (expense 30 125 183 95 143 -6 -69 -23 52 -53 154 278 138 -92 47 131 305 317 -41.7%Pretax income 1,022 1,183 1,481 1,669 1,754 1,276 1,615 1,189 2,061 1,813 2,205 3,150 3,030 2,804 3,024 3,249 3,546 3,790 -0.1%Provisions for taxes -186 -181 -253 -207 -321 -189 -288 -170 -276 -245 -367 -459 -510 -458 -494 -514 -544 -581 -1.6%Minority interest (I/S item) -101 -130 -180 -160 -94 -59 -49 -59 -195 -186 -231 -340 -153 -107 -131 -166 -203 -238 -7.4%Discontinued business 14 10 0 0 0 0 0 0 0 0 24 0 0 0 0 0 0 0Reported NPAT 749 882 1,049 1,302 1,339 1,029 1,279 960 1,590 1,382 1,631 2,351 2,367 2,239 2,399 2,569 2,800 2,971 0.7%Net one-off's -26 -2 88 91 28 83 -23 -23 -137 -16 -28 179 111 -46 0 0 0 0Recurring NPAT 776 884 961 1,211 1,310 946 1,301 983 1,726 1,398 1,659 2,172 2,256 2,284 2,399 2,569 2,800 2,971 3.1%
Reported EPS (basic) 0.43 0.49 0.49 0.62 0.34 0.24 0.33 0.25 0.99 0.79 0.92 1.12 0.58 0.58 0.61 0.66 0.71 0.76 2.7%Reported EPS (diluted) 0.43 0.48 0.49 0.62 0.34 0.24 0.33 0.25 0.98 0.79 0.91 1.11 0.58 0.58 0.61 0.65 0.71 0.76 2.6%
YoY Growth %Sales 13% 27% 25% 7% -1.1% -3.1% 3.8% 6.8% 24% -3% 20% 15% -2% 5.2% 5.8% 5.5% 5.1% 4.7%GP 19% 41% 52% 14% -2.9% 2.6% 5.1% 9.6% 23% -6% 30% 32% 0% 7% 5% 6% 6% 6%Operating profit (GP less SG&A) -1% 74% 68% 27% -1.4% -37.3% 2.2% 26.5% 19% -14% 29% 46% -18% 11% 1% 3% 2% 9%EBIT 3% 17% 37% 51% 20.6% -18.5% 7.2% -6.0% 30% -11% 10% 44% -1% 1% 3% 5% 4% 7%NPAT 16% 20% 40% 48% 27.7% -21.0% -4.5% -6.6% 28% -13% 18% 44% 1% -5% 7% 7% 9% 6%Recurring NPAT 3% 37% 24% 37% 36.4% -21.9% -0.7% 3.9% 13% -19% 19% 31% 4% 1% 5% 7% 9% 6%
MarginsGP 26.7% 27.2% 32.4% 29.1% 31.9% 30.8% 32.3% 31.6% 25.7% 25.0% 27.0% 30.8% 31.4% 32.0% 31.8% 31.8% 32.1% 32.5%Operating profit (GP less SG&A) 4.8% 5.0% 6.4% 6.0% 6.4% 3.9% 6.3% 4.6% 5.1% 4.6% 4.9% 6.2% 5.2% 5.5% 5.2% 5.1% 4.9% 5.1%EBIT 4.3% 4.2% 4.7% 6.0% 5.8% 5.0% 5.9% 4.4% 5.1% 4.7% 4.3% 5.3% 5.4% 5.2% 5.0% 5.0% 5.0% 5.1%NPAT 3.6% 3.9% 4.1% 5.4% 5.2% 4.4% 4.8% 3.8% 4.3% 3.8% 3.8% 4.7% 4.8% 4.3% 4.4% 4.5% 4.6% 4.7%Recurring NPAT 3.8% 3.9% 3.7% 5.0% 5.1% 4.0% 4.9% 3.9% 4.6% 3.9% 3.8% 4.3% 4.6% 4.4% 4.4% 4.5% 4.6% 4.7%SG&A/Sales -21.9% -22.2% -26.0% -23.2% -25.4% -27.0% -25.9% -27.1% -20.5% -20.5% -22.1% -24.6% -26.2% -26.5% -26.6% -26.7% -27.1% -27.4%Effective tax rate (%) -18.2% -15.3% -17.0% -12.4% -18.3% -14.8% -17.8% -14.3% -13.4% -13.5% -16.6% -14.6% -16.8% -16.3% -16.3% -15.8% -15.3% -15.3%
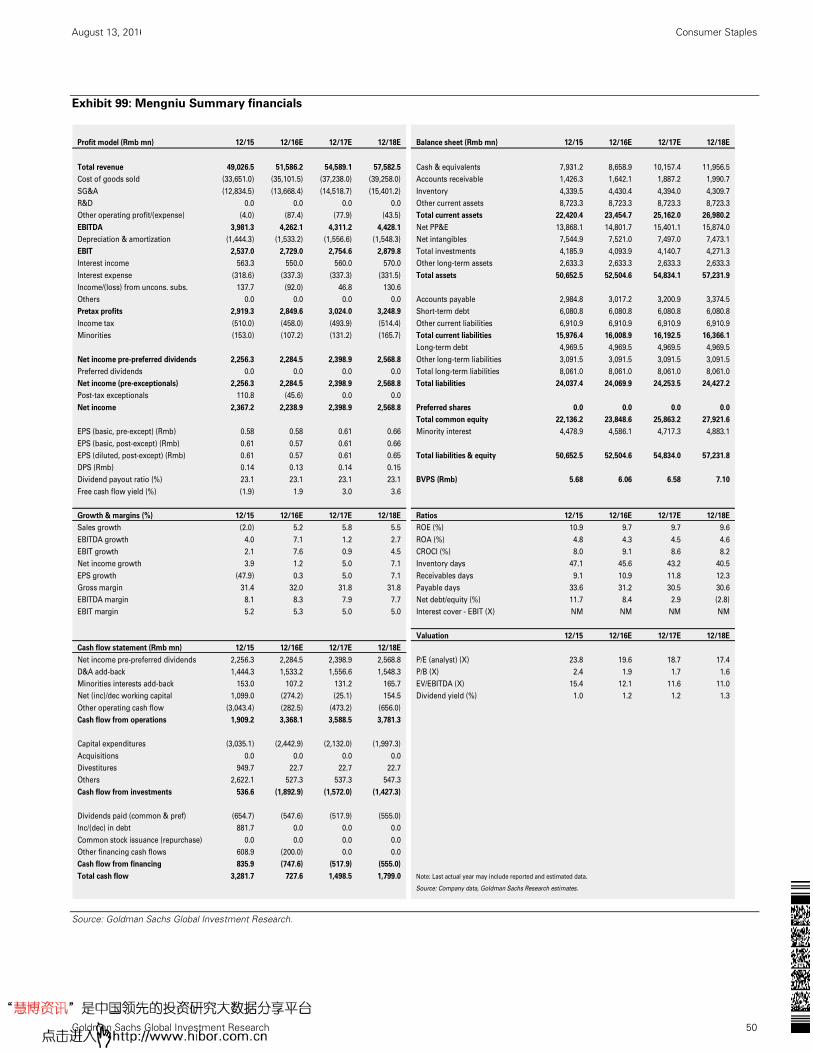
August 13, 2016 China: Consumer Staples
Goldman Sachs Global Investment Research 50
Exhibit 99: Mengniu Summary financials
Source: Goldman Sachs Global Investment Research.
Profit model (Rmb mn) 12/15 12/16E 12/17E 12/18E Balance sheet (Rmb mn) 12/15 12/16E 12/17E 12/18E
Total revenue 49,026.5 51,586.2 54,589.1 57,582.5 Cash & equivalents 7,931.2 8,658.9 10,157.4 11,956.5
Cost of goods sold (33,651.0) (35,101.5) (37,238.0) (39,258.0) Accounts receivable 1,426.3 1,642.1 1,887.2 1,990.7
SG&A (12,834.5) (13,668.4) (14,518.7) (15,401.2) Inventory 4,339.5 4,430.4 4,394.0 4,309.7
R&D 0.0 0.0 0.0 0.0 Other current assets 8,723.3 8,723.3 8,723.3 8,723.3
Other operating profit/(expense) (4.0) (87.4) (77.9) (43.5) Total current assets 22,420.4 23,454.7 25,162.0 26,980.2
EBITDA 3,981.3 4,262.1 4,311.2 4,428.1 Net PP&E 13,868.1 14,801.7 15,401.1 15,874.0
Depreciation & amortization (1,444.3) (1,533.2) (1,556.6) (1,548.3) Net intangibles 7,544.9 7,521.0 7,497.0 7,473.1
EBIT 2,537.0 2,729.0 2,754.6 2,879.8 Total investments 4,185.9 4,093.9 4,140.7 4,271.3
Interest income 563.3 550.0 560.0 570.0 Other long-term assets 2,633.3 2,633.3 2,633.3 2,633.3
Interest expense (318.6) (337.3) (337.3) (331.5) Total assets 50,652.5 52,504.6 54,834.1 57,231.9
Income/(loss) from uncons. subs. 137.7 (92.0) 46.8 130.6
Others 0.0 0.0 0.0 0.0 Accounts payable 2,984.8 3,017.2 3,200.9 3,374.5
Pretax profits 2,919.3 2,849.6 3,024.0 3,248.9 Short-term debt 6,080.8 6,080.8 6,080.8 6,080.8
Income tax (510.0) (458.0) (493.9) (514.4) Other current liabilities 6,910.9 6,910.9 6,910.9 6,910.9
Minorities (153.0) (107.2) (131.2) (165.7) Total current liabilities 15,976.4 16,008.9 16,192.5 16,366.1
Long-term debt 4,969.5 4,969.5 4,969.5 4,969.5
Net income pre-preferred dividends 2,256.3 2,284.5 2,398.9 2,568.8 Other long-term liabilities 3,091.5 3,091.5 3,091.5 3,091.5
Preferred dividends 0.0 0.0 0.0 0.0 Total long-term liabilities 8,061.0 8,061.0 8,061.0 8,061.0
Net income (pre-exceptionals) 2,256.3 2,284.5 2,398.9 2,568.8 Total liabilities 24,037.4 24,069.9 24,253.5 24,427.2
Post-tax exceptionals 110.8 (45.6) 0.0 0.0
Net income 2,367.2 2,238.9 2,398.9 2,568.8 Preferred shares 0.0 0.0 0.0 0.0
Total common equity 22,136.2 23,848.6 25,863.2 27,921.6
EPS (basic, pre-except) (Rmb) 0.58 0.58 0.61 0.66 Minority interest 4,478.9 4,586.1 4,717.3 4,883.1
EPS (basic, post-except) (Rmb) 0.61 0.57 0.61 0.66
EPS (diluted, post-except) (Rmb) 0.61 0.57 0.61 0.65 Total liabilities & equity 50,652.5 52,504.6 54,834.0 57,231.8
DPS (Rmb) 0.14 0.13 0.14 0.15
Dividend payout ratio (%) 23.1 23.1 23.1 23.1 BVPS (Rmb) 5.68 6.06 6.58 7.10
Free cash flow yield (%) (1.9) 1.9 3.0 3.6
Growth & margins (%) 12/15 12/16E 12/17E 12/18E Ratios 12/15 12/16E 12/17E 12/18E
Sales growth (2.0) 5.2 5.8 5.5 ROE (%) 10.9 9.7 9.7 9.6
EBITDA growth 4.0 7.1 1.2 2.7 ROA (%) 4.8 4.3 4.5 4.6
EBIT growth 2.1 7.6 0.9 4.5 CROCI (%) 8.0 9.1 8.6 8.2
Net income growth 3.9 1.2 5.0 7.1 Inventory days 47.1 45.6 43.2 40.5
EPS growth (47.9) 0.3 5.0 7.1 Receivables days 9.1 10.9 11.8 12.3
Gross margin 31.4 32.0 31.8 31.8 Payable days 33.6 31.2 30.5 30.6
EBITDA margin 8.1 8.3 7.9 7.7 Net debt/equity (%) 11.7 8.4 2.9 (2.8)
EBIT margin 5.2 5.3 5.0 5.0 Interest cover - EBIT (X) NM NM NM NM
Valuation 12/15 12/16E 12/17E 12/18E
Cash flow statement (Rmb mn) 12/15 12/16E 12/17E 12/18E
Net income pre-preferred dividends 2,256.3 2,284.5 2,398.9 2,568.8 P/E (analyst) (X) 23.8 19.6 18.7 17.4
D&A add-back 1,444.3 1,533.2 1,556.6 1,548.3 P/B (X) 2.4 1.9 1.7 1.6
Minorities interests add-back 153.0 107.2 131.2 165.7 EV/EBITDA (X) 15.4 12.1 11.6 11.0
Net (inc)/dec working capital 1,099.0 (274.2) (25.1) 154.5 Dividend yield (%) 1.0 1.2 1.2 1.3
Other operating cash flow (3,043.4) (282.5) (473.2) (656.0)
Cash flow from operations 1,909.2 3,368.1 3,588.5 3,781.3
Capital expenditures (3,035.1) (2,442.9) (2,132.0) (1,997.3)
Acquisitions 0.0 0.0 0.0 0.0
Divestitures 949.7 22.7 22.7 22.7
Others 2,622.1 527.3 537.3 547.3
Cash flow from investments 536.6 (1,892.9) (1,572.0) (1,427.3)
Dividends paid (common & pref) (654.7) (547.6) (517.9) (555.0)
Inc/(dec) in debt 881.7 0.0 0.0 0.0
Common stock issuance (repurchase) 0.0 0.0 0.0 0.0
Other financing cash flows 608.9 (200.0) 0.0 0.0
Cash flow from financing 835.9 (747.6) (517.9) (555.0)
Total cash flow 3,281.7 727.6 1,498.5 1,799.0 Note: Last actual year may include reported and estimated data.
Source: Company data, Goldman Sachs Research estimates.
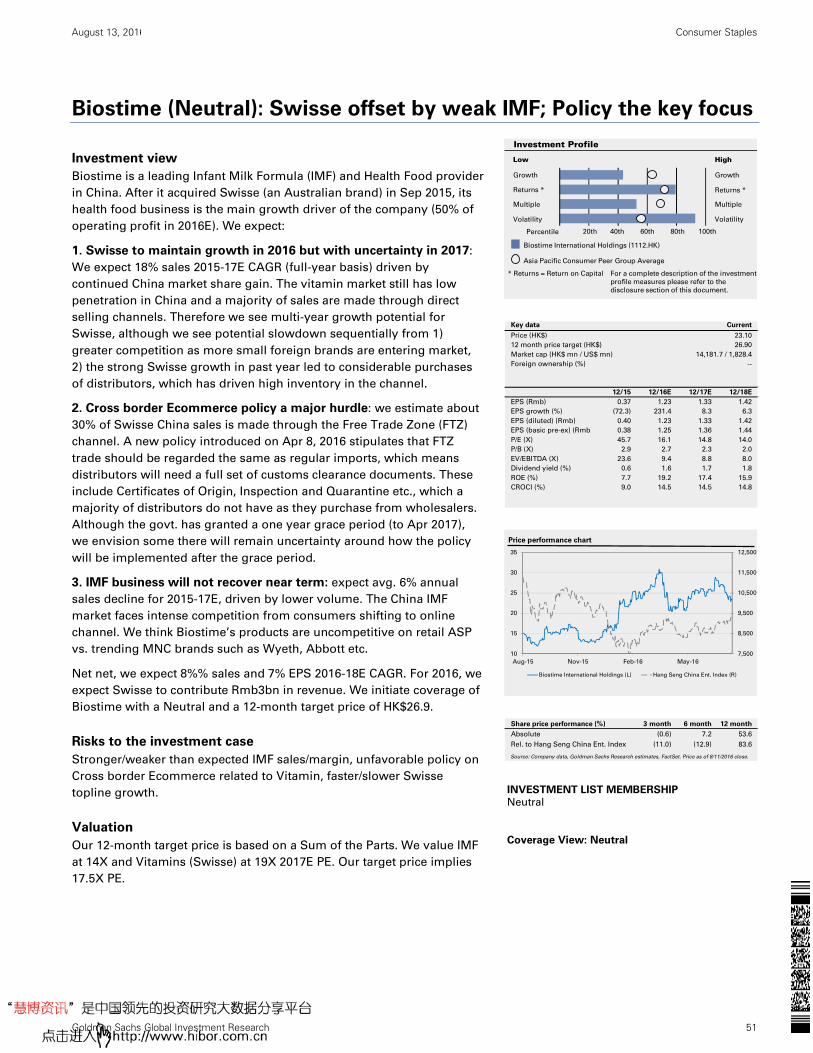
August 13, 2016 China: Consumer Staples
Goldman Sachs Global Investment Research 51
Biostime (Neutral): Swisse offset by weak IMF; Policy the key focus
Investment view
Biostime is a leading Infant Milk Formula (IMF) and Health Food provider
in China. After it acquired Swisse (an Australian brand) in Sep 2015, its
health food business is the main growth driver of the company (50% of
operating profit in 2016E). We expect:
1. Swisse to maintain growth in 2016 but with uncertainty in 2017:
We expect 18% sales 2015-17E CAGR (full-year basis) driven by
continued China market share gain. The vitamin market still has low
penetration in China and a majority of sales are made through direct
selling channels. Therefore we see multi-year growth potential for
Swisse, although we see potential slowdown sequentially from 1)
greater competition as more small foreign brands are entering market,
2) the strong Swisse growth in past year led to considerable purchases
of distributors, which has driven high inventory in the channel.
2. Cross border Ecommerce policy a major hurdle: we estimate about
30% of Swisse China sales is made through the Free Trade Zone (FTZ)
channel. A new policy introduced on Apr 8, 2016 stipulates that FTZ
trade should be regarded the same as regular imports, which means
distributors will need a full set of customs clearance documents. These
include Certificates of Origin, Inspection and Quarantine etc., which a
majority of distributors do not have as they purchase from wholesalers.
Although the govt. has granted a one year grace period (to Apr 2017),
we envision some there will remain uncertainty around how the policy
will be implemented after the grace period.
3. IMF business will not recover near term: expect avg. 6% annual
sales decline for 2015-17E, driven by lower volume. The China IMF
market faces intense competition from consumers shifting to online
channel. We think Biostime’s products are uncompetitive on retail ASP
vs. trending MNC brands such as Wyeth, Abbott etc.
Net net, we expect 8%% sales and 7% EPS 2016-18E CAGR. For 2016, we
expect Swisse to contribute Rmb3bn in revenue. We initiate coverage of
Biostime with a Neutral and a 12-month target price of HK$26.9.
Risks to the investment case
Stronger/weaker than expected IMF sales/margin, unfavorable policy on
Cross border Ecommerce related to Vitamin, faster/slower Swisse
topline growth.
Valuation
Our 12-month target price is based on a Sum of the Parts. We value IMF
at 14X and Vitamins (Swisse) at 19X 2017E PE. Our target price implies
17.5X PE.
Growth
Returns *
Multiple
Volatility Volatility
Multiple
Returns *
Growth
Investment Profile
Low High
Percentile 20th 40th 60th 80th 100th
* Returns = Return on Capital For a complete description of the investment
profile measures please refer to the
disclosure section of this document.
Biostime International Holdings (1112.HK)
Asia Pacific Consumer Peer Group Average
Key data Current
Price (HK$) 23.10
12 month price target (HK$) 26.90
Market cap (HK$ mn / US$ mn) 14,181.7 / 1,828.4
Foreign ownership (%) --
12/15 12/16E 12/17E 12/18E
EPS (Rmb) 0.37 1.23 1.33 1.42
EPS growth (%) (72.3) 231.4 8.3 6.3
EPS (diluted) (Rmb) 0.40 1.23 1.33 1.42
EPS (basic pre-ex) (Rmb) 0.38 1.25 1.36 1.44
P/E (X) 45.7 16.1 14.8 14.0
P/B (X) 2.9 2.7 2.3 2.0
EV/EBITDA (X) 23.6 9.4 8.8 8.0
Dividend yield (%) 0.6 1.6 1.7 1.8
ROE (%) 7.7 19.2 17.4 15.9
CROCI (%) 9.0 14.5 14.5 14.8
7,500
8,500
9,500
10,500
11,500
12,500
10
15
20
25
30
35
Aug-15 Nov-15 Feb-16 May-16
Price performance chart
Biostime International Holdings (L) Hang Seng China Ent. Index (R)
Share price performance (%) 3 month 6 month 12 month
Absolute (0.6) 7.2 53.6
Rel. to Hang Seng China Ent. Index (11.0) (12.9) 83.6
Source: Company data, Goldman Sachs Research estimates, FactSet. Price as of 8/11/2016 close.
INVESTMENT LIST MEMBERSHIP
Neutral
Coverage View: Neutral
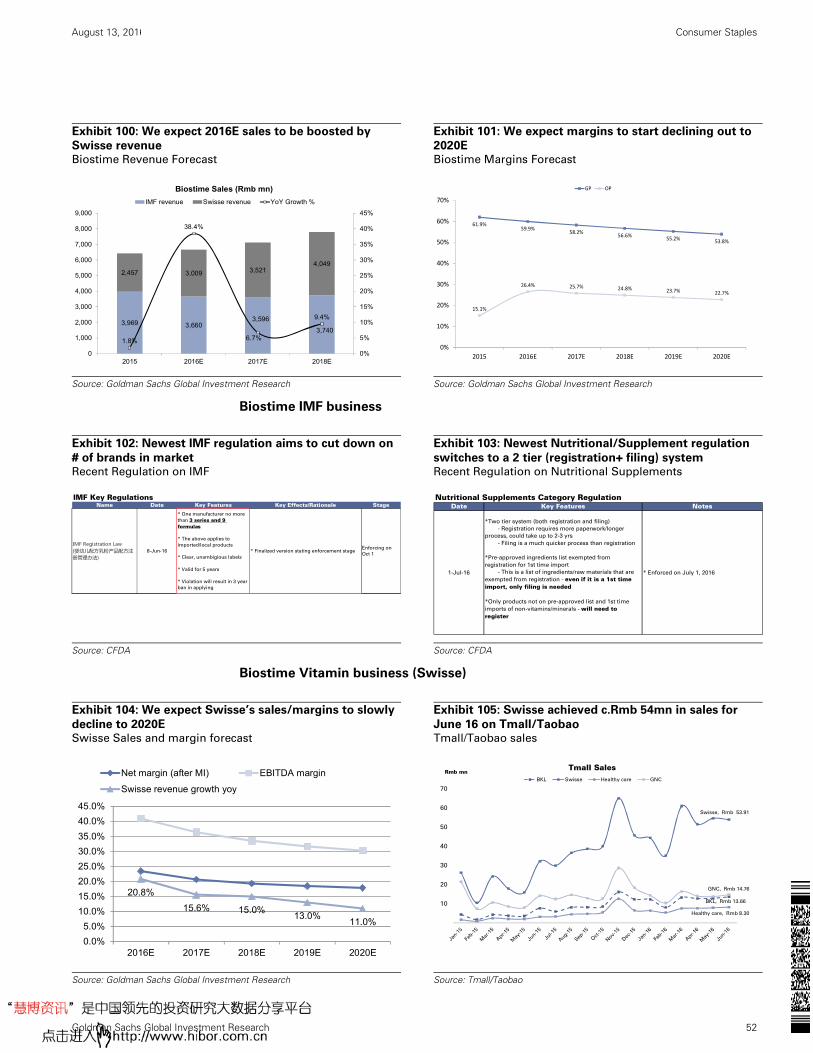
August 13, 2016 China: Consumer Staples
Goldman Sachs Global Investment Research 52
Exhibit 100: We expect 2016E sales to be boosted by
Swisse revenue Biostime Revenue Forecast
Exhibit 101: We expect margins to start declining out to
2020E Biostime Margins Forecast
Source: Goldman Sachs Global Investment Research
Source: Goldman Sachs Global Investment Research
Biostime IMF business
Exhibit 102: Newest IMF regulation aims to cut down on
# of brands in market Recent Regulation on IMF
Exhibit 103: Newest Nutritional/Supplement regulation
switches to a 2 tier (registration+ filing) system Recent Regulation on Nutritional Supplements
Source: CFDA
Source: CFDA
Biostime Vitamin business (Swisse)
Exhibit 104: We expect Swisse’s sales/margins to slowly
decline to 2020E Swisse Sales and margin forecast
Exhibit 105: Swisse achieved c.Rmb 54mn in sales for
June 16 on Tmall/Taobao Tmall/Taobao sales
Source: Goldman Sachs Global Investment Research
Source: Tmall/Taobao
3,969 3,6603,596
3,740
2,457 3,009 3,5214,049
1.8%
38.4%
6.7%
9.4%
0%
5%
10%
15%
20%
25%
30%
35%
40%
45%
0
1,000
2,000
3,000
4,000
5,000
6,000
7,000
8,000
9,000
2015 2016E 2017E 2018E
Biostime Sales (Rmb mn)
IMF revenue Swisse revenue YoY Growth %
61.9% 59.9%
58.2% 56.6%
55.2% 53.8%
15.1%
26.4% 25.7% 24.8% 23.7% 22.7%
0%
10%
20%
30%
40%
50%
60%
70%
2015 2016E 2017E 2018E 2019E 2020E
GP OP
IMF Key RegulationsName Date Key Features Key Effects/Rationale Stage
IMF�Registration�Law�(婴幼儿配方乳粉产品配方注册管理办法)
8-Jun-16
* One manufacturer no more
than 3 series and 9 formulas
* The above applies to
imported/local products
* Clear, unambigious labels
* Valid for 5 years
* Violation will result in 3 year
ban in applying
* Finalized version stating enforcement stageEnforcing on
Oct 1
Nutritional Supplements Category Regulation Date Key Features Notes
1-Jul-16
*Two tier system (both registration and filing)
- Registration requires more paperwork/longer
process, could take up to 2-3 yrs
- Filing is a much quicker process than registration
*Pre-approved ingredients list exempted from
registration for 1st time import
- This is a list of ingredients/raw materials that are
exempted from registration - even if it is a 1st time import, only filing is needed
*Only products not on pre-approved list and 1st time
imports of non-vitamins/minerals - will need to register
* Enforced on July 1, 2016
20.8%
15.6% 15.0%13.0%
11.0%
0.0%
5.0%
10.0%
15.0%
20.0%
25.0%
30.0%
35.0%
40.0%
45.0%
2016E 2017E 2018E 2019E 2020E
Net margin (after MI) EBITDA margin
Swisse revenue growth yoy
BKL, Rmb 13.66
Swisse, Rmb 53.91
Healthy care, Rmb 8.30
GNC, Rmb 14.76
10
20
30
40
50
60
70
Rmb mnTmall Sales
BKL Swisse Healthy care GNC

August 13, 2016 China: Consumer Staples
Goldman Sachs Global Investment Research 53
Exhibit 106: Swisse has a 9% market share of vitamins
and supplements on Tmall Tmall/Taobao market share
Exhibit 107: ASP has been trending downwards for Tmall
Tmall/Taobao ASP trend
Source: Tmall/Taobao
Source: Tmall/Taobao
Exhibit 108: We value Biostime IMF and Vitamin business
at 14X and 19X 2017E PE Biostime SOTP valuation
Exhibit 109: Biostime currently trading at 19X 12m fwd
P/E, vs. avg of 18X since 2013 Biostime 12m fwd PE
Source: Goldman Sachs Global Investment Research
Source: Goldman Sachs Global Investment Research
BKL, 2%
Swisse, 8.9%
Healthy care, 1%
GNC, 2%
0%
1%
2%
3%
4%
5%
6%
7%
8%
9%
10%
Jan
-15
Feb
-15
Mar-
15
Ap
r-15
May
-…
Ju
n-1
5
Ju
l-1
5
Au
g-1
5
Se
p-1
5
Oct
-15
No
v-1
5
Dec-
15
Jan
-16
Feb
-16
Mar-
16
Ap
r-16
May
-…
Ju
n-1
6
Market Share Tmall Market Share by Value
BKL Swisse Healthy care GNC
BKL, Rmb129.78
Swisse, Rmb 97.54
Healthy care,
Rmb133.48
GNC, Rmb115.79
RMB80
RMB100
RMB120
RMB140
RMB160
RMB180
RMB200ASP Trend
BKL Swisse Healthy care GNC
SOTP PE (RMB mn) 2017 NPAT Multiple Equity ValueInfant milk formula 245 14.0x 3,429 Vitamin Supplements (83%) 588 19.0x 11,180 Total 833 17.5x 14,609 Diluted outstanding shares (mn) 625Exchange rate: CNYHKD 1.15Implied value per share (HK$) 26.9
10.0
12.0
14.0
16.0
18.0
20.0
22.0
24.0
26.0
28.0
30.0
Biostime 12m fwd PE
Avg. 18X
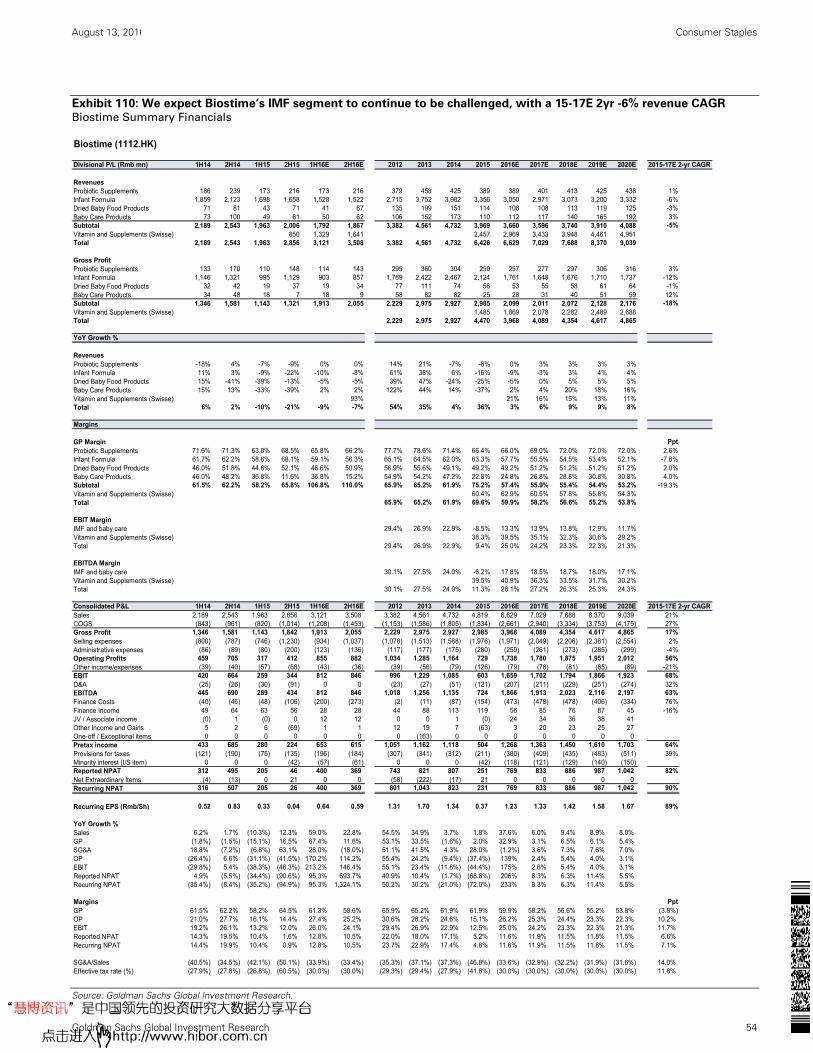
August 13, 2016 China: Consumer Staples
Goldman Sachs Global Investment Research 54
Exhibit 110: We expect Biostime’s IMF segment to continue to be challenged, with a 15-17E 2yr -6% revenue CAGR Biostime Summary Financials
Source: Goldman Sachs Global Investment Research.
Biostime (1112.HK)
Divisional P/L (Rmb mn) 1H14 2H14 1H15 2H15 1H16E 2H16E 2012 2013 2014 2015 2016E 2017E 2018E 2019E 2020E 2015-17E 2-yr CAGR
RevenuesProbiotic Supplements 186 239 173 216 173 216 379 458 425 389 389 401 413 425 438 1%Infant Formula 1,859 2,123 1,698 1,658 1,528 1,522 2,715 3,752 3,982 3,356 3,050 2,971 3,073 3,200 3,332 -6%Dried Baby Food Products 71 81 43 71 41 67 135 199 151 114 108 108 113 119 125 -3%Baby Care Products 73 100 49 61 50 62 106 152 173 110 112 117 140 165 192 3%Subtotal 2,189 2,543 1,963 2,006 1,792 1,867 3,382 4,561 4,732 3,969 3,660 3,596 3,740 3,910 4,088 -5%Vitamin and Supplements (Swisse) 850 1,329 1,641 2,457 2,969 3,433 3,948 4,461 4,951Total 2,189 2,543 1,963 2,856 3,121 3,508 3,382 4,561 4,732 6,426 6,629 7,029 7,688 8,370 9,039
Gross ProfitProbiotic Supplements 133 170 110 148 114 143 295 360 304 259 257 277 297 306 316 3%Infant Formula 1,146 1,321 995 1,129 903 857 1,769 2,422 2,467 2,124 1,761 1,648 1,676 1,710 1,737 -12%Dried Baby Food Products 32 42 19 37 19 34 77 111 74 56 53 55 58 61 64 -1%Baby Care Products 34 48 18 7 18 9 58 82 82 25 28 31 40 51 59 12%Subtotal 1,346 1,581 1,143 1,321 1,913 2,055 2,229 2,975 2,927 2,985 2,099 2,011 2,072 2,128 2,176 -18%Vitamin and Supplements (Swisse) 1,485 1,869 2,078 2,282 2,489 2,688Total 2,229 2,975 2,927 4,470 3,968 4,089 4,354 4,617 4,865
YoY Growth %
RevenuesProbiotic Supplements -18% 4% -7% -9% 0% 0% 14% 21% -7% -8% 0% 3% 3% 3% 3%Infant Formula 11% 3% -9% -22% -10% -8% 61% 38% 6% -16% -9% -3% 3% 4% 4%Dried Baby Food Products 15% -41% -39% -13% -5% -5% 39% 47% -24% -25% -5% 0% 5% 5% 5%Baby Care Products 15% 13% -33% -39% 2% 2% 122% 44% 14% -37% 2% 4% 20% 18% 16%Vitamin and Supplements (Swisse) 93% 21% 16% 15% 13% 11%Total 6% 2% -10% -21% -9% -7% 54% 35% 4% 36% 3% 6% 9% 9% 8%
Margins
GP Margin PptProbiotic Supplements 71.6% 71.3% 63.8% 68.5% 65.8% 66.2% 77.7% 78.6% 71.4% 66.4% 66.0% 69.0% 72.0% 72.0% 72.0% 2.6%Infant Formula 61.7% 62.2% 58.6% 68.1% 59.1% 56.3% 65.1% 64.5% 62.0% 63.3% 57.7% 55.5% 54.5% 53.4% 52.1% -7.8%Dried Baby Food Products 46.0% 51.8% 44.6% 52.1% 46.6% 50.9% 56.9% 55.6% 49.1% 49.2% 49.2% 51.2% 51.2% 51.2% 51.2% 2.0%Baby Care Products 46.0% 48.2% 36.8% 11.6% 36.8% 15.2% 54.9% 54.2% 47.2% 22.8% 24.8% 26.8% 28.8% 30.8% 30.8% 4.0%Subtotal 61.5% 62.2% 58.2% 65.8% 106.8% 110.0% 65.9% 65.2% 61.9% 75.2% 57.4% 55.9% 55.4% 54.4% 53.2% -19.3%Vitamin and Supplements (Swisse) 60.4% 62.9% 60.5% 57.8% 55.8% 54.3%Total 65.9% 65.2% 61.9% 69.6% 59.9% 58.2% 56.6% 55.2% 53.8%
EBIT MarginIMF and baby care 29.4% 26.9% 22.9% -8.5% 13.3% 13.9% 13.8% 12.9% 11.7%Vitamin and Supplements (Swisse) 38.3% 39.5% 35.1% 32.3% 30.6% 29.2%Total 29.4% 26.9% 22.9% 9.4% 25.0% 24.2% 23.3% 22.3% 21.3%
EBITDA MarginIMF and baby care 30.1% 27.5% 24.0% -6.2% 17.8% 18.5% 18.7% 18.0% 17.1%Vitamin and Supplements (Swisse) 39.5% 40.9% 36.3% 33.5% 31.7% 30.2%Total 30.1% 27.5% 24.0% 11.3% 28.1% 27.2% 26.3% 25.3% 24.3%
Consolidated P&L 1H14 2H14 1H15 2H15 1H16E 2H16E 2012 2013 2014 2015 2016E 2017E 2018E 2019E 2020E 2015-17E 2-yr CAGRSales 2,189 2,543 1,963 2,856 3,121 3,508 3,382 4,561 4,732 4,819 6,629 7,029 7,688 8,370 9,039 21%COGS (843) (961) (820) (1,014) (1,208) (1,453) (1,153) (1,586) (1,805) (1,834) (2,661) (2,940) (3,334) (3,753) (4,175) 27%Gross Profit 1,346 1,581 1,143 1,842 1,913 2,055 2,229 2,975 2,927 2,985 3,968 4,089 4,354 4,617 4,865 17%Selling expenses (800) (787) (746) (1,230) (934) (1,037) (1,078) (1,513) (1,588) (1,976) (1,971) (2,049) (2,206) (2,381) (2,554) 2%Administrative expenses (86) (89) (80) (200) (123) (136) (117) (177) (175) (280) (259) (261) (273) (285) (299) -4%Operating Profits 459 705 317 412 855 882 1,034 1,285 1,164 729 1,738 1,780 1,875 1,951 2,012 56%Other income/expenses (39) (40) (57) (68) (43) (36) (39) (56) (79) (126) (79) (78) (81) (85) (89) -21%EBIT 420 664 259 344 812 846 996 1,229 1,085 603 1,659 1,702 1,794 1,866 1,923 68%D&A (25) (26) (30) (91) 0 0 (23) (27) (51) (121) (207) (211) (229) (251) (274) 32%EBITDA 445 690 289 434 812 846 1,018 1,256 1,135 724 1,866 1,913 2,023 2,116 2,197 63%Finance Costs (40) (46) (48) (106) (200) (273) (2) (11) (87) (154) (473) (478) (478) (406) (334) 76%Finance Income 49 64 63 56 28 28 44 88 113 119 56 85 76 87 45 -16%JV / Associate income (0) 1 (0) 0 12 12 0 0 1 (0) 24 34 36 38 41Other Income and Gains 5 2 6 (69) 1 1 12 19 7 (63) 3 20 23 25 27One-off / Exceptional items 0 0 0 0 0 0 0 (163) 0 0 0 0 0 0 0Pretax income 433 685 280 224 653 615 1,051 1,162 1,118 504 1,268 1,363 1,450 1,610 1,703 64%Provisions for taxes (121) (190) (75) (135) (196) (184) (307) (341) (312) (211) (380) (409) (435) (483) (511) 39%Minority interest (I/S item) 0 0 0 (42) (57) (61) 0 0 0 (42) (118) (121) (129) (140) (150)Reported NPAT 312 495 205 46 400 369 743 821 807 251 769 833 886 987 1,042 82%Net Extraordinary Items (4) (13) 0 21 0 0 (58) (222) (17) 21 0 0 0 0 0Recurring NPAT 316 507 205 26 400 369 801 1,043 823 231 769 833 886 987 1,042 90%
Recurring EPS (Rmb/Sh) 0.52 0.83 0.33 0.04 0.64 0.59 1.31 1.70 1.34 0.37 1.23 1.33 1.42 1.58 1.67 89%
YoY Growth %Sales 6.2% 1.7% (10.3%) 12.3% 59.0% 22.8% 54.5% 34.9% 3.7% 1.8% 37.6% 6.0% 9.4% 8.9% 8.0%GP (1.8%) (1.5%) (15.1%) 16.5% 67.4% 11.6% 53.1% 33.5% (1.6%) 2.0% 32.9% 3.1% 6.5% 6.1% 5.4%SG&A 18.8% (7.2%) (6.8%) 63.1% 28.0% (18.0%) 51.1% 41.5% 4.3% 28.0% (1.2%) 3.6% 7.3% 7.6% 7.0%OP (26.4%) 6.6% (31.1%) (41.5%) 170.2% 114.2% 55.4% 24.2% (9.4%) (37.4%) 139% 2.4% 5.4% 4.0% 3.1%EBIT (29.8%) 5.4% (38.3%) (48.3%) 213.2% 146.4% 55.1% 23.4% (11.8%) (44.4%) 175% 2.6% 5.4% 4.0% 3.1%Reported NPAT 4.9% (5.5%) (34.4%) (90.6%) 95.3% 693.7% 40.9% 10.4% (1.7%) (68.8%) 206% 8.3% 6.3% 11.4% 5.5%Recurring NPAT (35.4%) (8.4%) (35.2%) (94.9%) 95.3% 1,324.1% 50.2% 30.2% (21.0%) (72.0%) 233% 8.3% 6.3% 11.4% 5.5%
Margins PptGP 61.5% 62.2% 58.2% 64.5% 61.3% 58.6% 65.9% 65.2% 61.9% 61.9% 59.9% 58.2% 56.6% 55.2% 53.8% (3.8%)OP 21.0% 27.7% 16.1% 14.4% 27.4% 25.2% 30.6% 28.2% 24.6% 15.1% 26.2% 25.3% 24.4% 23.3% 22.3% 10.2%EBIT 19.2% 26.1% 13.2% 12.0% 26.0% 24.1% 29.4% 26.9% 22.9% 12.5% 25.0% 24.2% 23.3% 22.3% 21.3% 11.7%Reported NPAT 14.3% 19.5% 10.4% 1.6% 12.8% 10.5% 22.0% 18.0% 17.1% 5.2% 11.6% 11.9% 11.5% 11.8% 11.5% 6.6%Recurring NPAT 14.4% 19.9% 10.4% 0.9% 12.8% 10.5% 23.7% 22.9% 17.4% 4.8% 11.6% 11.9% 11.5% 11.8% 11.5% 7.1%
SG&A/Sales (40.5%) (34.5%) (42.1%) (50.1%) (33.9%) (33.4%) (35.3%) (37.1%) (37.3%) (46.8%) (33.6%) (32.9%) (32.2%) (31.9%) (31.6%) 14.0%Effective tax rate (%) (27.9%) (27.8%) (26.8%) (60.5%) (30.0%) (30.0%) (29.3%) (29.4%) (27.9%) (41.8%) (30.0%) (30.0%) (30.0%) (30.0%) (30.0%) 11.8%
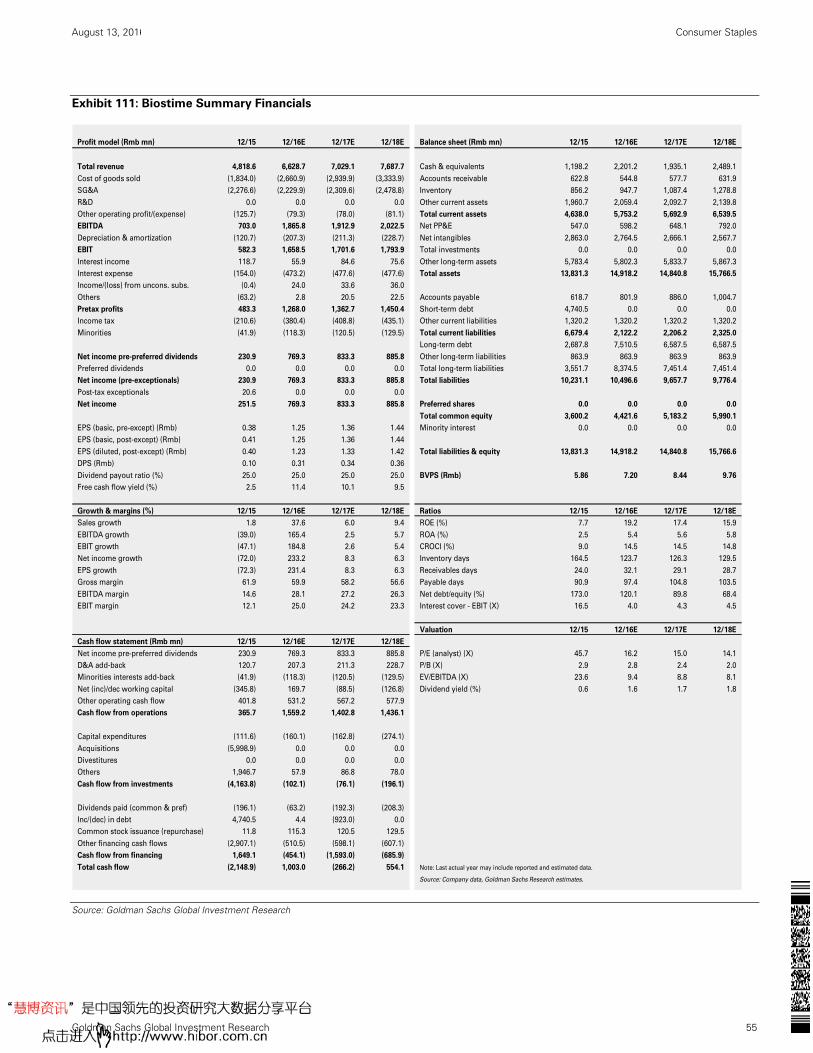
August 13, 2016 China: Consumer Staples
Goldman Sachs Global Investment Research 55
Exhibit 111: Biostime Summary Financials
Source: Goldman Sachs Global Investment Research
Profit model (Rmb mn) 12/15 12/16E 12/17E 12/18E Balance sheet (Rmb mn) 12/15 12/16E 12/17E 12/18E
Total revenue 4,818.6 6,628.7 7,029.1 7,687.7 Cash & equivalents 1,198.2 2,201.2 1,935.1 2,489.1
Cost of goods sold (1,834.0) (2,660.9) (2,939.9) (3,333.9) Accounts receivable 622.8 544.8 577.7 631.9
SG&A (2,276.6) (2,229.9) (2,309.6) (2,478.8) Inventory 856.2 947.7 1,087.4 1,278.8
R&D 0.0 0.0 0.0 0.0 Other current assets 1,960.7 2,059.4 2,092.7 2,139.8
Other operating profit/(expense) (125.7) (79.3) (78.0) (81.1) Total current assets 4,638.0 5,753.2 5,692.9 6,539.5
EBITDA 703.0 1,865.8 1,912.9 2,022.5 Net PP&E 547.0 598.2 648.1 792.0
Depreciation & amortization (120.7) (207.3) (211.3) (228.7) Net intangibles 2,863.0 2,764.5 2,666.1 2,567.7
EBIT 582.3 1,658.5 1,701.6 1,793.9 Total investments 0.0 0.0 0.0 0.0
Interest income 118.7 55.9 84.6 75.6 Other long-term assets 5,783.4 5,802.3 5,833.7 5,867.3
Interest expense (154.0) (473.2) (477.6) (477.6) Total assets 13,831.3 14,918.2 14,840.8 15,766.5
Income/(loss) from uncons. subs. (0.4) 24.0 33.6 36.0
Others (63.2) 2.8 20.5 22.5 Accounts payable 618.7 801.9 886.0 1,004.7
Pretax profits 483.3 1,268.0 1,362.7 1,450.4 Short-term debt 4,740.5 0.0 0.0 0.0
Income tax (210.6) (380.4) (408.8) (435.1) Other current liabilities 1,320.2 1,320.2 1,320.2 1,320.2
Minorities (41.9) (118.3) (120.5) (129.5) Total current liabilities 6,679.4 2,122.2 2,206.2 2,325.0
Long-term debt 2,687.8 7,510.5 6,587.5 6,587.5
Net income pre-preferred dividends 230.9 769.3 833.3 885.8 Other long-term liabilities 863.9 863.9 863.9 863.9
Preferred dividends 0.0 0.0 0.0 0.0 Total long-term liabilities 3,551.7 8,374.5 7,451.4 7,451.4
Net income (pre-exceptionals) 230.9 769.3 833.3 885.8 Total liabilities 10,231.1 10,496.6 9,657.7 9,776.4
Post-tax exceptionals 20.6 0.0 0.0 0.0
Net income 251.5 769.3 833.3 885.8 Preferred shares 0.0 0.0 0.0 0.0
Total common equity 3,600.2 4,421.6 5,183.2 5,990.1
EPS (basic, pre-except) (Rmb) 0.38 1.25 1.36 1.44 Minority interest 0.0 0.0 0.0 0.0
EPS (basic, post-except) (Rmb) 0.41 1.25 1.36 1.44
EPS (diluted, post-except) (Rmb) 0.40 1.23 1.33 1.42 Total liabilities & equity 13,831.3 14,918.2 14,840.8 15,766.6
DPS (Rmb) 0.10 0.31 0.34 0.36
Dividend payout ratio (%) 25.0 25.0 25.0 25.0 BVPS (Rmb) 5.86 7.20 8.44 9.76
Free cash flow yield (%) 2.5 11.4 10.1 9.5
Growth & margins (%) 12/15 12/16E 12/17E 12/18E Ratios 12/15 12/16E 12/17E 12/18E
Sales growth 1.8 37.6 6.0 9.4 ROE (%) 7.7 19.2 17.4 15.9
EBITDA growth (39.0) 165.4 2.5 5.7 ROA (%) 2.5 5.4 5.6 5.8
EBIT growth (47.1) 184.8 2.6 5.4 CROCI (%) 9.0 14.5 14.5 14.8
Net income growth (72.0) 233.2 8.3 6.3 Inventory days 164.5 123.7 126.3 129.5
EPS growth (72.3) 231.4 8.3 6.3 Receivables days 24.0 32.1 29.1 28.7
Gross margin 61.9 59.9 58.2 56.6 Payable days 90.9 97.4 104.8 103.5
EBITDA margin 14.6 28.1 27.2 26.3 Net debt/equity (%) 173.0 120.1 89.8 68.4
EBIT margin 12.1 25.0 24.2 23.3 Interest cover - EBIT (X) 16.5 4.0 4.3 4.5
Valuation 12/15 12/16E 12/17E 12/18E
Cash flow statement (Rmb mn) 12/15 12/16E 12/17E 12/18E
Net income pre-preferred dividends 230.9 769.3 833.3 885.8 P/E (analyst) (X) 45.7 16.2 15.0 14.1
D&A add-back 120.7 207.3 211.3 228.7 P/B (X) 2.9 2.8 2.4 2.0
Minorities interests add-back (41.9) (118.3) (120.5) (129.5) EV/EBITDA (X) 23.6 9.4 8.8 8.1
Net (inc)/dec working capital (345.8) 169.7 (88.5) (126.8) Dividend yield (%) 0.6 1.6 1.7 1.8
Other operating cash flow 401.8 531.2 567.2 577.9
Cash flow from operations 365.7 1,559.2 1,402.8 1,436.1
Capital expenditures (111.6) (160.1) (162.8) (274.1)
Acquisitions (5,998.9) 0.0 0.0 0.0
Divestitures 0.0 0.0 0.0 0.0
Others 1,946.7 57.9 86.8 78.0
Cash flow from investments (4,163.8) (102.1) (76.1) (196.1)
Dividends paid (common & pref) (196.1) (63.2) (192.3) (208.3)
Inc/(dec) in debt 4,740.5 4.4 (923.0) 0.0
Common stock issuance (repurchase) 11.8 115.3 120.5 129.5
Other financing cash flows (2,907.1) (510.5) (598.1) (607.1)
Cash flow from financing 1,649.1 (454.1) (1,593.0) (685.9)
Total cash flow (2,148.9) 1,003.0 (266.2) 554.1 Note: Last actual year may include reported and estimated data.
Source: Company data, Goldman Sachs Research estimates.
August 13, 2016 China: Consumer Staples
Goldman Sachs Global Investment Research 56
Financials
Income Statement
Sales: we expect Biostime to post 5% sales CAGR in 2016/17E, assuming Swisse on a full
year basis. The stronger growth for Swisse is partially offset by decline in IMF.
Margin: after a jump in OPM in 2016 (due to the Swisse acquisition), we expect the
company’s margin to gradually decline over 2016-18E, due to the intense competition in
the IMF business .
Balance Sheet
Gearing: Biostime’s net gearing ratio went up substantially post the Swisse acquisition, to
206%. We expect it will be reduced gradually to 127% in 2017E.
ROE: expect gradual fall in ROE after 2016 as company sales growth slows down and
margins decline.
Cash Flow Statement
Capex: In the absence of major M&A in near term, we expect the company’s capex will
stabilize around Rmb150mn annually over 2016-17E.
FCF: We expect the company to generate Rmb1.3-1.4bn free cash flow each year,
contributed by Swisse profit.
Valuation
We value Biostime on a Sum of the Part and assign different PE multiples to the IMF and
Vitamin (Swisse) businesses. This is due to Biostime having recently bought Swisse and
which is still in a high growth stage, whereas the IMF business is already in a mature stage.
We assign 19X 2017E PE to Swisse, in line with large cap China staples companies
avg. PE (Yili, Mengniu, WW and Tingyi), given its high single digit growth profile.
We assign 14X 2017E PE to the IMF business, about 1SD below historical avg. level
due to its slower sales and lower margin.
From this we derive our 12m target price of HK$26.9/share, implying 17.5X 2017E PE.
Key risks to our rating, TP and earnings estimates
Weaker than expected Swisse sales: higher competition or channel inventory destocking
could potentially slow Swisse sales and drive lower profit
Higher/lower than expected IMF margin: we expect gradual decline of Biostime IMF margin
as competition is still intense.
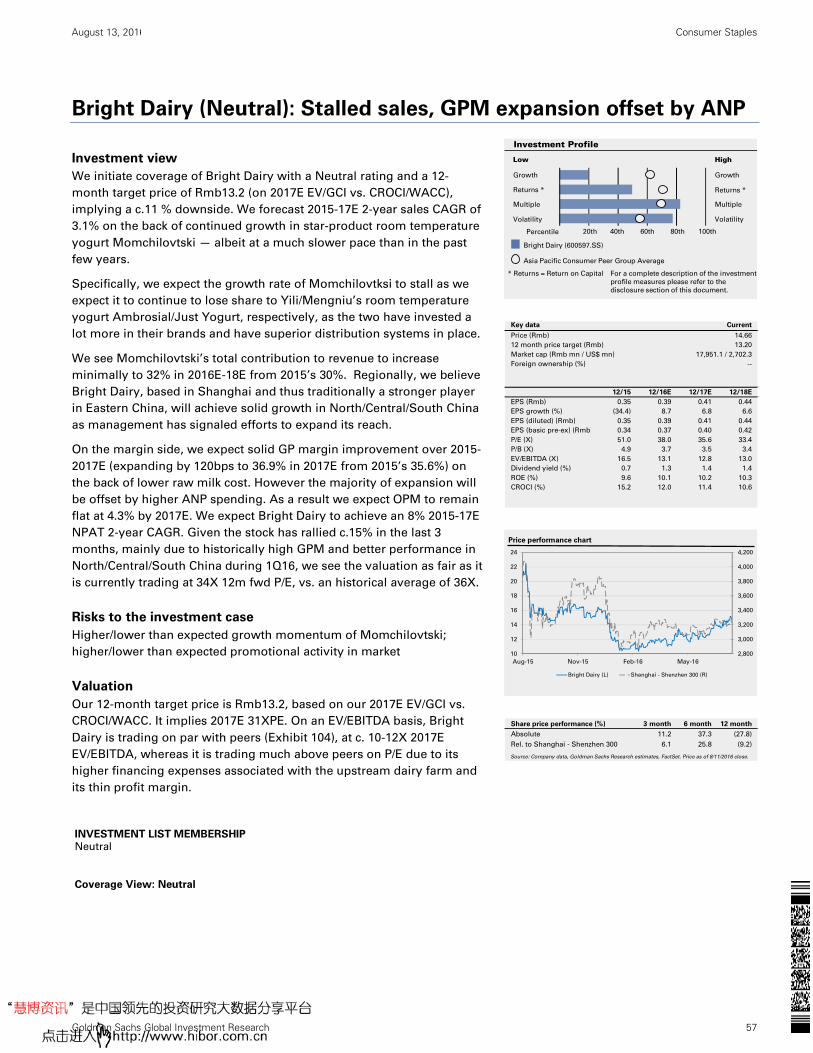
August 13, 2016 China: Consumer Staples
Goldman Sachs Global Investment Research 57
Bright Dairy (Neutral): Stalled sales, GPM expansion offset by ANP
Investment view
We initiate coverage of Bright Dairy with a Neutral rating and a 12-
month target price of Rmb13.2 (on 2017E EV/GCI vs. CROCI/WACC),
implying a c.11 % downside. We forecast 2015-17E 2-year sales CAGR of
3.1% on the back of continued growth in star-product room temperature
yogurt Momchilovtski — albeit at a much slower pace than in the past
few years.
Specifically, we expect the growth rate of Momchilovtksi to stall as we
expect it to continue to lose share to Yili/Mengniu’s room temperature
yogurt Ambrosial/Just Yogurt, respectively, as the two have invested a
lot more in their brands and have superior distribution systems in place.
We see Momchilovtski’s total contribution to revenue to increase
minimally to 32% in 2016E-18E from 2015’s 30%. Regionally, we believe
Bright Dairy, based in Shanghai and thus traditionally a stronger player
in Eastern China, will achieve solid growth in North/Central/South China
as management has signaled efforts to expand its reach.
On the margin side, we expect solid GP margin improvement over 2015-
2017E (expanding by 120bps to 36.9% in 2017E from 2015’s 35.6%) on
the back of lower raw milk cost. However the majority of expansion will
be offset by higher ANP spending. As a result we expect OPM to remain
flat at 4.3% by 2017E. We expect Bright Dairy to achieve an 8% 2015-17E
NPAT 2-year CAGR. Given the stock has rallied c.15% in the last 3
months, mainly due to historically high GPM and better performance in
North/Central/South China during 1Q16, we see the valuation as fair as it
is currently trading at 34X 12m fwd P/E, vs. an historical average of 36X.
Risks to the investment case
Higher/lower than expected growth momentum of Momchilovtski;
higher/lower than expected promotional activity in market
Valuation
Our 12-month target price is Rmb13.2, based on our 2017E EV/GCI vs.
CROCI/WACC. It implies 2017E 31XPE. On an EV/EBITDA basis, Bright
Dairy is trading on par with peers (Exhibit 104), at c. 10-12X 2017E
EV/EBITDA, whereas it is trading much above peers on P/E due to its
higher financing expenses associated with the upstream dairy farm and
its thin profit margin.
INVESTMENT LIST MEMBERSHIP
Neutral
Coverage View: Neutral
Growth
Returns *
Multiple
Volatility Volatility
Multiple
Returns *
Growth
Investment Profile
Low High
Percentile 20th 40th 60th 80th 100th
* Returns = Return on Capital For a complete description of the investment
profile measures please refer to the
disclosure section of this document.
Bright Dairy (600597.SS)
Asia Pacific Consumer Peer Group Average
Key data Current
Price (Rmb) 14.66
12 month price target (Rmb) 13.20
Market cap (Rmb mn / US$ mn) 17,951.1 / 2,702.3
Foreign ownership (%) --
12/15 12/16E 12/17E 12/18E
EPS (Rmb) 0.35 0.39 0.41 0.44
EPS growth (%) (34.4) 8.7 6.8 6.6
EPS (diluted) (Rmb) 0.35 0.39 0.41 0.44
EPS (basic pre-ex) (Rmb) 0.34 0.37 0.40 0.42
P/E (X) 51.0 38.0 35.6 33.4
P/B (X) 4.9 3.7 3.5 3.4
EV/EBITDA (X) 16.5 13.1 12.8 13.0
Dividend yield (%) 0.7 1.3 1.4 1.4
ROE (%) 9.6 10.1 10.2 10.3
CROCI (%) 15.2 12.0 11.4 10.6
2,800
3,000
3,200
3,400
3,600
3,800
4,000
4,200
10
12
14
16
18
20
22
24
Aug-15 Nov-15 Feb-16 May-16
Price performance chart
Bright Dairy (L) Shanghai - Shenzhen 300 (R)
Share price performance (%) 3 month 6 month 12 month
Absolute 11.2 37.3 (27.8)
Rel. to Shanghai - Shenzhen 300 6.1 25.8 (9.2)
Source: Company data, Goldman Sachs Research estimates, FactSet. Price as of 8/11/2016 close.

August 13, 2016 China: Consumer Staples
Goldman Sachs Global Investment Research 58
Financials
Income Statement
Sales: we expect 3% sales CAGR over 2015-18E, slower than Yili/Mengniu’s mid to high
single digit. The East China region is more saturated and offers less growth potential while
it will take time for Bright Dairy to expand in other region such as North and Central China
given its smaller scale and intense competition. For UHT yogurt, we expect Bright Dairy to
lose market share to Yili due to Yili’s extensive marketing campaign.
Margin: expect flattish OP margin over the next three years. We expect Bright Dairy will
benefit further from lower raw milk price in 2016 but this will be offset by higher A&P
expenses as company continued to push its UHT yogurt and expand into other regions.
Balance Sheet
Gearing: expect company’s net debt to increase over the next two years and net gearing of
11% in 2018E.
CROCI: expect lower cash return over the next three years due to the still low profit margin
and high capex.
Cash Flow Statement
Capex: expect a slower capex of Rmb1.6bn/year, due to slower expansion of upstream
dairy farming and new plant built-up. However the absolute capex level is still high
compared to the company’s operating cash flow.
FCF: despite the slower capex, we expect the company’s FCF will be negative over the next
two years due to the subdued margin increase.
Key risks to our rating, TP and earnings estimates
Stronger/weaker than expected UHT yogurt growth: we expect a stabilized 5%
sales growth for Bright Dairy’s UHT yogurt product. However a faster/slower
growth would have significant impact on the company’s topline/profit.
Higher/lower than expected margin: the company makes a thin 4% OPM or only
2.3% NPM. Any increase in the gross margin or fluctuation of selling expenses will
impact its profit margin.
Potential M&A of Israel Tnuva: Bright offered to buy 70% of Tnuva in 2H15 but
postponed the acquisition due to financing hurdles earlier this year. If this deal
takes place it would alter Bright’s capital structure and earnings composition.
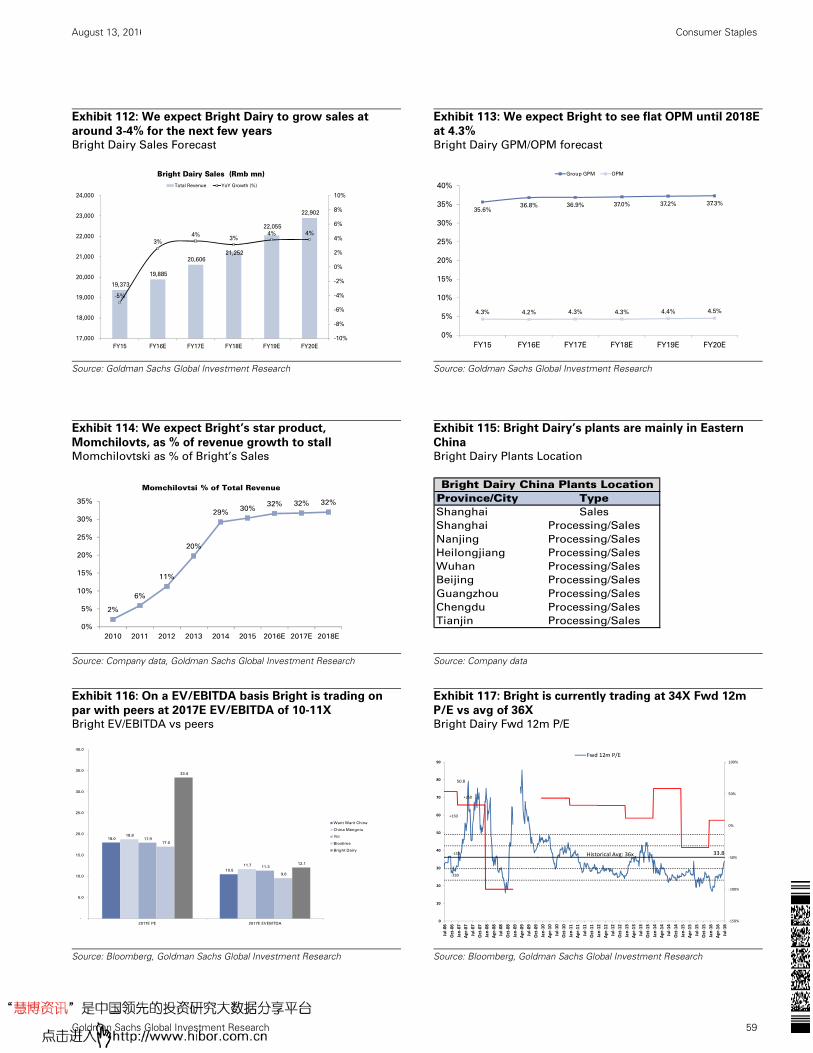
August 13, 2016 China: Consumer Staples
Goldman Sachs Global Investment Research 59
Exhibit 112: We expect Bright Dairy to grow sales at
around 3-4% for the next few years Bright Dairy Sales Forecast
Exhibit 113: We expect Bright to see flat OPM until 2018E
at 4.3% Bright Dairy GPM/OPM forecast
Source: Goldman Sachs Global Investment Research
Source: Goldman Sachs Global Investment Research
Exhibit 114: We expect Bright’s star product,
Momchilovts, as % of revenue growth to stall Momchilovtski as % of Bright’s Sales
Exhibit 115: Bright Dairy’s plants are mainly in Eastern
China Bright Dairy Plants Location
Source: Company data, Goldman Sachs Global Investment Research
Source: Company data
Exhibit 116: On a EV/EBITDA basis Bright is trading on
par with peers at 2017E EV/EBITDA of 10-11X Bright EV/EBITDA vs peers
Exhibit 117: Bright is currently trading at 34X Fwd 12m
P/E vs avg of 36X Bright Dairy Fwd 12m P/E
Source: Bloomberg, Goldman Sachs Global Investment Research
Source: Bloomberg, Goldman Sachs Global Investment Research
19,373
19,885
20,606 21,252
22,055
22,902
-5%
3%4%
3%4% 4%
-10%
-8%
-6%
-4%
-2%
0%
2%
4%
6%
8%
10%
17,000
18,000
19,000
20,000
21,000
22,000
23,000
24,000
FY15 FY16E FY17E FY18E FY19E FY20E
Bright Dairy Sales (Rmb mn)Total Revenue YoY Growth (%)
35.6%36.8% 36.9% 37.0% 37.2% 37.3%
4.3% 4.2% 4.3% 4.3% 4.4% 4.5%
0%
5%
10%
15%
20%
25%
30%
35%
40%
FY15 FY16E FY17E FY18E FY19E FY20E
Group GPM OPM
2%
6%
11%
20%
29%30%
32% 32% 32%
0%
5%
10%
15%
20%
25%
30%
35%
2010 2011 2012 2013 2014 2015 2016E 2017E 2018E
Momchilovtsi % of Total Revenue
Province/City TypeShanghai Sales
Shanghai Processing/Sales
Nanjing Processing/Sales
Heilongjiang Processing/Sales
Wuhan Processing/Sales
Beijing Processing/Sales
Guangzhou Processing/Sales
Chengdu Processing/Sales
Tianjin Processing/Sales
Bright Dairy China Plants Location
18.0
10.5
18.8
11.7
17.9
11.3
17.0
9.6
33.4
12.1
-
5.0
10.0
15.0
20.0
25.0
30.0
35.0
40.0
2017E PE 2017E EVEBITDA
Want Want China
China Mengniu
Yili
Biostime
Bright Dairy33.8
‐150%
‐100%
‐50%
0%
50%
100%
0
10
20
30
40
50
60
70
80
90
Jul‐06
Oct‐06
Jan‐07
Apr‐07
Jul‐07
Oct‐07
Jan‐08
Apr‐08
Jul‐08
Oct‐08
Jan‐09
Apr‐09
Jul‐09
Oct‐09
Jan‐10
Apr‐10
Jul‐10
Oct‐10
Jan‐11
Apr‐11
Jul‐11
Oct‐11
Jan‐12
Apr‐12
Jul‐12
Oct‐12
Jan‐13
Apr‐13
Jul‐13
Oct‐13
Jan‐14
Apr‐14
Jul‐14
Oct‐ 14
Jan‐15
Apr‐15
Jul‐15
Oct‐15
Jan‐16
Apr‐16
Jul‐16
Fwd 12m P/E
Historical Avg: 36x
+1SD
‐1SD
+2SD
‐2SD
50.8
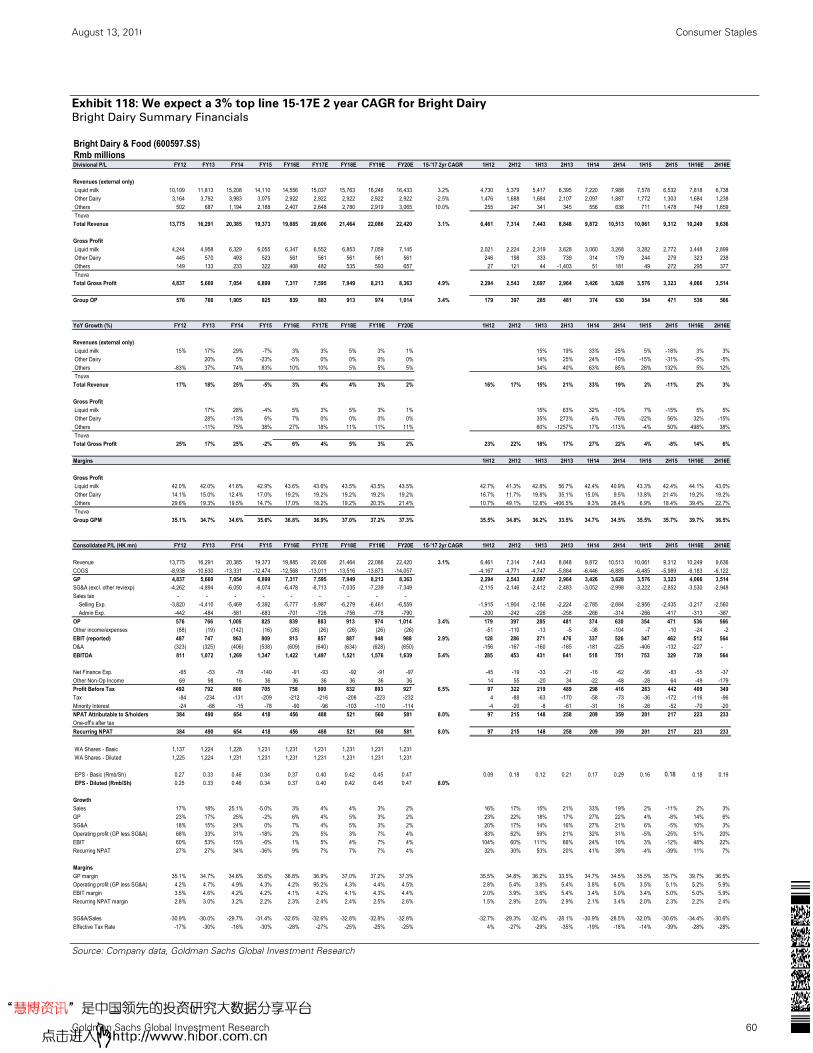
August 13, 2016 China: Consumer Staples
Goldman Sachs Global Investment Research 60
Exhibit 118: We expect a 3% top line 15-17E 2 year CAGR for Bright Dairy Bright Dairy Summary Financials
Source: Company data, Goldman Sachs Global Investment Research
Bright Dairy & Food (600597.SS)Rmb millionsDivisional P/L FY12 FY13 FY14 FY15 FY16E FY17E FY18E FY19E FY20E 15-'17 2yr CAGR 1H12 2H12 1H13 2H13 1H14 2H14 1H15 2H15 1H16E 2H16E
Revenues (external only)
Liquid milk 10,109 11,813 15,208 14,110 14,556 15,037 15,763 16,246 16,433 3.2% 4,730 5,379 5,417 6,395 7,220 7,988 7,578 6,532 7,818 6,738
Other Dairy 3,164 3,792 3,983 3,075 2,922 2,922 2,922 2,922 2,922 -2.5% 1,476 1,688 1,684 2,107 2,097 1,887 1,772 1,303 1,684 1,238
Others 502 687 1,194 2,188 2,407 2,648 2,780 2,919 3,065 10.0% 255 247 341 345 556 638 711 1,478 748 1,659
Tnuva
Total Revenue 13,775 16,291 20,385 19,373 19,885 20,606 21,464 22,086 22,420 3.1% 6,461 7,314 7,443 8,848 9,872 10,513 10,061 9,312 10,249 9,636
Gross Profit
Liquid milk 4,244 4,958 6,329 6,055 6,347 6,552 6,853 7,059 7,145 2,021 2,224 2,319 3,628 3,060 3,268 3,282 2,772 3,448 2,899
Other Dairy 445 570 493 523 561 561 561 561 561 246 198 333 739 314 179 244 279 323 238
Others 149 133 233 322 408 482 535 593 657 27 121 44 -1,403 51 181 49 272 295 377
Tnuva
Total Gross Profit 4,837 5,660 7,054 6,899 7,317 7,595 7,949 8,213 8,363 4.9% 2,294 2,543 2,697 2,964 3,426 3,628 3,576 3,323 4,066 3,514
Group OP 576 766 1,005 825 839 883 913 974 1,014 3.4% 179 397 285 481 374 630 354 471 536 566
YoY Growth (%) FY12 FY13 FY14 FY15 FY16E FY17E FY18E FY19E FY20E 1H12 2H12 1H13 2H13 1H14 2H14 1H15 2H15 1H16E 2H16E
Revenues (external only)
Liquid milk 15% 17% 29% -7% 3% 3% 5% 3% 1% 15% 19% 33% 25% 5% -18% 3% 3%
Other Dairy 20% 5% -23% -5% 0% 0% 0% 0% 14% 25% 24% -10% -15% -31% -5% -5%
Others -83% 37% 74% 83% 10% 10% 5% 5% 5% 34% 40% 63% 85% 28% 132% 5% 12%
Tnuva
Total Revenue 17% 18% 25% -5% 3% 4% 4% 3% 2% 16% 17% 15% 21% 33% 19% 2% -11% 2% 3%
Gross Profit
Liquid milk 17% 28% -4% 5% 3% 5% 3% 1% 15% 63% 32% -10% 7% -15% 5% 5%
Other Dairy 28% -13% 6% 7% 0% 0% 0% 0% 35% 273% -6% -76% -22% 56% 32% -15%
Others -11% 75% 38% 27% 18% 11% 11% 11% 60% -1257% 17% -113% -4% 50% 498% 38%
Tnuva
Total Gross Profit 25% 17% 25% -2% 6% 4% 5% 3% 2% 23% 22% 18% 17% 27% 22% 4% -8% 14% 6%
Margins 1H12 2H12 1H13 2H13 1H14 2H14 1H15 2H15 1H16E 2H16E
Gross Profit
Liquid milk 42.0% 42.0% 41.6% 42.9% 43.6% 43.6% 43.5% 43.5% 43.5% 42.7% 41.3% 42.8% 56.7% 42.4% 40.9% 43.3% 42.4% 44.1% 43.0%
Other Dairy 14.1% 15.0% 12.4% 17.0% 19.2% 19.2% 19.2% 19.2% 19.2% 16.7% 11.7% 19.8% 35.1% 15.0% 9.5% 13.8% 21.4% 19.2% 19.2%
Others 29.6% 19.3% 19.5% 14.7% 17.0% 18.2% 19.2% 20.3% 21.4% 10.7% 49.1% 12.8% -406.5% 9.3% 28.4% 6.9% 18.4% 39.4% 22.7%
Tnuva
Group GPM 35.1% 34.7% 34.6% 35.6% 36.8% 36.9% 37.0% 37.2% 37.3% 35.5% 34.8% 36.2% 33.5% 34.7% 34.5% 35.5% 35.7% 39.7% 36.5%
Consolidated P/L (HK mn) FY12 FY13 FY14 FY15 FY16E FY17E FY18E FY19E FY20E 15-'17 2yr CAGR 1H12 2H12 1H13 2H13 1H14 2H14 1H15 2H15 1H16E 2H16E
Revenue 13,775 16,291 20,385 19,373 19,885 20,606 21,464 22,086 22,420 3.1% 6,461 7,314 7,443 8,848 9,872 10,513 10,061 9,312 10,249 9,636
COGS -8,938 -10,630 -13,331 -12,474 -12,568 -13,011 -13,516 -13,873 -14,057 -4,167 -4,771 -4,747 -5,884 -6,446 -6,885 -6,485 -5,989 -6,183 -6,122
GP 4,837 5,660 7,054 6,899 7,317 7,595 7,949 8,213 8,363 2,294 2,543 2,697 2,964 3,426 3,628 3,576 3,323 4,066 3,514 SG&A (excl. other rev/exp) -4,262 -4,894 -6,050 -6,074 -6,478 -6,713 -7,035 -7,239 -7,349 -2,115 -2,146 -2,412 -2,483 -3,052 -2,998 -3,222 -2,852 -3,530 -2,948
Sales tax - - - - - - - - -
Selling Exp. -3,820 -4,410 -5,469 -5,392 -5,777 -5,987 -6,279 -6,461 -6,559 -1,915 -1,904 -2,186 -2,224 -2,785 -2,684 -2,956 -2,435 -3,217 -2,560
Admin Exp. -442 -484 -581 -683 -701 -726 -756 -778 -790 -200 -242 -226 -258 -266 -314 -266 -417 -313 -387
OP 576 766 1,005 825 839 883 913 974 1,014 3.4% 179 397 285 481 374 630 354 471 536 566Other income/expenses (88) (19) (142) (16) (26) (26) (26) (26) (26) -51 -110 -13 -5 -38 -104 -7 -10 -24 -2
EBIT (reported) 487 747 863 809 813 857 887 948 988 2.9% 128 286 271 476 337 526 347 462 512 564D&A (323) (325) (406) (538) (609) (640) (634) (628) (650) -156 -167 -160 -165 -181 -225 -406 -132 -227 -
EBITDA 811 1,072 1,269 1,347 1,422 1,497 1,521 1,576 1,639 5.4% 285 453 431 641 518 751 753 329 739 564
Net Finance Exp. -65 -53 -78 -140 -91 -93 -92 -91 -97 -45 -19 -33 -21 -16 -62 -56 -83 -55 -37
Other Non-Op Income 69 98 16 36 36 36 36 36 36 14 55 -20 34 -22 -48 -28 64 -49 -179
Profit Before Tax 492 792 800 705 758 800 832 893 927 6.5% 97 322 219 489 298 416 263 442 409 349
Tax -84 -234 -131 -209 -212 -216 -208 -223 -232 4 -88 -63 -170 -58 -73 -36 -172 -116 -96
Minority Interest -24 -68 -15 -78 -90 -96 -103 -110 -114 -4 -20 -8 -61 -31 16 -26 -52 -70 -20
NPAT Attributable to S/holders 384 490 654 418 456 488 521 560 581 8.0% 97 215 148 258 209 359 201 217 223 233
One-off's after tax
Recurring NPAT 384 490 654 418 456 488 521 560 581 8.0% 97 215 148 258 209 359 201 217 223 233
WA Shares - Basic 1,137 1,224 1,228 1,231 1,231 1,231 1,231 1,231 1,231
WA Shares - Diluted 1,225 1,224 1,231 1,231 1,231 1,231 1,231 1,231 1,231
EPS - Basic (Rmb/Sh) 0.27 0.33 0.46 0.34 0.37 0.40 0.42 0.45 0.47 0.09 0.18 0.12 0.21 0.17 0.29 0.16 0.18 0.18 0.19
EPS - Diluted (Rmb/Sh) 0.25 0.33 0.46 0.34 0.37 0.40 0.42 0.45 0.47 8.0%
Growth
Sales 17% 18% 25.1% -5.0% 3% 4% 4% 3% 2% 16% 17% 15% 21% 33% 19% 2% -11% 2% 3%
GP 23% 17% 25% -2% 6% 4% 5% 3% 2% 23% 22% 18% 17% 27% 22% 4% -8% 14% 6%
SG&A 18% 15% 24% 0% 7% 4% 5% 3% 2% 20% 17% 14% 16% 27% 21% 6% -5% 10% 3%
Operating profit (GP less SG&A) 68% 33% 31% -18% 2% 5% 3% 7% 4% 83% 62% 59% 21% 32% 31% -5% -25% 51% 20%
EBIT 60% 53% 15% -6% 1% 5% 4% 7% 4% 104% 60% 111% 66% 24% 10% 3% -12% 48% 22%
Recurring NPAT 27% 27% 34% -36% 9% 7% 7% 7% 4% 32% 30% 53% 20% 41% 39% -4% -39% 11% 7%
Margins
GP margin 35.1% 34.7% 34.6% 35.6% 36.8% 36.9% 37.0% 37.2% 37.3% 35.5% 34.8% 36.2% 33.5% 34.7% 34.5% 35.5% 35.7% 39.7% 36.5%
Operating profit (GP less SG&A) 4.2% 4.7% 4.9% 4.3% 4.2% 95.2% 4.3% 4.4% 4.5% 2.8% 5.4% 3.8% 5.4% 3.8% 6.0% 3.5% 5.1% 5.2% 5.9%
EBIT margin 3.5% 4.6% 4.2% 4.2% 4.1% 4.2% 4.1% 4.3% 4.4% 2.0% 3.9% 3.6% 5.4% 3.4% 5.0% 3.4% 5.0% 5.0% 5.9%
Recurring NPAT margin 2.8% 3.0% 3.2% 2.2% 2.3% 2.4% 2.4% 2.5% 2.6% 1.5% 2.9% 2.0% 2.9% 2.1% 3.4% 2.0% 2.3% 2.2% 2.4%
SG&A/Sales -30.9% -30.0% -29.7% -31.4% -32.6% -32.6% -32.8% -32.8% -32.8% -32.7% -29.3% -32.4% -28.1% -30.9% -28.5% -32.0% -30.6% -34.4% -30.6%
Effective Tax Rate -17% -30% -16% -30% -28% -27% -25% -25% -25% 4% -27% -29% -35% -19% -18% -14% -39% -28% -28%

August 13, 2016 China: Consumer Staples
Goldman Sachs Global Investment Research 61
Exhibit 119: Bright Dairy Summary Financials
Source: Goldman Sachs Global Investment Research
Profit model (Rmb mn) 12/15 12/16E 12/17E 12/18E Balance sheet (Rmb mn) 12/15 12/16E 12/17E 12/18E
Total revenue 19,373.2 19,885.0 20,606.0 21,464.4 Cash & equivalents 3,319.5 2,722.3 2,263.4 1,818.9
Cost of goods sold (12,474.0) (12,568.2) (13,010.5) (13,515.7) Accounts receivable 1,754.2 1,855.0 1,922.2 2,002.3
SG&A (6,074.2) (6,478.0) (6,712.9) (7,035.5) Inventory 1,852.8 1,866.8 1,896.9 1,933.5
R&D 0.0 0.0 0.0 0.0 Other current assets 628.2 628.2 628.2 628.2
Other operating profit/(expense) (16.4) (25.8) (25.8) (25.8) Total current assets 7,554.7 7,072.3 6,710.7 6,382.9
EBITDA 1,346.5 1,421.8 1,497.0 1,520.9 Net PP&E 5,925.1 6,454.2 6,951.5 7,459.5
Depreciation & amortization (537.8) (608.8) (640.3) (633.5) Net intangibles 532.7 519.2 505.7 492.1
EBIT 808.7 813.0 856.7 887.4 Total investments 69.4 69.4 69.4 69.4
Interest income 53.4 49.8 40.8 34.0 Other long-term assets 1,364.9 1,834.5 2,311.3 2,796.9
Interest expense (193.1) (141.2) (133.6) (126.0) Total assets 15,446.8 15,949.6 16,548.6 17,200.8
Income/(loss) from uncons. subs. (0.3) 0.0 0.0 0.0
Others 36.2 36.2 36.2 36.2 Accounts payable 4,765.6 4,870.5 5,113.2 5,385.8
Pretax profits 704.9 757.8 800.2 831.6 Short-term debt 1,441.4 1,441.4 1,441.4 1,441.4
Income tax (208.8) (212.2) (216.0) (207.9) Other current liabilities 862.8 862.8 862.8 862.8
Minorities (77.8) (89.8) (96.1) (102.7) Total current liabilities 7,069.9 7,174.7 7,417.4 7,690.0
Long-term debt 1,088.8 1,088.8 1,088.8 1,088.8
Net income pre-preferred dividends 418.3 455.8 488.0 521.0 Other long-term liabilities 2,025.0 2,025.0 2,025.0 2,025.0
Preferred dividends 0.0 0.0 0.0 0.0 Total long-term liabilities 3,113.8 3,113.8 3,113.8 3,113.8
Net income (pre-exceptionals) 418.3 455.8 488.0 521.0 Total liabilities 10,183.7 10,288.5 10,531.2 10,803.8
Post-tax exceptionals 18.2 18.6 18.9 19.4
Net income 436.5 474.4 506.8 540.4 Preferred shares 0.0 0.0 0.0 0.0
Total common equity 4,538.6 4,846.7 5,106.8 5,383.8
EPS (basic, pre-except) (Rmb) 0.34 0.37 0.40 0.42 Minority interest 724.6 814.4 910.5 1,013.2
EPS (basic, post-except) (Rmb) 0.35 0.39 0.41 0.44
EPS (diluted, post-except) (Rmb) 0.35 0.39 0.41 0.44 Total liabilities & equity 15,446.8 15,949.6 16,548.6 17,200.8
DPS (Rmb) 0.12 0.19 0.20 0.21
Dividend payout ratio (%) 33.8 48.0 48.1 48.2 BVPS (Rmb) 3.69 3.94 4.15 4.37
Free cash flow yield (%) (1.3) (2.3) (1.2) (1.0)
Growth & margins (%) 12/15 12/16E 12/17E 12/18E Ratios 12/15 12/16E 12/17E 12/18E
Sales growth (5.0) 2.6 3.6 4.2 ROE (%) 9.6 10.1 10.2 10.3
EBITDA growth 13.9 5.6 5.3 1.6 ROA (%) 3.1 3.0 3.1 3.2
EBIT growth 4.1 0.5 5.4 3.6 CROCI (%) 15.2 12.0 11.4 10.6
Net income growth (26.3) 9.0 7.1 6.8 Inventory days 56.8 54.0 52.8 51.7
EPS growth (34.4) 8.7 6.8 6.6 Receivables days 33.3 33.1 33.5 33.4
Gross margin 35.6 36.8 36.9 37.0 Payable days 130.0 139.9 140.0 141.8
EBITDA margin 7.0 7.2 7.3 7.1 Net debt/equity (%) (15.0) (3.4) 4.4 11.1
EBIT margin 4.2 4.1 4.2 4.1 Interest cover - EBIT (X) 5.8 8.9 9.2 9.6
Valuation 12/15 12/16E 12/17E 12/18E
Cash flow statement (Rmb mn) 12/15 12/16E 12/17E 12/18E
Net income pre-preferred dividends 418.3 455.8 488.0 521.0 P/E (analyst) (X) 51.0 39.3 36.8 34.5
D&A add-back 537.8 608.8 640.3 633.5 P/B (X) 4.9 3.8 3.7 3.5
Minorities interests add-back 77.8 89.8 96.1 102.7 EV/EBITDA (X) 16.5 13.6 13.2 13.4
Net (inc)/dec working capital 296.0 (10.0) 145.4 155.9 Dividend yield (%) 0.7 1.2 1.3 1.4
Other operating cash flow 536.4 0.0 0.0 0.0
Cash flow from operations 1,866.4 1,144.5 1,369.8 1,413.1
Capital expenditures (2,166.0) (1,594.0) (1,600.9) (1,613.5)
Acquisitions 70.3 0.0 0.0 0.0
Divestitures 70.3 0.0 0.0 0.0
Others (2.4) 0.0 0.0 0.0
Cash flow from investments (2,027.8) (1,594.0) (1,600.9) (1,613.5)
Dividends paid (common & pref) (344.6) (147.7) (227.9) (244.0)
Inc/(dec) in debt 1,915.4 0.0 0.0 0.0
Common stock issuance (repurchase) 2.5 0.0 0.0 0.0
Other financing cash flows (156.6) 0.0 0.0 0.0
Cash flow from financing 1,416.7 (147.7) (227.9) (244.0)
Total cash flow 1,282.5 (597.2) (459.0) (444.4) Note: Last actual year may include reported and estimated data.
Source: Company data, Goldman Sachs Research estimates.
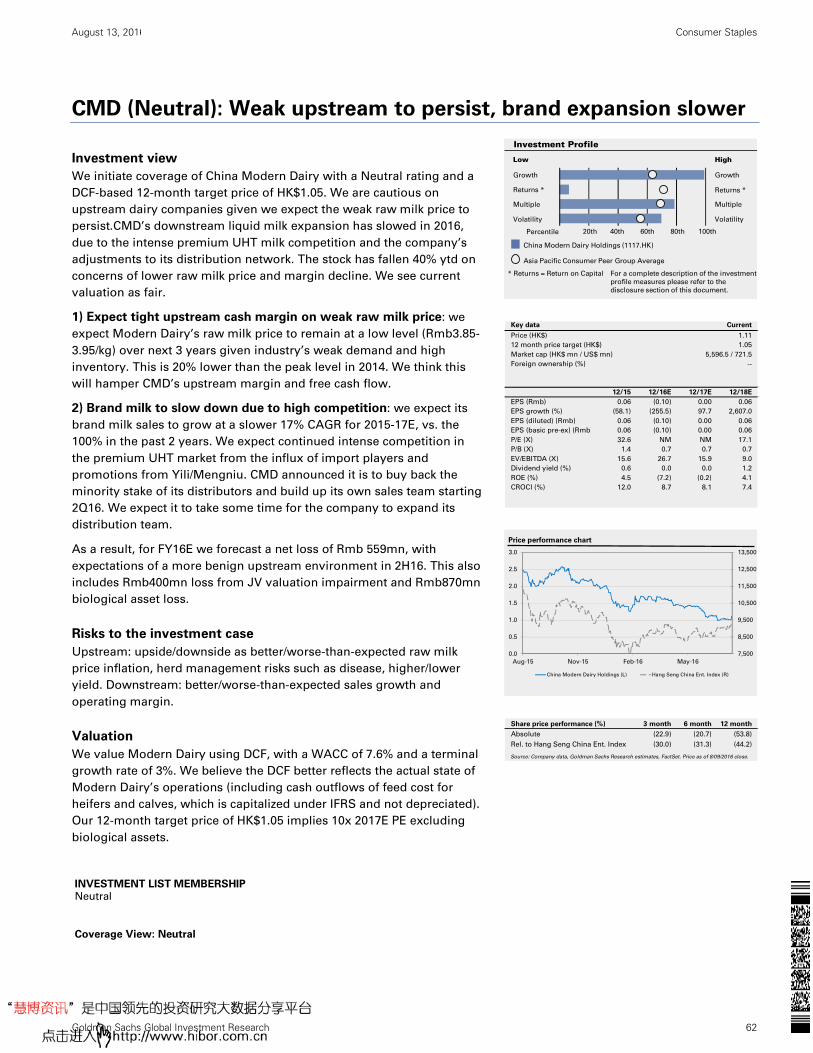
August 13, 2016 China: Consumer Staples
Goldman Sachs Global Investment Research 62
CMD (Neutral): Weak upstream to persist, brand expansion slower
Investment view
We initiate coverage of China Modern Dairy with a Neutral rating and a
DCF-based 12-month target price of HK$1.05. We are cautious on
upstream dairy companies given we expect the weak raw milk price to
persist.CMD’s downstream liquid milk expansion has slowed in 2016,
due to the intense premium UHT milk competition and the company’s
adjustments to its distribution network. The stock has fallen 40% ytd on
concerns of lower raw milk price and margin decline. We see current
valuation as fair.
1) Expect tight upstream cash margin on weak raw milk price: we
expect Modern Dairy’s raw milk price to remain at a low level (Rmb3.85-
3.95/kg) over next 3 years given industry’s weak demand and high
inventory. This is 20% lower than the peak level in 2014. We think this
will hamper CMD’s upstream margin and free cash flow.
2) Brand milk to slow down due to high competition: we expect its
brand milk sales to grow at a slower 17% CAGR for 2015-17E, vs. the
100% in the past 2 years. We expect continued intense competition in
the premium UHT market from the influx of import players and
promotions from Yili/Mengniu. CMD announced it is to buy back the
minority stake of its distributors and build up its own sales team starting
2Q16. We expect it to take some time for the company to expand its
distribution team.
As a result, for FY16E we forecast a net loss of Rmb 559mn, with
expectations of a more benign upstream environment in 2H16. This also
includes Rmb400mn loss from JV valuation impairment and Rmb870mn
biological asset loss.
Risks to the investment case
Upstream: upside/downside as better/worse-than-expected raw milk
price inflation, herd management risks such as disease, higher/lower
yield. Downstream: better/worse-than-expected sales growth and
operating margin.
Valuation
We value Modern Dairy using DCF, with a WACC of 7.6% and a terminal
growth rate of 3%. We believe the DCF better reflects the actual state of
Modern Dairy’s operations (including cash outflows of feed cost for
heifers and calves, which is capitalized under IFRS and not depreciated).
Our 12-month target price of HK$1.05 implies 10x 2017E PE excluding
biological assets.
INVESTMENT LIST MEMBERSHIP
Neutral
Coverage View: Neutral
Growth
Returns *
Multiple
Volatility Volatility
Multiple
Returns *
Growth
Investment Profile
Low High
Percentile 20th 40th 60th 80th 100th
* Returns = Return on Capital For a complete description of the investment
profile measures please refer to the
disclosure section of this document.
China Modern Dairy Holdings (1117.HK)
Asia Pacific Consumer Peer Group Average
Key data Current
Price (HK$) 1.11
12 month price target (HK$) 1.05
Market cap (HK$ mn / US$ mn) 5,596.5 / 721.5
Foreign ownership (%) --
12/15 12/16E 12/17E 12/18E
EPS (Rmb) 0.06 (0.10) 0.00 0.06
EPS growth (%) (58.1) (255.5) 97.7 2,607.0
EPS (diluted) (Rmb) 0.06 (0.10) 0.00 0.06
EPS (basic pre-ex) (Rmb) 0.06 (0.10) 0.00 0.06
P/E (X) 32.6 NM NM 17.1
P/B (X) 1.4 0.7 0.7 0.7
EV/EBITDA (X) 15.6 26.7 15.9 9.0
Dividend yield (%) 0.6 0.0 0.0 1.2
ROE (%) 4.5 (7.2) (0.2) 4.1
CROCI (%) 12.0 8.7 8.1 7.4
7,500
8,500
9,500
10,500
11,500
12,500
13,500
0.0
0.5
1.0
1.5
2.0
2.5
3.0
Aug-15 Nov-15 Feb-16 May-16
Price performance chart
China Modern Dairy Holdings (L) Hang Seng China Ent. Index (R)
Share price performance (%) 3 month 6 month 12 month
Absolute (22.9) (20.7) (53.8)
Rel. to Hang Seng China Ent. Index (30.0) (31.3) (44.2)
Source: Company data, Goldman Sachs Research estimates, FactSet. Price as of 8/09/2016 close.
August 13, 2016 China: Consumer Staples
Goldman Sachs Global Investment Research 63
Financials
Income Statement
Sales: we expect a 7% sales fall in 2016 followed by 10% rebound in 2017E. The fall is
mainly due to lower sales volume in the upstream dairy farm segment as the company has
had to pour raw milk into milk powder inventory. For its brand milk business, we see
slower expansion in 2016, but still expect double digit CAGR over the next three years as
the company further expands its POS after it consolidated its distributors.
Margin: we expect the raw milk ASP to fall 10% yoy in 2016 but more or less stabilize in
2017. This drives our estimates of 430bps OPM decline in 2016.
Balance Sheet
Gearing: expect slight decline of gearing ratio due to slower capex but it is still high at 58%
over the next three years.
ROE and CROCI: We expect returns to decrease further as profitability declines.
Cash Flow Statement
Capex: expect total Rmb1.4bn/year capex over 2016-18E, slower than Rmb2bn in the past
two years, due to 1) slower dairy farm expansion, 2) high culling rate of cows to generate
cash flow.
FCF: despite the sharp capex reduction, we see limited positive free cash flow over the next
two years, due to the lower profit margin and working capital drag from higher inventory.
Key risks to our rating, TP and earnings estimates
Higher/lower than expected raw milk price: we expect a more stabilized raw milk price
after 2017E, but higher or lower price will have significant impact on the company’s
upstream margin.
Stronger/weaker than expected brand milk sales: the company has consolidated its
distributors and started to build up its own sales team. The stronger or weaker brand milk
performance will have impact on company’s free cash flow and profit margin.

August 13, 2016 China: Consumer Staples
Goldman Sachs Global Investment Research 64
Exhibit 120: Global Raw Milk still trading at a discount to
China milk Global and China Raw Milk Price
Exhibit 121: China Milk Powder import experienced a
strong rebound since late 2014 China Milk Powder Import
Source: Ministry of Agriculture
Source: Bloomberg
Exhibit 122: China Milk Powder imports have rebounded
strongly since late 2014 China Liquid milk Import
Exhibit 123: We expect Modern dairy to see -7% sales in
2016E Modern dairy Sales Forecast
Source: Wind
Source: Goldman Sachs Global Investment Research
1.00
1.50
2.00
2.50
3.00
3.50
4.00
4.50
5.00
5.50
6.00China raw milk price (Rmb/Kg)
NZ WMP equivalent price (auction only)
NZ WMP equivalent price (auction plus transport, VAT)
-100%
-50%
0%
50%
100%
150%
200%
-
20
40
60
80
100
120
140
160
180
Import milk powder volume ('000 ton) Yoy growth (%)
-
500
1,000
1,500
2,000
2,500
3,000
-
10.0
20.0
30.0
40.0
50.0
60.0
70.0
80.0
Import liquid milk volume ('000 ton) Import price (US$/ton)
4,826.3 4,477.5
4,920.5
5,549.5
‐4%
‐7%
10%
13%
‐10%
‐5%
0%
5%
10%
15%
0
1,000
2,000
3,000
4,000
5,000
6,000
2015 2016E 2017E 2018E
Modern Dairy Sales (Rmb mn)
Revenue YoY Growth %
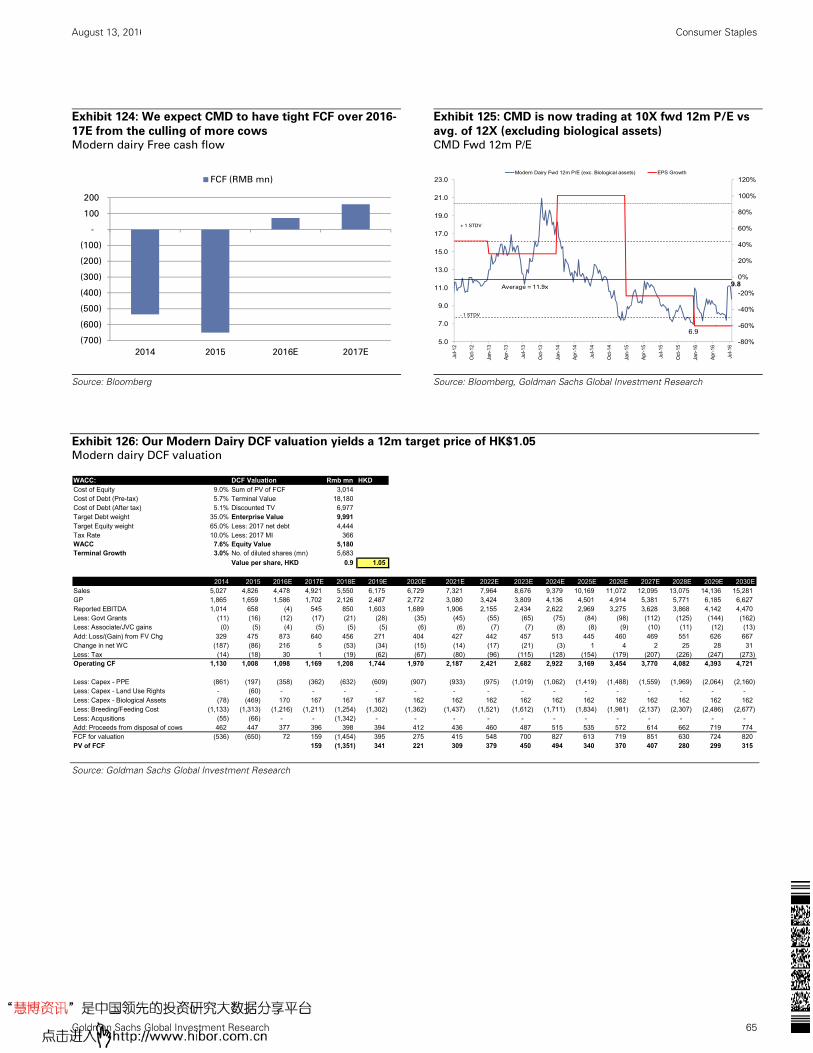
August 13, 2016 China: Consumer Staples
Goldman Sachs Global Investment Research 65
Exhibit 124: We expect CMD to have tight FCF over 2016-
17E from the culling of more cows Modern dairy Free cash flow
Exhibit 125: CMD is now trading at 10X fwd 12m P/E vs
avg. of 12X (excluding biological assets) CMD Fwd 12m P/E
Source: Bloomberg
Source: Bloomberg, Goldman Sachs Global Investment Research
Exhibit 126: Our Modern Dairy DCF valuation yields a 12m target price of HK$1.05 Modern dairy DCF valuation
Source: Goldman Sachs Global Investment Research
(700)
(600)
(500)
(400)
(300)
(200)
(100)
-
100
200
2014 2015 2016E 2017E
FCF (RMB mn)
6.9
9.8
-80%
-60%
-40%
-20%
0%
20%
40%
60%
80%
100%
120%
5.0
7.0
9.0
11.0
13.0
15.0
17.0
19.0
21.0
23.0
Jul-1
2
Oct
-12
Jan-
13
Apr
-13
Jul-1
3
Oct
-13
Jan-
14
Apr
-14
Jul-1
4
Oct
-14
Jan-
15
Apr
-15
Jul-1
5
Oct
-15
Jan-
16
Apr
-16
Jul-1
6
Modern Dairy Fwd 12m P/E (exc. Biological assets) EPS Growth
+ 1 STDV
- 1 STDV
Average = 11.9x
WACC: DCF Valuation Rmb mn HKDCost of Equity 9.0% Sum of PV of FCF 3,014 Cost of Debt (Pre-tax) 5.7% Terminal Value 18,180 Cost of Debt (After tax) 5.1% Discounted TV 6,977 Target Debt weight 35.0% Enterprise Value 9,991 Target Equity weight 65.0% Less: 2017 net debt 4,444 Tax Rate 10.0% Less: 2017 MI 366 WACC 7.6% Equity Value 5,180 Terminal Growth 3.0% No. of diluted shares (mn) 5,683
Value per share, HKD 0.9 1.05
=L72*L86 2014 2015 2016E 2017E 2018E 2019E 2020E 2021E 2022E 2023E 2024E 2025E 2026E 2027E 2028E 2029E 2030ESales 5,027 4,826 4,478 4,921 5,550 6,175 6,729 7,321 7,964 8,676 9,379 10,169 11,072 12,095 13,075 14,136 15,281 GP 1,865 1,659 1,586 1,702 2,126 2,487 2,772 3,080 3,424 3,809 4,136 4,501 4,914 5,381 5,771 6,185 6,627 Reported EBITDA 1,014 658 (4) 545 850 1,603 1,689 1,906 2,155 2,434 2,622 2,969 3,275 3,628 3,868 4,142 4,470 Less: Govt Grants (11) (16) (12) (17) (21) (28) (35) (45) (55) (65) (75) (84) (98) (112) (125) (144) (162) Less: Associate/JVC gains (0) (5) (4) (5) (5) (5) (6) (6) (7) (7) (8) (8) (9) (10) (11) (12) (13) Add: Loss/(Gain) from FV Chg 329 475 873 640 456 271 404 427 442 457 513 445 460 469 551 626 667 Change in net WC (187) (86) 216 5 (53) (34) (15) (14) (17) (21) (3) 1 4 2 25 28 31 Less: Tax (14) (18) 30 1 (19) (62) (67) (80) (96) (115) (128) (154) (179) (207) (226) (247) (273) Operating CF 1,130 1,008 1,098 1,169 1,208 1,744 1,970 2,187 2,421 2,682 2,922 3,169 3,454 3,770 4,082 4,393 4,721
Less: Capex - PPE (861) (197) (358) (362) (632) (609) (907) (933) (975) (1,019) (1,062) (1,419) (1,488) (1,559) (1,969) (2,064) (2,160) Less: Capex - Land Use Rights - (60) - - - - - - - - - - - - - - - Less: Capex - Biological Assets (78) (469) 170 167 167 167 162 162 162 162 162 162 162 162 162 162 162 Less: Breeding/Feeding Cost (1,133) (1,313) (1,216) (1,211) (1,254) (1,302) (1,362) (1,437) (1,521) (1,612) (1,711) (1,834) (1,981) (2,137) (2,307) (2,486) (2,677) Less: Acqusitions (55) (66) - - (1,342) - - - - - - - - - - - - Add: Proceeds from disposal of cows 462 447 377 396 398 394 412 436 460 487 515 535 572 614 662 719 774 FCF for valuation (536) (650) 72 159 (1,454) 395 275 415 548 700 827 613 719 851 630 724 820 PV of FCF 159 (1,351) 341 221 309 379 450 494 340 370 407 280 299 315
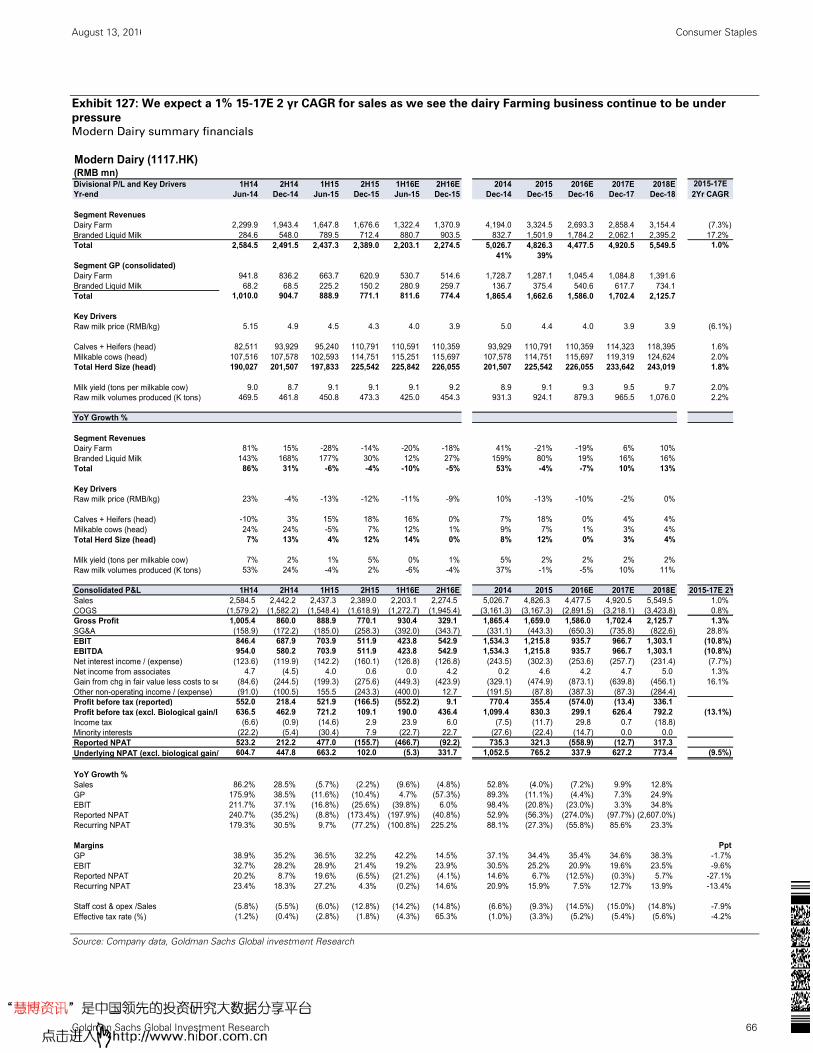
August 13, 2016 China: Consumer Staples
Goldman Sachs Global Investment Research 66
Exhibit 127: We expect a 1% 15-17E 2 yr CAGR for sales as we see the dairy Farming business continue to be under
pressure Modern Dairy summary financials
Source: Company data, Goldman Sachs Global investment Research
Modern Dairy (1117.HK)(RMB mn)Divisional P/L and Key Drivers 1H14 2H14 1H15 2H15 1H16E 2H16E 2014 2015 2016E 2017E 2018EYr-end Jun-14 Dec-14 Jun-15 Dec-15 Jun-15 Dec-15 Dec-14 Dec-15 Dec-16 Dec-17 Dec-18
Segment RevenuesDairy Farm 2,299.9 1,943.4 1,647.8 1,676.6 1,322.4 1,370.9 4,194.0 3,324.5 2,693.3 2,858.4 3,154.4 (7.3%)Branded Liquid Milk 284.6 548.0 789.5 712.4 880.7 903.5 832.7 1,501.9 1,784.2 2,062.1 2,395.2 17.2%Total 2,584.5 2,491.5 2,437.3 2,389.0 2,203.1 2,274.5 5,026.7 4,826.3 4,477.5 4,920.5 5,549.5 1.0%
41% 39%Segment GP (consolidated)Dairy Farm 941.8 836.2 663.7 620.9 530.7 514.6 1,728.7 1,287.1 1,045.4 1,084.8 1,391.6Branded Liquid Milk 68.2 68.5 225.2 150.2 280.9 259.7 136.7 375.4 540.6 617.7 734.1Total 1,010.0 904.7 888.9 771.1 811.6 774.4 1,865.4 1,662.6 1,586.0 1,702.4 2,125.7
Key DriversRaw milk price (RMB/kg) 5.15 4.9 4.5 4.3 4.0 3.9 5.0 4.4 4.0 3.9 3.9 (6.1%)
Calves + Heifers (head) 82,511 93,929 95,240 110,791 110,591 110,359 93,929 110,791 110,359 114,323 118,395 1.6%Milkable cows (head) 107,516 107,578 102,593 114,751 115,251 115,697 107,578 114,751 115,697 119,319 124,624 2.0%Total Herd Size (head) 190,027 201,507 197,833 225,542 225,842 226,055 201,507 225,542 226,055 233,642 243,019 1.8%
Milk yield (tons per milkable cow) 9.0 8.7 9.1 9.1 9.1 9.2 8.9 9.1 9.3 9.5 9.7 2.0%Raw milk volumes produced (K tons) 469.5 461.8 450.8 473.3 425.0 454.3 931.3 924.1 879.3 965.5 1,076.0 2.2%
YoY Growth %
Segment RevenuesDairy Farm 81% 15% -28% -14% -20% -18% 41% -21% -19% 6% 10%Branded Liquid Milk 143% 168% 177% 30% 12% 27% 159% 80% 19% 16% 16%Total 86% 31% -6% -4% -10% -5% 53% -4% -7% 10% 13%
Key DriversRaw milk price (RMB/kg) 23% -4% -13% -12% -11% -9% 10% -13% -10% -2% 0%
Calves + Heifers (head) -10% 3% 15% 18% 16% 0% 7% 18% 0% 4% 4%Milkable cows (head) 24% 24% -5% 7% 12% 1% 9% 7% 1% 3% 4%Total Herd Size (head) 7% 13% 4% 12% 14% 0% 8% 12% 0% 3% 4%
Milk yield (tons per milkable cow) 7% 2% 1% 5% 0% 1% 5% 2% 2% 2% 2%Raw milk volumes produced (K tons) 53% 24% -4% 2% -6% -4% 37% -1% -5% 10% 11%
Consolidated P&L 1H14 2H14 1H15 2H15 1H16E 2H16E 2014 2015 2016E 2017E 2018E 2015-17E 2YSales 2,584.5 2,442.2 2,437.3 2,389.0 2,203.1 2,274.5 5,026.7 4,826.3 4,477.5 4,920.5 5,549.5 1.0%COGS (1,579.2) (1,582.2) (1,548.4) (1,618.9) (1,272.7) (1,945.4) (3,161.3) (3,167.3) (2,891.5) (3,218.1) (3,423.8) 0.8%Gross Profit 1,005.4 860.0 888.9 770.1 930.4 329.1 1,865.4 1,659.0 1,586.0 1,702.4 2,125.7 1.3%SG&A (158.9) (172.2) (185.0) (258.3) (392.0) (343.7) (331.1) (443.3) (650.3) (735.8) (822.6) 28.8%EBIT 846.4 687.9 703.9 511.9 423.8 542.9 1,534.3 1,215.8 935.7 966.7 1,303.1 (10.8%)EBITDA 954.0 580.2 703.9 511.9 423.8 542.9 1,534.3 1,215.8 935.7 966.7 1,303.1 (10.8%)Net interest income / (expense) (123.6) (119.9) (142.2) (160.1) (126.8) (126.8) (243.5) (302.3) (253.6) (257.7) (231.4) (7.7%)Net income from associates 4.7 (4.5) 4.0 0.6 0.0 4.2 0.2 4.6 4.2 4.7 5.0 1.3%Gain from chg in fair value less costs to se (84.6) (244.5) (199.3) (275.6) (449.3) (423.9) (329.1) (474.9) (873.1) (639.8) (456.1) 16.1%Other non-operating income / (expense) (91.0) (100.5) 155.5 (243.3) (400.0) 12.7 (191.5) (87.8) (387.3) (87.3) (284.4)Profit before tax (reported) 552.0 218.4 521.9 (166.5) (552.2) 9.1 770.4 355.4 (574.0) (13.4) 336.1Profit before tax (excl. Biological gain/lo 636.5 462.9 721.2 109.1 190.0 436.4 1,099.4 830.3 299.1 626.4 792.2 (13.1%)Income tax (6.6) (0.9) (14.6) 2.9 23.9 6.0 (7.5) (11.7) 29.8 0.7 (18.8)Minority interests (22.2) (5.4) (30.4) 7.9 (22.7) 22.7 (27.6) (22.4) (14.7) 0.0 0.0Reported NPAT 523.2 212.2 477.0 (155.7) (466.7) (92.2) 735.3 321.3 (558.9) (12.7) 317.3Underlying NPAT (excl. biological gain/ 604.7 447.8 663.2 102.0 (5.3) 331.7 1,052.5 765.2 337.9 627.2 773.4 (9.5%)
YoY Growth %Sales 86.2% 28.5% (5.7%) (2.2%) (9.6%) (4.8%) 52.8% (4.0%) (7.2%) 9.9% 12.8%GP 175.9% 38.5% (11.6%) (10.4%) 4.7% (57.3%) 89.3% (11.1%) (4.4%) 7.3% 24.9%EBIT 211.7% 37.1% (16.8%) (25.6%) (39.8%) 6.0% 98.4% (20.8%) (23.0%) 3.3% 34.8%Reported NPAT 240.7% (35.2%) (8.8%) (173.4%) (197.9%) (40.8%) 52.9% (56.3%) (274.0%) (97.7%) (2,607.0%)Recurring NPAT 179.3% 30.5% 9.7% (77.2%) (100.8%) 225.2% 88.1% (27.3%) (55.8%) 85.6% 23.3%
Margins PptGP 38.9% 35.2% 36.5% 32.2% 42.2% 14.5% 37.1% 34.4% 35.4% 34.6% 38.3% -1.7%EBIT 32.7% 28.2% 28.9% 21.4% 19.2% 23.9% 30.5% 25.2% 20.9% 19.6% 23.5% -9.6%Reported NPAT 20.2% 8.7% 19.6% (6.5%) (21.2%) (4.1%) 14.6% 6.7% (12.5%) (0.3%) 5.7% -27.1%Recurring NPAT 23.4% 18.3% 27.2% 4.3% (0.2%) 14.6% 20.9% 15.9% 7.5% 12.7% 13.9% -13.4%
Staff cost & opex /Sales (5.8%) (5.5%) (6.0%) (12.8%) (14.2%) (14.8%) (6.6%) (9.3%) (14.5%) (15.0%) (14.8%) -7.9%Effective tax rate (%) (1.2%) (0.4%) (2.8%) (1.8%) (4.3%) 65.3% (1.0%) (3.3%) (5.2%) (5.4%) (5.6%) -4.2%
2015-17E 2Yr CAGR

August 13, 2016 China: Consumer Staples
Goldman Sachs Global Investment Research 67
Exhibit 128: Modern Dairy Summary Financials
Note: Numbers include Biological Assets gains/losses.
Source: Goldman Sachs Global Investment Research
Profit model (Rmb mn) 12/15 12/16E 12/17E 12/18E Balance sheet (Rmb mn) 12/15 12/16E 12/17E 12/18E
Total revenue 4,826.3 4,477.5 4,920.5 5,549.5 Cash & equivalents 833.6 1,780.0 794.4 579.2
Cost of goods sold (3,167.3) (2,891.5) (3,218.1) (3,423.8) Accounts receivable 1,097.8 895.8 984.4 1,110.2
SG&A (925.7) (1,523.4) (1,375.6) (1,278.7) Inventory 834.1 877.2 945.8 998.9
R&D 0.0 0.0 0.0 0.0 Other current assets 187.4 187.3 187.3 187.2
Other operating profit/(expense) 0.0 0.0 0.0 0.0 Total current assets 2,952.9 3,740.3 2,911.8 2,875.6
EBITDA 1,008.5 378.8 627.5 1,129.7 Net PP&E 12,967.8 12,745.4 12,755.4 13,277.7
Depreciation & amortization (275.2) (316.2) (300.6) (282.7) Net intangibles 1,441.5 1,441.5 1,441.5 1,441.5
EBIT 733.3 62.6 326.9 847.0 Total investments 25.1 157.3 162.0 167.0
Interest income 12.8 25.4 0.0 0.0 Other long-term assets 120.6 118.1 115.7 113.4
Interest expense (315.1) (279.0) (257.7) (231.4) Total assets 17,507.8 18,202.6 17,386.4 17,875.1
Income/(loss) from uncons. subs. 4.6 4.2 4.7 5.0
Others (80.2) (387.3) (87.3) (284.4) Accounts payable 2,013.0 2,070.4 2,232.3 2,357.8
Pretax profits 355.4 (574.0) (13.4) 336.1 Short-term debt 5,225.5 3,238.9 2,172.3 2,154.6
Income tax (11.7) 29.8 0.7 (18.8) Other current liabilities 0.3 16.2 19.9 27.2
Minorities (22.4) (14.7) 0.0 0.0 Total current liabilities 7,238.8 5,325.4 4,424.6 4,539.7
Long-term debt 821.7 3,110.9 3,066.5 3,039.9
Net income pre-preferred dividends 321.3 (558.9) (12.7) 317.3 Other long-term liabilities 1,497.3 1,930.4 2,072.0 2,152.4
Preferred dividends 0.0 0.0 0.0 0.0 Total long-term liabilities 2,319.0 5,041.3 5,138.6 5,192.3
Net income (pre-exceptionals) 321.3 (558.9) (12.7) 317.3 Total liabilities 9,557.8 10,366.7 9,563.1 9,732.0
Post-tax exceptionals 0.0 0.0 0.0 0.0
Net income 321.3 (558.9) (12.7) 317.3 Preferred shares 0.0 0.0 0.0 0.0
Total common equity 7,781.9 7,653.1 7,640.4 7,960.3
EPS (basic, pre-except) (Rmb) 0.06 (0.10) 0.00 0.06 Minority interest 168.1 182.9 182.9 182.9
EPS (basic, post-except) (Rmb) 0.06 (0.10) 0.00 0.06
EPS (diluted, post-except) (Rmb) 0.06 (0.10) 0.00 0.06 Total liabilities & equity 17,507.8 18,202.7 17,386.5 17,875.2
DPS (Rmb) 0.01 0.00 0.00 0.01
Dividend payout ratio (%) 19.8 0.0 0.0 19.9 BVPS (Rmb) 1.47 1.36 1.35 1.41
Free cash flow yield (%) (6.2) 1.8 (2.6) (9.7)
Growth & margins (%) 12/15 12/16E 12/17E 12/18E Ratios 12/15 12/16E 12/17E 12/18E
Sales growth (4.0) (7.2) 9.9 12.8 ROE (%) 4.5 (7.2) (0.2) 4.1
EBITDA growth (29.6) (62.4) 65.6 80.0 ROA (%) 2.0 (3.1) (0.1) 1.8
EBIT growth (39.1) (91.5) 422.2 159.1 CROCI (%) 12.0 8.7 8.1 7.4
Net income growth (56.3) (274.0) 97.7 2,607.0 Inventory days 85.0 108.0 103.4 103.7
EPS growth (58.1) (255.5) 97.7 2,607.0 Receivables days 72.8 81.3 69.7 68.9
Gross margin 34.4 35.4 34.6 38.3 Payable days 196.8 257.7 244.0 244.7
EBITDA margin 20.9 8.5 12.8 20.4 Net debt/equity (%) 65.6 58.3 56.8 56.7
EBIT margin 15.2 1.4 6.6 15.3 Interest cover - EBIT (X) 2.4 0.2 1.3 3.7
Valuation 12/15 12/16E 12/17E 12/18E
Cash flow statement (Rmb mn) 12/15 12/16E 12/17E 12/18E
Net income pre-preferred dividends 321.3 (558.9) (12.7) 317.3 P/E (analyst) (X) 32.6 NM NM 16.2
D&A add-back 273.0 313.7 298.1 280.3 P/B (X) 1.4 0.7 0.7 0.6
Minorities interests add-back 22.4 14.7 0.0 0.0 EV/EBITDA (X) 15.6 26.0 15.5 8.8
Net (inc)/dec working capital 558.6 216.4 4.7 (53.5) Dividend yield (%) 0.6 0.0 0.0 1.2
Other operating cash flow 266.5 1,512.7 978.7 664.4
Cash flow from operations 1,441.8 1,498.5 1,268.8 1,208.5
Capital expenditures (2,098.1) (1,403.4) (1,405.3) (1,718.3)
Acquisitions 0.0 0.0 0.0 0.0
Divestitures 0.0 0.0 0.0 0.0
Others 986.8 525.8 519.4 567.9
Cash flow from investments (1,111.3) (877.6) (885.8) (1,150.4)
Dividends paid (common & pref) (49.0) (64.3) 0.0 2.5
Inc/(dec) in debt 259.4 174.5 (1,110.9) (44.3)
Common stock issuance (repurchase) 0.0 0.0 0.0 0.0
Other financing cash flows (264.2) 215.4 (257.7) (231.4)
Cash flow from financing (53.8) 325.6 (1,368.6) (273.2)
Total cash flow 276.6 946.5 (985.6) (215.2) Note: Last actual year may include reported and estimated data.
Source: Company data, Goldman Sachs Research estimates.

August 13, 2016 China: Consumer Staples
Goldman Sachs Global Investment Research 68
Appendix: China dairy overview
China dairy overview
Exhibit 129: We initiate on 1 upstream dairy farming and 5 downstream dairy processors in this report
Dairy industry value chain
Source: Company data, China Dairy Association, Goldman Sachs Global Investment Research.
Key Players
UHT Milk Profit
Flow (Rmb/Kg)
Corn Soybean Meal Alfalfa Other Forage
Upstream ‐ Dairy
Farming
Culled
Import Milk
(102K tons)
Import Milk
Powder
(572K tons)
Food
Ingredients
Modern
Trade (2011:
148K POS)
E‐commerce
Mother/Baby
Store (55K
POS)
Modern Dairy (1117.HK),
Huishan (6863.HK),
Shengmu (1432.HK)
Calves (c.10mn heads) Milkable Cows (c.7mn heads)
Mengniu (2319.HK),
Yili (600887.SS),
Bright Dairy (600597.SS),
Want Want (151.HK)
IMF: Biostime (1112.HK),
Yashili (1230.HK),
Beingmate (002570.SZ)
Dairy farmers (2011: 2.2mn farmers)
Domestic Raw Milk Output (37mn tons, estiamted supply gap 8‐9mn tons)
D&A and
Other Cost
(11%)
Salary (9%)
Other
Farming Opex
(10%)
Forage (40% volume)Grain (60% volume)
Feed (70% of cost)
Retailers
Dairy processors (649), IMF processors (128), USD 40bn industry sales for total dairy products.
UHT/Pasteurized Milk
(Wholesale:US$10bn )
Downstream ‐
Processors
Yoghurt (Wholesale:US$5.1bn)Milk Beverages
(Wohelsale:US$8.9bn)IMF (Wholesale:US$7.4bn)
Industry Supply Chain
UHT/Pasteurized Milk
(Retail:US$13.5bn)Milk Beverages (Retail:US$12bn) Yoghurt (Retail:US$7.2bn) IMF (Retail:US$12.1bn)
Traditional Trade (2011: 3.2mn POS)Retailer/Distributor GPM c.25%
Processor GPM 30‐35%
Dairy farmers free cash flow are typically thin due to half of its cow herd is not milkable.
20‐24mths 5‐6 lactation cycles
3rd party distributors direct distribution

August 13, 2016 China: Consumer Staples
Goldman Sachs Global Investment Research 69
Exhibit 130: Stock performance closely correlated with
dairy sector earnings Stock perf. Vs dairy earnings index
Exhibit 131: Divergence between companies, as Yili has
outperformed and Mengniu has dipped Dairy stock performance by company
Source: Datastream.
Source: Datastream.
Exhibit 132: Industry ROIC has declined over the past 5
years due to higher expansion of asset base Dairy downstream ROIC
Exhibit 133: We expect dairy industry capex to slow
down in next 3 years Total dairy industry capex
Source: Company data, Goldman Sachs Global Investment Research.
Source: Company data, Goldman Sachs Global Investment Research.
0
100
200
300
400
500
600
700
800
0
100
200
300
400
500
600
700
800
Stock Perf. Index Dairy Earnings Index (RHS)
2000-2007:
Expansion of UHT milk
2008-09:
Melamine Incident
2010-13:
Demand for Quality Milk:
Kids milk, Premium Infant
formula
2014-16:
Milk Oversupply, High
Inventory and Promotion
0
100
200
300
400
500
600
700
800
900
1,000
1,100
1,200
1,300
1,400
1,500
1,600
Dairy Stock PerformanceIndex to 100
Yili, 12X
Mengniu,
6X
Biostime,
2.5X
CMD,
0.5X
WW, 2X
2000-2007:
Expansion of UHT milk:
Yili and Mengniu
2008-09:
Melamine Incident
2010-13:
Demand for Quality Milk
Growth of Kids milk, Premium
Infant formula:
WW, Biostime, Upstream dairy
2014-16:
Milk Oversupply, High
Inventory and Promotion;
IMF online shift
1,5812,608
613
4,1931,895
2,018
1,862
5,864
5,3994,620 4,353
2,800
1,969
2,553
3,068
3,691
3,807
3,5713,203
3,472
0
2,000
4,000
6,000
8,000
10,000
12,000
14,000
16,000
2011 2012 2013 2014 2015 2016E 2017E 2018E
Total Dairy Industry Capex (RMB mn)
Downstream Capex PPE/Land use capex Biological Assets (Capex)

August 13, 2016 China: Consumer Staples
Goldman Sachs Global Investment Research 70
Exhibit 134: Yili and Mengniu are highly involved in advertising/promotions Dairy Key Brands Marketing Strategy
Source: Channel Checks, Company data.
Company Product Category Product Feature15-16 Sponsoring
Program/Promotions/Movies
Yili Brand Entire Brand Olympic Strategic Partner
Satine UHT Milk
- Organic
- High Protein Content
- Low Fat Content
- I am Singer 4
- Biggest Brain 2
ShuHua UHT Milk - Suitable for Lactose Intolerant Consumers -Transformers 4
- LeeHom Wang
MeiYiTian Yoghurt Drink - Low Sugar Content
- High level of lactive acid bacteria- Happy Camp
ChangYi Probiotic Drink - Good for Digestive System
- Aids Weight loss process- Challenger's League 2
Ambrosial UHT Yoghurt
- High Protein Content
- Organic and Nautral
- "Greek Yoghurt"
- Running Man 4
- AngelaBaby
QQ Star Flavored Milk- Nutritional for Kids
- High amount of Vitamin D - Dad, where we going 3
YouSuanRu Yoghurt Drink- Targets younger customers
- Flavourful- Jay Chou
ChangQing Low Temp Yoghurt
- Light taste
- Aids weight loss process
- High probiotic content
- Fermented from 100% fresh milk
- Gao Yuan Yuan
Mengniu Brand Entire Brand Olympic Sponsor
Milk Deluxe UHT Milk
- Superior Milk Source
- High Protein content
- High end premium product
- Independence Day 2
XinYangDao UHT Milk - Suitable for Lactose Intolerant Consumers - Very Perfect
YouYiC Yoghurt Drink- High level of probiotics
- Good for Digestive system- WoShiMoWang
Just Milk UHT Yoghurt - 0 additives, all natural
- Full Speed 2
- China is Listening
- Deng Chao
- The Mermaid
Future Star Flavored Milk- Organic and nutritional
- 0 additives- Disney
SourSour Yoghurt Yoghurt Drink - Flavorful and nutritional- TF Boys
- 2016 Super Female Voice
GuanYiRu Low Temp Yoghurt- Good for digestive system
- High probiotic content- Sun Li
U+Milk UHT Milk- 0 Additives
- Natural Flavor
ChangYou Yoghurt Drink - Contains lactobacillus plantarum
Momchilovtsi UHT Yoghurt- Bulgarian Probiotics
- Exotic/Scientific
- Ultimate Challenge
- Olympics Sponsor
Want W
ant
WangZai Milk Flavored Milk- Suitable for kids
- Flavorful
Mengniu
Bright
Yili/Mengniu/Bright/Want Want Main Products Marketing Strategy
Yili
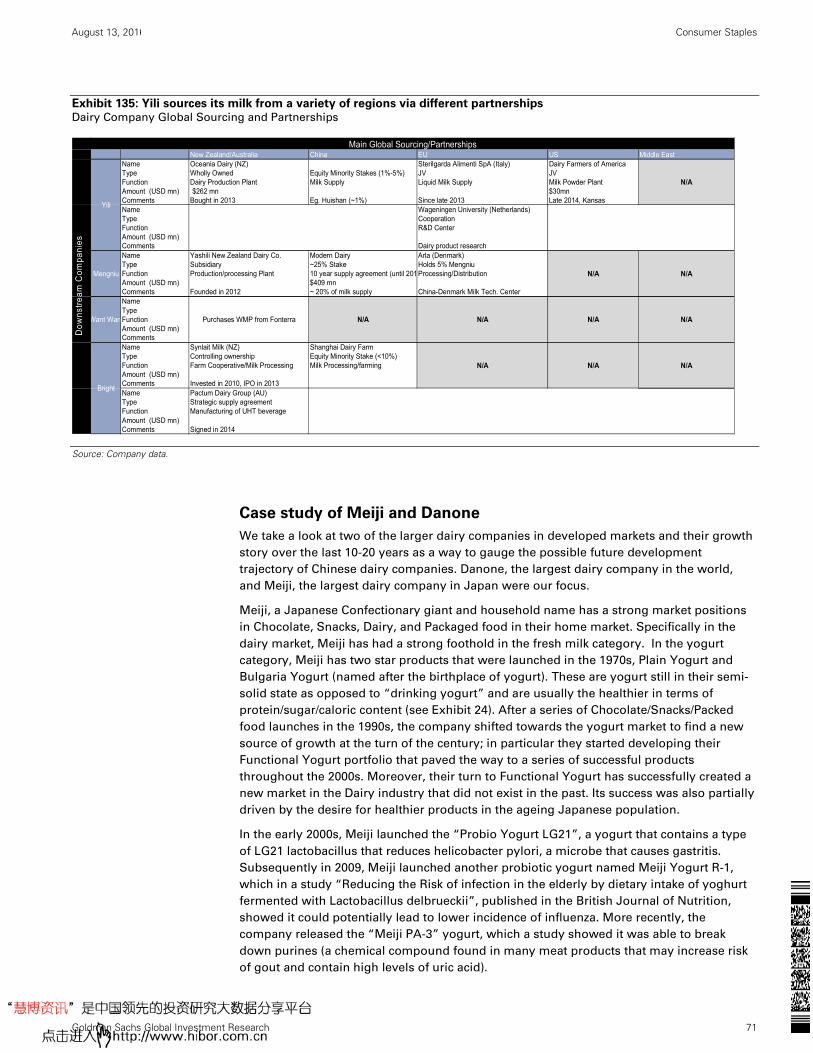
August 13, 2016 China: Consumer Staples
Goldman Sachs Global Investment Research 71
Exhibit 135: Yili sources its milk from a variety of regions via different partnerships Dairy Company Global Sourcing and Partnerships
Source: Company data.
Case study of Meiji and Danone
We take a look at two of the larger dairy companies in developed markets and their growth
story over the last 10-20 years as a way to gauge the possible future development
trajectory of Chinese dairy companies. Danone, the largest dairy company in the world,
and Meiji, the largest dairy company in Japan were our focus.
Meiji, a Japanese Confectionary giant and household name has a strong market positions
in Chocolate, Snacks, Dairy, and Packaged food in their home market. Specifically in the
dairy market, Meiji has had a strong foothold in the fresh milk category. In the yogurt
category, Meiji has two star products that were launched in the 1970s, Plain Yogurt and
Bulgaria Yogurt (named after the birthplace of yogurt). These are yogurt still in their semi-
solid state as opposed to “drinking yogurt” and are usually the healthier in terms of
protein/sugar/caloric content (see Exhibit 24). After a series of Chocolate/Snacks/Packed
food launches in the 1990s, the company shifted towards the yogurt market to find a new
source of growth at the turn of the century; in particular they started developing their
Functional Yogurt portfolio that paved the way to a series of successful products
throughout the 2000s. Moreover, their turn to Functional Yogurt has successfully created a
new market in the Dairy industry that did not exist in the past. Its success was also partially
driven by the desire for healthier products in the ageing Japanese population.
In the early 2000s, Meiji launched the “Probio Yogurt LG21”, a yogurt that contains a type
of LG21 lactobacillus that reduces helicobacter pylori, a microbe that causes gastritis.
Subsequently in 2009, Meiji launched another probiotic yogurt named Meiji Yogurt R-1,
which in a study “Reducing the Risk of infection in the elderly by dietary intake of yoghurt
fermented with Lactobacillus delbrueckii”, published in the British Journal of Nutrition,
showed it could potentially lead to lower incidence of influenza. More recently, the
company released the “Meiji PA-3” yogurt, which a study showed it was able to break
down purines (a chemical compound found in many meat products that may increase risk
of gout and contain high levels of uric acid).
New Zealand/Australia China EU US Middle EastName Oceania Dairy (NZ) Sterilgarda Alimenti SpA (Italy) Dairy Farmers of AmericaType Wholly Owned Equity Minority Stakes (1%-5%) JV JVFunction Dairy Production Plant Milk Supply Liquid Milk Supply Milk Powder PlantAmount (USD mn) $262 mn $30mnComments Bought in 2013 Eg. Huishan (~1%) Since late 2013 Late 2014, KansasName Wageningen University (Netherlands)Type Cooperation Function R&D CenterAmount (USD mn)Comments Dairy product researchName Yashili New Zealand Dairy Co. Modern Dairy Arla (Denmark)Type Subsidiary ~25% Stake Holds 5% MengniuFunction Production/processing Plant 10 year supply agreement (until 201Processing/DistributionAmount (USD mn) $409 mnComments Founded in 2012 ~ 20% of milk supply China-Denmark Milk Tech. CenterNameTypeFunctionAmount (USD mn)CommentsName Synlait Milk (NZ) Shanghai Dairy FarmType Controlling ownership Equity Minority Stake (<10%)Function Farm Cooperative/Milk Processing Milk Processing/farmingAmount (USD mn)Comments Invested in 2010, IPO in 2013Name Pactum Dairy Group (AU)Type Strategic supply agreementFunction Manufacturing of UHT beverageAmount (USD mn)Comments Signed in 2014
N/A
Main Global Sourcing/Partnerships
Do
wn
stre
am
Co
mpa
nie
s
Bright
Purchases WMP from Fonterra N/A
N/AN/A
N/A
N/A
N/A
N/A
N/A
Mengniu
Want Wan N/A
Yili
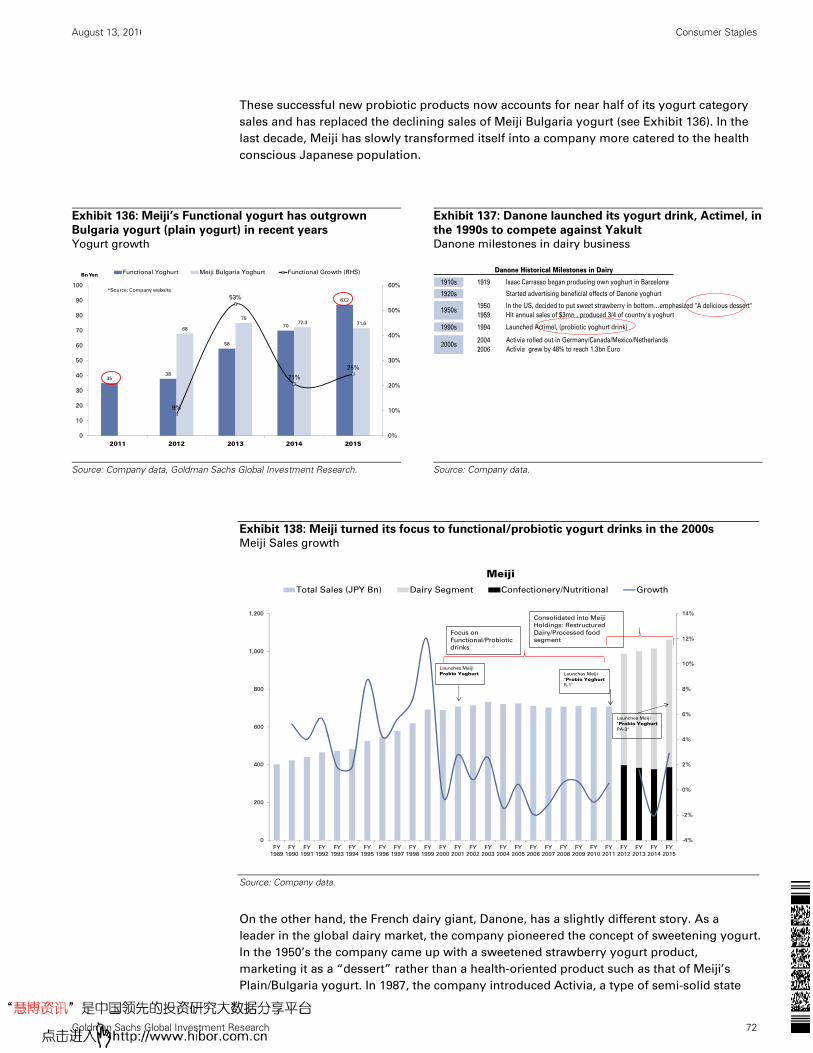
August 13, 2016 China: Consumer Staples
Goldman Sachs Global Investment Research 72
These successful new probiotic products now accounts for near half of its yogurt category
sales and has replaced the declining sales of Meiji Bulgaria yogurt (see Exhibit 136). In the
last decade, Meiji has slowly transformed itself into a company more catered to the health
conscious Japanese population.
Exhibit 136: Meiji’s Functional yogurt has outgrown
Bulgaria yogurt (plain yogurt) in recent years
Yogurt growth
Exhibit 137: Danone launched its yogurt drink, Actimel, in
the 1990s to compete against Yakult
Danone milestones in dairy business
Source: Company data, Goldman Sachs Global Investment Research.
Source: Company data.
Exhibit 138: Meiji turned its focus to functional/probiotic yogurt drinks in the 2000s
Meiji Sales growth
Source: Company data.
On the other hand, the French dairy giant, Danone, has a slightly different story. As a
leader in the global dairy market, the company pioneered the concept of sweetening yogurt.
In the 1950’s the company came up with a sweetened strawberry yogurt product,
marketing it as a “dessert” rather than a health-oriented product such as that of Meiji’s
Plain/Bulgaria yogurt. In 1987, the company introduced Activia, a type of semi-solid state
3538
58
70
87.2
68
7572.3 71.6
9%
53%
21%
25%
0%
10%
20%
30%
40%
50%
60%
0
10
20
30
40
50
60
70
80
90
100
2011 2012 2013 2014 2015
Bn Yen Functional Yoghurt Meiji Bulgaria Yoghurt Functional Growth (RHS)
*Source: Company website
1910s 1919 Isaac Carrasso began producing own yoghurt in Barcelona
1920s Started advertising beneficial effects of Danone yoghurt
1950 In the US, decided to put sweet strawberry in bottom…emphasized "A delicious dessert"
1959 Hit annual sales of $3mn , produced 3/4 of country's yoghurt
1990s 1994 Launched Actimel, (probiotic yoghurt drink)
2004 Activia rolled out in Germany/Canada/Mexico/Netherlands
2006 Activia grew by 48% to reach 1.3bn Euro
Danone Historical Milestones in Dairy
1950s
2000s
-4%
-2%
0%
2%
4%
6%
8%
10%
12%
14%
0
200
400
600
800
1,000
1,200
FY
1989
FY
1990
FY
1991
FY
1992
FY
1993
FY
1994
FY
1995
FY
1996
FY
1997
FY
1998
FY
1999
FY
2000
FY
2001
FY
2002
FY
2003
FY
2004
FY
2005
FY
2006
FY
2007
FY
2008
FY
2009
FY
2010
FY
2011
FY
2012
FY
2013
FY
2014
FY
2015
MeijiTotal Sales (JPY Bn) Dairy Segment Confectionery/Nutritional Growth
Launches Meiji
Probio Yoghurt Launches Meiji
"Probio Yoghurt R-1"
Focus on
Functional/Probiotic
drinks
Consolidated into Meiji
Holdings: Restructured
Dairy/Processed food
segment
Launches Meiji
"Probio Yoghurt PA-3"
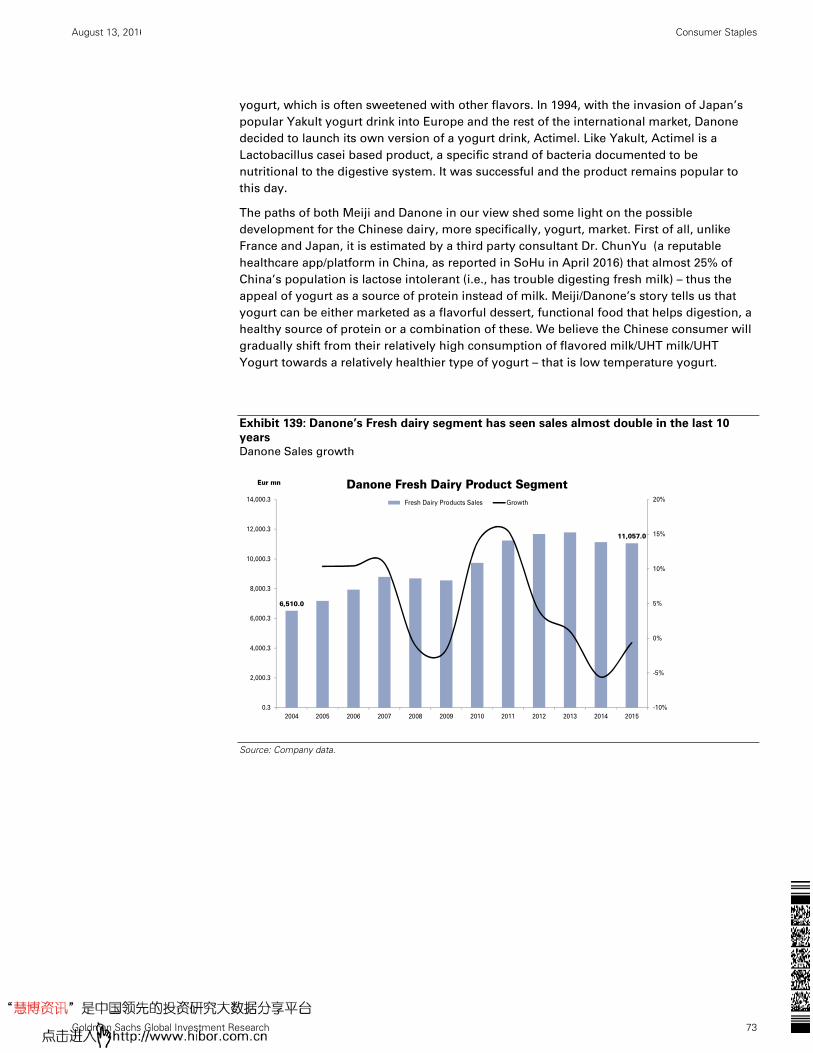
August 13, 2016 China: Consumer Staples
Goldman Sachs Global Investment Research 73
yogurt, which is often sweetened with other flavors. In 1994, with the invasion of Japan’s
popular Yakult yogurt drink into Europe and the rest of the international market, Danone
decided to launch its own version of a yogurt drink, Actimel. Like Yakult, Actimel is a
Lactobacillus casei based product, a specific strand of bacteria documented to be
nutritional to the digestive system. It was successful and the product remains popular to
this day.
The paths of both Meiji and Danone in our view shed some light on the possible
development for the Chinese dairy, more specifically, yogurt, market. First of all, unlike
France and Japan, it is estimated by a third party consultant Dr. ChunYu (a reputable
healthcare app/platform in China, as reported in SoHu in April 2016) that almost 25% of
China’s population is lactose intolerant (i.e., has trouble digesting fresh milk) – thus the
appeal of yogurt as a source of protein instead of milk. Meiji/Danone’s story tells us that
yogurt can be either marketed as a flavorful dessert, functional food that helps digestion, a
healthy source of protein or a combination of these. We believe the Chinese consumer will
gradually shift from their relatively high consumption of flavored milk/UHT milk/UHT
Yogurt towards a relatively healthier type of yogurt – that is low temperature yogurt.
Exhibit 139: Danone’s Fresh dairy segment has seen sales almost double in the last 10
years
Danone Sales growth
Source: Company data.
6,510.0
11,057.0
-10%
-5%
0%
5%
10%
15%
20%
0.3
2,000.3
4,000.3
6,000.3
8,000.3
10,000.3
12,000.3
14,000.3
2004 2005 2006 2007 2008 2009 2010 2011 2012 2013 2014 2015
Eur mn Danone Fresh Dairy Product Segment Fresh Dairy Products Sales Growth
August 13, 2016 China: Consumer Staples
Goldman Sachs Global Investment Research 74
Disclosure Appendix
Reg AC
We, Lincoln Kong, CFA, Joshua Lu, Kevin Li and Xufa Liao, CFA, hereby certify that all of the views expressed in this report accurately reflect our
personal views about the subject company or companies and its or their securities. We also certify that no part of our compensation was, is or will be,
directly or indirectly, related to the specific recommendations or views expressed in this report.
Unless otherwise stated, the individuals listed on the cover page of this report are analysts in Goldman Sachs' Global Investment Research division.
Investment Profile
The Goldman Sachs Investment Profile provides investment context for a security by comparing key attributes of that security to its peer group and
market. The four key attributes depicted are: growth, returns, multiple and volatility. Growth, returns and multiple are indexed based on composites
of several methodologies to determine the stocks percentile ranking within the region's coverage universe.
The precise calculation of each metric may vary depending on the fiscal year, industry and region but the standard approach is as follows:
Growth is a composite of next year's estimate over current year's estimate, e.g. EPS, EBITDA, Revenue. Return is a year one prospective aggregate
of various return on capital measures, e.g. CROCI, ROACE, and ROE. Multiple is a composite of one-year forward valuation ratios, e.g. P/E, dividend
yield, EV/FCF, EV/EBITDA, EV/DACF, Price/Book. Volatility is measured as trailing twelve-month volatility adjusted for dividends.
Quantum
Quantum is Goldman Sachs' proprietary database providing access to detailed financial statement histories, forecasts and ratios. It can be used for
in-depth analysis of a single company, or to make comparisons between companies in different sectors and markets.
GS SUSTAIN
GS SUSTAIN is a global investment strategy aimed at long-term, long-only performance with a low turnover of ideas. The GS SUSTAIN focus list
includes leaders our analysis shows to be well positioned to deliver long term outperformance through sustained competitive advantage and
superior returns on capital relative to their global industry peers. Leaders are identified based on quantifiable analysis of three aspects of corporate
performance: cash return on cash invested, industry positioning and management quality (the effectiveness of companies' management of the
environmental, social and governance issues facing their industry).
Disclosures
Coverage group(s) of stocks by primary analyst(s)
Lincoln Kong, CFA: Asia Pacific Consumer and Retail. Joshua Lu: Asia Pacific Consumer and Retail, Hong Kong/China Consumer. Xufa Liao, CFA: Asia
Pacific Consumer and Retail, China Food and Beverage, China Media.
Asia Pacific Consumer and Retail: Ace Hardware Indonesia, Amorepacific, BGF Retail, Biostime International Holdings, Bright Dairy, China Modern
Dairy Holdings, China Resources Enterprise, CJ CheilJedang, CP ALL PCL, E-Mart, Eclat Textile Co., GS Retail Co., Hyundai Department Store, KT&G,
LG Household & Healthcare, Lotte Shopping, Makalot Industrial Co, Matahari Department Store, Mengniu Dairy, MOMO.COM Inc., Orion, PChome
Online Inc., Pou Sheng International Holdings, President Chain Store, PT Gudang Garam Tbk, PT Hanjaya Mandala Sampoerna Tbk, PT Indofood CBP
Sukses Makmur, PT Indofood Sukses Makmur Tbk, PT Kalbe Farma Tbk, PT Unilever Indonesia Tbk, Shenzhou International Group Holdings Ltd,
Shinsegae, Stella International Holdings, Sun Art Retail Group, Tingyi (Cayman Islands) Holdings, Tsingtao Brewery (A), Tsingtao Brewery (H), Uni-
President China Holdings, Uni-President Enterprises, Want Want China Holdings, WH Group Ltd., Yili Industrial, Yue Yuen Industrial.
China Food and Beverage: Anhui Gujing Distillery Co., Jiangsu Yanghe, Kweichow Moutai, Luzhou Laojiao, Qinghai Huzhu Barley Wine Co., Shanxi
Xinghuacun Fen Wine, Wuliangye Yibin.
China Media: Alpha Group, Beijing Enlight Media Co., Beijing Gehua CATV, Beijing Hualubaina Film & TV Co., BlueFocus Communication, China
South Publishing & Media, Focus Media Information Technology, Guangdong Advertising, Huayi Brothers Media, IMAX China Holding, Jiangsu
Phoenix, Leshi Internet Information & Tech, Oriental Pearl, Ourpalm Co., Wanda Cinema Line Co., Zhejiang Huace Film & TV.
Hong Kong/China Consumer: Anta Sports Products, Belle International Holdings, Global Brands Group, Li & Fung, Li Ning Co., Samsonite
International SA.
Company-specific regulatory disclosures
Compendium report: please see disclosures at http://www.gs.com/research/hedge.html. Disclosures applicable to the companies included in this
compendium can be found in the latest relevant published research
Distribution of ratings/investment banking relationships
Goldman Sachs Investment Research global Equity coverage universe
Rating Distribution Investment Banking Relationships
Buy Hold Sell Buy Hold Sell
Global 31% 54% 15% 66% 60% 50%
As of July 1, 2016, Goldman Sachs Global Investment Research had investment ratings on 2,963 equity securities. Goldman Sachs assigns stocks as
Buys and Sells on various regional Investment Lists; stocks not so assigned are deemed Neutral. Such assignments equate to Buy, Hold and Sell for
the purposes of the above disclosure required by the FINRA Rules. See 'Ratings, Coverage groups and views and related definitions' below. The
Investment Banking Relationships chart reflects the percentage of subject companies within each rating category for whom Goldman Sachs has
provided investment banking services within the previous twelve months.
Price target and rating history chart(s)
Compendium report: please see disclosures at http://www.gs.com/research/hedge.html. Disclosures applicable to the companies included in this
compendium can be found in the latest relevant published research

August 13, 2016 China: Consumer Staples
Goldman Sachs Global Investment Research 75
Regulatory disclosures
Disclosures required by United States laws and regulations
See company-specific regulatory disclosures above for any of the following disclosures required as to companies referred to in this report: manager
or co-manager in a pending transaction; 1% or other ownership; compensation for certain services; types of client relationships; managed/co-
managed public offerings in prior periods; directorships; for equity securities, market making and/or specialist role. Goldman Sachs trades or may
trade as a principal in debt securities (or in related derivatives) of issuers discussed in this report.
The following are additional required disclosures: Ownership and material conflicts of interest: Goldman Sachs policy prohibits its analysts,
professionals reporting to analysts and members of their households from owning securities of any company in the analyst's area of
coverage. Analyst compensation: Analysts are paid in part based on the profitability of Goldman Sachs, which includes investment banking
revenues. Analyst as officer or director: Goldman Sachs policy prohibits its analysts, persons reporting to analysts or members of their
households from serving as an officer, director, advisory board member or employee of any company in the analyst's area of coverage. Non-U.S. Analysts: Non-U.S. analysts may not be associated persons of Goldman, Sachs & Co. and therefore may not be subject to FINRA Rule 2241 or FINRA
Rule 2242 restrictions on communications with subject company, public appearances and trading securities held by the analysts.
Distribution of ratings: See the distribution of ratings disclosure above. Price chart: See the price chart, with changes of ratings and price targets in
prior periods, above, or, if electronic format or if with respect to multiple companies which are the subject of this report, on the Goldman Sachs
website at http://www.gs.com/research/hedge.html.
Additional disclosures required under the laws and regulations of jurisdictions other than the United States
The following disclosures are those required by the jurisdiction indicated, except to the extent already made above pursuant to United States laws
and regulations. Australia: Goldman Sachs Australia Pty Ltd and its affiliates are not authorised deposit-taking institutions (as that term is defined in
the Banking Act 1959 (Cth)) in Australia and do not provide banking services, nor carry on a banking business, in Australia. This research, and any
access to it, is intended only for "wholesale clients" within the meaning of the Australian Corporations Act, unless otherwise agreed by Goldman
Sachs. In producing research reports, members of the Global Investment Research Division of Goldman Sachs Australia may attend site visits and
other meetings hosted by the issuers the subject of its research reports. In some instances the costs of such site visits or meetings may be met in part
or in whole by the issuers concerned if Goldman Sachs Australia considers it is appropriate and reasonable in the specific circumstances relating to
the site visit or meeting. Brazil: Disclosure information in relation to CVM Instruction 483 is available at
http://www.gs.com/worldwide/brazil/area/gir/index.html. Where applicable, the Brazil-registered analyst primarily responsible for the content of this
research report, as defined in Article 16 of CVM Instruction 483, is the first author named at the beginning of this report, unless indicated otherwise at
the end of the text. Canada: Goldman Sachs Canada Inc. is an affiliate of The Goldman Sachs Group Inc. and therefore is included in the company
specific disclosures relating to Goldman Sachs (as defined above). Goldman Sachs Canada Inc. has approved of, and agreed to take responsibility for,
this research report in Canada if and to the extent that Goldman Sachs Canada Inc. disseminates this research report to its clients. Hong Kong: Further information on the securities of covered companies referred to in this research may be obtained on request from Goldman Sachs
(Asia) L.L.C. India: Further information on the subject company or companies referred to in this research may be obtained from Goldman Sachs
(India) Securities Private Limited, Research Analyst - SEBI Registration Number INH000001493, 951-A, Rational House, Appasaheb Marathe Marg,
Prabhadevi, Mumbai 400 025, India, Corporate Identity Number U74140MH2006FTC160634, Phone +91 22 6616 9000, Fax +91 22 6616 9001. Goldman
Sachs may beneficially own 1% or more of the securities (as such term is defined in clause 2 (h) the Indian Securities Contracts (Regulation) Act,
1956) of the subject company or companies referred to in this research report. Japan: See below. Korea: Further information on the subject
company or companies referred to in this research may be obtained from Goldman Sachs (Asia) L.L.C., Seoul Branch. New Zealand: Goldman
Sachs New Zealand Limited and its affiliates are neither "registered banks" nor "deposit takers" (as defined in the Reserve Bank of New Zealand Act
1989) in New Zealand. This research, and any access to it, is intended for "wholesale clients" (as defined in the Financial Advisers Act 2008) unless
otherwise agreed by Goldman Sachs. Russia: Research reports distributed in the Russian Federation are not advertising as defined in the Russian
legislation, but are information and analysis not having product promotion as their main purpose and do not provide appraisal within the meaning of
the Russian legislation on appraisal activity. Singapore: Further information on the covered companies referred to in this research may be obtained
from Goldman Sachs (Singapore) Pte. (Company Number: 198602165W). Taiwan: This material is for reference only and must not be reprinted
without permission. Investors should carefully consider their own investment risk. Investment results are the responsibility of the individual
investor. United Kingdom: Persons who would be categorized as retail clients in the United Kingdom, as such term is defined in the rules of the
Financial Conduct Authority, should read this research in conjunction with prior Goldman Sachs research on the covered companies referred to
herein and should refer to the risk warnings that have been sent to them by Goldman Sachs International. A copy of these risks warnings, and a
glossary of certain financial terms used in this report, are available from Goldman Sachs International on request.
European Union: Disclosure information in relation to Article 4 (1) (d) and Article 6 (2) of the European Commission Directive 2003/125/EC is available
at http://www.gs.com/disclosures/europeanpolicy.html which states the European Policy for Managing Conflicts of Interest in Connection with
Investment Research.
Japan: Goldman Sachs Japan Co., Ltd. is a Financial Instrument Dealer registered with the Kanto Financial Bureau under registration number Kinsho
69, and a member of Japan Securities Dealers Association, Financial Futures Association of Japan and Type II Financial Instruments Firms
Association. Sales and purchase of equities are subject to commission pre-determined with clients plus consumption tax. See company-specific
disclosures as to any applicable disclosures required by Japanese stock exchanges, the Japanese Securities Dealers Association or the Japanese
Securities Finance Company.
Ratings, coverage groups and views and related definitions
Buy (B), Neutral (N), Sell (S) -Analysts recommend stocks as Buys or Sells for inclusion on various regional Investment Lists. Being assigned a Buy
or Sell on an Investment List is determined by a stock's return potential relative to its coverage group as described below. Any stock not assigned as
a Buy or a Sell on an Investment List is deemed Neutral. Each regional Investment Review Committee manages various regional Investment Lists to a
global guideline of 25%-35% of stocks as Buy and 10%-15% of stocks as Sell; however, the distribution of Buys and Sells in any particular coverage
group may vary as determined by the regional Investment Review Committee. Regional Conviction Buy and Sell lists represent investment
recommendations focused on either the size of the potential return or the likelihood of the realization of the return.
Return potential represents the price differential between the current share price and the price target expected during the time horizon associated
with the price target. Price targets are required for all covered stocks. The return potential, price target and associated time horizon are stated in each
report adding or reiterating an Investment List membership.
Coverage groups and views: A list of all stocks in each coverage group is available by primary analyst, stock and coverage group at
http://www.gs.com/research/hedge.html. The analyst assigns one of the following coverage views which represents the analyst's investment outlook
on the coverage group relative to the group's historical fundamentals and/or valuation. Attractive (A). The investment outlook over the following 12

August 13, 2016 China: Consumer Staples
Goldman Sachs Global Investment Research 76
months is favorable relative to the coverage group's historical fundamentals and/or valuation. Neutral (N). The investment outlook over the
following 12 months is neutral relative to the coverage group's historical fundamentals and/or valuation. Cautious (C). The investment outlook over
the following 12 months is unfavorable relative to the coverage group's historical fundamentals and/or valuation.
Not Rated (NR). The investment rating and target price have been removed pursuant to Goldman Sachs policy when Goldman Sachs is acting in an
advisory capacity in a merger or strategic transaction involving this company and in certain other circumstances. Rating Suspended (RS). Goldman
Sachs Research has suspended the investment rating and price target for this stock, because there is not a sufficient fundamental basis for
determining, or there are legal, regulatory or policy constraints around publishing, an investment rating or target. The previous investment rating and
price target, if any, are no longer in effect for this stock and should not be relied upon. Coverage Suspended (CS). Goldman Sachs has suspended
coverage of this company. Not Covered (NC). Goldman Sachs does not cover this company. Not Available or Not Applicable (NA). The
information is not available for display or is not applicable. Not Meaningful (NM). The information is not meaningful and is therefore excluded.
Global product; distributing entities
The Global Investment Research Division of Goldman Sachs produces and distributes research products for clients of Goldman Sachs on a global
basis. Analysts based in Goldman Sachs offices around the world produce equity research on industries and companies, and research on
macroeconomics, currencies, commodities and portfolio strategy. This research is disseminated in Australia by Goldman Sachs Australia Pty Ltd
(ABN 21 006 797 897); in Brazil by Goldman Sachs do Brasil Corretora de Títulos e Valores Mobiliários S.A.; in Canada by either Goldman Sachs
Canada Inc. or Goldman, Sachs & Co.; in Hong Kong by Goldman Sachs (Asia) L.L.C.; in India by Goldman Sachs (India) Securities Private Ltd.; in
Japan by Goldman Sachs Japan Co., Ltd.; in the Republic of Korea by Goldman Sachs (Asia) L.L.C., Seoul Branch; in New Zealand by Goldman Sachs
New Zealand Limited; in Russia by OOO Goldman Sachs; in Singapore by Goldman Sachs (Singapore) Pte. (Company Number: 198602165W); and in
the United States of America by Goldman, Sachs & Co. Goldman Sachs International has approved this research in connection with its distribution in
the United Kingdom and European Union.
European Union: Goldman Sachs International authorised by the Prudential Regulation Authority and regulated by the Financial Conduct Authority
and the Prudential Regulation Authority, has approved this research in connection with its distribution in the European Union and United Kingdom;
Goldman Sachs AG and Goldman Sachs International Zweigniederlassung Frankfurt, regulated by the Bundesanstalt für
Finanzdienstleistungsaufsicht, may also distribute research in Germany.
General disclosures
This research is for our clients only. Other than disclosures relating to Goldman Sachs, this research is based on current public information that we
consider reliable, but we do not represent it is accurate or complete, and it should not be relied on as such. The information, opinions, estimates and
forecasts contained herein are as of the date hereof and are subject to change without prior notification. We seek to update our research as
appropriate, but various regulations may prevent us from doing so. Other than certain industry reports published on a periodic basis, the large
majority of reports are published at irregular intervals as appropriate in the analyst's judgment.
Goldman Sachs conducts a global full-service, integrated investment banking, investment management, and brokerage business. We have
investment banking and other business relationships with a substantial percentage of the companies covered by our Global Investment Research
Division. Goldman, Sachs & Co., the United States broker dealer, is a member of SIPC (http://www.sipc.org).
Our salespeople, traders, and other professionals may provide oral or written market commentary or trading strategies to our clients and principal
trading desks that reflect opinions that are contrary to the opinions expressed in this research. Our asset management area, principal trading desks
and investing businesses may make investment decisions that are inconsistent with the recommendations or views expressed in this research.
The analysts named in this report may have from time to time discussed with our clients, including Goldman Sachs salespersons and traders, or may
discuss in this report, trading strategies that reference catalysts or events that may have a near-term impact on the market price of the equity
securities discussed in this report, which impact may be directionally counter to the analyst's published price target expectations for such stocks. Any
such trading strategies are distinct from and do not affect the analyst's fundamental equity rating for such stocks, which rating reflects a stock's
return potential relative to its coverage group as described herein.
We and our affiliates, officers, directors, and employees, excluding equity and credit analysts, will from time to time have long or short positions in,
act as principal in, and buy or sell, the securities or derivatives, if any, referred to in this research.
The views attributed to third party presenters at Goldman Sachs arranged conferences, including individuals from other parts of Goldman Sachs, do
not necessarily reflect those of Global Investment Research and are not an official view of Goldman Sachs.
Any third party referenced herein, including any salespeople, traders and other professionals or members of their household, may have positions in
the products mentioned that are inconsistent with the views expressed by analysts named in this report.
This research is not an offer to sell or the solicitation of an offer to buy any security in any jurisdiction where such an offer or solicitation would be
illegal. It does not constitute a personal recommendation or take into account the particular investment objectives, financial situations, or needs of
individual clients. Clients should consider whether any advice or recommendation in this research is suitable for their particular circumstances and, if
appropriate, seek professional advice, including tax advice. The price and value of investments referred to in this research and the income from them
may fluctuate. Past performance is not a guide to future performance, future returns are not guaranteed, and a loss of original capital may occur.
Fluctuations in exchange rates could have adverse effects on the value or price of, or income derived from, certain investments.
Certain transactions, including those involving futures, options, and other derivatives, give rise to substantial risk and are not suitable for all investors.
Investors should review current options disclosure documents which are available from Goldman Sachs sales representatives or at
http://www.theocc.com/about/publications/character-risks.jsp. Transaction costs may be significant in option strategies calling for multiple purchase
and sales of options such as spreads. Supporting documentation will be supplied upon request.
All research reports are disseminated and available to all clients simultaneously through electronic publication to our internal client websites. Not all
research content is redistributed to our clients or available to third-party aggregators, nor is Goldman Sachs responsible for the redistribution of our
research by third party aggregators. For research, models or other data available on a particular security, please contact your sales representative or
go to http://360.gs.com.
Disclosure information is also available at http://www.gs.com/research/hedge.html or from Research Compliance, 200 West Street, New York, NY
10282.
© 2016 Goldman Sachs.
No part of this material may be (i) copied, photocopied or duplicated in any form by any means or (ii) redistributed without the prior written consent of The Goldman Sachs Group, Inc.