Embed Size (px)
Citation preview

August 2017 CPI 1
Consumer Price Index (CPI)August 2017
Contact Statistician: Phaladi LabobediEmail: +267 3671300 Fax: 3952201
August 2017Consumer Price Index

August 2017 CPI2
Published by
STATISTICS BOTSWANAPrivate Bag 0024, GaboroneTel: 3671300 Fax: 3952201
Email: [email protected]
August 2017
Copyright © Statistics Botswana 2017
August 2017 CPI 3
CONSUMER PRICE INDEXAUGUST 2017

August 2017 CPI4
CONTENTS
COMMENTARY
Section1:HeadlineInflation Section2:CoreInflation
CHARTS
1.NationalRatesofInflation,August2014–August2017 2.MonthlyChangesintheCost-of-LivingIndex,August2014–August2017 3.Non-TradableInflationRates,August2014–August2017 4.TradableInflationRates,August2014–August2017
TABLES
1.Cost-of-LivingIndexSeries(January2015–August2017) 2.NationalCost-of-LivingGroupandSectionIndices 3.Cost-of-LivingIndexbyTradability(January2015–August2017) 4.CoreInflationRatesbyExclusionandTrimmedMean 5.AnnualAverageInflationRates2007-2016
GLOSSARY

August 2017 CPI 5
COMMENTARY
Section 1: Headline Inflation
Theannual inflation rate inAugust2017was3.4percent, thesamerateas inJuly2017.The inflation ratesforregionsbetweenJulyandAugust2017showedthatCities&Towns’wentdownto3.4percentfrom3.5percent,RuralVillages’droppedto3.6percentfrom3.7percentandUrbanVillages’remainedunchangedat3.2percentbetweenthetwomonths.
TheAugustnationalConsumerPriceIndexmovedfrom103.0inJuly2017to103.1inAugust2017,anincreaseof0.1percent.TheCities&Towns’indexroseby0.1percent,advancingfrom102.9inJuly2017to103.0inAugust2017.TheUrbanVillages’indexmovedfrom102.9inJulyto103.0inAugust,whiletheRuralVillages’indexrealizedariseof0.1percent,movingfrom103.3to103.4betweenthetwomonths.
GroupindicesweregenerallymovingataslowpacebetweenJulyandAugust2017,recordingchangesoflessthan1.0percent.
TheClothingandFootweargroupindexwentupfrom102.6to102.8,recordingariseof0.2percentbetweenthetwomonths.TheincreasewasattributedtotheriseinthesectionindicesofClothing(0.4percent)andotherArticlesofclothing(0.1percent). TheTransportgroupindexregisteredanincreaseof0.2percent,from101.4inJulyto101.6inAugust.TherisewasmainlyattributabletoanincreaseintheconstituentsectionindexofPurchaseofVehicles(0.8percent).
TheRestaurants&Hotelsindexgroupadvancedfrom103.3to103.5,registeringanincreaseof0.2percentduringtheperiodunderreview.ContributingtotheincreasewassectionindexoftheRestaurants,Cafesandthelikewhichwentupby0.3percent.
TheAll-Tradableinflationratewas3.2percentinAugust,adeclineof0.1ofapercentagepointontheJulyrateof3.3percent.TheDomesticTradableinflationratewentdownfrom3.8percentinJulyto3.4percentinAugust.TheImportedTradableinflationrateincreasedfrom3.0percentinJulyto3.1percentinAugust.TheNon-Tradableinflationrateremainedthesameat3.7percentbetweenthetwoperiods.
TheAll-Tradableindexmovedfrom103.0inJulyto103.1inAugustregisteringariseof0.1percent.TheImportedTradableindexmovedfrom102.7inJulyto103.0inAugust,recordinganincreaseof0.2percent.TheDomesticTradableindexdeclinedfrom103.4inJulyto103.2inAugust,registeringadropof0.1percent,whiletheNon-Tradableindexremainedconstantat103.1betweenthetwoperiods.
Section 2: Core Inflation
TheTrimmedMeanCoreInflationrateinAugust2017was2.9percent,thesamerateasinJuly2017.TheCoreInflationratebyexclusionalsoremainedstableat3.3percentbetweenthetwoperiods.

August 2017 CPI6
CHARTS
_________________________A.N. Majelantle
StatisticianGeneral15September2017
August 2017 CPI 7
TABLES
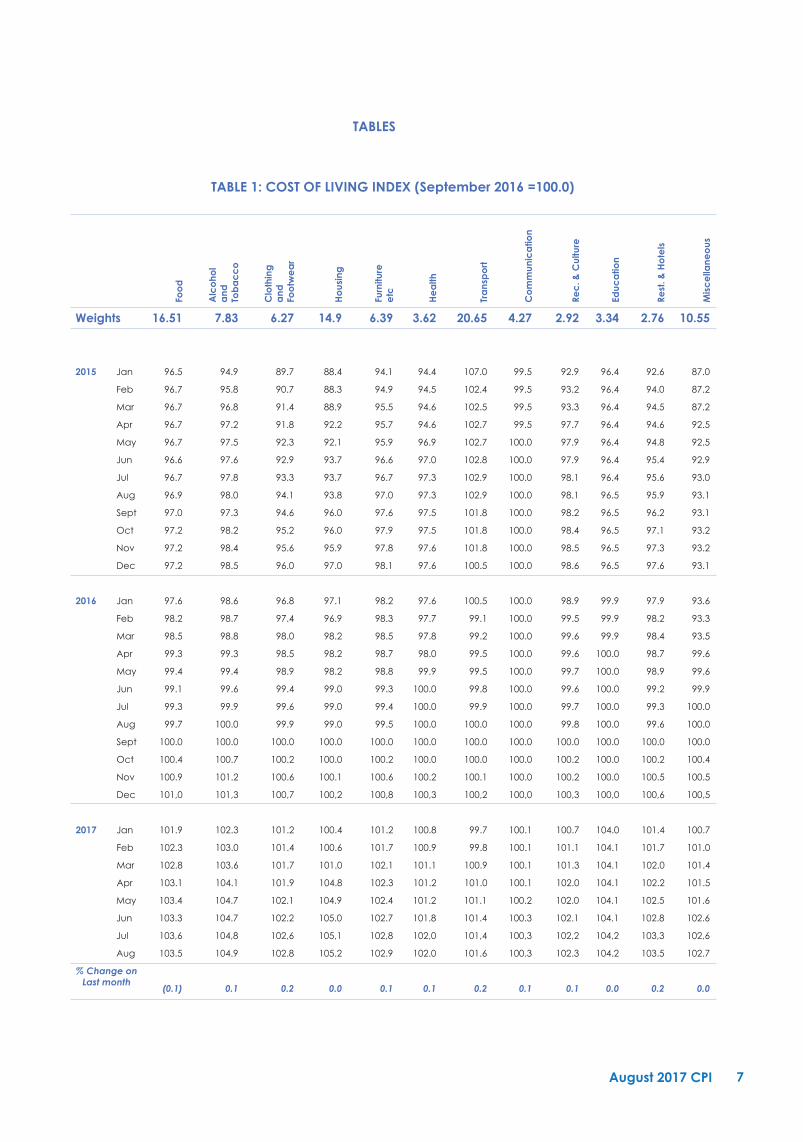
TABLE 1: COST OF LIVING INDEX (September 2016 =100.0)Fo
od
Alc
oho
la
ndTo
ba
cc
o
Clo
thin
ga
ndFo
otw
ea
r
Ho
usin
g
Furn
iture
etc
He
alth
Tra
nsp
ort
Co
mm
unic
atio
n
Rec
. & C
ultu
re
Educ
atio
n
Rest
. & H
ote
ls
Mis
ce
llane
ous
Weights 16.51 7.83 6.27 14.9 6.39 3.62 20.65 4.27 2.92 3.34 2.76 10.55
2015 Jan 96.5 94.9 89.7 88.4 94.1 94.4 107.0 99.5 92.9 96.4 92.6 87.0
Feb 96.7 95.8 90.7 88.3 94.9 94.5 102.4 99.5 93.2 96.4 94.0 87.2
Mar 96.7 96.8 91.4 88.9 95.5 94.6 102.5 99.5 93.3 96.4 94.5 87.2
Apr 96.7 97.2 91.8 92.2 95.7 94.6 102.7 99.5 97.7 96.4 94.6 92.5
May 96.7 97.5 92.3 92.1 95.9 96.9 102.7 100.0 97.9 96.4 94.8 92.5
Jun 96.6 97.6 92.9 93.7 96.6 97.0 102.8 100.0 97.9 96.4 95.4 92.9
Jul 96.7 97.8 93.3 93.7 96.7 97.3 102.9 100.0 98.1 96.4 95.6 93.0
Aug 96.9 98.0 94.1 93.8 97.0 97.3 102.9 100.0 98.1 96.5 95.9 93.1
Sept 97.0 97.3 94.6 96.0 97.6 97.5 101.8 100.0 98.2 96.5 96.2 93.1
Oct 97.2 98.2 95.2 96.0 97.9 97.5 101.8 100.0 98.4 96.5 97.1 93.2
Nov 97.2 98.4 95.6 95.9 97.8 97.6 101.8 100.0 98.5 96.5 97.3 93.2
Dec 97.2 98.5 96.0 97.0 98.1 97.6 100.5 100.0 98.6 96.5 97.6 93.1
2016 Jan 97.6 98.6 96.8 97.1 98.2 97.6 100.5 100.0 98.9 99.9 97.9 93.6
Feb 98.2 98.7 97.4 96.9 98.3 97.7 99.1 100.0 99.5 99.9 98.2 93.3
Mar 98.5 98.8 98.0 98.2 98.5 97.8 99.2 100.0 99.6 99.9 98.4 93.5
Apr 99.3 99.3 98.5 98.2 98.7 98.0 99.5 100.0 99.6 100.0 98.7 99.6
May 99.4 99.4 98.9 98.2 98.8 99.9 99.5 100.0 99.7 100.0 98.9 99.6
Jun 99.1 99.6 99.4 99.0 99.3 100.0 99.8 100.0 99.6 100.0 99.2 99.9
Jul 99.3 99.9 99.6 99.0 99.4 100.0 99.9 100.0 99.7 100.0 99.3 100.0
Aug 99.7 100.0 99.9 99.0 99.5 100.0 100.0 100.0 99.8 100.0 99.6 100.0
Sept 100.0 100.0 100.0 100.0 100.0 100.0 100.0 100.0 100.0 100.0 100.0 100.0
Oct 100.4 100.7 100.2 100.0 100.2 100.0 100.0 100.0 100.2 100.0 100.2 100.4
Nov 100.9 101.2 100.6 100.1 100.6 100.2 100.1 100.0 100.2 100.0 100.5 100.5
Dec 101,0 101,3 100,7 100,2 100,8 100,3 100,2 100,0 100,3 100,0 100,6 100,5
2017 Jan 101.9 102.3 101.2 100.4 101.2 100.8 99.7 100.1 100.7 104.0 101.4 100.7
Feb 102.3 103.0 101.4 100.6 101.7 100.9 99.8 100.1 101.1 104.1 101.7 101.0
Mar 102.8 103.6 101.7 101.0 102.1 101.1 100.9 100.1 101.3 104.1 102.0 101.4
Apr 103.1 104.1 101.9 104.8 102.3 101.2 101.0 100.1 102.0 104.1 102.2 101.5
May 103.4 104.7 102.1 104.9 102.4 101.2 101.1 100.2 102.0 104.1 102.5 101.6
Jun 103.3 104.7 102.2 105.0 102.7 101.8 101.4 100.3 102.1 104.1 102.8 102.6
Jul 103,6 104,8 102,6 105,1 102,8 102,0 101,4 100,3 102,2 104,2 103,3 102,6
Aug 103.5 104.9 102.8 105.2 102.9 102.0 101.6 100.3 102.3 104.2 103.5 102.7
% Change onLast month
(0.1) 0.1 0.2 0.0 0.1 0.1 0.2 0.1 0.1 0.0 0.2 0.0

August 2017 CPI8
TABLE 1: COST OF LIVING INDEX (Cont.)
All
Item
sIn
de
x
Na
tiona
lIn
flatio
nRa
te
Mo
nthl
yC
hang
e
Tow
ns &
C
itie
sIn
de
x
Urb
an
Vill
ag
eIn
de
x
Rura
lV
illa
ge
sIn
de
x
Annual Inflation
Towns & Cities
Urban Villages
Rural Villages
100 % % 41.8 34.5 23.7 % % %
2015 Jan 95.4 3.6 0.8 95.3 95.7 95.0 3.6 3.7 3.7
Feb 95.0 2.8 (0.4) 94.9 95.2 95.0 2.6 2.9 3.2
Mar 95.3 2.8 0.4 95.1 95.6 95.4 2.5 2.8 3.6
Apr 96.4 3.1 1.1 96.5 96.3 96.1 3.1 3.0 3.4
May 96.5 3.0 0.2 96.5 96.5 96.5 3.0 2.8 3.6
Jun 96.9 3.1 0.4 96.9 96.9 96.6 3.1 3.0 3.4
Jul 97.0 3.1 0.1 97.1 97.1 96.7 3.1 3.0 3.5
Aug 97.2 3.0 0.2 97.2 97.3 96.9 2.8 3.0 3.4
Sept 97.3 2.9 0.1 97.3 97.4 97.2 2.9 2.8 3.3
Oct 97.6 3.1 0.3 97.7 97.6 97.2 3.2 3.0 3.1
Nov 97.6 2.9 0.0 97.7 97.6 97.3 2.9 2.7 3.0
Dec 97.6 3.1 (0.0) 97.7 97.5 97.4 3.2 2.8 3.4
2016 Jan 97.9 2.7 0.4 97.9 98.1 97.7 2.7 2.6 2.8
Feb 97.9 3.0 (0.0) 97.7 98.2 97.9 2.9 3.2 3.1
Mar 98.2 3.0 0.3 98.1 98.6 98.0 3.1 3.2 2.7
Apr 99.1 2.8 0.9 99.0 99.4 98.7 2.6 3.2 2.7
May 99.2 2.8 0.1 99.1 99.5 98.9 2.7 3.1 2.5
Jun 99.4 2.7 0.2 99.4 99.7 99.1 2.5 2.8 2.6
Jul 99.6 2.7 0.1 99.5 99.7 99.6 2.5 2.7 3.0
Aug 99.7 2.6 0.2 99.6 99.9 99.8 2.6 2.6 2.9
Sept 100.0 2.8 0.3 100.0 100.0 100.0 2.8 2.7 2.9
Oct 100.2 2.7 0.2 100.2 100.2 100.2 2.5 2.7 3.1
Nov 100.4 2.9 0.3 100.3 100.4 100.7 2.7 2.9 3.5
Dec 100,5 3,0 0,1 100,5 100,4 100,8 2,8 3,0 3,5
2017 Jan 101.0 3.1 0.4 100.9 100.8 101.3 3.1 2.8 3.6
Feb 101.2 3.4 0.2 101.1 101.1 101.6 3.5 2.9 3.8
Mar 101.7 3.5 0.5 101.6 101.6 102.1 3.6 3.0 4.2
Apr 102.5 3.4 0.7 102.3 102.4 102.8 3.3 3.0 4.2
May 102.7 3.5 0.2 102.5 102.6 103.0 3.4 3.1 4.1
Jun 102.9 3.5 0.2 102.8 102.9 103.0 3.4 3.3 3.9
Jul 103,0 3,4 0,1 102,9 102,9 103,3 3,5 3,2 3,7
Aug 103.1 3.4 0.1 103.0 103.0 103.4 3.4 3.2 3.6
% Change onlast month
0.1 0.1 0.1 0.1

August 2017 CPI 9
TABLE 2 :National Cost-of-Living Group and Section Indices (September 2016=100.0)
Group Section We
ight
s
This
mo
nth
Aug
201
7
Last
mo
nth
Jul 2
017
3 m
ont
hsa
go
Ma
y 20
17
6 m
ont
hsa
go
Feb
2017
12 m
ont
hsa
go
Aug
201
6 Percentage Change on:
Lastmonth
3 months ago
6 monthsago
12 monthsago
1 Food & Non-Alcoholic Beverages 16.51 103.5 103.6 103.4 102.3 99.7 (0.1) 0.1 1.2 3.8
1.1 Bread&Cereals 5.27 101.9 102.1 102.4 101.6 99.4 (0.3) (0.5) 0.2 2.5
1.2 Meat(Fresh,Chilled&Frozen) 2.66 104.9 104.8 104.6 103.6 99.9 0.0 0.2 1.2 4.9
1.3 Fish(Fresh,Chilled&Frozen) 0.17 104.5 104.4 103.1 101.5 99.8 0.0 1.3 3.0 4.7
1.4 Milk,Cheese&MilkProducts 1.49 100.4 99.8 100.1 99.5 99.8 0.5 0.3 0.8 0.5
1.5 Oils&Fats 0.70 100.7 102.5 102.5 102.0 100.0 (1.7) (1.8) (1.2) 0.7
1.6 Fruit 0.86 105.4 106.1 106.8 106.4 99.4 (0.7) (1.3) (1.0) 6.0
1.7 Vegetables 1.80 103.8 103.8 102.8 103.5 100.7 0.1 1.0 0.3 3.1
1.8 Sugar,Jam,Honey,Chocolate&Confectionery 1.29 110.6 110.3 109.1 103.2 97.9 0.3 1.4 7.1 13.0
1.9 FoodnotelsewhereClassified 0.99 101.2 101.8 101.7 100.8 99.8 (0.5) (0.4) 0.4 1.4
1.10 Coffee,Tea&Cocoa 0.36 111.0 110.3 108.3 103.4 99.6 0.6 2.5 7.3 11.5
1.11 MineralWaters,SoftDrinks,Fruits&Veg.Juices 0.92 102.6 101.9 101.5 100.6 99.9 0.7 1.1 1.9 2.7
2 Alcoholic Beverages,Tobacco & Narcotics 7.83 104.9 104.8 104.7 103.0 100.0 0.1 0.2 1.8 4.9
2.1 AlcoholicBeverages 6.19 105.0 104.9 104.9 103.4 100.0 0.1 0.1 1.5 5.0
2.2 Tobacco 1.65 104.5 104.2 103.8 101.4 99.9 0.4 0.7 3.1 4.7
3 Clothing and Footwear 6.27 102.8 102.6 102.1 101.4 99.9 0.2 0.7 1.4 2.9
3.1 Clothing 2.42 102.4 102.0 101.7 100.9 100.0 0.4 0.7 1.4 2.4
3.2 OtherarticlesofClothing 1.01 102.1 102.0 101.6 100.7 99.8 0.1 0.5 1.4 2.3
3.3 Cleaning,Repair&Hire 0.99 104.5 104.5 102.7 102.4 99.9 0.0 1.7 2.1 4.6
3.4 Footwear 1.85 102.8 102.8 102.5 101.8 99.7 0.0 0.3 1.0 3.1
4 Housing, Water, Electr. Gas & Other Fuels
14.90 105.2 105.1 104.9 100.6 99.0 0.0 0.3 4.6 6.3
4.1 RentpaidbyTenants 6.25 101.0 101.0 100.6 100.0 97.9 0.0 0.3 1.0 3.1
4.2 MaterialsforMaintenance&Repairofdwellings
4.29 103.2 103.0 102.5 101.7 100.0 0.1 0.6 1.5 3.2
4.3 WaterSupply&Misc.Services 1.50 125.4 125.4 125.4 100.0 100.0 0.0 0.0 25.4 25.4
4.4 ElectricityGasandotherFuels 2.86 106.9 106.9 106.8 100.4 100.0 0.0 0.1 6.5 6.9
5 Furnishing, H/H Equipment& Routine Maintenance 6.39 102.9 102.8 102.4 101.7 99.5 0.1 0.5 1.2 3.4
5.1 Furniture&Furnishing 1.65 102.5 102.3 101.9 101.7 99.7 0.2 0.6 0.8 2.8
5.2 Carpets&OtherFloorCoverings 0.24 103.3 103.2 102.4 101.9 99.6 0.1 0.9 1.3 3.7
5.3 HouseholdTextiles 0.41 102.4 102.1 102.0 101.6 99.6 0.2 0.4 0.7 2.8
5.4 HouseholdAppliances 0.85 102.6 102.5 102.2 101.8 99.9 0.1 0.3 0.8 2.7
5.5 Glassware,Tableware&HouseholdUtensils 0.40 101.1 101.1 101.0 100.7 99.8 0.0 0.1 0.4 1.3
5.6 SmallTools,MiscelaneousAccessories 0.06 101.7 101.7 101.3 101.0 100.0 0.0 0.4 0.7 1.7
5.7 Goods&ServicesforH/hold Maintanance 2.78 103.7 103.6 103.1 101.8 99.3 0.1 0.5 1.8 4.4

August 2017 CPI10
TABLE 2 :National Cost-of-Living Group and Section Indices (September 2016=100.0) Cont
Group Section We
ight
s
This
mo
nth
Aug
201
7
Last
mo
nth
Jul 2
017
3 m
ont
hsa
go
Ma
y 20
17
6 m
ont
hsa
go
Feb
2017
12 m
ont
hsa
go
Aug
201
6 PercentageChangeon:
Lastmonth
3 months ago
6 monthsago
12 monthsago
6 Health 3.62 102.0 102.0 101.2 100.9 100.0 0.1 0.8 1.1 2.1
6.1 MedicalProducts,App.&Equip. 0.81 105.2 105.0 104.4 103.1 99.9 0.2 0.7 2.0 5.3
6.2 Out-patientServices 0.70 101.7 101.5 101.1 101.1 100.0 0.2 0.6 0.6 1.7
6.3 HospitalServices 2.10 101.0 101.0 100.0 100.0 100.0 0.0 1.0 1.0 1.0
7 Transport 20.65 101.6 101.4 101.1 99.8 100.0 0.2 0.5 1.8 1.6
7.1 PurchaseofVehicles 5.29 100.3 99.4 98.6 98.7 100.0 0.8 1.7 1.6 0.3
7.2 OperationofPersonalTransport 11.13 102.6 102.6 102.6 100.3 100.0 0.0 0.1 2.4 2.7
7.3 TransportServices 4.22 100.5 100.5 100.5 100.0 100.0 0.0 0.0 0.5 0.5
8 Communication 4.27 100.3 100.3 100.2 100.1 100.0 0.1 0.2 0.3 0.3
8.1 PostalServices 0.15 100.0 100.0 100.0 100.0 100.0 0.0 0.0 0.0 0.0
8.2 Telephone&TelefaxEquipment 0.71 102.0 101.6 100.9 100.4 100.0 0.4 1.1 1.6 2.0
8.3 Telephone&TelefaxServices 3.41 100.0 100.0 100.0 100.0 100.0 0.0 (0.0) (0.0) 0.0
9 Recreation & Culture 2.92 102.3 102.2 102.0 101.1 99.8 0.1 0.3 1.2 2.5
9.1 AudioVisual,Photographic&Info.Proce.Equip. 1.96 102.1 102.0 101.8 101.4 99.7 0.0 0.3 0.7 2.4
9.2 OtherRecreationalItems&Equip. 0.46 101.1 100.8 100.6 100.5 99.7 0.3 0.6 0.6 1.4
9.3 Recreational&CulturalServices 0.37 104.8 104.8 104.8 100.0 100.0 0.0 0.0 4.8 4.8
9.4 Newspapers,Books&Stationary 0.13 102.9 102.7 102.4 100.7 99.5 0.1 0.5 2.2 3.4
10 Education 3.34 104.2 104.2 104.1 104.1 100.0 0.0 0.1 0.1 4.2
10.1 Pre-Primary&PrimaryEducation 0.80 105.4 105.3 105.1 105.0 100.0 0.1 0.3 0.3 5.4
10.2 Secondary&TertiaryEducation 2.54 103.8 103.8 103.8 103.8 100.0 0.0 0.0 0.0 3.8
11 Restaurants & Hotels 2.76 103.5 103.3 102.5 101.7 99.6 0.2 1.0 1.8 3.9
11.1 Restaurants,CafesandtheLike 2.31 103.8 103.5 102.7 101.9 99.6 0.3 1.0 1.9 4.2
11.2 AccommodationServices 0.45 102.3 102.3 101.8 100.6 99.2 0.0 0.5 1.7 3.1
12 Miscellaneous Goods & Services 10.55 102.7 102.6 101.6 101.0 100.0 0.0 1.0 1.7 2.7
12.1 PersonalCare 1.71 103.8 103.8 103.2 101.7 99.8 (0.0) 0.6 2.0 4.0
12.2 PersonalEffectsN.E.C. 1.24 103.3 103.1 102.4 102.0 99.9 0.2 0.9 1.3 3.4
12.3 SocialProtection 0.07 102.1 102.0 102.0 102.0 100.0 0.0 0.1 0.1 2.1
12.4 Insurance 4.73 101.0 101.0 101.0 100.7 100.0 0.0 0.0 0.3 1.0
12.5 FinancialServices 0.79 103.1 103.0 102.5 101.1 99.9 0.1 0.6 1.9 3.2
12.6 TaxesLicences,Fees 2.01 105.1 105.1 100.9 100.5 100.0 0.0 4.2 4.7 5.1
All-Items Index 100.0 103.1 103.0 102.7 101.2 99.7 0.1 0.4 1.9 3.4

August 2017 CPI 11
TABLE 3: COST-OF-LIVING INDEX BY TRADABILITY (September 2016 = 100.0)
All ItemsNon-
TradableDomesticTradable
ImportedTradable
AllTradable
Index Inflation Index Inflation Index Inflation Index Inflation Index Inflation
Weights 100 35.83 20.39 43.77 64.17
2015 Jan 95.4 3.6 89.8 4.9 95.5 4.2 99.4 2.5 97.9 3.1
Feb 95.0 2.8 90.0 5.1 96.0 3.4 98.0 0.9 97.2 1.9
Mar 95.3 2.8 90.4 4.9 96.6 3.6 98.2 1.0 97.6 1.9
Apr 96.4 3.1 93.0 6.1 96.9 3.5 98.5 0.9 97.9 1.9
May 96.5 3.0 93.3 6.3 96.9 3.2 98.6 0.8 98.0 1.7
Jun 96.9 3.1 94.3 6.9 96.9 3.0 98.7 0.6 98.0 1.5
Jul 97.0 3.1 94.4 6.9 96.9 2.9 99.0 0.7 98.2 1.5
Aug 97.2 3.0 94.5 6.8 97.0 2.9 99.3 0.6 98.4 1.4
Sept 97.3 2.9 95.3 7.4 96.6 2.7 99.2 0.2 98.2 1.1
Oct 97.6 3.1 95.4 7.5 97.3 3.3 99.3 0.2 98.3 1.1
Nov 97.6 2.9 95.4 7.4 97.4 3.4 99.3 -0.4 98.6 1.0
Dec 97.6 3.1 96.0 7.6 97.4 3.5 98.9 0.0 98.3 1.2
2016 Jan 97.9 2.7 96.3 7.3 98.0 2.6 99.1 -0.3 98.6 0.8
Feb 97.9 3.0 96.4 7.0 98.4 2.5 98.8 0.7 98.6 1.4
Mar 98.2 3.0 96.9 7.3 98.6 2.1 99.0 0.8 98.8 1.3
Apr 99.1 2.8 98.7 6.1 99.1 2.3 99.4 0.9 99.3 1.4
May 99.2 2.8 98.9 6.0 99.4 2.5 99.4 0.8 99.4 1.4
Jun 99.4 2.7 99.4 5.4 99.3 2.5 99.6 0.9 99.5 1.5
Jul 99.6 2.7 99.4 5.4 99.5 2.8 99.7 0.7 99.6 1.5
Aug 99.7 2.6 99.5 5.3 99.9 3.0 99.9 0.6 99.9 1.5
Sept 100.0 2.8 100.0 4.9 100.0 3.5 100.0 0.9 100.0 1.9
Oct 100.2 2.7 100.1 4.9 100.3 3.1 100.2 0.9 100.2 1.9
Nov 100.4 2.9 100.1 4.9 100.7 3.4 100.5 1.2 100.6 2.1
Dec 100.5 3.0 100.1 4.3 100.9 3.6 100.6 1.8 100.7 2.5
2017 Jan 101.0 3.1 100.4 4.3 102.2 4.3 100.8 1.7 101.2 2.6
Feb 101.2 3.4 100.5 4.3 102.7 4.3 101.1 2.4 101.6 3.1
Mar 101.7 3.5 100.8 3.9 103.1 4.6 101.8 2.9 102.2 3.5
Apr 102.5 3.4 102.4 3.8 103.4 4.3 102.1 2.7 102.5 3.3
May 102.7 3.5 102.6 3.7 103.7 4.3 102.3 2.9 102.7 3.4
Jun 102.9 3.5 103.0 3.6 103.5 4.2 102.5 2.9 102.8 3.4
Jul 103,0 3,4 103,1 3,7 103,4 3,8 102,7 3,0 103,0 3,3
Aug 103.1 3.4 103.1 3.7 103.2 3.4 103.0 3.1 103.1 3.2
% Change on last month 0.1 0.0 (0.1) 0.2 0.1

August 2017 CPI12
TABLE 4: Core Inflation Rates by Exclusion and Trimmed Mean
Year Month
Consumer Price Index (Trimmed Mean)
(September 2016 = 100)
Core Monthly Inflation Rate (Trimmed Mean)
(percentage)
Consumer Price Index (Excluding Administered
Prices) (September 2016 = 100)
Core Monthly Inflation (Excluding Administered
Prices) (percentage)
2014
Jan 90.2 4.1 89.5 5.2
Feb 90.0 4.1 90.0 5.5
Mar 90.9 4.0 90.3 5.2
Apr 90.8 4.1 90.9 5.2
May 91.0 4.1 91.2 5.2
Jun 92.2 4.2 91.5 5.3
Jul 92.4 4.2 91.7 5.3
Aug 92.2 4.2 92.0 5.3
Sept 92.3 4.1 92.2 5.2
Oct 92.9 4.0 92.3 5.1
Nov 93.2 3.9 92.6 5.0
Dec 91.6 3.7 92.9 4.9
2015
Jan 92.6 3.6 93.7 4.8
Feb 92.7 3.2 94.3 4.8
Mar 93.0 3.3 94.7 4.8
Apr 95.5 3.6 95.3 4.8
May 95.7 3.5 95.4 4.7
Jun 96.1 3.6 95.8 4.7
Jul 96.1 3.6 96.0 4.7
Aug 96.4 3.5 96.2 4.6
Sept 96.8 3.4 96.6 4.8
Oct 97.1 3.6 96.9 5.0
Nov 97.1 3.3 97.0 4.7
Dec 97.0 3.2 97.1 4.5
2016
Jan 97.5 2.8 97.5 4.0
Feb 97.7 2.6 97.8 3.7
Mar 97.9 2.5 98.1 3.7
Apr 98.5 2.4 98.9 3.9
May 98.7 2.3 99.1 3.8
Jun 98.7 2.4 99.3 3.6
Jul 99.5 2.5 99.5 3.6
Aug 99.7 2.4 99.7 3.6
Sept 100.0 2.6 100.0 3.6
Oct 100.2 2.2 100.2 3.4
Nov 100.4 2.5 100.6 3.7
Dec 100.5 2.5 100.7 3.7
2017
Jan 101.0 2.7 101.3 3.9
Feb 101.1 2.9 101.6 3.9
Mar 101.7 3.1 102.0 3.9
Apr 102.0 3.1 102.2 3.3
May 102.1 3.1 102.5 3.4
Jun 102.4 2.9 102.6 3.3
Jul 102.5 2.9 102.8 3.3
Aug 102.6 2.9 102.9 3.3
August 2017 CPI 13
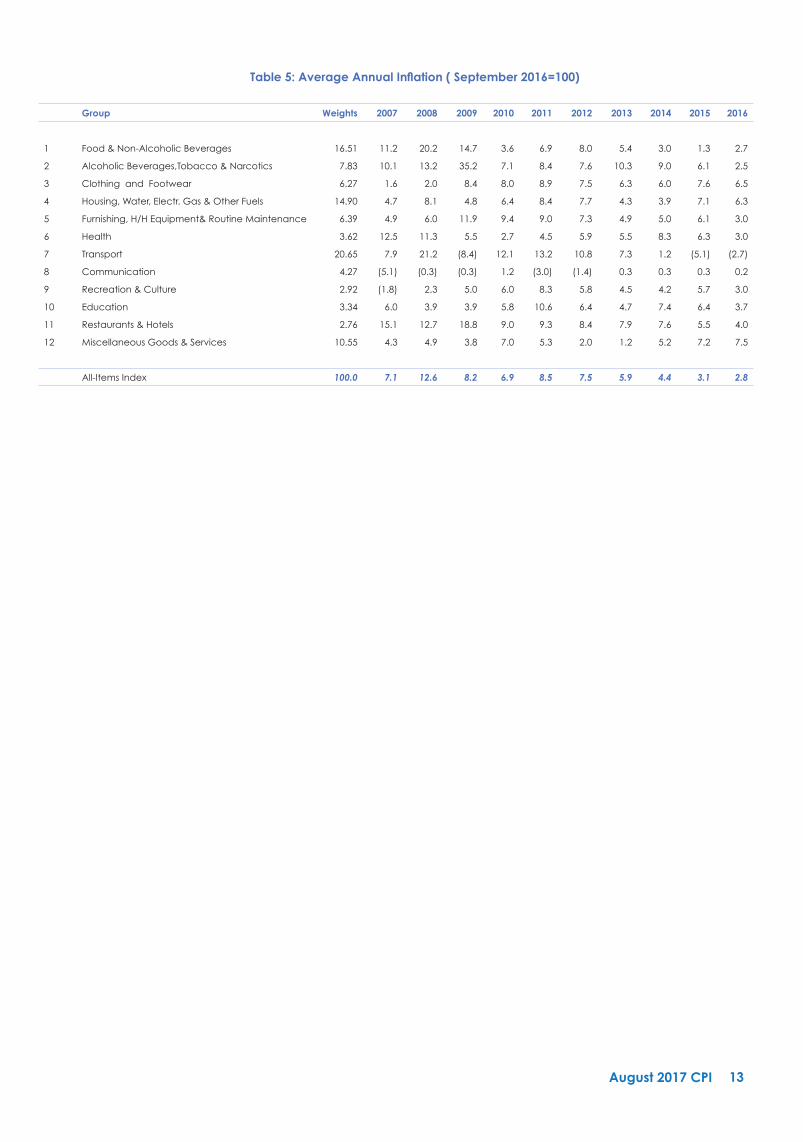
Table 5: Average Annual Inflation ( September 2016=100)
Group Weights 2007 2008 2009 2010 2011 2012 2013 2014 2015 2016
1 Food&Non-AlcoholicBeverages 16.51 11.2 20.2 14.7 3.6 6.9 8.0 5.4 3.0 1.3 2.7
2 AlcoholicBeverages,Tobacco&Narcotics 7.83 10.1 13.2 35.2 7.1 8.4 7.6 10.3 9.0 6.1 2.5
3 ClothingandFootwear 6.27 1.6 2.0 8.4 8.0 8.9 7.5 6.3 6.0 7.6 6.5
4 Housing,Water,Electr.Gas&OtherFuels 14.90 4.7 8.1 4.8 6.4 8.4 7.7 4.3 3.9 7.1 6.3
5 Furnishing,H/HEquipment&RoutineMaintenance 6.39 4.9 6.0 11.9 9.4 9.0 7.3 4.9 5.0 6.1 3.0
6 Health 3.62 12.5 11.3 5.5 2.7 4.5 5.9 5.5 8.3 6.3 3.0
7 Transport 20.65 7.9 21.2 (8.4) 12.1 13.2 10.8 7.3 1.2 (5.1) (2.7)
8 Communication 4.27 (5.1) (0.3) (0.3) 1.2 (3.0) (1.4) 0.3 0.3 0.3 0.2
9 Recreation&Culture 2.92 (1.8) 2.3 5.0 6.0 8.3 5.8 4.5 4.2 5.7 3.0
10 Education 3.34 6.0 3.9 3.9 5.8 10.6 6.4 4.7 7.4 6.4 3.7
11 Restaurants&Hotels 2.76 15.1 12.7 18.8 9.0 9.3 8.4 7.9 7.6 5.5 4.0
12 MiscellaneousGoods&Services 10.55 4.3 4.9 3.8 7.0 5.3 2.0 1.2 5.2 7.2 7.5
All-ItemsIndex 100.0 7.1 12.6 8.2 6.9 8.5 7.5 5.9 4.4 3.1 2.8

August 2017 CPI14

August 2017 CPI 15
GLOSSARY
Consumer Price Index (CPI)isanindexwhichmeasurespricechangesingoodsandserviceswithreferencetoabaseperiod.
Inflationisameasurementofpricesmovementofgoodsandservicesinaparticularcountry.
Domestic Tradablereferstothegoodsandserviceswhichacountry(Botswana)canexporttoothercountries.
Imported Tradablerepresentsthegoodsandserviceswhichacountry(Botswana)importsfromothercountries(tradingpartners).
Non-Tradablereferstothegoodsandserviceswhichacountrycannotexportorimporttoothercountries.
All –TradablereferstothetotalofDomesticandImportedtradable.
Trimmed Mean Core Inflation-attemptstoremove8percent(byweight)ofthecommoditysub-groupswiththelargestpricechangesateachoftheendsofanorderedseriesofpricechangesinanygivenmonth.
Core inflationbyExclusionisameasureusedtoremovethevolatilityinherentinpricesthatareonlyadjustedperiodicallyandnotalwaysinresponsetocurrentlyprevailingmarketforces.

August 2017 CPI16
August 2017Consumer Price Index


![Bargaining Update, August 2017 · 15 Average Weekly Earnings [AWE], Jun 2017 16 Consumer Price Index [CPI] , Jul 2017 17 CPI and AWE Comparison, Jul 2017 ... Foothills School Division](https://img.dokumen.tips/doc/110x75/5f8e73ce655b9d0d3452ee6d/bargaining-update-august-2017-15-average-weekly-earnings-awe-jun-2017-16-consumer.jpg)