Embed Size (px)
Citation preview

MANAGEMENT R E P O R T
2017
AS AT 30 JUNE 2017UNAUDITED
C P I P R O P E R T y G R O U P M A N A G E M E N T R E P O R T J U N E 2 0 1 7 / K E y F I G U R E S
Nestlé HQ, Prague
TOTAl REvENUES
203MEUR
NET lTv
49.8%
TOTAl ASSETS
6 490MEUR
EPRA NAv
3 068MEUR
We provide people with space for opportunity

3
KEY FIGURES
C P I P R O P E R T y G R O U P M A N A G E M E N T R E P O R T J U N E 2 0 1 7 / K E y F I G U R E S
PERfoRMancE 30-Jun-17 30-Jun-16 change
Total revenues MEUR 203 155 31%
Net business income MEUR 123 109 13%
Operating result MEUR 321 95 238%
Funds from operations (FFO) MEUR 51 51 0%
Profit before tax MEUR 231 58 298%
Interest expense MEUR 47 45 4%
Net profit for the period MEUR 190 44 332%
assEts 30-Jun-17 31-Dec-16 change
Total assets MEUR 6 490 5 662 15%
Property Portfolio MEUR 5 707 4 865 17%
Gross leasable area * sqm 3 238 000 3 094 000 5%
Occupancy in % * % 91% 90% +1.0 pp
Total number of properties ** No 420 417 1%
Total number of residential units No 12 402 12 396 0%
Total number of hotel beds No 10 308 11 278 -9%
EPRA NAv MEUR 3 068 2 729 12%
* Excluding hotels ** Excluding residential properties
financing stRUctURE 30-Jun-17 31-Dec-16 change
Total equity MEUR 2 598 2 289 14%
Equity ratio % 40% 40% +0.0 pp
Net debt MEUR 2 840 2 335 22%
loan to value ratio (Net lTv) % 49.8% 48.0% +1.8 pp
Consolidated leverage Ratio % 48.5% 47.6% +0.9 pp
Consolidated Coverage Ratio ratio 2.2 2.1 5%
Secured Consolidated leverage Ratio % 38.4% 36.4% +2.0 pp
All data for CPI PROPERTy GROUP (“CPIPG” or the “Company”, and together with its subsidiaries the “Group”) covering years 2013 and 2014 presented under the assumption that CPI PROPERTy GROUP and Czech Property Investments, a.s. were combined as of 1 January 2013.
4 C P I P R O P E R T y G R O U P M A N A G E M E N T R E P O R T J U N E 2 0 1 7 / K E y F I G U R E S
total assEts / PRoPERty PoRtfolio (MEUR)
6 000
7 000
5 000
4 000
3 000
2 000
1 000
0
Total Assets Property Porftolio
400
450
300
200
100
0
total REVEnUEs (MEUR)
EPRa naV (MEUR) / loan-to-ValUE (%)
0
500
2 000
1 500
1 000
3 000
2 500
2013 2014 2015 2016
2013
3 819
3 203
2014
4 219
2016
5 662
3 553
2015
4 323
3 822
4 865
H1 2017
6 490
5 707
2013
188
2014
269
2015
284
2016
351
2017E
431
1 493
1 940
1 732
2 729
3 068
61.5%
55.7%
58.8%
48.0%49.8%
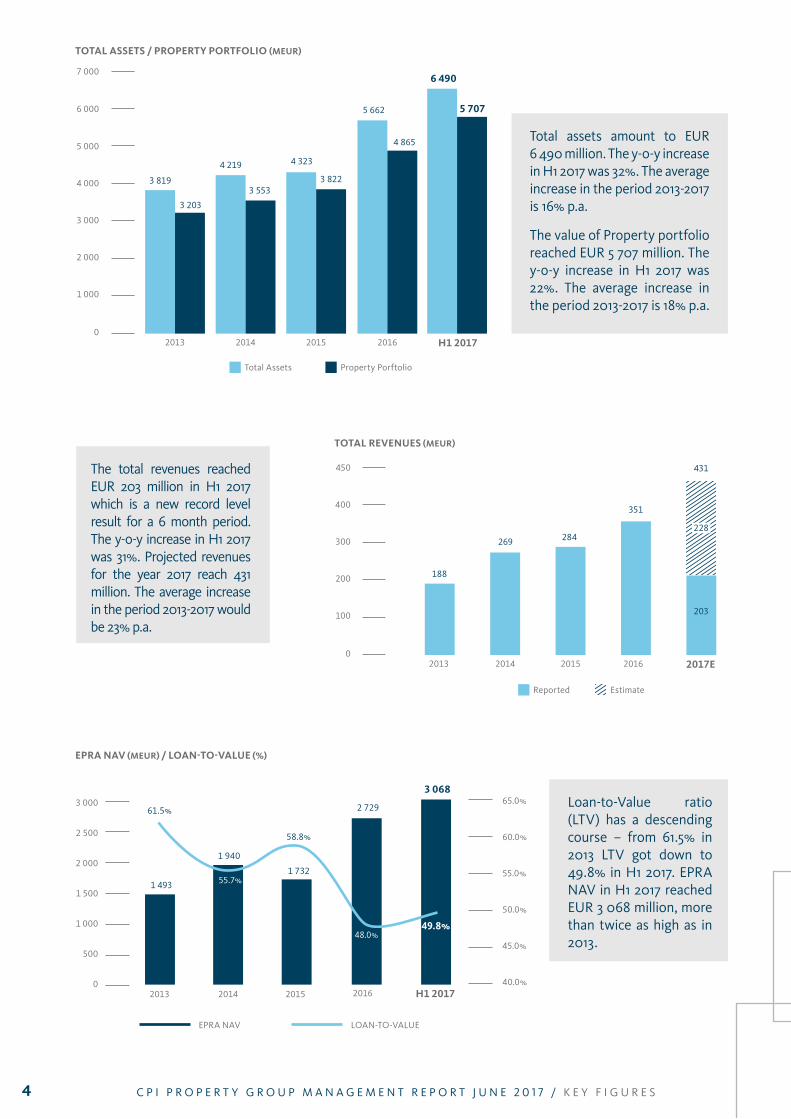
Total assets amount to EUR 6 490 million. The y-o-y increase in H1 2017 was 32%. The average increase in the period 2013-2017 is 16% p.a.
The value of Property portfolio reached EUR 5 707 million. The y-o-y increase in H1 2017 was 22%. The average increase in the period 2013-2017 is 18% p.a.
The total revenues reached EUR 203 million in H1 2017 which is a new record level result for a 6 month period. The y-o-y increase in H1 2017 was 31%. Projected revenues for the year 2017 reach 431 million. The average increase in the period 2013-2017 would be 23% p.a.
loan-to-value ratio (lTv) has a descending course – from 61.5% in 2013 lTv got down to 49.8% in H1 2017. EPRA NAv in H1 2017 reached EUR 3 068 million, more than twice as high as in 2013.
40.0%
45.0%
60.0%
55.0%
50.0%
65.0%
lOAN-TO-vAlUEEPRA NAv
203
Reported Estimate
H1 2017
228

C P I P R O P E R T y G R O U P M A N A G E M E N T R E P O R T J U N E 2 0 1 7 / K E y F I G U R E S

CONTENTS
C P I P R O P E R T y G R O U P M A N A G E M E N T R E P O R T J U N E 2 0 1 7 / C O N T E N T S
view from Prosta 69 building, Warsaw

7C P I P R O P E R T y G R O U P M A N A G E M E N T R E P O R T J U N E 2 0 1 7 / C O N T E N T S
CONTENTS
KEy FIGURES2
GROUP OvERvIEW14
ECONOMICREvIEW20
CONTENTS6
PORTFOlIO SEGMENTS30
yEAR 20178
THE CEO’S MESSAGE12
RESUlTSAND NET ASSETS64
OUTlOOK70
CORPORATEGOvERNANCE72
MANAGEMENT74
BOARD OFDIRECTORS76
OTHERREPORTINGREQUIREMENTS78
FINANCING56
GEOGRAPHy OF THE GROUP
PROPERTy PORTFOlIO EvOlUTION
ACCOUNTING RECONCIlIATION OF THE PROPERTy PORTFOlIO
MACROECONOMIC REvIEW
PROPERTy vAlUATION
OFFICE
RETAIl
HOTElS
RESIDENTIAl
DEvElOPMENT & lAND BANK
OTHER SEGMENTS
GlOSSARy

YEAR2017
C P I P R O P E R T y G R O U P M A N A G E M E N T R E P O R T J U N E 2 0 1 7 / y E A R 2 0 1 7
Ogrody shopping centre, Poland

9
PoRtfolio HigHligHts
THE GROUP BOOSTS ITS RETAIl PORTFOlIO
The Group acquired the high-quality retail portfolio (“CBRE GI acquisition”) of predominantly 11 shopping centres located in Czechia, Hungary, Poland and Romania with a total leasable area of approximately 280 000 sqm. The closing of this historic deal for the Group was completed on 29 March 2017. The acquired portfolio consists of (i) major shopping centres Olympia Plzeň and Nisa liberec in Czechia, Ogrody in Poland, Polus and Campona in Hungary and Felicia in Romania; (ii) multifunctional complexes Zlatý Anděl in Prague and Andrássy Complex in Budapest; and (iii) two Interspar stores in Hungary. The acquisition price reached EUR 625 million. The bank financing has been arranged through several loans at a total of EUR 440 million, with the Group providing the remaining amount from its own funds.
ACQUISITION OF THE SHOPPING CENTRE IN BRNO
On 26 July 2017, the Group acquired Královo Pole Shopping Centre located in Brno, Czechia. The shopping centre was built in 2004 by Carrefour and comprises a two-level gallery with 78 shops and a food court with a total of 26 500 sqm GlA and 900 parking spaces. The hypermarket was originally anchored by Carrefour until 2007, when it was taken over by Tesco. Královo Pole is the dominant shopping centre in northern Brno featuring a large catchment of 250 000 inhabitants within 20 minutes with above average purchasing power. The shopping centre offers development potential having a valid building permit in place for a further 12 000 sqm GlA expansion.
ACQUISITION OF THE HOTEl vlADIMÍR
On 7 March 2017, the Group acquired Hotel vladimír in Ústí nad labem. Hotel vladimír is a 3 star hotel with 86 rooms. The operation of this hotel will be secured by CPI Hotels a.s., operator of the majority of the Group s hotels portfolio.
SAlE OF ARKÁDy PROSTĚJOv SHOPPING GAllERy
On 8 August 2017, the Group disposed of the Arkády Prostějov shopping gallery. The shopping gallery, with the total gross leasable area of approximately 10 000 sqm, is located in Prostějov, eastern Czechia. The Group decided to proceed with this disposal, since it considered Arkády Prostějov as a non-core asset.
SAlE OF OFFICE BUIlDING IN CAPEllEN
The Group disposed of the office building in Capellen, luxembourg. The building with a leasable area of approximately 7 700 sqm, located in the Capellen business park just outside of the City of luxembourg, was sold to a private investor. The transaction, structured as a share deal, was completed on 25 January 2017.
SAlE OF lOZORNO lOGISTIC PARK
In February 2017, the Group disposed of lozorno logistics park, located outside of Bratislava, Slovakia. The logistics park, comprising of 5 halls with total rentable space reaching 118 000 sqm, was sold in a share deal transaction.
YEAR 2017
C P I P R O P E R T y G R O U P M A N A G E M E N T R E P O R T J U N E 2 0 1 7 / y E A R 2 0 1 7
cBRE gi acqUisition: Retail and office poRtfolio boosted by eUR 625 million
anotheR MaJoR sHoPPing cEntRE in bRno, czechia acqUiRed
10
SAlE OF OFFICE PROPERTy IN BRNO
In March 2017, the Group disposed of the Purkyňova office building located in Brno, Czech Republic. The modern building with an area exceeding 11 300 sqm was sold in a share deal transaction.
coRPoRatE nEWs
EUR 51.5 MIllION NEW SHARES
The Company issued of 515 000 000 new ordinary shares for a global cash contribution of EUR 51.5 million. The new shares were subscribed by the current shareholder RAvENTO S.a r.l., an entity closely associated with Mr. Radovan vítek.
The new shares, having a par value and a subscription price of EUR 0.10 each, were issued in a reserved capital increase under the Company’s authorised share capital and fully paid by cash. The corporate share capital of the Company has thus been increased from EUR 779 561 784.60 represented by 7 795 617 846 shares to EUR 831 061 784.60 represented by 8 310 617 846 shares.
The total number of shares comprising the share capital of the Company is 8 310 617 846 as of 30 June 2017.
caPital MaRKEt financing
CZK 800 MIllION BONDS REPAID AND NEWly ISSUED
On 5 May 2017, two maturing tranches of Group subsidiary CPI ByTy, a.s. bonds amounting to CZK 300 million and CZK 500 million, were repaid from equity.
On 10 May 2017, CPI ByTy, a.s. issued the seventh and eighth tranche of secured bonds. The seventh tranche, registered under ISIN code CZ0003516551, amounts to CZK 530 million, carries a fixed coupon of 1.85% and matures on 10 May 2019. The eighth tranche, registered under ISIN code CZ0003516569, amounts to CZK 270 million, carries a fixed coupon of 2.25% and matures on 7 May 2019. The prospectus, which was approved by the Czech National Bank on 3 May 2017 is available in electronic form at www.cpibyty.cz.
EUR 55 MIllION BONDS ISSUE
The Group issued additional EUR 55 million bonds with the nominal amount of EUR 1 000 each with maturity in 2022. The bonds are registered under ISIN code SK4120012097 and carry a fixed rate coupon of 5.00% p.a. The prospectus, approved by the National Bank of Slovakia on 28 September 2016 is available in electronic form at www.cpifinanceslovakiaii.sk.
C P I P R O P E R T y G R O U P M A N A G E M E N T R E P O R T J U N E 2 0 1 7 / y E A R 2 0 1 7
incREasE in eqUityby eUR 51.5 million
EUR 85 Million bonds issUe

11C P I P R O P E R T y G R O U P M A N A G E M E N T R E P O R T J U N E 2 0 1 7 / y E A R 2 0 1 7

12
'The Group is reaching new heights, we exceeded EUR 6 billion total assets and completed the largest real estate acquisition in the CEE region this year.'
C P I P R O P E R T y G R O U P M A N A G E M E N T R E P O R T J U N E 2 0 1 7 / T H E C E O ’ S M E S S A G E
13
THE CEO’S MESSAGE
Dear Shareholders,
It is with great satisfaction to report a highly engaging half year of concentrated progress. Alongside continued advancements in bond financing, the Group has achieved a substantial landmark acquisition driving the Company forward in its expansion and continuous improvement in asset quality. We have succeeded in taking advantage of opportunities in a positive, high-liquidity environment to concentrate growth in regions that facilitate the long-term strategies of our property portfolio. The size of the Group, its strong cash flow, low leverage and diversification put us in front of any other real estate company in the region.
The total assets value this year is near approaching EUR 6,500 million, having increased by EUR 830 million in the first half of 2017, with the property portfolio rising over EUR 840 million. This boost in assets has been primarily financed via equity which jumped by EUR 310 million thus maintaining lTv below 50% and EPRA NAv crossing the EUR 3,000 million level. The net debt increased by EUR 505 million. Net Business Income rose by EUR 14 million to EUR 123 million. The financial statements also confirm the strategy of continued investment in the existing portfolio in order to sustain and increase its value. The comparable interest expenses, despite an increase in the property portfolio and related debt, is evidence of the Group’s successful refinancing plan initiated two years ago.
The Group completed the acquisition of a EUR 625 million retail portfolio from funds managed by CBRE of 11 high quality properties expanding our established presence in the Czech Republic, Hungary, Poland and Romania. In the current market, we agreed financing of EUR 440 million with major banks and drove the transaction process across this complex and multi-jurisdictional region all within a six-month period. The landmark 280,000 sqm procurement alongside the Královo Pole shopping centre acquisition has pushed the Group into the premier league of European real estate investors, resulting in a two-fold boost in our shopping centres portfolio now totalling 20. We are well prepared to integrate the new assets into our management and work on long-term strategies enabling us to remain fully competitive in current and future environments.
The Group was considerably active on the bond market in the first half of 2017, where we continue to lead the Czech real estate industry. In May, pursuant to its bond programme, CPI ByTy, a.s. issued the seventh (EUR 20.4 million at 1.85%) and eighth (EUR 10.4 million at 2.25%) tranches of secured bonds maturing in mid-2019. These figures represent the lowest coupon in the Group’s history, decreasing the Group’s average cost of financing to the rate of 2.76% p.a. The two remaining tranches of CPI ByTy, a.s. bonds were refinanced, amounting to EUR 11.5 million and EUR 19.2 million which were repaid from equity. This issuance reflects the immense market interest, which has significantly exceeded the total volume of the actual subscription amount. In June, the Group issued 515 million new ordinary shares for a global cash contribution of EUR 51.5 million. The corporate share capital of the Group has increased to EUR 831,061,784.60 represented by 8,310,617,846 shares. The Group’s credit is growing - the company successfully contracted for a new overdraft credit facility from UniCredit Bank to finance its general corporate and operation commitments and our bonds are trading at a premium.
The Group has seen continued development in České Budějovice in the Czech Republic where we see significant potential in long-term investment. The newly redeveloped IGy Shopping centre is scheduled to open in November of this year. Furthermore, the Group continued the refurbishment of its hotel portfolio with the announcement of the expansion project of the Clarion Congress Hotel, České Budějovice. Proceedings with Zbrojovka in Brno continue to gain ground and we look forward to reporting on more progress with the Group’s largest development project.
The Group benefited from favourable market conditions to dispose of assets unsuitable for our existing portfolio. We disposed of Arkády Prostějov shopping centre, a non-core asset comprising of shopping centre located in Prostějov, Czech Republic. Earlier this year, the Group made changes in the structure of its logistics and office portfolio. We again took the opportunity to sell what we see as non-core assets. We disposed of the Capellen office building in luxembourg, the lozorno logistics park in Slovakia and the Purkyňova office building in the Czech Republic.
looking ahead, the market remains buoyant. We will focus on further strengthening the Group’s credit on the capital markets and decreasing the costs of funds. The Group will continue utilising the high-liquidity environment to search for acquisitions that will be complementary to our portfolio, offering positive opportunities of return. Moreover, the Group sees a number of remarkable redevelopment and refurbishment opportunities in its current portfolio. With limited additional risk, the Group can achieve above-market returns, higher income and increased asset quality. The Group’s ambition is to provide our tenants with the optimum service to retain long-term contracts and continue to generate superior professional relationships.
luxembourg, 30 August 2017
Martin Němeček
Chief Executive Officer & Managing Director
C P I P R O P E R T y G R O U P M A N A G E M E N T R E P O R T J U N E 2 0 1 7 / T H E C E O ’ S M E S S A G E

GROUP OVERVIEW
C P I P R O P E R T y G R O U P M A N A G E M E N T R E P O R T J U N E 2 0 1 7 / G R O U P O v E R v I E W
Quadrio, Prague
15
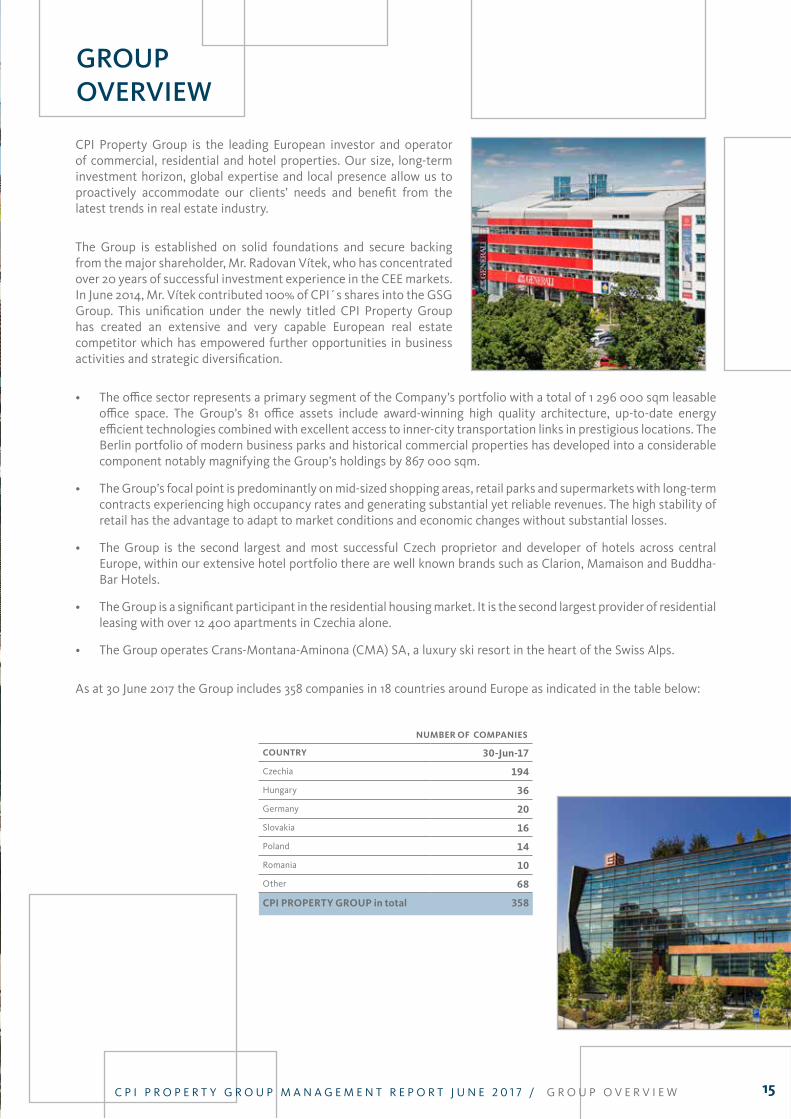
CPI Property Group is the leading European investor and operator of commercial, residential and hotel properties. Our size, long-term investment horizon, global expertise and local presence allow us to proactively accommodate our clients’ needs and benefit from the latest trends in real estate industry.
The Group is established on solid foundations and secure backing from the major shareholder, Mr. Radovan vítek, who has concentrated over 20 years of successful investment experience in the CEE markets. In June 2014, Mr. vítek contributed 100% of CPI´s shares into the GSG Group. This unification under the newly titled CPI Property Group has created an extensive and very capable European real estate competitor which has empowered further opportunities in business activities and strategic diversification.
• The office sector represents a primary segment of the Company’s portfolio with a total of 1 296 000 sqm leasable office space. The Group’s 81 office assets include award-winning high quality architecture, up-to-date energy efficient technologies combined with excellent access to inner-city transportation links in prestigious locations. The Berlin portfolio of modern business parks and historical commercial properties has developed into a considerable component notably magnifying the Group’s holdings by 867 000 sqm.
• The Group’s focal point is predominantly on mid-sized shopping areas, retail parks and supermarkets with long-term contracts experiencing high occupancy rates and generating substantial yet reliable revenues. The high stability of retail has the advantage to adapt to market conditions and economic changes without substantial losses.
• The Group is the second largest and most successful Czech proprietor and developer of hotels across central Europe, within our extensive hotel portfolio there are well known brands such as Clarion, Mamaison and Buddha-Bar Hotels.
• The Group is a significant participant in the residential housing market. It is the second largest provider of residential leasing with over 12 400 apartments in Czechia alone.
• The Group operates Crans-Montana-Aminona (CMA) SA, a luxury ski resort in the heart of the Swiss Alps.
As at 30 June 2017 the Group includes 358 companies in 18 countries around Europe as indicated in the table below:
nUMBER of coMPaniEs
coUntRy 30-Jun-17
Czechia 194
Hungary 36
Germany 20
Slovakia 16
Poland 14
Romania 10
Other 68
cPi PRoPERty gRoUP in total 358
GROUP OVERVIEW
C P I P R O P E R T y G R O U P M A N A G E M E N T R E P O R T J U N E 2 0 1 7 / G R O U P O v E R v I E W

16
GEOGRAPHY OF THE GROUP
C P I P R O P E R T y G R O U P M A N A G E M E N T R E P O R T 2 0 1 6C P I P R O P E R T y G R O U P M A N A G E M E N T R E P O R T J U N E 2 0 1 7 / G R O U P O v E R v I E W
czechiaProperty portfolio value: MEUR 3 230Gross leasable area: 1 874 000 sqmPotential gross saleable area: 1 000 sqmPotential gross leasable area: 7 000 sqmland bank area: 19 084 000 sqmAgriculture land: 231 770 000 sqmNo. of hotel beds: 7 070
GeRmanyProperty portfolio value: MEUR 1 053Gross leasable area: 867 000 sqmland bank area: 13 000 sqm
slovakiaProperty portfolio value: MEUR 110Gross leasable area: 94 000 sqm
italyProperty portfolio value: MEUR 47Potential gross saleable area: 31 000 sqmNo. of hotel beds: 634
hUnGaRyProperty portfolio value: MEUR 515Gross leasable area: 306 000 sqmland bank area: 131 000 sqmNo. of hotel beds: 666
RomaniaProperty portfolio value: MEUR 38Gross leasable area: 11 000 sqmland bank area: 300 000 sqm
fRanceProperty portfolio value: MEUR 181Gross leasable area: 6 000 sqmPotential gross saleable area: 3 000 sqm
sWitzeRlandProperty portfolio value: MEUR 116
RUssiaProperty portfolio value: MEUR 26No. hotel beds: 168
cRoatiaProperty portfolio value: MEUR 168No. hotel beds: 1 646
polandProperty portfolio value: MEUR 223Gross leasable area: 80 000 sqmland bank area: 39 000 sqmNo. of hotel beds: 124
The Group is a real estate company concentrating on long-term investments and the lease of real estate, primarily in the Central European region and Germany. The Group’s activities are focused on rental income generating properties such as retail, office, residential, industry and logistics and operation of its own hotels. Additionally, the Group develops office and retail assets for future rental and specific residential developments for future sale.
PRoPERty PoRtfolio as at 30 JUnE 2017

17C P I P R O P E R T y G R O U P M A N A G E M E N T R E P O R T J U N E 2 0 1 7 / G R O U P O v E R v I E W
In recent years, the Group has grown at a dynamic pace. One of the portfolio growth milestones was the combination of GSG GROUP and CPI in 2014 creating CPI PROPERTy GROUP. In 2015 and especially 2016, Group continues in further major acquisitions and diversifying its portfolio in countries such as Hungary, Poland, Croatia, France, Switzerland and other. The dynamic progress of the Group climaxed in 2017, when the largest real estate transaction of the Group history took place which boosted the Group’s portfolio by more than EUR 600 million. The average growth rate in the value of the Group’s portfolio in the years 2013-2017 reached 18% p.a.
The main reasons for the change in the property portfolio total value in H1 2017 were as follows:
• acquisition of the portfolio of retail and office assets in Czechia, Hungary, Poland and Romania and the acquisition of a hotel asset in Czechia and other transactions, in the total amount of EUR 631 million;
• additions in the total amount of EUR 28 million;
• disposals of in the total amount of EUR 116 million; primarily lozorno industrial park in Slovakia, office asset Capellen in luxembourg;
• valuation gain of EUR 229 million;
• other movements include valuation impact in equity and FX translation.
PROPERTY PORTFOLIO EVOLUTION
5 000
6 000
4 000
3 000
2 000
1 000
02013 2014 2015 2016 H1 2017
CZECHIA 2 017 2 178 2 256 2 647 3 230
GERMANy 538 650 694 1 048 1 053
HUNGARy 271 307 316 319 515
OTHER WESTERN EUROPE 87 78 222 364 344
OTHER CEE 290 340 334 487 565
total 3 203 3 553 3 822 4 865 5 707
Portfolio value 31 Dec 2016
Acquisitions / Additions
Disposals Change in fair value
Other Movements
Portfolio value30 June 2017
3 000
4 000
5 000
6 000
4 865
7 000
DecreaseIncrease
659 116 229 70 5 707
2 000
1 000
0
PRoPERty PoRtfolio ValUE in 2013-2017 (MEUR)
18 C P I P R O P E R T y G R O U P M A N A G E M E N T R E P O R T 2 0 1 6
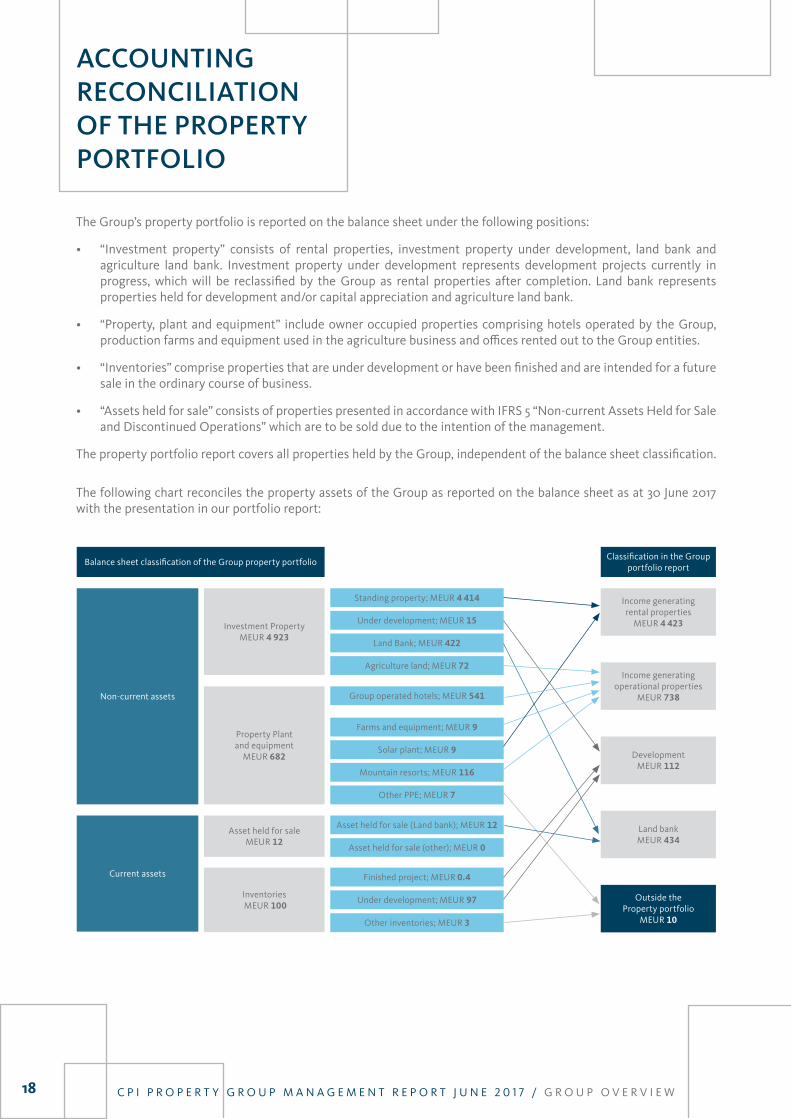
The Group’s property portfolio is reported on the balance sheet under the following positions:
• “Investment property” consists of rental properties, investment property under development, land bank and agriculture land bank. Investment property under development represents development projects currently in progress, which will be reclassified by the Group as rental properties after completion. land bank represents properties held for development and/or capital appreciation and agriculture land bank.
• “Property, plant and equipment” include owner occupied properties comprising hotels operated by the Group, production farms and equipment used in the agriculture business and offices rented out to the Group entities.
• “Inventories” comprise properties that are under development or have been finished and are intended for a future sale in the ordinary course of business.
• “Assets held for sale” consists of properties presented in accordance with IFRS 5 “Non-current Assets Held for Sale and Discontinued Operations” which are to be sold due to the intention of the management.
The property portfolio report covers all properties held by the Group, independent of the balance sheet classification.
The following chart reconciles the property assets of the Group as reported on the balance sheet as at 30 June 2017 with the presentation in our portfolio report:
ACCOUNTING RECONCILIATION OF THE PROPERTY PORTFOLIO
Outside the Property portfolio
MEUR 10
land Bank; MEUR 422
Current assets
Asset held for saleMEUR 12
Inventories MEUR 100
Asset held for sale (land bank); MEUR 12
Asset held for sale (other); MEUR 0
Finished project; MEUR 0.4
Property Plant and equipment
MEUR 682
Under development; MEUR 15
Standing property; MEUR 4 414
Investment Property MEUR 4 923
Non -current assets
land bank MEUR 434
Development MEUR 112
Income generating rental properties
MEUR 4 423
Balance sheet classification of the Group property portfolioClassification in the Group
portfolio report
Income generating operational properties
MEUR 738
Agriculture land; MEUR 72
Group operated hotels; MEUR 541
Other PPE; MEUR 7
Farms and equipment; MEUR 9
Solar plant; MEUR 9
Mountain resorts; MEUR 116
Under development; MEUR 97
Other inventories; MEUR 3
C P I P R O P E R T y G R O U P M A N A G E M E N T R E P O R T J U N E 2 0 1 7 / G R O U P O v E R v I E W

19C P I P R O P E R T y G R O U P M A N A G E M E N T R E P O R T J U N E 2 0 1 7 / G R O U P O v E R v I E W
ECONOMICREVIEW
C P I P R O P E R T y G R O U P M A N A G E M E N T R E P O R T J U N E 2 0 1 7 / E C O N O M I C R E v I E W
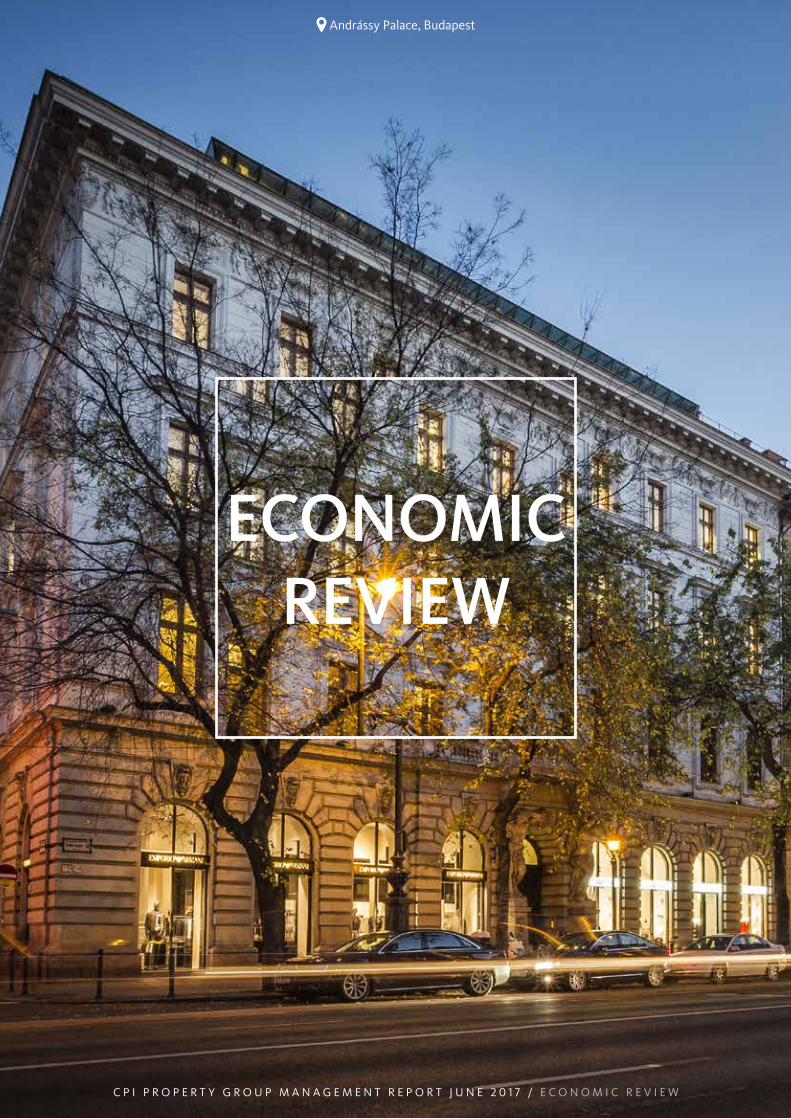
Andrássy Palace, Budapest
21
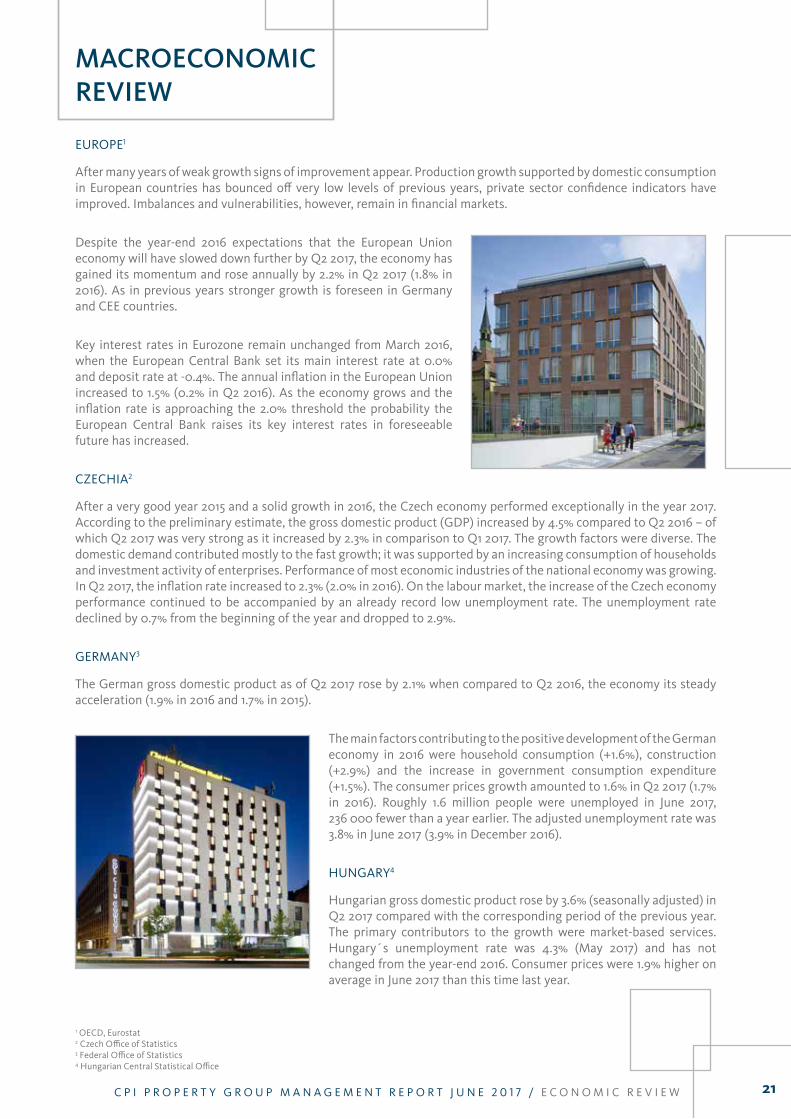
EUROPE1
After many years of weak growth signs of improvement appear. Production growth supported by domestic consumption in European countries has bounced off very low levels of previous years, private sector confidence indicators have improved. Imbalances and vulnerabilities, however, remain in financial markets.
Despite the year-end 2016 expectations that the European Union economy will have slowed down further by Q2 2017, the economy has gained its momentum and rose annually by 2.2% in Q2 2017 (1.8% in 2016). As in previous years stronger growth is foreseen in Germany and CEE countries.
Key interest rates in Eurozone remain unchanged from March 2016, when the European Central Bank set its main interest rate at 0.0% and deposit rate at -0.4%. The annual inflation in the European Union increased to 1.5% (0.2% in Q2 2016). As the economy grows and the inflation rate is approaching the 2.0% threshold the probability the European Central Bank raises its key interest rates in foreseeable future has increased.
CZECHIA2
After a very good year 2015 and a solid growth in 2016, the Czech economy performed exceptionally in the year 2017. According to the preliminary estimate, the gross domestic product (GDP) increased by 4.5% compared to Q2 2016 – of which Q2 2017 was very strong as it increased by 2.3% in comparison to Q1 2017. The growth factors were diverse. The domestic demand contributed mostly to the fast growth; it was supported by an increasing consumption of households and investment activity of enterprises. Performance of most economic industries of the national economy was growing. In Q2 2017, the inflation rate increased to 2.3% (2.0% in 2016). On the labour market, the increase of the Czech economy performance continued to be accompanied by an already record low unemployment rate. The unemployment rate declined by 0.7% from the beginning of the year and dropped to 2.9%.
GERMANy3
The German gross domestic product as of Q2 2017 rose by 2.1% when compared to Q2 2016, the economy its steady acceleration (1.9% in 2016 and 1.7% in 2015).
The main factors contributing to the positive development of the German economy in 2016 were household consumption (+1.6%), construction (+2.9%) and the increase in government consumption expenditure (+1.5%). The consumer prices growth amounted to 1.6% in Q2 2017 (1.7% in 2016). Roughly 1.6 million people were unemployed in June 2017, 236 000 fewer than a year earlier. The adjusted unemployment rate was 3.8% in June 2017 (3.9% in December 2016).
HUNGARy4
Hungarian gross domestic product rose by 3.6% (seasonally adjusted) in Q2 2017 compared with the corresponding period of the previous year. The primary contributors to the growth were market-based services. Hungary´s unemployment rate was 4.3% (May 2017) and has not changed from the year-end 2016. Consumer prices were 1.9% higher on average in June 2017 than this time last year.
MACROECONOMICREVIEW
1 OECD, Eurostat2 Czech Office of Statistics3 Federal Office of Statistics4 Hungarian Central Statistical Office
C P I P R O P E R T y G R O U P M A N A G E M E N T R E P O R T J U N E 2 0 1 7 / E C O N O M I C R E v I E W

22
POlAND5
The Polish economy grew very fast by 3.9% (seasonally adjusted) in Q2 2017 and is accelerating compared to previous period (2.8% in 2016). The unemployment rate in 2017 keeps a downward trend, reaching 7.1% in June 2017 (8.3% in December 2016) and was lowest since 2011. The consumer price level increased annually by 1.3% (-0.2% in December 2016).
KEy MacRo figUREs foR gRoUP coRE EconoMiEs
coUntRy gRoWtH RatE of REal gDP6
annUal inflation RatEs7
RatE of UnEMPloyMEnt gRoss PUBlic DEBt JUnE 20178
(% of gDP)
Germany 2.1% 1.6% 3.8% 67.0%
Czechia 4.5% 2.3% 2.9% 36.4%
Hungary 3.6% 1.9% 4.3% 72.7%
Poland 3.9% 1.3% 7.1% 55.1%
EU average 2.3% 1.5% 9.1% 90.5%
Source: Eurostat
As can be seen in Figure X-y the Group core economies belong among developed markets that have higher than above-average performance and key macroeconomic characteristics. With Germany steadily gaining impetus in its performance, Czechia, Poland and Hungary are even 1 to 2 percentage points above EU average growth in GDP. All the Group core economies are out of deflation zone and still under the inflation target – the only economy hitting above the inflation threshold of 2.0% is Czechia. Unemployment rates of Czechia, Germany and Hungary were among the lowest in previous periods; during the first 6 months of 2017, also Polish rate of unemployment has fallen by almost 1 percentage point. Also, the financial discipline of public sector in all of the Group core economies is among the best in the European Union.
CURRENCIES
Unlike in previous years the Euro appreciated by 8% against US dollar, by 2% against Swiss franc and by 3% against the Pound sterling.
C P I P R O P E R T y G R O U P M A N A G E M E N T R E P O R T J U N E 2 0 1 7 / E C O N O M I C R E v I E W
5 Central Statistical Office of Poland6 annual growth rate compared to Q2 20167 annual growth rate compared to Q2 20168 own calculations

23
on 6 aPRil 2017 tHE czEcH national BanK EnDED its KoRUna flooR coMMitMEnt…
…anD tHE czEcH KoRUna Has BEEn stEaDily aPPREciating sincE tHEn
by pursuing its primary objective – price stability – the czech central bank (Čnb) targets inflation. since 2010 the inflation target in terms of the consumer price index has been set at 2% with a tolerance band of ±1 percentage point. the standard instrument is a key interest rate set by Čnb. When this rate technically reached zero in 2013, Čnb decided to temporarily use exchange rate as alternative instrument to meet its primary objective and started intervening on the market in november 2013.
the exit from the koruna floor commitment after 4 years is the first step towards a gradual moderation of the expansionary nature of the monetary conditions.
moderation of expansionary monetary policy has/would have the main following effects on Group financial statements, especially due to different functional currencies within the Group:
Monetary tool: exit from the koruna floor
intercompany loans
• revaluationofintragrouploans–theGrouphasmanyfinancingtransactionsbetweenGroupentitieswithdifferentfunctionalcurrencies; thesetransactionsbyitsnaturecannotbeeffectivelyhedgedbyFXderivatives;
• appreciationofCZKtoEURforeignexchangelossintheconsolidatedincomestatement;
• excludedfromFFOcalculationasanon-casheffect;
property portfolio
• revaluationofCzechpropertyportfolioinCzechkoruna–thiseffectisrecognisedintheconsolidatedequityonly;
• appreciationofCZKtoEURnoeffectintheconsolidatedincomestatement;
• revaluationofCzechpropertyportfoliodenominatedinEUR–theeffectisrecogniseddireclyintheincomestatement;
• appreciationofCZKtoEURforeignexchangelossintheconsolidatedincomestatement;
• excludedfromFFOcalculationasanon-casheffect;
liabilities
• revaluationofliabilitiesofCzechentitiesdenominatedinCzechkoruna–thiseffectisrecognisedintheconsolidatedequityonly;
• appreciationofCZKtoEURnoeffectintheconsolidatedincomestatement;
• revaluationofliabilitiesofCzechentitiesdenominatedinEUR–ingeneral,theeffectisrecogniseddireclyintheincomestatement,asforeign exchangeloss/profit;
• appreciationofCZKtoEURprofitintheconsolidatedincomestatement;
• howeverthiseffectisverylimitedasthepredominantpartoftheCzechentitiesapplythehedgeaccountingforEURdenominated bankfinancing,i.e.suchFXimpactisdirectlyrecognisedwithintheconsolidatedequityonly;
• excludedfromFFOcalculationasanon-casheffect;
20152013 2014 2016 2017
CZK/EUR
25
26
27
28
29
Čnb started koruna floor commitment
Čnb ended koruna floor commitment

24
INTRODUCTION
The condensed consolidated interim financial statements for the six months ended 30 June 2017 have been prepared in accordance with IAS 34 Interim Financial Reporting as adopted by European Union, which include the application of the fair value method.
Since the property portfolio owned by the Group must be stated at fair value (present value), the regular valuation of these properties by independent experts is recommended. The Group’s management analysed the situation on the real estate market at the time together with current yields and then applied discount rates and other factors used by independent valuators in their appraisals as of 31 December 2016. As a result, the fair value of the majority of the property portfolio as of 30 June 2017 was determined based on the management’s analysis described above and it does not significantly differ from the fair value as of 31 December 2016.
In instances where there have been indications of significant changes and therefore with potential impact on the property value during the first half of 2017, the value of the property has been updated based on the external or internal appraisals as of 30 June 2017.
The property portfolio expert valuation was based on reports issued by:
• Cushman&Wakefield (Prague, Warsaw, Paris);
• Savills (Berlin);
• RSM TACOMA (Prague, Bratislava);
• Jones lang laSalle (Budapest, Bucharest, Prague, Bratislava, Warsaw);
• other valuers (Galtier, Hampton, Mazars, CBRE, Ey, Freraul Expertises etc.).
PROPERTYVALUATION
C P I P R O P E R T y G R O U P M A N A G E M E N T R E P O R T J U N E 2 0 1 7 / E C O N O M I C R E v I E W
05. 06.04.
03.
02.
01.
01. Cushman&Wakefield: 33%
02. Jones lang laSalle: 24%
03. Savills: 18%
04. TACOMA: 9%
05. Internal: 8%
06. Other: 8%
PRoPERtyPoRtfolioValUation
C P I P R O P E R T y G R O U P M A N A G E M E N T R E P O R T J U N E 2 0 1 7 / E C O N O M I C R E v I E W

2524 C P I P R O P E R T y G R O U P M A N A G E M E N T R E P O R T J U N E 2 0 1 7 / E C O N O M I C R E v I E W
czEcHia1
RETAIl MARKET
Positive economic situation represented by low inflation and the low rate of unemployment in Czechia is supported by an increase in private consumption. Overall retail trade increased by 6.6% y-o-y in the second half of 2017 and in 2018 a slight slowdown of retail spending is expected.
By Q2 2017, the total volume of shopping centres in Czechia exceeded 2 350 000 sqm of modern retail space, with only one shopping centre opened in 2017. Currently there are only two shopping centres under construction: expansion of Centrum Chodov (Unibail-Rodamco) and expansion of IGy České Budějovice (CPIPG).
Retail investment market is healthy and since 2013 significant changes in the ownership of shopping centres have taken place. Half of shopping centre space has been transacted or has the potential to be transacted. Strong demand compresses the yield; prime yield dropped from 6.25% in 2013 to 4.75% in 2017.
The prime shopping centre rents increased by 13% y-o-y in Prague. In regions, the prime shopping centre rent remained stable.
GROUP PORTFOlIO
Occupancy rates in Group portfolio remain high, the average rate is well above 90% for the couple of recent periods (2017: 93.3%). As the strategy of the Group is to focus on the acquisition of prime shopping centres, the occupancy is
expected to rise even higher. In 2017, GlA of shopping centres increased by another 100 000 sqm of a high quality asset portfolio based in major cities. Positive trends on the Czech retail market were demonstrated by a robust increase in the revaluation of the Group's portfolio which amounted to EUR 57 million (2016: EUR 15 million).
OFFICE MARKET
Office market is concentrated in the capital and regional cities of the country. Strong demand along with low levels of new supply caused vacancy rates to fall to new minimum, post-crisis levels.
In Prague, only a total of 25 000 sqm of modern office space was delivered to the market. vacancy rates decreased to a new record level of 8.6% in 2017. Gross office take-up in Q2 2017 reached 154 600 sqm, making it the second busiest quarter in the history of the market. New office space to be delivered in 2017 amounts to 125 000 sqm. Despite this the occupier demand should keep the vacancy rate below 10%.
Brno office market has been dynamically growing in past few years as result of the availability of highly qualified labour obtainable at lower cost in comparison to Prague and attraction of a large share of FDI. yields in Brno have decreased, confirming high interest in the area.
GROUP PORTFOlIO
Group portfolio records very low vacancy rates, exceptionally it is higher than 10%. In 2017, Group portfolio’s average vacancy rate remained at an already low 5.3% (2016: 5.2%). Although GlA in 2017 changed a little, there was a dynamic shift towards more quality office premises, for example acquisition of office premises in the centre of Prague. Half year revaluation gain at EUR 13 million (2016: EUR 16 million) shows the Group portfolio gaining upward momentum in the second half of 2017.
1 Jll, Cushman & Wakefield, Colliers

26C P I P R O P E R T y G R O U P M A N A G E M E N T R E P O R T J U N E 2 0 1 7 / E C O N O M I C R E v I E W
2 HB index announced by Hypoteční banka3 Jll, Cushman & Wakefield
RESIDENTIAl MARKET
In Q2 2017, the real estate price index2 confirmed another period of increase in prices of residential real estate which already started at the beginning of 2014. land prices increased by 11.9% y-o-y and prices of flats increased by 12.1% y-o-y due to the growing demand. The average market price of land and the flats reached 137.8 and 117.6 (2010 = 100).
GROUP PORTFOlIO
Group portfolio is a steady business with increasing revenues every year. In 2016, the revenues were higher than CZK 500 million (EUR 18 million) for the first time and the revenues in 2017 confirm this upward trend. The Group’s strategy is to keep the portfolio as a source of steady cashflow. Prices of residential assets on the Czech market are accelerating and the Group portfolio goes hand in hand with this trend. Revaluation shows an increase by EUR 54 million (2016: EUR 13 million).
sUMMaRy of tHE czEcH PoRtfolio
REValUation gain / (loss) 2017
faiR ValUE JUnE 2017 REValUation gain / (loss) 2016
faiR ValUE 2016
Retail 57 1 297 15 919
Office 13 762 16 712
Residential 54 351 13 287
land Bank 69 383 -3 302
Hotels -5 284 -1 289
Other 0 153 17 138
total 188 3 230 57 2 647
gERMany 3
OFFICE MARKET
German economy is performing well with 2.1% y-o-y growth in GDP in Q2 2017. Consumer index measured by the GfK Consumer Climate Index reached its highest level of the last three years; ifo business climate rose to a new record at
the end of June 2017.
Berlin recorded strong demand for office space with 412 000 sqm take-up in the first half of 2017. Prime office yields decreased by 65 percentage points from the end of 2016 to 3.25% at Q2 2017. Prime office rents increased by more than 8% over the last 12 months, being the period with the fastest growth within the last 5 years.
GROUP PORTFOlIO
The Berlin portfolio remains stable for several periods. The management analysed the current development and decided not to have Berlin portfolio revalued as according to its best estimate the value of portfolio corresponds to values calculated at the year-end 2016. In the previous period Berlin portfolio experienced a huge shift upward due to market trends and amounted to EUR 343 million.
sUMMaRy of tHE BERlin PoRtfolio
REValUation gain / (loss) 2017
faiR ValUE 2017 REValUation gain / (loss) 2016
faiR ValUE 2016
Office 0 1 037 343 1 032
land bank 0 7 0 7
Other 0 9 2 9
total 0 1 053 345 1 048

2726 C P I P R O P E R T y G R O U P M A N A G E M E N T R E P O R T J U N E 2 0 1 7 / E C O N O M I C R E v I E W
HUngaRy4
OFFICE MARKET
Office market is concentrated in the capital city Budapest. Given the fact that there is limited new space coming through during the remainder of 2017 and occupier activity is strong, there is a high probability that headline rents will increase further as availability continues to reduce.
At Q2 2017, the total stock in Budapest reached 3.35 million sqm. The vacancy rate stood at 8.6%, which is 0.9% lower compared with 2016 Q4 data and the lowest rate in post-crisis period. Prime office rents increased by 4.8% in last 12 month period, this is the fastest growth rate in the recent 5 years period.
The new supply in the following years to 2019 is expected to be at 720 000 sqm. The significant increase in supply is expected in 2018, when 211 000 sqm is expected to be delivered to the market. Net take up is expected to outpace new deliveries until early 2018, which suggest further decrease in vacancy rate in 2017.
GROUP PORTFOlIO
Group portfolio’s vacancy rate is still above market average vacancy rate but the trend is very promising as it dropped from 22% in 2016 to 18% in 2017. Group portfolio in Budapest has been strengthened by the grade A office premises Andrássy Complex. Revaluation in half-year 2017 reached EUR 3 million (2016: EUR 13 million). With the revitalised Budapest market we expect the rate of revaluation gains to continue at a steady pace in the following years.
RETAIl MARKET
Rising household incomes will maintain high levels of consumption, supported by a tight labour market creating wage pressure which has seen a rise of 4.1% in 2017. The continuous increase reflects the country’s positive economic performance and strong consumer confidence.
The Hungarian market is concentrated in the Budapest area as 20% of population live there and the differences in spending per capita between the capital and countryside is significant.
Occupier demand for prime high street and shopping centre retail in Budapest remained strong and prime rents are under pressure to rise. Rental growth amounted to the vicinity of a 20% threshold. In Budapest, very few projects are under construction with expected delivery in 2019 at the earliest, the rental growth should remain at already strong levels.
GROUP PORTFOlIO
Our vacancy rates improved from already low levels to 5.8% (2016:12.3%). Part of the improvement is attributed to the acquisition of two retail assets in Budapest with total GlA above 80 000 sqm. The private consumption in Hungary is high and this is reflected in this year's revaluation gain of EUR 21 million (2016: EUR 1 million). Our strategy is to expand on the retail market in Budapest and in the regional cities and utilise upward momentum in Hungarian macroeconomic development. With government policy of lowering personal taxes and vAT rates we expect retail sales growth to keep up already impressive levels in the forthcoming years.
sUMMaRy of tHE HUngaRian PoRtfolio
HUngaRy REValUation gain / (loss) 2017
faiR ValUE 2017 REValUation gain / (loss) 2016
faiR ValUE 2016
Retail 21 212 1 37
Office 3 204 13 184
Hotels 0 43 0 43
Other 0 56 5 55
total 24 515 19 319
4 Cushman & Wakefield, Jll

28C P I P R O P E R T y G R O U P M A N A G E M E N T R E P O R T J U N E 2 0 1 7 / E C O N O M I C R E v I E W
otHER EURoPE 5
HOTEl MARKETS IN CEE
The sub-prime crisis followed by the global economic meltdown pushed away investors that were historically interested in buying hotels in the region. These investors then started focusing largely at prime opportunities in key western European cities, eventually prime products in gateway cities of CEE region such as Prague, Warsaw or Budapest. The global economic market has during the past years shown signs of recovery from the most recent global financial crisis. The year 2014 was a strong year in terms of economic growth in the western world. Because of this growth, investors resurfaced in the hotel industry with a strong focus on the European market. The investment market gained momentum and from 2014 showed improvements in the number of transactions in the CEE region.
According to the Croatian Ministry of Tourism revenues from tourism increased in 2016 by 8.5% compared to 2015. The share of the tourism industry on Croatian GDP is around 19% with and is increasing every year.
GROUP PORTFOlIO
Recently, hotel portfolio became the third most important business segment in the Group. In 2016, the Group entered the Croatian market by extensive acquisitions of Hvar hotels. From its perspective, the Group regards investment into seaside resorts as a contribution to an effectively diversified portfolio of assets. The Croatian tourism market is experiencing a boom as demand by people of Western Europe jumped in 2016 to a new historical record (by tourist arrivals and tourist nights). If there is no external shock, this trend will undoubtedly continue to keep high levels of growth as tourist infrastructure develops rapidly through massive investment.
sUMMaRy of tHE otHER6 EURoPE PoRtfolio
otHER EURoPE REValUation gain / (loss) 2017
faiR ValUE 2017 REValUation gain / (loss) 2016
faiR ValUE 2016
Retail 11 274 -10 124
Office 0 67 2 89
Hotels -1 252 3 252
Other 0 316 -22 386
total 10 909 -27 851
5 Cushman & Wakefield6 includes France, Switzerland, Poland, Slovakia, Croatia, Italy, Russia

2928 C P I P R O P E R T y G R O U P M A N A G E M E N T R E P O R T J U N E 2 0 1 7 / E C O N O M I C R E v I E WC P I P R O P E R T y G R O U P M A N A G E M E N T R E P O R T J U N E 2 0 1 7 / E C O N O M I C R E v I E W

PORTFOLIOSEGMENTS
C P I P R O P E R T y G R O U P M A N A G E M E N T R E P O R T J U N E 2 0 1 7 / P O R T F O l I O S E G M E N T S
Citypark, Jihlava
31
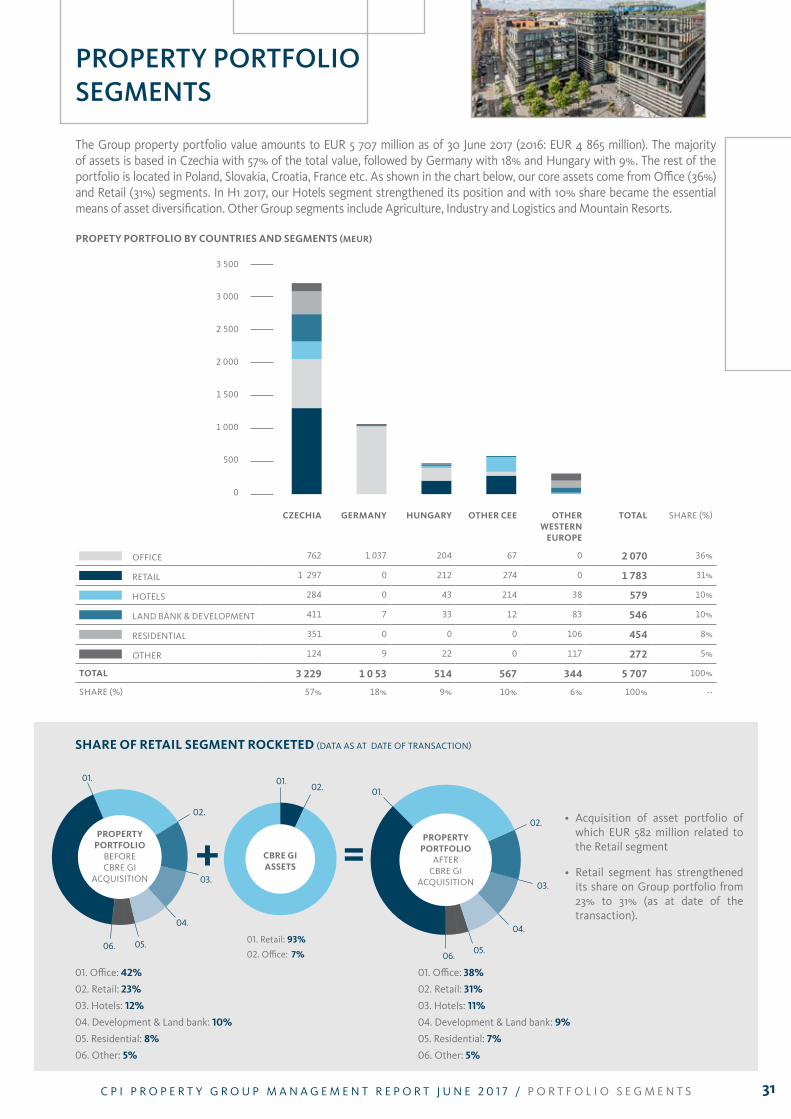
The Group property portfolio value amounts to EUR 5 707 million as of 30 June 2017 (2016: EUR 4 865 million). The majority of assets is based in Czechia with 57% of the total value, followed by Germany with 18% and Hungary with 9%. The rest of the portfolio is located in Poland, Slovakia, Croatia, France etc. As shown in the chart below, our core assets come from Office (36%) and Retail (31%) segments. In H1 2017, our Hotels segment strengthened its position and with 10% share became the essential means of asset diversification. Other Group segments include Agriculture, Industry and logistics and Mountain Resorts.
PROPERTY PORTFOLIOSEGMENTS
C P I P R O P E R T y G R O U P M A N A G E M E N T R E P O R T J U N E 2 0 1 7 / P O R T F O l I O S E G M E N T S
PRoPEty PoRtfolio By coUntRiEs anD sEgMEnts (MEUR)
3 000
3 500
2 500
2 000
1 500
1 000
500
0
czEcHia gERMany HUngaRy otHER cEE otHER WEstERn
EURoPE
total SHARE (%)
OFFICE 762 1 037 204 67 0 2 070 36%
RETAIl 1 297 0 212 274 0 1 783 31%
HOTElS 284 0 43 214 38 579 10%
lAND BANK & DEvElOPMENT 411 7 33 12 83 546 10%
RESIDENTIAl 351 0 0 0 106 454 8%
OTHER 124 9 22 0 117 272 5%
total 3 229 1 0 53 514 567 344 5 707 100%
SHARE (%) 57% 18% 9% 10% 6% 100% --
01. Retail: 93%
02. Office: 7%
01. Office: 38%
02. Retail: 31%
03. Hotels: 11%
04. Development & land bank: 9%
05. Residential: 7%
06. Other: 5%
01. Office: 42%
02. Retail: 23%
03. Hotels: 12%
04. Development & land bank: 10%
05. Residential: 8%
06. Other: 5%
01.02.
cBRE giassEts+ =
05.06.
01.
02.
03.
04.
PRoPERty PoRtfolio
BEFORECBRE GI
ACQUISITION
05.06.
01.
02.
03.
04.
PRoPERty PoRtfolio
AFTERCBRE GI
ACQUISITION
• Acquisition of asset portfolio of which EUR 582 million related to the Retail segment
• Retail segment has strengthened its share on Group portfolio from 23% to 31% (as at date of the transaction).
sHaRE of REtail sEgMEnt RocKEtED (DATA AS AT DATE OF TRANSACTION)

OFFICE
C P I P R O P E R T y G R O U P M A N A G E M E N T R E P O R T J U N E 2 0 1 7 / O F F I C E
Quadrio, Prague
33
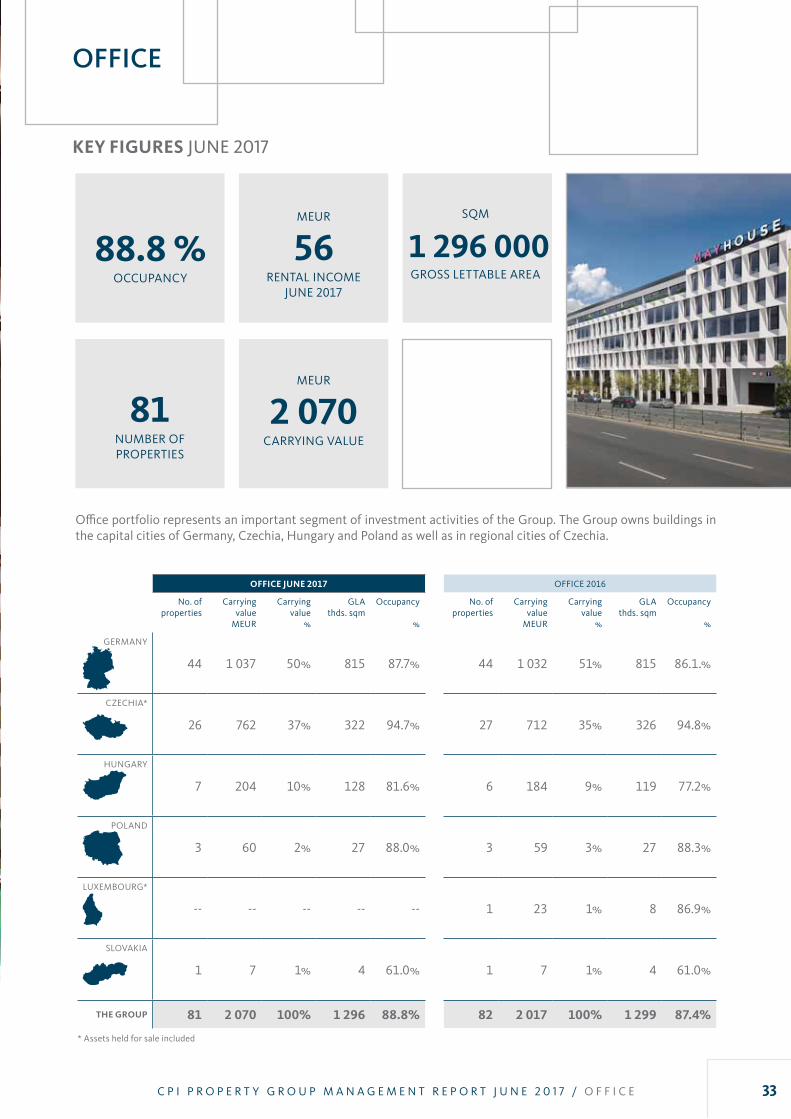
KEy figUREs JUNE 2017
81NUMBER OF PROPERTIES
88.8 %OCCUPANCy
SQM
1 296 000GROSS lETTABlE AREA
MEUR
56RENTAl INCOME
JUNE 2017
MEUR
2 070CARRyING vAlUE
Office portfolio represents an important segment of investment activities of the Group. The Group owns buildings in the capital cities of Germany, Czechia, Hungary and Poland as well as in regional cities of Czechia.
C P I P R O P E R T y G R O U P M A N A G E M E N T R E P O R T J U N E 2 0 1 7 / O F F I C E
officE JUnE 2017 OFFICE 2016
No. of properties
Carryingvalue
MEUR
Carrying value
%
GlAthds. sqm
Occupancy
%
No. of properties
Carryingvalue
MEUR
Carrying value
%
GlAthds. sqm
Occupancy
%
GERMANy
44 1 037 50% 815 87.7% 44 1 032 51% 815 86.1.%
CZECHIA*
26 762 37% 322 94.7% 27 712 35% 326 94.8%
HUNGARy
7 204 10% 128 81.6% 6 184 9% 119 77.2%
POlAND
3 60 2% 27 88.0% 3 59 3% 27 88.3%
lUXEMBOURG*
-- -- -- -- -- 1 23 1% 8 86.9%
SlOvAKIA
1 7 1% 4 61.0% 1 7 1% 4 61.0%
tHE gRoUP 81 2 070 100% 1 296 88.8% 82 2 017 100% 1 299 87.4%
* Assets held for sale included
OFFICE
34
tHE Most iMPoRtant assEts in tHE officE PoRtfolio inclUDE:
QUADRIO, PRAGUE, CZECHIA
Quadrio is a complex of six buildings at Národní třída metro station in Prague’s city centre. The complex offers commercial space for rent (office area: 16 400 sqm) and a separate deluxe residential apartments for discerning clients. The outdoor plaza is enhanced by David Černý’s star attraction, a statue of Franz Kafka, a 10 metre high, 42 segmented revolving head complimented by surrounding greenery and outdoor restaurants.
GSG-HOF HElMHOlTZSTRASE, BERlIN, GERMANy
located where OSRAM once produced the world-famous light bulbs, young and innovative companies can be found today. The renovated GSG-HOF is situated in Campus Charlottenburg with its internationally significant research facilities. Office space, factory loft or commercial space – the areas offered ranges from 70 sqm for offices to about 730 sqm for commercial space. Companies from the business fields of telematics and IT application can move into office rooms at the “European Telematics Factory“.
Office portfolio is one of the leading segments in the Group portfolio. The office property is spread evenly between major office locations and strong regional economic centres in Germany, Czechia, Hungary and other CEE countries. The occupancy rates are gradually rising and approach to 90% on Group level.
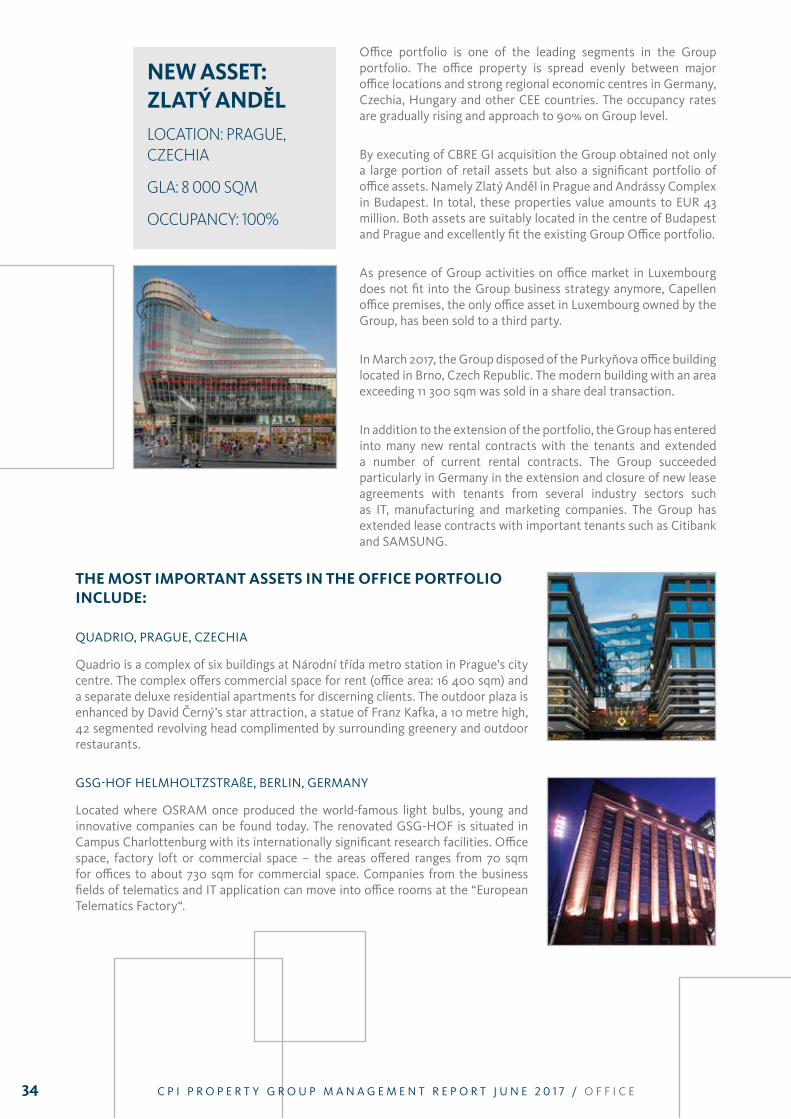
By executing of CBRE GI acquisition the Group obtained not only a large portion of retail assets but also a significant portfolio of office assets. Namely Zlatý Anděl in Prague and Andrássy Complex in Budapest. In total, these properties value amounts to EUR 43 million. Both assets are suitably located in the centre of Budapest and Prague and excellently fit the existing Group Office portfolio.
As presence of Group activities on office market in luxembourg does not fit into the Group business strategy anymore, Capellen office premises, the only office asset in luxembourg owned by the Group, has been sold to a third party.
In March 2017, the Group disposed of the Purkyňova office building located in Brno, Czech Republic. The modern building with an area exceeding 11 300 sqm was sold in a share deal transaction.
In addition to the extension of the portfolio, the Group has entered into many new rental contracts with the tenants and extended a number of current rental contracts. The Group succeeded particularly in Germany in the extension and closure of new lease agreements with tenants from several industry sectors such as IT, manufacturing and marketing companies. The Group has extended lease contracts with important tenants such as Citibank and SAMSUNG.
nEW assEt: zlatý anDěllocation: pRaGUe, czechia
Gla: 8 000 sqm
occUpancy: 100%
C P I P R O P E R T y G R O U P M A N A G E M E N T R E P O R T J U N E 2 0 1 7 / O F F I C E
35
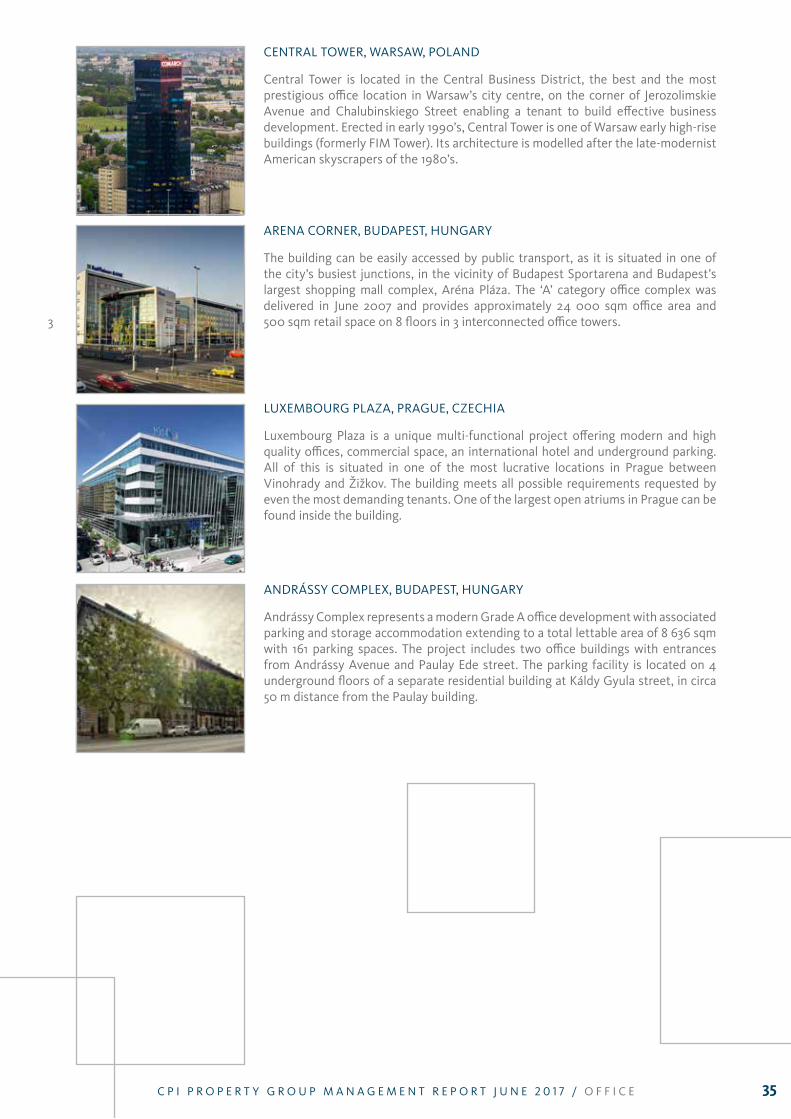
CENTRAl TOWER, WARSAW, POlAND
Central Tower is located in the Central Business District, the best and the most prestigious office location in Warsaw’s city centre, on the corner of Jerozolimskie Avenue and Chalubinskiego Street enabling a tenant to build effective business development. Erected in early 1990’s, Central Tower is one of Warsaw early high-rise buildings (formerly FIM Tower). Its architecture is modelled after the late-modernist American skyscrapers of the 1980’s.
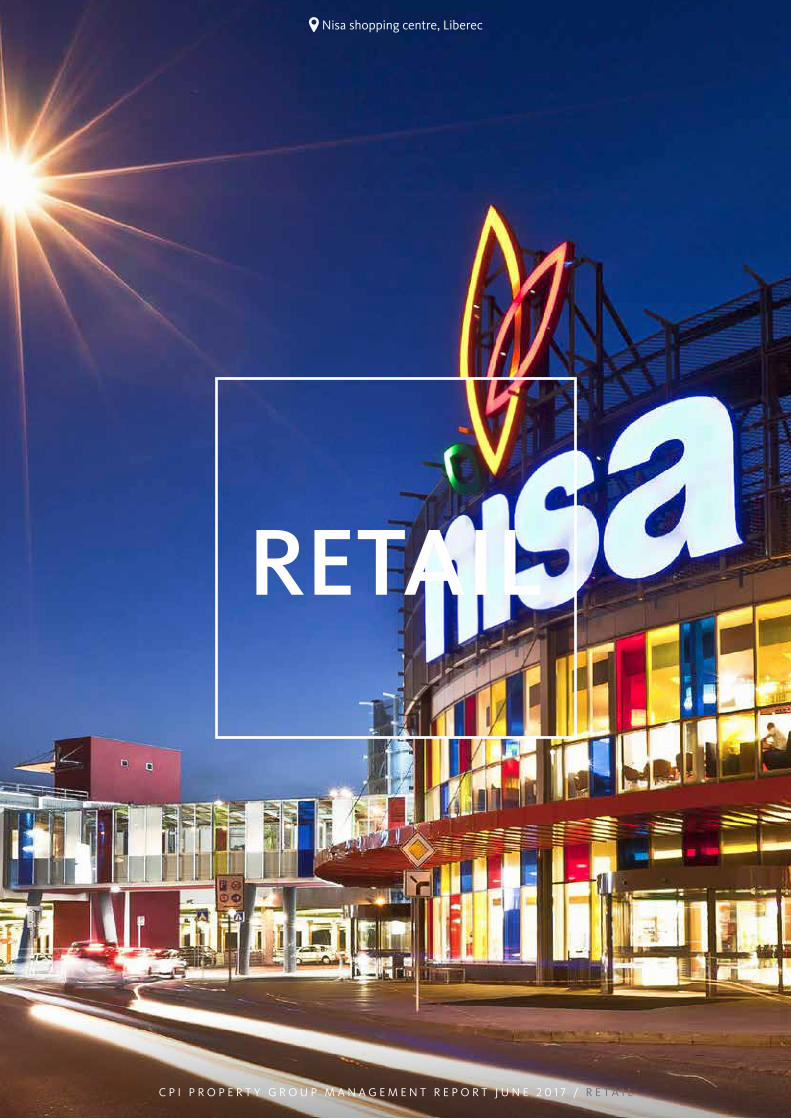
ARENA CORNER, BUDAPEST, HUNGARy
The building can be easily accessed by public transport, as it is situated in one of the city’s busiest junctions, in the vicinity of Budapest Sportarena and Budapest’s largest shopping mall complex, Aréna Pláza. The ‘A’ category office complex was delivered in June 2007 and provides approximately 24 000 sqm office area and
3 500 sqm retail space on 8 floors in 3 interconnected office towers.
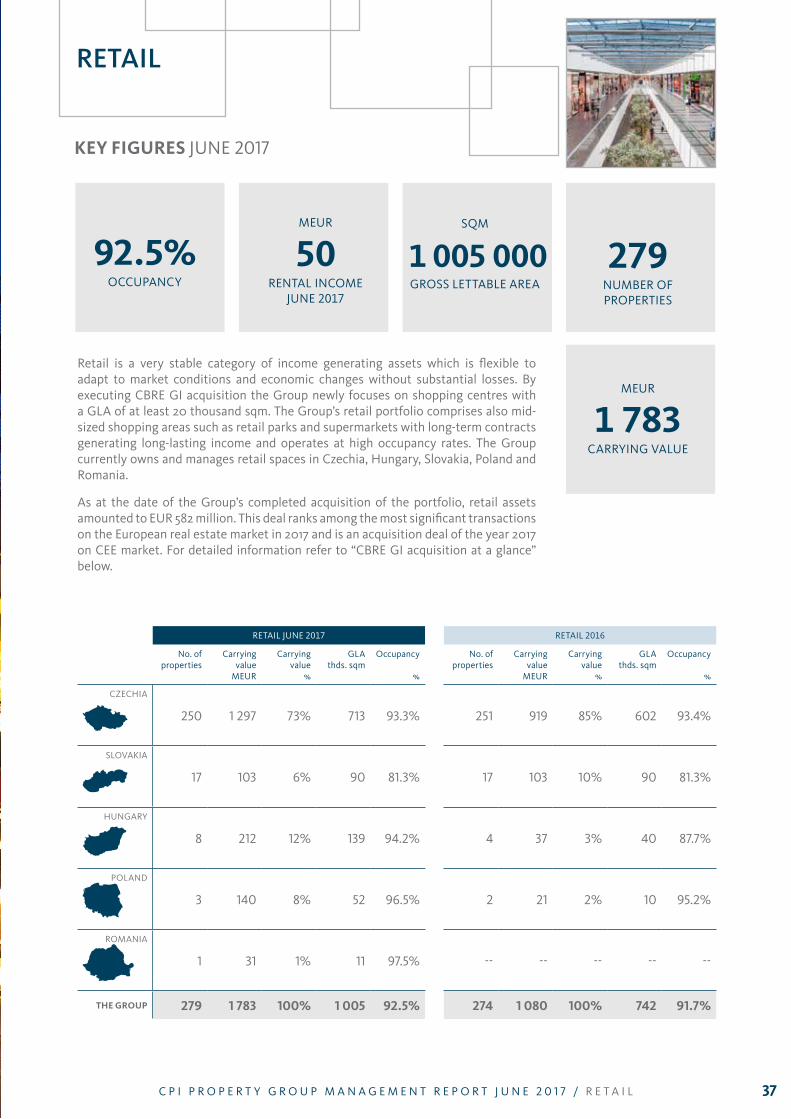
lUXEMBOURG PlAZA, PRAGUE, CZECHIA
luxembourg Plaza is a unique multi-functional project offering modern and high quality offices, commercial space, an international hotel and underground parking. All of this is situated in one of the most lucrative locations in Prague between vinohrady and Žižkov. The building meets all possible requirements requested by even the most demanding tenants. One of the largest open atriums in Prague can be found inside the building.
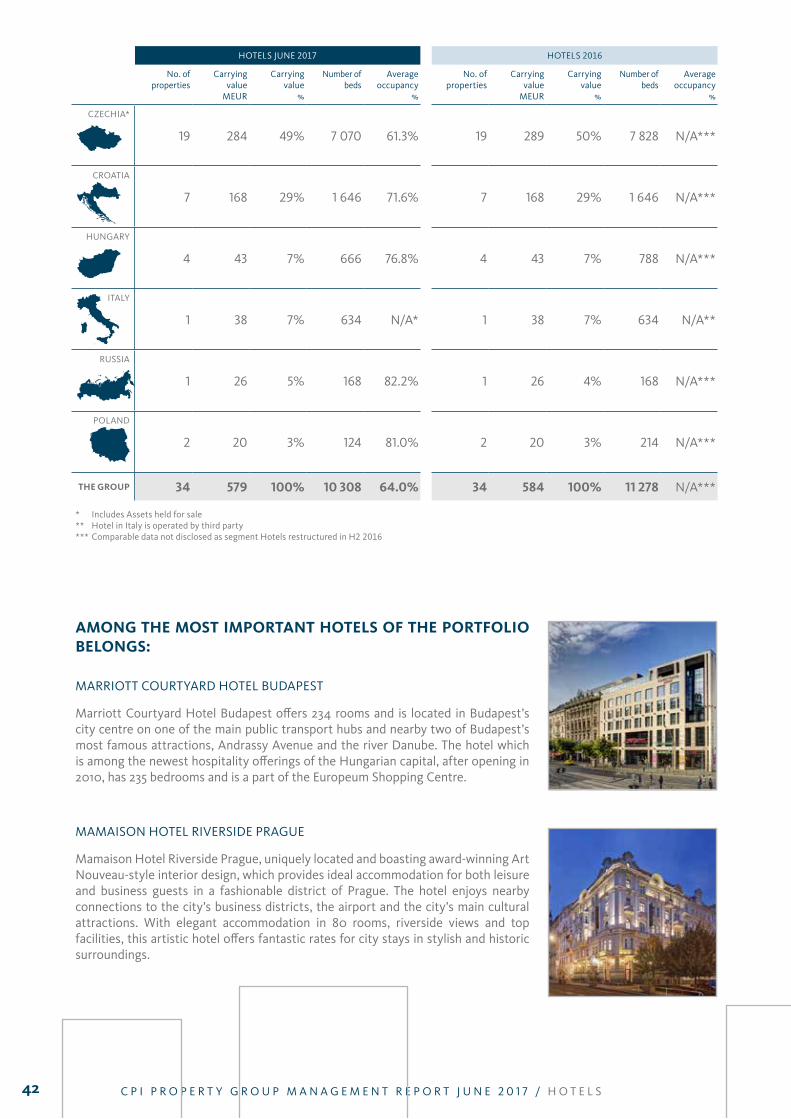
ANDRÁSSy COMPlEX, BUDAPEST, HUNGARy
Andrássy Complex represents a modern Grade A office development with associated parking and storage accommodation extending to a total lettable area of 8 636 sqm with 161 parking spaces. The project includes two office buildings with entrances from Andrássy Avenue and Paulay Ede street. The parking facility is located on 4 underground floors of a separate residential building at Káldy Gyula street, in circa 50 m distance from the Paulay building.
C P I P R O P E R T y G R O U P M A N A G E M E N T R E P O R T J U N E 2 0 1 7 / O F F I C E
RETAIL
C P I P R O P E R T y G R O U P M A N A G E M E N T R E P O R T J U N E 2 0 1 7 / R E T A I l
Nisa shopping centre, liberec
37
KEy figUREs JUNE 2017
279NUMBER OF PROPERTIES
92.5%OCCUPANCy
SQM
1 005 000GROSS lETTABlE AREA
MEUR
50RENTAl INCOME
JUNE 2017
MEUR
1 783CARRyING vAlUE
RETAIL
Retail is a very stable category of income generating assets which is flexible to adapt to market conditions and economic changes without substantial losses. By executing CBRE GI acquisition the Group newly focuses on shopping centres with a GlA of at least 20 thousand sqm. The Group’s retail portfolio comprises also mid-sized shopping areas such as retail parks and supermarkets with long-term contracts generating long-lasting income and operates at high occupancy rates. The Group currently owns and manages retail spaces in Czechia, Hungary, Slovakia, Poland and Romania.
As at the date of the Group’s completed acquisition of the portfolio, retail assets amounted to EUR 582 million. This deal ranks among the most significant transactions on the European real estate market in 2017 and is an acquisition deal of the year 2017 on CEE market. For detailed information refer to “CBRE GI acquisition at a glance” below.
C P I P R O P E R T y G R O U P M A N A G E M E N T R E P O R T J U N E 2 0 1 7 / R E T A I l
RETAIl JUNE 2017 RETAIl 2016
No. of properties
Carryingvalue
MEUR
Carrying value
%
GlAthds. sqm
Occupancy
%
No. of properties
Carryingvalue
MEUR
Carrying value
%
GlAthds. sqm
Occupancy
%
CZECHIA
250 1 297 73% 713 93.3% 251 919 85% 602 93.4%
SlOvAKIA
17 103 6% 90 81.3% 17 103 10% 90 81.3%
HUNGARy
8 212 12% 139 94.2% 4 37 3% 40 87.7%
POlAND
3 140 8% 52 96.5% 2 21 2% 10 95.2%
ROMANIA
1 31 1% 11 97.5% -- -- -- -- --
tHE gRoUP 279 1 783 100% 1 005 92.5% 274 1 080 100% 742 91.7%

38
The portfolio constantly maintains a high occupancy rate of well above 90%. One of the main reasons is that the core Czech market has performed very well in recent periods and retail sales maintain high rates of growth. Another main reason is the CBRE GI acquisition comprising retail portfolio with already high occupancy rates.
The Retail portfolio provides approximately 1 005 000 sqm of lettable area which can be further divided as follows:
• Retail warehouse which comprise supermarkets, hypermarkets, hobby markets and retail parks of about 439 000 sqm of lettable area;
• Shopping centres and galleries of approximately 449 000 sqm of lettable area;
• Special properties provide approximately 117 000 sqm of lettable area.
Excluding the tenants of the portfolio’s new premises, the Group has entered into a number of new leases with the tenants and extended a number of current rental contracts. Among the new tenants reside companies representing brands such as Billa, Sportisimo, Citibank, PlANEO elektro or KIK textil. Current rental contracts were extended with tenants such as Hoffmann, Takko and Hervis.
C P I P R O P E R T y G R O U P M A N A G E M E N T R E P O R T J U N E 2 0 1 7 / R E T A I l
cBRE gi acqUisition at a glancE
PRoPERty PoRtfolio ValUE - REtail (MEUR)
0 11
37 154
103
0
922
290
21
113
pl
cz sk
hU
Ro
• MajordealintheGroup’shistory• AcquiredinMarch2017• 11commercialassets• Acquisitionprice:EUR625million• Externalfinancing:EUR440million• GRI:exceedingEUR50million• Majorcities:Prague,Pilsen,Liberec, Elblag, Budapest
• GLA:280thousandsqm • Shoppingcentres:247thousandsqm • Officepremises:15thousandsqm • Hypermarkets:18thousandsqm• GLAofshoppingcentresmorethandoubled• New800tenants• Companies/brands:NationaleNederlanden,Marks&Spencer,HUMANIC, NEW yORKER, Carrefour, Interspar, AHOlD, NEXT etc.
CPI
CBRE GI

39C P I P R O P E R T y G R O U P M A N A G E M E N T R E P O R T J U N E 2 0 1 7 / R E T A I lC P I P R O P E R T y G R O U P M A N A G E M E N T R E P O R T J U N E 2 0 1 7 / R E T A I l
• MajordealintheGroup’shistory• AcquiredinMarch2017• 11commercialassets• Acquisitionprice:EUR625million• Externalfinancing:EUR440million• GRI:exceedingEUR50million• Majorcities:Prague,Pilsen,Liberec, Elblag, Budapest
ZlATÝ ANDĚl, PRAGUE, CZECHIA
Zlatý Anděl represents a modern office development with associated parking, storage and retail accommodation. The building was constructed in 1999 and well maintained with the last renovation in 2016. It extends to a total lettable area of 20 997 sqm and offers 218 car parking spaces. The Property is constructed between three interconnected buildings (A, B, C). Section A is constructed over 7 floors and Section B is constructed over 8 floors. The property benefits from high levels of foot fall and perfect visibility.
OGRODy SHOPPING CENTRE, ElBlAG, POlAND
Ogrody shopping centre was constructed in 2002 and initially provided a GlA of 17 600 sqm. In 2013, the property was under reconstruction which was completed in March 2015. At the valuation date it extends to total lettable area of 41 931 sqm with 1 250 car parking spaces. The floor layout is "l" shaped. The two retail floors are served with two pairs of escalators, one of them located in the central area. Additionally, the second floor, occupied by a cinema and a fitness club. The shopping centre provides in total 127 retail units with most of them being located on the ground and first floor.
CAMPONA SHOPPING CENTRE, BUDAPEST, HUNGARy
Campona is a shopping centre constructed in two phases between 1997 and 2000. The 1st phase consists of the retail units in a two-storey shopping centre while the 2nd phase consists of the Tropicarium and a cinema. There is a car park in a separate building providing about 2 000 parking spaces on 3 floors.
tHE acqUiRED PoRtfolio aMong otHERs consists of:

HOTELS
C P I P R O P E R T y G R O U P M A N A G E M E N T R E P O R T J U N E 2 0 1 7 / H O T E l S
Amfora, Hvar Grand Beach Resort

41
KEy figUREs JUNE 2017
34NUMBER OF PROPERTIES
10 308NUMBER OF BEDS
MEUR
47REvENUES JUNE 2017
MEUR
579CARRyING vAlUE
HOTELS
The Group is one of the largest Czech owners and developers of hotels. The hotel portfolio has grown and currently includes 34 hotels. 33 hotels are operated by the Group and a hotel in Rome, Italy is leased to an outside operator. The diverse portfolio includes in lodging houses for long-term accommodation and hotels in the two to five stars categories. These hotels are located in capital and major cities of Czechia, Hungary, Poland and Italy. The flagship of the Group is a network of four-star Clarion hotels aimed at corporate and congress clientele.
In 2016, the Group acquired Sunčani Hvar Hotels, a hotel group on Croatia’s premier island Hvar. Hvar is one of the most beautiful islands of the Mediterranean, its hillsides are covered in pine forests, with vineyards, olive groves, fruit orchards and lavender fields in agricultural areas and its climate is characterised by mild winters, and warm summers with many hours of sunshine.
During this period, the Group acquired hotel vladimír in Ústí nad labem, a major Czech city. This acquisition has further enhanced our hotel portfolio targeted at congress clientele. With next to 90 rooms and 172 beds the hotel offers base and services for conferences, seminars and even social and family events.
The Group also disposed of hotel Rhea in Prague with a value of EUR 8 million.
C P I P R O P E R T y G R O U P M A N A G E M E N T R E P O R T J U N E 2 0 1 7 / H O T E l S
42 C P I P R O P E R T y G R O U P M A N A G E M E N T R E P O R T J U N E 2 0 1 7 / H O T E l S
HOTElS JUNE 2017 HOTElS 2016
No. of properties
Carryingvalue
MEUR
Carrying value
%
Number of beds
Average occupancy
%
No. of properties
Carryingvalue
MEUR
Carrying value
%
Number of beds
Average occupancy
%
CZECHIA*
19 284 49% 7 070 61.3% 19 289 50% 7 828 N/A***
CROATIA
7 168 29% 1 646 71.6% 7 168 29% 1 646 N/A***
HUNGARy
4 43 7% 666 76.8% 4 43 7% 788 N/A***
ITAly
1 38 7% 634 N/A* 1 38 7% 634 N/A**
RUSSIA
1 26 5% 168 82.2% 1 26 4% 168 N/A***
POlAND
2 20 3% 124 81.0% 2 20 3% 214 N/A***
tHE gRoUP 34 579 100% 10 308 64.0% 34 584 100% 11 278 N/A***
* Includes Assets held for sale** Hotel in Italy is operated by third party*** Comparable data not disclosed as segment Hotels restructured in H2 2016
aMong tHE Most iMPoRtant HotEls of tHE PoRtfolio BElongs:
MARRIOTT COURTyARD HOTEl BUDAPEST
Marriott Courtyard Hotel Budapest offers 234 rooms and is located in Budapest’s city centre on one of the main public transport hubs and nearby two of Budapest’s most famous attractions, Andrassy Avenue and the river Danube. The hotel which is among the newest hospitality offerings of the Hungarian capital, after opening in 2010, has 235 bedrooms and is a part of the Europeum Shopping Centre.
MAMAISON HOTEl RIvERSIDE PRAGUE
Mamaison Hotel Riverside Prague, uniquely located and boasting award-winning Art Nouveau-style interior design, which provides ideal accommodation for both leisure and business guests in a fashionable district of Prague. The hotel enjoys nearby connections to the city’s business districts, the airport and the city’s main cultural attractions. With elegant accommodation in 80 rooms, riverside views and top facilities, this artistic hotel offers fantastic rates for city stays in stylish and historic surroundings.
43C P I P R O P E R T y G R O U P M A N A G E M E N T R E P O R T J U N E 2 0 1 7 / H O T E l S
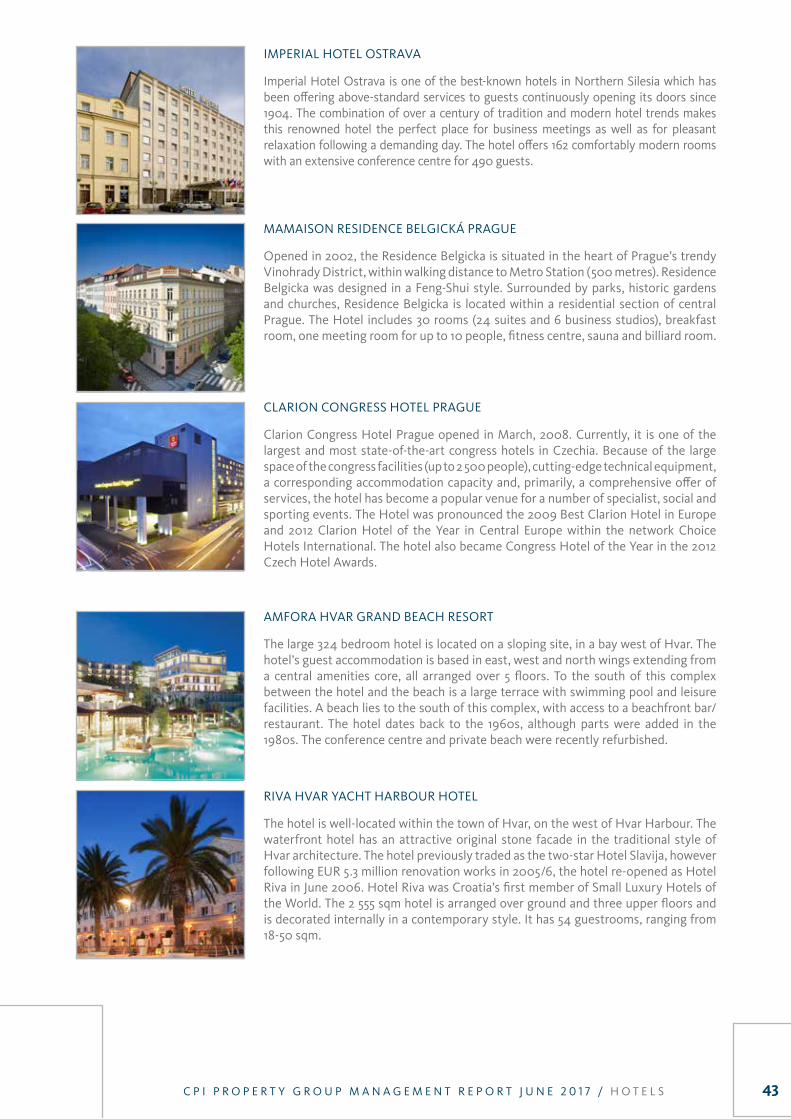
IMPERIAl HOTEl OSTRAvA
Imperial Hotel Ostrava is one of the best-known hotels in Northern Silesia which has been offering above-standard services to guests continuously opening its doors since 1904. The combination of over a century of tradition and modern hotel trends makes this renowned hotel the perfect place for business meetings as well as for pleasant relaxation following a demanding day. The hotel offers 162 comfortably modern rooms with an extensive conference centre for 490 guests.
MAMAISON RESIDENCE BElGICKÁ PRAGUE
Opened in 2002, the Residence Belgicka is situated in the heart of Prague’s trendy vinohrady District, within walking distance to Metro Station (500 metres). Residence Belgicka was designed in a Feng-Shui style. Surrounded by parks, historic gardens and churches, Residence Belgicka is located within a residential section of central Prague. The Hotel includes 30 rooms (24 suites and 6 business studios), breakfast room, one meeting room for up to 10 people, fitness centre, sauna and billiard room.
ClARION CONGRESS HOTEl PRAGUE
Clarion Congress Hotel Prague opened in March, 2008. Currently, it is one of the largest and most state-of-the-art congress hotels in Czechia. Because of the large space of the congress facilities (up to 2 500 people), cutting-edge technical equipment, a corresponding accommodation capacity and, primarily, a comprehensive offer of services, the hotel has become a popular venue for a number of specialist, social and sporting events. The Hotel was pronounced the 2009 Best Clarion Hotel in Europe and 2012 Clarion Hotel of the year in Central Europe within the network Choice Hotels International. The hotel also became Congress Hotel of the year in the 2012 Czech Hotel Awards.
AMFORA HvAR GRAND BEACH RESORT
The large 324 bedroom hotel is located on a sloping site, in a bay west of Hvar. The hotel’s guest accommodation is based in east, west and north wings extending from a central amenities core, all arranged over 5 floors. To the south of this complex between the hotel and the beach is a large terrace with swimming pool and leisure facilities. A beach lies to the south of this complex, with access to a beachfront bar/restaurant. The hotel dates back to the 1960s, although parts were added in the 1980s. The conference centre and private beach were recently refurbished.
RIvA HvAR yACHT HARBOUR HOTEl
The hotel is well-located within the town of Hvar, on the west of Hvar Harbour. The waterfront hotel has an attractive original stone facade in the traditional style of Hvar architecture. The hotel previously traded as the two-star Hotel Slavija, however following EUR 5.3 million renovation works in 2005/6, the hotel re-opened as Hotel Riva in June 2006. Hotel Riva was Croatia’s first member of Small luxury Hotels of the World. The 2 555 sqm hotel is arranged over ground and three upper floors and is decorated internally in a contemporary style. It has 54 guestrooms, ranging from 18-50 sqm.

44
PHAROS HvAR BAy HIll HOTEl
This hotel is situated in a hilltop location, occupying a site of 15 322 sqm, surrounded by olive groves and providing excellent sea views. The property is located to the west of Adriana and Delfin hotels, while east of Amfora, in a raised location, but yet within a short walk to the town centre. The Pharos hotel is arranged across five separate accommodation blocks with a central reception and amenity block. There are 197 standard bedrooms, including 11 family bedrooms.
THE PAlACE HvAR HOTEl
The hotel is situated to the north of Hvar Harbour, set back from the quayside. The hotel is physically connected and set behind a venetian clock tower and loggia, which is owned by the City of Hvar local authority and used for all town hall purposes. The hotel entrance therefore has an exclusive feel, accessed from the harbour/town square. The Hotel Palace is a prominent and historic property which opened in 1903 as Hvar’s first hotel. The main access is located adjacent to the loggia, up some marble steps. The hotel also has direct access through the loggia, which is owned by the municipality and can be used with the town hall’s permission for events. The hotel is of 3 star quality, measuring over 4 058 sqm and arranged over basement, ground and four upper floors. The 73 bedrooms vary in size and outlook, with the front facing rooms enjoying views over the harbour and town square which can command a premium price.
C P I P R O P E R T y G R O U P M A N A G E M E N T R E P O R T J U N E 2 0 1 7 / H O T E l S

45C P I P R O P E R T y G R O U P M A N A G E M E N T R E P O R T J U N E 2 0 1 7 / H O T E l S C P I P R O P E R T y G R O U P M A N A G E M E N T R E P O R T J U N E 2 0 1 7 / H O T E l S
RESIDENTIAL
C P I P R O P E R T y G R O U P M A N A G E M E N T R E P O R T J U N E 2 0 1 7 / R E S I D E N T I A l
CPI Byty, Česká lípa
47
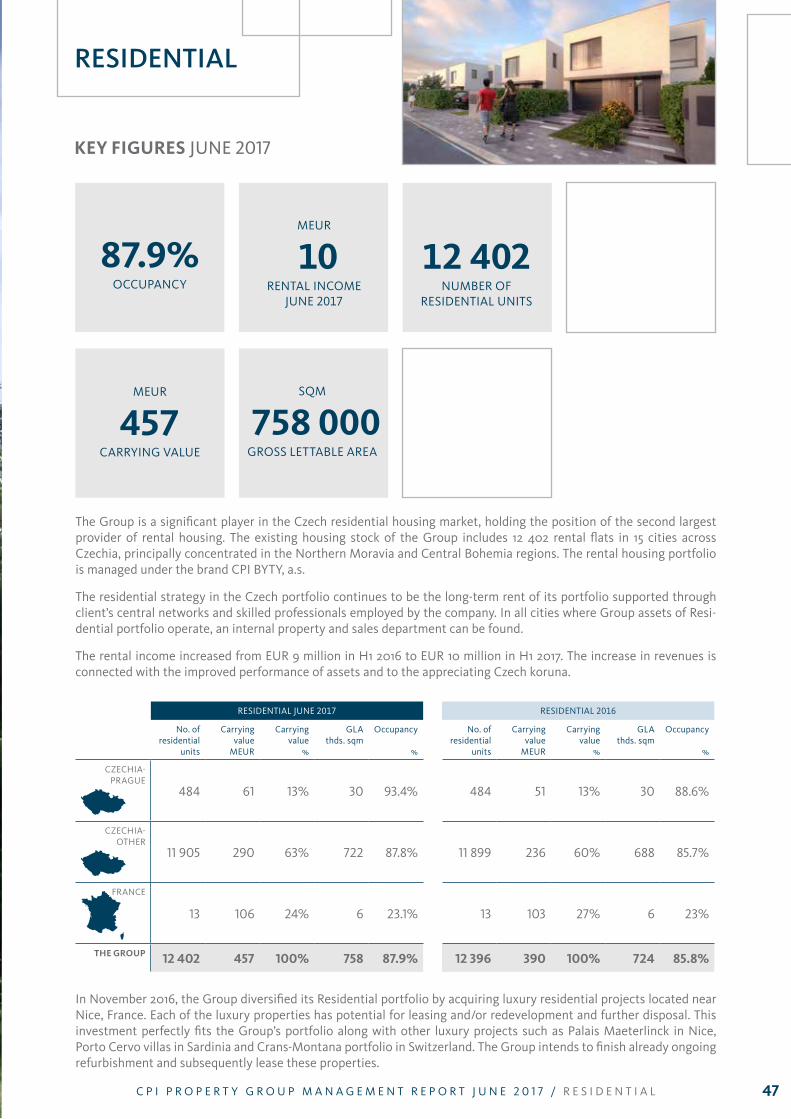
KEy figUREs JUNE 2017
87.9%OCCUPANCy
12 402NUMBER OF
RESIDENTIAl UNITS
MEUR
10RENTAl INCOME
JUNE 2017
MEUR
457CARRyING vAlUE
SQM
758 000GROSS lETTABlE AREA
RESIDENTIAL
The Group is a significant player in the Czech residential housing market, holding the position of the second largest provider of rental housing. The existing housing stock of the Group includes 12 402 rental flats in 15 cities across Czechia, principally concentrated in the Northern Moravia and Central Bohemia regions. The rental housing portfolio is managed under the brand CPI ByTy, a.s.
The residential strategy in the Czech portfolio continues to be the long-term rent of its portfolio supported through client’s central networks and skilled professionals employed by the company. In all cities where Group assets of Resi-dential portfolio operate, an internal property and sales department can be found.
The rental income increased from EUR 9 million in H1 2016 to EUR 10 million in H1 2017. The increase in revenues is connected with the improved performance of assets and to the appreciating Czech koruna.
In November 2016, the Group diversified its Residential portfolio by acquiring luxury residential projects located near Nice, France. Each of the luxury properties has potential for leasing and/or redevelopment and further disposal. This investment perfectly fits the Group’s portfolio along with other luxury projects such as Palais Maeterlinck in Nice, Porto Cervo villas in Sardinia and Crans-Montana portfolio in Switzerland. The Group intends to finish already ongoing refurbishment and subsequently lease these properties.
C P I P R O P E R T y G R O U P M A N A G E M E N T R E P O R T J U N E 2 0 1 7 / R E S I D E N T I A l
RESIDENTIAl JUNE 2017 RESIDENTIAl 2016
No. of residential
units
Carryingvalue
MEUR
Carrying value
%
GlAthds. sqm
Occupancy
%
No. of residential
units
Carryingvalue
MEUR
Carrying value
%
GlAthds. sqm
Occupancy
%
CZECHIA-PRAGUE
484 61 13% 30 93.4% 484 51 13% 30 88.6%
CZECHIA-OTHER
11 905 290 63% 722 87.8% 11 899 236 60% 688 85.7%
FRANCE
13 106 24% 6 23.1% 13 103 27% 6 23%
tHE gRoUP 12 402 457 100% 758 87.9% 12 396 390 100% 724 85.8%
48
DEVELOPMENT &
LAND BANK
C P I P R O P E R T y G R O U P M A N A G E M E N T R E P O R T J U N E 2 0 1 7 / D E v E l O P M E N T & l A N D B A N K
IGy shopping centre, České Budějovice

49
lAND BANK JUNE 2017 lAND BANK 2016
Total areathds. sqm
Carrying value MEUR
Total areathds. sqm
Carrying value MEUR
CZECHIA
19 084 383 19 079 302
HUNGARRy
131 33 131 33
GERMANy
13 7 13 7
ROMANIA*
300 7 300 8
POlAND*
39 4 39 4
tHE gRoUP 19 567 434 19 562 354
* Assets held for sale included
KEy figUREs JUNE 2017
SQM
19.5 million
TOTAl AREA
SQM
35 000POTENTIAl GROSS
SAlEABlE AREA
SQM
7 000POTENTIAl GROSS
lEASABlE AREA
MEUR
434CARRyING vAlUE lAND
BANK AREA
MEUR
15DEvElOPMENT
FOR RENTAl
MEUR
97DEvElOPMENT
FOR SAlE
DEVELOPMENT & LAND BANK
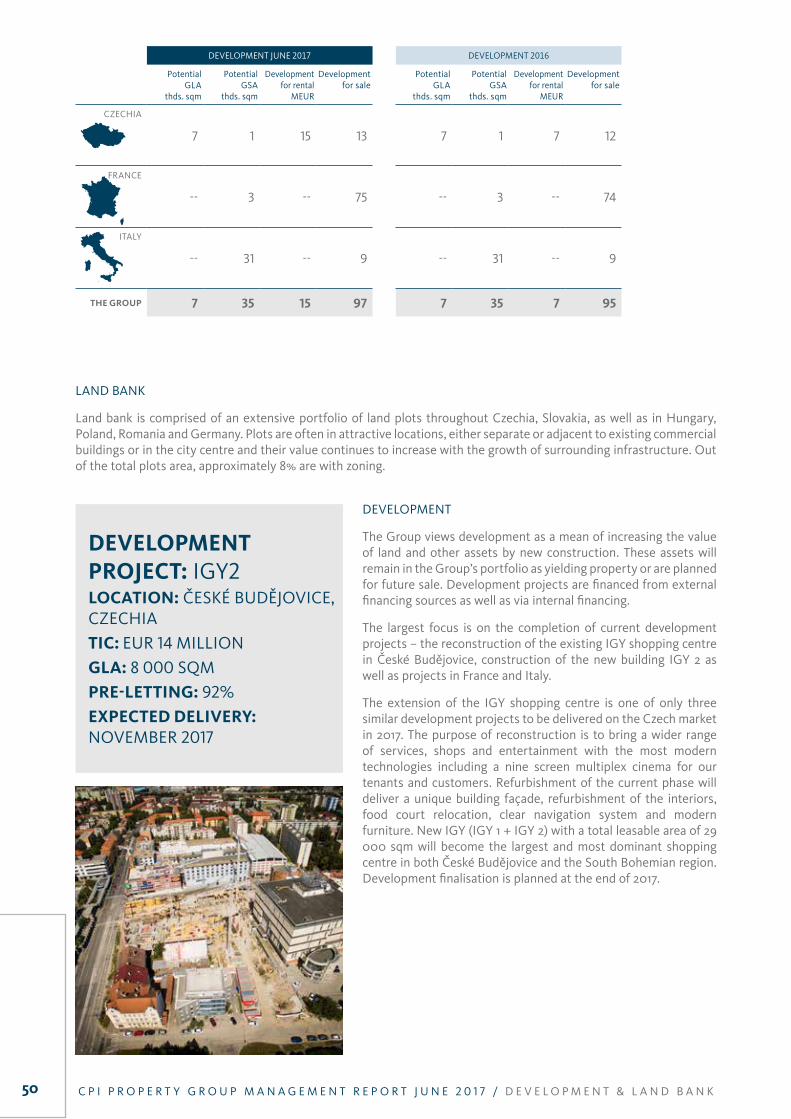
The land bank portfolio consists of land properties acquired and held by the Group for future development. Once work on a development project is commenced, the area is presented either as a future sale (Potential gross saleable area) or as a future rental (Potential gross leasable area).
C P I P R O P E R T y G R O U P M A N A G E M E N T R E P O R T J U N E 2 0 1 7 / D E v E l O P M E N T & l A N D B A N K
50
lAND BANK
land bank is comprised of an extensive portfolio of land plots throughout Czechia, Slovakia, as well as in Hungary, Poland, Romania and Germany. Plots are often in attractive locations, either separate or adjacent to existing commercial buildings or in the city centre and their value continues to increase with the growth of surrounding infrastructure. Out of the total plots area, approximately 8% are with zoning.
DEvElOPMENT
The Group views development as a mean of increasing the value of land and other assets by new construction. These assets will remain in the Group’s portfolio as yielding property or are planned for future sale. Development projects are financed from external financing sources as well as via internal financing.
The largest focus is on the completion of current development projects – the reconstruction of the existing IGy shopping centre in České Budějovice, construction of the new building IGy 2 as well as projects in France and Italy.
The extension of the IGy shopping centre is one of only three similar development projects to be delivered on the Czech market in 2017. The purpose of reconstruction is to bring a wider range of services, shops and entertainment with the most modern technologies including a nine screen multiplex cinema for our tenants and customers. Refurbishment of the current phase will deliver a unique building façade, refurbishment of the interiors, food court relocation, clear navigation system and modern furniture. New IGy (IGy 1 + IGy 2) with a total leasable area of 29 000 sqm will become the largest and most dominant shopping centre in both České Budějovice and the South Bohemian region. Development finalisation is planned at the end of 2017.
C P I P R O P E R T y G R O U P M A N A G E M E N T R E P O R T J U N E 2 0 1 7 / D E v E l O P M E N T & l A N D B A N K
DEVEloPMEnt PRoJEct: IGy2location: ČESKé BUDĚJOvICE, CZECHIAtic: EUR 14 MIllIONgla: 8 000 SQMPRE-lEtting: 92%ExPEctED DEliVERy: NOvEMBER 2017
DEvElOPMENT JUNE 2017 DEvElOPMENT 2016
Potential GlA
thds. sqm
Potential GSA
thds. sqm
Development for rental
MEUR
Development for sale
Potential GlA
thds. sqm
Potential GSA
thds. sqm
Development for rental
MEUR
Development for sale
CZECHIA
7 1 15 13 7 1 7 12
FRANCE
-- 3 -- 75 -- 3 -- 74
ITAly
-- 31 -- 9 -- 31 -- 9
tHE gRoUP 7 35 15 97 7 35 7 95
51C P I P R O P E R T y G R O U P M A N A G E M E N T R E P O R T J U N E 2 0 1 7 / D E v E l O P M E N T & l A N D B A N K C P I P R O P E R T y G R O U P M A N A G E M E N T R E P O R T J U N E 2 0 1 7 / D E v E l O P M E N T & l A N D B A N K
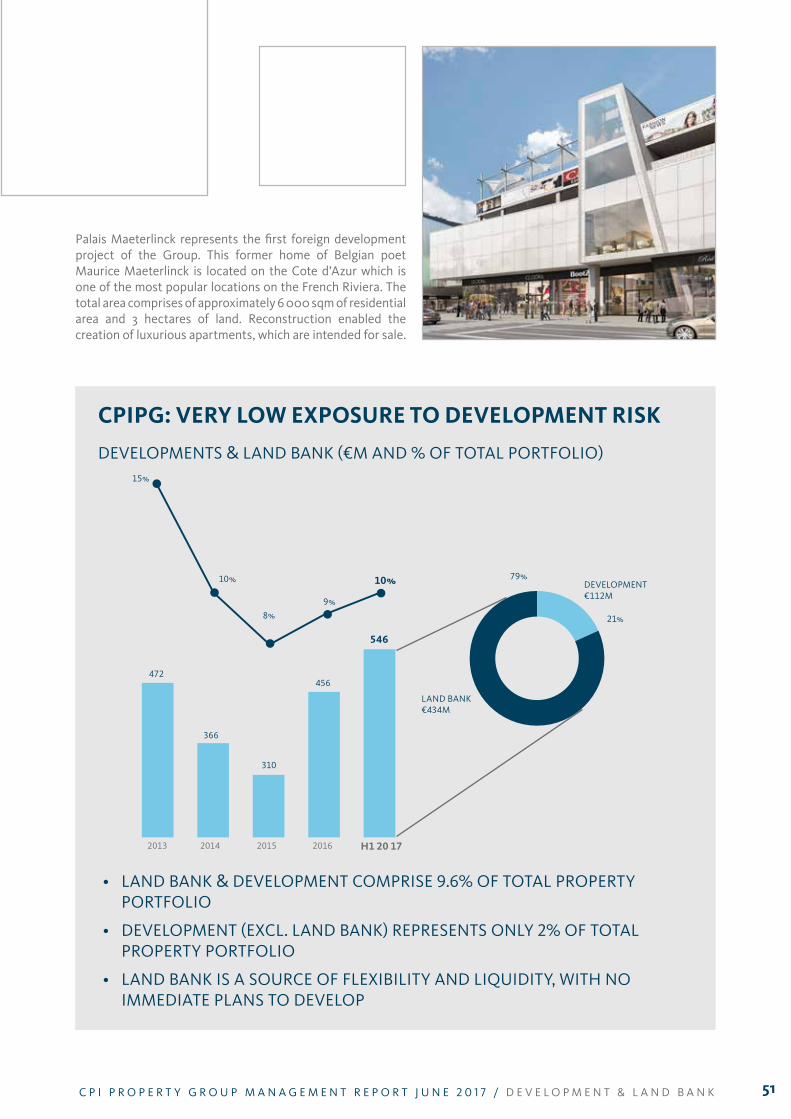
cPiPg: VERy loW ExPosURE to DEVEloPMEnt RisK
DEvElOPMENTS & lAND BANK (€M AND % OF TOTAl PORTFOlIO)
Palais Maeterlinck represents the first foreign development project of the Group. This former home of Belgian poet Maurice Maeterlinck is located on the Cote d’Azur which is one of the most popular locations on the French Riviera. The total area comprises of approximately 6 000 sqm of residential area and 3 hectares of land. Reconstruction enabled the creation of luxurious apartments, which are intended for sale.
• LANdbANk& DEvElOPMENT COMPRISE 9.6% OF TOTAl PROPERTy PORTFOlIO
• dEvELOPMENt(ExCL.LANdbANk)REPRESENtSONLy2%OftOtAL PROPERTy PORTFOlIO
• LANdbANkISASOURCEOffLExIbILItyANdLIqUIdIty,wItHNO IMMEDIATE PlANS TO DEvElOP
2013 2014 2015 2016 H1 20 17
15%
79%
21%
472
366
546
310
456
10%
8%9%
10%
lAND BANK€434M
DEvElOPMENT€112M

OTHERSEGMENTS
C P I P R O P E R T y G R O U P M A N A G E M E N T R E P O R T J U N E 2 0 1 7 / O T H E R S E G M E N T S
logistic Park, Brandýs nad labem
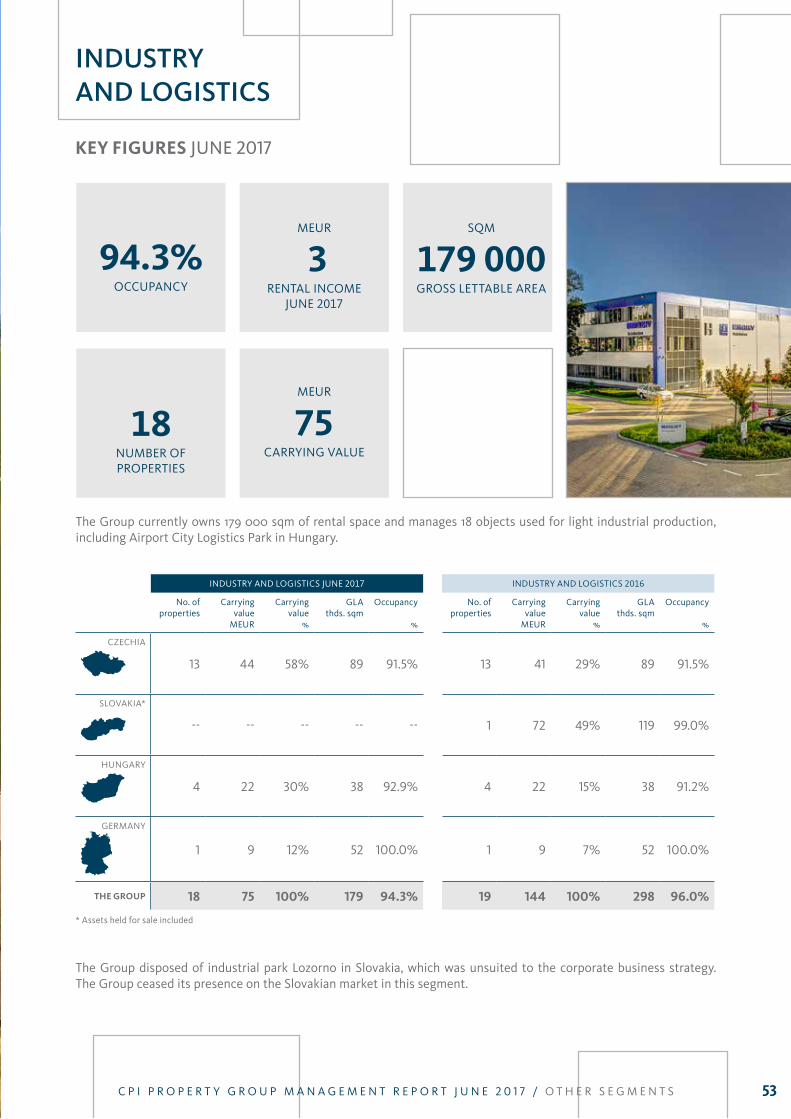
53
KEy figUREs JUNE 2017
18NUMBER OF PROPERTIES
94.3%OCCUPANCy
SQM
179 000GROSS lETTABlE AREA
MEUR
3RENTAl INCOME
JUNE 2017
MEUR
75CARRyING vAlUE
INDUSTRY AND LOGISTICS
The Group currently owns 179 000 sqm of rental space and manages 18 objects used for light industrial production, including Airport City logistics Park in Hungary.
The Group disposed of industrial park lozorno in Slovakia, which was unsuited to the corporate business strategy. The Group ceased its presence on the Slovakian market in this segment.
C P I P R O P E R T y G R O U P M A N A G E M E N T R E P O R T J U N E 2 0 1 7 / O T H E R S E G M E N T S
INDUSTRy AND lOGISTICS JUNE 2017 INDUSTRy AND lOGISTICS 2016
No. of properties
Carryingvalue
MEUR
Carrying value
%
GlAthds. sqm
Occupancy
%
No. of properties
Carryingvalue
MEUR
Carrying value
%
GlAthds. sqm
Occupancy
%
CZECHIA
13 44 58% 89 91.5% 13 41 29% 89 91.5%
SlOvAKIA*
-- -- -- -- -- 1 72 49% 119 99.0%
HUNGARy
4 22 30% 38 92.9% 4 22 15% 38 91.2%
GERMANy
1 9 12% 52 100.0% 1 9 7% 52 100.0%
tHE gRoUP 18 75 100% 179 94.3% 19 144 100% 298 96.0%
* Assets held for sale included
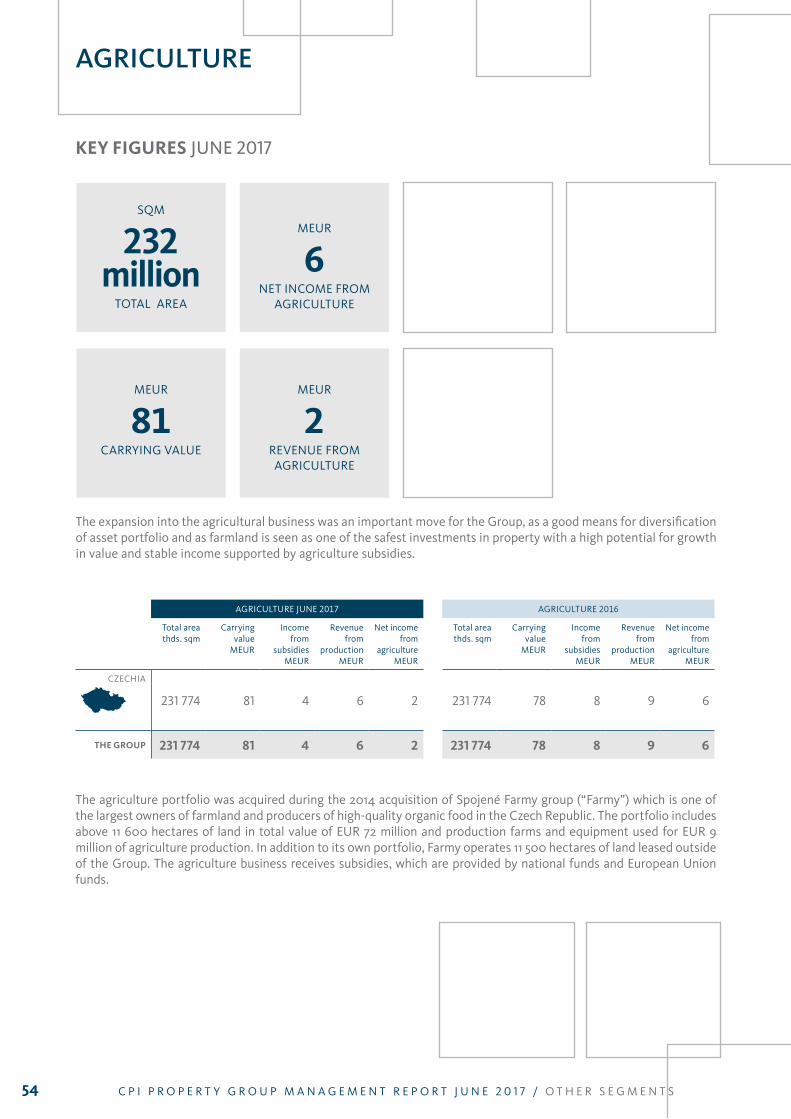
54
KEy figUREs JUNE 2017
MEUR
6NET INCOME FROM
AGRICUlTURE
MEUR
81CARRyING vAlUE
MEUR
2REvENUE FROM AGRICUlTURE
AGRICULTURE
The expansion into the agricultural business was an important move for the Group, as a good means for diversification of asset portfolio and as farmland is seen as one of the safest investments in property with a high potential for growth in value and stable income supported by agriculture subsidies.
C P I P R O P E R T y G R O U P M A N A G E M E N T R E P O R T J U N E 2 0 1 7 / O T H E R S E G M E N T S
AGRICUlTURE JUNE 2017 AGRICUlTURE 2016
Total areathds. sqm
Carryingvalue
MEUR
Income from
subsidiesMEUR
Revenue from
productionMEUR
Net income from
agricultureMEUR
Total areathds. sqm
Carryingvalue
MEUR
Income from
subsidiesMEUR
Revenue from
productionMEUR
Net income from
agricultureMEUR
CZECHIA
231 774 81 4 6 2 231 774 78 8 9 6
tHE gRoUP 231 774 81 4 6 2 231 774 78 8 9 6
The agriculture portfolio was acquired during the 2014 acquisition of Spojené Farmy group (“Farmy”) which is one of the largest owners of farmland and producers of high-quality organic food in the Czech Republic. The portfolio includes above 11 600 hectares of land in total value of EUR 72 million and production farms and equipment used for EUR 9 million of agriculture production. In addition to its own portfolio, Farmy operates 11 500 hectares of land leased outside of the Group. The agriculture business receives subsidies, which are provided by national funds and European Union funds.
SQM
232 million
TOTAl AREA
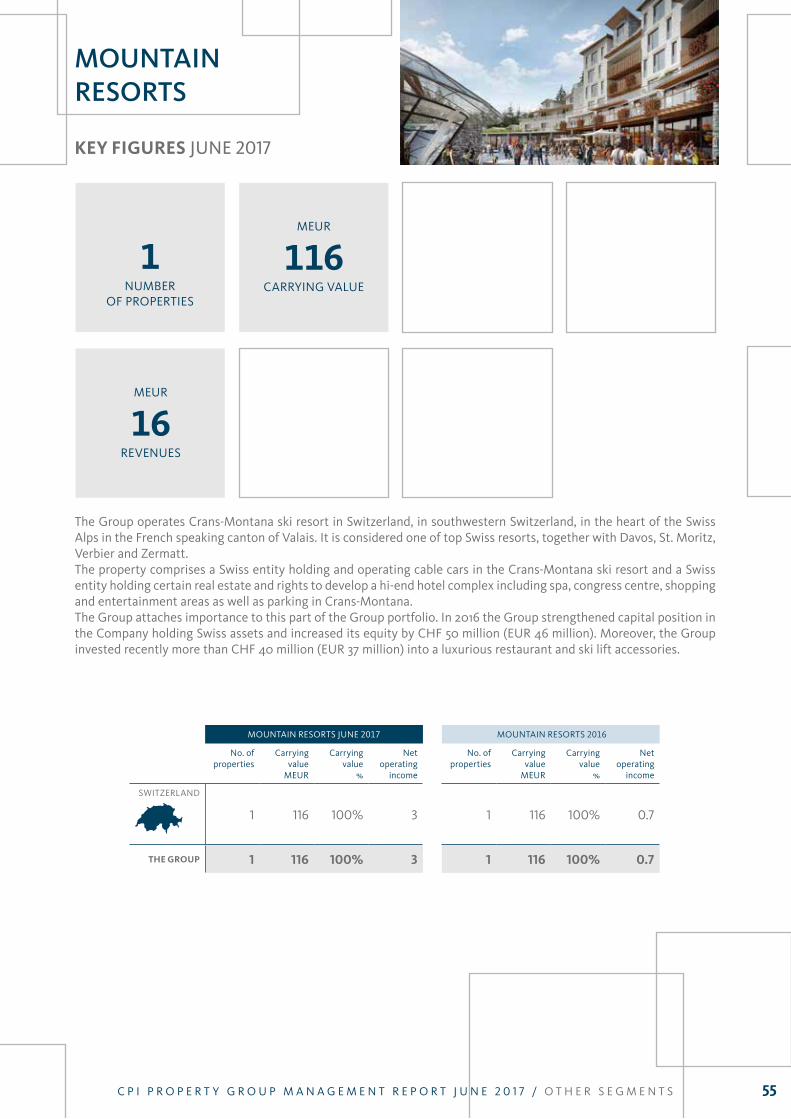
55
KEy figUREs JUNE 2017
1NUMBER
OF PROPERTIES
MEUR
116CARRyING vAlUE
MEUR
16REvENUES
MOUNTAIN RESORTS
The Group operates Crans-Montana ski resort in Switzerland, in southwestern Switzerland, in the heart of the Swiss Alps in the French speaking canton of valais. It is considered one of top Swiss resorts, together with Davos, St. Moritz, verbier and Zermatt. The property comprises a Swiss entity holding and operating cable cars in the Crans-Montana ski resort and a Swiss entity holding certain real estate and rights to develop a hi-end hotel complex including spa, congress centre, shopping and entertainment areas as well as parking in Crans-Montana.The Group attaches importance to this part of the Group portfolio. In 2016 the Group strengthened capital position in the Company holding Swiss assets and increased its equity by CHF 50 million (EUR 46 million). Moreover, the Group invested recently more than CHF 40 million (EUR 37 million) into a luxurious restaurant and ski lift accessories.
C P I P R O P E R T y G R O U P M A N A G E M E N T R E P O R T J U N E 2 0 1 7 / O T H E R S E G M E N T S
MOUNTAIN RESORTS JUNE 2017 MOUNTAIN RESORTS 2016
No. of properties
Carryingvalue
MEUR
Carrying value
%
Net operating
income
No. of properties
Carryingvalue
MEUR
Carryingvalue
%
Net operating
income
SWITZERlAND
1 116 100% 3 1 116 100% 0.7
tHE gRoUP 1 116 100% 3 1 116 100% 0.7

FINANCING
C P I P R O P E R T y G R O U P M A N A G E M E N T R E P O R T J U N E 2 0 1 7 / F I N A N C I N G
GSG Berlin, Prinzessinnenstrasse2

57
There are two necessary conditions for a dynamically growing group to succeed in a highly competitive real estate sector: acquiring and managing a portfolio of quality assets and access to and managing an optimally structured capital. The Group perceives both conditions as an integral part of the business rather than two complementary operating segments.
The first half of 2017 was another year of intensive financing activity for the Group, both in project financing and on debt capital markets. The Group deployed the continuing low interest-rate environment in both reducing its cost of debt and enhancing repayment tenor. Cost of external debt was compressed to 2.76% while the weighted average tenor increased from 3.3 years at year-end 2016 to 4.6 years in H1 2017 reflecting strenuous work on refinancing of the Group external financing portfolio.
lOAN-TO-vAlUE SlIGHTly INCREASED
The external financing as at 30 June 2017 stood at EUR 3 074 million which represents an increase by EUR 434 million (+16%, 2016: EUR 2 640 million). Cash and cash equivalents decreased by EUR 70 million to EUR 235 million as at 30 June 2017 (-23%, 2016: EUR 305 million). The property portfolio saw a sharp year-to-date increase and reached EUR 5 707 million as at 30 June 2017 (+17%, 2016: EUR 4 865 million). The main determinant for these changes was CBRE GI acquisition; despite this loan-to-value increases slightly to 49.8% (2016: 48.0%).
loan-to-ValUE calcUlation (MEUR)
loan -to-ValUE* 30-Jun-17 31-Dec-16
Financial debts (non-current) 1 741 1 294
Financial debts (current) 596 639
Bonds issued (non-current) 688 657
Bonds issued (current) 50 50
Cash and cash equivalents -235 -305
Net debt 2 840 2 335
Property Portfolio 5 707 4 865
loan to value ratio in % 49.8% 48.0%
* Assets held for sale included
In previous periods from 2013, a significantly decreasing trend of the loan-to-value ratio can be clearly seen. It shows the Group's gradual progression to lowering the cost per unit of property – through effective management of the property portfolio with the growing performance of assets and optimisation of capital structure. In the foreseeable future, the loan-to-value ratio should be in the proximity of the 50% threshold.
FINANCING
C P I P R O P E R T y G R O U P M A N A G E M E N T R E P O R T J U N E 2 0 1 7 / F I N A N C I N G
40.0%
45.0%
60.0%
55.0%
50.0%
lOAN-TO-vAlUENET DEBT (MEUR)
65.0%
0
500
1 000
1 500
2 500
2 000
3 000
1 971 1 9782 248
2 335
2 840
49.8%
48.0%55.7%
58.8%
61.5%
2013 2014 2015 2016 30 Jun 2017
loan-to-ValUE in PERioD 2013-2017
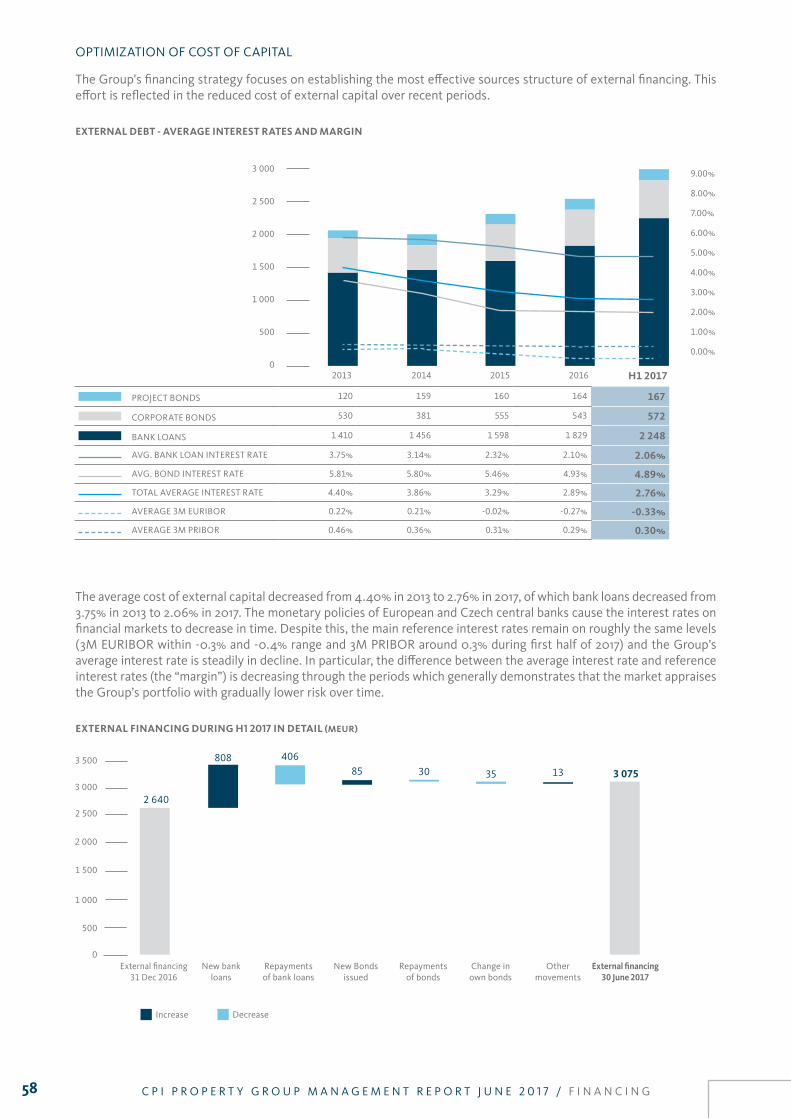
58
OPTIMIZATION OF COST OF CAPITAl
The Group's financing strategy focuses on establishing the most effective sources structure of external financing. This effort is reflected in the reduced cost of external capital over recent periods.
ExtERnal DEBt - aVERagE intEREst RatEs anD MaRgin
The average cost of external capital decreased from 4.40% in 2013 to 2.76% in 2017, of which bank loans decreased from 3.75% in 2013 to 2.06% in 2017. The monetary policies of European and Czech central banks cause the interest rates on financial markets to decrease in time. Despite this, the main reference interest rates remain on roughly the same levels (3M EURIBOR within -0.3% and -0.4% range and 3M PRIBOR around 0.3% during first half of 2017) and the Group’s average interest rate is steadily in decline. In particular, the difference between the average interest rate and reference interest rates (the “margin”) is decreasing through the periods which generally demonstrates that the market appraises the Group’s portfolio with gradually lower risk over time.
ExtERnal financing DURing H1 2017 in DEtail (MEUR)
9.00%
8.00%
7.00%
6.00%
4.00%
5.00%
2.00%
1.00%
3.00%
0.00%
2013 2014 2015 2016 H1 2017
PROJECT BONDS 120 159 160 164 167
CORPORATE BONDS 530 381 555 543 572
BANK lOANS 1 410 1 456 1 598 1 829 2 248
AvG. BANK lOAN INTEREST RATE 3.75% 3.14% 2.32% 2.10% 2.06%
AvG. BOND INTEREST RATE 5.81% 5.80% 5.46% 4.93% 4.89%
TOTAl AvERAGE INTEREST RATE 4.40% 3.86% 3.29% 2.89% 2.76%
AvERAGE 3M EURIBOR 0.22% 0.21% -0.02% -0.27% -0.33%
AvERAGE 3M PRIBOR 0.46% 0.36% 0.31% 0.29% 0.30%
External financing 31 Dec 2016
New bank loans
Repayments of bank loans
New Bondsissued
Repayments of bonds
Change in own bonds
Other movements
External financing 30 June 2017
DecreaseIncrease
500
1 000
1 500
2 000
2 6402 500
808 40685 30 35 13 3 075
0
3 000
3 500
C P I P R O P E R T y G R O U P M A N A G E M E N T R E P O R T J U N E 2 0 1 7 / F I N A N C I N G
3 000
2 500
2 000
1 500
1 000
500
0
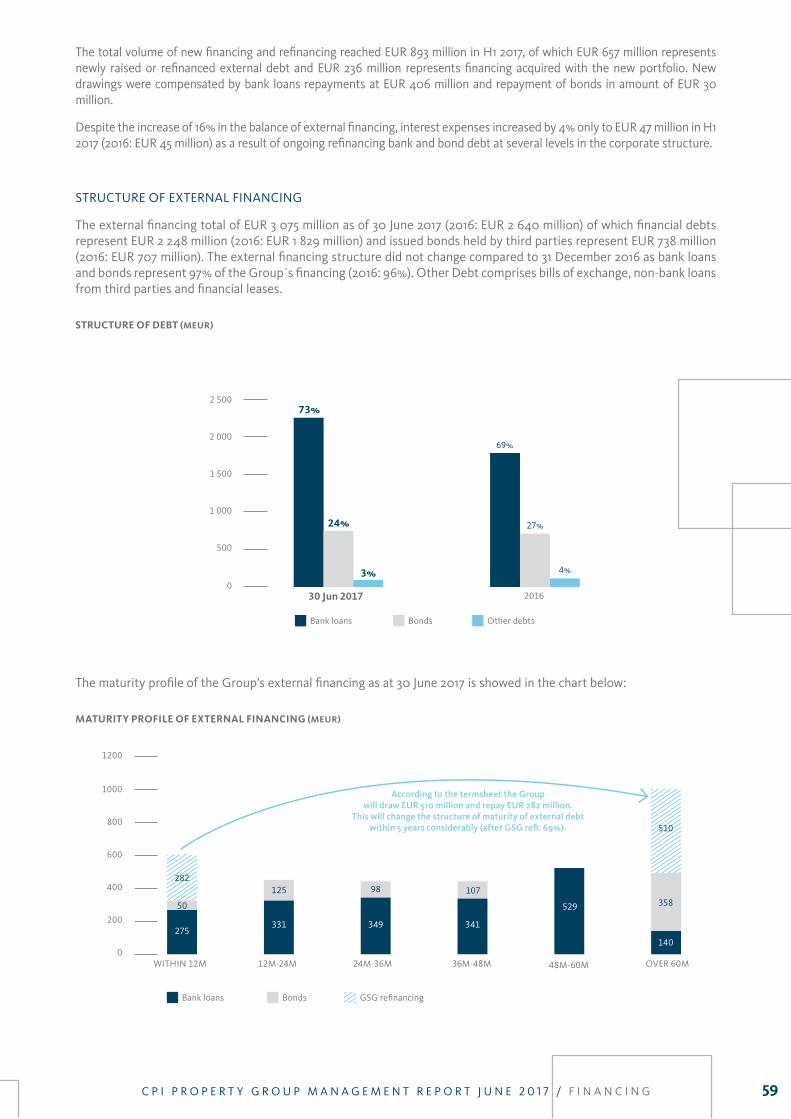
59
The total volume of new financing and refinancing reached EUR 893 million in H1 2017, of which EUR 657 million represents newly raised or refinanced external debt and EUR 236 million represents financing acquired with the new portfolio. New drawings were compensated by bank loans repayments at EUR 406 million and repayment of bonds in amount of EUR 30 million.
Despite the increase of 16% in the balance of external financing, interest expenses increased by 4% only to EUR 47 million in H1 2017 (2016: EUR 45 million) as a result of ongoing refinancing bank and bond debt at several levels in the corporate structure.
STRUCTURE OF EXTERNAl FINANCING
The external financing total of EUR 3 075 million as of 30 June 2017 (2016: EUR 2 640 million) of which financial debts represent EUR 2 248 million (2016: EUR 1 829 million) and issued bonds held by third parties represent EUR 738 million (2016: EUR 707 million). The external financing structure did not change compared to 31 December 2016 as bank loans and bonds represent 97% of the Group s financing (2016: 96%). Other Debt comprises bills of exchange, non-bank loans from third parties and financial leases.
stRUctURE of DEBt (MEUR)
The maturity profile of the Group’s external financing as at 30 June 2017 is showed in the chart below:
MatURity PRofilE of ExtERnal financing (MEUR)
C P I P R O P E R T y G R O U P M A N A G E M E N T R E P O R T J U N E 2 0 1 7 / F I N A N C I N G
2 500
2 000
1 500
1 000
500
030 Jun 2017 2016
Other debtsBank loans Bonds
4%
69%
24% 27%
73%
3%
WITHIN 12M
1000
800
1200
600
400
200
0
50
275
282
12M-24M
331
125
24M-36M
349
98
36M-48M
454
107
48M-60M
529
OvER 60M
140
358
Bank loans Bonds GSG refinancing
341
510
According to the termsheet the Group will draw EUR 510 million and repay EUR 282 million.
This will change the structure of maturity of external debt within 5 years considerably (after GSG refi: 69%).
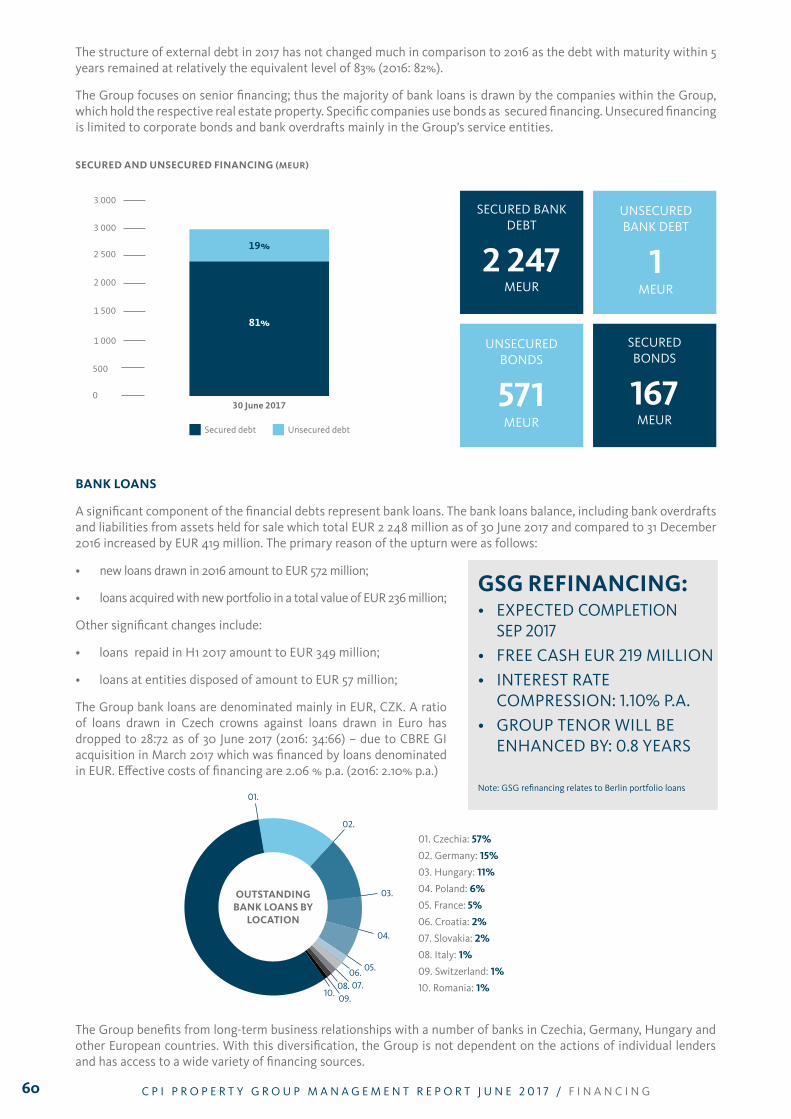
60
UNSECURED BANK DEBT
1MEUR
The structure of external debt in 2017 has not changed much in comparison to 2016 as the debt with maturity within 5 years remained at relatively the equivalent level of 83% (2016: 82%).
The Group focuses on senior financing; thus the majority of bank loans is drawn by the companies within the Group, which hold the respective real estate property. Specific companies use bonds as secured financing. Unsecured financing is limited to corporate bonds and bank overdrafts mainly in the Group’s service entities.
sEcURED anD UnsEcURED financing (MEUR)
BanK loans
A significant component of the financial debts represent bank loans. The bank loans balance, including bank overdrafts and liabilities from assets held for sale which total EUR 2 248 million as of 30 June 2017 and compared to 31 December 2016 increased by EUR 419 million. The primary reason of the upturn were as follows:
500
1 000
1 500
2 000
2 500
0
3 000
30 June 2017
81%
19%
Secured debt Unsecured debt
SECURED BANK DEBT
2 247MEUR
SECURED BONDS
167MEUR
UNSECURED BONDS
571MEUR
C P I P R O P E R T y G R O U P M A N A G E M E N T R E P O R T J U N E 2 0 1 7 / F I N A N C I N G
01. Czechia: 57%
02. Germany: 15%
03. Hungary: 11%
04. Poland: 6%
05. France: 5%
06. Croatia: 2%
07. Slovakia: 2%
08. Italy: 1%
09. Switzerland: 1%
10. Romania: 1%
The Group benefits from long-term business relationships with a number of banks in Czechia, Germany, Hungary and other European countries. With this diversification, the Group is not dependent on the actions of individual lenders and has access to a wide variety of financing sources.
3 000
oUtstanDing BanK loans By
location
01.
02.
03.
04.
05.06.08.
10.07.
09.
gsg REfinancing:• ExPECtEdCOMPlETION SEP 2017• fREECASHEUR219MILLION• INtEREStRAtE COMPRESSION: 1.10% P.A.• GROUPtENORwILLbE ENHANCED By: 0.8 yEARS
Note: GSG refinancing relates to Berlin portfolio loans
• new loans drawn in 2016 amount to EUR 572 million;
• loans acquired with new portfolio in a total value of EUR 236 million;
Other significant changes include:
• loans repaid in H1 2017 amount to EUR 349 million;
• loans at entities disposed of amount to EUR 57 million;
The Group bank loans are denominated mainly in EUR, CZK. A ratio of loans drawn in Czech crowns against loans drawn in Euro has dropped to 28:72 as of 30 June 2017 (2016: 34:66) – due to CBRE GI acquisition in March 2017 which was financed by loans denominated in EUR. Effective costs of financing are 2.06 % p.a. (2016: 2.10% p.a.)
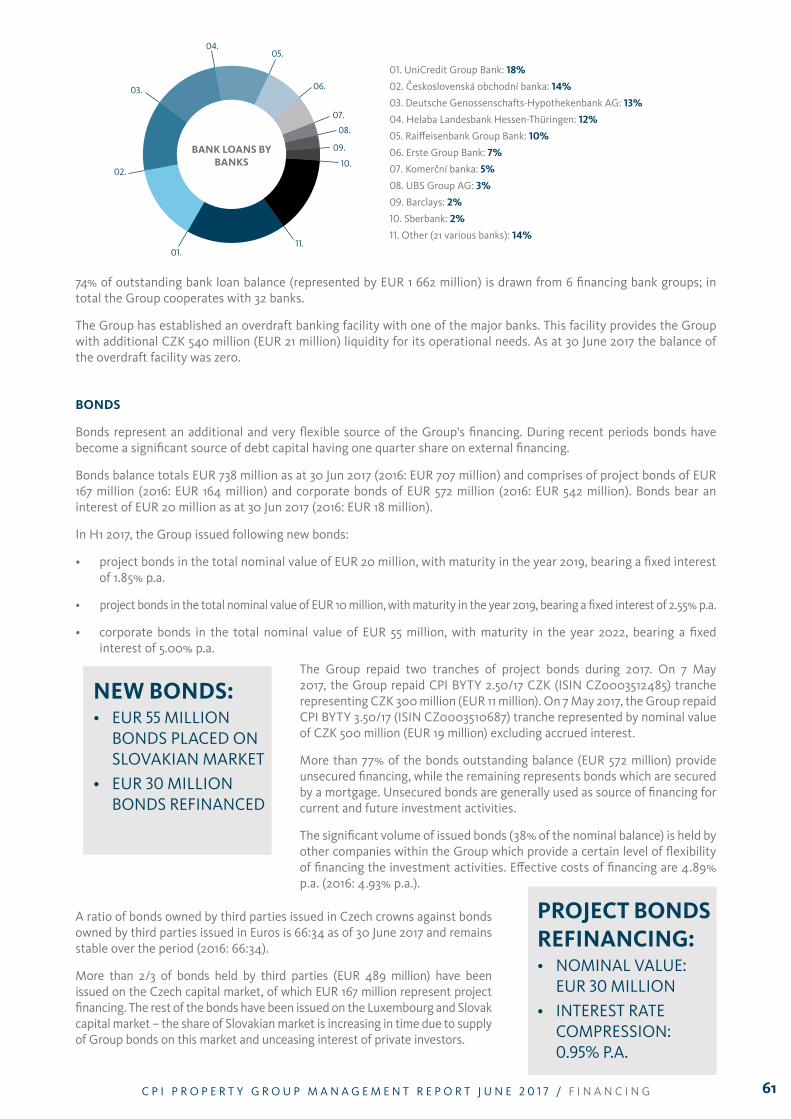
61
BonDs
Bonds represent an additional and very flexible source of the Group's financing. During recent periods bonds have become a significant source of debt capital having one quarter share on external financing.
Bonds balance totals EUR 738 million as at 30 Jun 2017 (2016: EUR 707 million) and comprises of project bonds of EUR 167 million (2016: EUR 164 million) and corporate bonds of EUR 572 million (2016: EUR 542 million). Bonds bear an interest of EUR 20 million as at 30 Jun 2017 (2016: EUR 18 million).
In H1 2017, the Group issued following new bonds:
• project bonds in the total nominal value of EUR 20 million, with maturity in the year 2019, bearing a fixed interest of 1.85% p.a.
• project bonds in the total nominal value of EUR 10 million, with maturity in the year 2019, bearing a fixed interest of 2.55% p.a.
• corporate bonds in the total nominal value of EUR 55 million, with maturity in the year 2022, bearing a fixed interest of 5.00% p.a.
C P I P R O P E R T y G R O U P M A N A G E M E N T R E P O R T J U N E 2 0 1 7 / F I N A N C I N G
01. UniCredit Group Bank: 18%
02. Československá obchodní banka: 14%
03. Deutsche Genossenschafts-Hypothekenbank AG: 13%
04. Helaba landesbank Hessen-Thüringen: 12%
05. Raiffeisenbank Group Bank: 10%
06. Erste Group Bank: 7%
07. Komerční banka: 5%
08. UBS Group AG: 3%
09. Barclays: 2%
10. Sberbank: 2%
11. Other (21 various banks): 14%11.
BanK loans By BanKs 10.
09.
08.
07.
06.
05.04.
03.
02.
01.
PRoJEct BonDs REfinancing:• NOMINALvALUE: EUR 30 MIllION• INtEREStRAtE COMPRESSION: 0.95% P.A.
nEW BonDs:• EUR55MILLION BONDS PlACED ON SlOvAKIAN MARKET• EUR30MILLION BONDS REFINANCED
The Group repaid two tranches of project bonds during 2017. On 7 May 2017, the Group repaid CPI ByTy 2.50/17 CZK (ISIN CZ0003512485) tranche representing CZK 300 million (EUR 11 million). On 7 May 2017, the Group repaid CPI ByTy 3.50/17 (ISIN CZ0003510687) tranche represented by nominal value of CZK 500 million (EUR 19 million) excluding accrued interest.
More than 77% of the bonds outstanding balance (EUR 572 million) provide unsecured financing, while the remaining represents bonds which are secured by a mortgage. Unsecured bonds are generally used as source of financing for current and future investment activities.
The significant volume of issued bonds (38% of the nominal balance) is held by other companies within the Group which provide a certain level of flexibility of financing the investment activities. Effective costs of financing are 4.89% p.a. (2016: 4.93% p.a.).
74% of outstanding bank loan balance (represented by EUR 1 662 million) is drawn from 6 financing bank groups; in total the Group cooperates with 32 banks.
The Group has established an overdraft banking facility with one of the major banks. This facility provides the Group with additional CZK 540 million (EUR 21 million) liquidity for its operational needs. As at 30 June 2017 the balance of the overdraft facility was zero.
A ratio of bonds owned by third parties issued in Czech crowns against bonds owned by third parties issued in Euros is 66:34 as of 30 June 2017 and remains stable over the period (2016: 66:34).
More than 2/3 of bonds held by third parties (EUR 489 million) have been issued on the Czech capital market, of which EUR 167 million represent project financing. The rest of the bonds have been issued on the luxembourg and Slovak capital market – the share of Slovakian market is increasing in time due to supply of Group bonds on this market and unceasing interest of private investors.
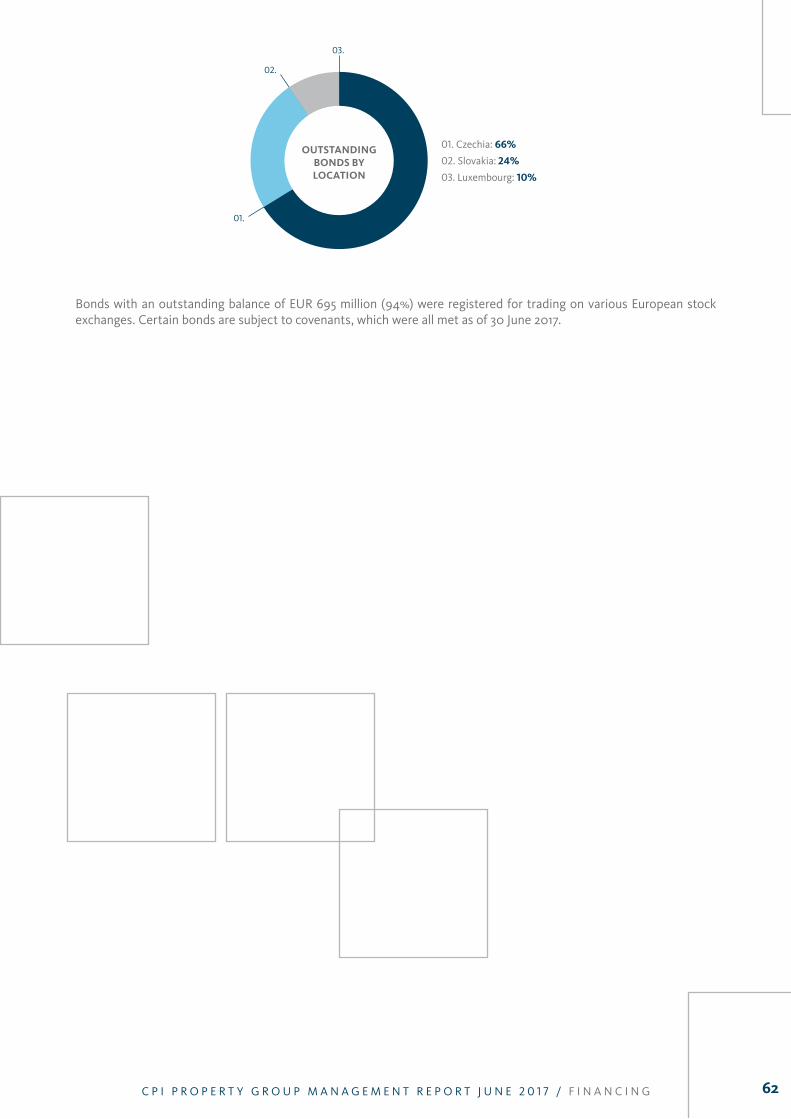
62
01. Czechia: 66%
02. Slovakia: 24%
03. luxembourg: 10%
01.
02.
03.
oUtstanDing BonDs By location
Bonds with an outstanding balance of EUR 695 million (94%) were registered for trading on various European stock exchanges. Certain bonds are subject to covenants, which were all met as of 30 June 2017.
C P I P R O P E R T y G R O U P M A N A G E M E N T R E P O R T J U N E 2 0 1 7 / F I N A N C I N G

62 63C P I P R O P E R T y G R O U P M A N A G E M E N T R E P O R T J U N E 2 0 1 7 / F I N A N C I N G

RESULTS AND NET ASSETS
C P I P R O P E R T y G R O U P M A N A G E M E N T R E P O R T J U N E 2 0 1 7 / R E S U l T S A N D N E T A S S E T S
Andrássy Palace, Budapest
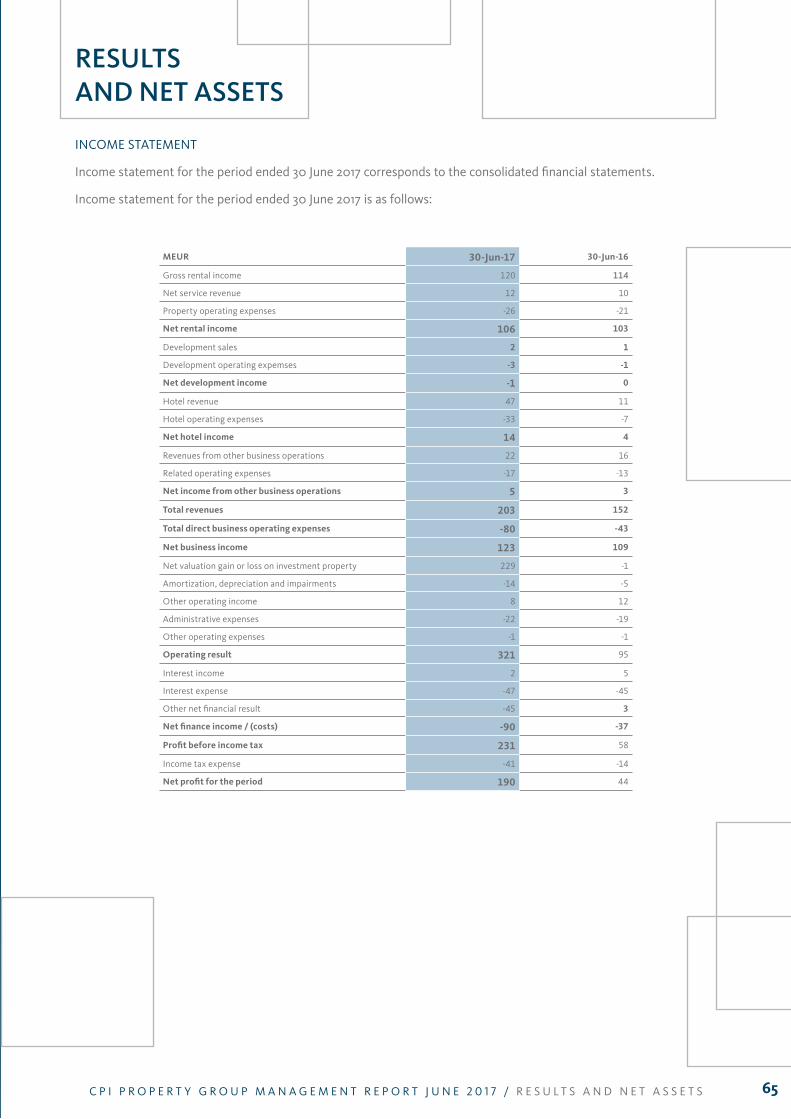
65
INCOME STATEMENT
Income statement for the period ended 30 June 2017 corresponds to the consolidated financial statements.
Income statement for the period ended 30 June 2017 is as follows:
MEUR 30-Jun-17 30-Jun-16
Gross rental income 120 114
Net service revenue 12 10
Property operating expenses -26 -21
net rental income 106 103
Development sales 2 1
Development operating expemses -3 -1
net development income -1 0
Hotel revenue 47 11
Hotel operating expenses -33 -7
net hotel income 14 4
Revenues from other business operations 22 16
Related operating expenses -17 -13
net income from other business operations 5 3
total revenues 203 152
total direct business operating expenses -80 -43
net business income 123 109
Net valuation gain or loss on investment property 229 -1
Amortization, depreciation and impairments -14 -5
Other operating income 8 12
Administrative expenses -22 -19
Other operating expenses -1 -1
operating result 321 95
Interest income 2 5
Interest expense -47 -45
Other net financial result -45 3
net finance income / (costs) -90 -37
Profit before income tax 231 58
Income tax expense -41 -14
net profit for the period 190 44
RESULTS AND NET ASSETS
C P I P R O P E R T y G R O U P M A N A G E M E N T R E P O R T J U N E 2 0 1 7 / R E S U l T S A N D N E T A S S E T S

66 C P I P R O P E R T y G R O U P M A N A G E M E N T R E P O R T J U N E 2 0 1 7 / R E S U l T S A N D N E T A S S E T S
NET RENTAl INCOME
Net rental income slightly increased by 3% to EUR 106 million in H1 2017 (H1 2016: EUR 103 million).
The positive impact of the increase in gross rental income of 5%, reflecting the improved property performance as well as the impact of the new acquisitions in late 2016 and during H1 2017, was compensated by higher property operating expenses which rose by EUR 5 million. The overall positive development in the real estate sector continues to motivate the Group to invest more in repairs and maintenance costs to support the long-term value and marketability of the assets.
NET HOTEl INCOME
The substantial increase is attributable, primarily to the acquisition of Sunčani Hvar hotels portfolio in May 2016 and the acquisition of 100% share in CPI Hotels, a.s., a long-term business partner which operates 24 hotels owned by the Group, in August 2016.
NET vAlUATION GAIN
The overall gain on revaluation of the property portfolio totals EUR 229 million and its based predominantly on the valuation appraisals prepared by independent and reputable appraisers. The gain was driven primarily by the overall performance improvement of the projects, current situation on the Czech residential market and successful acquisitions carried out in late 2016 and 2017.
AMORTIZATION, DEPRECIATION AND IMPAIRMENTS
The substantial increase in amortization, depreciation and impairments reflects predominantly the transfer of hotel properties from investment property to property, plant and equipment due to the acquisition of hotel operator CPI Hotels, a.s.
OTHER NET FINANCIAl RESUlT
Other net financial result was adversely affected by foreign exchange loss of EUR 46 million. In April 2017, the Czech National Bank ended its Czech koruna floor commitment. The Czech koruna is steadily appreciating since then. Significant existing intercompany relationships between entities with functional currencies of Czech koruna and Euro and revaluation of EUR denominated assets on Czech entities were the major reasons for net foreign exchange loss in 2017.
INCOME TAX EXPENSE
Increase in income tax expense by EUR 27 million reflects primarily the deferred tax effect of the property portfolio revaluation.
FUNDS FROM OPERATIONS (FFO)
In H1 2017 the Group generated EUR 51 million Funds from operations (FFO).
30-Jun-17 30-Jun-16
net profit for the period MEUR 190 44
Deferred income tax MEUR 35 11
Net valuation gain or loss on investment property MEUR -229 1
Net valuation gain or loss on revaluation of derivatives MEUR -6 2
Net gain or loss on disposal of assets MEUR 3 0
Amortization, depreciation and impairments MEUR 14 5
Other non-recurring / non-cash items MEUR 44 -12
funds from operations (ffo) MEUR 51 51

67C P I P R O P E R T y G R O U P M A N A G E M E N T R E P O R T J U N E 2 0 1 7 / R E S U l T S A N D N E T A S S E T S
BAlANCE SHEET
Balance sheet as at 30 June 2017 corresponds to the consolidated financial statements.
MEUR 30-Jun-17 30-Jun-16
non-cURREnt assEts
Intangible assets and goodwill 150 117
Investment property 4 923 3 978
Property, plant and equipment 682 679
Deferrred tax asset 124 122
Other non-current assets 47 17
total non-current assets 5 926 4 913
cURREnt assEts
Inventories 100 98
Trade receivables 75 68
Cash and cash equivalents 235 304
Assets held for sale 12 124
Other current assets 140 155
total current assets 564 749
total assEts 6 490 5 662
EqUity
Equity attributable to owners of the Company 2 567 2 259
Non controlling interests 31 30
total equity 2 598 2 289
non-cURREnt liaBilitiEs
Bonds issued 688 657
Financial debts 1 741 1 294
Deferred tax liabilities 579 504
Other non-current liabilities 42 38
total non-current liabilities 3 052 2 493
cURREnt liaBilitiEs
Bonds issued 50 50
Financial debts 596 582
Trade payables 66 66
liabilities linked to assets held for sale -- 59
Other current liabilities 128 123
total current liabilities 840 880
total EqUity anD liaBilitiEs 6 490 5 662
TOTAl ASSETS AND TOTAl lIABIlITIES
Total assets increased by EUR 828 million (15%) to EUR 6 490 million as at 30 June 2017. The increase is primarily connected with the increase in property portfolio which rose by EUR 842 million.
Non-current and current liabilities total EUR 3 891 million as at 30 June 2017 which represents increase by EUR 518 million (15%) compared to 31 December 2016. The main driver of this increase was a growth in external financing as a result of the acquisitions.
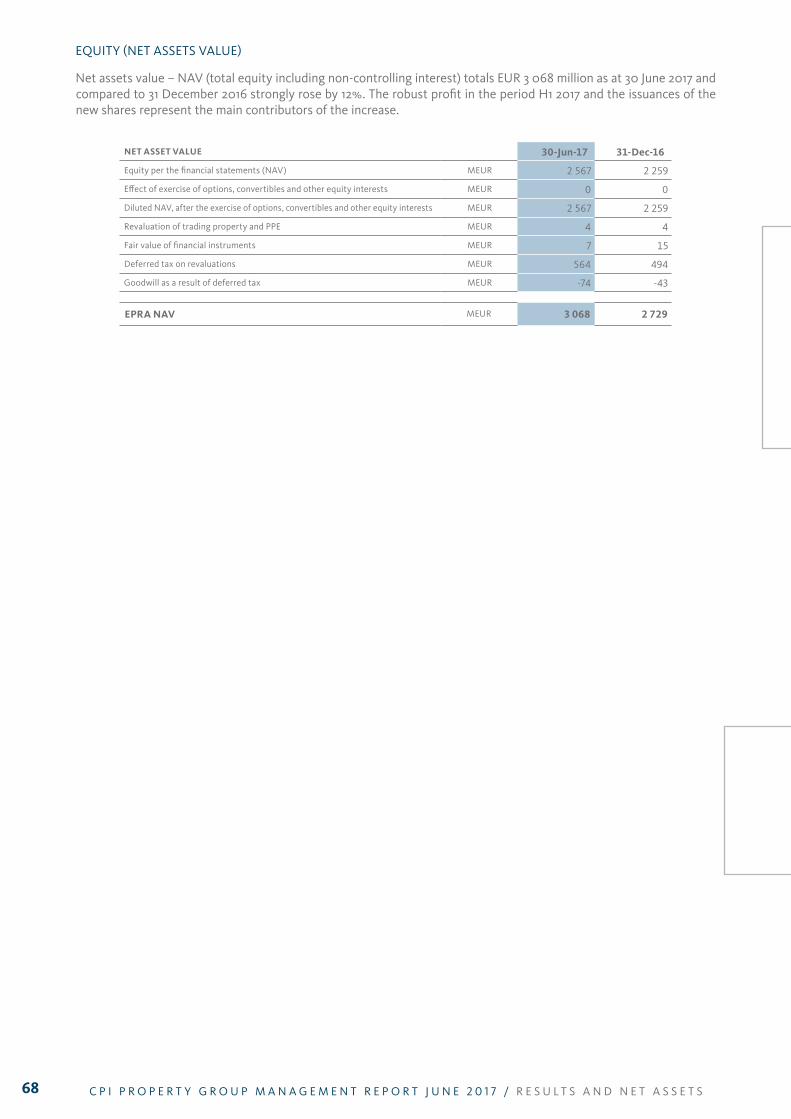
68
EQUITy (NET ASSETS vAlUE)
Net assets value – NAv (total equity including non-controlling interest) totals EUR 3 068 million as at 30 June 2017 and compared to 31 December 2016 strongly rose by 12%. The robust profit in the period H1 2017 and the issuances of the new shares represent the main contributors of the increase.
nEt assEt ValUE 30-Jun-17 31-Dec-16
Equity per the financial statements (NAv) MEUR 2 567 2 259
Effect of exercise of options, convertibles and other equity interests MEUR 0 0
Diluted NAv, after the exercise of options, convertibles and other equity interests MEUR 2 567 2 259
Revaluation of trading property and PPE MEUR 4 4
Fair value of financial instruments MEUR 7 15
Deferred tax on revaluations MEUR 564 494
Goodwill as a result of deferred tax MEUR -74 -43
EPRa naV MEUR 3 068 2 729
C P I P R O P E R T y G R O U P M A N A G E M E N T R E P O R T J U N E 2 0 1 7 / R E S U l T S A N D N E T A S S E T S

69C P I P R O P E R T y G R O U P M A N A G E M E N T R E P O R T J U N E 2 0 1 7 / R E S U l T S A N D N E T A S S E T S

OUTLOOK
C P I P R O P E R T y G R O U P M A N A G E M E N T R E P O R T J U N E 2 0 1 7 / O U T l O O K
GSG Berlin, GSG Berlin Reichenberger Strasse1
71
looking ahead, the Group endeavours to maintain investment in the portfolio, upgrade and increase the quality of its assets and seek new approaches in providing additional services and improving relationships with our tenants. We will continue searching for ideal, representative acquisitions that provide long-term stability and structure that achieve reliable and lasting income for the Group. We aim to intensify financing activities both in credit improvement and bond financing together with the reduction of external capital and the enhancement of extensive loan repayments.
The Group will continue to support and diversify our development and residential portfolios. Proceedings with the Group’s largest development project Zbrojovka in Brno, are set to continue alongside the reopening of newly refurbished IGy shopping centre in České Budějovice scheduled in November, 2017. Further developments include luxury villa and residential projects in France, Italy and the Czech Republic.
The Group’s long-term mission is the provision of superior services and appropriate solutions to existing and future tenants. An increased concentration of new and innovative technologies and trends in the refurbishment and modernisation of the shopping centre and retail sectors. The Group is concentrating on occupancy rates with the extension of leases along with new tenancy integration, mix enhancement and adaptation to regional requirements.
OUTLOOK
C P I P R O P E R T y G R O U P M A N A G E M E N T R E P O R T J U N E 2 0 1 7 / O U T l O O K

CORPORATEGOVERNANCE
C P I P R O P E R T y G R O U P M A N A G E M E N T R E P O R T J U N E 2 0 1 7 / C O R P O R A T E G O v E R N A N C E
Nestlé, Prague
73
PRINCIPlES
Good corporate governance improves transparency and the quality of reporting, enables effective management control, safeguards shareholder interests and serves as an important tool to build corporate culture. The Company is dedicated to acting in the best interests of its shareholders and stakeholders.
The Company is committed to continually and progressively implement industry best practices with respect to corporate governance and has been adjusting and improving its internal practices in order to meet evolving standards. The Company aims to communicate regularly with its shareholders and stakeholders regarding corporate governance and to provide regular updates on its website.
The Company follows the Ten Principles and their Recommendations of the luxembourg Stock Exchange as a reference for its Corporate Governance Rules.
DESCRIPTION OF INTERNAl CONTROlS RElATIvE TO FINANCIAl INFORMATION PROCESSING
The Company has organised the management of internal control by the definition of control environment, the identification of the preeminent risks to which it is exposed together with the level of control of these risks, and strengthening the reliability of the financial reporting and communication process.
There is a limited and defined scope of power of attorneys granted.
The establishment of a senior internal auditor role strengthened the internal audit process of the Group.
For the annual and semi-annual closures, the Company’s executive management members indicate any transactions they have carried out with the Company as “Related parties”.
AUDIT COMMITTEE
The Audit Committee is comprised of the following members of the Board of Directors:
• Mr. Edward Hughes (president);
• Mr. Philippe Magistretti;
• Mr. Tomáš Salajka.
The Audit Committee reviews the Company’s accounting policies and the communication of financial information. In particular, the Audit Committee follows the auditing process, reviews and enhances the Company’s reporting procedures by business lines, reviews risk factors and risk control procedures.
REMUNERATION AND RElATED PARTy TRANSACTION COMMITTEE
The Remuneration and Related Party Transaction Committee (the “Remuneration Committee”) is comprised of following people:
• Mr. Edward Hughes (president);
• Mr. Martin Němeček;
• Mr. Radovan vítek;
The Remuneration Committee presents proposals to the Board of Directors about remuneration and incentive programs to be offered to the management and the Directors of the Company. The Remuneration Committee also deals with related party transactions.
CORPORATEGOVERNANCE
C P I P R O P E R T y G R O U P M A N A G E M E N T R E P O R T J U N E 2 0 1 7 / C O R P O R A T E G O v E R N A N C E

MANAGEMENT
C P I P R O P E R T y G R O U P M A N A G E M E N T R E P O R T J U N E 2 0 1 7 / M A N A G E M E N T
GSG Berlin Helmholtzstr

75
MANAGEMENT
C P I P R O P E R T y G R O U P M A N A G E M E N T R E P O R T J U N E 2 0 1 7 / M A N A G E M E N T
tHE MEMBERs of tHE ManagEMEnt as of 30 JUnE 2017 aRE:
MARTIN NĚMEČEKChief Executive Officer
Mr. Martin Němeček, CEO of CPI Property Group, was appointed in March, 2014. Martin has recently led the acquisition and integration by CPI Property Group of Czech Property Investments. Before joining CPI Property Group, Martin was the Deputy CEO of CPI Group, where he was responsible for real estate acquisitions and the management of transactions with total values over €1.5 billion, including the Group’s overseas expansion and the acquisition of Ablon and Endurance Fund. Martin also oversaw the bank project financing and legal affairs of CPI Group. From 2001 to 2011, he worked for the law firms, Salans (today Dentons), linklaters and Kinstellar. Martin graduated from the Faculty of law at Charles University in Prague and the University of Economics, Prague.
ZDENĚK HAvElKAExecutive Director
Mr. Zdeněk Havelka, Executive Director of CPI Property Group, was appointed in June, 2014. Before joining CPI Property Group, Zdeněk led CPI Group as CEO. He joined Czech Property Investments in 2002 as a senior accountant. later, he was assigned to Chief Financial Officer. In 2005, he was nominated the Chief Executive Officer and his direct subordinates were the directors of the departments of internal audit, development, asset management, acquisitions, property management and operations. He was present during the most important milestones for the growth of the Group that has already expanded beyond the borders of Czechia. Zdeněk is a graduate of the Faculty of Agriculture, University of South Bohemia in České Budějovice.
TOMÁš SAlAJKADirector of Acquisitions, Asset Management & Sales
Mr. Tomáš Salajka, Director of Acquisitions, Asset Management & Sales of CPI Property Group, was appointed in June, 2014. Before joining CPI Property Group, Tomáš was the CEO of Orco Property Group and worked over the last 10 years for GE Real Estate Germany/CEE as Head of Asset Management & Sales CEE and previously for CSOB in Restructuring. He studied foreign trade at the University of Economics in Prague.
PAvEl MĚCHURAChief Financial Officer
Mr. Pavel Měchura, CFO of CPI Property Group, was appointed in June, 2014. Before joining the company, Pavel worked for almost 4 years for Czech Property Investments, firstly as an IFRS specialist, two years later, he became manager of IFRS and Analysis. In May 2014, he was appointed Chief Financial Officer and was responsible for the entire Czech Property Investment’s accounting departments. Pavel gained many years of experience at KPMG where he was responsible for leading audit engagements of large companies, mainly from the automotive, real estate and petrochemical industries. Pavel graduated from the Faculty of Economics at the Technical University of liberec.

BOARD OF DIRECTORS
C P I P R O P E R T y G R O U P M A N A G E M E N T R E P O R T J U N E 2 0 1 7 / B O A R D O F D I R E C T O R S
Arena Corner, Budapest
77
BOARD OF DIRECTORS
C P I P R O P E R T y G R O U P M A N A G E M E N T R E P O R T J U N E 2 0 1 7 / B O A R D O F D I R E C T O R S
The Company is administered and supervised by the Board of Directors. The Board of Directors represents the collective shareholders and acts in the best interests of the Company. The Board of Directors meetings are held as often as deemed necessary or appropriate at the request of the Chairman. All members, and in particular the independent and non-executive members, are guided by the interests of the Company and its business, such interests including but not limited to the interests of the Company’s shareholders and employees.
The members of the Board of Directors are elected by the general meeting of shareholders for a period not exceeding six years. They are eligible for re-election and may be removed at any time, by a resolution adopted by a simple majority of votes of the general meeting of shareholders. The Directors may be either natural persons or legal entities. In the event of a vacancy on the Board of Directors, the remaining members may co-opt a new member. The Board of Directors has the following tasks and competencies, without such list being exhaustive:
• Setting the objectives and management policies of the Company;
• Preparing the annual operating and financing plans;
• Managing the Company’s business affairs and performing all the acts and operations relating to the corporate purpose that do not fall within the duties attributed to other bodies of the Company;
• Representing the Company in or out of court;
• Acquiring, selling real estate;
• Incorporating companies;
• Adopting resolutions regarding issuance of bonds;
• Adopting resolutions regarding issuance of shares pursuant to the authorised share capital.
As at 30 June 2017, the Board of Directors consisted of the following members:
• Edward Hughes, Chairman of the Board;
• Philippe Magistretti;
• Martin Němeček, Managing Director;
• Tomáš Salajka;
• Oliver Schlink;
• Radovan vítek; and
• Marie vítková
The Board of Directors is comprised of:
• 4 executive members representing the management of the Company: Martin Němeček, CEO, Tomáš Salajka, Director of Acquisitions, Asset Management & Sales, Philippe Magistretti, President of CMA s.a. Crans Montana and Oliver Schlink, CFO of Company’s subsidiary GSG Berlin;
• 1 independent, non-executive member: Edward Hughes;
• 2 non-executive members representing shareholders: Radovan vítek and Marie vítková.
The current Board members were appointed during the Company’s annual general meeting of 2017 and their term expires at the annual general meeting of 2018 concerning the approval of the annual accounts of the Company for the financial year ending 31 December 2017.

OTHER REPORTING
REQUIREMENTS
C P I P R O P E R T y G R O U P M A N A G E M E N T R E P O R T J U N E 2 0 1 7 / O T H E R R E P O R T I N G R E Q U I R E M E N T SC P I P R O P E R T y G R O U P M A N A G E M E N T R E P O R T J U N E 2 0 1 7 / O T H E R R E P O R T I N G R E Q U I R E M E N T S
Bondy Centre, Mladá Boleslav
79
OTHER REPORTINGREQUIREMENTS
C P I P R O P E R T y G R O U P M A N A G E M E N T R E P O R T J U N E 2 0 1 7 / O T H E R R E P O R T I N G R E Q U I R E M E N T S
SUBSEQUENT EvENTS
Please refer to Note 11 of the Consolidated Financial Statements as at 30 June 2017.
FINANCIAl RISKS EXPOSURE
For detail description of the principal risks and uncertainties, please refer to Note 2 Basis of Preparation of the Consolidated Financial Statements as at 30 June 2017.
REQUIRED INFORMATION
In reference to the information required by paragraphs (a) to (k) of Article 11(1) of the law of 19 May 2006 transposing Directive 2004/25/EC of the European Parliament and of the Council of 21 April 2004 on takeover bids, the Board of Directors states the following elements:
(a) The structure of the capital, including securities which are not admitted to trading on a regulated market in a Member State, where appropriate with an indication of the different classes of shares and for each class of shares, the rights and obligations attaching to it and the percentage of total share capital that it represents:
The share capital of the Company is represented by 8 310 617 846 ordinary shares of one class, out of which 230 056 445 shares (approximately 2.77% of the total number of shares), registered under ISIN code lU0251710041 are admitted to trading on the regulated market of the Frankfurt Stock Exchange in the General Standard segment. The remaining 8 080 561 401 Company shares (approximately 97.23% of the total number of shares) are currently not listed and are non-tradeable on a regulated market.
The extraordinary general meeting of Company shareholders held on 26 June 2017 (the “EGM”) introduced the legal framework to create and issue up to ten billion (10 000 000 000) non-voting shares, having a par value of ten eurocents (EUR 0.10) each, which (i) shall be entitled to receive, out of the net profits of the Company, a preferred dividend per non-voting share amounting to six point nine percent (6.90 %) of the subscription price of the non-voting share, the remainder of such net profits to be shared between all the shares issued by the Company (excluding the non-voting shares), (ii) carry a right to reimbursement of the contribution (including any premium paid) corresponding to the non-voting shares on a preferential basis out of the net proceeds of the liquidation and (iii) be entitled to receive a preferential liquidation dividend amounting to six point nine percent (6.90 %) of the par value of the non-voting shares in case of dissolution and liquidation of the Company.
EGM also decided to introduce the possibility for the board of directors of the Company to create and issue up to ten billion (10 000 000 000) beneficiary shares without any voting rights and being under registered form only, to be paid up by contribution in cash, in kind or in services, each beneficiary share entitling its holder to receive, subject to the existence of distributable amounts at the level of the Company within the meaning of the law and the decision of the general meeting of the shareholders to operate a dividend distribution to the holders of the beneficiary shares, a dividend per beneficiary share amounting to six point nine percent (6.90 %) of the issue price of each of the beneficiary shares per financial year of the Company. The EGM granted to the board of directors of the Company all powers to create and issue beneficiary shares with no voting rights and to further determine and set forth the terms and conditions of such beneficiary shares with no voting rights in their respective issue documentation.
However, as at the date of this report, none of these types of shares (neither non-voting nor beneficiary shares) have been issued by the Company.
(b) Any restrictions on the transfer of securities, such as limitations on the holding of securities or the need to obtain the approval of the company or other holders of securities, without prejudice to Article 46 of Directive 2001/34/EC:
There are no restrictions on the transfer of Company’s securities. The 230 056 445 Company shares (approx. 2.77% of the total number of shares) registered under ISIN code lU0251710041 are admitted to trading on the regulated market of the Frankfurt Stock Exchange in the General Standard segment. The remaining 8 080 561 401 Company shares (approx. 97.23% of the total number of shares) are currently not listed and not tradeable on a regulated market. There are no particular restrictions on the transfer of securities issued by the Company.
(c) Significant direct and indirect shareholdings (including indirect shareholdings through pyramid structures and crossshareholdings) within the meaning of Article 85 of Directive 2001/34/EC:

80
To the best of Company’s knowledge, the following table sets out information regarding the ownership of the Company s shares as at 30 June 2017:
shareholder number of shares share held
Radovan vítek and entities controlled by Mr. vítek 7 461 043 946 89.78%
Others 756 404 549 9.10%
Treasury shares 93 169 351 1.12%
total 8 310 617 846 100.00%
(d) The holders of any securities with special control rights and a description of those rights:
None of the Company’s principal shareholders has voting rights different from any other holders of the Company’s shares. The Company respect the rights of its shareholders and ensure they receive equitable treatment. The Company has established a policy of active communication with the shareholders.
(e) The system of control of any employee share scheme where the control rights are not exercised directly by the employees:
The Company has no employee share scheme.
(f) Any restrictions on voting rights, such as limitation on the voting rights of holders of a given percentage or number of votes, deadlines for exercising voting rights, or systems whereby, with the Company’s cooperation, the financial rights attaching to securities are separated from the holding of securities:
There are no restriction on voting rights.
g) Any agreements between shareholders which are known to the company and may result in restrictions on the transfer of securities and/or voting rights within the meaning of Directive 2001/34/EC:
In relationship to mandatory public takeover offer (the „Mandatory Offer“) to the shareholders of the Company by Materali, a.s. and according to the related offer document Materali, a.s. and Deutsche Bank AG entered into non-tender agreements with each of Orco Property Group S.A., Brillant 1419. GmbH & Co. verwaltungs KG and linkskaters limited (the “Major Shareholders”) under which the Major Shareholders have undertaken not to tender a total of 137 464 693 Company shares held by the Major Shareholders into the Mandatory Offer or to exercise their right to tender. Furthermore, in July 2014, Materali, a.s. and Deutsche Bank AG entered into security blockage agreements with each of the Major Shareholders and their depositary banks (except for Brillant 1419. GmbH & Co. verwaltungs KG and its depositary bank) in order to ensure that the depositary banks do not without the Materali, a.s.’ and Deutsche Bank AG’s consent (i) transfer the Major Shareholder’s Company shares to any other securities or sub-securities account, (ii) deliver the Majority Shareholder’s Company shares to the Major Shareholders or to any third party, (iii) execute any sales orders regarding the Majority Shareholder’s Company shares or (iv) assist, carry out or otherwise support the transfer or other disposition of any of the Major Shareholder’s Company shares.
(h) The rules governing the appointment and replacement of board members and the amendment of the articles of association:
The Company is managed by Board of Directors appointed as a collegiate body by the general meeting of shareholders. The Board of Directors shall be composed of the number of members determined by the general meeting of the shareholders, and shall amount to at least three members. The Directors are elected by the general meeting of shareholders for a period of maximum six years. The directors are eligible for re-election and may be removed with or without cause at any time by decision of the general meeting of shareholders by simple majority vote. In the event of a vacancy in the Board of Directors, the remaining members may co-opt a new member. The articles of association may be modified by an extraordinary general meeting of the shareholders, deliberating with a quorum of at least half of the corporate capital and deciding by a vote of at least a two-thirds majority of the votes cast.
(i) The powers of board members, and in particular the power to issue or buy back shares:
Please refer to the paragraph Board of Directors on page 77 of this Management report.
The Extraordinary General Meeting of the shareholders of the Company held on 28 August 2014 authorised the Board of Directors of the Company to repurchase, in one or several steps, a maximum number of 750 000 000 Company shares from the existing and/or future shareholders of the Company, for a purchase price comprised in the range between one eurocent (EUR 0.01-) and five euro (EUR 5.-), for a period of five (5) years from the date of the General Meeting of 28 August 2014.
The EGM resolved to modify, renew and replace the existing authorised share capital of the Company and to set it to an amount of three billion euros (EUR 3 000 000 000.-) for a period of five (5) years from the date of the EGM, which would authorize the issuance of up to twenty billion (20 000 000 000) new ordinary shares and up to ten billion (10 000 000 000) new non-voting shares .
C P I P R O P E R T y G R O U P M A N A G E M E N T R E P O R T J U N E 2 0 1 7 / O T H E R R E P O R T I N G R E Q U I R E M E N T S
81C P I P R O P E R T y G R O U P M A N A G E M E N T R E P O R T J U N E 2 0 1 7 / O T H E R R E P O R T I N G R E Q U I R E M E N T S C P I P R O P E R T y G R O U P M A N A G E M E N T R E P O R T J U N E 2 0 1 7 / O T H E R R E P O R T I N G R E Q U I R E M E N T S
As at 30 June 2017, the authorised share capital of the Company amounts to EUR 2 948 500 000, which would authorize the issuance of up to 19 485 000 000 new ordinary shares and up to 10 000 000 000 new non-voting shares in addition to the shares currently outstanding.
(j) Any significant agreements to which the company is a party and which take effect, alter or terminate upon a change of control of the company following a takeover bid, and the effects thereof, except where their nature is such that their disclosure would be seriously prejudicial to the company; this exception shall not apply where the company is specifically obliged to disclose such information on the basis of other legal requirements:
Not applicable as of 30 June 2017.
(k) Any agreements between the company and its board members or employees providing for compensation if they resign or are made redundant without valid reason or if their employment ceases because of a takeover bid:
Not applicable as of 30 June 2017.
DIRECTORS’ COMPENSATION
Please refer to Note 10 of the Condensed Consolidated Interim Financial Statements as at 30 June 2017.
OTHER INFORMATION
The Group does not have any activities in research and development.
The Company does not have any branch.

82
The Group presents alternative performance measures (APMs). The APMs used in our report are commonly referred to and analysed amongst professionals participating in the Real Estate Sector to reflect the underlying business performance and to enhance comparability both between different companies in the sector and between different financial periods. APMs should not be considered as a substitute for measures of performance in accordance with the IFRS. The presentation of APMs in the Real Estate Sector is considered advantageous by various participants, including banks, analysts, bondholders and other users of financial information:
• ·APMsprovideadditionalhelpfulandusefulinformationinaconcise and practical manner.
• APMs are commonly used by senior management and Board of Directors for their decisions and setting of mid and long-term strategy of the Group and assist in discussion with outside parties.
• APMs in some cases might better reflect key trends in the Group’s performance which are specific to that sector, i.e. APMs are a way for the management to highlight the key value drivers within the business that may not be obvious in the consolidated financial statements.
ConSolIDATED ADjuSTED EBITDAConsolidated Adjusted EBITDA is net business income as reported deducted by Administrative expenses as reported.
ConSolIDATED ADjuSTED ToTAl ASSETSConsolidated Adjusted Total Assets is Total Assets as reported deducted by Intangible assets and goodwill as reported.
ConSolIDATED CovERAGE RATIoConsolidated Coverage Ratio is a ratio of Consolidated Adjusted EBITDA to Interest expense as reported.
ConSolIDATED lEvERAGE RATIoConsolidated leverage Ratio is a ratio of a sum of Financial Debts as reported and Bonds issued as reported to the Consolidated Adjusted Total Assets.
DEvEloPMEnT FoR REnTAl Development for rental represents carrying value of developed assets – ie. under development or finished assets – being held by the Group with the intention to rent the assets in the foreseeable future.
DEvEloPMEnT FoR SAlEDevelopment for sale represents carrying value of developed assets – ie. under development or finished assets – being held by the Group with the intention to sell the assets in the foreseeable future.
GRoSS lEASABlE AREAGross leasable area is the amount of floor space available to be rented. Gross leasable area is the area for which tenants pay rent, and thus the area that produces income for the property owner.
GRoSS SAlEABlE AREAGross saleable area is the amount of floor space held by the Group with the intention to be sold. Gross saleable area is the area of property to be sold with a capital gain.
GRoSS REnTAl InCoMEGross rental income is the amount the Group collects in rent from its rental properties. It is one of the key figures by which the Group measures its performance.
EPRA nAv EPRA nAv is a measure of the fair value of net assets assuming a normal investment property company business model. Accordingly, there is an assumption of owning and operating investment property for the long term. For this reason, deferred taxes on property revaluations and the fair value of deferred tax liabilities are excluded as the investment property is not expected to be sold and the tax liability is not expected to materialize. In addition, the fair value of financial instruments which the company intends to hold !to maturity is excluded as these will cancel out on settlement. All other assets including trading property, finance leases, and investments reported at cost are adjusted to fair value.
The performance indicator has been prepared in accordance with best practices as defined by EPRA (European Public Real Estate Association) in its Best Practices Recommendations guide, available on EPRA’s website (www.epra.com).
EQuITY RATIoEquity Ratio provides a general assessment of financial risk undertaken. It is calculated as Total Equity divided by Total Assets.
FFoFFo (Funds from operations) provides an indication of core recurring earnings. It assumes net income (computed in accordance with IFRS), excludes non-recurring (non-cash) items like gains (or losses) from sales of property and inventory, impact of derivatives revaluation and impairment transactions. Calculation excludes accounting adjustments for unconsolidated partnerships and joint ventures.
loAn-To-vAluEloan-to-value provides a general assessment of financing risk undertaken. It is calculated as net Debt divided by fair value of Property Portfolio. net Debt is borrowings plus bank overdraft less cash and cash equivalents. Property Portfolio covers all properties held by the Group, independent of the balance sheet classification, from which the Group incurs rental or other operating income.
PoTEnTIAl GRoSS lEASABlE AREAPotential gross leasable area is the total amount of floor space and land area being developed which the Group is planning to rent after the development is complete.
PoTEnTIAl GRoSS SAlEABlE AREAPotential gross saleable area is the total amount of floor space and land area being developed which the Group is planning to sell after the development is complete.
SECuRED ConSolIDATED lEvERAGE RATIoSecured Consolidated leverage Ratio is a ratio of a sum of secured financial debts and secured bonds to Consolidated Adjusted Total Assets.
C P I P R O P E R T y G R O U P M A N A G E M E N T R E P O R T J U N E 2 0 1 7 / O T H E R R E P O R T I N G R E Q U I R E M E N T S
GloSSARY

83C P I P R O P E R T y G R O U P M A N A G E M E N T R E P O R T J U N E 2 0 1 7 / O T H E R R E P O R T I N G R E Q U I R E M E N T S
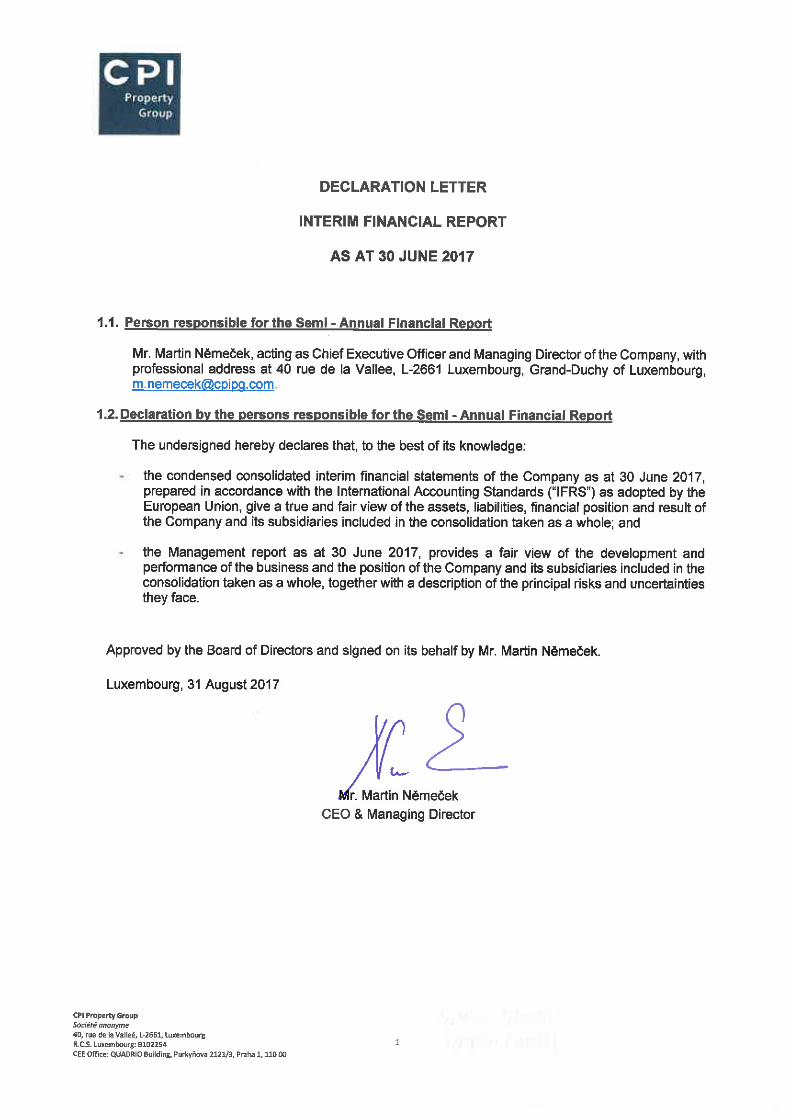
CPI PROPERTY GROUP
CONDENSED CONSOLIDATED INTERIM FINANCIAL
STATEMENTS FOR THE SIX-MONTH PERIOD ENDED
30 JUNE 2017
(UNAUDITED)
CPI PROPERTY GROUP´s Board of Directors has approved the condensed consolidated interim financial
statements for the six-month period ended 30 June 2017 on 31 August 2017.
All the figures in this report are presented in thousands of Euros, except if explicitly indicated otherwise.
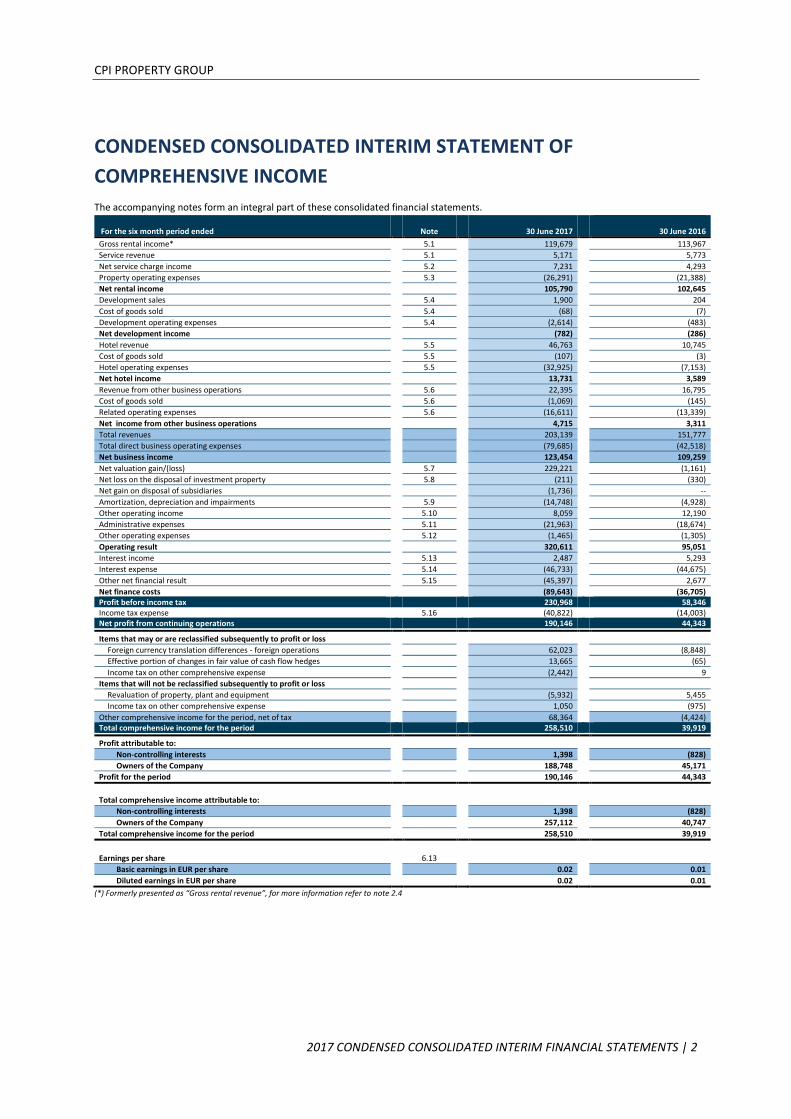
CPI PROPERTY GROUP
2017 CONDENSED CONSOLIDATED INTERIM FINANCIAL STATEMENTS | 2
CONDENSED CONSOLIDATED INTERIM STATEMENT OF
COMPREHENSIVE INCOME
The accompanying notes form an integral part of these consolidated financial statements.
For the six month period ended Note 30 June 2017
30 June 2016
Gross rental income* 5.1 119,679 113,967
Service revenue 5.1 5,171 5,773
Net service charge income 5.2 7,231 4,293
Property operating expenses 5.3 (26,291) (21,388)
Net rental income 105,790 102,645
Development sales 5.4 1,900 204
Cost of goods sold 5.4 (68) (7)
Development operating expenses 5.4 (2,614) (483)
Net development income (782) (286)
Hotel revenue 5.5 46,763 10,745
Cost of goods sold 5.5 (107) (3)
Hotel operating expenses 5.5 (32,925) (7,153)
Net hotel income 13,731 3,589
Revenue from other business operations 5.6 22,395 16,795
Cost of goods sold 5.6 (1,069) (145)
Related operating expenses 5.6 (16,611) (13,339)
Net income from other business operations 4,715 3,311
Total revenues 203,139 151,777
Total direct business operating expenses (79,685) (42,518)
Net business income 123,454 109,259
Net valuation gain/(loss) 5.7 229,221 (1,161)
Net loss on the disposal of investment property 5.8 (211) (330)
Net gain on disposal of subsidiaries (1,736) --
Amortization, depreciation and impairments 5.9 (14,748) (4,928)
Other operating income 5.10 8,059 12,190
Administrative expenses 5.11 (21,963) (18,674)
Other operating expenses 5.12 (1,465) (1,305)
Operating result 320,611 95,051
Interest income 5.13 2,487 5,293
Interest expense 5.14 (46,733) (44,675)
Other net financial result 5.15 (45,397) 2,677
Net finance costs (89,643) (36,705) Profit before income tax 230,968 58,346 Income tax expense 5.16 (40,822) (14,003) Net profit from continuing operations 190,146 44,343
Items that may or are reclassified subsequently to profit or loss Foreign currency translation differences - foreign operations 62,023 (8,848)
Effective portion of changes in fair value of cash flow hedges 13,665 (65)
Income tax on other comprehensive expense (2,442) 9
Items that will not be reclassified subsequently to profit or loss Revaluation of property, plant and equipment (5,932) 5,455
Income tax on other comprehensive expense 1,050 (975)
Other comprehensive income for the period, net of tax 68,364 (4,424) Total comprehensive income for the period 258,510 39,919 Profit attributable to:
Non-controlling interests 1,398 (828)
Owners of the Company 188,748 45,171
Profit for the period 190,146 44,343
Total comprehensive income attributable to:
Non-controlling interests 1,398 (828)
Owners of the Company 257,112 40,747
Total comprehensive income for the period 258,510 39,919
Earnings per share 6.13 Basic earnings in EUR per share 0.02 0.01
Diluted earnings in EUR per share 0.02 0.01
(*) Formerly presented as “Gross rental revenue”, for more information refer to note 2.4
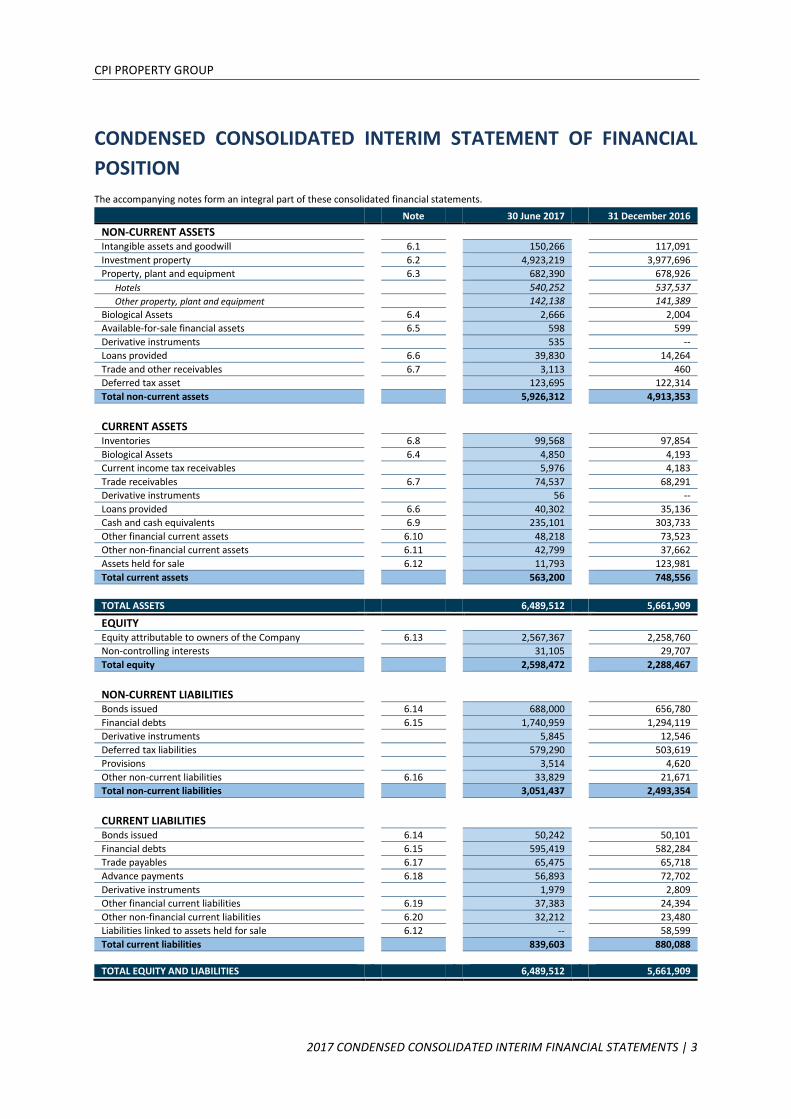
CPI PROPERTY GROUP
2017 CONDENSED CONSOLIDATED INTERIM FINANCIAL STATEMENTS | 3
CONDENSED CONSOLIDATED INTERIM STATEMENT OF FINANCIAL
POSITION
The accompanying notes form an integral part of these consolidated financial statements.
Note 30 June 2017 31 December 2016
NON-CURRENT ASSETS
Intangible assets and goodwill 6.1 150,266 117,091
Investment property 6.2 4,923,219 3,977,696
Property, plant and equipment 6.3 682,390 678,926
Hotels 540,252 537,537
Other property, plant and equipment 142,138 141,389
Biological Assets 6.4 2,666 2,004
Available-for-sale financial assets 6.5 598 599
Derivative instruments 535 --
Loans provided 6.6 39,830 14,264
Trade and other receivables 6.7 3,113 460
Deferred tax asset
123,695 122,314
Total non-current assets
5,926,312 4,913,353
CURRENT ASSETS
Inventories 6.8 99,568 97,854
Biological Assets 6.4 4,850 4,193
Current income tax receivables 5,976 4,183
Trade receivables 6.7 74,537 68,291
Derivative instruments 56 --
Loans provided 6.6 40,302 35,136
Cash and cash equivalents 6.9 235,101 303,733
Other financial current assets 6.10 48,218 73,523
Other non-financial current assets 6.11 42,799 37,662
Assets held for sale 6.12 11,793 123,981
Total current assets 563,200 748,556
TOTAL ASSETS 6,489,512 5,661,909
EQUITY
Equity attributable to owners of the Company 6.13 2,567,367 2,258,760
Non-controlling interests 31,105 29,707
Total equity 2,598,472 2,288,467
NON-CURRENT LIABILITIES
Bonds issued
6.14 688,000 656,780
Financial debts
6.15 1,740,959 1,294,119
Derivative instruments
5,845 12,546
Deferred tax liabilities
579,290 503,619
Provisions
3,514 4,620
Other non-current liabilities
6.16 33,829 21,671
Total non-current liabilities
3,051,437 2,493,354
CURRENT LIABILITIES
Bonds issued
6.14 50,242 50,101
Financial debts
6.15 595,419 582,284
Trade payables
6.17 65,475 65,718
Advance payments
6.18 56,893 72,702
Derivative instruments
1,979 2,809
Other financial current liabilities
6.19 37,383 24,394
Other non-financial current liabilities
6.20 32,212 23,480
Liabilities linked to assets held for sale 6.12 -- 58,599
Total current liabilities
839,603 880,088
TOTAL EQUITY AND LIABILITIES 6,489,512 5,661,909

CPI PROPERTY GROUP
2017 CONDENSED CONSOLIDATED INTERIM FINANCIAL STATEMENTS | 4
CONDENSED CONSOLIDATED INTERIM STATEMENT OF CHANGES IN EQUITY
The accompanying notes form an integral part of these consolidated financial statements.
Note Share
capital
Share premium
Translation
reserve
Legal reserve
Hedging reserve
Other
reserves*
Retained earnings
Equity attributable to owners
of the Company
Non
controlling interests
Total
equity
Balance at 1 January 2017 770,245 1,060,744 (47,970) 5,845 (18,388) 223,058 265,226 2,258,760 29,707 2,288,467
Comprehensive income:
Profit/(loss) for the period -- -- -- -- -- -- 188,748 188,748 1,398 190,146
Total comprehensive income -- -- 62,023 -- -- -- -- 62,023 -- 62,023
Net changes in fair value of cash flow FX hedges -- -- -- -- 10,559 -- -- 10,559 -- 10,559
Related income tax on other comprehensive expense -- -- -- -- (1,880) -- -- (1,880) -- (1,880)
Net changes in fair value of cash flow IRS hedges -- -- -- -- 3,106 -- -- 3,106 -- 3,106
Related income tax on other comprehensive expense -- -- -- -- (563) -- -- (563) -- (563)
Revaluation of property, plant and equipment 6.3 -- -- -- -- -- (5,932) -- (5,932) -- (5,932)
Related deferred tax effect
-- -- -- -- -- 1,050 -- 1,050 -- 1,050
Total comprehensive income/(expense)
-- -- 62,023 -- 11,223 (4,882) -- 68,364 -- 68,364
Total comprehensive income for the period -- -- 62,023 -- 11,223 (4,882) 188,748 257,112 1,398 258,510
Contributions by and distributions to owners of the Company
Capital increases 6.13 51,500 -- -- -- -- -- -- 51,500 -- 51,500
Total contributions by and distributions to owners of the Company 51,500 -- -- -- -- -- -- 51,500 -- 51,500
Disposal of subsidiaries -- -- -- (8) -- -- -- (8) -- (8)
Total changes in ownership interests in subsidiaries -- -- -- (8) -- -- -- (8) -- (8)
Total transactions with owners of the Company 51,500 -- -- (8) -- -- -- 51,492 -- 51,491 Balance at 30 June 2017 821,745 1,060,744 14,053 5,837 (7,165) 218,177 453,974 2,567,367 31,105 2,598,472
* Other Reserves are created from accumulated profits and losses and other equity operations, such as scope variations or revaluation of assets. These reserves may be subject to the distribution of dividends. This item also includes
measurements of post-employment defined benefit obligation.
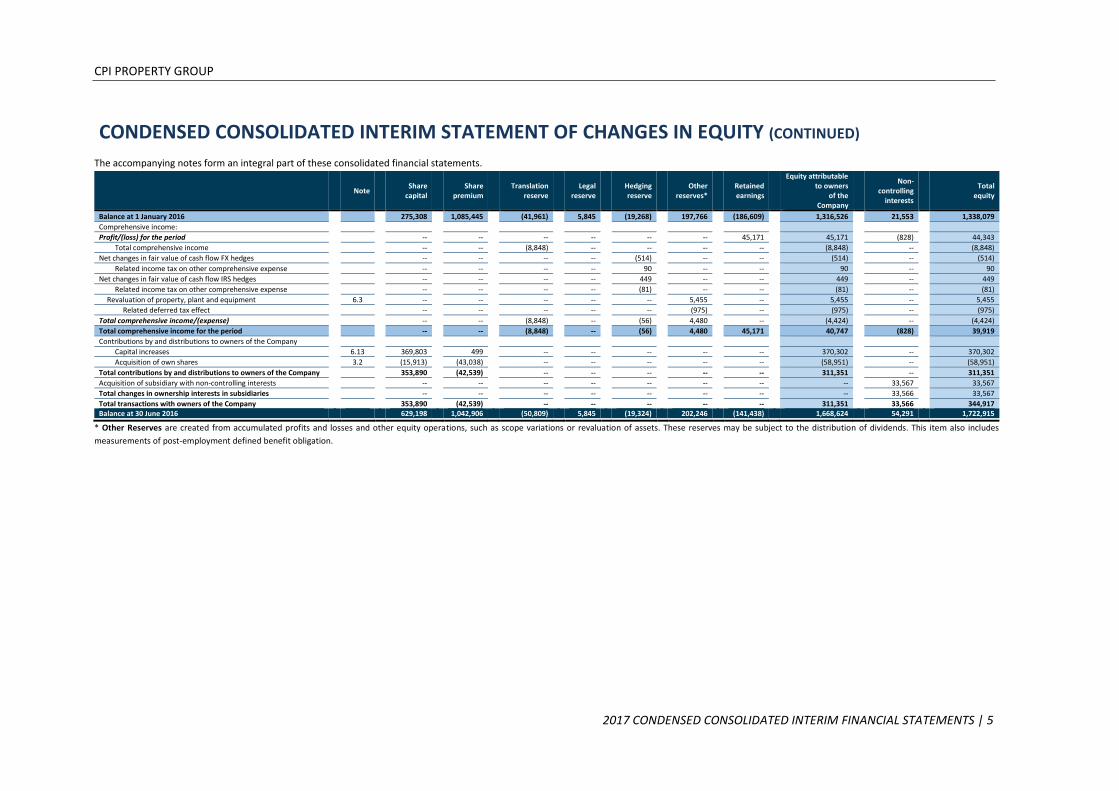
CPI PROPERTY GROUP
2017 CONDENSED CONSOLIDATED INTERIM FINANCIAL STATEMENTS | 5
CONDENSED CONSOLIDATED INTERIM STATEMENT OF CHANGES IN EQUITY (CONTINUED)
The accompanying notes form an integral part of these consolidated financial statements.
Note Share
capital
Share premium
Translation
reserve
Legal reserve
Hedging reserve
Other
reserves*
Retained earnings
Equity attributable to owners
of the Company
Non-
controlling interests
Total
equity
Balance at 1 January 2016 275,308 1,085,445 (41,961) 5,845 (19,268) 197,766 (186,609) 1,316,526 21,553 1,338,079
Comprehensive income:
Profit/(loss) for the period -- -- -- -- -- -- 45,171 45,171 (828) 44,343
Total comprehensive income -- -- (8,848) -- -- -- -- (8,848) -- (8,848)
Net changes in fair value of cash flow FX hedges -- -- -- -- (514) -- -- (514) -- (514)
Related income tax on other comprehensive expense -- -- -- -- 90 -- -- 90 -- 90
Net changes in fair value of cash flow IRS hedges -- -- -- -- 449 -- -- 449 -- 449
Related income tax on other comprehensive expense -- -- -- -- (81) -- -- (81) -- (81)
Revaluation of property, plant and equipment 6.3 -- -- -- -- -- 5,455 -- 5,455 -- 5,455
Related deferred tax effect
-- -- -- -- -- (975) -- (975) -- (975)
Total comprehensive income/(expense) -- -- (8,848) -- (56) 4,480 -- (4,424) -- (4,424)
Total comprehensive income for the period -- -- (8,848) -- (56) 4,480 45,171 40,747 (828) 39,919
Contributions by and distributions to owners of the Company
Capital increases 6.13 369,803 499 -- -- -- -- -- 370,302 -- 370,302
Acquisition of own shares 3.2 (15,913) (43,038) -- -- -- -- -- (58,951) -- (58,951)
Total contributions by and distributions to owners of the Company 353,890 (42,539) -- -- -- -- -- 311,351 -- 311,351
Acquisition of subsidiary with non-controlling interests -- -- -- -- -- -- -- -- 33,567 33,567
Total changes in ownership interests in subsidiaries -- -- -- -- -- -- -- -- 33,566 33,567
Total transactions with owners of the Company 353,890 (42,539) -- -- -- -- -- 311,351 33,566 344,917 Balance at 30 June 2016 629,198 1,042,906 (50,809) 5,845 (19,324) 202,246 (141,438) 1,668,624 54,291 1,722,915
* Other Reserves are created from accumulated profits and losses and other equity operations, such as scope variations or revaluation of assets. These reserves may be subject to the distribution of dividends. This item also includes
measurements of post-employment defined benefit obligation.

CPI PROPERTY GROUP
2017 CONDENSED CONSOLIDATED INTERIM FINANCIAL STATEMENTS | 6
CONDENSED CONSOLIDATED INTERIM CASH FLOW STATEMENT
The accompanying notes form an integral part of these consolidated financial statements.
For the six month period ended Note 30 June 2017 30 June 2016
PROFIT BEFORE INCOME TAX 230,968 58,346
Adjusted by:
Net valuation (gain)/loss on investment property
5.7
(229,221)
1,161
Loss on the disposal of investment property
5.8
211
330
Depreciation/amortisation of tangible and intangible assets
5.9
13,834
5,238
Impairment of assets/(Reversal of impairment of assets)
5.9
914
(328)
Loss on the disposal of subsidiaries
1,736
--
Net finance costs
5.13, 5.14
49,847
42,485
Bargain purchase
3.2
(4,118)
(9,882)
Exchange rate differences
43,168
(7,927)
Profit before changes in working capital and provisions
107,339 89,423
Increase in inventories
(1,207) (336)
Decrease/(increase) in trade receivables
20,925 (29,113)
(Decrease)/increase in trade payables
(5,962) 20,373
Changes in provisions
(1,106) 2,225
Income tax paid
(850) (6,019) NET CASH FROM OPERATING ACTIVITIES 119,139 76,553
Acquisition of subsidiaries, net of cash acquired
3.2
(131,161)
(233,400)
Acquisition of investment property
6.2
(22,093)
(14,300)
Acquisition of available-for-sale financial assets -- (111)
Expenditure on investment property under development
6.2
(4,917)
(1,092)
Proceeds from sale of investment property
5.8
1,086
19,730
Proceeds from sale of available-for-sale financial assets -- 1,376
Proceeds from sale of property, plant and equipment
36
15
Proceeds from disposals of subsidiaries, net of cash disposed
26,068
--
Acquisition of property, plant and equipment
(11,478)
(11,509)
Acquisition of intangible assets
(195)
--
Loans provided
6.6
(34,472)
(13,982)
Loans repaid 6.6 4,580 49,571
Interest received
2,730
10,255 NET CASH USED IN INVESTING ACTIVITIES (169,816) (193,448)
Proceeds from issue of share capital
6.13
51,500
73,500
Proceeds from bond issued 6.14 93,984 205,232
Repayment of bonds issued 6.14 (74,708) (50,080)
Drawdowns of loans and borrowings 179,440 285,341
Repayments of loans and borrowings (217,100) (369,303)
Interest paid
(50,593)
(45,560)
Repayment of finance lease liabilities
(502)
(1,046) NET CASH FROM / (USED IN) FINANCING ACTIVITIES (17,979) 98,083
NET DECREASE IN CASH (68,656) (18,812)
Cash and cash equivalents at the beginning of the year
303,733
159,052
Effect of movements in exchange rates on cash held
24
7 CASH AND CASH EQUIVALENTS AT THE END OF THE PERIOD 235,101 140,247
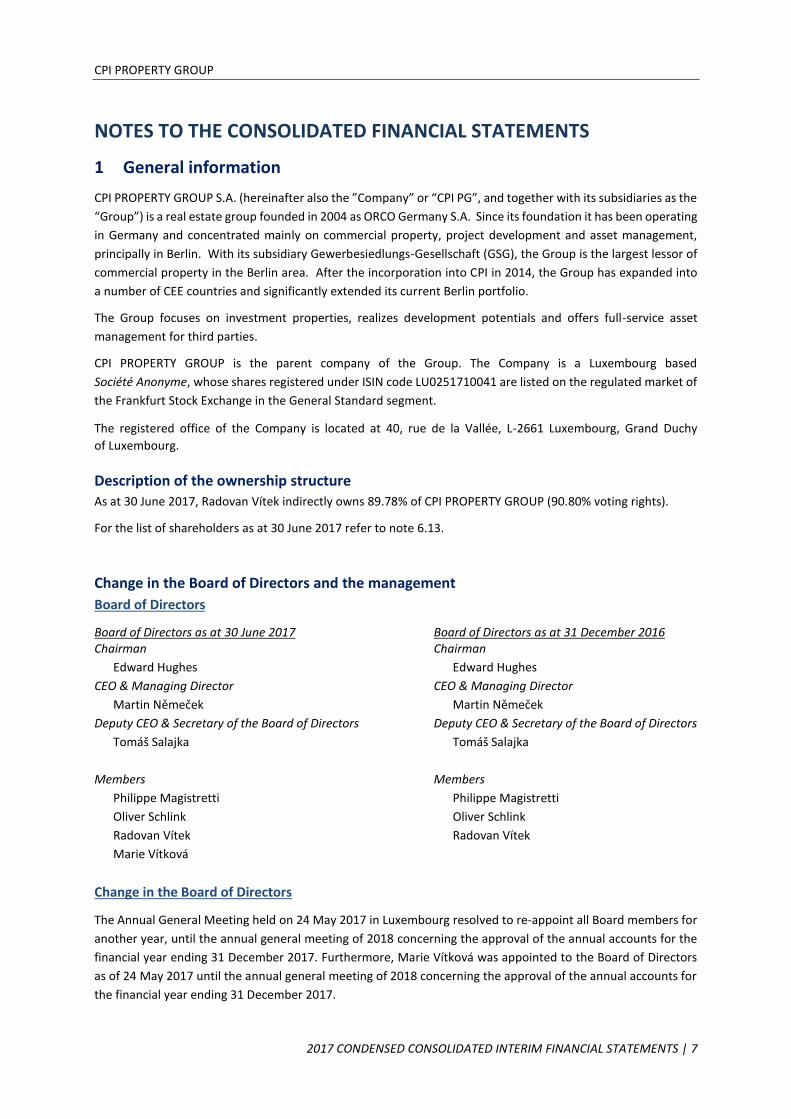
CPI PROPERTY GROUP
2017 CONDENSED CONSOLIDATED INTERIM FINANCIAL STATEMENTS | 7
NOTES TO THE CONSOLIDATED FINANCIAL STATEMENTS
1 General information
CPI PROPERTY GROUP S.A. (hereinafter also the ”Company” or “CPI PG”, and together with its subsidiaries as the
“Group”) is a real estate group founded in 2004 as ORCO Germany S.A. Since its foundation it has been operating
in Germany and concentrated mainly on commercial property, project development and asset management,
principally in Berlin. With its subsidiary Gewerbesiedlungs-Gesellschaft (GSG), the Group is the largest lessor of
commercial property in the Berlin area. After the incorporation into CPI in 2014, the Group has expanded into
a number of CEE countries and significantly extended its current Berlin portfolio.
The Group focuses on investment properties, realizes development potentials and offers full-service asset
management for third parties.
CPI PROPERTY GROUP is the parent company of the Group. The Company is a Luxembourg based
Société Anonyme, whose shares registered under ISIN code LU0251710041 are listed on the regulated market of
the Frankfurt Stock Exchange in the General Standard segment.
The registered office of the Company is located at 40, rue de la Vallée, L-2661 Luxembourg, Grand Duchy
of Luxembourg.
Description of the ownership structure As at 30 June 2017, Radovan Vítek indirectly owns 89.78% of CPI PROPERTY GROUP (90.80% voting rights).
For the list of shareholders as at 30 June 2017 refer to note 6.13.
Change in the Board of Directors and the management
Board of Directors
Board of Directors as at 30 June 2017 Board of Directors as at 31 December 2016 Chairman Chairman
Edward Hughes Edward Hughes
CEO & Managing Director CEO & Managing Director
Martin Němeček Martin Němeček
Deputy CEO & Secretary of the Board of Directors Deputy CEO & Secretary of the Board of Directors
Tomáš Salajka Tomáš Salajka
Members Members
Philippe Magistretti Philippe Magistretti
Oliver Schlink Oliver Schlink
Radovan Vítek Radovan Vítek
Marie Vítková
Change in the Board of Directors
The Annual General Meeting held on 24 May 2017 in Luxembourg resolved to re-appoint all Board members for
another year, until the annual general meeting of 2018 concerning the approval of the annual accounts for the
financial year ending 31 December 2017. Furthermore, Marie Vítková was appointed to the Board of Directors
as of 24 May 2017 until the annual general meeting of 2018 concerning the approval of the annual accounts for
the financial year ending 31 December 2017.

CPI PROPERTY GROUP
2017 CONDENSED CONSOLIDATED INTERIM FINANCIAL STATEMENTS | 8
The management
The management team of the Company is comprised of the following members: Martin Němeček, CEO;
Zdeněk Havelka, Executive Director; Tomáš Salajka, Acquisitions, Asset Management and Sales Director;
Pavel Měchura, CFO; Pavel Semrád, Asset and Letting Director; Petr Beránek, Construction Director
and Martin Matula, General Counsel.
Employees
The Group has 3,672 employees as at 30 June 2017 (as at 31 December 2016 – 3,170 employees).
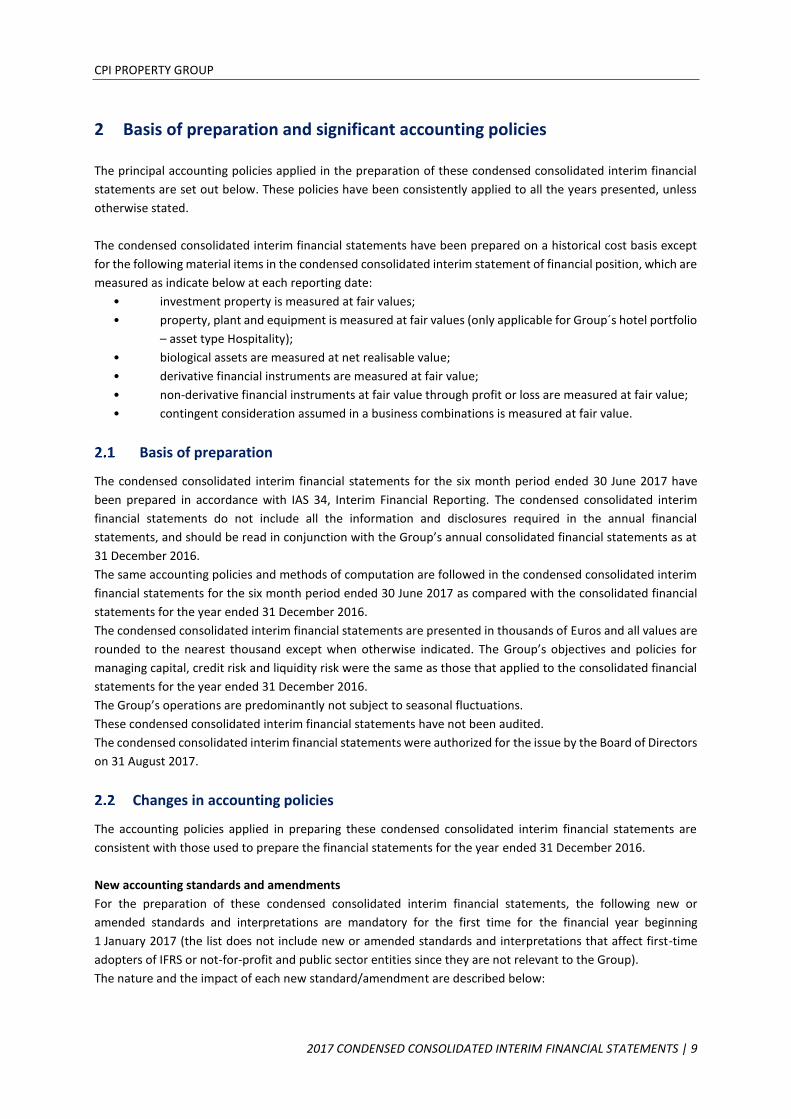
CPI PROPERTY GROUP
2017 CONDENSED CONSOLIDATED INTERIM FINANCIAL STATEMENTS | 9
2 Basis of preparation and significant accounting policies
The principal accounting policies applied in the preparation of these condensed consolidated interim financial
statements are set out below. These policies have been consistently applied to all the years presented, unless
otherwise stated.
The condensed consolidated interim financial statements have been prepared on a historical cost basis except
for the following material items in the condensed consolidated interim statement of financial position, which are
measured as indicate below at each reporting date:
• investment property is measured at fair values;
• property, plant and equipment is measured at fair values (only applicable for Group´s hotel portfolio
– asset type Hospitality);
• biological assets are measured at net realisable value;
• derivative financial instruments are measured at fair value;
• non-derivative financial instruments at fair value through profit or loss are measured at fair value;
• contingent consideration assumed in a business combinations is measured at fair value.
Basis of preparation
The condensed consolidated interim financial statements for the six month period ended 30 June 2017 have
been prepared in accordance with IAS 34, Interim Financial Reporting. The condensed consolidated interim
financial statements do not include all the information and disclosures required in the annual financial
statements, and should be read in conjunction with the Group’s annual consolidated financial statements as at
31 December 2016.
The same accounting policies and methods of computation are followed in the condensed consolidated interim
financial statements for the six month period ended 30 June 2017 as compared with the consolidated financial
statements for the year ended 31 December 2016.
The condensed consolidated interim financial statements are presented in thousands of Euros and all values are
rounded to the nearest thousand except when otherwise indicated. The Group’s objectives and policies for
managing capital, credit risk and liquidity risk were the same as those that applied to the consolidated financial
statements for the year ended 31 December 2016.
The Group’s operations are predominantly not subject to seasonal fluctuations.
These condensed consolidated interim financial statements have not been audited.
The condensed consolidated interim financial statements were authorized for the issue by the Board of Directors
on 31 August 2017.
Changes in accounting policies
The accounting policies applied in preparing these condensed consolidated interim financial statements are
consistent with those used to prepare the financial statements for the year ended 31 December 2016.
New accounting standards and amendments
For the preparation of these condensed consolidated interim financial statements, the following new or
amended standards and interpretations are mandatory for the first time for the financial year beginning
1 January 2017 (the list does not include new or amended standards and interpretations that affect first-time
adopters of IFRS or not-for-profit and public sector entities since they are not relevant to the Group).
The nature and the impact of each new standard/amendment are described below:
CPI PROPERTY GROUP
2017 CONDENSED CONSOLIDATED INTERIM FINANCIAL STATEMENTS | 10
• amendments to IAS 7, 'Statement of Cash Flows' which require entities to provide disclosures about
changes in their liabilities arising from financing activities. This includes both changes arising from cash
flows as well as from non-cash changes (such as foreign exchange gains and losses). Entities are not
required to provide comparative information for proceeding periods.
These amendments to IAS 7 are effective for annual periods beginning on or after 1 January 2017, which
is why additional information will be disclosed by the Group in is annual consolidated financial
statements for the year ended 31 December 2017;
• amendments to IAS 12 'Income Taxes' concerning the recognition of deferred tax assets for unrealised
losses. The amendments clarify that an entity needs to consider, whether tax law restricts the sources
of taxable profits against which it may make deductions on the reversal of that deductible temporary
difference. Guidance is also provided on how an entity should determine the future taxable profits and
explain the circumstances in which taxable profit may include the recovery of some assets for more than
their carrying amount. Retrospective application is required. On initial application of these
amendments, the change in the opening equity of the earliest comparative period may be recognised
in opening retained earnings (or another appropriate component of equity), without allocating the
change between the opening retained earnings and other components of equity. However, entities
applying this relief must disclose the fact
These amendments to IAS 12 are effective for annual periods beginning on or after 1 January 2017.
• Amendments to IFRS 12 'Disclosure of Interests in Other Entities' clarify that disclosure requirements in
IFRS 12 (other than those in paragraphs B10 – B16) apply to an entity´s subsidiary, joint venture or
an associate that is classified as held for sale. These amendments do not have any effect on the Group´s
condensed consolidated interim financial statements as at 30 June 2017.
New standards and interpretations not yet adopted
The following new standards, new interpretations and amendments to standards and interpretations are
effective for annual periods beginning after 1 January 2017 and have not been early adopted by the Group:
• IFRS 9, 'Financial instruments', addresses the classification, measurement and recognition of financial
assets and financial liabilities. The complete version of IFRS 9 was issued in July 2014. It replaces the
guidance in IAS 39 that relates to the classification and measurement of financial instruments. IFRS 9
retains but simplifies the mixed measurement model and establishes three primary measurement
categories for financial assets: amortized cost, fair value through OCI and fair value through P&L.
The basis of classification depends on the entity's business model and the contractual cash flow
characteristics of the financial asset. Investments in equity instruments are required to be measured at
fair value through profit or loss with the irrevocable option at inception to present changes in fair value
in OCI not recycling. There is now a new expected credit losses model that replaces the incurred loss
impairment model used in IAS 39. For financial liabilities there were no changes to classification and
measurement except for the recognition of changes in own credit risk in other comprehensive income,
for liabilities designated at fair value through profit or loss. IFRS 9 relaxes the requirements for hedge
effectiveness by replacing the bright line hedge effectiveness tests. It requires an economic relationship
between the hedged item and hedging instrument and for the ‘hedged ratio’ to be the same as the one
management actually use for risk management purposes. Contemporaneous documentation is still
required but is different to that currently prepared under IAS 39. The standard is effective for accounting
periods beginning on or after 1 January 2018. Early adoption is permitted, subject to EU endorsement.
It is very likely to affect the Group’s accounting treatment of financial instruments. The Group is yet to
assess IFRS 9’s full impact;

CPI PROPERTY GROUP
2017 CONDENSED CONSOLIDATED INTERIM FINANCIAL STATEMENTS | 11
• IFRS 15, 'Revenue from contracts with customers' deals with revenue recognition and establishes
principles for reporting useful information to users of financial statements about the nature, amount,
timing and uncertainty of revenue and cash flows arising from an entity’s contracts with customers.
Revenue is recognized when a customer obtains control of a good or service and thus has the ability to
direct the use and obtain the benefits from the good or service. The standard replaces IAS 18 'Revenue'
and IAS 11 'Construction contracts' and related interpretations. The standard is effective for annual
periods beginning on or after 1 January 2017 and earlier application is permitted, subject to
EU adoption. The Group is assessing the impact of IFRS 15;
• IFRS 16, 'Leases' effective for reporting periods ending 31 December 2019 (early application is
permitted), will replace the actual IAS 17 ‘Leases’. Under IFRS 16, companies will recognise new assets
and liabilities, bringing added transparency to the balance sheet. IFRS 16 eliminates the current dual
accounting model for lessees, which distinguishes between on-balance sheet finance leases and off-
balance sheet operating leases. There will be a single, on-balance model for both finance and operating
leases. The Group is currently assessing the impact of IFRS 16.
The Group has estimated the impact of the implementation of the other new standards and amendments not
early adopted as non-significant.
The Group refers to the endorsement status of the new IFRS standards and amendments to standards and
interpretations as they are published by the European Union
(http://ec.europa.eu/internal_market/accounting/ias/index_en.htm).
Estimates
The preparation of the financial statements requires management to make judgements, estimates
and assumptions that affect the application of accounting policies and the reported amounts of assets
and liabilities, income and expenses. The estimates and associated assumptions are based on historical
experience, internal calculations and various other factors that the management believes to be reasonable under
the circumstances, the results of which form the basis of judgements about the carrying values of assets
and liabilities that are not readily apparent from other sources. The actual results may differ from these
estimates.
In preparing these condensed consolidated interim financial statements, the significant judgements made by
management in applying the Group’s accounting policies and the key sources of estimation uncertainty were
the same as those that applied to the consolidated financial statements for the year ended 31 December 2016.
Change in presentation
In line with the common standards used in the real-estate business the Group’s management decided to rename
item “Gross rental revenue” into “Gross rental income”.The nature of this item remains unchanged. Gross rental
income represents total amount received by the Group from rental activities before taking into account any
costs, expenses or taxes. The term “Gross rental income” shall be used since 30 June 2017 in Group’s
consolidated financial statements.
To ensure consistency with the presentation selected in the current period, the change was made in the
comparative financial statements as at 31 December 2016 and 30 June 2016 respectively.

CPI PROPERTY GROUP
2017 CONDENSED CONSOLIDATED INTERIM FINANCIAL STATEMENTS | 12
3 Group Structure
Control of the Group
CPI Property Group is the Group’s ultimate parent company.
As at 30 June 2017 the Group is formed by parent company, 357 subsidiaries controlled by the parent company
(at 31 December 2016 - 352 subsidiaries) and one joint venture. For list of subsidiaries and joint venture refer to
Appendix I.
Changes in the Group in 2017
During six months of 2017, the Group has acquired/founded the following entities:
Entity Change Share in % Date of acquisition/foundation
Brno Property Development, a.s. Acquisition 86.54% 18 January 2017
REZIDENCE MASARYKOVA 36, s.r.o. Acquisition 100.00% 7 March 2017
Andrassy Real Kft. Acquisition 100.00% 29 March 2017
CAMPONA Shopping Center Kft. Acquisition 100.00% 29 March 2017
Centrum Ogrody Sp. z o.o. Acquisition 100.00% 29 March 2017
Centrum Olympia Plzeň s.r.o. Acquisition 100.00% 29 March 2017
City Gardens Sp. z o.o. Acquisition 100.00% 29 March 2017
FELICIA SHOPPING CENTER SRL Acquisition 100.00% 29 March 2017
IS Nyír Kft. Acquisition 100.00% 29 March 2017
IS Zala Kft. Acquisition 100.00% 29 March 2017
Nisa OC s.r.o. Acquisition 100.00% 29 March 2017
PFCE Prague investments s.r.o. Acquisition 100.00% 29 March 2017
Pólus Shopping Center Zrt. Acquisition 100.00% 29 March 2017
Polus Társasház Üzemeltető Kft. Acquisition 100.00% 29 March 2017
Rezidence Jančova, s.r.o. Founded 100.00% 27 February 2017
Rezidence Malkovského, s.r.o. Founded 100.00% 27 February 2017
Tepelná Litvínov, s.r.o. Founded 100.00% 27 February 2017
CPI Retail One Kft. Founded 100.00% 4 April 2017
CPI Retail Store Kft. Founded 100.00% 6 April 2017
CPI Retail Two Kft. Founded 100.00% 6 April 2017
CPI Kappa, s.r.o. Founded 100.00% 26 May 2017
Nový Projekt CPI, s.r.o. Founded 100.00% 26 May 2017
CPI Finance CEE, a.s. Founded 100.00% 29 May 2017
CPI Blatiny, s.r.o. Founded 100.00% 23 June 2017
The following entities were either disposed of or liquidated in the first six months of 2017:
Entity Change Share in % Date of disposal/liquidation
New Field Kft. Disposal 100.00% 19 January 2017
Capellen S.A. Disposal 97.31% 25 January 2017
CPI Rhea, s.r.o. Disposal 100.00% 21 February 2017
NERONTA, a.s. Disposal 100.00% 28 February 2017
Office Center Purkyňova, a.s. Disposal 100.00% 7 March 2017
Týniště Property Development, s.r.o. Disposal 100.00% 1 April 2017
VM Property Development, a.s. Disposal 100.00% 1 April 2017
Žďár Property Development, a.s. Disposal 100.00% 1 April 2017
Quadrio Residence, s.r.o. Disposal 100.00% 16 June 2017
M3 BC Kft. Disposal 100.00% 29 June 2017
Orco Germany Sp. z o.o Liquidation 100.00% 26 January 2017
Ekodružstvo Severozápad a.s. Liquidation 100.00% 24 February 2017
Orco Hotel Project Sp. z o.o. Liquidation 100.00% 15 March 2017
Orco Hotel Development Sp. z o.o. Liquidation 100.00% 21 March 2017

CPI PROPERTY GROUP
2017 CONDENSED CONSOLIDATED INTERIM FINANCIAL STATEMENTS | 13
Acquisition through the business combinations/property asset acquisitions
Portfolio acquired from CBRE Global Investors (“CBRE GI portfolio”)
On 29 March 2017, the Group has successfully acquired the high-quality retail portfolio of predominantly
11 shopping centres located in the Czech Republic, Hungary, Poland and Romania with a total leasable area
of approximately 280 thousand sqm from two funds managed by CBRE Global Investors.
The acquired portfolio primarily consists of:
Regionally dominant shopping centres:
Olympia shopping centre (Plzeň, Czech Republic)
Nisa shopping centre (Liberec, Czech Republic)
Ogrody shopping centre (Elblag, Poland)
Felicia shopping centre (Iasi, Romania)
Pólus shopping centre (Budapest, Hungary)
Campona shopping centre (Budapest, Hungary)
Mix of prime high-street and office space:
Zlatý Anděl (Prague, Czech Republic)
Andrássy Complex (Budapest, Hungary)
Retail warehouses:
Interspar (Zalaegerszeg, Hungary)
Interspar (Nyiregyhaza, Hungary)
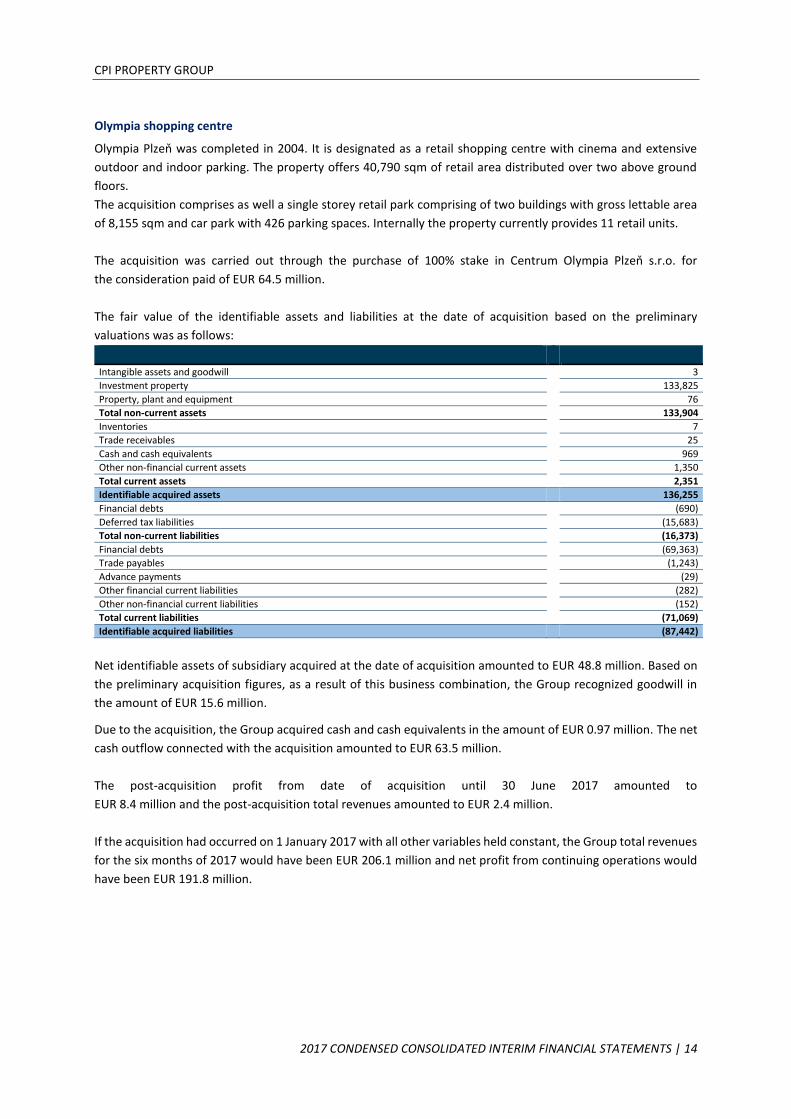
CPI PROPERTY GROUP
2017 CONDENSED CONSOLIDATED INTERIM FINANCIAL STATEMENTS | 14
Olympia shopping centre
Olympia Plzeň was completed in 2004. It is designated as a retail shopping centre with cinema and extensive
outdoor and indoor parking. The property offers 40,790 sqm of retail area distributed over two above ground
floors.
The acquisition comprises as well a single storey retail park comprising of two buildings with gross lettable area
of 8,155 sqm and car park with 426 parking spaces. Internally the property currently provides 11 retail units.
The acquisition was carried out through the purchase of 100% stake in Centrum Olympia Plzeň s.r.o. for
the consideration paid of EUR 64.5 million.
The fair value of the identifiable assets and liabilities at the date of acquisition based on the preliminary
valuations was as follows:
Intangible assets and goodwill 3
Investment property 133,825
Property, plant and equipment 76
Total non-current assets 133,904
Inventories 7
Trade receivables 25
Cash and cash equivalents 969
Other non-financial current assets 1,350
Total current assets 2,351
Identifiable acquired assets 136,255
Financial debts (690)
Deferred tax liabilities (15,683)
Total non-current liabilities (16,373)
Financial debts (69,363)
Trade payables (1,243)
Advance payments (29)
Other financial current liabilities (282)
Other non-financial current liabilities (152)
Total current liabilities (71,069)
Identifiable acquired liabilities (87,442)
Net identifiable assets of subsidiary acquired at the date of acquisition amounted to EUR 48.8 million. Based on
the preliminary acquisition figures, as a result of this business combination, the Group recognized goodwill in
the amount of EUR 15.6 million.
Due to the acquisition, the Group acquired cash and cash equivalents in the amount of EUR 0.97 million. The net
cash outflow connected with the acquisition amounted to EUR 63.5 million.
The post-acquisition profit from date of acquisition until 30 June 2017 amounted to
EUR 8.4 million and the post-acquisition total revenues amounted to EUR 2.4 million.
If the acquisition had occurred on 1 January 2017 with all other variables held constant, the Group total revenues
for the six months of 2017 would have been EUR 206.1 million and net profit from continuing operations would
have been EUR 191.8 million.

CPI PROPERTY GROUP
2017 CONDENSED CONSOLIDATED INTERIM FINANCIAL STATEMENTS | 15
Nisa shopping centre
Nisa represents a modern shopping centre with associated parking, constructed in 1999 and extended in 2008.
It offers 48,949 sqm of lettable area. It is constructed over two or three above ground floors and is of rectangular
layout. The upper floor is accommodates cinema, casino and restaurant. The ground and first floor levels include
retail units. Internally the property currently provides 166 retail units.
The acquisition was carried out through the purchase of 100% stake in Nisa OC s.r.o. for the consideration paid
of EUR 10.2 million.
The fair value of the identifiable assets and liabilities at the date of acquisition based on the preliminary
valuations was as follows:
Intangible assets and goodwill 2
Investment property 81,510
Property, plant and equipment 483
Total non-current assets 81,995
Inventories 1
Trade receivables 369
Cash and cash equivalents 2,956
Other non-financial current assets 1,828
Total current assets 5,154
Identifiable acquired assets 87,149
Financial debts (71,812)
Deferred tax liabilities 632
Other non-current liabilities (1,257)
Total non-current liabilities (72,437)
Financial debts (64)
Trade payables (73)
Advance payments (313)
Other financial current liabilities (2,100)
Other non-financial current liabilities (273)
Total current liabilities (2,823)
Identifiable acquired liabilities (75,260)
Net identifiable assets of subsidiary acquired at the date of acquisition amounted to EUR 11.9 million. Based on
the preliminary acquisition figures, as a result of this business combination, the Group recognized bargain
purchase in the amount of EUR 1.7 million. The gain on bargain purchase is recognized as a part of other operating
income.
Due to the acquisition, the Group acquired cash and cash equivalents in the amount of EUR 3 million. The net
cash outflow connected with the acquisition amounted to EUR 7.2 million.
The post-acquisition profit from date of acquisition until 30 June 2017 amounted to
EUR 12.9 million and the post-acquisition total revenues amounted to EUR 0.8 million.
If the acquisition had occurred on 1 January 2017 with all other variables held constant, the Group total revenues
for the six months of 2017 would have been EUR 205.5 million and net profit from continuing operations would
have been EUR 190.7 million.

CPI PROPERTY GROUP
2017 CONDENSED CONSOLIDATED INTERIM FINANCIAL STATEMENTS | 16
Ogrody shopping centre
Ogrody shopping center is located approximately 3.5 km to the north of Elblag city center. It was constructed in
2002 and its reconstruction was completed in March 2015. It provides a total gross lettable area of approximately
41,931 sqm with ca. 1,250 parking spaces. The shopping centre provides in total 127 retail units with most
of them being located on the ground and first floor.
The acquisition was carried out through the purchase of 100% stakes in City Gardens Sp. z o.o. and Centrum
Ogrody Sp. z o.o. for the consideration paid of PLN 10.2 million (app. EUR 2.4 million).
The fair value of the identifiable assets and liabilities at the date of acquisition based on the preliminary
valuations was as follows:
Investment property 112,967
Total non-current assets 112,967
Trade receivables 661
Cash and cash equivalents 1,828
Other financial current assets 127
Other non-financial current assets 71
Total current assets 2,687
Identifiable acquired assets 115,654
Financial debts (107,036)
Deferred tax liabilities (250)
Other non-current liabilities (322)
Total non-current liabilities (107,608)
Financial debts (4,067)
Trade payables (411)
Advance payments (54)
Other financial current liabilities (70)
Other non-financial current liabilities (1,032)
Total current liabilities (5,634)
Identifiable acquired liabilities (113,242)
Net identifiable assets of subsidiary acquired at the date of acquisition amounted to EUR 2.4 million. Based on
the preliminary acquisition figures, as a result of this business combination, neither goodwill nor bargain
purchase was recognized.
Due to the acquisition, the Group acquired cash and cash equivalents in the amount of EUR 1.9 million. The net
cash outflow connected with the acquisition amounted to EUR 0.5 million.
The post-acquisition profit from date of acquisition until 30 June 2017 amounted to
EUR 7.4 million and the post-acquisition total revenues amounted to EUR 1.9 million.
If the acquisition had occurred on 1 January 2017 with all other variables held constant, the Group total revenues
for the six months of 2017 would have been EUR 206.4 million and net profit from continuing operations would
have been EUR 191.7 million.

CPI PROPERTY GROUP
2017 CONDENSED CONSOLIDATED INTERIM FINANCIAL STATEMENTS | 17
Felicia shopping centre
Felicia shopping centre is located south-east of Iasi city, within the industrial district. Commercial gallery spread
on ground level, part of a traditional medium shopping centre of approximately 26,500 sqm of gross lettable
area, anchored by Carrefour hypermarket. The property also includes shopping gallery, part of common areas
and office space located at 1st floor.
The acquisition was carried out through the purchase of 100% stake in FELICIA SHOPPING CENTER SRL for the
consideration paid of EUR 6.01 million.
The fair value of the identifiable assets and liabilities at the date of acquisition based on the preliminary
valuations was as follows:
Intangible assets and goodwill 1
Investment property 24,991
Total non-current assets 24,992
Inventories 9
Trade receivables 660
Cash and cash equivalents 738
Other non-financial current assets 94
Total current assets 1,501
Identifiable acquired assets 26,493
Deferred tax liabilities 726
Total non-current liabilities 726
Financial debts (18,982)
Trade payables (161)
Advance payments (165)
Other financial current liabilities (582)
Other non-financial current liabilities (103)
Total current liabilities (19,993)
Identifiable acquired liabilities (19,267)
Net identifiable assets of subsidiary acquired at the date of acquisition amounted to EUR 7.2 million. Based on
the preliminary acquisition figures, as a result of this business combination, the Group recognized bargain
purchase in the amount of EUR 1.2 million. The gain on bargain purchase is recognized as a part of other operating
income.
Due to the acquisition, the Group acquired cash and cash equivalents in the amount of EUR 0.7 million. The net
cash outflow connected with the acquisition amounted to EUR 5.27 million.
The post-acquisition profit from date of acquisition until 30 June 2017 amounted to
EUR 4.5 million and the post-acquisition total revenues amounted to EUR 0.8 million.
If the acquisition had occurred on 1 January 2017 with all other variables held constant, the Group total revenues
for the six months of 2017 would have been EUR 203.9 million and net profit from continuing operations would
have been EUR 190.3 million.
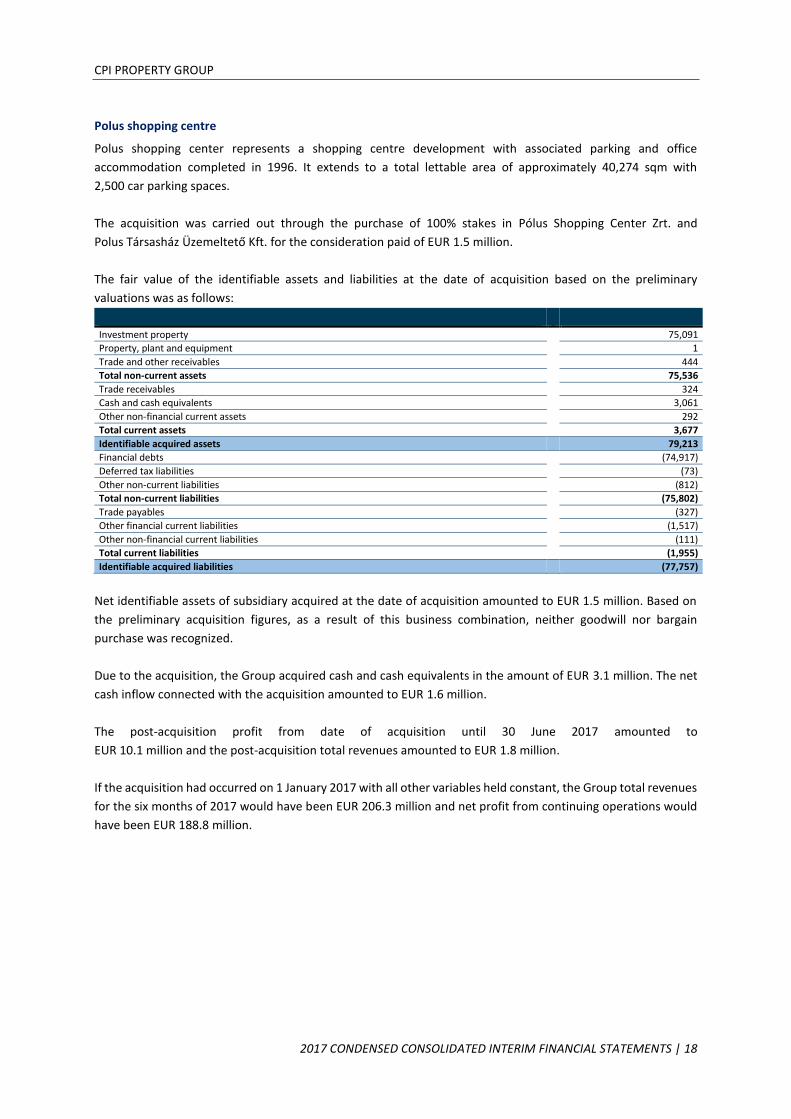
CPI PROPERTY GROUP
2017 CONDENSED CONSOLIDATED INTERIM FINANCIAL STATEMENTS | 18
Polus shopping centre
Polus shopping center represents a shopping centre development with associated parking and office
accommodation completed in 1996. It extends to a total lettable area of approximately 40,274 sqm with
2,500 car parking spaces.
The acquisition was carried out through the purchase of 100% stakes in Pólus Shopping Center Zrt. and
Polus Társasház Üzemeltető Kft. for the consideration paid of EUR 1.5 million.
The fair value of the identifiable assets and liabilities at the date of acquisition based on the preliminary
valuations was as follows:
Investment property 75,091
Property, plant and equipment 1
Trade and other receivables 444
Total non-current assets 75,536
Trade receivables 324
Cash and cash equivalents 3,061
Other non-financial current assets 292
Total current assets 3,677
Identifiable acquired assets 79,213
Financial debts (74,917)
Deferred tax liabilities (73)
Other non-current liabilities (812)
Total non-current liabilities (75,802)
Trade payables (327)
Other financial current liabilities (1,517)
Other non-financial current liabilities (111)
Total current liabilities (1,955)
Identifiable acquired liabilities (77,757)
Net identifiable assets of subsidiary acquired at the date of acquisition amounted to EUR 1.5 million. Based on
the preliminary acquisition figures, as a result of this business combination, neither goodwill nor bargain
purchase was recognized.
Due to the acquisition, the Group acquired cash and cash equivalents in the amount of EUR 3.1 million. The net
cash inflow connected with the acquisition amounted to EUR 1.6 million.
The post-acquisition profit from date of acquisition until 30 June 2017 amounted to
EUR 10.1 million and the post-acquisition total revenues amounted to EUR 1.8 million.
If the acquisition had occurred on 1 January 2017 with all other variables held constant, the Group total revenues
for the six months of 2017 would have been EUR 206.3 million and net profit from continuing operations would
have been EUR 188.8 million.

CPI PROPERTY GROUP
2017 CONDENSED CONSOLIDATED INTERIM FINANCIAL STATEMENTS | 19
Campona shopping centre
Campona shopping centre was constructed in two phases between 1997 and 2000. The first phase consists of
the retail units in a two-storey shopping centre while the second phase consists of the Tropicarium and the
cinema. There is and open parking house in a separate building providing about 2,000 parking spaces on three
floors.
The acquisition was carried out through the purchase of 100% stake in Campona Shopping Center Kft. for the
consideration paid of EUR 2.1 million.
The fair value of the identifiable assets and liabilities at the date of acquisition based on the preliminary
valuations was as follows:
Investment property 66,249
Trade and other receivables 319
Total non-current assets 66,568
Trade receivables 557
Cash and cash equivalents 1,495
Other financial current assets 231
Other non-financial current assets 1,325
Total current assets 3,608
Identifiable acquired assets 70,176
Financial debts (64,915)
Deferred tax liabilities 75
Other non-current liabilities (934)
Total non-current liabilities (65,774)
Trade payables (447)
Advance payments (5)
Other financial current liabilities (691)
Other non-financial current liabilities 50
Total current liabilities (1,093)
Identifiable acquired liabilities (66,867)
Net identifiable assets of subsidiary acquired at the date of acquisition amounted to EUR 3.3 million. Based on
the preliminary acquisition figures, as a result of this business combination, the Group recognized bargain
purchase in the amount of EUR 1.2 million. The gain on bargain purchase is recognized as a part of other operating
income.
Due to the acquisition, the Group acquired cash and cash equivalents in the amount of EUR 1.5 million. The net
cash outflow connected with the acquisition amounted to EUR 0.6 million.
The post-acquisition profit from date of acquisition until 30 June 2017 amounted to
EUR 6.5 million and the post-acquisition total revenues amounted to EUR 1.0 million.
If the acquisition had occurred on 1 January 2017 with all other variables held constant, the Group total revenues
for the six months of 2017 would have been EUR 205.1 million and net profit from continuing operations would
have been EUR 190.3 million.
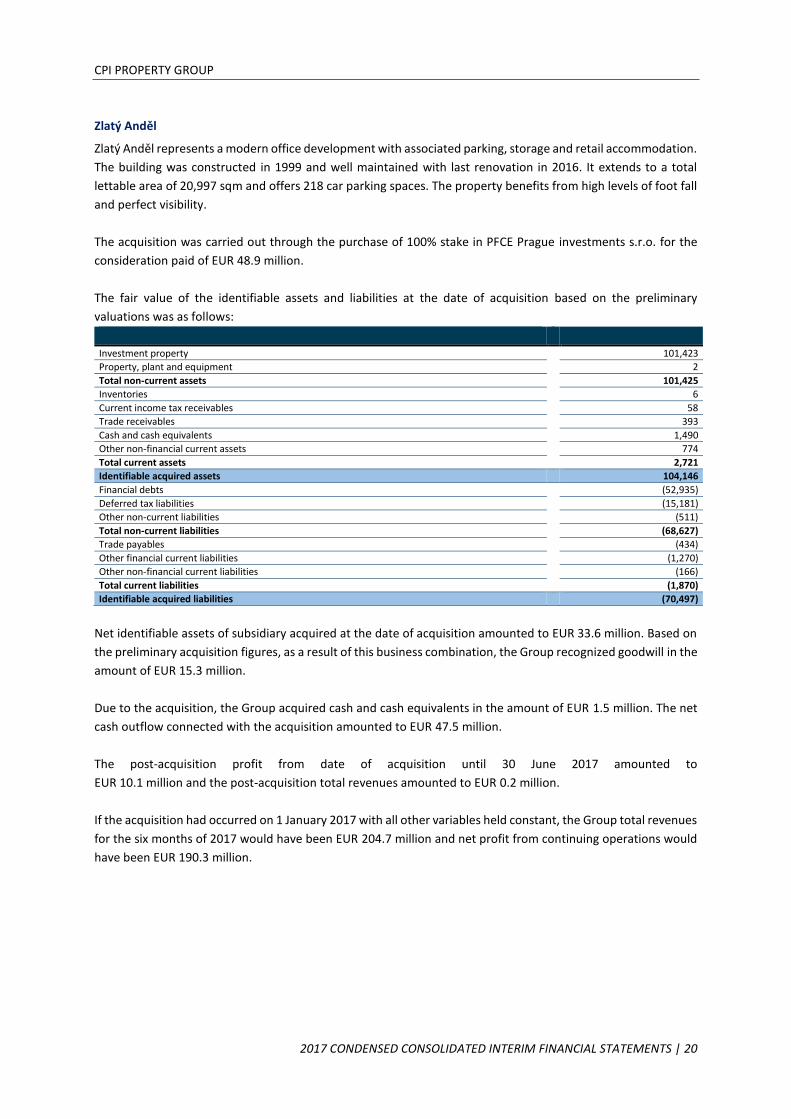
CPI PROPERTY GROUP
2017 CONDENSED CONSOLIDATED INTERIM FINANCIAL STATEMENTS | 20
Zlatý Anděl
Zlatý Anděl represents a modern office development with associated parking, storage and retail accommodation.
The building was constructed in 1999 and well maintained with last renovation in 2016. It extends to a total
lettable area of 20,997 sqm and offers 218 car parking spaces. The property benefits from high levels of foot fall
and perfect visibility.
The acquisition was carried out through the purchase of 100% stake in PFCE Prague investments s.r.o. for the
consideration paid of EUR 48.9 million.
The fair value of the identifiable assets and liabilities at the date of acquisition based on the preliminary
valuations was as follows:
Investment property 101,423
Property, plant and equipment 2
Total non-current assets 101,425
Inventories 6
Current income tax receivables 58
Trade receivables 393
Cash and cash equivalents 1,490
Other non-financial current assets 774
Total current assets 2,721
Identifiable acquired assets 104,146
Financial debts (52,935)
Deferred tax liabilities (15,181)
Other non-current liabilities (511)
Total non-current liabilities (68,627)
Trade payables (434)
Other financial current liabilities (1,270)
Other non-financial current liabilities (166)
Total current liabilities (1,870)
Identifiable acquired liabilities (70,497)
Net identifiable assets of subsidiary acquired at the date of acquisition amounted to EUR 33.6 million. Based on
the preliminary acquisition figures, as a result of this business combination, the Group recognized goodwill in the
amount of EUR 15.3 million.
Due to the acquisition, the Group acquired cash and cash equivalents in the amount of EUR 1.5 million. The net
cash outflow connected with the acquisition amounted to EUR 47.5 million.
The post-acquisition profit from date of acquisition until 30 June 2017 amounted to
EUR 10.1 million and the post-acquisition total revenues amounted to EUR 0.2 million.
If the acquisition had occurred on 1 January 2017 with all other variables held constant, the Group total revenues
for the six months of 2017 would have been EUR 204.7 million and net profit from continuing operations would
have been EUR 190.3 million.

CPI PROPERTY GROUP
2017 CONDENSED CONSOLIDATED INTERIM FINANCIAL STATEMENTS | 21
Andrássy Complex
Andrássy Complex represents a modern office development with associated parking and storage accommodation
extending to a total lettable area of 8,637 sqm with 161 parking spaces. The project includes two office buildings.
The parking facility is located on four underground floors of a separate residential building.
The acquisition was carried out through the purchase of 100% stake in Andrássy Real Kft. for the consideration
paid of EUR 4.1 million.
The fair value of the identifiable assets and liabilities at the date of acquisition based on the preliminary
valuations was as follows:
Investment property 16,308
Trade and other receivables 10
Total non-current assets 16,318
Trade receivables 258
Cash and cash equivalents 209
Other financial current assets 1
Other non-financial current assets 59
Total current assets 527
Identifiable acquired assets 16,845
Financial debts (12,365)
Other non-current liabilities (114)
Total non-current liabilities (12,479)
Trade payables (91)
Other financial current liabilities (168)
Other non-financial current liabilities (25)
Total current liabilities (284)
Identifiable acquired liabilities (12,763)
Net identifiable assets of subsidiary acquired at the date of acquisition amounted to EUR 4.1 million. Based on
the preliminary acquisition figures, as a result of this business combination, neither goodwill nor bargain
purchase was recognized.
Due to the acquisition, the Group acquired cash and cash equivalents in the amount of EUR 0.2 million. The net
cash outflow connected with the acquisition amounted to EUR 3.9 million.
The post-acquisition profit from date of acquisition until 30 June 2017 amounted to
EUR 2.8 million and the post-acquisition total revenues amounted to EUR 0.4 million.
If the acquisition had occurred on 1 January 2017 with all other variables held constant, the Group total revenues
for the six months of 2017 would have been EUR 203.6 million and net profit from continuing operations would
have been EUR 190.0 million.
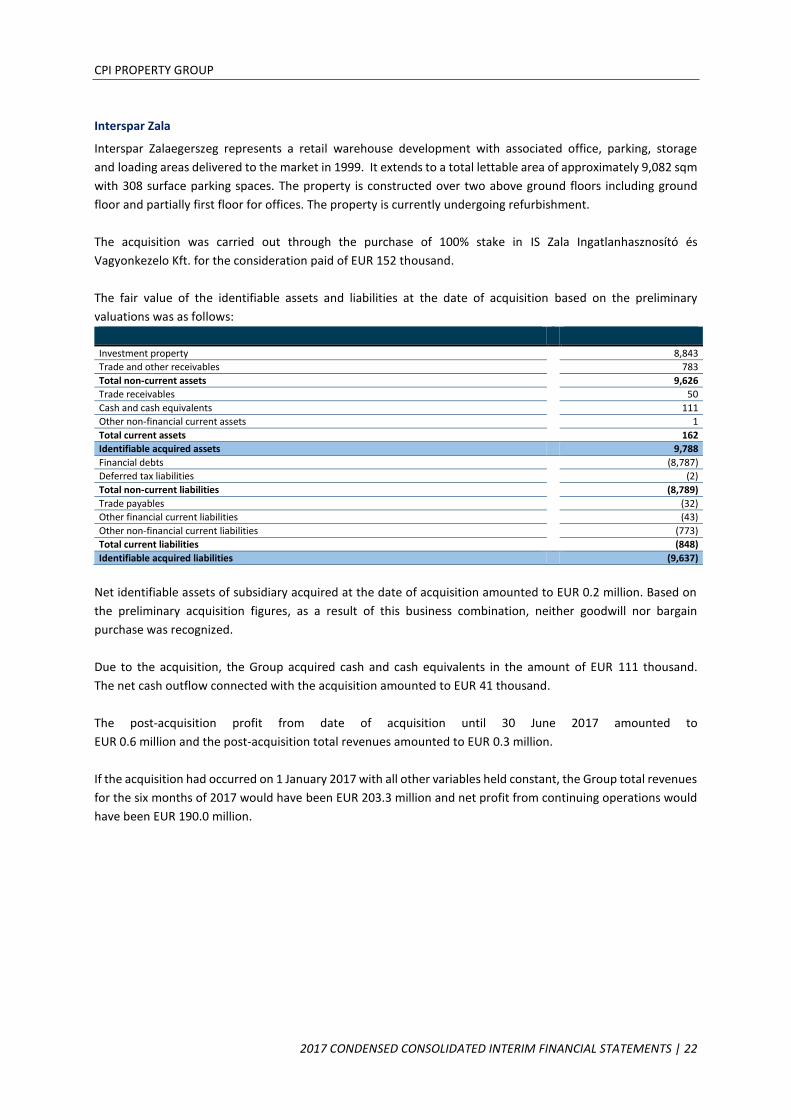
CPI PROPERTY GROUP
2017 CONDENSED CONSOLIDATED INTERIM FINANCIAL STATEMENTS | 22
Interspar Zala
Interspar Zalaegerszeg represents a retail warehouse development with associated office, parking, storage
and loading areas delivered to the market in 1999. It extends to a total lettable area of approximately 9,082 sqm
with 308 surface parking spaces. The property is constructed over two above ground floors including ground
floor and partially first floor for offices. The property is currently undergoing refurbishment.
The acquisition was carried out through the purchase of 100% stake in IS Zala Ingatlanhasznosító és
Vagyonkezelo Kft. for the consideration paid of EUR 152 thousand.
The fair value of the identifiable assets and liabilities at the date of acquisition based on the preliminary
valuations was as follows:
Investment property 8,843
Trade and other receivables 783
Total non-current assets 9,626
Trade receivables 50
Cash and cash equivalents 111
Other non-financial current assets 1
Total current assets 162
Identifiable acquired assets 9,788
Financial debts (8,787)
Deferred tax liabilities (2)
Total non-current liabilities (8,789)
Trade payables (32)
Other financial current liabilities (43)
Other non-financial current liabilities (773)
Total current liabilities (848)
Identifiable acquired liabilities (9,637)
Net identifiable assets of subsidiary acquired at the date of acquisition amounted to EUR 0.2 million. Based on
the preliminary acquisition figures, as a result of this business combination, neither goodwill nor bargain
purchase was recognized.
Due to the acquisition, the Group acquired cash and cash equivalents in the amount of EUR 111 thousand.
The net cash outflow connected with the acquisition amounted to EUR 41 thousand.
The post-acquisition profit from date of acquisition until 30 June 2017 amounted to
EUR 0.6 million and the post-acquisition total revenues amounted to EUR 0.3 million.
If the acquisition had occurred on 1 January 2017 with all other variables held constant, the Group total revenues
for the six months of 2017 would have been EUR 203.3 million and net profit from continuing operations would
have been EUR 190.0 million.
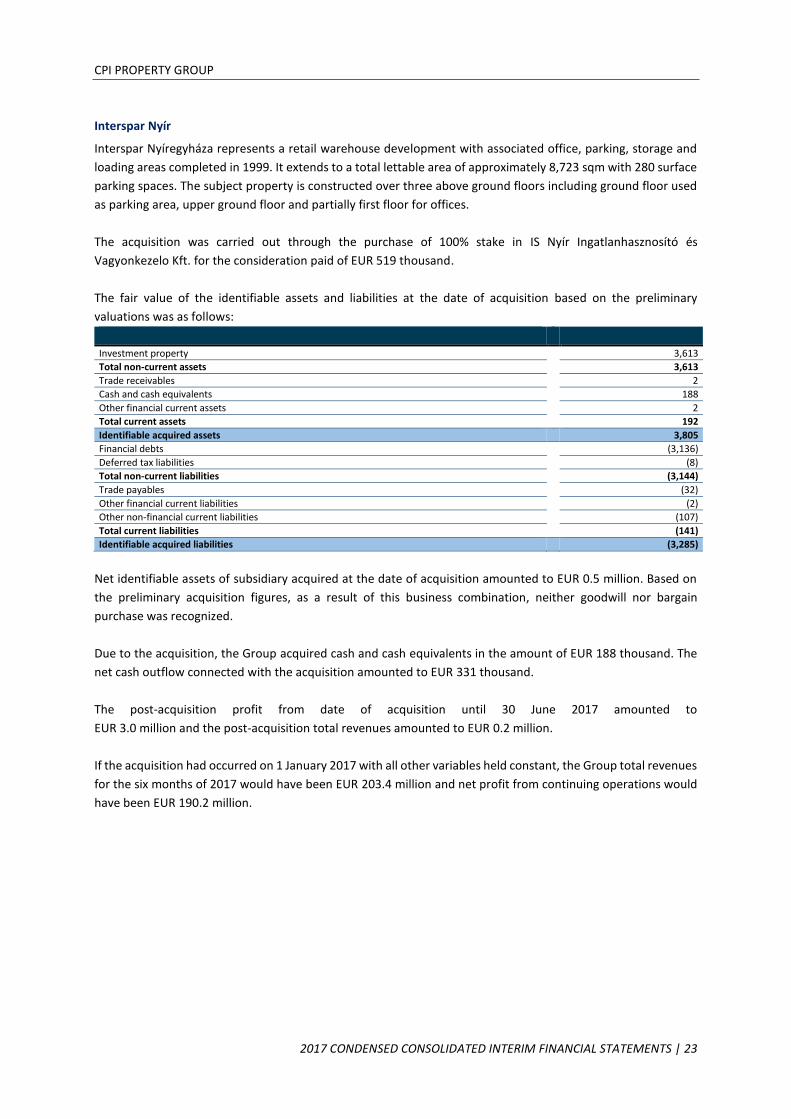
CPI PROPERTY GROUP
2017 CONDENSED CONSOLIDATED INTERIM FINANCIAL STATEMENTS | 23
Interspar Nyír
Interspar Nyíregyháza represents a retail warehouse development with associated office, parking, storage and
loading areas completed in 1999. It extends to a total lettable area of approximately 8,723 sqm with 280 surface
parking spaces. The subject property is constructed over three above ground floors including ground floor used
as parking area, upper ground floor and partially first floor for offices.
The acquisition was carried out through the purchase of 100% stake in IS Nyír Ingatlanhasznosító és
Vagyonkezelo Kft. for the consideration paid of EUR 519 thousand.
The fair value of the identifiable assets and liabilities at the date of acquisition based on the preliminary
valuations was as follows:
Investment property 3,613
Total non-current assets 3,613
Trade receivables 2
Cash and cash equivalents 188
Other financial current assets 2
Total current assets 192
Identifiable acquired assets 3,805
Financial debts (3,136)
Deferred tax liabilities (8)
Total non-current liabilities (3,144)
Trade payables (32)
Other financial current liabilities (2)
Other non-financial current liabilities (107)
Total current liabilities (141)
Identifiable acquired liabilities (3,285)
Net identifiable assets of subsidiary acquired at the date of acquisition amounted to EUR 0.5 million. Based on
the preliminary acquisition figures, as a result of this business combination, neither goodwill nor bargain
purchase was recognized.
Due to the acquisition, the Group acquired cash and cash equivalents in the amount of EUR 188 thousand. The
net cash outflow connected with the acquisition amounted to EUR 331 thousand.
The post-acquisition profit from date of acquisition until 30 June 2017 amounted to
EUR 3.0 million and the post-acquisition total revenues amounted to EUR 0.2 million.
If the acquisition had occurred on 1 January 2017 with all other variables held constant, the Group total revenues
for the six months of 2017 would have been EUR 203.4 million and net profit from continuing operations would
have been EUR 190.2 million.

CPI PROPERTY GROUP
2017 CONDENSED CONSOLIDATED INTERIM FINANCIAL STATEMENTS | 24
Hotel Vladimír, Ústí nad Labem
On 7 March 2017, the Group acquired 100% stake of REZIDENCE MASARYKOVA 36, s.r.o. company owning
and operating Hotel Vladimír in Ústí nad Labem. Following the acquisition, as at 30 June 2017 the operation
of this hotel was already secured by CPI Hotels a.s., operator of the majority of the Group´s hospitality portfolio.
This acquisition was recognized as a property asset acquisition as the company do not consists of business
as defined by IFRS.
Consideration paid for 100% stake amounted to CZK 62.5 million (approximately EUR 2.3 million).
The carrying value of the identifiable assets and liabilities at the date of acquisition was as follows:
Intangible assets and goodwill 2
Investment propert 2,733
Total non-current assets 2,735
Inventories 9
Trade receivables 39
Cash and cash equivalents 29
Total current assets 77
Identifiable acquired assets 2,812
Deferred tax liabilities (395)
Total non-current liabilities (395)
Trade payables (63)
Advance payments (1)
Other financial current liabilities (1)
Other non-financial current liabilities (42)
Total current liabilities (107)
Identifiable acquired liabilities (502)
Net identifiable assets of subsidiary acquired at the date of acquisition amounted to EUR 2.3 million.
Due to the acquisition, the Group acquired cash and cash equivalents in the amount of EUR 29 thousand.
The net cash outflow connected with the acquisition amounted to EUR 2.28 million.
Brno Property Development, a.s.
On 17 January 2017, the Group acquired 100% stake in Brno Property Development, a.s. The acquired entity
owns land bank of approximately 5,358 sqm. The consideration paid amounted to CZK 41.7 million
(app. EUR 1.5 million).
This acquisition was recognized as a property asset acquisition as the company do not consists of business
as defined by IFRS.
As at the date of acquisition, the identifiable assets of the acquired company represent investment property in
the amount of EUR 2.8 million, cash and cash equivalents acquired in the amount of EUR 2 thousand and other
non-financial current assets in the amount of EUR 2 thousand. The carrying value of the identifiable liabilities
at the date of acquisition represents financial debts in the amount EUR 1.3 million.
Net identifiable assets of the subsidiary acquired at the date of acquisition amounted to EUR 1.5 million. The net
cash outflow connected with the acquisition amounted to EUR 1.5 million.
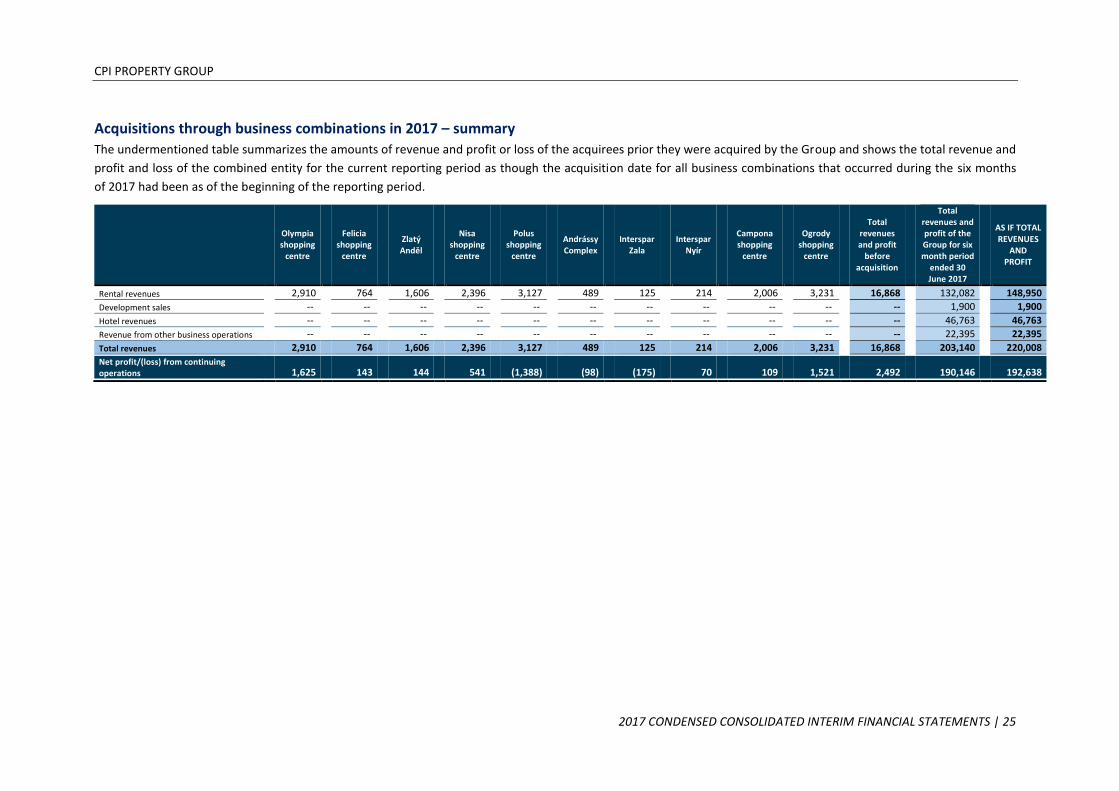
CPI PROPERTY GROUP
2017 CONDENSED CONSOLIDATED INTERIM FINANCIAL STATEMENTS | 25
Acquisitions through business combinations in 2017 – summary
The undermentioned table summarizes the amounts of revenue and profit or loss of the acquirees prior they were acquired by the Group and shows the total revenue and
profit and loss of the combined entity for the current reporting period as though the acquisition date for all business combinations that occurred during the six months
of 2017 had been as of the beginning of the reporting period.
Olympia shopping
centre
Felicia shopping
centre
Zlatý Anděl
Nisa
shopping centre
Polus
shopping centre
Andrássy Complex
Interspar
Zala
Interspar Nyír
Campona shopping
centre
Ogrody shopping
centre
Total revenues and profit
before acquisition
Total revenues and profit of the Group for six month period
ended 30 June 2017
AS IF TOTAL REVENUES
AND PROFIT
Rental revenues 2,910 764 1,606 2,396 3,127 489 125 214 2,006 3,231 16,868 132,082 148,950
Development sales -- -- -- -- -- -- -- -- -- -- -- 1,900 1,900
Hotel revenues -- -- -- -- -- -- -- -- -- -- -- 46,763 46,763
Revenue from other business operations -- -- -- -- -- -- -- -- -- -- -- 22,395 22,395
Total revenues 2,910 764 1,606 2,396 3,127 489 125 214 2,006 3,231 16,868 203,140 220,008
Net profit/(loss) from continuing operations 1,625 143 144 541 (1,388) (98) (175) 70 109 1,521 2,492 190,146 192,638
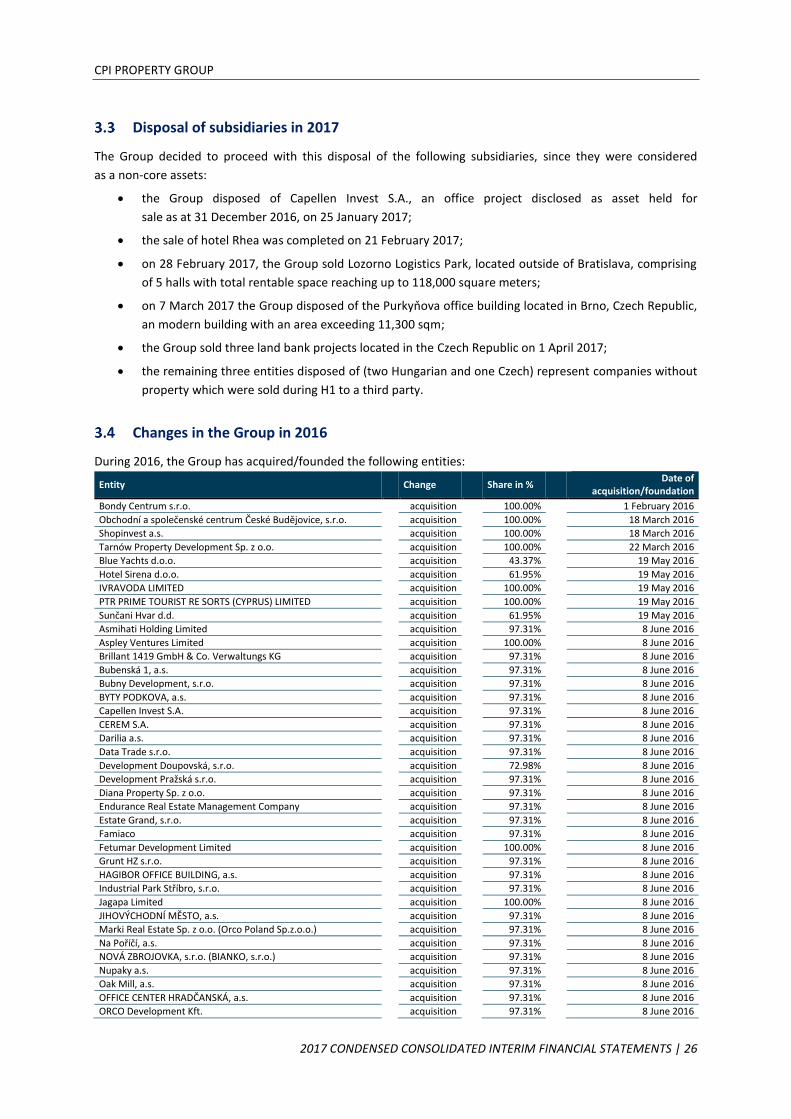
CPI PROPERTY GROUP
2017 CONDENSED CONSOLIDATED INTERIM FINANCIAL STATEMENTS | 26
Disposal of subsidiaries in 2017
The Group decided to proceed with this disposal of the following subsidiaries, since they were considered
as a non-core assets:
• the Group disposed of Capellen Invest S.A., an office project disclosed as asset held for
sale as at 31 December 2016, on 25 January 2017;
• the sale of hotel Rhea was completed on 21 February 2017;
• on 28 February 2017, the Group sold Lozorno Logistics Park, located outside of Bratislava, comprising
of 5 halls with total rentable space reaching up to 118,000 square meters;
• on 7 March 2017 the Group disposed of the Purkyňova office building located in Brno, Czech Republic,
an modern building with an area exceeding 11,300 sqm;
• the Group sold three land bank projects located in the Czech Republic on 1 April 2017;
• the remaining three entities disposed of (two Hungarian and one Czech) represent companies without
property which were sold during H1 to a third party.
Changes in the Group in 2016
During 2016, the Group has acquired/founded the following entities:
Entity Change Share in % Date of
acquisition/foundation
Bondy Centrum s.r.o. acquisition 100.00% 1 February 2016
Obchodní a společenské centrum České Budějovice, s.r.o. acquisition 100.00% 18 March 2016
Shopinvest a.s. acquisition 100.00% 18 March 2016
Tarnów Property Development Sp. z o.o. acquisition 100.00% 22 March 2016
Blue Yachts d.o.o. acquisition 43.37% 19 May 2016
Hotel Sirena d.o.o. acquisition 61.95% 19 May 2016
IVRAVODA LIMITED acquisition 100.00% 19 May 2016
PTR PRIME TOURIST RE SORTS (CYPRUS) LIMITED acquisition 100.00% 19 May 2016
Sunčani Hvar d.d. acquisition 61.95% 19 May 2016
Asmihati Holding Limited acquisition 97.31% 8 June 2016
Aspley Ventures Limited acquisition 100.00% 8 June 2016
Brillant 1419 GmbH & Co. Verwaltungs KG acquisition 97.31% 8 June 2016
Bubenská 1, a.s. acquisition 97.31% 8 June 2016
Bubny Development, s.r.o. acquisition 97.31% 8 June 2016
BYTY PODKOVA, a.s. acquisition 97.31% 8 June 2016
Capellen Invest S.A. acquisition 97.31% 8 June 2016
CEREM S.A. acquisition 97.31% 8 June 2016
Darilia a.s. acquisition 97.31% 8 June 2016
Data Trade s.r.o. acquisition 97.31% 8 June 2016
Development Doupovská, s.r.o. acquisition 72.98% 8 June 2016
Development Pražská s.r.o. acquisition 97.31% 8 June 2016
Diana Property Sp. z o.o. acquisition 97.31% 8 June 2016
Endurance Real Estate Management Company acquisition 97.31% 8 June 2016
Estate Grand, s.r.o. acquisition 97.31% 8 June 2016
Famiaco acquisition 97.31% 8 June 2016
Fetumar Development Limited acquisition 100.00% 8 June 2016
Grunt HZ s.r.o. acquisition 97.31% 8 June 2016
HAGIBOR OFFICE BUILDING, a.s. acquisition 97.31% 8 June 2016
Industrial Park Stříbro, s.r.o. acquisition 97.31% 8 June 2016
Jagapa Limited acquisition 100.00% 8 June 2016
JIHOVÝCHODNÍ MĚSTO, a.s. acquisition 97.31% 8 June 2016
Marki Real Estate Sp. z o.o. (Orco Poland Sp.z.o.o.) acquisition 97.31% 8 June 2016
Na Poříčí, a.s. acquisition 97.31% 8 June 2016
NOVÁ ZBROJOVKA, s.r.o. (BIANKO, s.r.o.) acquisition 97.31% 8 June 2016
Nupaky a.s. acquisition 97.31% 8 June 2016
Oak Mill, a.s. acquisition 97.31% 8 June 2016
OFFICE CENTER HRADČANSKÁ, a.s. acquisition 97.31% 8 June 2016
ORCO Development Kft. acquisition 97.31% 8 June 2016
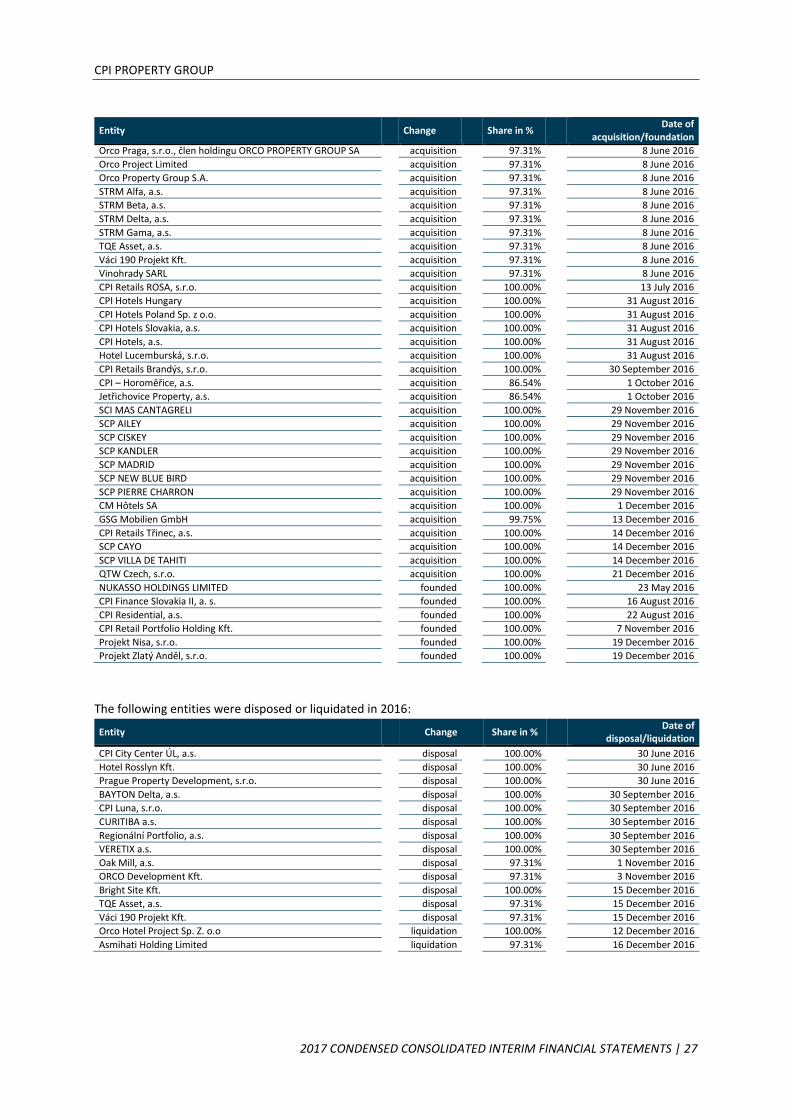
CPI PROPERTY GROUP
2017 CONDENSED CONSOLIDATED INTERIM FINANCIAL STATEMENTS | 27
Entity Change Share in % Date of
acquisition/foundation
Orco Praga, s.r.o., člen holdingu ORCO PROPERTY GROUP SA acquisition 97.31% 8 June 2016
Orco Project Limited acquisition 97.31% 8 June 2016
Orco Property Group S.A. acquisition 97.31% 8 June 2016
STRM Alfa, a.s. acquisition 97.31% 8 June 2016
STRM Beta, a.s. acquisition 97.31% 8 June 2016
STRM Delta, a.s. acquisition 97.31% 8 June 2016
STRM Gama, a.s. acquisition 97.31% 8 June 2016
TQE Asset, a.s. acquisition 97.31% 8 June 2016
Váci 190 Projekt Kft. acquisition 97.31% 8 June 2016
Vinohrady SARL acquisition 97.31% 8 June 2016
CPI Retails ROSA, s.r.o. acquisition 100.00% 13 July 2016
CPI Hotels Hungary acquisition 100.00% 31 August 2016
CPI Hotels Poland Sp. z o.o. acquisition 100.00% 31 August 2016
CPI Hotels Slovakia, a.s. acquisition 100.00% 31 August 2016
CPI Hotels, a.s. acquisition 100.00% 31 August 2016
Hotel Lucemburská, s.r.o. acquisition 100.00% 31 August 2016
CPI Retails Brandýs, s.r.o. acquisition 100.00% 30 September 2016
CPI – Horoměřice, a.s. acquisition 86.54% 1 October 2016
Jetřichovice Property, a.s. acquisition 86.54% 1 October 2016
SCI MAS CANTAGRELI acquisition 100.00% 29 November 2016
SCP AILEY acquisition 100.00% 29 November 2016
SCP CISKEY acquisition 100.00% 29 November 2016
SCP KANDLER acquisition 100.00% 29 November 2016
SCP MADRID acquisition 100.00% 29 November 2016
SCP NEW BLUE BIRD acquisition 100.00% 29 November 2016
SCP PIERRE CHARRON acquisition 100.00% 29 November 2016
CM Hôtels SA acquisition 100.00% 1 December 2016
GSG Mobilien GmbH acquisition 99.75% 13 December 2016
CPI Retails Třinec, a.s. acquisition 100.00% 14 December 2016
SCP CAYO acquisition 100.00% 14 December 2016
SCP VILLA DE TAHITI acquisition 100.00% 14 December 2016
QTW Czech, s.r.o. acquisition 100.00% 21 December 2016
NUKASSO HOLDINGS LIMITED founded 100.00% 23 May 2016
CPI Finance Slovakia II, a. s. founded 100.00% 16 August 2016
CPI Residential, a.s. founded 100.00% 22 August 2016
CPI Retail Portfolio Holding Kft. founded 100.00% 7 November 2016
Projekt Nisa, s.r.o. founded 100.00% 19 December 2016
Projekt Zlatý Anděl, s.r.o. founded 100.00% 19 December 2016
The following entities were disposed or liquidated in 2016:
Entity Change Share in % Date of
disposal/liquidation
CPI City Center ÚL, a.s. disposal 100.00% 30 June 2016
Hotel Rosslyn Kft. disposal 100.00% 30 June 2016
Prague Property Development, s.r.o. disposal 100.00% 30 June 2016
BAYTON Delta, a.s. disposal 100.00% 30 September 2016
CPI Luna, s.r.o. disposal 100.00% 30 September 2016
CURITIBA a.s. disposal 100.00% 30 September 2016
Regionální Portfolio, a.s. disposal 100.00% 30 September 2016
VERETIX a.s. disposal 100.00% 30 September 2016
Oak Mill, a.s. disposal 97.31% 1 November 2016
ORCO Development Kft. disposal 97.31% 3 November 2016
Bright Site Kft. disposal 100.00% 15 December 2016
TQE Asset, a.s. disposal 97.31% 15 December 2016
Váci 190 Projekt Kft. disposal 97.31% 15 December 2016
Orco Hotel Project Sp. Z. o.o liquidation 100.00% 12 December 2016
Asmihati Holding Limited liquidation 97.31% 16 December 2016

CPI PROPERTY GROUP
2017 CONDENSED CONSOLIDATED INTERIM FINANCIAL STATEMENTS | 28
4 Segment reporting
For all asset types, discrete financial information is provided to the Board of Directors, which is the chief
operating decision maker, on an individual entity (subsidiary) basis. The information provided are revenues
(consisting of sale of goods, rental activities, services and net service charge income), net gain/loss from fair value
adjustment on investment property, cost of goods sold, impairments, amortization and other operating result
which altogether form the operating result.
The individual entities are aggregated into reportable segments with similar economic characteristics for the
purposes of consolidated reporting.
The structure of operating segments remains unchanged in 2017 compared to the financial statements
as at 31 December 2016.
Income generating rental properties Within the segment “Income generating rental properties” the Group is considered to have six types of assets
as at 30 June 2017, as follows:
• Retail – acquires, develops and leases shopping malls
• Office – acquires, develops and leases offices
• Logistics – acquires, develops and leases warehouses and factories
• Residential – rents residential property
• Hotels – acquires, develops and leases hotels to operators
• Other – primarily includes intergroup service and financing entities
Income generating operational properties
The segment includes properties which primarily generate income from other than rental activities.
As at 30 June 2017 the segment includes three types of assets:
• Hospitality – operates hotel premises as hotel operator
• Agriculture – operates farmland and produces the high-quality organic food
• Mountain resorts – operates ski resort, rents restaurants and owns land bank designated for future
development
Development
Covers all real estate assets under construction or designated for future development in order to be sold to
a third party or to be transferred to the Income generating rental properties operating segment.
Land bank
Acquires and retains lands for further Group’s utilization. The segment also includes building which are intended
for future redevelopment and do not generate any rental income.
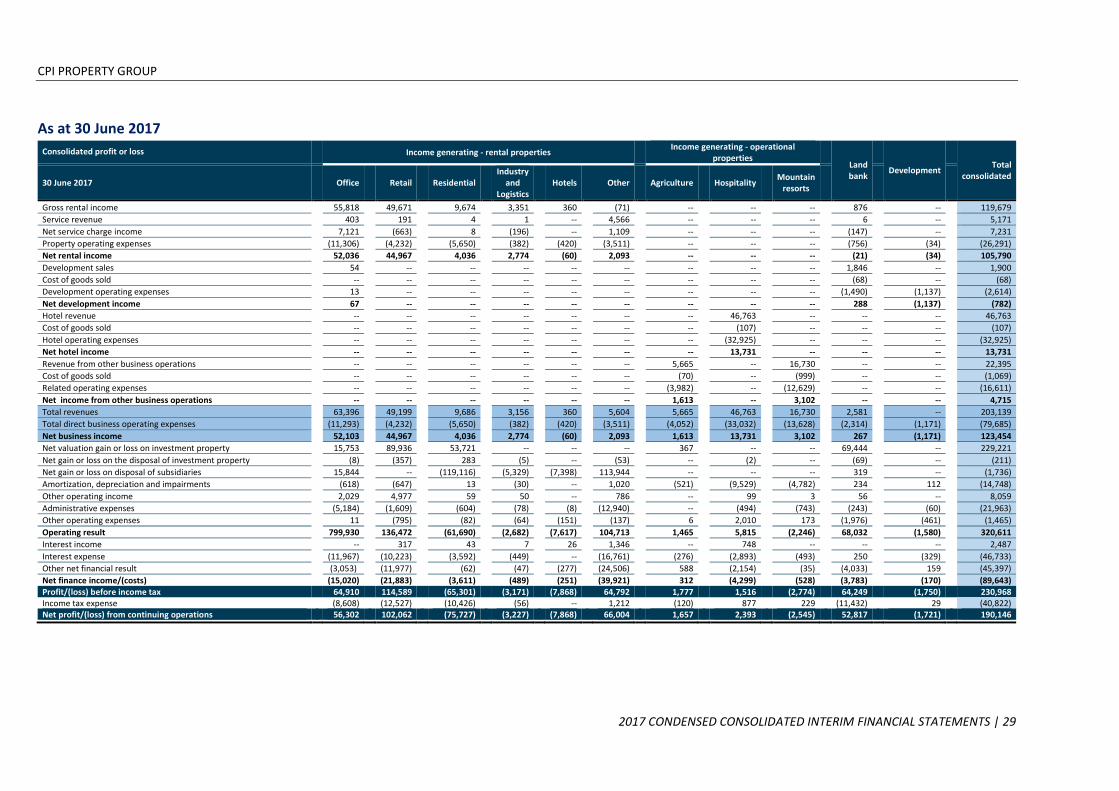
CPI PROPERTY GROUP
2017 CONDENSED CONSOLIDATED INTERIM FINANCIAL STATEMENTS | 29
As at 30 June 2017
Consolidated profit or loss
Income generating - rental properties Income generating - operational
properties
Land bank
Development
Total consolidated
30 June 2017
Office
Retail
Residential
Industry and
Logistics Hotels
Other
Agriculture
Hospitality
Mountain resorts
Gross rental income 55,818
49,671
9,674
3,351
360
(71)
--
--
--
876
--
119,679
Service revenue 403
191
4
1
--
4,566
--
--
--
6
--
5,171
Net service charge income 7,121
(663)
8
(196)
--
1,109
--
--
--
(147)
--
7,231
Property operating expenses (11,306)
(4,232)
(5,650)
(382)
(420)
(3,511)
--
--
--
(756)
(34)
(26,291)
Net rental income 52,036
44,967
4,036
2,774
(60)
2,093
--
--
--
(21)
(34)
105,790
Development sales 54
--
--
--
--
--
--
--
--
1,846
--
1,900
Cost of goods sold --
--
--
--
--
--
--
--
--
(68)
--
(68)
Development operating expenses 13
--
--
--
--
--
--
--
--
(1,490)
(1,137)
(2,614)
Net development income 67
--
--
--
--
--
--
--
--
288
(1,137)
(782)
Hotel revenue --
--
--
--
--
--
--
46,763
--
--
--
46,763
Cost of goods sold --
--
--
--
--
--
--
(107)
--
--
--
(107)
Hotel operating expenses --
--
--
--
--
--
--
(32,925)
--
--
--
(32,925)
Net hotel income --
--
--
--
--
--
--
13,731
--
--
--
13,731
Revenue from other business operations --
--
--
--
--
--
5,665
--
16,730
--
--
22,395
Cost of goods sold --
--
--
--
--
--
(70)
--
(999)
--
--
(1,069)
Related operating expenses --
--
--
--
--
--
(3,982)
--
(12,629)
--
--
(16,611)
Net income from other business operations --
--
--
--
--
--
1,613
--
3,102
--
--
4,715
Total revenues 63,396
49,199
9,686
3,156
360
5,604
5,665
46,763
16,730
2,581
--
203,139
Total direct business operating expenses (11,293)
(4,232)
(5,650)
(382)
(420)
(3,511)
(4,052)
(33,032)
(13,628)
(2,314)
(1,171)
(79,685)
Net business income 52,103
44,967
4,036
2,774
(60)
2,093
1,613
13,731
3,102
267
(1,171)
123,454
Net valuation gain or loss on investment property 15,753
89,936
53,721
--
--
--
367
--
--
69,444
--
229,221
Net gain or loss on the disposal of investment property (8)
(357)
283
(5)
--
(53)
--
(2)
--
(69)
--
(211)
Net gain or loss on disposal of subsidiaries 15,844
--
(119,116)
(5,329)
(7,398)
113,944
--
--
--
319
--
(1,736)
Amortization, depreciation and impairments (618)
(647)
13
(30)
--
1,020
(521)
(9,529)
(4,782)
234
112
(14,748)
Other operating income 2,029
4,977
59
50
--
786
--
99
3
56
--
8,059
Administrative expenses (5,184)
(1,609)
(604)
(78)
(8)
(12,940)
--
(494)
(743)
(243)
(60)
(21,963)
Other operating expenses 11
(795)
(82)
(64)
(151)
(137)
6
2,010
173
(1,976)
(461)
(1,465)
Operating result 799,930
136,472
(61,690)
(2,682)
(7,617)
104,713
1,465
5,815
(2,246)
68,032
(1,580)
320,611
Interest income --
317
43
7
26
1,346
--
748
--
--
--
2,487
Interest expense (11,967)
(10,223)
(3,592)
(449)
--
(16,761)
(276)
(2,893)
(493)
250
(329)
(46,733)
Other net financial result (3,053)
(11,977)
(62)
(47)
(277)
(24,506)
588
(2,154)
(35)
(4,033)
159
(45,397)
Net finance income/(costs) (15,020)
(21,883)
(3,611)
(489)
(251)
(39,921)
312
(4,299)
(528)
(3,783)
(170)
(89,643) Profit/(loss) before income tax 64,910 114,589 (65,301) (3,171) (7,868) 64,792 1,777 1,516 (2,774) 64,249 (1,750) 230,968 Income tax expense (8,608) (12,527) (10,426) (56) -- 1,212 (120) 877 229 (11,432) 29 (40,822) Net profit/(loss) from continuing operations 56,302 102,062 (75,727) (3,227) (7,868) 66,004 1,657 2,393 (2,545) 52,817 (1,721) 190,146
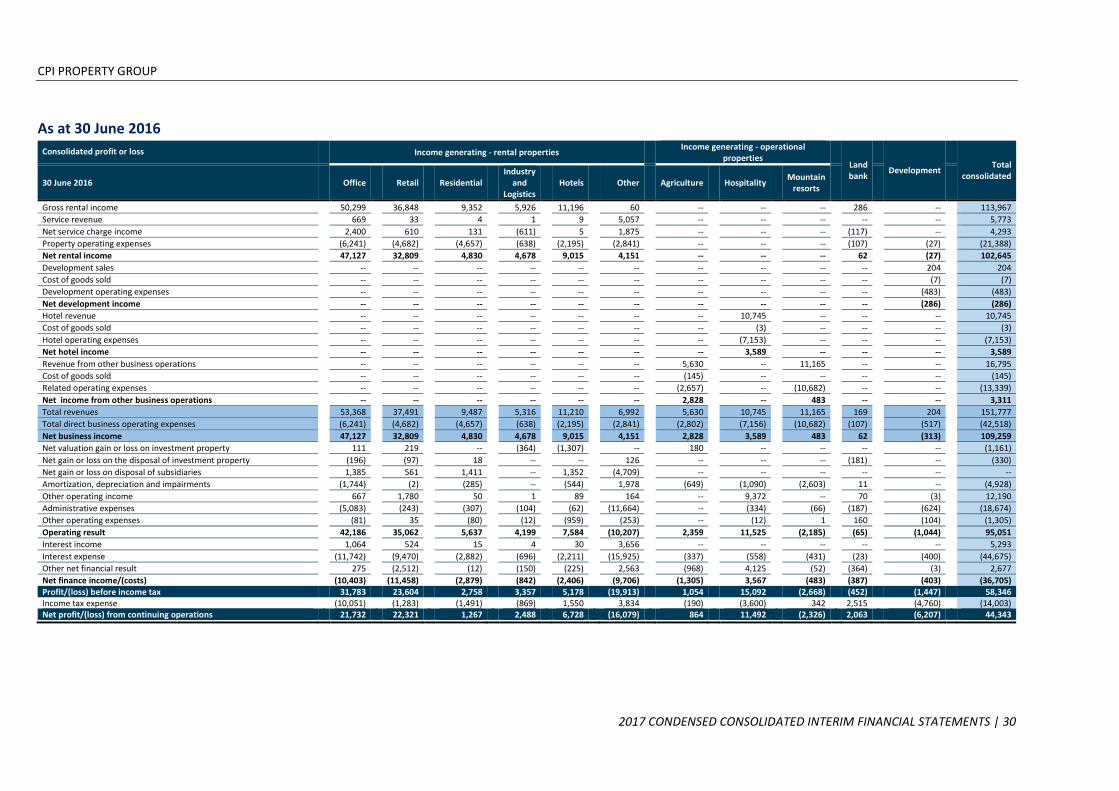
CPI PROPERTY GROUP
2017 CONDENSED CONSOLIDATED INTERIM FINANCIAL STATEMENTS | 30
As at 30 June 2016
Consolidated profit or loss
Income generating - rental properties Income generating - operational
properties
Land bank
Development
Total consolidated
30 June 2016
Office
Retail
Residential
Industry and
Logistics Hotels
Other
Agriculture
Hospitality
Mountain resorts
Gross rental income 50,299
36,848
9,352
5,926
11,196
60
--
--
--
286
--
113,967
Service revenue 669
33
4
1
9
5,057
--
--
--
--
--
5,773
Net service charge income 2,400
610
131
(611)
5
1,875
--
--
--
(117)
--
4,293
Property operating expenses (6,241)
(4,682)
(4,657)
(638)
(2,195)
(2,841)
--
--
--
(107)
(27)
(21,388)
Net rental income 47,127
32,809
4,830
4,678
9,015
4,151
--
--
--
62
(27)
102,645
Development sales --
--
--
--
--
--
--
--
--
--
204
204
Cost of goods sold --
--
--
--
--
--
--
--
--
--
(7)
(7)
Development operating expenses --
--
--
--
--
--
--
--
--
--
(483)
(483)
Net development income --
--
--
--
--
--
--
--
--
--
(286)
(286)
Hotel revenue --
--
--
--
--
--
--
10,745
--
--
--
10,745
Cost of goods sold --
--
--
--
--
--
--
(3)
--
--
--
(3)
Hotel operating expenses --
--
--
--
--
--
--
(7,153)
--
--
--
(7,153)
Net hotel income --
--
--
--
--
--
--
3,589
--
--
--
3,589
Revenue from other business operations --
--
--
--
--
--
5,630
--
11,165
--
--
16,795
Cost of goods sold --
--
--
--
--
--
(145)
--
--
--
--
(145)
Related operating expenses --
--
--
--
--
--
(2,657)
--
(10,682)
--
--
(13,339)
Net income from other business operations --
--
--
--
--
--
2,828
--
483
--
--
3,311
Total revenues 53,368
37,491
9,487
5,316
11,210
6,992
5,630
10,745
11,165
169
204
151,777
Total direct business operating expenses (6,241)
(4,682)
(4,657)
(638)
(2,195)
(2,841)
(2,802)
(7,156)
(10,682)
(107)
(517)
(42,518)
Net business income 47,127
32,809
4,830
4,678
9,015
4,151
2,828
3,589
483
62
(313)
109,259
Net valuation gain or loss on investment property 111
219
--
(364)
(1,307)
--
180
--
--
--
--
(1,161)
Net gain or loss on the disposal of investment property (196)
(97)
18
--
--
126
--
--
--
(181)
--
(330)
Net gain or loss on disposal of subsidiaries 1,385
561
1,411
--
1,352
(4,709)
--
--
--
--
--
--
Amortization, depreciation and impairments (1,744)
(2)
(285)
--
(544)
1,978
(649)
(1,090)
(2,603)
11
--
(4,928)
Other operating income 667
1,780
50
1
89
164
--
9,372
--
70
(3)
12,190
Administrative expenses (5,083)
(243)
(307)
(104)
(62)
(11,664)
--
(334)
(66)
(187)
(624)
(18,674)
Other operating expenses (81)
35
(80)
(12)
(959)
(253)
--
(12)
1
160
(104)
(1,305)
Operating result 42,186
35,062
5,637
4,199
7,584
(10,207)
2,359
11,525
(2,185)
(65)
(1,044)
95,051
Interest income 1,064
524
15
4
30
3,656
--
--
--
--
--
5,293
Interest expense (11,742)
(9,470)
(2,882)
(696)
(2,211)
(15,925)
(337)
(558)
(431)
(23)
(400)
(44,675)
Other net financial result 275
(2,512)
(12)
(150)
(225)
2,563
(968)
4,125
(52)
(364)
(3)
2,677
Net finance income/(costs) (10,403)
(11,458)
(2,879)
(842)
(2,406)
(9,706)
(1,305)
3,567
(483)
(387)
(403)
(36,705) Profit/(loss) before income tax 31,783 23,604 2,758 3,357 5,178 (19,913) 1,054 15,092 (2,668) (452) (1,447) 58,346 Income tax expense (10,051) (1,283) (1,491) (869) 1,550 3,834 (190) (3,600) 342 2,515 (4,760) (14,003) Net profit/(loss) from continuing operations 21,732 22,321 1,267 2,488 6,728 (16,079) 864 11,492 (2,326) 2,063 (6,207) 44,343
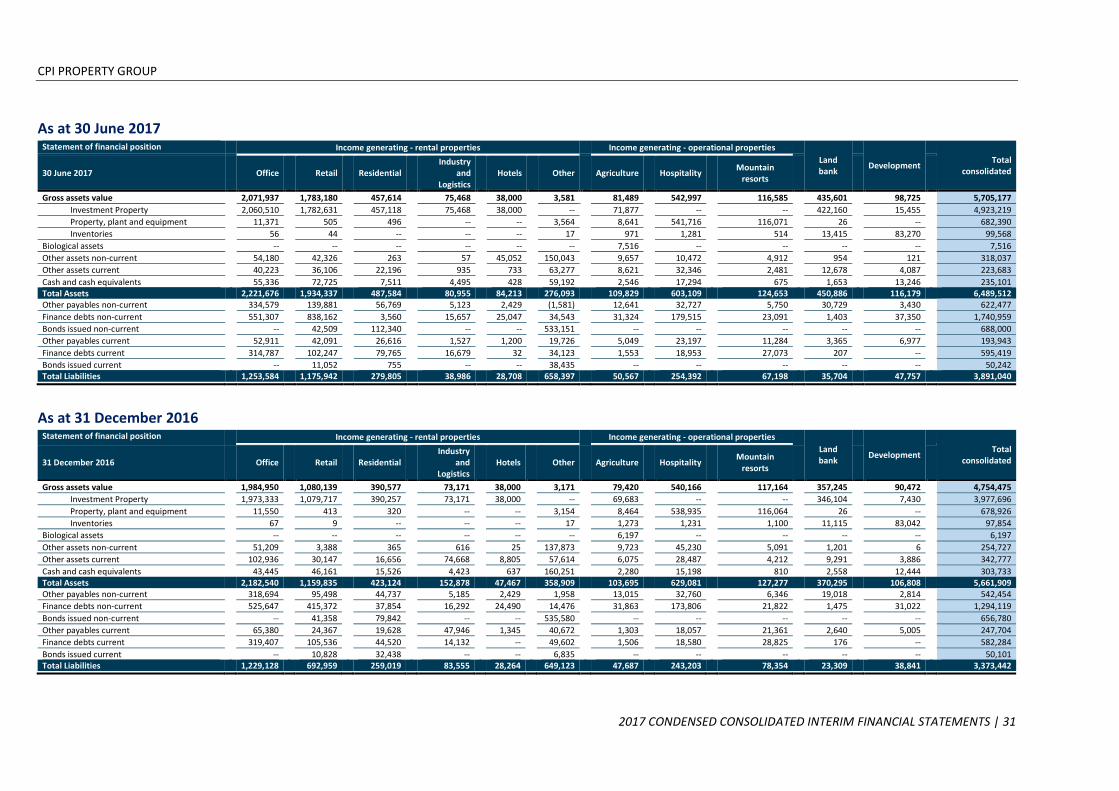
CPI PROPERTY GROUP
2017 CONDENSED CONSOLIDATED INTERIM FINANCIAL STATEMENTS | 31
As at 30 June 2017 Statement of financial position Income generating - rental properties Income generating - operational properties
Land bank
Development
Total consolidated 30 June 2017 Office
Retail
Residential
Industry and
Logistics Hotels
Other
Agriculture
Hospitality
Mountain resorts
Gross assets value 2,071,937
1,783,180
457,614
75,468
38,000
3,581
81,489 542,997 116,585 435,601 98,725 5,705,177
Investment Property 2,060,510
1,782,631
457,118
75,468
38,000
--
71,877 -- -- 422,160 15,455 4,923,219
Property, plant and equipment 11,371
505
496
--
--
3,564
8,641 541,716 116,071 26 -- 682,390
Inventories 56
44
--
--
--
17
971 1,281 514 13,415 83,270 99,568
Biological assets --
--
--
--
--
--
7,516 -- -- -- -- 7,516
Other assets non-current 54,180
42,326
263
57
45,052
150,043
9,657 10,472 4,912 954 121 318,037
Other assets current 40,223
36,106
22,196
935
733
63,277
8,621 32,346 2,481 12,678 4,087 223,683
Cash and cash equivalents 55,336
72,725
7,511
4,495
428
59,192
2,546 17,294 675 1,653 13,246 235,101 Total Assets 2,221,676
1,934,337
487,584
80,955
84,213
276,093
109,829 603,109 124,653 450,886 116,179 6,489,512
Other payables non-current 334,579
139,881
56,769
5,123
2,429
(1,581)
12,641 32,727 5,750 30,729 3,430 622,477
Finance debts non-current 551,307
838,162
3,560
15,657
25,047
34,543
31,324 179,515 23,091 1,403 37,350 1,740,959
Bonds issued non-current --
42,509
112,340
--
--
533,151
-- -- -- -- -- 688,000
Other payables current 52,911
42,091
26,616
1,527
1,200
19,726
5,049 23,197 11,284 3,365 6,977 193,943
Finance debts current 314,787
102,247
79,765
16,679
32
34,123
1,553 18,953 27,073 207 -- 595,419
Bonds issued current --
11,052
755
--
--
38,435
-- -- -- -- -- 50,242 Total Liabilities 1,253,584
1,175,942
279,805
38,986
28,708
658,397
50,567 254,392 67,198 35,704 47,757 3,891,040
As at 31 December 2016 Statement of financial position Income generating - rental properties Income generating - operational properties
Land bank
Development
Total consolidated 31 December 2016 Office
Retail
Residential
Industry and
Logistics Hotels
Other
Agriculture
Hospitality
Mountain resorts
Gross assets value 1,984,950 1,080,139 390,577 73,171 38,000 3,171 79,420 540,166 117,164 357,245 90,472 4,754,475
Investment Property 1,973,333 1,079,717 390,257 73,171 38,000 -- 69,683 -- -- 346,104 7,430 3,977,696
Property, plant and equipment 11,550 413 320 -- -- 3,154 8,464 538,935 116,064 26 -- 678,926
Inventories 67 9 -- -- -- 17 1,273 1,231 1,100 11,115 83,042 97,854
Biological assets -- -- -- -- -- -- 6,197 -- -- -- -- 6,197
Other assets non-current 51,209 3,388 365 616 25 137,873 9,723 45,230 5,091 1,201 6 254,727
Other assets current 102,936 30,147 16,656 74,668 8,805 57,614 6,075 28,487 4,212 9,291 3,886 342,777
Cash and cash equivalents 43,445 46,161 15,526 4,423 637 160,251 2,280 15,198 810 2,558 12,444 303,733 Total Assets 2,182,540 1,159,835 423,124 152,878 47,467 358,909 103,695 629,081 127,277 370,295 106,808 5,661,909 Other payables non-current 318,694 95,498 44,737 5,185 2,429 1,958 13,015 32,760 6,346 19,018 2,814 542,454
Finance debts non-current 525,647 415,372 37,854 16,292 24,490 14,476 31,863 173,806 21,822 1,475 31,022 1,294,119
Bonds issued non-current -- 41,358 79,842 -- -- 535,580 -- -- -- -- -- 656,780
Other payables current 65,380 24,367 19,628 47,946 1,345 40,672 1,303 18,057 21,361 2,640 5,005 247,704
Finance debts current 319,407 105,536 44,520 14,132 -- 49,602 1,506 18,580 28,825 176 -- 582,284
Bonds issued current -- 10,828 32,438 -- -- 6,835 -- -- -- -- -- 50,101 Total Liabilities 1,229,128 692,959 259,019 83,555 28,264 649,123 47,687 243,203 78,354 23,309 38,841 3,373,442

CPI PROPERTY GROUP
2017 CONDENSED CONSOLIDATED INTERIM FINANCIAL STATEMENTS | 32
As at 30 June 2017
Consolidated profit or loss 30 June 2017
Czech Republic
Slovak
Republic Germany Hungary Poland Romania France Luxembourg Italy Russia Switzerland Croatia Monaco
Other*
Total consolidated
Gross rental income 71,353 3,915 26,081 12,532 4,611 759 42 26 360 -- -- -- -- -- 119,679
Service revenue 4,557 68 365 74 91 12 4 -- -- -- -- -- -- -- 5,171
Net service charge income 623 (211) 6,862 516 (570) 12 -- -- -- -- -- -- -- -- 7,231
Property operating expenses (15,204) (401) (6,179) (3,571) (85) (6) (97) -- (443) -- -- -- (305) -- (26,291)
Net rental income 61,329 3,371 27,129 9,551 4,047 777 (51) 26 (83) -- -- -- (305) -- 105,790
Development sales 1,873 -- -- 27 -- -- -- -- -- -- -- -- -- -- 1,900
Cost of goods sold (59) -- -- (7) (2) -- -- -- -- -- -- -- -- -- (68)
Development operating expenses (1,489) -- -- -- (1) -- -- -- (1,124) -- -- -- -- -- (2,614)
Net development income 325 -- -- 20 (3) -- -- -- (1,124) -- -- -- -- -- (782)
Hotel revenue 29,777 291 -- 4,940 2,423 -- -- -- -- 2,175 -- 7,157 -- -- 46,763
Cost of goods sold (103) -- -- -- -- -- -- -- -- -- -- (4) -- -- (107)
Hotel operating expenses (20,744) (268) -- (3,068) (1,571) -- -- -- -- (1,454) -- (5,820) -- -- (32,925)
Net hotel income 8,930 23 -- 1,872 852 -- -- -- -- 721 -- 1,333 -- -- 13,731
Revenue from other business operations 5,676 -- -- -- -- -- -- -- -- -- 16,719 -- -- -- 22,395
Cost of goods sold (69) -- -- -- -- -- -- -- -- -- (1,000) -- -- -- (1,069)
Related operating expenses (3,966) -- -- -- -- -- -- -- -- -- (12,644) -- -- -- (16,611)
Net income from other business operations 1,641 -- -- -- -- -- -- -- -- -- 3,075 -- -- -- 4,715
Total revenues 113,859 4,063 33,308 18,089 6,555 783 46 26 360 2,175 16,719 7,157 -- -- 203,139
Total direct business operating expenses (41,634) (669) (6,179) (6,646) (1,659) (6) (97) -- (1,567) (1,454) (13,644) (5,824) (305) -- (79,685)
Net business income 72,225 3,394 27,129 11,443 4,896 777 (51) 26 (1,207) 721 3,075 1,333 (305) -- 123,454
Net valuation gain or loss 193,624 -- -- 24,395 5,575 5,627 -- -- -- -- -- -- -- -- 229,221
Net gain or loss on the disposal of investment property (200) -- -- (11) -- -- -- -- -- -- -- -- -- -- (211)
Net gain or loss on disposal of subsidiaries 4,532 (5,329) -- 13,355 -- -- -- 1,054 -- -- -- -- -- (15,348) (1,736)
Amortization, depreciation and impairments (6,105) -- (555) (487) (1,332) (10) -- 1,119 -- 390 (4,782) (2,986) -- -- (14,748)
Other operating income 2,892 2 1,102 2,331 464 1,199 -- 57 -- -- 3 -- -- 9 8,059
Administrative expenses (8,122) (180) (4,486) (2,561) (539) (46) (28) (1,615) (50) (53) (743) (117) (243) (3,180) (21,963)
Other operating expenses (1,485) (12) 677 (538) 2,055 (20) (469) (64) (151) 9 173 112 (8) (1,745) (1,465)
Operating result 257,361 (2,125) 23,867 47,927 11,119 7,527 (548) 577 (1,408) 1,067 (2,274) (1,658) (556) (20,264) 320,611
Interest income 1,393 -- -- -- -- -- 43 661 26 -- -- -- -- 364 2,487
Interest expense (29,918) (5,367) (5,153) (372) (1,353) 37 (401) (2,283) -- -- (493) (756) (670) (4) (46,733)
Other net financial result (20,663) (56) 162 (2,234) 2,045 (456) 6 (22,445) (277) (1,474) (35) 288 (51) (207) (45,397)
Net finance income/(costs) (49,188) (5,423) (4,991) (2,606) 692 (419) (352) (24,067) (251) (1,474) (528) (468) (721) 153 (89,643) Profit/(loss) before income tax 208,173 (7,548) 18,876 45,321 11,811 7,108 (900) (23,490) (1,659) (407) (2,802) (2,126) (1,277) 517 230,968 Income tax expense (34,556) (417) (4,945) (2,093) 542 (1,712) -- 1,694 -- 237 229 269 -- (70) (40,822) Net profit/(loss) from continuing operations 173,617 (7,965) 13,931 43,228 12,353 5,396 (900) (21,796) (1,659) (170) (2,573) (1,857) (1,277) 447 190,146
*Other countries includes operations in Netherland, Ireland, Cyprus, British Virgin Islands and Guernsey.

CPI PROPERTY GROUP
2017 CONDENSED CONSOLIDATED INTERIM FINANCIAL STATEMENTS | 33
As at 30 June 2016
Consolidated profit or loss 30 June 2016
Czech Republic
Slovak
Republic Germany Hungary Poland Romania France Luxembourg Italy Russia Switzerland Croatia Other*
Total consolidated
Gross rental income 69,744 7,366 23,731 8,678 3,326 -- 42 -- 1,080 -- -- -- -- 113,967
Service revenue 4,851 1 645 19 37 -- 4 216 -- -- -- -- -- 5,773
Net service charge income 2,465 (740) 1,476 1,204 (112) -- -- -- -- -- -- -- -- 4,293
Property operating expenses (15,879) (960) (2,617) (1,165) (397) -- -- -- (370) -- -- -- -- (21,388)
Net rental income 61,181 5,667 23,235 8,736 2,854 -- 46 216 710 -- -- -- -- 102,645
Development sales 171 -- -- 33 -- -- -- -- -- -- -- -- -- 204
Cost of goods sold -- -- -- (7) -- -- -- -- -- -- -- -- -- (7)
Development operating expenses (52) -- -- -- -- -- -- -- (431) -- -- -- -- (483)
Net development income 119 -- -- 26 -- -- -- -- (431) -- -- -- -- (286)
Hotel revenue 2,052 -- -- 2,494 -- -- -- -- -- 1,707 -- 4,492 -- 10,745
Cost of goods sold -- -- -- -- -- -- -- -- -- -- -- (3) -- (3)
Hotel operating expenses (1,243) -- -- (1,841) -- -- -- -- -- (1,031) -- (3,038) -- (7,153)
Net hotel income 809 -- -- 653 -- -- -- -- -- 676 -- 1,451 -- 3,589
Revenue from other business operations 5,630 -- -- -- -- -- -- -- -- -- 11,165 -- -- 16,795
Cost of goods sold (145) -- -- -- -- -- -- -- -- -- -- -- -- (145)
Related operating expenses (2,657) -- -- -- -- -- -- -- -- -- (10,682) -- -- (13,339)
Net income from other business operations 2,828 -- -- -- -- -- -- -- -- -- 483 -- -- 3,311
Total revenues 84,913 6,627 25,852 12,428 3,251 -- 46 216 1,080 1,707 11,165 4,492 -- 151,777
Total direct business operating expenses (19,976) (960) (2,617) (3,013) (397) -- -- -- (801) (1,031) (10,682) (3,041) -- (42,518)
Net business income 64,937 5,667 23,235 9,415 2,854 -- 46 216 279 676 483 1,451 -- 109,259
Net valuation gain or loss on investment property 499 (777) -- (874) (9) -- -- -- -- -- -- -- -- (1,161)
Net gain or loss on the disposal of investment property (348) -- -- 18 -- -- -- -- -- -- -- -- -- (330)
Net gain or loss on disposal of subsidiaries 1,411 -- -- 1,184 -- -- -- (210) -- -- -- -- (2,385) --
Amortization, depreciation and impairments (2,008) (5) (1,719) (245) (57) (1) -- 2,438 -- (268) (2,603) (460) -- (4,928)
Other operating income 1,624 882 191 63 5 -- -- 138 -- -- -- 9,372 (85) 12,190
Administrative expenses (7,495) (8) (4,857) (1,341) (439) (87) (625) (478) (134) (172) (66) (25) (2,947) (18,674)
Other operating expenses (79) (521) 763 (320) 6 (20) (115) (122) (892) -- 1 -- (6) (1,305)
Operating result 58,541 5,238 17,613 7,900 2,360 (108) (694) 1,982 (747) 236 (2,185) 10,338 (5,423) 95,051
Interest income 912 -- 1,055 10 -- -- -- 2,548 10 -- -- -- 758 5,293
Interest expense (27,053) (2,968) (5,262) (1,413) (771) (4) (429) (5,372) -- -- (431) (303) (669) (44,675)
Other net financial result (1,398) (344) (417) 256 (1,420) 3 (2) 1,942 (1) 4,120 (52) 57 (67) 2,677
Net finance income/(costs) (27,539) (3,312) (4,624) (1,147) (2,191) (1) (431) (882) 9 4,120 (483) (246) 22 (36,705)
Profit/(loss) before income tax 31,002 1,926 12,989 6,753 169 (109) (1,125) 1,100 19 4,120 (483) (246) 780 58,346 Income tax expense (61) (50) (5,382) (1,433) (323) 26 (4,914) (274) 177 (990) 342 (2,422) 1,301 (14,003) Net profit/(loss) from continuing operations 30,941 1,876 7,607 5,320 (154) (83) (6,039) 826 196 3,130 (141) (2,668) 2,081 44,343
*Other countries includes operations in Netherland, Ireland, Cyprus, British Virgin Islands and Guernsey.

CPI PROPERTY GROUP
2017 CONDENSED CONSOLIDATED INTERIM FINANCIAL STATEMENTS | 34
As at 30 June 2017
Consolidated statement of financial position Czech Republic
Slovak Republic
Germany Hungary Poland Romania France Luxemburg Italy Russia Switzerland
Croatia
Monaco Other* Total
consolidated
30 June 2017
Gross assets value 3,236,989 110,409 1,053,654 514,942 219,092 30,622 85,960 -- 46,713 26,040 116,585 168,748 95,412 11 5,705,177
Investment Property 2,923,835 110,402 1,043,205 471,692 199,166 30,600 11,100 -- 38,000 -- -- -- 95,219 -- 4,923,219
Property, plant and equipment 298,173 3 10,395 43,139 19,863 -- 303 -- -- 25,924 116,071 168,326 193 -- 682,390
Inventories 14,981 4 54 111 63 22 74,557 -- 8,713 116 514 422 -- 11 99,568
Biological assets 7,516 -- -- -- -- -- -- -- -- -- -- -- -- -- 7,516
Other assets non-current 74,587 (2) 52,579 2,115 257 -- -- 183,163 26 252 4,912 74 10 64 318,037
Other assets current 129,842 1,267 19,266 9,101 5,917 8,700 6,863 32,660 2,799 199 2,481 2,919 444 1,225 223,683
Cash and cash equivalents 151,253 3,953 18,109 22,345 9,482 1,373 12,078 1,384 710 230 675 2,746 4,676 6,087 235,101 Total Assets 3,600,187 115,627 1,143,608 548,503 234,748 40,695 104,901 217,207 50,248 26,721 124,653 174,487 100,542 7,387 6,489,512 Other payables non-current 309,130 9,210 254,974 20,461 6,140 927 2,357 (1,285) 2,429 877 5,750 11,506 -- 1 622,477
Finance debts non-current 1,184,640 42,318 40,056 236,376 120,088 303 34,520 28 25,047 -- 23,091 34,448 -- 44 1,740,959
Bonds issued non-current 473,479 147,017 -- -- -- -- -- 67,504 -- -- -- -- -- -- 688,000
Other payables current 103,406 1,224 32,149 12,993 4,576 1,053 9,854 1,300 1,496 937 11,284 7,026 1,446 5,199 193,943
Finance debts current 145,604 2,723 288,386 17,245 18,005 15,253 7,129 -- 32 -- 27,073 1,327 72,636 6 595,419
Bonds issued current 15,222 32,320 -- -- -- -- -- 2,700 -- -- -- -- -- -- 50,242 Total Liabilities 2,231,481 234,812 615,565 287,075 148,809 17,536 53,860 70,247 29,004 1,814 67,198 54,307 74,082 5,250 3,891,040
*Other countries includes assets and liabilities in Netherland, Ireland, Cyprus, British Virgin Islands and Guernsey.
As at 31 December 2016
Consolidated statement of financial position Czech Republic
Slovak Republic
Germany Hungary Poland Romania France Luxemburg Italy Russia Switzerland
Croatia
Monaco Other* Total
consolidated
31 December 2016
Gross assets value 2,635,556 109,864 1,049,090 319,521 103,997 -- 85,733 -- 46,712 26,050 117,164 168,435 92,342 11 4,754,475
Investment Property 2,328,233 109,857 1,038,390 275,800 83,989 -- 11,100 -- 38,000 -- -- -- 92,326 -- 3,977,696
Property, plant and equipment 294,205 3 10,646 43,574 19,905 -- 303 -- -- 25,932 116,064 168,278 16 -- 678,926
Inventories 13,118 4 54 147 103 -- 74,330 -- 8,712 118 1,100 157 -- 11 97,854
Biological assets 6,197 -- -- -- -- -- -- -- -- -- -- -- -- -- 6,197
Other assets non-current 78,110 476 49,953 34 249 -- -- 118,964 26 9 5,091 78 135 1,602 254,727
Other assets current 144,549 74,747 46,422 5,123 1,234 7,759 6,776 37,073 2,768 250 4,212 365 323 11,176 342,777
Cash and cash equivalents 197,495 4,015 10,181 11,781 7,418 16 12,740 51,850 468 108 810 2,493 4,306 52 303,733 Total Assets 3,061,907 189,102 1,155,646 336,459 112,898 7,775 105,249 207,887 49,974 26,417 127,277 171,371 97,106 12,841 5,661,909 Other payables non-current 238,615 9,336 247,251 16,339 6,516 11 2,357 750 2,429 735 6,346 11,769 -- -- 542,454
Finance debts non-current 898,357 39,040 41,007 120,625 45,328 303 34,522 52 24,490 -- 21,822 34,238 34,292 43 1,294,119
Bonds issued non-current 421,860 122,773 -- -- -- -- -- 112,147 -- -- -- -- -- -- 656,780
Other payables current 82,649 45,668 28,725 8,089 2,985 5 9,341 40,998 1,335 999 21,361 3,602 311 1,636 247,704
Finance debts current 179,401 2,563 293,146 17,915 14,292 98 7,111 192 -- -- 28,825 1,318 37,409 14 582,284
Bonds issued current 46,460 1,816 -- -- -- -- -- 1,825 -- -- -- -- -- -- 50,101 Total Liabilities 1,867,342 221,196 610,129 162,968 69,121 417 53,331 155,964 28,254 1,734 78,354 50,927 72,012 1,693 3,373,442
*Other countries includes assets and liabilities in Netherland, Ireland, Cyprus, British Virgin Islands and Guernsey.

CPI PROPERTY GROUP
2017 CONDENSED CONSOLIDATED INTERIM FINANCIAL STATEMENTS | 35
5 Condensed consolidated interim statement of comprehensive income
Gross rental income
For the six month period ended
30 June 2017 30 June 2016
Gross rental income (1) 119,679 113,967
Service revenue (2) 5,171 5,773 Total gross rental income 124,850 119,740
(1) Increase in rental income is generally attributable to the Group´s expansion in 2017 and 2016. The main
favourable impact represent the acquisition of CBRE GI portfolio in March 2017 leading to a net increase of
EUR 10 million. Gross rental income in 2017 includes 6 months operations of Géčko Shopping Center
(acquired in March 2016) with net increase of EUR 2 million and 6 months operations of OPG (acquired in
June 2016) with net increase of EUR 3 million.
The growth is partially offset by a decline in gross rental income caused by the sale of Lozorno Logistics Park
(EUR 3.4 million).
Due to acquisition of CPI Hotels in August 2016, the gross rental income of the Group decreased of
EUR 9.9 million compared to first six months of 2016. Following the acquisition, the gross rental income
generated by the hotels owned by the Group became intercompany income. However, it has been substituted
by the significant increase in net hotel income (note 5.5).
Rental income is derived from a large number of tenants and no single tenant or group of tenants contribute
more than 10 % to the Group’s rental income.
(2) Service revenue include main advisory and accounting services, which relate to service provided to non-
consolidated entities. These services derive directly from rental activities performed by the Group so they are
disclosed as a part of service income.
Net service charge income
For the six month period ended
30 June 2017 30 June 2016
Service charge income 28,148 21,610
Service charge expenses (21,934) (18,327)
Total 6,214 3,283
Revenues from sales of goods and merchandise 2,037 2,030
Revenues from sales of energy 543 222
Cost of sales - goods and merchandise (1,330) (1,241)
Cost of sales - energy (233) (1)
Total 1,017 1,010
Total net service charge income 7,231 4,293
Increase in volume of service charge income and expenses reflects increase in rental activity.
Increase in the net service charge income in 2017 relates to the German portfolio (net increase of EUR 2.4 million)
and is mainly influenced by higher occupancy.
Profit from sale of energies (the Group has license for the purchase and its further distribution) remains stable
and also contributed to total positive result from service recharges.
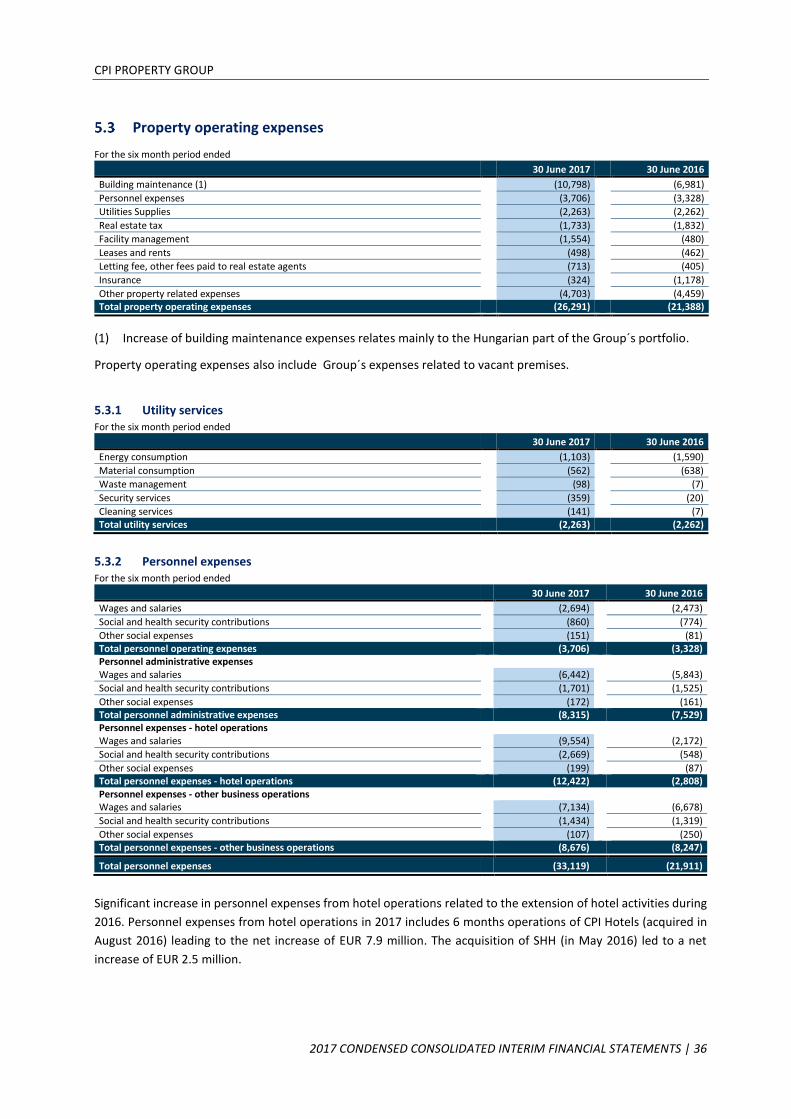
CPI PROPERTY GROUP
2017 CONDENSED CONSOLIDATED INTERIM FINANCIAL STATEMENTS | 36
Property operating expenses
For the six month period ended
30 June 2017 30 June 2016
Building maintenance (1) (10,798) (6,981)
Personnel expenses (3,706) (3,328)
Utilities Supplies (2,263) (2,262)
Real estate tax (1,733) (1,832)
Facility management (1,554) (480)
Leases and rents (498) (462)
Letting fee, other fees paid to real estate agents (713) (405)
Insurance (324) (1,178)
Other property related expenses (4,703) (4,459) Total property operating expenses (26,291) (21,388)
(1) Increase of building maintenance expenses relates mainly to the Hungarian part of the Group´s portfolio.
Property operating expenses also include Group´s expenses related to vacant premises.
5.3.1 Utility services For the six month period ended
30 June 2017 30 June 2016
Energy consumption (1,103) (1,590)
Material consumption (562) (638)
Waste management (98) (7)
Security services (359) (20)
Cleaning services (141) (7) Total utility services (2,263) (2,262)
5.3.2 Personnel expenses For the six month period ended
30 June 2017 30 June 2016
Wages and salaries (2,694) (2,473)
Social and health security contributions (860) (774)
Other social expenses (151) (81) Total personnel operating expenses (3,706) (3,328) Personnel administrative expenses Wages and salaries (6,442) (5,843)
Social and health security contributions (1,701) (1,525)
Other social expenses (172) (161) Total personnel administrative expenses (8,315) (7,529) Personnel expenses - hotel operations Wages and salaries (9,554) (2,172)
Social and health security contributions (2,669) (548)
Other social expenses (199) (87) Total personnel expenses - hotel operations (12,422) (2,808) Personnel expenses - other business operations Wages and salaries (7,134) (6,678)
Social and health security contributions (1,434) (1,319)
Other social expenses (107) (250) Total personnel expenses - other business operations (8,676) (8,247) Total personnel expenses (33,119) (21,911)
Significant increase in personnel expenses from hotel operations related to the extension of hotel activities during
2016. Personnel expenses from hotel operations in 2017 includes 6 months operations of CPI Hotels (acquired in
August 2016) leading to the net increase of EUR 7.9 million. The acquisition of SHH (in May 2016) led to a net
increase of EUR 2.5 million.
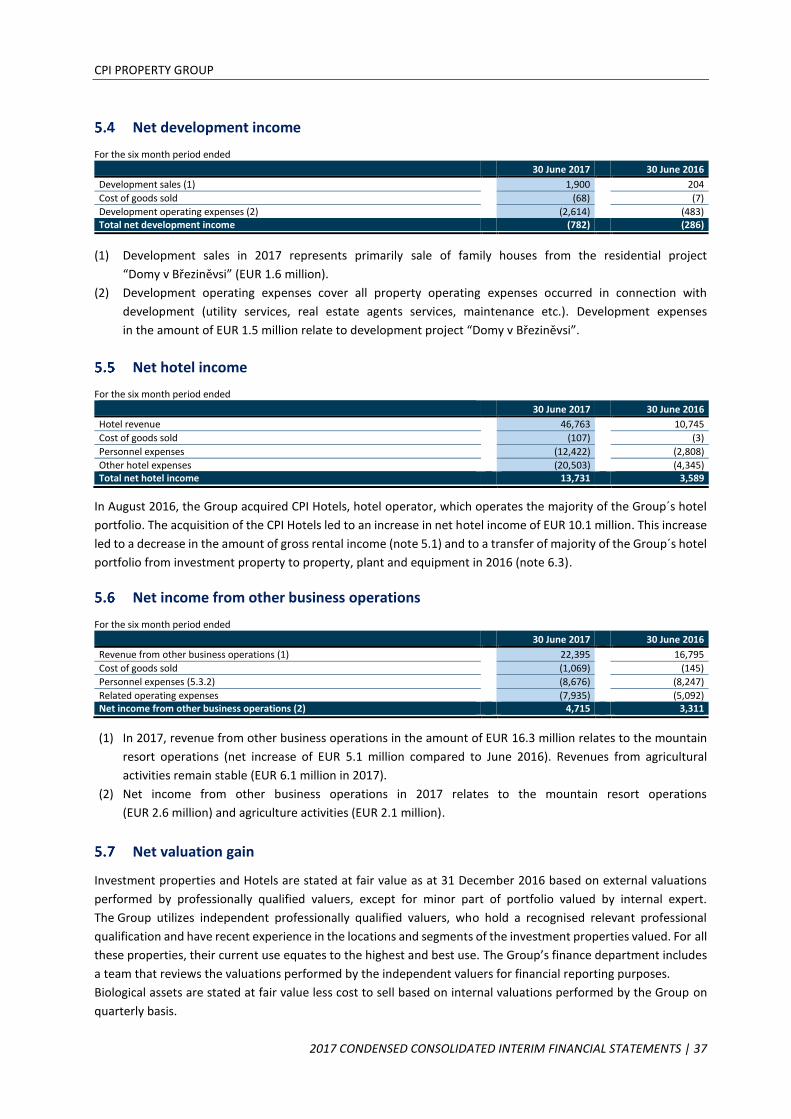
CPI PROPERTY GROUP
2017 CONDENSED CONSOLIDATED INTERIM FINANCIAL STATEMENTS | 37
Net development income
For the six month period ended
30 June 2017 30 June 2016
Development sales (1) 1,900 204
Cost of goods sold (68) (7)
Development operating expenses (2) (2,614) (483) Total net development income (782) (286)
(1) Development sales in 2017 represents primarily sale of family houses from the residential project
“Domy v Březiněvsi” (EUR 1.6 million).
(2) Development operating expenses cover all property operating expenses occurred in connection with
development (utility services, real estate agents services, maintenance etc.). Development expenses
in the amount of EUR 1.5 million relate to development project “Domy v Březiněvsi”.
Net hotel income
For the six month period ended 30 June 2017 30 June 2016
Hotel revenue 46,763 10,745
Cost of goods sold (107) (3)
Personnel expenses (12,422) (2,808)
Other hotel expenses (20,503) (4,345) Total net hotel income 13,731 3,589
In August 2016, the Group acquired CPI Hotels, hotel operator, which operates the majority of the Group´s hotel
portfolio. The acquisition of the CPI Hotels led to an increase in net hotel income of EUR 10.1 million. This increase
led to a decrease in the amount of gross rental income (note 5.1) and to a transfer of majority of the Group´s hotel
portfolio from investment property to property, plant and equipment in 2016 (note 6.3).
Net income from other business operations
For the six month period ended
30 June 2017 30 June 2016
Revenue from other business operations (1) 22,395 16,795
Cost of goods sold (1,069) (145)
Personnel expenses (5.3.2) (8,676) (8,247)
Related operating expenses (7,935) (5,092) Net income from other business operations (2) 4,715 3,311
(1) In 2017, revenue from other business operations in the amount of EUR 16.3 million relates to the mountain
resort operations (net increase of EUR 5.1 million compared to June 2016). Revenues from agricultural
activities remain stable (EUR 6.1 million in 2017).
(2) Net income from other business operations in 2017 relates to the mountain resort operations
(EUR 2.6 million) and agriculture activities (EUR 2.1 million).
Net valuation gain
Investment properties and Hotels are stated at fair value as at 31 December 2016 based on external valuations
performed by professionally qualified valuers, except for minor part of portfolio valued by internal expert.
The Group utilizes independent professionally qualified valuers, who hold a recognised relevant professional
qualification and have recent experience in the locations and segments of the investment properties valued. For all
these properties, their current use equates to the highest and best use. The Group’s finance department includes
a team that reviews the valuations performed by the independent valuers for financial reporting purposes.
Biological assets are stated at fair value less cost to sell based on internal valuations performed by the Group on
quarterly basis.
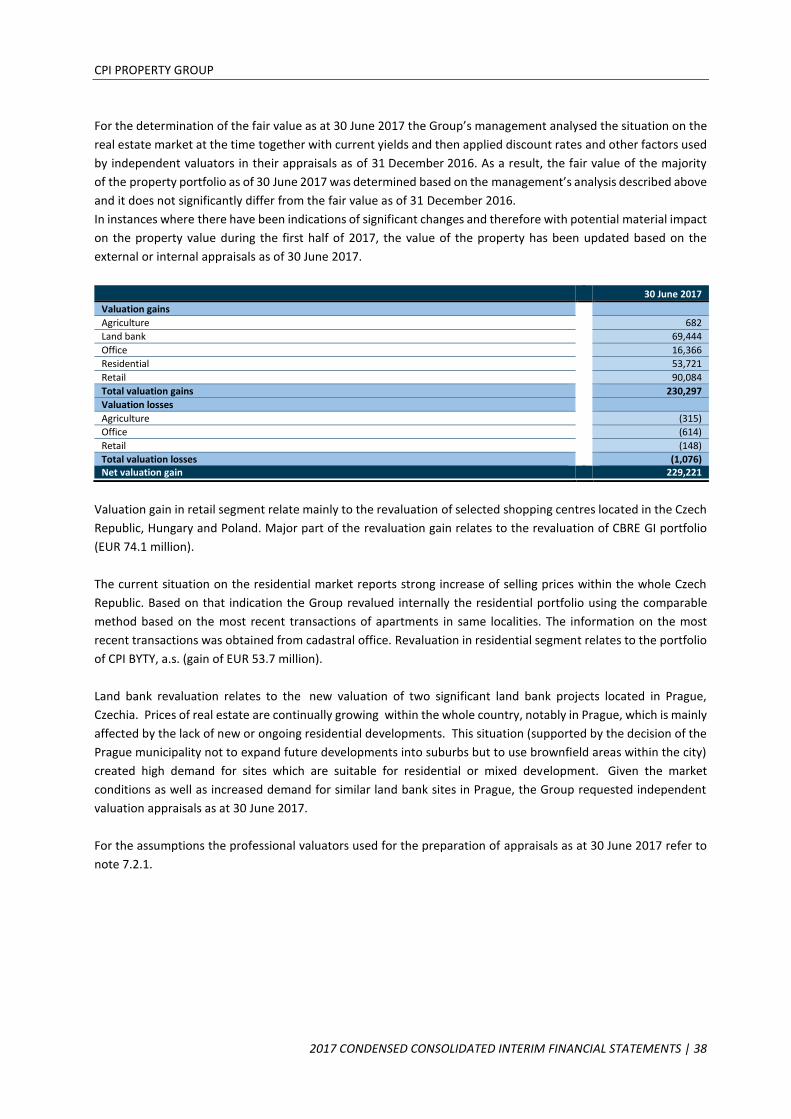
CPI PROPERTY GROUP
2017 CONDENSED CONSOLIDATED INTERIM FINANCIAL STATEMENTS | 38
For the determination of the fair value as at 30 June 2017 the Group’s management analysed the situation on the
real estate market at the time together with current yields and then applied discount rates and other factors used
by independent valuators in their appraisals as of 31 December 2016. As a result, the fair value of the majority
of the property portfolio as of 30 June 2017 was determined based on the management’s analysis described above
and it does not significantly differ from the fair value as of 31 December 2016.
In instances where there have been indications of significant changes and therefore with potential material impact
on the property value during the first half of 2017, the value of the property has been updated based on the
external or internal appraisals as of 30 June 2017.
30 June 2017
Valuation gains
Agriculture 682
Land bank 69,444
Office 16,366
Residential 53,721
Retail 90,084
Total valuation gains 230,297
Valuation losses
Agriculture (315)
Office (614)
Retail (148)
Total valuation losses (1,076) Net valuation gain 229,221
Valuation gain in retail segment relate mainly to the revaluation of selected shopping centres located in the Czech
Republic, Hungary and Poland. Major part of the revaluation gain relates to the revaluation of CBRE GI portfolio
(EUR 74.1 million).
The current situation on the residential market reports strong increase of selling prices within the whole Czech
Republic. Based on that indication the Group revalued internally the residential portfolio using the comparable
method based on the most recent transactions of apartments in same localities. The information on the most
recent transactions was obtained from cadastral office. Revaluation in residential segment relates to the portfolio
of CPI BYTY, a.s. (gain of EUR 53.7 million).
Land bank revaluation relates to the new valuation of two significant land bank projects located in Prague,
Czechia. Prices of real estate are continually growing within the whole country, notably in Prague, which is mainly
affected by the lack of new or ongoing residential developments. This situation (supported by the decision of the
Prague municipality not to expand future developments into suburbs but to use brownfield areas within the city)
created high demand for sites which are suitable for residential or mixed development. Given the market
conditions as well as increased demand for similar land bank sites in Prague, the Group requested independent
valuation appraisals as at 30 June 2017.
For the assumptions the professional valuators used for the preparation of appraisals as at 30 June 2017 refer to
note 7.2.1.
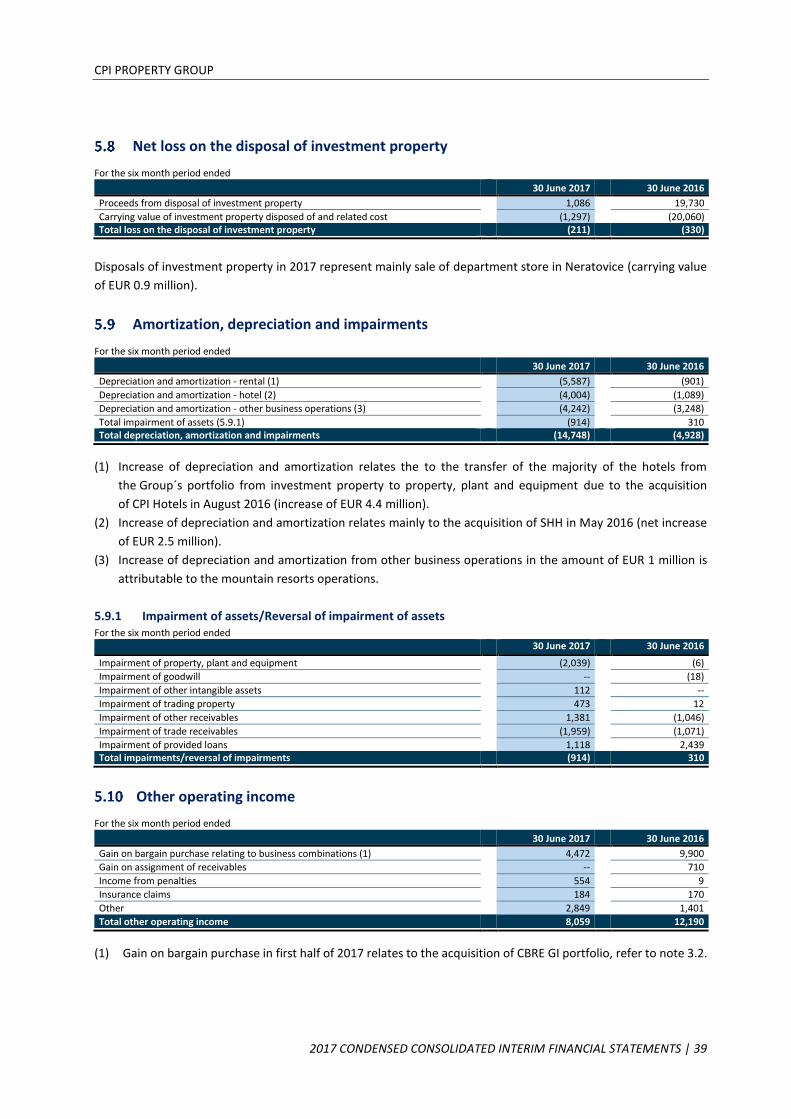
CPI PROPERTY GROUP
2017 CONDENSED CONSOLIDATED INTERIM FINANCIAL STATEMENTS | 39
Net loss on the disposal of investment property
For the six month period ended
30 June 2017 30 June 2016
Proceeds from disposal of investment property 1,086 19,730
Carrying value of investment property disposed of and related cost (1,297) (20,060) Total loss on the disposal of investment property (211) (330)
Disposals of investment property in 2017 represent mainly sale of department store in Neratovice (carrying value
of EUR 0.9 million).
Amortization, depreciation and impairments
For the six month period ended
30 June 2017 30 June 2016
Depreciation and amortization - rental (1) (5,587) (901)
Depreciation and amortization - hotel (2) (4,004) (1,089)
Depreciation and amortization - other business operations (3) (4,242) (3,248)
Total impairment of assets (5.9.1) (914) 310 Total depreciation, amortization and impairments (14,748) (4,928)
(1) Increase of depreciation and amortization relates the to the transfer of the majority of the hotels from
the Group´s portfolio from investment property to property, plant and equipment due to the acquisition
of CPI Hotels in August 2016 (increase of EUR 4.4 million).
(2) Increase of depreciation and amortization relates mainly to the acquisition of SHH in May 2016 (net increase
of EUR 2.5 million).
(3) Increase of depreciation and amortization from other business operations in the amount of EUR 1 million is
attributable to the mountain resorts operations.
5.9.1 Impairment of assets/Reversal of impairment of assets For the six month period ended
30 June 2017 30 June 2016
Impairment of property, plant and equipment
(2,039)
(6)
Impairment of goodwill
--
(18)
Impairment of other intangible assets
112
--
Impairment of trading property
473
12
Impairment of other receivables
1,381
(1,046)
Impairment of trade receivables
(1,959)
(1,071)
Impairment of provided loans
1,118
2,439 Total impairments/reversal of impairments (914) 310
Other operating income
For the six month period ended
30 June 2017 30 June 2016
Gain on bargain purchase relating to business combinations (1) 4,472 9,900
Gain on assignment of receivables -- 710
Income from penalties 554 9
Insurance claims 184 170
Other 2,849 1,401
Total other operating income 8,059 12,190
(1) Gain on bargain purchase in first half of 2017 relates to the acquisition of CBRE GI portfolio, refer to note 3.2.
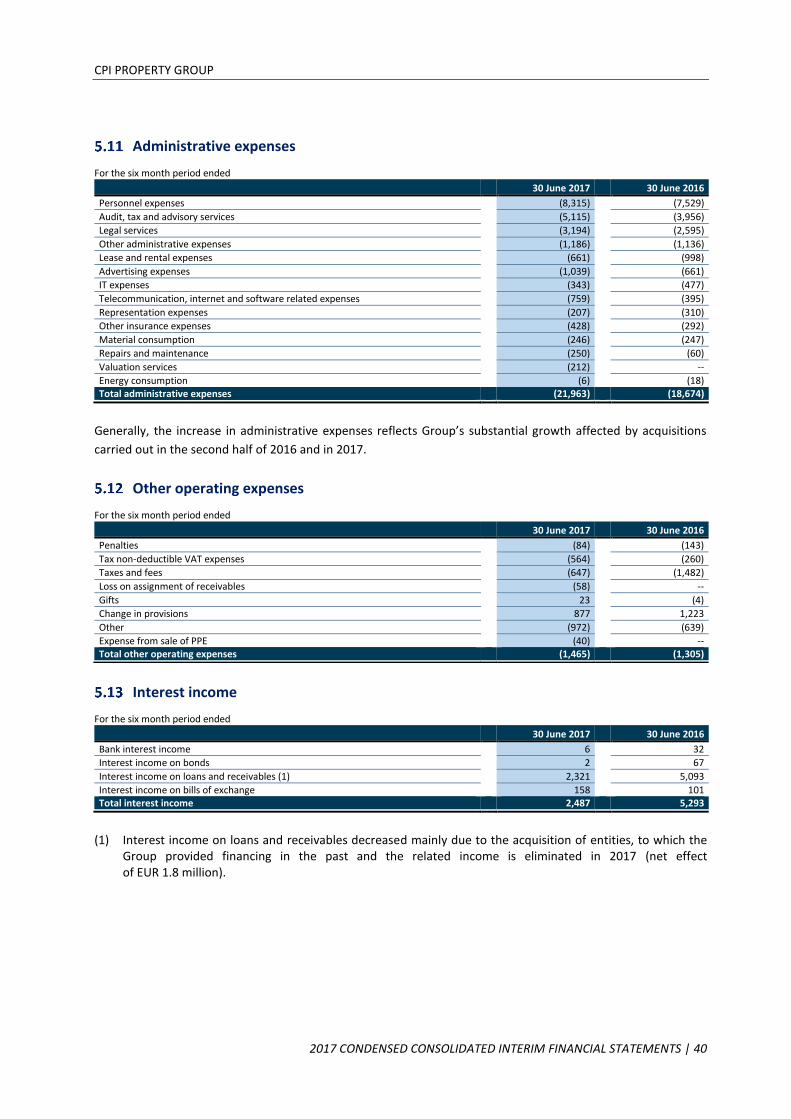
CPI PROPERTY GROUP
2017 CONDENSED CONSOLIDATED INTERIM FINANCIAL STATEMENTS | 40
Administrative expenses
For the six month period ended
30 June 2017 30 June 2016
Personnel expenses (8,315) (7,529)
Audit, tax and advisory services (5,115) (3,956)
Legal services (3,194) (2,595)
Other administrative expenses (1,186) (1,136)
Lease and rental expenses (661) (998)
Advertising expenses (1,039) (661)
IT expenses (343) (477)
Telecommunication, internet and software related expenses (759) (395)
Representation expenses (207) (310)
Other insurance expenses (428) (292)
Material consumption (246) (247)
Repairs and maintenance (250) (60)
Valuation services (212) --
Energy consumption (6) (18) Total administrative expenses (21,963) (18,674)
Generally, the increase in administrative expenses reflects Group’s substantial growth affected by acquisitions
carried out in the second half of 2016 and in 2017.
Other operating expenses
For the six month period ended
Interest income
For the six month period ended
30 June 2017 30 June 2016
Bank interest income 6 32
Interest income on bonds 2 67
Interest income on loans and receivables (1) 2,321 5,093
Interest income on bills of exchange 158 101 Total interest income 2,487 5,293
(1) Interest income on loans and receivables decreased mainly due to the acquisition of entities, to which the Group provided financing in the past and the related income is eliminated in 2017 (net effect of EUR 1.8 million).
30 June 2017 30 June 2016
Penalties (84) (143)
Tax non-deductible VAT expenses (564) (260)
Taxes and fees (647) (1,482)
Loss on assignment of receivables (58) --
Gifts 23 (4)
Change in provisions 877 1,223
Other (972) (639)
Expense from sale of PPE (40) -- Total other operating expenses (1,465) (1,305)
--
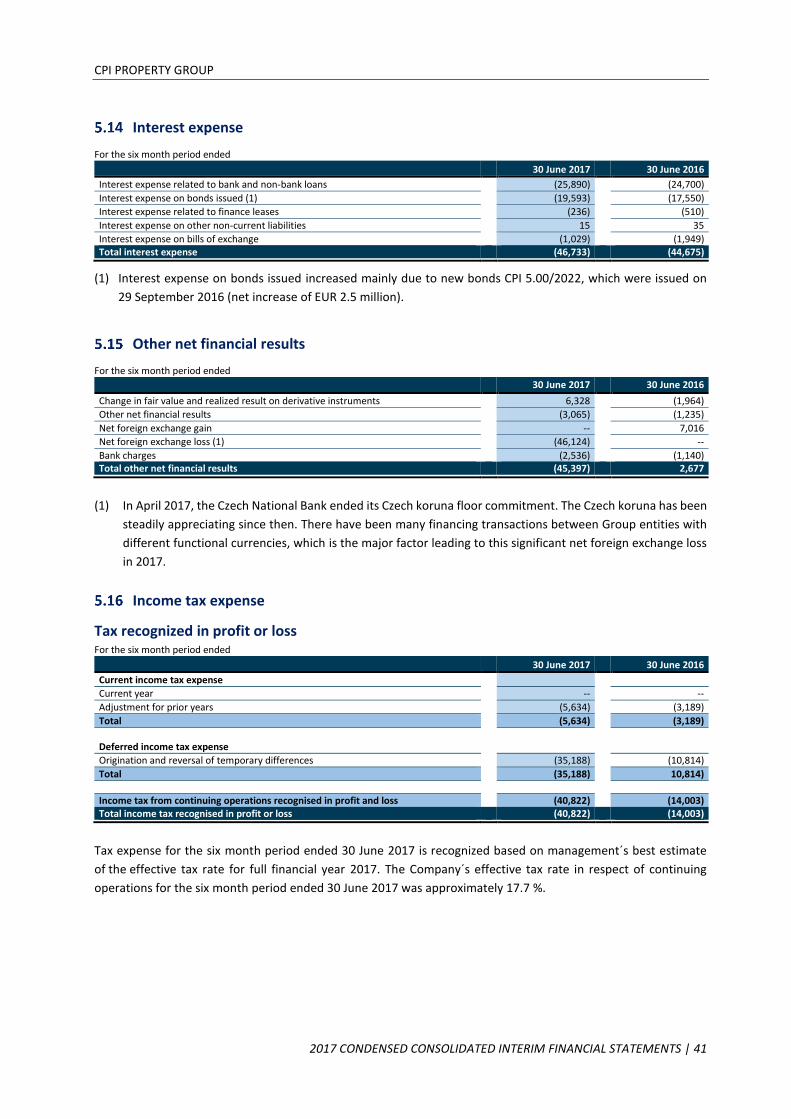
CPI PROPERTY GROUP
2017 CONDENSED CONSOLIDATED INTERIM FINANCIAL STATEMENTS | 41
Interest expense
For the six month period ended
30 June 2017 30 June 2016
Interest expense related to bank and non-bank loans (25,890) (24,700)
Interest expense on bonds issued (1) (19,593) (17,550)
Interest expense related to finance leases (236) (510)
Interest expense on other non-current liabilities 15 35
Interest expense on bills of exchange (1,029) (1,949) Total interest expense (46,733) (44,675)
(1) Interest expense on bonds issued increased mainly due to new bonds CPI 5.00/2022, which were issued on
29 September 2016 (net increase of EUR 2.5 million).
Other net financial results
For the six month period ended
30 June 2017 30 June 2016
Change in fair value and realized result on derivative instruments 6,328 (1,964)
Other net financial results (3,065) (1,235)
Net foreign exchange gain -- 7,016
Net foreign exchange loss (1) (46,124) --
Bank charges (2,536) (1,140) Total other net financial results (45,397) 2,677
(1) In April 2017, the Czech National Bank ended its Czech koruna floor commitment. The Czech koruna has been
steadily appreciating since then. There have been many financing transactions between Group entities with
different functional currencies, which is the major factor leading to this significant net foreign exchange loss
in 2017.
Income tax expense
Tax recognized in profit or loss For the six month period ended
30 June 2017 30 June 2016
Current income tax expense Current year -- --
Adjustment for prior years (5,634) (3,189)
Total (5,634) (3,189)
Deferred income tax expense Origination and reversal of temporary differences (35,188) (10,814)
Total (35,188) 10,814)
Income tax from continuing operations recognised in profit and loss (40,822) (14,003) Total income tax recognised in profit or loss (40,822) (14,003)
Tax expense for the six month period ended 30 June 2017 is recognized based on management´s best estimate
of the effective tax rate for full financial year 2017. The Company´s effective tax rate in respect of continuing
operations for the six month period ended 30 June 2017 was approximately 17.7 %.
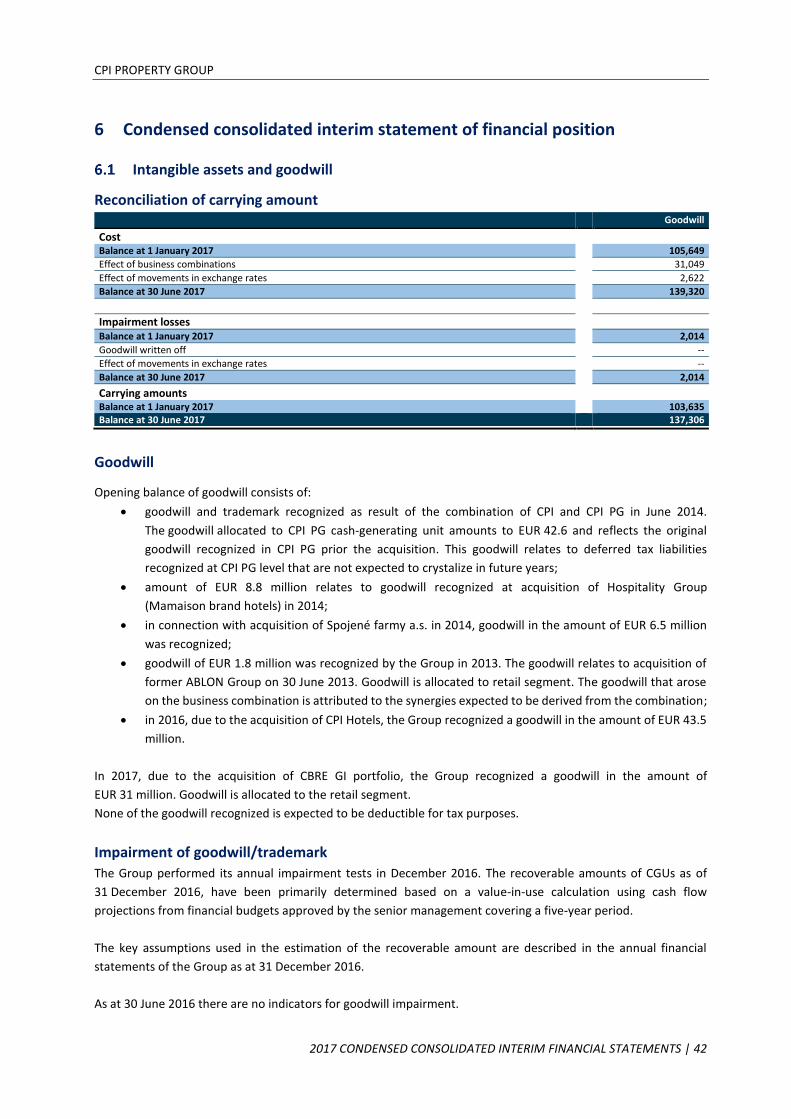
CPI PROPERTY GROUP
2017 CONDENSED CONSOLIDATED INTERIM FINANCIAL STATEMENTS | 42
6 Condensed consolidated interim statement of financial position
Intangible assets and goodwill
Reconciliation of carrying amount Goodwill
Cost Balance at 1 January 2017 105,649
Effect of business combinations 31,049
Effect of movements in exchange rates 2,622
Balance at 30 June 2017 139,320
Impairment losses Balance at 1 January 2017 2,014
Goodwill written off --
Effect of movements in exchange rates --
Balance at 30 June 2017 2,014 Carrying amounts Balance at 1 January 2017 103,635 Balance at 30 June 2017 137,306
Goodwill
Opening balance of goodwill consists of:
• goodwill and trademark recognized as result of the combination of CPI and CPI PG in June 2014.
The goodwill allocated to CPI PG cash-generating unit amounts to EUR 42.6 and reflects the original
goodwill recognized in CPI PG prior the acquisition. This goodwill relates to deferred tax liabilities
recognized at CPI PG level that are not expected to crystalize in future years;
• amount of EUR 8.8 million relates to goodwill recognized at acquisition of Hospitality Group
(Mamaison brand hotels) in 2014;
• in connection with acquisition of Spojené farmy a.s. in 2014, goodwill in the amount of EUR 6.5 million
was recognized;
• goodwill of EUR 1.8 million was recognized by the Group in 2013. The goodwill relates to acquisition of
former ABLON Group on 30 June 2013. Goodwill is allocated to retail segment. The goodwill that arose
on the business combination is attributed to the synergies expected to be derived from the combination;
• in 2016, due to the acquisition of CPI Hotels, the Group recognized a goodwill in the amount of EUR 43.5
million.
In 2017, due to the acquisition of CBRE GI portfolio, the Group recognized a goodwill in the amount of
EUR 31 million. Goodwill is allocated to the retail segment.
None of the goodwill recognized is expected to be deductible for tax purposes.
Impairment of goodwill/trademark
The Group performed its annual impairment tests in December 2016. The recoverable amounts of CGUs as of
31 December 2016, have been primarily determined based on a value-in-use calculation using cash flow
projections from financial budgets approved by the senior management covering a five-year period.
The key assumptions used in the estimation of the recoverable amount are described in the annual financial
statements of the Group as at 31 December 2016.
As at 30 June 2016 there are no indicators for goodwill impairment.

CPI PROPERTY GROUP
2017 CONDENSED CONSOLIDATED INTERIM FINANCIAL STATEMENTS | 43
Investment property
Income Generating - Rental properties
Subtotal - rental
properties
Income Generating - operation properties
Land bank
Development
Total
Office Retail Residential
Industry and logistics
Hotels
Agriculture
Balance at 1 January 2016 1,539,663 964,375 275,883 143,526 336,266 3,259,713 49,130 222,633 2,838 3,534,314
Investments/acquisitions 101,276 98,833 99,826 1,150 -- 301,085 -- 149,803 -- 450,888
Transfers -- -- -- 1,230 (295,083) (293,853) -- (4,714) -- (298,567)
Development costs -- -- -- -- -- -- -- -- 4,492 4,492
Additions 19,385 11,879 3,002 10,039 2,747 47,052 440 1,335 -- 48,827
Disposals (24,433) (268) (1,271) -- (116) (26,088) (36) (7,891) -- (34,015)
Valuation gain/(loss) 372,781 5,506 12,759 (11,250) 1,624 381,420 20,129 (6,965) 98 394,682
Transfers in/from assets held for sale (33,973) -- -- (71,530) (7,850) (113,353) -- (8,076) -- (121,429)
Translation differences (1,366) (608) 58 6 412 (1,498) 20 (20) 2 (1,496)
Balance at 31 December 2016 1,973,333 1,079,717 390,257 73,171 38,000 3,554,478 69,683 346,105 7,430 3,977,696
Investments/acquisitions 43,489 581,723 -- -- 2,723 627,935 -- 2,800 -- 630,735
Transfers -- -- -- -- (2,723) (2,723) -- (3,823) -- (6,546)
Development costs -- -- -- -- -- -- -- -- 7,620 7,620
Additions 9,114 7,881 2,899 1,012 -- 20,906 392 795 -- 22,093
Disposals (113) (868) -- -- -- (981) (71) (25) -- (1,077)
Valuation gain/(loss) 15,754 89,936 53,721 -- -- 159,411 (277) 69,443 -- 228,577
Translation differences 18,933 24,242 10,241 1,285 -- 54,701 2,150 6,865 405 64,122 Balance at 30 June 2017 2,060,510 1,782,631 457,118 75,468 38,000 4,413,727 71,877 422,160 15,455 4,923,219
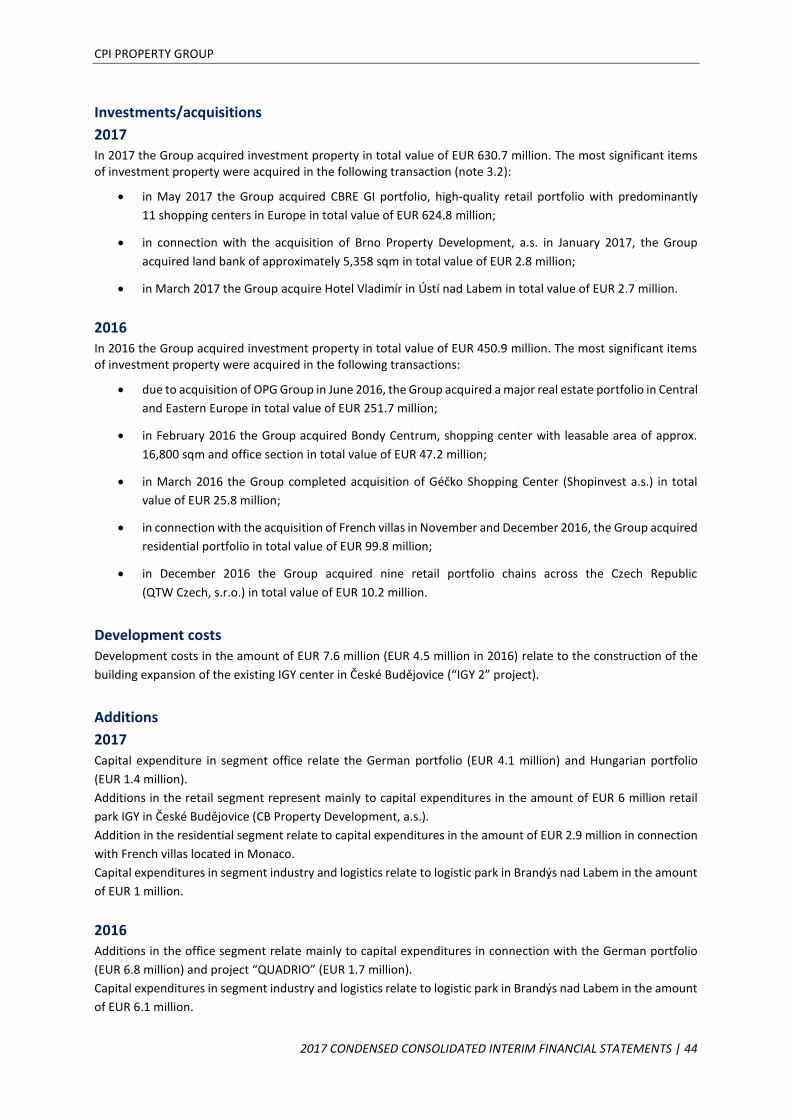
CPI PROPERTY GROUP
2017 CONDENSED CONSOLIDATED INTERIM FINANCIAL STATEMENTS | 44
Investments/acquisitions
2017 In 2017 the Group acquired investment property in total value of EUR 630.7 million. The most significant items of investment property were acquired in the following transaction (note 3.2):
• in May 2017 the Group acquired CBRE GI portfolio, high-quality retail portfolio with predominantly
11 shopping centers in Europe in total value of EUR 624.8 million;
• in connection with the acquisition of Brno Property Development, a.s. in January 2017, the Group
acquired land bank of approximately 5,358 sqm in total value of EUR 2.8 million;
• in March 2017 the Group acquire Hotel Vladimír in Ústí nad Labem in total value of EUR 2.7 million.
2016 In 2016 the Group acquired investment property in total value of EUR 450.9 million. The most significant items of investment property were acquired in the following transactions:
• due to acquisition of OPG Group in June 2016, the Group acquired a major real estate portfolio in Central
and Eastern Europe in total value of EUR 251.7 million;
• in February 2016 the Group acquired Bondy Centrum, shopping center with leasable area of approx.
16,800 sqm and office section in total value of EUR 47.2 million;
• in March 2016 the Group completed acquisition of Géčko Shopping Center (Shopinvest a.s.) in total
value of EUR 25.8 million;
• in connection with the acquisition of French villas in November and December 2016, the Group acquired
residential portfolio in total value of EUR 99.8 million;
• in December 2016 the Group acquired nine retail portfolio chains across the Czech Republic
(QTW Czech, s.r.o.) in total value of EUR 10.2 million.
Development costs
Development costs in the amount of EUR 7.6 million (EUR 4.5 million in 2016) relate to the construction of the
building expansion of the existing IGY center in České Budějovice (“IGY 2” project).
Additions
2017
Capital expenditure in segment office relate the German portfolio (EUR 4.1 million) and Hungarian portfolio
(EUR 1.4 million).
Additions in the retail segment represent mainly to capital expenditures in the amount of EUR 6 million retail
park IGY in České Budějovice (CB Property Development, a.s.).
Addition in the residential segment relate to capital expenditures in the amount of EUR 2.9 million in connection
with French villas located in Monaco.
Capital expenditures in segment industry and logistics relate to logistic park in Brandýs nad Labem in the amount
of EUR 1 million.
2016 Additions in the office segment relate mainly to capital expenditures in connection with the German portfolio
(EUR 6.8 million) and project “QUADRIO” (EUR 1.7 million).
Capital expenditures in segment industry and logistics relate to logistic park in Brandýs nad Labem in the amount
of EUR 6.1 million.
CPI PROPERTY GROUP
2017 CONDENSED CONSOLIDATED INTERIM FINANCIAL STATEMENTS | 45
Additions in the amount of EUR 2.2 million relate to reconstruction of Spa & Kur Hotel Praha in Františkovy Lázně
(LD Praha, a.s.).
Other additions in 2016 represent mainly capital expenditures in the amount of EUR 3.5 million in connection
with retail park IGY in České Budějovice (CB Property Development, a.s.).
Disposals
2017
Investment property in the amount of EUR 0.9 million was disposed of due to sale department store in Neratovice
(CPI Reality, a.s.).
2016 Investment property in the amount of EUR 27.4 million was disposed of due to sale of three subsidiaries in 2016.
Valuation gain/loss Refer to 5.7.
Transfers in/from assets held for sale
Amount EUR 11.8 million was transfer from investment property to assets held for sale, refer to note 6.12.
Translation differences Translation differences related to investment property arise primarily in connection with translation of financial
information of subsidiaries having other currency than EUR as functional currency to presentation currency of
consolidated financial statements (EUR).
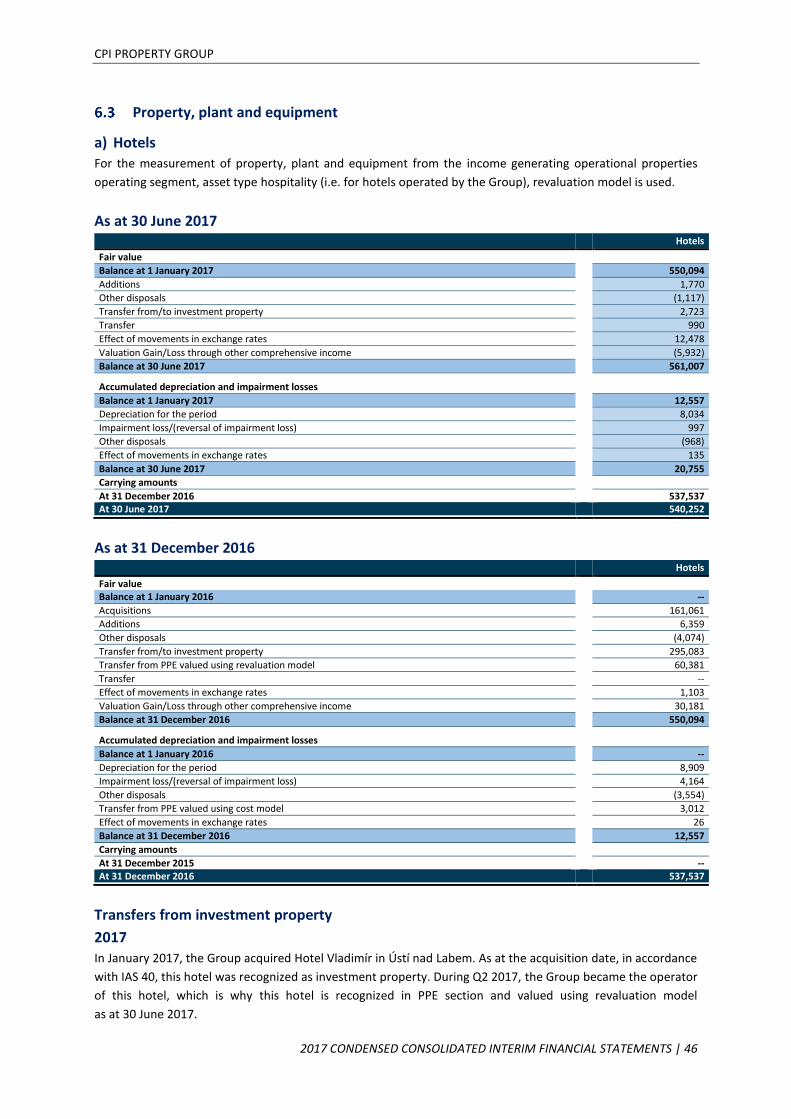
CPI PROPERTY GROUP
2017 CONDENSED CONSOLIDATED INTERIM FINANCIAL STATEMENTS | 46
Property, plant and equipment
a) Hotels For the measurement of property, plant and equipment from the income generating operational properties
operating segment, asset type hospitality (i.e. for hotels operated by the Group), revaluation model is used.
As at 30 June 2017 Hotels
Fair value Balance at 1 January 2017 550,094
Additions 1,770
Other disposals (1,117)
Transfer from/to investment property 2,723
Transfer 990
Effect of movements in exchange rates 12,478
Valuation Gain/Loss through other comprehensive income (5,932)
Balance at 30 June 2017 561,007
Accumulated depreciation and impairment losses Balance at 1 January 2017 12,557
Depreciation for the period 8,034
Impairment loss/(reversal of impairment loss) 997
Other disposals (968)
Effect of movements in exchange rates 135
Balance at 30 June 2017 20,755
Carrying amounts At 31 December 2016 537,537 At 30 June 2017 540,252
As at 31 December 2016 Hotels
Fair value Balance at 1 January 2016 --
Acquisitions 161,061
Additions 6,359
Other disposals (4,074)
Transfer from/to investment property 295,083
Transfer from PPE valued using revaluation model 60,381
Transfer --
Effect of movements in exchange rates 1,103
Valuation Gain/Loss through other comprehensive income 30,181
Balance at 31 December 2016 550,094
Accumulated depreciation and impairment losses Balance at 1 January 2016 --
Depreciation for the period 8,909
Impairment loss/(reversal of impairment loss) 4,164
Other disposals (3,554)
Transfer from PPE valued using cost model 3,012
Effect of movements in exchange rates 26
Balance at 31 December 2016 12,557
Carrying amounts At 31 December 2015 -- At 31 December 2016 537,537
Transfers from investment property
2017 In January 2017, the Group acquired Hotel Vladimír in Ústí nad Labem. As at the acquisition date, in accordance
with IAS 40, this hotel was recognized as investment property. During Q2 2017, the Group became the operator
of this hotel, which is why this hotel is recognized in PPE section and valued using revaluation model
as at 30 June 2017.

CPI PROPERTY GROUP
2017 CONDENSED CONSOLIDATED INTERIM FINANCIAL STATEMENTS | 47
2016 Due to the acquisition of CPI Hotels, the Group became both owner and operator of its hotel portfolio (except
the Holiday Inn Rome hotel), which is why as at 30 June 2016, the majority of the hotel portfolio has been
transfered from investment property to property, plant and equipment. Subsequently, these hotels has been
revaluated to its fair value as at 31 December 2016 based on the valuations prepared by the independent
valuator.
Acquisitions
2016
Increase of balance of property, plant and equipment in the amount of EUR 161 million is attributable to
acquisition of SHH in May 2016.
Valuation loss through OCI Fair value of Hotels was determined using either the direct comparison method of valuation where price per
bedroom was calculated and compared, or using the discounted cash flow method, or through the income
capitalization method. This means that valuations performed by the valuer are based on active market prices,
significantly adjusted for differences in the nature, location or condition of the specific property. As at the date
of revaluation on 31 December 2016, the fair values of Hotels are based on valuations performed by independent
and experienced valuer. For the key assumptions made in relation of hotel property valuations refer to note
7.2.1.
2017
The Group´s hotel portfolio has not been revalued as of 30 June 2017. The Group’s management analysed the
situation on the real estate market at the time together with current yields and then applied discount rates and
other factors used by independent valuators in their appraisals as of 31 December 2016. As a result, the fair value
of the majority of the property portfolio as of 30 June 2017 was determined based on the management’s analysis
described above and it does not significantly differ from the fair value as of 31 December 2016.
Decrease of the valuation surplus (EUR 30.2 million recognized as at 31 December 2016) in the amount of
EUR 5.9 million reflects primarily the significant change in exchange rate CZK/EUR, in case of entities having the
functional currency CZK and the valuation appraisal as at 31 December 2016 in EUR.
If Hotels were measured using the cost model, the carrying amounts would be EUR 516,003 thousand
as at 30 June 2017 (EUR 507,356 thousand as at 31 December 2016).
2016 Valuation gain in the amount of EUR 30.2 million has been recognized in connection with the revaluation of the
Group´s hospitality portfolio.
Impairment losses
2017 In 2017, the Group recognized an impairment expense in the amount of EUR 0.9 million in connection with the
revaluation of its hospitality portfolio.
2016
In 2016, the Group recognized an impairment expense in the amount of EUR 4.2 million in connection with the
revaluation of its hospitality portfolio.

CPI PROPERTY GROUP
2017 CONDENSED CONSOLIDATED INTERIM FINANCIAL STATEMENTS | 48
b) Other property, plant and equipment
Other property, plant and equipment, except hotels from hospitality segment, is valued using cost model.
The major part of property, plant and equipment represents portfolio of CMA Group acquired in 2015 (asset type
- mountain resorts; operating segment - income generating operational properties) with value as at 30 June 2017
EUR 116 million (as at 31 December 2016 EUR 116.1 million).
Biological assets
Biological assets Balance at 31 December 2016
Non-current 2,004
Current 4,193
Total biological assets as at 31 December 2016 6,197
Balance at 30 June 2017
Non-current 2,666
Current 4,850
Total biological assets as at 30 June 2017 7,516
Biological assets are measured at fair value less cost to sell. Fair value of biological assets at the end of the
reporting period is based on internal valuations performed by the Group.
Available-for-sale financial assets
30 June 2017 31 December 2016
Equity securities 487 488
Total equity investments 487 488
Debentures 111 111 Total available-for-sale financial assets (Non-current) 598 599 Debentures -- -- Total available-for-sale financial assets (Current) -- --
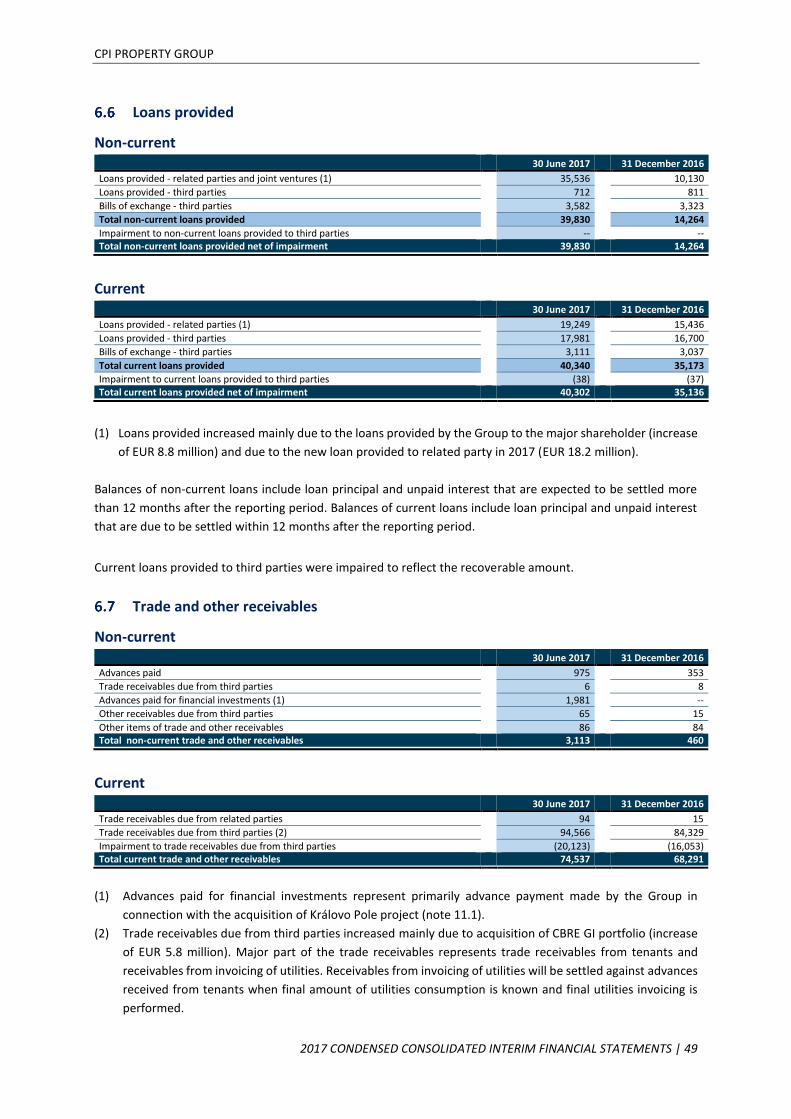
CPI PROPERTY GROUP
2017 CONDENSED CONSOLIDATED INTERIM FINANCIAL STATEMENTS | 49
Loans provided
Non-current 30 June 2017 31 December 2016
Loans provided - related parties and joint ventures (1) 35,536 10,130
Loans provided - third parties 712 811
Bills of exchange - third parties 3,582 3,323
Total non-current loans provided 39,830 14,264
Impairment to non-current loans provided to third parties -- -- Total non-current loans provided net of impairment 39,830 14,264
Current 30 June 2017 31 December 2016
Loans provided - related parties (1) 19,249 15,436
Loans provided - third parties 17,981 16,700
Bills of exchange - third parties 3,111 3,037
Total current loans provided 40,340 35,173
Impairment to current loans provided to third parties (38) (37) Total current loans provided net of impairment 40,302 35,136
(1) Loans provided increased mainly due to the loans provided by the Group to the major shareholder (increase
of EUR 8.8 million) and due to the new loan provided to related party in 2017 (EUR 18.2 million).
Balances of non-current loans include loan principal and unpaid interest that are expected to be settled more
than 12 months after the reporting period. Balances of current loans include loan principal and unpaid interest
that are due to be settled within 12 months after the reporting period.
Current loans provided to third parties were impaired to reflect the recoverable amount.
Trade and other receivables
Non-current 30 June 2017 31 December 2016
Advances paid 975 353
Trade receivables due from third parties 6 8
Advances paid for financial investments (1) 1,981 --
Other receivables due from third parties 65 15
Other items of trade and other receivables 86 84 Total non-current trade and other receivables 3,113 460
Current 30 June 2017 31 December 2016
Trade receivables due from related parties 94 15
Trade receivables due from third parties (2) 94,566 84,329
Impairment to trade receivables due from third parties (20,123) (16,053) Total current trade and other receivables 74,537 68,291
(1) Advances paid for financial investments represent primarily advance payment made by the Group in
connection with the acquisition of Královo Pole project (note 11.1).
(2) Trade receivables due from third parties increased mainly due to acquisition of CBRE GI portfolio (increase
of EUR 5.8 million). Major part of the trade receivables represents trade receivables from tenants and
receivables from invoicing of utilities. Receivables from invoicing of utilities will be settled against advances
received from tenants when final amount of utilities consumption is known and final utilities invoicing is
performed.
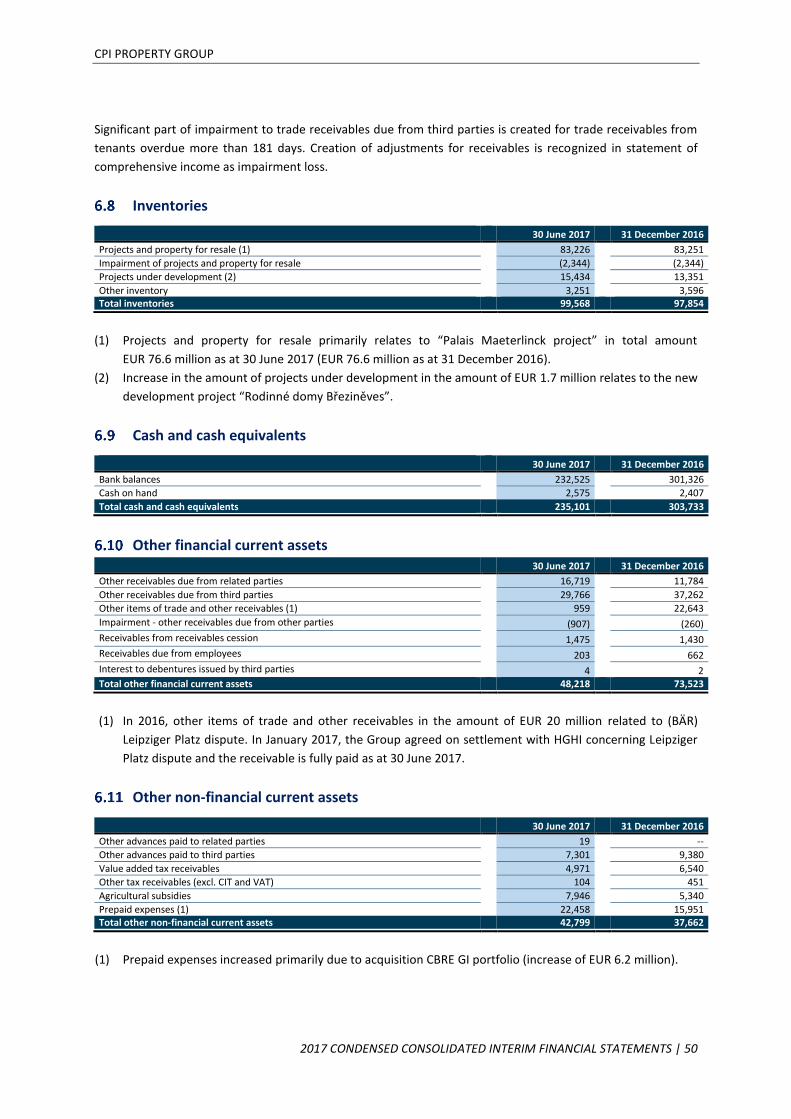
CPI PROPERTY GROUP
2017 CONDENSED CONSOLIDATED INTERIM FINANCIAL STATEMENTS | 50
Significant part of impairment to trade receivables due from third parties is created for trade receivables from
tenants overdue more than 181 days. Creation of adjustments for receivables is recognized in statement of
comprehensive income as impairment loss.
Inventories
30 June 2017 31 December 2016
Projects and property for resale (1) 83,226 83,251
Impairment of projects and property for resale (2,344) (2,344)
Projects under development (2) 15,434 13,351
Other inventory 3,251 3,596 Total inventories 99,568 97,854
(1) Projects and property for resale primarily relates to “Palais Maeterlinck project” in total amount
EUR 76.6 million as at 30 June 2017 (EUR 76.6 million as at 31 December 2016).
(2) Increase in the amount of projects under development in the amount of EUR 1.7 million relates to the new
development project “Rodinné domy Březiněves”.
Cash and cash equivalents
30 June 2017 31 December 2016
Bank balances 232,525 301,326
Cash on hand 2,575 2,407
Total cash and cash equivalents 235,101 303,733
Other financial current assets 30 June 2017 31 December 2016
Other receivables due from related parties 16,719 11,784
Other receivables due from third parties 29,766 37,262
Other items of trade and other receivables (1) 959 22,643
Impairment - other receivables due from other parties (907) (260)
Receivables from receivables cession 1,475 1,430
Receivables due from employees 203 662
Interest to debentures issued by third parties 4 2 Total other financial current assets 48,218 73,523
(1) In 2016, other items of trade and other receivables in the amount of EUR 20 million related to (BÄR)
Leipziger Platz dispute. In January 2017, the Group agreed on settlement with HGHI concerning Leipziger
Platz dispute and the receivable is fully paid as at 30 June 2017.
Other non-financial current assets
30 June 2017 31 December 2016
Other advances paid to related parties 19 --
Other advances paid to third parties 7,301 9,380
Value added tax receivables 4,971 6,540
Other tax receivables (excl. CIT and VAT) 104 451
Agricultural subsidies 7,946 5,340
Prepaid expenses (1) 22,458 15,951 Total other non-financial current assets 42,799 37,662
(1) Prepaid expenses increased primarily due to acquisition CBRE GI portfolio (increase of EUR 6.2 million).
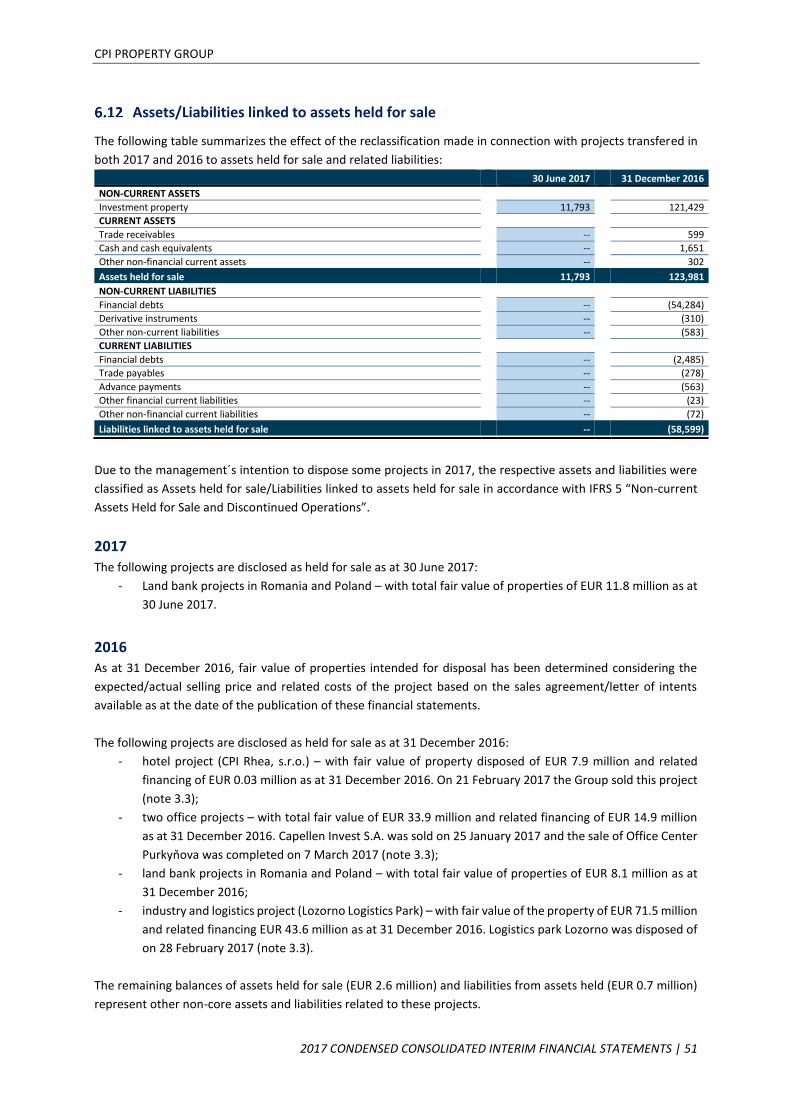
CPI PROPERTY GROUP
2017 CONDENSED CONSOLIDATED INTERIM FINANCIAL STATEMENTS | 51
Assets/Liabilities linked to assets held for sale
The following table summarizes the effect of the reclassification made in connection with projects transfered in
both 2017 and 2016 to assets held for sale and related liabilities: 30 June 2017 31 December 2016
NON-CURRENT ASSETS
Investment property
11,793
121,429
CURRENT ASSETS
Trade receivables
--
599
Cash and cash equivalents
--
1,651
Other non-financial current assets
--
302
Assets held for sale 11,793 123,981 NON-CURRENT LIABILITIES
Financial debts
--
(54,284)
Derivative instruments
--
(310)
Other non-current liabilities
--
(583)
CURRENT LIABILITIES
Financial debts
--
(2,485)
Trade payables
--
(278)
Advance payments
--
(563)
Other financial current liabilities
--
(23)
Other non-financial current liabilities
--
(72)
Liabilities linked to assets held for sale -- (58,599)
Due to the management´s intention to dispose some projects in 2017, the respective assets and liabilities were
classified as Assets held for sale/Liabilities linked to assets held for sale in accordance with IFRS 5 “Non-current
Assets Held for Sale and Discontinued Operations”.
2017
The following projects are disclosed as held for sale as at 30 June 2017:
- Land bank projects in Romania and Poland – with total fair value of properties of EUR 11.8 million as at
30 June 2017.
2016 As at 31 December 2016, fair value of properties intended for disposal has been determined considering the
expected/actual selling price and related costs of the project based on the sales agreement/letter of intents
available as at the date of the publication of these financial statements.
The following projects are disclosed as held for sale as at 31 December 2016:
- hotel project (CPI Rhea, s.r.o.) – with fair value of property disposed of EUR 7.9 million and related
financing of EUR 0.03 million as at 31 December 2016. On 21 February 2017 the Group sold this project
(note 3.3);
- two office projects – with total fair value of EUR 33.9 million and related financing of EUR 14.9 million
as at 31 December 2016. Capellen Invest S.A. was sold on 25 January 2017 and the sale of Office Center
Purkyňova was completed on 7 March 2017 (note 3.3);
- land bank projects in Romania and Poland – with total fair value of properties of EUR 8.1 million as at
31 December 2016;
- industry and logistics project (Lozorno Logistics Park) – with fair value of the property of EUR 71.5 million
and related financing EUR 43.6 million as at 31 December 2016. Logistics park Lozorno was disposed of
on 28 February 2017 (note 3.3).
The remaining balances of assets held for sale (EUR 2.6 million) and liabilities from assets held (EUR 0.7 million)
represent other non-core assets and liabilities related to these projects.

CPI PROPERTY GROUP
2017 CONDENSED CONSOLIDATED INTERIM FINANCIAL STATEMENTS | 52
Equity
Changes in equity
The condensed consolidated interim statement of changes in equity is presented on the face of the condensed
consolidated interim financial statements.
Share capital and share premium
As of 30 June 2017 the share capital of the Company amounts to EUR 831,061,784.6 and is represented by
8,310,617,846 ordinary fully paid shares with a nominal value of EUR 0.10 each.
To the best of Company’s knowledge, the following table sets out information regarding the ownership of the
Company´s shares as at 30 June 2017:
Shareholder Number of shares Share held Voting rights
Radovan Vítek and entities controlled by Mr. Vítek 7,461,043,946 89.78% 90.80%
Others 756,404,549 9.10% 9.20%
Treasury shares held by the Group 93,169,351 1.12% 0.00%
Total 8,310,617,846 100.00% 100.00%
The share premium opening balance of 2017 comprised the amount received in excess of the nominal value of the
shares issued by way of subsequent issue of ordinary shares.
Balance at 31 December 2016 Number of shares Share Capital Share premium
7,795,617,846 770,245 1,060,744 Capital increase of 30 June 2017 515,000,000 51,500 --
Balance at 30 June 2017 8,310,617,846 821,745 1,060,744
Authorized capital not issued:
The Extraordinary General Meeting (“EGM”) of the shareholders of the Company held on 26 June 2017 resolved to
modify, renew and replace the existing authorised share capital of the Company and to set it to an amount
of three billion euro (EUR 3,000,000,000) for a period of five (5) years from 26 June 2017, which would authorise
the issuance of up to twenty billion (20,000,000,000) new ordinary shares and up to ten billion (10,000,000,000)
new non-voting shares.
The EGM approved the report issued by the board of directors relating to the possibility for the board of directors
of the Company to cancel or limit preferential subscription rights of the shareholders of the Company upon
increases of share capital in the framework of the authorised share capital of the Company.
The EGM decided to introduce the possibility to create and issue up to ten billion (10,000,000,000) non-voting
shares, having a par value of ten eurocents (EUR 0.10) each, which (i) shall be entitled to receive, out of the net
profits of the Company, a preferred dividend per non-voting share amounting to six point nine percent (6.90 %) of
the subscription price of the non-voting share, the remainder of such net profits to be shared between all the
shares issued by the Company (excluding the non-voting shares), (ii) carry a right to reimbursement of the
contribution (including any premium paid) corresponding to the non-voting shares on a preferential basis out of
the net proceeds of the liquidation and (iii) be entitled to receive a preferential liquidation dividend amounting to
six point nine percent (6.90 %) of the par value of the non-voting shares in case of dissolution and liquidation of
the Company.
The EGM also decided to introduce the possibility for the board of directors of the Company to create and issue up
to ten billion (10,000,000,000) beneficiary shares without any voting rights and being under registered form only,
to be paid up by contribution in cash, in kind or in services, each beneficiary share entitling its holder to receive,
subject to the existence of distributable amounts at the level of the Company within the meaning of the law and
the decision of the general meeting of the shareholders to operate a dividend distribution to the holders of the
beneficiary shares, a dividend per beneficiary share amounting to six point nine percent (6.90 %) of the issue price
of each of the beneficiary shares per financial year of the Company. The EGM granted to the board of directors of

CPI PROPERTY GROUP
2017 CONDENSED CONSOLIDATED INTERIM FINANCIAL STATEMENTS | 53
the Company all powers to create and issue beneficiary shares with no voting rights and to further determine and
set forth the terms and conditions of such beneficiary shares with no voting rights in their respective issue
documentation.
As at 30 June 2017, the authorised share capital of the Company amounts to EUR 2,948,500,000, which would
authorize the issuance of up to 19,485,000,000 new ordinary shares and up to 10,000,000,000 new non-voting
shares in addition to the shares currently outstanding.
Share buy-back program
The Extraordinary General Meeting held on 28 August 2014 resolved to approve the terms and conditions of the
buy-back program of the Company, enabling the redemption of Company’s own shares. The Extraordinary General
Meeting authorized the Board of Directors of the Company to repurchase, in one or several steps, a maximum
number of 750,000,000 Company shares from the existing and/or future shareholders of the Company,
for a purchase price comprised in the range between one eurocent (EUR 0.01) and five euro (EUR 5) for a period of
five (5) years from the date of the Extraordinary General Meeting.
The Company is allowed to purchase another 199,298,985 pieces of its own shares from existing and/or future
shareholders until 28 August 2019.
Translation reserve The translation reserve comprises all foreign exchange differences arising from the translation of the financial
statements of foreign operations from their functional to the presentation currency.
Hedging reserve Group maintains several interest rate swaps for hedging of future interest payments on liabilities. These are swaps
where the Group pays a fixed interest rate and receives a floating rate.
Since January 2011 the Group applies hedge accounting in respect of foreign currency risks and interest rates risk
in selected subsidiaries. The hedging reserve includes effective portion of the fair value changes of hedging
instruments designated as a cash flow hedge. Ineffective portion of cash flow hedges represents part of finance
costs or income.
Other reserves Other reserves are created from other equity operations, such as scope variations or revaluation of assets
(revaluation reserve). Revaluation reserve comprises gains and losses from the revaluation of hotels (property,
plant and equipment). These reserves may not be subject to the distribution of dividends.
Retained earnings
Retained earnings are created from accumulated profits and losses and these reserves may be subject to the
distribution of dividends.

CPI PROPERTY GROUP
2017 CONDENSED CONSOLIDATED INTERIM FINANCIAL STATEMENTS | 54
Earnings per share 30 June 2017 30 June 2016
At the beginning of the period 7,702,448,495 3,303,768,300
Shares issued 7,795,617,846 3,303,768,300
Tresury shares held by the Group (93,169,351) --
Weighted average movements 515,000,000 552,407,679
Issue of new shares 515,000,000 552,407,679 Weighted average outstanding shares for the purpose of calculating the basic earnings per share 8,217,448,495 3,856,175,979
Weighted average outstanding shares for the purpose of calculating the diluted earnings per share 8,217,448,495 3,856,175,979
Net profit attributable to the Equity holders of the Company 188,748 45,171
Net profit attributable to the Equity holders of the Company after assumed conversions/exercises 188,748 45,171
Total Basic earnings in EUR per share 0.02 0.01
o/w discontinued operations -- --
Diluted earnings in EUR per share 0.02 0.01
o/w discontinued operations -- --
Basic earnings per share (EPS) is calculated by dividing the profit/(loss) attributable to the Group by the weighted
average number of ordinary shares in issue during the period, excluding ordinary shares purchased by the Group
and held as treasury shares.
Diluted earnings per share is calculated by adjusting the weighted average number of ordinary shares outstanding
to assume conversion of all dilutive potential ordinary shares.
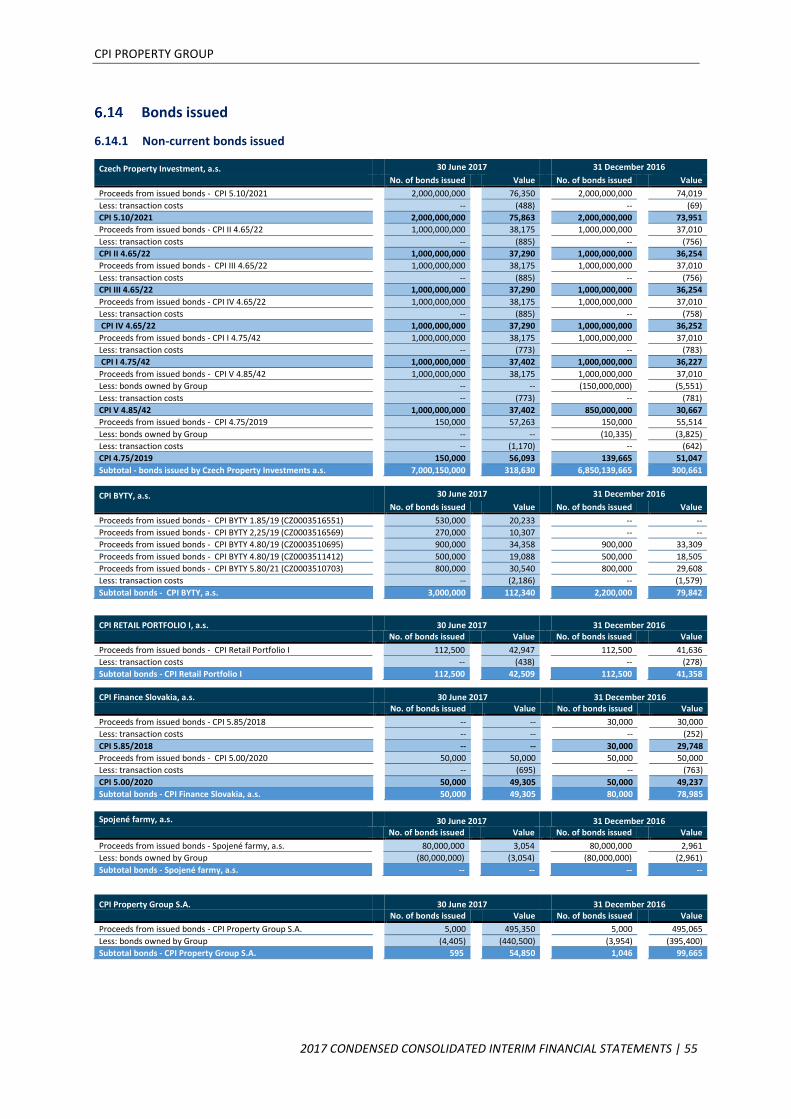
CPI PROPERTY GROUP
2017 CONDENSED CONSOLIDATED INTERIM FINANCIAL STATEMENTS | 55
Bonds issued
6.14.1 Non-current bonds issued
Czech Property Investment, a.s. 30 June 2017 31 December 2016
No. of bonds issued Value No. of bonds issued Value
Proceeds from issued bonds - CPI 5.10/2021 2,000,000,000 76,350 2,000,000,000 74,019
Less: transaction costs -- (488) -- (69)
CPI 5.10/2021 2,000,000,000 75,863 2,000,000,000 73,951
Proceeds from issued bonds - CPI II 4.65/22 1,000,000,000 38,175 1,000,000,000 37,010
Less: transaction costs -- (885) -- (756)
CPI II 4.65/22 1,000,000,000 37,290 1,000,000,000 36,254
Proceeds from issued bonds - CPI III 4.65/22 1,000,000,000 38,175 1,000,000,000 37,010
Less: transaction costs -- (885) -- (756)
CPI III 4.65/22 1,000,000,000 37,290 1,000,000,000 36,254
Proceeds from issued bonds - CPI IV 4.65/22 1,000,000,000 38,175 1,000,000,000 37,010
Less: transaction costs -- (885) -- (758)
CPI IV 4.65/22 1,000,000,000 37,290 1,000,000,000 36,252
Proceeds from issued bonds - CPI I 4.75/42 1,000,000,000 38,175 1,000,000,000 37,010
Less: transaction costs -- (773) -- (783)
CPI I 4.75/42 1,000,000,000 37,402 1,000,000,000 36,227
Proceeds from issued bonds - CPI V 4.85/42 1,000,000,000 38,175 1,000,000,000 37,010
Less: bonds owned by Group -- -- (150,000,000) (5,551)
Less: transaction costs -- (773) -- (781)
CPI V 4.85/42 1,000,000,000 37,402 850,000,000 30,667
Proceeds from issued bonds - CPI 4.75/2019 150,000 57,263 150,000 55,514
Less: bonds owned by Group -- -- (10,335) (3,825)
Less: transaction costs -- (1,170) -- (642)
CPI 4.75/2019 150,000 56,093 139,665 51,047
Subtotal - bonds issued by Czech Property Investments a.s. 7,000,150,000 318,630 6,850,139,665 300,661
CPI BYTY, a.s. 30 June 2017 31 December 2016
No. of bonds issued Value No. of bonds issued Value
Proceeds from issued bonds - CPI BYTY 1.85/19 (CZ0003516551) 530,000 20,233 -- --
Proceeds from issued bonds - CPI BYTY 2,25/19 (CZ0003516569) 270,000 10,307 -- --
Proceeds from issued bonds - CPI BYTY 4.80/19 (CZ0003510695) 900,000 34,358 900,000 33,309
Proceeds from issued bonds - CPI BYTY 4.80/19 (CZ0003511412) 500,000 19,088 500,000 18,505
Proceeds from issued bonds - CPI BYTY 5.80/21 (CZ0003510703) 800,000 30,540 800,000 29,608
Less: transaction costs -- (2,186) -- (1,579)
Subtotal bonds - CPI BYTY, a.s. 3,000,000 112,340 2,200,000 79,842
CPI RETAIL PORTFOLIO I, a.s. 30 June 2017 31 December 2016 No. of bonds issued Value No. of bonds issued Value
Proceeds from issued bonds - CPI Retail Portfolio I 112,500 42,947 112,500 41,636
Less: transaction costs -- (438) -- (278)
Subtotal bonds - CPI Retail Portfolio I 112,500 42,509 112,500 41,358
CPI Finance Slovakia, a.s. 30 June 2017 31 December 2016 No. of bonds issued Value No. of bonds issued Value
Proceeds from issued bonds - CPI 5.85/2018 -- -- 30,000 30,000
Less: transaction costs -- -- -- (252)
CPI 5.85/2018 -- -- 30,000 29,748
Proceeds from issued bonds - CPI 5.00/2020 50,000 50,000 50,000 50,000
Less: transaction costs -- (695) -- (763)
CPI 5.00/2020 50,000 49,305 50,000 49,237
Subtotal bonds - CPI Finance Slovakia, a.s. 50,000 49,305 80,000 78,985
Spojené farmy, a.s. 30 June 2017 31 December 2016 No. of bonds issued Value No. of bonds issued Value
Proceeds from issued bonds - Spojené farmy, a.s. 80,000,000 3,054 80,000,000 2,961
Less: bonds owned by Group (80,000,000) (3,054) (80,000,000) (2,961)
Subtotal bonds - Spojené farmy, a.s. -- -- -- --
CPI Property Group S.A. 30 June 2017 31 December 2016 No. of bonds issued Value No. of bonds issued Value
Proceeds from issued bonds - CPI Property Group S.A. 5,000 495,350 5,000 495,065
Less: bonds owned by Group (4,405) (440,500) (3,954) (395,400)
Subtotal bonds - CPI Property Group S.A. 595 54,850 1,046 99,665
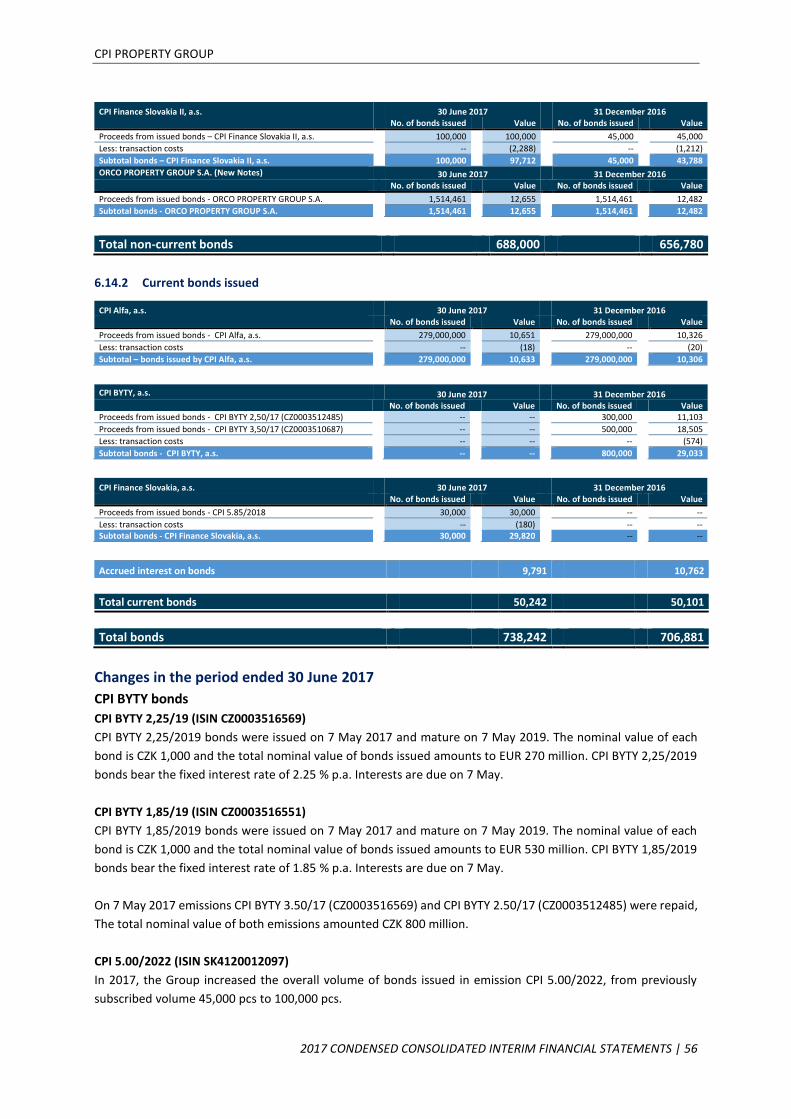
CPI PROPERTY GROUP
2017 CONDENSED CONSOLIDATED INTERIM FINANCIAL STATEMENTS | 56
CPI Finance Slovakia II, a.s. 30 June 2017 31 December 2016 No. of bonds issued Value No. of bonds issued Value
Proceeds from issued bonds – CPI Finance Slovakia II, a.s. 100,000 100,000 45,000 45,000
Less: transaction costs -- (2,288) -- (1,212)
Subtotal bonds – CPI Finance Slovakia II, a.s. 100,000 97,712 45,000 43,788
ORCO PROPERTY GROUP S.A. (New Notes) 30 June 2017 31 December 2016 No. of bonds issued Value No. of bonds issued Value
Proceeds from issued bonds - ORCO PROPERTY GROUP S.A. 1,514,461 12,655 1,514,461 12,482
Subtotal bonds - ORCO PROPERTY GROUP S.A. 1,514,461 12,655 1,514,461 12,482
Total non-current bonds 688,000 656,780
6.14.2 Current bonds issued
CPI Alfa, a.s. 30 June 2017 31 December 2016 No. of bonds issued Value No. of bonds issued Value
Proceeds from issued bonds - CPI Alfa, a.s. 279,000,000 10,651 279,000,000 10,326
Less: transaction costs -- (18) -- (20)
Subtotal – bonds issued by CPI Alfa, a.s. 279,000,000 10,633 279,000,000 10,306
CPI BYTY, a.s. 30 June 2017 31 December 2016 No. of bonds issued Value No. of bonds issued Value Proceeds from issued bonds - CPI BYTY 2,50/17 (CZ0003512485) -- -- 300,000 11,103
Proceeds from issued bonds - CPI BYTY 3,50/17 (CZ0003510687) -- -- 500,000 18,505
Less: transaction costs -- -- -- (574)
Subtotal bonds - CPI BYTY, a.s. -- -- 800,000 29,033
CPI Finance Slovakia, a.s. 30 June 2017 31 December 2016 No. of bonds issued Value No. of bonds issued Value
Proceeds from issued bonds - CPI 5.85/2018 30,000 30,000 -- --
Less: transaction costs -- (180) -- -- Subtotal bonds - CPI Finance Slovakia, a.s. 30,000 29,820 -- --
Accrued interest on bonds 9,791 10,762
Total current bonds 50,242 50,101
Total bonds 738,242 706,881
Changes in the period ended 30 June 2017
CPI BYTY bonds
CPI BYTY 2,25/19 (ISIN CZ0003516569)
CPI BYTY 2,25/2019 bonds were issued on 7 May 2017 and mature on 7 May 2019. The nominal value of each
bond is CZK 1,000 and the total nominal value of bonds issued amounts to EUR 270 million. CPI BYTY 2,25/2019
bonds bear the fixed interest rate of 2.25 % p.a. Interests are due on 7 May.
CPI BYTY 1,85/19 (ISIN CZ0003516551)
CPI BYTY 1,85/2019 bonds were issued on 7 May 2017 and mature on 7 May 2019. The nominal value of each
bond is CZK 1,000 and the total nominal value of bonds issued amounts to EUR 530 million. CPI BYTY 1,85/2019
bonds bear the fixed interest rate of 1.85 % p.a. Interests are due on 7 May.
On 7 May 2017 emissions CPI BYTY 3.50/17 (CZ0003516569) and CPI BYTY 2.50/17 (CZ0003512485) were repaid,
The total nominal value of both emissions amounted CZK 800 million.
CPI 5.00/2022 (ISIN SK4120012097)
In 2017, the Group increased the overall volume of bonds issued in emission CPI 5.00/2022, from previously
subscribed volume 45,000 pcs to 100,000 pcs.
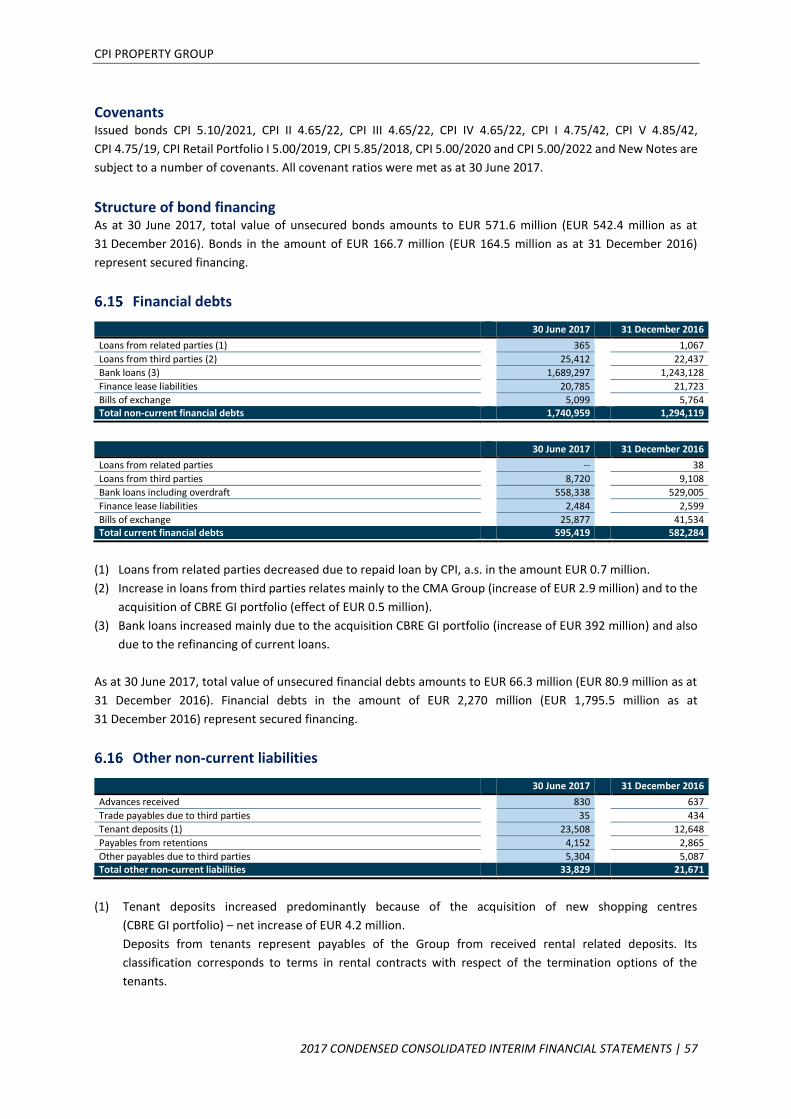
CPI PROPERTY GROUP
2017 CONDENSED CONSOLIDATED INTERIM FINANCIAL STATEMENTS | 57
Covenants Issued bonds CPI 5.10/2021, CPI II 4.65/22, CPI III 4.65/22, CPI IV 4.65/22, CPI I 4.75/42, CPI V 4.85/42,
CPI 4.75/19, CPI Retail Portfolio I 5.00/2019, CPI 5.85/2018, CPI 5.00/2020 and CPI 5.00/2022 and New Notes are
subject to a number of covenants. All covenant ratios were met as at 30 June 2017.
Structure of bond financing As at 30 June 2017, total value of unsecured bonds amounts to EUR 571.6 million (EUR 542.4 million as at
31 December 2016). Bonds in the amount of EUR 166.7 million (EUR 164.5 million as at 31 December 2016)
represent secured financing.
Financial debts
30 June 2017 31 December 2016
Loans from related parties (1) 365 1,067
Loans from third parties (2) 25,412 22,437
Bank loans (3) 1,689,297 1,243,128
Finance lease liabilities 20,785 21,723
Bills of exchange 5,099 5,764 Total non-current financial debts 1,740,959 1,294,119
30 June 2017 31 December 2016
Loans from related parties -- 38
Loans from third parties 8,720 9,108
Bank loans including overdraft 558,338 529,005
Finance lease liabilities 2,484 2,599
Bills of exchange 25,877 41,534 Total current financial debts 595,419 582,284
(1) Loans from related parties decreased due to repaid loan by CPI, a.s. in the amount EUR 0.7 million.
(2) Increase in loans from third parties relates mainly to the CMA Group (increase of EUR 2.9 million) and to the
acquisition of CBRE GI portfolio (effect of EUR 0.5 million).
(3) Bank loans increased mainly due to the acquisition CBRE GI portfolio (increase of EUR 392 million) and also
due to the refinancing of current loans.
As at 30 June 2017, total value of unsecured financial debts amounts to EUR 66.3 million (EUR 80.9 million as at
31 December 2016). Financial debts in the amount of EUR 2,270 million (EUR 1,795.5 million as at
31 December 2016) represent secured financing.
Other non-current liabilities
30 June 2017 31 December 2016
Advances received 830 637
Trade payables due to third parties 35 434
Tenant deposits (1) 23,508 12,648
Payables from retentions 4,152 2,865
Other payables due to third parties 5,304 5,087 Total other non-current liabilities 33,829 21,671
(1) Tenant deposits increased predominantly because of the acquisition of new shopping centres
(CBRE GI portfolio) – net increase of EUR 4.2 million.
Deposits from tenants represent payables of the Group from received rental related deposits. Its
classification corresponds to terms in rental contracts with respect of the termination options of the
tenants.

CPI PROPERTY GROUP
2017 CONDENSED CONSOLIDATED INTERIM FINANCIAL STATEMENTS | 58
Trade payables
Advance payments
30 June 2017 31 December 2016
Advances received from related parties (1) -- 24,500
Advances received from third parties 43,719 34,764
Tenant deposits (2) 13,174 13,438 Total advance payments 56,893 72,702
(1) Decrease in advances received from related parties relates to the repayment of advance received in 2016
from a major shareholder (amount of EUR 24.5 million).
(2) Advances received from tenants represented payments received from tenants for utilities that will be
settled against trade receivables when final amount of utilities consumption is known and final respective
invoicing is performed.
Other financial current liabilities
30 June 2017 31 December 2016
Deferred income/revenue and accrued liabilities (1) 14,273 7,076
Other payables due to related parties 1,110 1,222
Other payables due to third parties 22,000 16,096 Total other financial current liabilities 37,383 24,394
(1) The main increase in deferred income/revenue relates to the acquisition of CBRE GI portfolio (increase of
EUR 6.1 million).
Other non-financial current liabilities
30 June 2017 31 December 2016
Current income tax liabilities 9,493 8,505
Value added tax payables 7,693 6,008
Other tax payables (excl. CIT and VAT) 1,168 824
Payables due to employees, SHI, employees income tax 6,355 5,252
Provisions 3,626 2,891
Liabilities from grants (1) 3,878 -- Total other non-financial current liabilities 32,212 23,480
(1) Liabilities from grants relates to Mercuda, a.s. (Spojené farmy a.s.) in the amount of EUR 3.9 million.
30 June 2017 31 December 2016
Trade payables due to related parties 267 319
Trade payables due to third parties 65,208 65,399 Total trade payables 65,475 65,718

CPI PROPERTY GROUP
2017 CONDENSED CONSOLIDATED INTERIM FINANCIAL STATEMENTS | 59
7 Fair value measurement Fair value of financial instruments
Fair value measurements of financial instruments reported at fair value are classified by level of the following
measurement hierarchy:
• Level 1: Quoted prices (unadjusted) in active markets for identical assets or liabilities;
• Level 2: Inputs other than quoted prices that are observable for the asset or liability, either directly
(that is, as prices) or indirectly (that is, derived from prices);
• Level 3: Inputs for the asset or liability that are not based on observable market data (that is,
unobservable inputs).
The fair value of financial instruments traded in active markets (such as publicly traded derivatives, trading
securities and financial assets at fair value through profit or loss) is based on quoted market prices at the
reporting date. The fair value of financial instruments that are not traded in an active market is determined by
using valuation techniques. The Group is using a variety of methods and makes assumptions that are based on
market conditions existing at each reporting date. Quoted market prices or dealer quotes for similar instruments
are used for long-term debt. Other techniques, such as estimated discounted cash flows, are used to determine
fair value for the remaining financial instruments. The fair value of interest rate swaps is calculated as the present
value of the estimated future cash flows.
Valuations are performed regularly on the basis of the management best estimates of the credit risk of the Group
or of the specific entity concerned in the light of existing, available and observable market data:
• for the derivatives (interest rate swaps, options and forwards) the valuation is provided by the Group’s
banks;
• for the available-for-sale financial assets and for the bonds, the fair values as of 30 June 2017 have
been determined in accordance with generally accepted pricing models based on the discounted cash
flow analysis, with the most significant inputs being the discount rate that reflects the credit risk of
counterparties.
The fair value of financial instruments reflects, inter alia, current market conditions (interest rates, volatility and
share price). Changes in fair values are recorded in the consolidated income statement under the “other net
financial results” line.

CPI PROPERTY GROUP
2017 CONDENSED CONSOLIDATED INTERIM FINANCIAL STATEMENTS | 60
Accounting classification and fair values
The following tables show the carrying amounts at fair value of financial assets and liabilities, including their level
in the fair value hierarchy. It does not include fair value information for financial assets and financial liabilities
not measured at fair value if the carrying amount is a reasonable approximation of fair value.
Carrying amount Fair value
30 June 2017
Financial assets &
liabilities measured
at fair value
Financial assets &
liabilities not
measured at fair value
(*)
Level 1 Level 2 Level 3
FINANCIAL ASSETS
Long-term Equity investments -- 487 487 -- --
Debentures issued by third parties -- 111 111 -- --
Financial assets available-for-sale -- 598 -- -- --
Advances paid -- 2,956 -- -- --
Derivative instruments 535 -- -- 535 --
Loans provided -- 36,248 -- -- 36,248
Bills of exchange -- 3,582 -- -- 3,582
Other non-current receivables -- 157 -- -- 157
Non-current loans and receivables 535 42,943 -- -- --
Trade and other receivables -- 74,537 -- -- --
Derivative instruments 56 -- -- 56 --
Loans provided -- 37,192 -- -- 39,311
Bills of exchange -- 3,111 -- -- 3,214
Other current financial assets -- 48,218 -- -- --
Cash and cash equivalent -- 235,101 -- -- --
Current financial assets 56 398,159 -- -- -- FINANCIAL LIABILITIES
Bonds -- 688,000 714,958 -- --
Financial debt (floating rate bank debts) -- 1,656,047 -- -- 1,656,047
Financial debt (fixed rate bank debts) -- 33,250 -- -- 34,547
Financial debt (other borrowings) -- 51,662 -- -- 43,083
Derivative instruments 5,845 -- -- 5,845 --
Long term liabilities -- 33,829 -- -- --
Non-current financial liabilities 5,845 2,462,788 -- -- --
Bonds -- 40,453** 41,101 -- --
Financial debt (floating rate bank debts) -- 555,814 -- -- 555,814
Financial debt (fixed rate bank debts) -- 2,524 -- -- 3,464
Financial debt (other borrowings) -- 37,081 -- -- 37,030
Derivates instruments 1,979 -- -- 1,979 --
Advanced payments -- 56,893 -- -- --
Trade payables -- 65,475 -- -- --
Other financial current liabilities -- 37,383 -- -- --
Liabilities linked to assets held for sale -- -- -- -- --
Current financial liabilities 1,979 795,623 -- -- --
(*) It does not include fair value information for financial assets and liabilities not measured at fair value if the carry amount is a reasonable approximation of
the fair value.
(**) Accrued interest is not included.
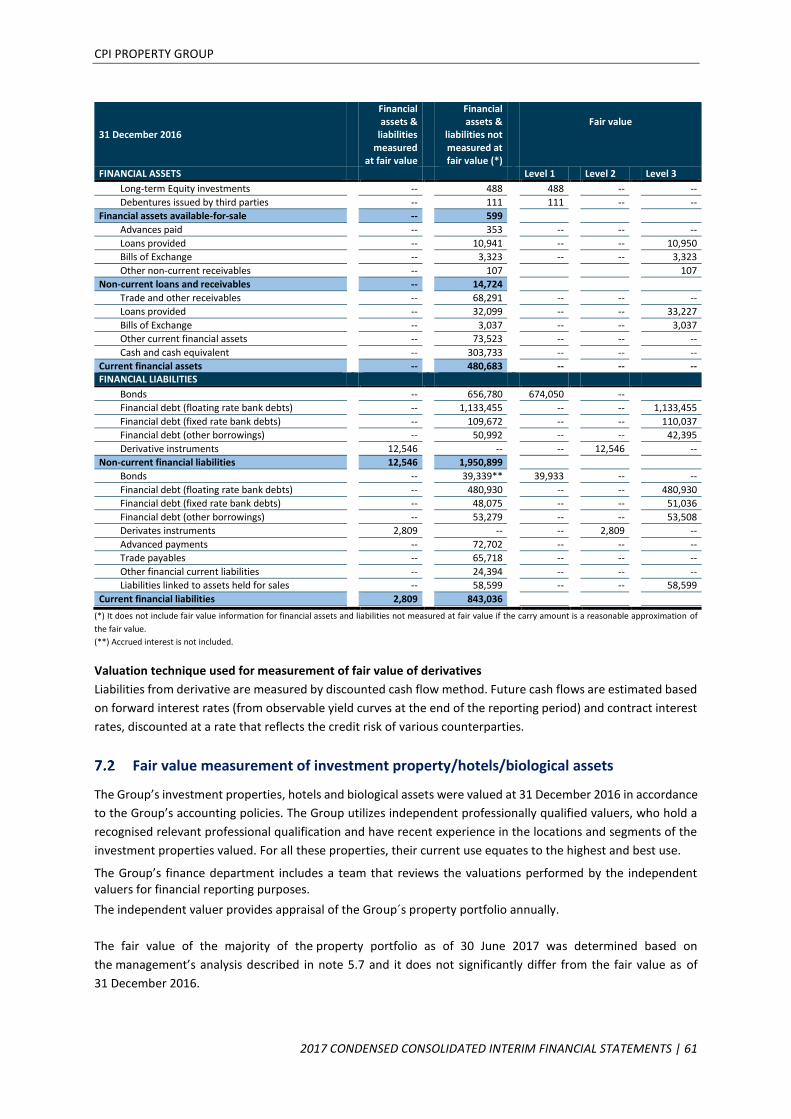
CPI PROPERTY GROUP
2017 CONDENSED CONSOLIDATED INTERIM FINANCIAL STATEMENTS | 61
31 December 2016
Financial assets &
liabilities measured
at fair value
Financial assets &
liabilities not measured at fair value (*)
Fair value
FINANCIAL ASSETS Level 1 Level 2 Level 3
Long-term Equity investments -- 488 488 -- --
Debentures issued by third parties -- 111 111 -- --
Financial assets available-for-sale -- 599 Advances paid -- 353 -- -- --
Loans provided -- 10,941 -- -- 10,950
Bills of Exchange -- 3,323 -- -- 3,323
Other non-current receivables -- 107 107
Non-current loans and receivables -- 14,724 Trade and other receivables -- 68,291 -- -- --
Loans provided -- 32,099 -- -- 33,227
Bills of Exchange -- 3,037 -- -- 3,037
Other current financial assets -- 73,523 -- -- --
Cash and cash equivalent -- 303,733 -- -- --
Current financial assets -- 480,683 -- -- -- FINANCIAL LIABILITIES
Bonds -- 656,780 674,050 -- Financial debt (floating rate bank debts) -- 1,133,455 -- -- 1,133,455
Financial debt (fixed rate bank debts) -- 109,672 -- -- 110,037
Financial debt (other borrowings) -- 50,992 -- -- 42,395
Derivative instruments 12,546 -- -- 12,546 --
Non-current financial liabilities 12,546 1,950,899 Bonds -- 39,339** 39,933 -- --
Financial debt (floating rate bank debts) -- 480,930 -- -- 480,930
Financial debt (fixed rate bank debts) -- 48,075 -- -- 51,036
Financial debt (other borrowings) -- 53,279 -- -- 53,508
Derivates instruments 2,809 -- -- 2,809 --
Advanced payments -- 72,702 -- -- --
Trade payables -- 65,718 -- -- --
Other financial current liabilities -- 24,394 -- -- --
Liabilities linked to assets held for sales -- 58,599 -- -- 58,599
Current financial liabilities 2,809 843,036 (*) It does not include fair value information for financial assets and liabilities not measured at fair value if the carry amount is a reasonable approximation of
the fair value.
(**) Accrued interest is not included.
Valuation technique used for measurement of fair value of derivatives
Liabilities from derivative are measured by discounted cash flow method. Future cash flows are estimated based
on forward interest rates (from observable yield curves at the end of the reporting period) and contract interest
rates, discounted at a rate that reflects the credit risk of various counterparties.
Fair value measurement of investment property/hotels/biological assets
The Group’s investment properties, hotels and biological assets were valued at 31 December 2016 in accordance
to the Group’s accounting policies. The Group utilizes independent professionally qualified valuers, who hold a
recognised relevant professional qualification and have recent experience in the locations and segments of the
investment properties valued. For all these properties, their current use equates to the highest and best use.
The Group’s finance department includes a team that reviews the valuations performed by the independent valuers for financial reporting purposes.
The independent valuer provides appraisal of the Group´s property portfolio annually.
The fair value of the majority of the property portfolio as of 30 June 2017 was determined based on
the management’s analysis described in note 5.7 and it does not significantly differ from the fair value as of
31 December 2016.
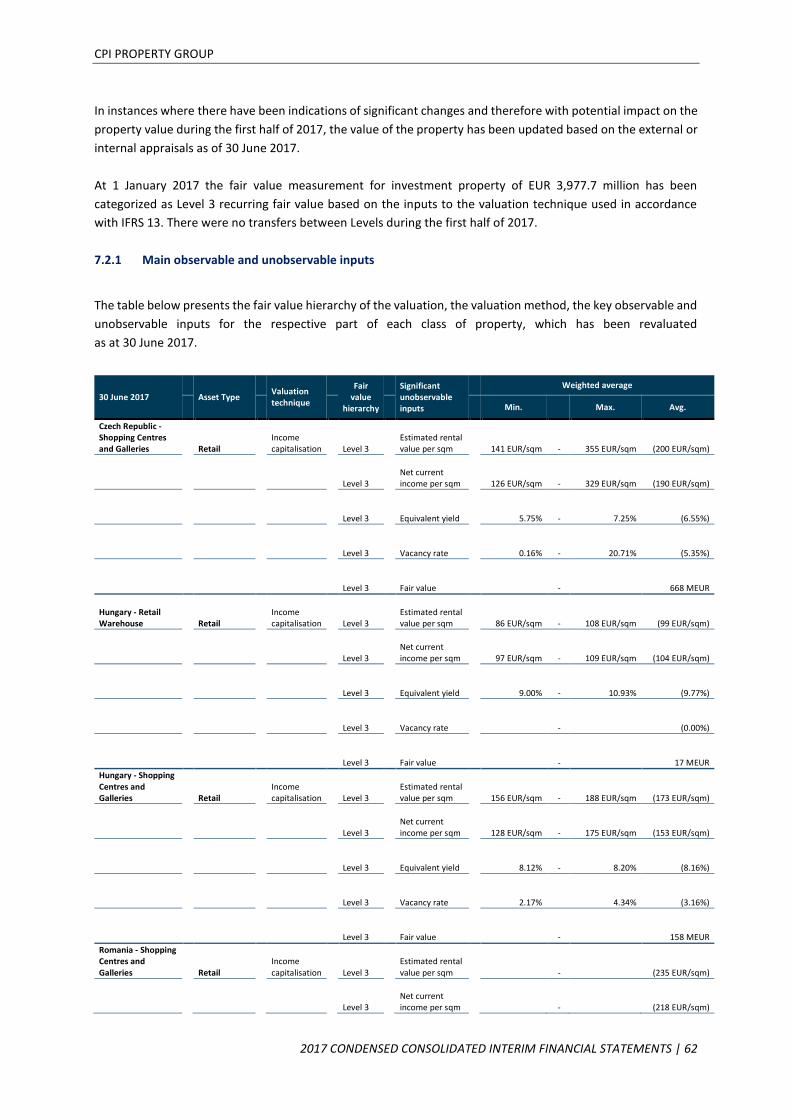
CPI PROPERTY GROUP
2017 CONDENSED CONSOLIDATED INTERIM FINANCIAL STATEMENTS | 62
In instances where there have been indications of significant changes and therefore with potential impact on the
property value during the first half of 2017, the value of the property has been updated based on the external or
internal appraisals as of 30 June 2017.
At 1 January 2017 the fair value measurement for investment property of EUR 3,977.7 million has been
categorized as Level 3 recurring fair value based on the inputs to the valuation technique used in accordance
with IFRS 13. There were no transfers between Levels during the first half of 2017.
7.2.1 Main observable and unobservable inputs
The table below presents the fair value hierarchy of the valuation, the valuation method, the key observable and
unobservable inputs for the respective part of each class of property, which has been revaluated
as at 30 June 2017.
30 June 2017
Asset Type
Valuation technique
Fair value
hierarchy
Significant unobservable inputs
Weighted average
Min. Max. Avg.
Czech Republic - Shopping Centres and Galleries Retail
Income capitalisation Level 3
Estimated rental value per sqm 141 EUR/sqm - 355 EUR/sqm (200 EUR/sqm)
Czech Republic - Shopping Centres and Galleries Retail
Income capitalisation Level 3
Net current income per sqm 126 EUR/sqm - 329 EUR/sqm (190 EUR/sqm)
Czech Republic - Shopping Centres and Galleries Retail
Income capitalisation Level 3 Equivalent yield 5.75% - 7.25% (6.55%)
Level 3 Vacancy rate 0.16% - 20.71% (5.35%)
Czech Republic - Shopping Centres and Galleries Retail
Income capitalisation Level 3 Fair value - 668 MEUR
Hungary - Retail Warehouse Retail
Income capitalisation Level 3
Estimated rental value per sqm 86 EUR/sqm - 108 EUR/sqm (99 EUR/sqm)
Hungary - Retail Warehouse Retail
Income capitalisation Level 3
Net current income per sqm 97 EUR/sqm - 109 EUR/sqm (104 EUR/sqm)
Hungary - Retail Warehouse Retail
Income capitalisation Level 3 Equivalent yield 9.00% - 10.93% (9.77%)
Level 3 Vacancy rate - (0.00%)
Hungary - Retail Warehouse Retail
Income capitalisation Level 3 Fair value - 17 MEUR
Hungary - Shopping Centres and Galleries Retail
Income capitalisation Level 3
Estimated rental value per sqm 156 EUR/sqm - 188 EUR/sqm (173 EUR/sqm)
Hungary - Shopping Centres and Galleries Retail
Income capitalisation Level 3
Net current income per sqm 128 EUR/sqm - 175 EUR/sqm (153 EUR/sqm)
Hungary - Shopping Centres and Galleries Retail
Income capitalisation Level 3 Equivalent yield 8.12% - 8.20% (8.16%)
Level 3 Vacancy rate 2.17% 4.34% (3.16%)
Hungary - Shopping Centres and Galleries Retail
Income capitalisation Level 3 Fair value - 158 MEUR
Romania - Shopping Centres and Galleries Retail
Income capitalisation Level 3
Estimated rental value per sqm - (235 EUR/sqm)
Poland - Retail Warehouse Retail
Income capitalisation Level 3
Net current income per sqm - (218 EUR/sqm)

CPI PROPERTY GROUP
2017 CONDENSED CONSOLIDATED INTERIM FINANCIAL STATEMENTS | 63
30 June 2017
Asset Type
Valuation technique
Fair value
hierarchy
Significant unobservable inputs
Weighted average
Min. Max. Avg.
Poland - Retail Warehouse Retail
Income capitalisation Level 3 Equivalent yield - (9.25%)
Level 3 Vacancy rate - (9.26%)
Poland - Retail Warehouse Retail
Income capitalisation Level 3 Fair value - 31 MEUR
Poland - Shopping Centres and Galleries Retail
Income capitalisation Level 3
Estimated rental value per sqm - (181 EUR/sqm)
Poland - Shopping Centres and Galleries Retail
Income capitalisation Level 3 Equivalent yield - (6.74%)
Level 3 Vacancy rate - (3.37%)
Poland - Shopping Centres and Galleries Retail
Income capitalisation Level 3 Fair value - 119 MEUR
Remaining part Retail Fair value - 791 MEUR
Czech Republic Office Income capitalisation Level 3
Estimated rental value per sqm 128 EUR/sqm - 227 EUR/sqm (174 EUR/sqm)
Czech Republic Office
Income capitalisation Level 3
Net current income per sqm 97 EUR/sqm - 211 EUR/sqm (128 EUR/sqm)
Czech Republic Office
Income capitalisation Level 3 Equivalent yield 5.75% - 8.50% (6.57%)
Level 3 Vacancy rate 3.16% - 4.30% (2.35%)
Czech Republic Office Income capitalisation Level 3 Fair value - 109 MEUR
Hungary Office
Income capitalisation Level 3
Estimated rental value per sqm - (181 EUR/sqm)
Hungary Office
Income capitalisation Level 3
Net current income per sqm - (164 EUR/sqm)
Hungary Office
Income capitalisation Level 3 Equivalent yield - (7.29%)
Level 3 Vacancy rate - (8.12%)
Hungary Office Income capitalisation Level 3 Fair value - 19 MEUR
Remaining part Office Fair value 1,933 MEUR
Czech Republic Residential Comparable Level 3 Fair value per sqm 12 EUR/sqm - 1,988 EUR/sqm (701 EUR/sqm)
Level 3 Fair value 343 MEUR
Remaining part Residential Fair value 114 MEUR
Czech Republic Land Bank Comparable Level 3 Fair value per sqm 144 EUR/sqm - 3,021 EUR/sqm
(2,539 EUR/sqm)
Level 3 Fair value - 138 MEUR
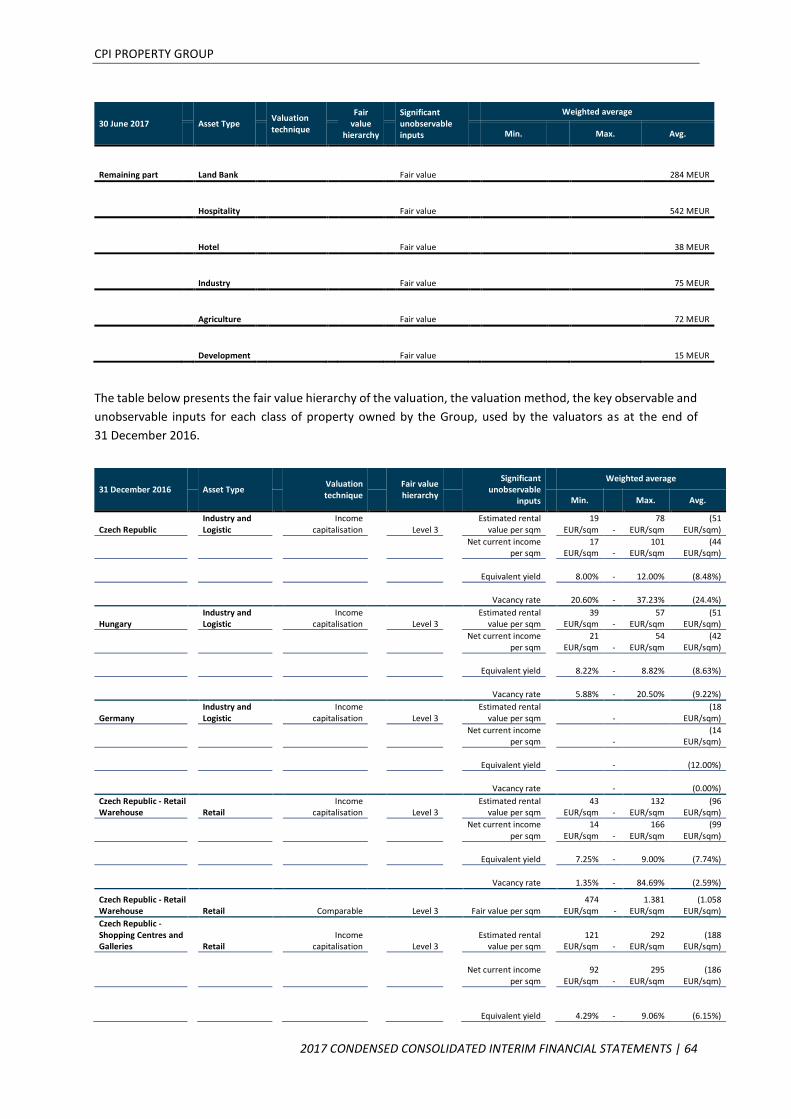
CPI PROPERTY GROUP
2017 CONDENSED CONSOLIDATED INTERIM FINANCIAL STATEMENTS | 64
30 June 2017
Asset Type
Valuation technique
Fair value
hierarchy
Significant unobservable inputs
Weighted average
Min. Max. Avg.
Remaining part Land Bank Fair value 284 MEUR
Hospitality Fair value 542 MEUR
Hotel Fair value 38 MEUR
Industry Fair value 75 MEUR
Agriculture Fair value 72 MEUR
Development Fair value 15 MEUR
The table below presents the fair value hierarchy of the valuation, the valuation method, the key observable and
unobservable inputs for each class of property owned by the Group, used by the valuators as at the end of
31 December 2016.
31 December 2016
Asset Type
Valuation technique
Fair value hierarchy
Significant unobservable
inputs
Weighted average
Min. Max. Avg.
Czech Republic Industry and Logistic
Income capitalisation Level 3
Estimated rental value per sqm
19 EUR/sqm -
78 EUR/sqm
(51 EUR/sqm)
Czech Republic
Industry and Logistic
Income capitalisation
Net current income per sqm
17 EUR/sqm -
101 EUR/sqm
(44 EUR/sqm)
Czech Republic
Industry and Logistic
Income capitalisation Equivalent yield 8.00% - 12.00% (8.48%)
Czech Republic Industry and Logistic
Income capitalisation Vacancy rate 20.60% - 37.23% (24.4%)
Hungary
Industry and Logistic
Income capitalisation Level 3
Estimated rental value per sqm
39 EUR/sqm -
57 EUR/sqm
(51 EUR/sqm)
Hungary
Industry and Logistic
Income capitalisation
Net current income per sqm
21 EUR/sqm -
54 EUR/sqm
(42 EUR/sqm)
Hungary
Industry and Logistic
Income capitalisation Equivalent yield 8.22% - 8.82% (8.63%)
Hungary Industry and Logistic
Income capitalisation Vacancy rate 5.88% - 20.50% (9.22%)
Germany
Industry and Logistic
Income capitalisation Level 3
Estimated rental value per sqm -
(18 EUR/sqm)
Germany
Industry and Logistic
Income capitalisation
Net current income per sqm -
(14 EUR/sqm)
Germany
Industry and Logistic
Income capitalisation Equivalent yield - (12.00%)
Germany Industry and Logistic
Income capitalisation Vacancy rate - (0.00%)
Czech Republic - Retail Warehouse Retail
Income capitalisation Level 3
Estimated rental value per sqm
43 EUR/sqm -
132 EUR/sqm
(96 EUR/sqm)
Czech Republic - Retail Warehouse Retail
Income capitalisation
Net current income per sqm
14 EUR/sqm -
166 EUR/sqm
(99 EUR/sqm)
Czech Republic - Retail Warehouse Retail
Income capitalisation Equivalent yield 7.25% - 9.00% (7.74%)
Czech Republic - Retail Warehouse Retail
Income capitalisation Vacancy rate 1.35% - 84.69% (2.59%)
Czech Republic - Retail Warehouse Retail Comparable Level 3 Fair value per sqm
474 EUR/sqm -
1.381 EUR/sqm
(1.058 EUR/sqm)
Czech Republic - Shopping Centres and Galleries Retail
Income capitalisation Level 3
Estimated rental value per sqm
121 EUR/sqm -
292 EUR/sqm
(188 EUR/sqm)
Czech Republic - Shopping Centres and Galleries Retail
Income capitalisation
Net current income per sqm
92 EUR/sqm -
295 EUR/sqm
(186 EUR/sqm)
Czech Republic - Shopping Centres and Galleries Retail
Income capitalisation Equivalent yield 4.29% - 9.06% (6.15%)
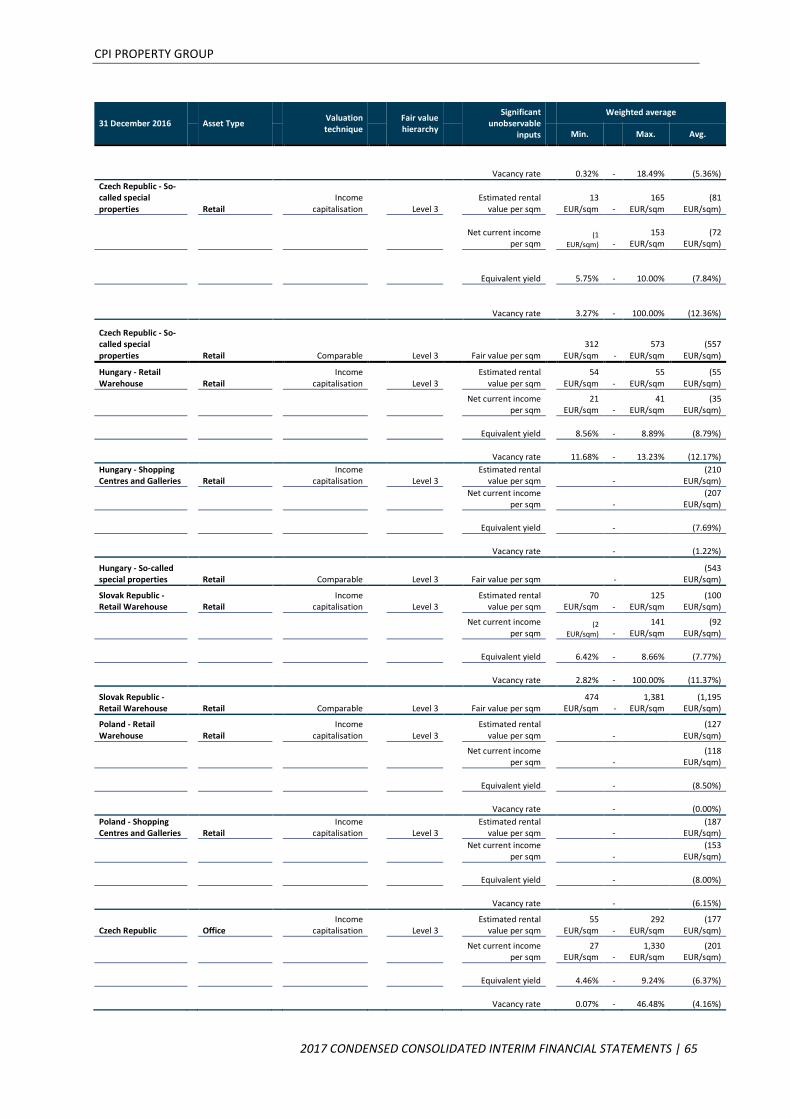
CPI PROPERTY GROUP
2017 CONDENSED CONSOLIDATED INTERIM FINANCIAL STATEMENTS | 65
31 December 2016
Asset Type
Valuation technique
Fair value hierarchy
Significant unobservable
inputs
Weighted average
Min. Max. Avg.
Czech Republic - Shopping Centres and Galleries Retail
Income capitalisation Vacancy rate 0.32% - 18.49% (5.36%)
Czech Republic - So-called special properties Retail
Income capitalisation Level 3
Estimated rental value per sqm
13 EUR/sqm -
165 EUR/sqm
(81 EUR/sqm)
Czech Republic - So-called special properties Retail
Income capitalisation
Net current income per sqm
(1 EUR/sqm) -
153 EUR/sqm
(72 EUR/sqm)
Czech Republic - So-called special properties Retail
Income capitalisation Equivalent yield 5.75% - 10.00% (7.84%)
Czech Republic - So-called special properties Retail
Income capitalisation Vacancy rate 3.27% - 100.00% (12.36%)
Czech Republic - So-called special properties Retail Comparable Level 3 Fair value per sqm
312 EUR/sqm -
573 EUR/sqm
(557 EUR/sqm)
Hungary - Retail Warehouse Retail
Income capitalisation Level 3
Estimated rental value per sqm
54 EUR/sqm -
55 EUR/sqm
(55 EUR/sqm)
Hungary - Retail Warehouse Retail
Income capitalisation
Net current income per sqm
21 EUR/sqm -
41 EUR/sqm
(35 EUR/sqm)
Hungary - Retail Warehouse Retail
Income capitalisation Equivalent yield 8.56% - 8.89% (8.79%)
Hungary - Retail Warehouse Retail
Income capitalisation Vacancy rate 11.68% - 13.23% (12.17%)
Hungary - Shopping Centres and Galleries Retail
Income capitalisation Level 3
Estimated rental value per sqm -
(210 EUR/sqm)
Hungary - Shopping Centres and Galleries Retail
Income capitalisation
Net current income per sqm -
(207 EUR/sqm)
Hungary - Shopping Centres and Galleries Retail
Income capitalisation Equivalent yield - (7.69%)
Hungary - Shopping Centres and Galleries Retail
Income capitalisation Vacancy rate - (1.22%)
Hungary - So-called special properties Retail Comparable Level 3 Fair value per sqm -
(543 EUR/sqm)
Slovak Republic - Retail Warehouse Retail
Income capitalisation Level 3
Estimated rental value per sqm
70 EUR/sqm -
125 EUR/sqm
(100 EUR/sqm)
Slovak Republic - Retail Warehouse Retail
Income capitalisation
Net current income per sqm
(2 EUR/sqm) -
141 EUR/sqm
(92 EUR/sqm)
Slovak Republic - Retail Warehouse Retail
Income capitalisation Equivalent yield 6.42% - 8.66% (7.77%)
Slovak Republic - Retail Warehouse Retail
Income capitalisation Vacancy rate 2.82% - 100.00% (11.37%)
Slovak Republic - Retail Warehouse Retail Comparable Level 3 Fair value per sqm
474 EUR/sqm -
1,381 EUR/sqm
(1,195 EUR/sqm)
Poland - Retail Warehouse Retail
Income capitalisation Level 3
Estimated rental value per sqm -
(127 EUR/sqm)
Poland - Retail Warehouse Retail
Income capitalisation
Net current income per sqm -
(118 EUR/sqm)
Poland - Retail Warehouse Retail
Income capitalisation Equivalent yield - (8.50%)
Poland - Retail Warehouse Retail
Income capitalisation Vacancy rate - (0.00%)
Poland - Shopping Centres and Galleries Retail
Income capitalisation Level 3
Estimated rental value per sqm -
(187 EUR/sqm)
Poland - Shopping Centres and Galleries Retail
Income capitalisation
Net current income per sqm -
(153 EUR/sqm)
Poland - Shopping Centres and Galleries Retail
Income capitalisation Equivalent yield - (8.00%)
Poland - Shopping Centres and Galleries Retail
Income capitalisation Vacancy rate - (6.15%)
Czech Republic Office
Income capitalisation Level 3
Estimated rental value per sqm
55 EUR/sqm -
292 EUR/sqm
(177 EUR/sqm)
Czech Republic Office
Income capitalisation
Net current income per sqm
27 EUR/sqm -
1,330 EUR/sqm
(201 EUR/sqm)
Czech Republic Office
Income capitalisation Equivalent yield 4.46% - 9.24% (6.37%)
Czech Republic Office Income
capitalisation Vacancy rate 0.07% - 46.48% (4.16%)

CPI PROPERTY GROUP
2017 CONDENSED CONSOLIDATED INTERIM FINANCIAL STATEMENTS | 66
31 December 2016
Asset Type
Valuation technique
Fair value hierarchy
Significant unobservable
inputs
Weighted average
Min. Max. Avg.
Germany Office Income
capitalisation Level 3
Estimated rental value per sqm
42 EUR/sqm -
155 EUR/sqm
(83 EUR/sqm)
Germany Office Income
capitalisation
Gross current income per sqm
28 EUR/sqm -
154 EUR/sqm
(74 EUR/sqm)
Germany Office Income
capitalisation Equivalent yield 4.25% - 6.25% (5.38%)
Germany Office Income
capitalisation Vacancy rate 0.94% - 51.90% (11.28%)
Hungary Office
Income capitalisation Level 3
Estimated rental value per sqm
89 EUR/sqm -
297 EUR/sqm
(146 EUR/sqm)
Hungary Office
Income capitalisation
Net current income per sqm
25 EUR/sqm -
140 EUR/sqm
(122 EUR/sqm)
Hungary Office
Income capitalisation Equivalent yield 7.62% - 13.30% (8.20%)
Hungary Office Income
capitalisation Vacancy rate 0.00% - 77.13% (16.41%)
Hungary Office Comparable Level 3 Fair value per sqm -
(1.268 EUR/sqm)
Poland Office
Income capitalisation Level 3
Estimated rental value per sqm
153 EUR/sqm -
241 EUR/sqm
(213 EUR/sqm)
Poland Office
Income capitalisation
Net current income per sqm
98 EUR/sqm -
234 EUR/sqm
(183 EUR/sqm)
Poland Office
Income capitalisation Equivalent yield 6.50% - 8.75% (8.41%)
Poland Office Income
capitalisation Vacancy rate 5.38% - 21.08% (9.27%)
Slovak Republic Office
Income capitalisation Level 3
Estimated rental value per sqm -
(148 EUR/sqm)
Slovak Republic Office
Income capitalisation
Net current income per sqm -
(89 EUR/sqm)
Slovak Republic Office
Income capitalisation Equivalent yield - (8.33%)
Slovak Republic Office Income
capitalisation Vacancy rate - (39.01%)
Czech Republic Residential Comparable Level 3 Fair value per sqm 1,755
EUR/sqm - 4,033
EUR/sqm (2,038
EUR/sqm)
Czech Republic Residential DCF Level 3
Estimated rental value per sqm
19 EUR/sqm -
59 EUR/sqm
(35 EUR/sqm)
Czech Republic Residential DCF
Net current income per sqm
12 EUR/sqm -
52 EUR/sqm
(28 EUR/sqm)
Czech Republic Residential DCF Exit yield 3.60% - 9.50% (6.65%)
Czech Republic Residential DCF Vacancy rate 2.03% - 45.23% (15.79%)
Czech Republic Residential DCF Discount rate 4.35% - 10.00% (7.49%)
France Residential Comparable Level 3 Fair value per sqm 7,077
EUR/sqm - 28,000
EUR/sqm (19,602
EUR/sqm)
Italy - 4* hotel Hotel DCF Level 3 Rate per key -
(175,115 EUR/key)
Italy - 4* hotel Hotel DCF
Net current income per sqm -
(88 EUR/sqm)
Italy - 4* hotel Hotel DCF Exit yield - (7.10%)
Italy - 4* hotel Hotel DCF Discount rate - (7.00%)
Czech Republic Land Bank Comparable Level 3 Fair value per sqm 2
EUR/sqm - 3,042
EUR/sqm (277
EUR/sqm)
Hungary Land Bank Comparable Level 3 Fair value per sqm 48
EUR/sqm - 1,870
EUR/sqm (838
EUR/sqm)
Poland Land Bank Comparable Level 3 Fair value per sqm -
(151 EUR/sqm)
Germany Land Bank Comparable Level 3 Fair value per sqm -
(494 EUR/sqm)
Czech Republic Development Development
Appraisal Level 3 Total EMRV -
(1.433.002 EUR)
Czech Republic Development
Development Appraisal
Gross development value -
(21.700.000 EUR)
Czech Republic Development Development
Appraisal Development
margin - (10.00%)

CPI PROPERTY GROUP
2017 CONDENSED CONSOLIDATED INTERIM FINANCIAL STATEMENTS | 67
31 December 2016
Asset Type
Valuation technique
Fair value hierarchy
Significant unobservable
inputs
Weighted average
Min. Max. Avg.
Switzerland Development
Development Appraisal Level 3
Gross development value -
(247.617.166 EUR)
Switzerland Development Development
Appraisal Development
margin - (20.00%)
Czech Republic Agriculture Comparable Level 3 Fair value per sqm 0.30
EUR/sqm - 0.61
EUR/sqm (0.61
EUR/sqm)
Czech Republic - 3* hotel Hospitality Comparable Level 3 Rate per key
32,395 EUR/key -
90,884 EUR/key
(54,805 EUR/key)
Czech Republic - 4* hotel Hospitality DCF Level 3 Rate per key
103,727 EUR/key -
144,194 EUR/key
(121,704 EUR/key)
Czech Republic - 4* hotel Hotel DCF
Net current income per sqm
270 EUR/sqm -
1.234 EUR/sqm
(698 EUR/sqm)
Czech Republic - 4* hotel Hotel DCF Exit yield 7.00% - 7.75% (7.33%)
Czech Republic - 4* hotel Hotel DCF Discount rate 9.00% - 9.25% (9.11%)
Czech Republic - 4* hotel Hospitality Comparable Level 3 Rate per key
86,139 EUR/key -
188,980 EUR/key
(126,512 EUR/key)
Czech Republic - 5* hotel Hospitality Comparable Level 3 Rate per key
72,900 EUR/key -
521,630 EUR/key
(348,689 EUR/key)
Czech Republic - Hostel Hospitality Comparable Level 3 Rate per key -
(19,804 EUR/sqm)
Hungary - 4* hotel Hospitality DCF Level 3 Rate per key 92,025
EUR/key - 163,158 EUR/key
(115,057 EUR/key)
Hungary - 4* hotel Hotel DCF
Net current income per sqm
5 EUR/sqm -
494 EUR/sqm
(294 EUR/sqm)
Hungary - 4* hotel Hotel DCF Exit yield 7.25% - 7.50% (7.29%)
Hungary - 4* hotel Hotel DCF Discount rate 9.25% - 10.25% (9.79%)
Poland - 4* hotel Hospitality DCF Level 3 Rate per key -
(169,565 EUR/key)
Poland - 4* hotel Hotel DCF
Net current income per sqm -
(139 EUR/sqm)
Poland - 4* hotel Hotel DCF Exit yield - (7.00%)
Poland - 4* hotel Hotel DCF Discount rate - (9.00%)
Poland - 5* hotel Hospitality DCF Level 3 Rate per key -
(195,082 EUR/key)
Poland - 5* hotel Hotel DCF
Net current income per sqm -
(194 EUR/sqm)
Poland - 5* hotel Hotel DCF Exit yield - (7.00%)
Poland - 5* hotel Hotel DCF Discount rate - (9.00%)
Russia - 5* hotel Hospitality DCF Level 3 Rate per key -
(308,333 EUR/key)
Russia - 5* hotel Hotel DCF
Net current income per sqm -
(1,625 EUR/sqm)
Russia - 5* hotel Hotel DCF Exit yield - (7.80%)
Russia - 5* hotel Hotel DCF Discount rate - (10.80%)
Croatia Hospitality DCF Level 3 Rate per key - (238,869 EUR/key)
Croatia - n/a Hotel DCF Exit yield - (8.79%)
Croatia - n/a Hotel DCF Discount rate - (10.01%)
Discounted cash flow method (DCF) – application guidance provided by IVSC, www.ivsc.org
Under the DCF method, a property’s fair value is estimated using explicit assumptions regarding the benefits and
liabilities of ownership over the asset’s life including an exit or terminal value. As an accepted method within the
income approach to valuation, the DCF method involves the projection of a series of cash flows on a real property

CPI PROPERTY GROUP
2017 CONDENSED CONSOLIDATED INTERIM FINANCIAL STATEMENTS | 68
interest. To this projected cash flow series, an appropriate, market-derived discount rate is applied to establish
the present value of the income stream associated with the real property.
The duration of the cash flow and the specific timing of inflows and outflows are determined by events such as
rent reviews, lease renewal and related lease up periods, re-letting, redevelopment, or refurbishment. The
appropriate duration is typically driven by market behaviour that is a characteristic of the class of real property.
In the case of investment properties, periodic cash flow is typically estimated as gross income less vacancy, non
recoverable expenses, collection losses, lease incentives, maintenance cost, agent and commission costs and
other operating and management expenses. The series of periodic net operating incomes, along with an estimate
of the terminal value anticipated at the end of the projection period, is then discounted.
Market comparable method – application guidance provided by IVSC, www.ivsc.org
Under the market comparable method (or market comparable approach), a property’s fair value is estimated
based on comparable transactions.
The market comparable approach is based upon the principle of substitution under which a potential buyer will
not pay more for the property than it will cost to buy a comparable substitute property. In theory, the best
comparable sale would be an exact duplicate of the subject property and would indicate, by the known selling
price of the duplicate, the price for which the subject property could be sold. The unit of comparison applied is
the price per square metre (sqm).
Income capitalisation method - application guidance provided by IVSC, www.ivsc.org
Under the income capitalisation method, a property´s fair value is estimated based on the normalised net
operating income generated by the property, which is divided by the capitalisation rate (the investor´s rate of
return). The difference between gross and net rental income includes expense categories such as vacancy, non
recoverable expenses, collection losses, lease incentives, maintenance cost, agent and commission costs and
other operating and management expenses. When using the income capitalisation method, the mentioned
expenses have to be included on the basis of a time weighted average, such as the average lease up costs. Under
the income capitalisation method, over (above market rent) and under-rent situations are separately capitalised.
CPI PROPERTY GROUP
2017 CONDENSED CONSOLIDATED INTERIM FINANCIAL STATEMENTS | 69
8 Contingencies and Litigations
The Group has given guarantees in the ordinary course of business, more specifically on the residential units
delivered. Such guarantees are internally covered by the guarantees granted by the general contractor and
provisions where needed.
CPI PG has guaranteed certain debt of Orco Property Group (“OPG")
On 7 November 2014, the Company entered into a trust deed (the “Orco Trust Deed”) pursuant to which it
unconditionally and irrevocably guaranteed the due and punctual payment of all sums from time to time payable
by Orco Property Group in relation to its notes (New Notes, note 6.15) registered under ISIN code XS0820547742,
which were issued on 4 October 2012 (and amended and restated pursuant to the Orco Trust Deed). The Group
has also undertaken in the Orco Trust Deed to be bound by certain limitations on its activities and to maintain
certain financial ratios.
In May 2016 OPG purchased approximately 77 % of the New Notes, which shall be cancelled. As of the date
hereof, the principal amount outstanding of the New Notes is EUR 12.66 million. Interest on the New Notes
accrues at a rate of 7 % per annum, payable semi-annually in arrears. Unless previously redeemed, or purchased
and cancelled, the New Notes will be redeemed at their then outstanding principal amount on 7 November 2019.
In consideration of Group's entry into the Orco Trust Deed and the guarantee given thereunder, Orco Property
Group has agreed to pay to the Group a guarantee fee of three percents. of the outstanding principal balance of
the New Notes, payable on a payment in kind (PIK) basis falling due on the business day after all amounts payable
in connection with the New Notes have been paid in full. For more details about the New Notes please refer to
Orco Trust Deed available at www.orcogroup.com.
The Company agreed to guarantee certain warranties given by OPG to the buyer of Capellen building in
Luxembourg. The guaranteed warranties related to pending claims in relation to the building and are limited to
EUR 250,000. The duration of the guarantee is 24 months from 25 January 2017.
Kingstown dispute
The Company announced that on 20 January 2015 it was served with a summons containing petition of the three
companies namely Kingstown Partners Master Ltd. of the Cayman Islands, Kingstown Partners II, LP of Delaware
and Ktown LP of Delaware (together referred to as „Kingstown“), claiming to be the shareholders of OPG, filed
with the „Tribunal d´Arrondissement de et a Luxembourg“. The petition seeks condemnation of the Company
together with Orco Property Group, S.A. (“OPG“) and certain members of OPG´s board of directors as jointly and
severally liable to pay damages in the amount of EUR 14,485,111.13 and compensation for moral damage in the
amount of EUR 5,000,000. According to Kingstown´s allegation the claimed damage has arisen as a consequence
of inter alia alleged violation of OPG´s minority shareholders rights. To the best of Company´s knowledge,
Kingstown was not at the relevant time (and is not up to now) a shareholder of the Company. Therefore and
without any assumption regarding the possible violation, the Company believes that it cannot be held liable for
the violation of the rights of the shareholders of another entity.
The Management of the Company has been taking all available legal actions to oppose these allegations in order
to protect the corporate interest as well as the interest of its shareholders. Accordingly, the parties sued by
Kingstown raised the exceptio judicatum solvi plea, which consists in requiring the entity who initiated the
proceedings and who does not reside in the European Union or in a State which is not a Member State of the
Council of Europe to pay a legal deposit to cover the legal costs and compensation procedure. The Luxembourg
CPI PROPERTY GROUP
2017 CONDENSED CONSOLIDATED INTERIM FINANCIAL STATEMENTS | 70
District Court rendered on 19 February 2016 a judgement, whereby each claimant has to place a legal deposit in
the total amount of 90,000 EUR with the “Caisse de Consignation” in Luxembourg in order to continue the
proceedings. Kingstown paid the deposit in January 2017.
(BÄR) Leipziger Platz dispute (Litigation - HGHI against Orco Immobilien GmbH)
As part of the Leipziger Platz Project Orco Immobilien GmbH (subsidiary of CPI PG latter referred as “OI”) entered
in 2010 into an separate agreement („OG-HGHI-Agreement“) with HGHI 1 LP GmbH and HGHI 2 LP GmbH
(together referred to as „HGHI“) to regulate the handling of a neighbor dispute with the neighbor B.Ä.R.
Grundstücks GmbH & Co. Voß-/Wilhelmstraße KG and B.Ä.R.a.n.o. Gesellschaft für Grundbesitz Berlin GmbH und
Co. KG (hereinafter jointly: „BÄR“). The main point of the agreement was OI deposited an amount of
EUR 10 million into an escrow account to be used to cover compensation or indemnification payments with
regard to neighbor agreements with BÄR and to cover the costs of the trustees and the proceedings.
In 2013 HGHI has sued Orco Immobilien GmbH for the release of the remaining amounts (about EUR 9 million)
and payment to HGHI. Orco Immobilien defend themselves against the claim and accordingly the court has
dismissed the claim in total. HGHI has appealed against this first instance verdict.
In the second instance the parties agreed within an general settlement between Group and HGHI in January 2017
that HGHI will withdraw their suit and furthermore that the remaining amounts on the escrow
shall be paid out to Orco Immobilien GmbH. After clearing all formal objections at 05 April 2017 the trustee has
paid out the remaining EUR 8.6 million from the escrow account to Orco Immobilien GmbH.
With respect to the litigation concerning the deferred compensation of EUR 30 million to be paid by HGHI to
Group in relation to the Leipziger Platz project disposal, the parties agreed at the second instance hearing that
HGHI has to pay to Group EUR 20 million, which was paid by 2 May 2017. With the settlement of these main
proceedings the two other corresponding litigations (the information claim and the injunction measures) were
also ended.
HAGIBOR OFFICE BUILDING In March 2016, the insolvency administrator of the OPG's subsidiary HAGIBOR OFFICE BUILDING ("HOB"), filed a
lawsuit, requesting that the OPG returns to HOB in aggregate USD 16.49 million, paid by HOB to OPG in 2012.
OPG is of the opinion that the lawsuit has no merit given that in 2012 HOB duly repaid its loan to OPG. OPG will
defend itself against this lawsuit. In August 2016, the litigation has been stayed until litigation concerning the
ownership of the Radio Free Europe building is resolved. In December 2016 OPG filed a lawsuit claiming the non-
existence of pledges registered on the Radio Free Europe building in favor of the financing bank.
As at the date of the publication of the consolidated financial statements, the Group does not have in evidence
of any other contingent liabilities except those mentioned above. No legal proceeding is currently active the
result of which would influence consolidated financial statements and the Group is not aware of any potential
upcoming lawsuit.
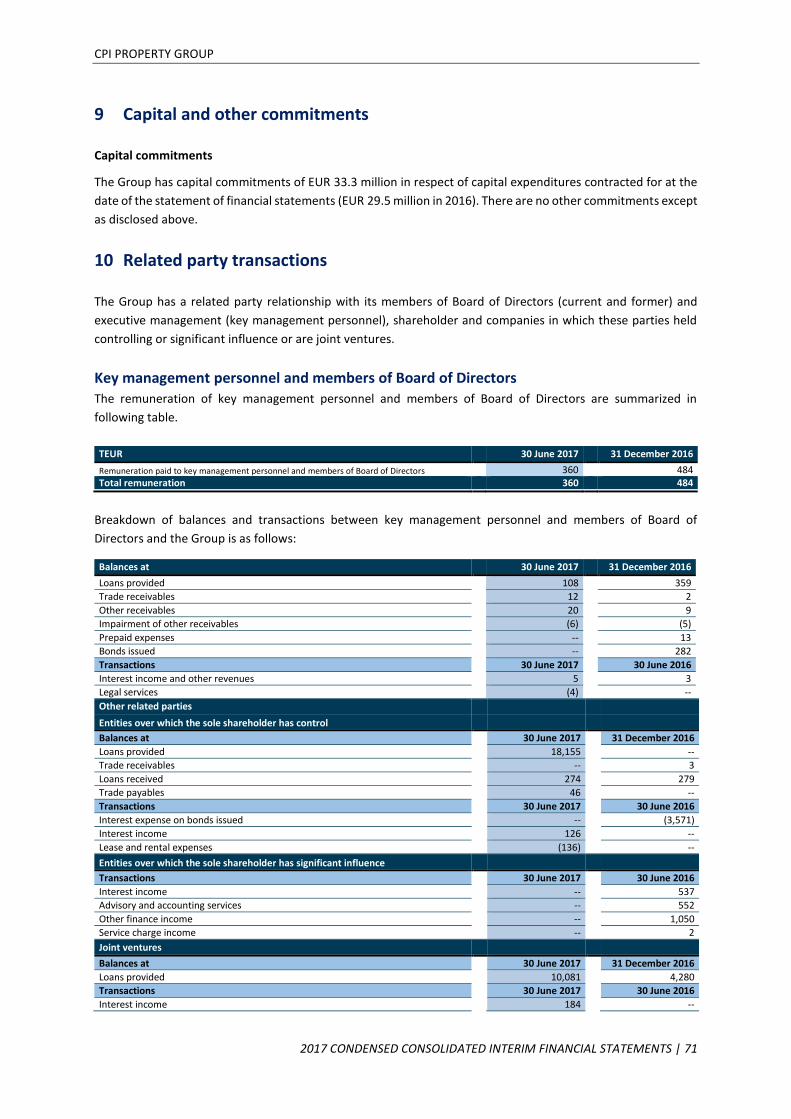
CPI PROPERTY GROUP
2017 CONDENSED CONSOLIDATED INTERIM FINANCIAL STATEMENTS | 71
9 Capital and other commitments
Capital commitments
The Group has capital commitments of EUR 33.3 million in respect of capital expenditures contracted for at the
date of the statement of financial statements (EUR 29.5 million in 2016). There are no other commitments except
as disclosed above.
10 Related party transactions
The Group has a related party relationship with its members of Board of Directors (current and former) and
executive management (key management personnel), shareholder and companies in which these parties held
controlling or significant influence or are joint ventures.
Key management personnel and members of Board of Directors The remuneration of key management personnel and members of Board of Directors are summarized in
following table.
TEUR 30 June 2017 31 December 2016
Remuneration paid to key management personnel and members of Board of Directors 360 484 Total remuneration 360 484
Breakdown of balances and transactions between key management personnel and members of Board of
Directors and the Group is as follows:
Balances at 30 June 2017 31 December 2016
Loans provided 108 359
Trade receivables 12 2
Other receivables 20 9
Impairment of other receivables (6) (5)
Prepaid expenses -- 13
Bonds issued -- 282
Transactions 30 June 2017 30 June 2016
Interest income and other revenues 5 3
Legal services (4) --
Other related parties
Entities over which the sole shareholder has control
Balances at 30 June 2017 31 December 2016
Loans provided 18,155 --
Trade receivables -- 3
Loans received 274 279
Trade payables 46 --
Transactions 30 June 2017 30 June 2016
Interest expense on bonds issued -- (3,571)
Interest income 126 --
Lease and rental expenses (136) --
Entities over which the sole shareholder has significant influence
Transactions 30 June 2017 30 June 2016
Interest income -- 537
Advisory and accounting services -- 552
Other finance income -- 1,050
Service charge income -- 2
Joint ventures
Balances at 30 June 2017 31 December 2016
Loans provided 10,081 4,280
Transactions 30 June 2017 30 June 2016
Interest income 184 --
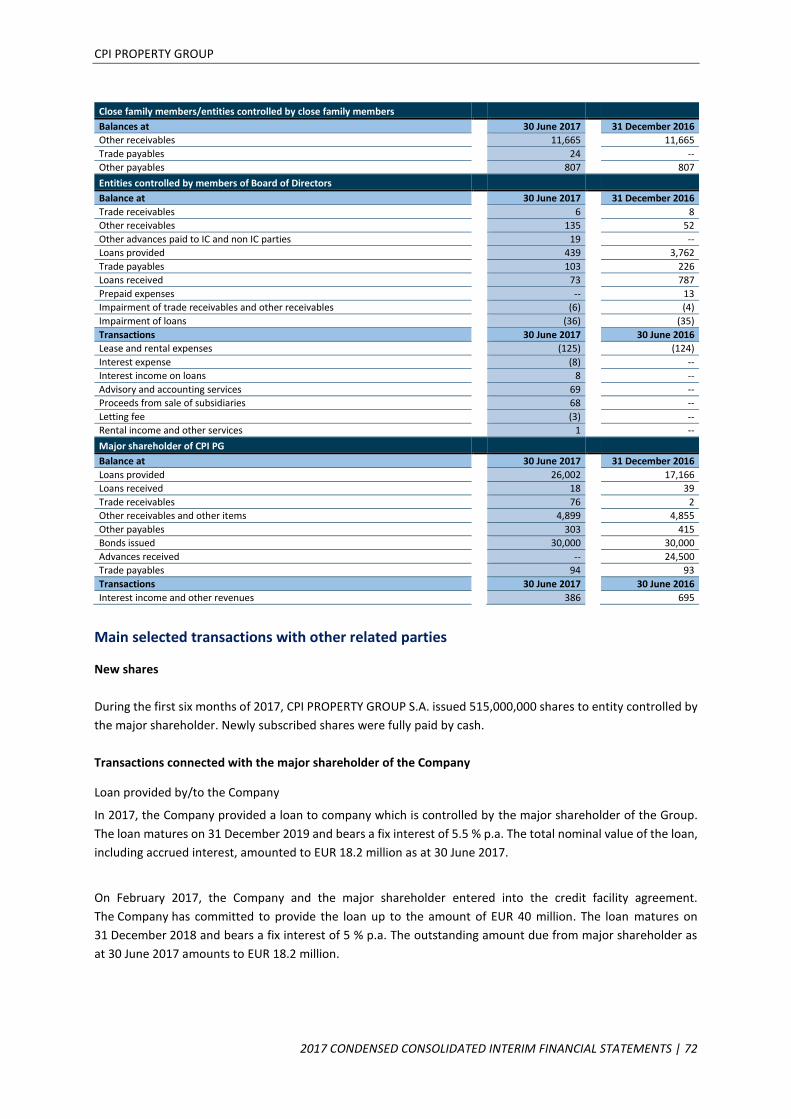
CPI PROPERTY GROUP
2017 CONDENSED CONSOLIDATED INTERIM FINANCIAL STATEMENTS | 72
Close family members/entities controlled by close family members
Balances at 30 June 2017 31 December 2016
Other receivables 11,665 11,665
Trade payables 24 --
Other payables 807 807
Entities controlled by members of Board of Directors
Balance at 30 June 2017 31 December 2016
Trade receivables 6 8
Other receivables 135 52
Other advances paid to IC and non IC parties 19 --
Loans provided 439 3,762
Trade payables 103 226
Loans received 73 787
Prepaid expenses -- 13
Impairment of trade receivables and other receivables (6) (4)
Impairment of loans (36) (35)
Transactions 30 June 2017 30 June 2016
Lease and rental expenses (125) (124)
Interest expense (8) --
Interest income on loans 8 --
Advisory and accounting services 69 --
Proceeds from sale of subsidiaries 68 --
Letting fee (3) --
Rental income and other services 1 --
Major shareholder of CPI PG
Balance at 30 June 2017 31 December 2016
Loans provided 26,002 17,166
Loans received 18 39
Trade receivables 76 2
Other receivables and other items 4,899 4,855
Other payables 303 415
Bonds issued 30,000 30,000
Advances received -- 24,500
Trade payables 94 93
Transactions 30 June 2017 30 June 2016
Interest income and other revenues 386 695
Main selected transactions with other related parties
New shares
During the first six months of 2017, CPI PROPERTY GROUP S.A. issued 515,000,000 shares to entity controlled by
the major shareholder. Newly subscribed shares were fully paid by cash.
Transactions connected with the major shareholder of the Company
Loan provided by/to the Company
In 2017, the Company provided a loan to company which is controlled by the major shareholder of the Group.
The loan matures on 31 December 2019 and bears a fix interest of 5.5 % p.a. The total nominal value of the loan,
including accrued interest, amounted to EUR 18.2 million as at 30 June 2017.
On February 2017, the Company and the major shareholder entered into the credit facility agreement.
The Company has committed to provide the loan up to the amount of EUR 40 million. The loan matures on
31 December 2018 and bears a fix interest of 5 % p.a. The outstanding amount due from major shareholder as
at 30 June 2017 amounts to EUR 18.2 million.
CPI PROPERTY GROUP
2017 CONDENSED CONSOLIDATED INTERIM FINANCIAL STATEMENTS | 73
11 Events after the reporting period
Acquisition of Královo Pole Shopping Centre
Královo Pole Shopping Centre located in Brno, Czechia, was acquired on 26 July 2017. Královo Pole Shopping
Centre was built in 2004 and comprises a two-level gallery with 78 shops and a food court with a total of
26,500 sqm gross leasable area and 900 parking spaces. Královo Pole is the dominant shopping centre in the
North of Brno featuring a large catchment of 250,000 inhabitants within 20 min with above average purchasing
power. The shopping centre offers development potential having a valid building permit in place for a further
12,000 sqm GLA expansion.
Disposal of Arkády Prostějov Shopping Gallery
On 8 August 2017, the Group disposed of Arkády Prostějov Shopping gallery, an non-core asset comprising of
shopping gallery with the total gross leasable area of approximately 10,000 square meters located in Prostějov,
Czechia.
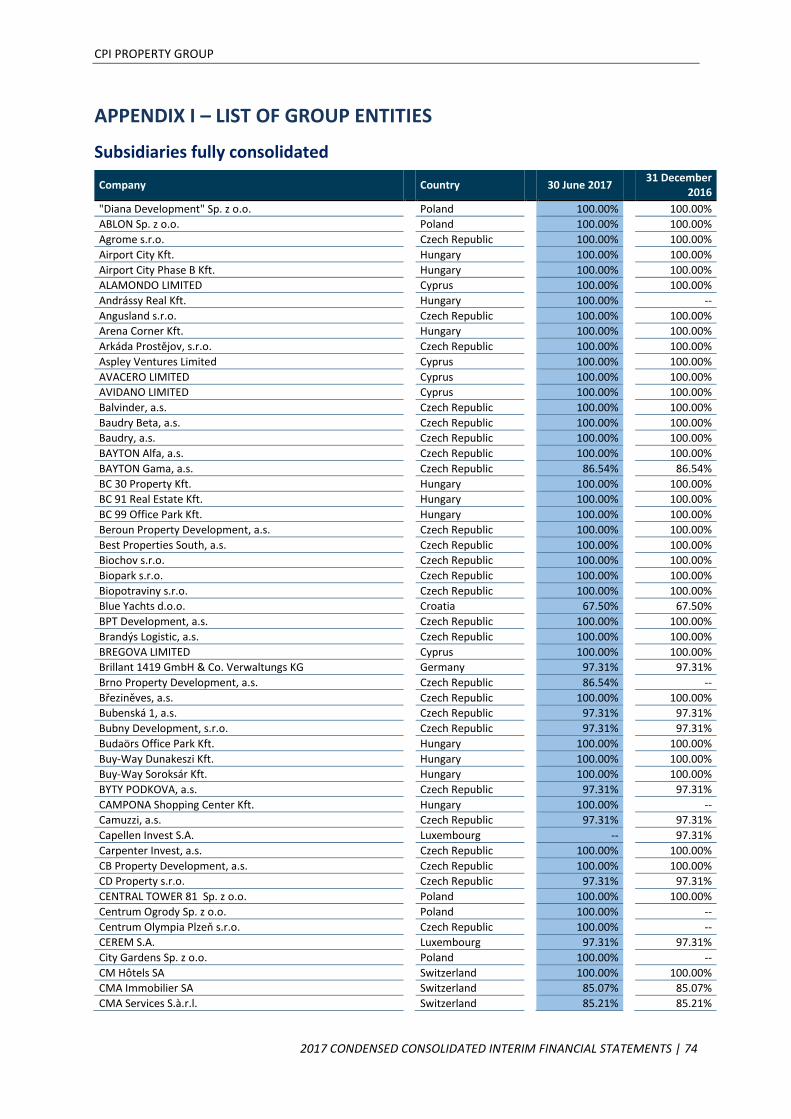
CPI PROPERTY GROUP
2017 CONDENSED CONSOLIDATED INTERIM FINANCIAL STATEMENTS | 74
APPENDIX I – LIST OF GROUP ENTITIES
Subsidiaries fully consolidated
Company Country 30 June 2017 31 December
2016
"Diana Development" Sp. z o.o. Poland 100.00% 100.00%
ABLON Sp. z o.o. Poland 100.00% 100.00%
Agrome s.r.o. Czech Republic 100.00% 100.00%
Airport City Kft. Hungary 100.00% 100.00%
Airport City Phase B Kft. Hungary 100.00% 100.00%
ALAMONDO LIMITED Cyprus 100.00% 100.00%
Andrássy Real Kft. Hungary 100.00% --
Angusland s.r.o. Czech Republic 100.00% 100.00%
Arena Corner Kft. Hungary 100.00% 100.00%
Arkáda Prostějov, s.r.o. Czech Republic 100.00% 100.00%
Aspley Ventures Limited Cyprus 100.00% 100.00%
AVACERO LIMITED Cyprus 100.00% 100.00%
AVIDANO LIMITED Cyprus 100.00% 100.00%
Balvinder, a.s. Czech Republic 100.00% 100.00%
Baudry Beta, a.s. Czech Republic 100.00% 100.00%
Baudry, a.s. Czech Republic 100.00% 100.00%
BAYTON Alfa, a.s. Czech Republic 100.00% 100.00%
BAYTON Gama, a.s. Czech Republic 86.54% 86.54%
BC 30 Property Kft. Hungary 100.00% 100.00%
BC 91 Real Estate Kft. Hungary 100.00% 100.00%
BC 99 Office Park Kft. Hungary 100.00% 100.00%
Beroun Property Development, a.s. Czech Republic 100.00% 100.00%
Best Properties South, a.s. Czech Republic 100.00% 100.00%
Biochov s.r.o. Czech Republic 100.00% 100.00%
Biopark s.r.o. Czech Republic 100.00% 100.00%
Biopotraviny s.r.o. Czech Republic 100.00% 100.00%
Blue Yachts d.o.o. Croatia 67.50% 67.50%
BPT Development, a.s. Czech Republic 100.00% 100.00%
Brandýs Logistic, a.s. Czech Republic 100.00% 100.00%
BREGOVA LIMITED Cyprus 100.00% 100.00%
Brillant 1419 GmbH & Co. Verwaltungs KG Germany 97.31% 97.31%
Brno Property Development, a.s. Czech Republic 86.54% --
Březiněves, a.s. Czech Republic 100.00% 100.00%
Bubenská 1, a.s. Czech Republic 97.31% 97.31%
Bubny Development, s.r.o. Czech Republic 97.31% 97.31%
Budaörs Office Park Kft. Hungary 100.00% 100.00%
Buy-Way Dunakeszi Kft. Hungary 100.00% 100.00%
Buy-Way Soroksár Kft. Hungary 100.00% 100.00%
BYTY PODKOVA, a.s. Czech Republic 97.31% 97.31%
CAMPONA Shopping Center Kft. Hungary 100.00% --
Camuzzi, a.s. Czech Republic 97.31% 97.31%
Capellen Invest S.A. Luxembourg -- 97.31%
Carpenter Invest, a.s. Czech Republic 100.00% 100.00%
CB Property Development, a.s. Czech Republic 100.00% 100.00%
CD Property s.r.o. Czech Republic 97.31% 97.31%
CENTRAL TOWER 81 Sp. z o.o. Poland 100.00% 100.00%
Centrum Ogrody Sp. z o.o. Poland 100.00% --
Centrum Olympia Plzeň s.r.o. Czech Republic 100.00% --
CEREM S.A. Luxembourg 97.31% 97.31%
City Gardens Sp. z o.o. Poland 100.00% --
CM Hôtels SA Switzerland 100.00% 100.00%
CMA Immobilier SA Switzerland 85.07% 85.07%
CMA Services S.à.r.l. Switzerland 85.21% 85.21%

CPI PROPERTY GROUP
2017 CONDENSED CONSOLIDATED INTERIM FINANCIAL STATEMENTS | 75
Company Country 30 June 2017 31 December
2016
CODIAZELLA LTD Cyprus 100.00% 100.00%
Conradian, a.s. Czech Republic 100.00% 100.00%
CPI - Bor, a.s. Czech Republic 100.00% 100.00%
CPI - Facility, a.s. Czech Republic 100.00% 100.00%
CPI - Horoměřice, a.s. Czech Republic 86.54% 86.54%
CPI - Krásné Březno, a.s. Czech Republic 97.31% 97.31%
CPI - Land Development, a.s. Czech Republic 97.31% 97.31%
CPI - Orlová, a.s. Czech Republic 100.00% 100.00%
CPI - Real Estate, a.s. Czech Republic 100.00% 100.00%
CPI - Štupartská, a.s. Czech Republic 100.00% 100.00%
CPI - Zbraslav, a.s. Czech Republic 100.00% 100.00%
CPI Alberghi HI Roma S.r.l. Italy 100.00% 100.00%
CPI Alfa, a.s. Czech Republic 100.00% 100.00%
CPI Beta, a.s. Czech Republic 100.00% 100.00%
CPI Blatiny Czech Republic 100.00% --
CPI Blue, s.r.o. (1) Czech Republic 100.00% 100.00%
CPI BYTY, a.s. Czech Republic 100.00% 100.00%
CPI CYPRUS LIMITED Cyprus 100.00% 100.00%
CPI Delta, a.s. Czech Republic 100.00% 100.00%
CPI East, s.r.o. Czech Republic 100.00% 100.00%
CPI Epsilon, a.s. Czech Republic 100.00% 100.00%
CPI Facility Management Kft. (2) Hungary 100.00% 100.00%
CPI Facility Slovakia, a.s. Slovak Republic 100.00% 100.00%
CPI FINANCE (BVI) LIMITED British Virgin Islands 100.00% 100.00%
CPI Finance CEE, a.s. Czech Republic 100.00% --
CPI Finance Ireland II Limited Ireland 100.00% 100.00%
CPI Finance Ireland III Limited Ireland 100.00% 100.00%
CPI Finance Ireland Limited Ireland 100.00% 100.00%
CPI Finance Netherlands B.V. Netherland 100.00% 100.00%
CPI Finance Netherlands II B.V. Netherland 100.00% 100.00%
CPI Finance Netherlands III B.V. Netherland 100.00% 100.00%
CPI Finance Slovakia II, a. s. Slovak Republic 100.00% 100.00%
CPI Finance Slovakia, a.s. Slovak Republic 100.00% 100.00%
CPI Flats, a.s. Czech Republic 100.00% 100.00%
CPI France, aSASU France 100.00% 100.00%
CPI Group, a.s. Czech Republic 100.00% 100.00%
CPI Heli, s.r.o. Czech Republic 100.00% 100.00%
CPI Hotels Hungary Kft. Hungary 100.00% 100.00%
CPI HOTELS POLAND Sp. z o.o. Poland 100.00% 100.00%
CPI Hotels Properties, a.s. Czech Republic 100.00% 100.00%
CPI Hotels Slovakia, s.r.o. Slovak Republic 100.00% 100.00%
CPI Hotels, a.s. Czech Republic 100.00% 100.00%
CPI Hungary Kft. Hungary 100.00% 100.00%
CPI IMMO, S.a.r.l. France 100.00% 100.00%
CPI Jihlava Shopping, a.s. Czech Republic 100.00% 100.00%
CPI Kappa, s.r.o. Czech Republic 100.00% --
CPI Lambda, a.s. Czech Republic 100.00% 100.00%
CPI Management, s.r.o. Czech Republic 100.00% 100.00%
CPI Meteor Centre, s.r.o. Czech Republic 100.00% 100.00%
CPI Národní, s.r.o. Czech Republic 100.00% 100.00%
CPI North, s.r.o. Czech Republic 100.00% 100.00%
CPI Palmovka Office, s.r.o. Czech Republic 100.00% 100.00%
CPI Park Mlýnec, a.s. Czech Republic 100.00% 100.00%
CPI Park Žďárek, a.s. Czech Republic 99.96% 99.96%
CPI PG Management, S.á r.l Luxembourg 100.00% 100.00%
CPI Poland Sp. z o.o. Poland 100.00% 100.00%
CPI Property, s.r.o. Czech Republic 100.00% 100.00%
CPI Reality, a.s. Czech Republic 100.00% 100.00%
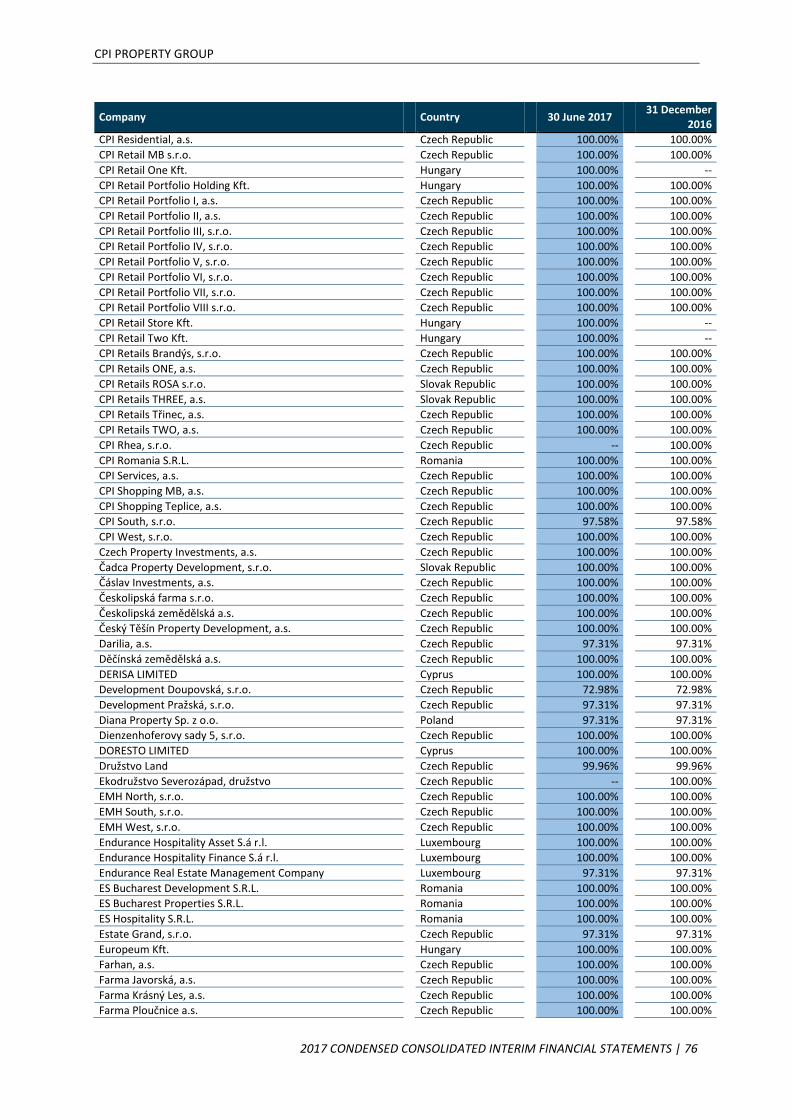
CPI PROPERTY GROUP
2017 CONDENSED CONSOLIDATED INTERIM FINANCIAL STATEMENTS | 76
Company Country 30 June 2017 31 December
2016
CPI Residential, a.s. Czech Republic 100.00% 100.00%
CPI Retail MB s.r.o. Czech Republic 100.00% 100.00%
CPI Retail One Kft. Hungary 100.00% --
CPI Retail Portfolio Holding Kft. Hungary 100.00% 100.00%
CPI Retail Portfolio I, a.s. Czech Republic 100.00% 100.00%
CPI Retail Portfolio II, a.s. Czech Republic 100.00% 100.00%
CPI Retail Portfolio III, s.r.o. Czech Republic 100.00% 100.00%
CPI Retail Portfolio IV, s.r.o. Czech Republic 100.00% 100.00%
CPI Retail Portfolio V, s.r.o. Czech Republic 100.00% 100.00%
CPI Retail Portfolio VI, s.r.o. Czech Republic 100.00% 100.00%
CPI Retail Portfolio VII, s.r.o. Czech Republic 100.00% 100.00%
CPI Retail Portfolio VIII s.r.o. Czech Republic 100.00% 100.00%
CPI Retail Store Kft. Hungary 100.00% --
CPI Retail Two Kft. Hungary 100.00% --
CPI Retails Brandýs, s.r.o. Czech Republic 100.00% 100.00%
CPI Retails ONE, a.s. Czech Republic 100.00% 100.00%
CPI Retails ROSA s.r.o. Slovak Republic 100.00% 100.00%
CPI Retails THREE, a.s. Slovak Republic 100.00% 100.00%
CPI Retails Třinec, a.s. Czech Republic 100.00% 100.00%
CPI Retails TWO, a.s. Czech Republic 100.00% 100.00%
CPI Rhea, s.r.o. Czech Republic -- 100.00%
CPI Romania S.R.L. Romania 100.00% 100.00%
CPI Services, a.s. Czech Republic 100.00% 100.00%
CPI Shopping MB, a.s. Czech Republic 100.00% 100.00%
CPI Shopping Teplice, a.s. Czech Republic 100.00% 100.00%
CPI South, s.r.o. Czech Republic 97.58% 97.58%
CPI West, s.r.o. Czech Republic 100.00% 100.00%
Czech Property Investments, a.s. Czech Republic 100.00% 100.00%
Čadca Property Development, s.r.o. Slovak Republic 100.00% 100.00%
Čáslav Investments, a.s. Czech Republic 100.00% 100.00%
Českolipská farma s.r.o. Czech Republic 100.00% 100.00%
Českolipská zemědělská a.s. Czech Republic 100.00% 100.00%
Český Těšín Property Development, a.s. Czech Republic 100.00% 100.00%
Darilia, a.s. Czech Republic 97.31% 97.31%
Děčínská zemědělská a.s. Czech Republic 100.00% 100.00%
DERISA LIMITED Cyprus 100.00% 100.00%
Development Doupovská, s.r.o. Czech Republic 72.98% 72.98%
Development Pražská, s.r.o. Czech Republic 97.31% 97.31%
Diana Property Sp. z o.o. Poland 97.31% 97.31%
Dienzenhoferovy sady 5, s.r.o. Czech Republic 100.00% 100.00%
DORESTO LIMITED Cyprus 100.00% 100.00%
Družstvo Land Czech Republic 99.96% 99.96%
Ekodružstvo Severozápad, družstvo Czech Republic -- 100.00%
EMH North, s.r.o. Czech Republic 100.00% 100.00%
EMH South, s.r.o. Czech Republic 100.00% 100.00%
EMH West, s.r.o. Czech Republic 100.00% 100.00%
Endurance Hospitality Asset S.á r.l. Luxembourg 100.00% 100.00%
Endurance Hospitality Finance S.á r.l. Luxembourg 100.00% 100.00%
Endurance Real Estate Management Company Luxembourg 97.31% 97.31%
ES Bucharest Development S.R.L. Romania 100.00% 100.00%
ES Bucharest Properties S.R.L. Romania 100.00% 100.00%
ES Hospitality S.R.L. Romania 100.00% 100.00%
Estate Grand, s.r.o. Czech Republic 97.31% 97.31%
Europeum Kft. Hungary 100.00% 100.00%
Farhan, a.s. Czech Republic 100.00% 100.00%
Farma Javorská, a.s. Czech Republic 100.00% 100.00%
Farma Krásný Les, a.s. Czech Republic 100.00% 100.00%
Farma Ploučnice a.s. Czech Republic 100.00% 100.00%
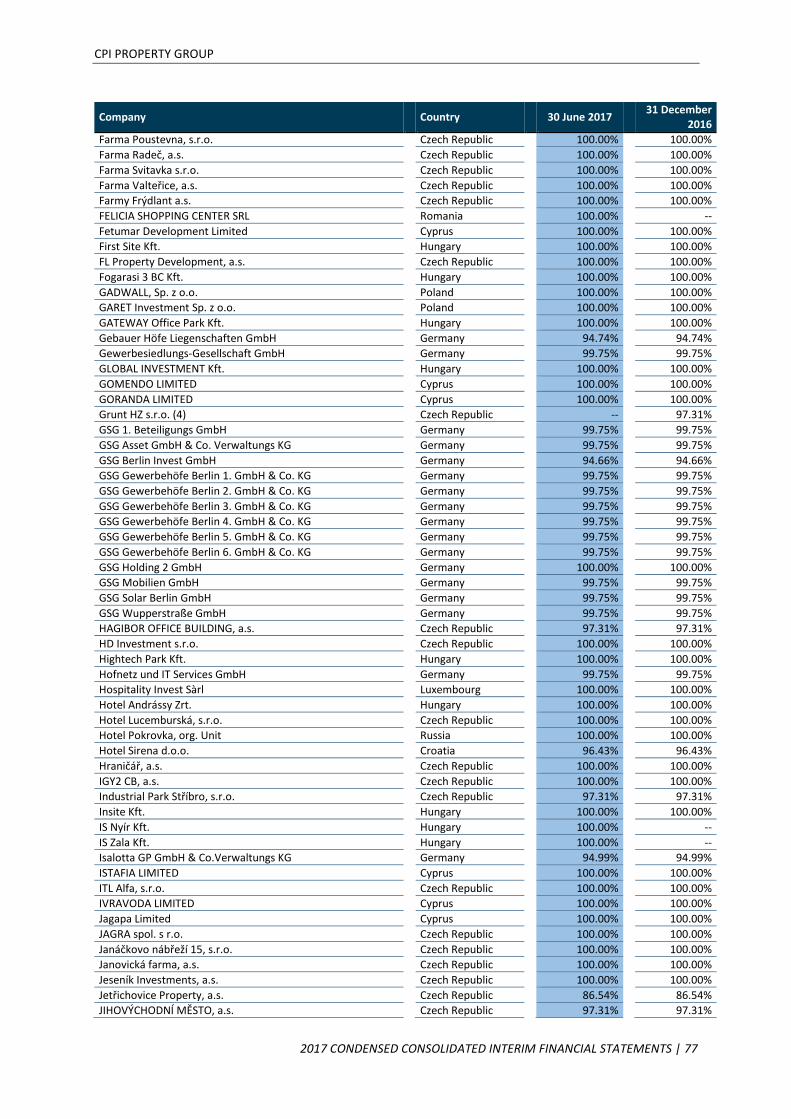
CPI PROPERTY GROUP
2017 CONDENSED CONSOLIDATED INTERIM FINANCIAL STATEMENTS | 77
Company Country 30 June 2017 31 December
2016
Farma Poustevna, s.r.o. Czech Republic 100.00% 100.00%
Farma Radeč, a.s. Czech Republic 100.00% 100.00%
Farma Svitavka s.r.o. Czech Republic 100.00% 100.00%
Farma Valteřice, a.s. Czech Republic 100.00% 100.00%
Farmy Frýdlant a.s. Czech Republic 100.00% 100.00%
FELICIA SHOPPING CENTER SRL Romania 100.00% --
Fetumar Development Limited Cyprus 100.00% 100.00%
First Site Kft. Hungary 100.00% 100.00%
FL Property Development, a.s. Czech Republic 100.00% 100.00%
Fogarasi 3 BC Kft. Hungary 100.00% 100.00%
GADWALL, Sp. z o.o. Poland 100.00% 100.00%
GARET Investment Sp. z o.o. Poland 100.00% 100.00%
GATEWAY Office Park Kft. Hungary 100.00% 100.00%
Gebauer Höfe Liegenschaften GmbH Germany 94.74% 94.74%
Gewerbesiedlungs-Gesellschaft GmbH Germany 99.75% 99.75%
GLOBAL INVESTMENT Kft. Hungary 100.00% 100.00%
GOMENDO LIMITED Cyprus 100.00% 100.00%
GORANDA LIMITED Cyprus 100.00% 100.00%
Grunt HZ s.r.o. (4) Czech Republic -- 97.31%
GSG 1. Beteiligungs GmbH Germany 99.75% 99.75%
GSG Asset GmbH & Co. Verwaltungs KG Germany 99.75% 99.75%
GSG Berlin Invest GmbH Germany 94.66% 94.66%
GSG Gewerbehöfe Berlin 1. GmbH & Co. KG Germany 99.75% 99.75%
GSG Gewerbehöfe Berlin 2. GmbH & Co. KG Germany 99.75% 99.75%
GSG Gewerbehöfe Berlin 3. GmbH & Co. KG Germany 99.75% 99.75%
GSG Gewerbehöfe Berlin 4. GmbH & Co. KG Germany 99.75% 99.75%
GSG Gewerbehöfe Berlin 5. GmbH & Co. KG Germany 99.75% 99.75%
GSG Gewerbehöfe Berlin 6. GmbH & Co. KG Germany 99.75% 99.75%
GSG Holding 2 GmbH Germany 100.00% 100.00%
GSG Mobilien GmbH Germany 99.75% 99.75%
GSG Solar Berlin GmbH Germany 99.75% 99.75%
GSG Wupperstraße GmbH Germany 99.75% 99.75%
HAGIBOR OFFICE BUILDING, a.s. Czech Republic 97.31% 97.31%
HD Investment s.r.o. Czech Republic 100.00% 100.00%
Hightech Park Kft. Hungary 100.00% 100.00%
Hofnetz und IT Services GmbH Germany 99.75% 99.75%
Hospitality Invest Sàrl Luxembourg 100.00% 100.00%
Hotel Andrássy Zrt. Hungary 100.00% 100.00%
Hotel Lucemburská, s.r.o. Czech Republic 100.00% 100.00%
Hotel Pokrovka, org. Unit Russia 100.00% 100.00%
Hotel Sirena d.o.o. Croatia 96.43% 96.43%
Hraničář, a.s. Czech Republic 100.00% 100.00%
IGY2 CB, a.s. Czech Republic 100.00% 100.00%
Industrial Park Stříbro, s.r.o. Czech Republic 97.31% 97.31%
Insite Kft. Hungary 100.00% 100.00%
IS Nyír Kft. Hungary 100.00% --
IS Zala Kft. Hungary 100.00% --
Isalotta GP GmbH & Co.Verwaltungs KG Germany 94.99% 94.99%
ISTAFIA LIMITED Cyprus 100.00% 100.00%
ITL Alfa, s.r.o. Czech Republic 100.00% 100.00%
IVRAVODA LIMITED Cyprus 100.00% 100.00%
Jagapa Limited Cyprus 100.00% 100.00%
JAGRA spol. s r.o. Czech Republic 100.00% 100.00%
Janáčkovo nábřeží 15, s.r.o. Czech Republic 100.00% 100.00%
Janovická farma, a.s. Czech Republic 100.00% 100.00%
Jeseník Investments, a.s. Czech Republic 100.00% 100.00%
Jetřichovice Property, a.s. Czech Republic 86.54% 86.54%
JIHOVÝCHODNÍ MĚSTO, a.s. Czech Republic 97.31% 97.31%
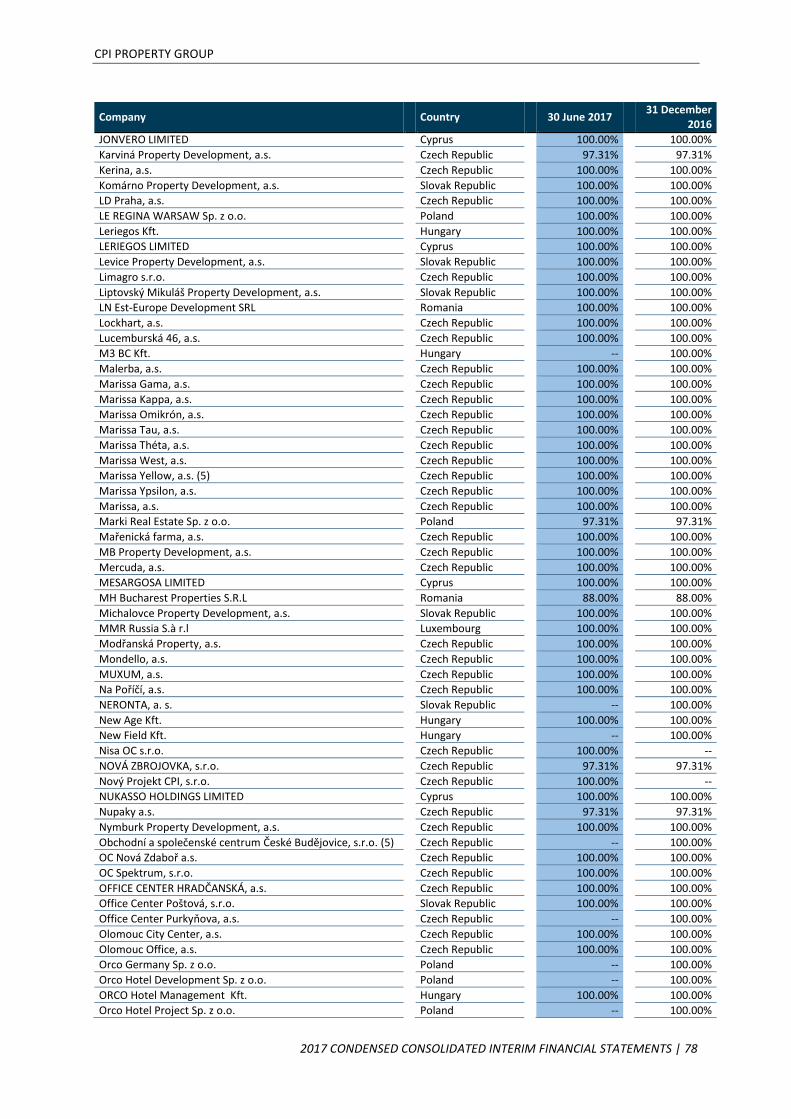
CPI PROPERTY GROUP
2017 CONDENSED CONSOLIDATED INTERIM FINANCIAL STATEMENTS | 78
Company Country 30 June 2017 31 December
2016
JONVERO LIMITED Cyprus 100.00% 100.00%
Karviná Property Development, a.s. Czech Republic 97.31% 97.31%
Kerina, a.s. Czech Republic 100.00% 100.00%
Komárno Property Development, a.s. Slovak Republic 100.00% 100.00%
LD Praha, a.s. Czech Republic 100.00% 100.00%
LE REGINA WARSAW Sp. z o.o. Poland 100.00% 100.00%
Leriegos Kft. Hungary 100.00% 100.00%
LERIEGOS LIMITED Cyprus 100.00% 100.00%
Levice Property Development, a.s. Slovak Republic 100.00% 100.00%
Limagro s.r.o. Czech Republic 100.00% 100.00%
Liptovský Mikuláš Property Development, a.s. Slovak Republic 100.00% 100.00%
LN Est-Europe Development SRL Romania 100.00% 100.00%
Lockhart, a.s. Czech Republic 100.00% 100.00%
Lucemburská 46, a.s. Czech Republic 100.00% 100.00%
M3 BC Kft. Hungary -- 100.00%
Malerba, a.s. Czech Republic 100.00% 100.00%
Marissa Gama, a.s. Czech Republic 100.00% 100.00%
Marissa Kappa, a.s. Czech Republic 100.00% 100.00%
Marissa Omikrón, a.s. Czech Republic 100.00% 100.00%
Marissa Tau, a.s. Czech Republic 100.00% 100.00%
Marissa Théta, a.s. Czech Republic 100.00% 100.00%
Marissa West, a.s. Czech Republic 100.00% 100.00%
Marissa Yellow, a.s. (5) Czech Republic 100.00% 100.00%
Marissa Ypsilon, a.s. Czech Republic 100.00% 100.00%
Marissa, a.s. Czech Republic 100.00% 100.00%
Marki Real Estate Sp. z o.o. Poland 97.31% 97.31%
Mařenická farma, a.s. Czech Republic 100.00% 100.00%
MB Property Development, a.s. Czech Republic 100.00% 100.00%
Mercuda, a.s. Czech Republic 100.00% 100.00%
MESARGOSA LIMITED Cyprus 100.00% 100.00%
MH Bucharest Properties S.R.L Romania 88.00% 88.00%
Michalovce Property Development, a.s. Slovak Republic 100.00% 100.00%
MMR Russia S.à r.l Luxembourg 100.00% 100.00%
Modřanská Property, a.s. Czech Republic 100.00% 100.00%
Mondello, a.s. Czech Republic 100.00% 100.00%
MUXUM, a.s. Czech Republic 100.00% 100.00%
Na Poříčí, a.s. Czech Republic 100.00% 100.00%
NERONTA, a. s. Slovak Republic -- 100.00%
New Age Kft. Hungary 100.00% 100.00%
New Field Kft. Hungary -- 100.00%
Nisa OC s.r.o. Czech Republic 100.00% --
NOVÁ ZBROJOVKA, s.r.o. Czech Republic 97.31% 97.31%
Nový Projekt CPI, s.r.o. Czech Republic 100.00% --
NUKASSO HOLDINGS LIMITED Cyprus 100.00% 100.00%
Nupaky a.s. Czech Republic 97.31% 97.31%
Nymburk Property Development, a.s. Czech Republic 100.00% 100.00%
Obchodní a společenské centrum České Budějovice, s.r.o. (5) Czech Republic -- 100.00%
OC Nová Zdaboř a.s. Czech Republic 100.00% 100.00%
OC Spektrum, s.r.o. Czech Republic 100.00% 100.00%
OFFICE CENTER HRADČANSKÁ, a.s. Czech Republic 100.00% 100.00%
Office Center Poštová, s.r.o. Slovak Republic 100.00% 100.00%
Office Center Purkyňova, a.s. Czech Republic -- 100.00%
Olomouc City Center, a.s. Czech Republic 100.00% 100.00%
Olomouc Office, a.s. Czech Republic 100.00% 100.00%
Orco Germany Sp. z o.o. Poland -- 100.00%
Orco Hotel Development Sp. z o.o. Poland -- 100.00%
ORCO Hotel Management Kft. Hungary 100.00% 100.00%
Orco Hotel Project Sp. z o.o. Poland -- 100.00%
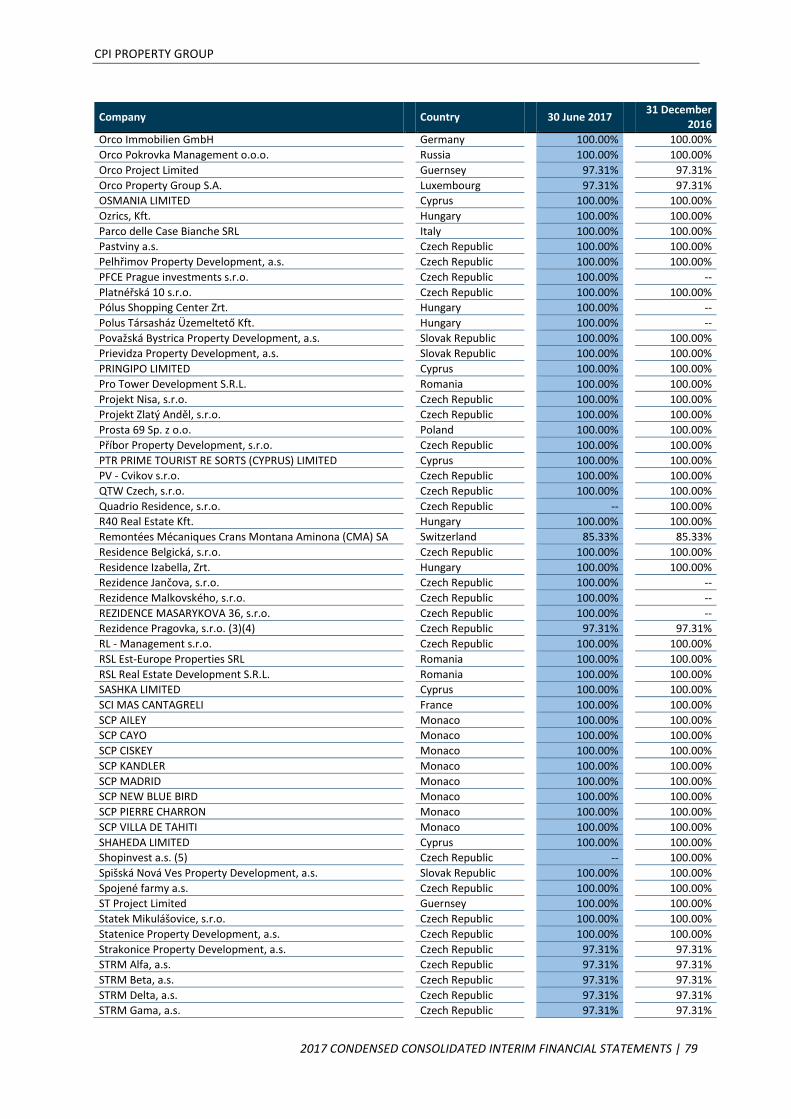
CPI PROPERTY GROUP
2017 CONDENSED CONSOLIDATED INTERIM FINANCIAL STATEMENTS | 79
Company Country 30 June 2017 31 December
2016
Orco Immobilien GmbH Germany 100.00% 100.00%
Orco Pokrovka Management o.o.o. Russia 100.00% 100.00%
Orco Project Limited Guernsey 97.31% 97.31%
Orco Property Group S.A. Luxembourg 97.31% 97.31%
OSMANIA LIMITED Cyprus 100.00% 100.00%
Ozrics, Kft. Hungary 100.00% 100.00%
Parco delle Case Bianche SRL Italy 100.00% 100.00%
Pastviny a.s. Czech Republic 100.00% 100.00%
Pelhřimov Property Development, a.s. Czech Republic 100.00% 100.00%
PFCE Prague investments s.r.o. Czech Republic 100.00% --
Platnéřská 10 s.r.o. Czech Republic 100.00% 100.00%
Pólus Shopping Center Zrt. Hungary 100.00% --
Polus Társasház Üzemeltető Kft. Hungary 100.00% --
Považská Bystrica Property Development, a.s. Slovak Republic 100.00% 100.00%
Prievidza Property Development, a.s. Slovak Republic 100.00% 100.00%
PRINGIPO LIMITED Cyprus 100.00% 100.00%
Pro Tower Development S.R.L. Romania 100.00% 100.00%
Projekt Nisa, s.r.o. Czech Republic 100.00% 100.00%
Projekt Zlatý Anděl, s.r.o. Czech Republic 100.00% 100.00%
Prosta 69 Sp. z o.o. Poland 100.00% 100.00%
Příbor Property Development, s.r.o. Czech Republic 100.00% 100.00%
PTR PRIME TOURIST RE SORTS (CYPRUS) LIMITED Cyprus 100.00% 100.00%
PV - Cvikov s.r.o. Czech Republic 100.00% 100.00%
QTW Czech, s.r.o. Czech Republic 100.00% 100.00%
Quadrio Residence, s.r.o. Czech Republic -- 100.00%
R40 Real Estate Kft. Hungary 100.00% 100.00%
Remontées Mécaniques Crans Montana Aminona (CMA) SA Switzerland 85.33% 85.33%
Residence Belgická, s.r.o. Czech Republic 100.00% 100.00%
Residence Izabella, Zrt. Hungary 100.00% 100.00%
Rezidence Jančova, s.r.o. Czech Republic 100.00% --
Rezidence Malkovského, s.r.o. Czech Republic 100.00% --
REZIDENCE MASARYKOVA 36, s.r.o. Czech Republic 100.00% --
Rezidence Pragovka, s.r.o. (3)(4) Czech Republic 97.31% 97.31%
RL - Management s.r.o. Czech Republic 100.00% 100.00%
RSL Est-Europe Properties SRL Romania 100.00% 100.00%
RSL Real Estate Development S.R.L. Romania 100.00% 100.00%
SASHKA LIMITED Cyprus 100.00% 100.00%
SCI MAS CANTAGRELI France 100.00% 100.00%
SCP AILEY Monaco 100.00% 100.00%
SCP CAYO Monaco 100.00% 100.00%
SCP CISKEY Monaco 100.00% 100.00%
SCP KANDLER Monaco 100.00% 100.00%
SCP MADRID Monaco 100.00% 100.00%
SCP NEW BLUE BIRD Monaco 100.00% 100.00%
SCP PIERRE CHARRON Monaco 100.00% 100.00%
SCP VILLA DE TAHITI Monaco 100.00% 100.00%
SHAHEDA LIMITED Cyprus 100.00% 100.00%
Shopinvest a.s. (5) Czech Republic -- 100.00%
Spišská Nová Ves Property Development, a.s. Slovak Republic 100.00% 100.00%
Spojené farmy a.s. Czech Republic 100.00% 100.00%
ST Project Limited Guernsey 100.00% 100.00%
Statek Mikulášovice, s.r.o. Czech Republic 100.00% 100.00%
Statenice Property Development, a.s. Czech Republic 100.00% 100.00%
Strakonice Property Development, a.s. Czech Republic 97.31% 97.31%
STRM Alfa, a.s. Czech Republic 97.31% 97.31%
STRM Beta, a.s. Czech Republic 97.31% 97.31%
STRM Delta, a.s. Czech Republic 97.31% 97.31%
STRM Gama, a.s. Czech Republic 97.31% 97.31%

CPI PROPERTY GROUP
2017 CONDENSED CONSOLIDATED INTERIM FINANCIAL STATEMENTS | 80
Company Country 30 June 2017 31 December
2016
Sunčani Hvar d.d. Croatia 96.43% 96.43%
Svitavy Property Alfa, a.s. Czech Republic 100.00% 100.00%
Svitavy Property Development, a.s. Czech Republic 97.31% 97.31%
Šenovská zemědělská, s.r.o. Czech Republic 100.00% 100.00%
Tarnów Property Development Sp. z o.o. Poland 100.00% 100.00%
Telč Property Development, a.s. Czech Republic 100.00% 100.00%
Tepelná Litvínov, s.r.o. Czech Republic 100.00% --
Trebišov Property Development, s. r. o. Slovak Republic 100.00% 100.00%
Trutnov Property Development, a.s. Czech Republic 100.00% 100.00%
Třinec Investments, s.r.o. Czech Republic 100.00% 100.00%
Třinec Property Development, a.s. Czech Republic 100.00% 100.00%
TUNELIA LIMITED Cyprus 100.00% 100.00%
Týniště Property Development, s.r.o. Czech Republic -- 100.00%
Tyršova 6, a.s. Czech Republic 100.00% 100.00%
U svatého Michala, a.s. Czech Republic 100.00% 100.00%
Valdovská zemědělská, a.s. Czech Republic 100.00% 100.00%
Valkeřická ekologická, a.s. Czech Republic 100.00% 100.00%
Verneřický Angus a.s. Czech Republic 100.00% 100.00%
Vigano, a.s. Czech Republic 100.00% 100.00%
Vinohrady s.a.r.l. France 97.31% 97.31%
VM Property Development, a.s. Czech Republic -- 100.00%
VOLANTI LIMITED Cyprus 100.00% 100.00%
Vyškov Property Development, a.s. Czech Republic 100.00% 100.00%
Wertpunkt Real Estate Experts GmbH Germany 99.75% 99.75%
Zelená farma s.r.o. Czech Republic 100.00% 100.00%
Zelená louka s.r.o. Czech Republic 100.00% 100.00%
Zelená pastva s.r.o. Czech Republic 100.00% 100.00%
ZEMSPOL s.r.o. Czech Republic 100.00% 100.00%
ZLATICO LIMITED Cyprus 100.00% 100.00%
Žďár Property Development, a.s. Czech Republic -- 100.00%
Ždírec Property Development, a.s. Czech Republic 100.00% 100.00%
Joint ventures
Company Country 30 June 2017 31 December 2016
Uniborc S.A. Luxembourg 34.06% 19.47%
1) Orco Germany Prague changed its name to CPI Blue, s.r.o. with effective date of 19 January 2017.
2) Szolgáltatóház Kft. changed its name to CPI Facility Management Kft. with effective date of 30 June 2017.
3) Orco Praga, s.r.o., člen holdingu ORCO PROPERTY GROUP SA changed its name to Rezidence Pragovka, s.r.o. with effective
date of 3 January 2017.
4) Grunt HZ s.r.o. has merged with Rezidence Pragovka, s.r.o. (the "successor company”) with the effective date of
31 May 2017. All assets and liabilities of Grunt HZ s.r.o. passed to the successor company.
5) Obchodní a společenské centrum České Budějovice, s.r.o. and Shopinvest a.s. has merged with Marissa Yellow, a.s. (the
„successor company“) with the effective date of 31 March 2017. All assets and liabilities of Obchodní a společenské centrum
České Budějovice, s.r.o. and Shopinvest a.s. passed to the successor company.