Embed Size (px)
Citation preview

1
Construction Update
Green shoots in a year of transition
Rabobank – Wholesale Clients Netherlands
Industry Knowledge Team
Utrecht, April 2014

2 2
Table of contents
Sections
I Construction in macroeconomic perspective 5
II Developments Netherlands 9
III Developments Europe and US 18
IV European contractors – metrics & strategy comparison 26
Appendices
A Appendix: Contact details 32

3
Executive summary (I/II)
I. Construction in macroeconomic
perspective
II. Developments Netherlands
The European construction sector is finally bottoming out now that the European economy is back on a
growth track. We expect that construction production will improve gradually, provided that conditions
stimulating a.o. residential production will strengthen during the year and gross fixed capital formation will
increase backed by growing producer confidence and higher utilisation rates
A recovery of European construction production is expected as of 2014 onwards. Although it will start
slowly, the recovery might gather speed as of 2H14 due to increased GDP growth forecasts. One of the
prerequisites for stronger economic growth is a consistent and persistent approach towards economic
reforms
Dutch gross fixed investments in homes, buildings and infrastructure have been improving in recent
months. Likewise, construction confidence has shown a very strong pickup in the twelve months preceding
March 2014. Overall, macroeconomic developments are not expected to have major destabilizing effects in
Europe anymore, but the construction sector will still experience some headwinds from the weak labour
market and depressed household income
Like in our 3Q13 Construction Update, we stick to our cautious view that the Dutch construction market
will bottom out in 2H14. However, based on improving sentiment and stabilising order books we have
become slightly more optimistic, resulting in stabilisation or possibly slight production growth in 2014. In
2015 the recovery will be more pronounced with 2.5% growth YoY
Positive signs in the residential market are accumulating, but 2014 will be a balancing act between
positive developments and challenges like low permit issuance, stricter regulations for housing
corporations and lower employment participation. The wide gap between input prices and output prices
evidences that an increase in (new)residential production will not immediately result in better margins
Due to oversupply in commercial real estate markets and the transition from greenfield to brownfield
developments (stimulating transformation, renovation) we foresee a strongly subdued demand for new
non-residential buildings in the coming years. This is illustrated by the fact that the costs of construction
orders for new non-residential buildings for most sectors were still declining at year-end 2013
Dutch Infrastructure production will suffer from widespread austerity measures and a slow private sector
investment climate in 2014. Meanwhile, opportunities in the Dutch PPP market are ramping up, but under
very competitive pricing levels and surrounded by an increasing number of legal disputes

4
Executive summary (II/II)
III. Developments Europe & US
IV. European contractors – metrics &
strategy comparison
With the exception of France and Spain, all European countries covered in our analysis are expected to
report construction growth as of 2014. Due to the severity of economic problems and public deficits it will
take longer for these countries to recover. Overall, Europe continues to struggle against the challenges of
Euro zone economic woes, deficit reduction and challenging export markets. Nevertheless, we expect that
macro economic developments will not ignite a new set of destabilizing effects on the construction sector
Germany proves to have the most robust construction sector in recent years and currently enjoys an early
spring resulting from strong economic fundamentals
The 4 Nordic countries combined are reporting a stronger construction performance than the rest of
Europe. Many European contractors try their luck in the Nordics, mainly attracted by a steady stream of
larger infrastructure and non-residential projects
Although US construction already returned to growth in 2012, the recovery still seems relatively weak in
historical perspective. However, the shale gas boom keeps offering opportunities for infra contractors
experienced in the power sector (adaptation of distribution networks to LNG/shale gas). The upturn in the
residential market is slowing down somewhat, but is still the main driver of construction recovery
In recent years, contractors increasingly jumped to internationalisation and diversification in order to
escape weak local markets. The effects of European decline were softened by diversification into e.g.
maintenance, energy and PPP contracts. A substantial number of contractors expanded their activities
outside Europe, preferably in emerging markets
EBIT margins of the largest European contractors seem to edge up from their troughs, but pure
construction activities, especially those from Dutch companies, are still showing a very meagre
performance in 2013, significantly under the 10-year average of 4%. Earnings recovery at main European
contractors will on average be a slow process. Given this fact and the remaining high pressure on the Euro
zone financial system, the need for deleveraging to create cash for growth remains
Diversification and internationalisation are tempting in the battle to grow earnings as other regions outside
Europe will report structurally higher construction growth rates. However, e.g. foreign expansion involves
many risks and margin improvement firstly starts with operational excellence and excellent risk
management. Dutch contractors should consider a more close examination of their opportunities for cost
reductions related to subcontractors and building materials as these costs make up for 86% of total costs
and these cost categories are largely responsible for so-called failure costs

5
Construction in macroeconomic perspective I

6
Currently European construction output is
representing 9.7% of GDP on average. In the last
decade European economies have become less
dependent on construction, especially driven by
strong declines in new building activities (residential
and non-residential)
In countries like Ireland and Spain construction
output as a % of GDP more than halved, while
Belgium and Germany were hardly affected.
Positively, economic growth is strengthening and
will have its effect on purchasing power. How
quickly construction will increase its contribution to
GDP growth, will strongly depend on the size of
regionally built-up surpluses in (non)-residential
property
In line with economic forecast institutes,
Euroconstruct has raised its outlook for the
European construction sector. Although
Euroconstruct expects Dutch construction to grow
slightly in 2014, the recovery might be curbed by
further deleveraging of households and businesses
in 2014. Furthermore, both central and local
governments still have to absorb austerity and
restructuring measures
Overall, Euroconstruct estimates are mildly
optimistic for most European countries. Increases in
construction production as of 2014 are primarily
dependent on an accelerating revival in the
residential market, for instance backed by low
mortgage interest rates
After years of decline, the European economy
seems to be back on a growth track. Main drivers of
expected GDP growth are improving consumer
confidence indicators and private spending. Various
institutes recently upped their forecasts, assuming
various countries continue to carry out economic
reforms consistently
Contrary to other countries, the Dutch economy will
firstly benefit from increasing net exports and a
higher investment appetite by the business
community. As of 2015 we expect more significant
contributions from private consumption and
declining unemployment. Consumer confidence is
still negative, but rose for the 6th consecutive
month in March 2014
Construction still digesting aftermath of economic crisis, recovery will be more pronounced as of 2015
Source: Euroconstruct, Euroconstruct 19 countries Source: Euroconstruct December 2013, FMI Corporation Source: Rabobank Economic Research
Construction output, GDP and new building
Construction production volume (% YoY) GDP forecasts (% YoY)
New building activity in calmer territory
First green shoots in transition year
Harsh years followed by soft Dutch recovery
Volume 2011
Volume 2012
Volume 2013(e)
Volume 2014(e)
Netherlands 3.5% -7.2% -5.0% 0.4%
Germany 3.7% -1.2% 0.3% 2.7%
UK 2.3% -7.8% -1.1% 2.4%
Ireland -19.1% -16.8% -3.5% 9.8%
France 4.3% 0.3% -2.8% -1.5%
Belgium 4.3% 0.5% -1.3% 1.2%
Spain -20.1% -31.8% -23.0% -6.7%
US -1.7% 8.7% 6.1% 7.4%
1.0 1.0 1.4 1.5 1.5
1.8 1.9 2.0
2.8
-2
-1
0
1
2
3
4
Fra
nce
Spain
Euro
zone
Belg
ium
Neth
erl
ands
Germ
any
UK
Irela
nd
US
2011 2012 2013 2014 (e) 2015 (e)
30%
35%
40%
45%
0%
4%
8%
12%
2006
2007
2008
2009
2010
2011
2012
2013
2014(e
)
2015(e
)
Construction output as % GDP (LH axis)
New building as % GDP (LH axis)
% New building in total output (RH axis)

7
The outlook for European fixed capital formation1 is
modest, but is expected to slightly gather pace in
2H14. Gross fixed investment volumes are still
relatively low at this early stage of the economic
rebound, dampened by weak fundamentals and the
economic crisis legacy. In general the European
capital goods stock has been ageing strongly during
a long phase of downward economic adjustments
Fixed capital growth can be supported further by
improving funding conditions. However, European
corporate loan volume growth (not in graph) was
still negative in February 2014 (-3% YoY), while
corporate profits suffer from erosion. With better
than expected GDP growth in the Euro zone and a
pick-up in corporate revenue prospects, there are
signs that the worst is over
Looking at developments from a more positive
angle, all this should result in improving producer
confidence and higher utilization rates when
replacement investments start to spill over to new
capital expenditure
Recent Rabobank forecasts reveal that Dutch gross
fixed capital formation (investments)2 is expected
to pick up considerably in 2014 and 2015 (4.75%
and 4.0% YoY). This is supported by investments in
Dutch homes, buildings and infrastructure which
seem to edge up from their troughs since 2H13.
The construction confidence indicator has improved
strongly in recent months, which provides a strong
base for a further increase of both gross fixed
investments and the production index
-1.4%
-13.4%
-0.2%
1.6%
-3.0% -2.5%
3.0% 4.2%
-1.7%
-6.5%
-2.8%
1.3%
-3.9% -2.4%
1.2% 1.4%
-16%
-12%
-8%
-4%
0%
4%
8%
2008
2009
2010
2011
2012
2013
2014(e
)
2015(e
)
Gross domestic fixed capital formation
Construction gross domestic fixed capital formation*
Dutch construction confidence climbing up steadily, gross fixed investments edging up from their troughs
Note (1): Fixed capital includes tangible and intangible assets that are used in the production process for longer than one year, e.g. buildings, dwellings etc. Gross investment s include both spending to expand assets, and spending to replace assets Note (2):Dutch gross fixed investments in homes, buildings and infrastructure include the work in progress of the construction sector commissioned by principals and costs related to conveyance, real estate brokerage, appraisals and architect costs
Source: Eurostat Source: Euroconstruct, European Commission, (*) EC 19 countries
85
95
105
115
125
Jan-0
7
Jan-0
8
Jan-0
9
Jan-1
0
Jan-1
1
Jan-1
2
Jan-1
3
Jan-1
4
Construction production - Euro Area
Construction production - Netherlands
Source: Eurostat
Construction Confidence indicator
European fixed capital formation (% YoY)
Improving prospects Dutch investments
Construction Production index (2010 = 100)
-50
-30
-10
10
30
Jan-0
7
Jan-0
8
Jan-0
9
Jan-1
0
Jan-1
1
Jan-1
2
Jan-1
3
Jan-1
4
Constr. confidence - Netherlands
Constr. Confidence - Euro area
-20
-15
-10
-5
0
5
10
15
1Q
07
1Q
08
1Q
09
1Q
10
1Q
11
1Q
12
1Q
13
1Q
14
Homes Buildings Infrastructure
Source: CBS, 2014, quarterly moving average
Dutch gross fixed investments (% YoY)

8
After investment cuts from both the private and
public sector are being absorbed, further significant
decline in production is not expected
However, apart from the sluggish recovery in new
production in countries with oversupply, also
renovation will be curbed. Energy efficiency policies
could contribute to renovation growth, but
obligatory targets and new laws are lacking
Ireland is remarkably positioned in the higher
growth range, but we have to bear in mind that
recovery is from a very low base as in previous
years construction volume declined by over 80%.
Meanwhile, growth is strongly supported by the
created ‘bad bank’ NAMA2 which is broadly
supporting both commercial and housing projects
Now that economic prospects seem to be reaching
more positive territories, we expect that residential
production growth will return at the latest in 2015
in most European markets
Macro economic developments do not seem to have
major destabilizing effects anymore. However, it
remains to be seen how positive drivers like
demographic trends and low interest rates will be
counterbalanced by still weak labour markets and
depressed household income
While stimulus measures have been phased out in
most European countries, the UK finds strong
support from new home buyers schemes.
Production is growing markedly, but at the same
time overheating of housing prices is feared
Euroconstruct has upped its infra forecasts in its
most recent report. This implies that only a few
countries, like e.g. Spain, will not be able to return
to growth in the coming years
There have been many public initiatives and fiscal
policies to stimulate infra construction. Most
stimulus programmes have now come to an end
and infra budget improvements are highly
dependent on economic recovery which can reduce
the impact of austerity
Moreover, significant public debt burdens will
continue to put a damper on the prospects for new
infra production. Like with new infra, the resources
to tackle the deteriorating conditions of existing
infrastructure are equally scarce
Slow European construction recovery gathering pace after 2014
Note (1): size of the bubbles in the graphs represent relative size of construction production in specifiic country in 2013 Note (2): NAMA stands for National Asset Management Agency, NAMA functions as a bad bank, acquiring property development loans from Irish banks in return for government bonds in order to improve the availability of credit in the Irish economy
Source: Euroconstruct, December 2012 Source: Euroconstruct, December 2012 Source: Euroconstruct, December 2012
Infrastructure (% CAGR)1
Residential (% CAGR)1
Non-residential (% CAGR)1
-4%
0%
4%
8%
-20% -15% -10% -5% 0% 5%
Con
str
ucti
on
ou
tpu
t g
row
th 2
01
3-
20
16
Construction output growth 2011-2013
Ireland
Spain
Netherlands
France
UK
Germany
Belgium
-4%
0%
4%
8%
12%
16%
-25% -20% -15% -10% -5% 0% 5%
Con
str
ucti
on
ou
tpu
t g
row
th
20
13
-20
16
Construction output growth 2011-2013
Spain
Ireland
Netherlands
France
Belgium
UK
Germany
-7%
-4%
-1%
2%
5%
-45% -35% -25% -15% -5% 5%
Con
str
ucti
on
ou
tpu
t g
row
th 2
01
3-
20
16
Construction output growth 2011-2013
Spain
Ireland
Netherlands
Germany
France
UK
Belgium
Non-residential: further deterioration halted
Infrastructure: hold back by austerity
Residential: 2013 last year of decline?

5
Developments Netherlands II

10
2014: despite ‘spring fever’ a transitional year
In January 2014, EIB (Economisch Instituut Bouw) released its new construction
outlook. Since 2008, construction declined by almost 25% and construction will
only start to grow visibly as of 2015. Although we agree with EIB about 2014
being a transitional year, we think differently about the timing and the
magnitude of the recovery. EIB forecasts a slight shrinkage (-0.5% YoY) for the
construction sector in 2014, but we expect production to stabilize or grow
slightly. Production will improve markedly as of 2015, but we think the 4% YoY
estimated by EIB is too optimistic. Mainly based on more modest expectations
about the residential market we estimate that production will grow by 2.5%
Residential growth is hampered by very low permit issuance which has dropped
to an all-time low (see slide 12). Furthermore, mortgage lending conditions have
been sobered down and income prospects are still subdued by a decrease in
employment participation and the impact of austerity. On top of that, households
expecting residual mortgage debt will temper their ambitions to make a next step
in their housing career. In 2014 the effects of the ‘verhuurdersheffing’ and
stricter regulations for housing corporations will result in lower investments in
the new-built production of rental homes. Although various institutes recently
upped their forecasts regarding Dutch economic growth, it will take time before
this will translate fully into strongly higher home buyers appetite. All said, there
is considerable latent demand for new homes based on socio-demographic
trends1, but the accommodation of demand is curbed by the issues mentioned
Non-residential prospects are meagre. Key issues hampering new production are
overcapacity in existing real estate and the prioritization of real estate financiers
towards transformation and refurbishments. Vacancy rates will not come down
quickly in the coming years and the demand side is strongly weakened by e.g.
the effects of ‘The new way of working’ and the increase of online retail.
However, as of 2014 we expect the pace of transformational activity
(renovations) to climb gradually, backed by improving economic prospects
Infrastructure output suffers from postponed infra spending on large projects by
the central government as well as reduced budgets at local governments. A
strong increase of new-residential production and the revitalization of business
parks as of 2015 can provide an impulse for modest growth as this will drive the
need to prepare building sites and improve infrastructural quality
Dutch construction: outlook influenced by balancing act between latent demand, lending policies, income prospects and austerity
2013 EIB
2014 EIB
2014(e) Rabo
2015(e) Rabo
2019* Rabo
Residential -9.0% -3.0% -0.5% 5.0% 6.5%
New building -11.5% -7.0% -2.0% 8.0% 8.0%
Renovation -4.8% 2.5% 2.0% 0.5% 4.0%
Non-residential -4.0% 1.5% 0.0% 2.0% 2.5%
New building -5.0% 1.0% -1.0% 1.0% 1.5%
Renovation -2.0% 2.5% 2.0% 3.0% 3.5%
Infrastructure -3.0% 0.0% -1.0% 1.5% 2.0%
New building & repair -3.5% -0.5% -1.5% 1.5% 2.0%
Maintenance -2.5% 0.5% 0.0% 1.0% 1.5%
External subcontracting
-4.5% -0.5% 0.0% 3.0% 3.0%
Maintenance buildings
1.5% 0.0% 0.5% 0.5% 1.0%
Total -4.5% -0.5% 0.0% 2.5% 3.0%
Note (1): see the report ‘Dutch housing market in regional perspective’, issued by Rabobank Economic Research, January 2014
Dutch construction production forecasts – % YoY
Source: EIB January 2014, Rabobank estimates 2014-2019, (*)estimated CAGR in 2016-2019

11
Currently the vacancies rate in construction is very
low. It is expected to increase only gradually over
the year, provided that the order books of
construction companies keep improving during the
year
As vacancies increase, it will be challenging to find
new workers. Many older workers have left the
industry permanently and inflow at colleges and
vocational schools has shrunk considerably. Taking
into account the EIB scenario (4% construction
growth as of 2015), the productivity per worker
might need to grow more strongly than projected in
the graph at the left bottom, in order to prevent
strong increases in cost price and margin erosion
It seems that the peak in bankruptcies has been
passed. However, we expect that the level will
remain high in the coming year due to a.o. order
intake at or below cost price (see also slide 13) and
significant constraints to generate cash to meet
(increasing) working capital needs
The late-cyclical character of construction has
smoothed somewhat in recent years, because of
overcapacity companies have been able to respond
to demand more quickly. However, capacity at
many firms has been reduced radically and as soon
as demand is gathering speed, we expect margin
pressure and pressure on cash flows caused by
increasing labour costs (necessity to hire scarce
subcontractors)
Dutch construction: capacity reduction and productivity constraints will bring challenges in the coming years
Source: CBS, Rabobank, 12 months/quarterly moving average Source: CBS, 12 months moving average
Source: CBS, quarterly moving average Source: EIB, January 2014
Cash generation key challenge GDP growth & added value (% YoY) Dutch construction bankruptcies (monthly)
Productivity growth hampered Vacancies rate (# vacancies per 1,000 jobs)
Productivity per employee (EUR)
0
20
40
60
80
100
120
140
Jan-9
4
Jan-9
6
Jan-9
8
Jan-0
0
Jan-0
2
Jan-0
4
Jan-0
6
Jan-0
8
Jan-1
0
Jan-1
2
Jan-1
4
One-man businesses Other firms
0
10
20
30
40
50
60
1Q
98
1Q
99
1Q
00
1Q
01
1Q
02
1Q
03
1Q
04
1Q
05
1Q
06
1Q
07
1Q
08
1Q
09
1Q
10
1Q
11
1Q
12
1Q
13
1Q
14
Vacancies rate (quarterly moving average)
-4
-2
0
2
4
-15
-10
-5
0
5
10
15
Jan-0
6
Jan-0
7
Jan-0
8
Jan-0
9
Jan-1
0
Jan-1
1
Jan-1
2
Jan-1
3
Jan-1
4
Construction Added Value (LH axis) GDP (RH axis)
105,000
110,000
115,000
120,000
125,000
130,000
135,000
2008
2009
2010
2011
2012
2013
2014(e
)
2015(e
)
2016(e
)
2017(e
)
2018(e
)
2019(e
)
EUR
Productivity per worker - EIB scenario(EUR)

12
Permit issuance for new homes has currently
reached the lowest level in 14 years. In 2013 only
26.000 permits have been issued. This will temper
the production of new homes in the coming years,
likely resulting in a production of 45,000 homes or
less in 2014 (2013: 51,000)
Until 20401 ca. 1 mln new homes are required and
also replacements of >15.000 homes yearly.
Housing corporations, suffering from new
regulation, cannot provide a strong stimulus for
new production in the rental segment in the coming
years. Sales (driving permits & production) of new
homes will only increase by a few thousand in
2014. On balance, this will result in a growing
overall Dutch housing shortage in the short term
Differences in economic activity and income
distribution are strong drivers of regionally
diverging patterns of demographic growth. As the
first two graphs on this slide clearly indicate,
population growth will only occur in urbanized
areas, except for the Flevoland province
Furthermore, when looking at absolute numbers
(not in graphs), population growth in the next
decades will mainly take place in the Randstad
provinces and Noord-Brabant, while stagnation or
shrinkage is expected in the other regions
In shrinking or stagnating regions it is important
that the focus shifts from purely new-built activity
to ‘replacement’ construction
The residential construction market is not only
driven by regional urbanisation and population
trends in general, but also by underlying regional
developments in greying, the growth of single
person households and changing consumer
preferences (rental or ownership)
Local housing shortages or surpluses will have a
more temporary or structural character. Home
builders and developers thus should consider to
realise homes in a more adaptable and flexible way.
Ideally homes should qualify for refurbishments in
order to be able to serve the housing needs of e.g.
both families and elderly people during its total life
span. In specific cases homes should be built for
disassembly, e.g. student homes or care
apartments
Dutch Residential: new-built challenges driven by regional demographic trends, housing shortages growing in the short term
Note (1): see the report ‘Dutch housing market in regional perspective’ ,issued by Rabobank Economic Research, January 2014
Source: CBS, 2014 Source: CBS, 2014
Sold houses & permits issued (annualized)
Non-urban population growth (%)
Urban population growth (%)
Low permits issuance drives shortages
...demand prudent new build approach Increasing regional differences …
-0.5%
0.5%
1.5%
2.5%
3.5%
FL u
rban
FR u
rban
ZE u
rban
OV u
rban
LI
urb
an
ZH
urb
an
GE u
rban
NH
urb
an
GR u
rban
DR u
rban
NB u
rban
UT u
rban
CAGR 2007-2010 CAGR 2011-2014e
0
50
100
150
200
250
0
20
40
60
80
100
120
Jan-0
0
Jan-0
1
Jan-0
2
Jan-0
3
Jan-0
4
Jan-0
5
Jan-0
6
Jan-0
7
Jan-0
8
Jan-0
9
Jan-1
0
Jan-1
1
Jan-1
2
Jan-1
3
Jan-1
4
Jan-1
5
Thousands
Permits rental (LH axis)
Permits owner occupier (LH axis)
Sold new homes (LH axis)
Sold existing homes (RH axis)
Source: CBS, NVB Bouw, (*) annualized numbers, moving average
-2.0%
-1.0%
0.0%
1.0%
2.0%
3.0%
UT n
on u
rban
NH
non u
rban
ZH
non u
rban
NB n
on u
rban
GE n
on u
rban
LI
non u
rban
GR n
on u
rban
DR n
on u
rban
FR n
on u
rban
OV n
on u
rban
ZE n
on u
rban
FL n
on u
rban
CAGR 2007-2010 CAGR 2011-2014e

13
At first sight, expected increases in order books and
costs of orders seem to be a positive indication for
the future revenues and profits of contractors
Looking more closely at input costs and output
costs of newly built homes, the picture seems
worrisome. The output price of homes (including
surcharges for general costs, risk and profit) has
declined strongly, while the input price (only
representing wages & materials) has been rising
substantially
Order intake and completion of semi-finished
products might be taking place at prices too low to
recover actual production costs
The index of the costs of architect orders finally
seems to have stabilized in 2H13. This is confirmed
by the claimed order book stabilisation by architects
(early indicator production)1
The trend in costs of orders received by contractors
is still downwards. In the ‘costs of orders received’
wages, material costs, VAT and ground costs have
been included, while in the ‘costs of architect
orders’ e.g. ground costs and the architect’s fee
have been excluded. We expect the ‘costs of orders
received’ to stabilize in due time, but the current
downward trend suggests that home builders might
experience an increase in orders, while they are
forced to offer their products for a lower price
In 2014 new residential construction will decline
further due to low permit issuance. Renovation is
less late-cyclical and will grow slightly backed by
improving consumer confidence (execution of
postponed home improvement), supporting
measures from the ‘Energieakkoord’ and the
prolonged VAT reduction on renovation works
The residential order backlog has reached a level of
5.6 months in January 2014 and has been circling
around this number for 6 months, indicating that
the worst might be over. This is also confirmed by
large construction companies, indicating that both
order books and sales are near stabilisation after a
long period of decline
Dutch Residential: patience needed, anticipated production growth will not immediately result in margin improvement
Source: CBS, Rabobank, 2014 Source: CBS, Rabobank 2014, index 2010=100 Source: CBS, Rabobank, 2014
Prices newly built homes (index 2010=100) Architect orders & cost orders received
Order backlog residential (in months)
Margin of future production under pressure Index architect orders bottoming out
Order book beyond the lowest point
4
6
8
10
Jan 2
005
Jan 2
006
Jan 2
007
Jan 2
008
Jan 2
009
Jan 2
010
Jan 2
011
Jan 2
012
Jan 2
013
Jan 2
014 90
95
100
105
110
Jan-0
8
Jan-0
9
Jan-1
0
Jan-1
1
Jan-1
2
Jan-1
3
Jan-1
4
Input price building costs (total)
Output price building costs
0
2
4
6
8
10
12
0
50
100
150
200
250
300
350
Jan-0
7
Jan-0
8
Jan-0
9
Jan-1
0
Jan-1
1
Jan-1
2
Jan-1
3
Jan-1
4
EURbn
Th
ou
san
ds
index
LH axis - Index costs architect orders
RH axis - Costs of orders received (annualized)
Note (1): based on results of Monitor Bouwketen – December 2013

14
New non-residential production is hampered by (i) increasing vacancies (office
market, retail market), (ii) modest appetite from the corporate sector, (iii)
austerity at public clients, (iv) critical attitude Dutch real estate financiers and (v)
increasing number of competitive all-in rental concepts from providers of existing
properties. Foreign investors are increasingly interested in new-built and existing
Dutch property, but primarily focus on large objects or portfolios1
Currently it seems unlikely that new non-residential production will ever reach
pre-crisis production levels again, as a large share of production was induced by
‘cheap’ money and speculative building initiatives
The order backlog has been circling around 5.4 months in 2013. So far, a
stronger decline in the order backlog has been prevented by the stream of larger
(PPP) projects driven by government spending. We expect the stream of large
projects to shrink further, to be partly offset by brownfield (re)developments
(transformation) and renovation & maintenance
The index of costs of architect orders (covering new construction & renovation)
finally seems to have bottomed out in 2H13. However, the monthly value of
issued permits for new buildings is still declining. This seems to support the
assumption that the transition from greenfield to brownfield developments
(smaller scale, less voluminous) has only just started
The value of issued permits for new buildings declined by roughly 20% YoY in
December 2013 (15% YoY December 2012). Given the large relative contribution
of new-built activity to total non-residential construction (>60%), this indicates
that non-residential production will not recover before 2015
Modest growth of non-residential production in 2015 is foreseen, with logistics
and to a lesser extent retail construction performing markedly better than office
building. Nevertheless, a vigorous recovery of business investments and
continuously improving lending prospects for businesses are crucial for an overall
recovery to really get airborne
Dutch non-residential: increasing vacancies commercial real estate drives transition from greenfield to brownfield developments
Note (1): see the report ‘FGH Real Estate report 2014, focus on flexibility’ about developments in Dutch commercial real estate markets
Source: EIB (March 2014)
Source: CBS, adapted by Rabobank IKT, index 2010=100
Fragile prospects for production growth as of 2015 Non-residential: architect orders & value building permits (EUR m)
New-built assignments practically of the radar Order backlog non-residential construction (in months)
4
6
8
10
Jan 2
005
Jan 2
006
Jan 2
007
Jan 2
008
Jan 2
009
Jan 2
010
Jan 2
011
Jan 2
012
Jan 2
013
Jan 2
014
0
200
400
600
800
0
50
100
150
200
250
Jan-0
7
Jan-0
8
Jan-0
9
Jan-1
0
Jan-1
1
Jan-1
2
Jan-1
3
Jan-1
4
x 1,000
LH-Index costs architect orders RH- Monthly value of permits for new buildings

15
Since the peak in December 2008, the total costs of
orders received (new-built + renovation) has
decreased by 58% to a level of EUR 5.7bn in
December 2013. The increase in January 2014 to
EUR 6.1bn might indicate the start of a recovery
process
However, the costs of finished non-residential
construction works are still heading downwards and
the decline has accelerated in 2013. Based on
improving economic growth prospects, we expect
the costs of finished works to bottom out in 2H14
The recovery pattern will differ strongly per sector,
depending on economic cyclicality as well as the
degree of vacant and suitable existing properties.
The greater the demand for new-built property, the
faster the recovery will proceed
Costs of orders of Professional services (offices) and
the Public Sector seem to have passed the lowest
point. Within the Public segment (Education,
Healthcare, Government), Education and Healtcare
account for 80% of the costs of all Public orders
received. Particularly Education has contributed to
recent increases in costs of Public orders. However,
we expect this to be a temporary effect as lower
population growth and lower budgets decrease
future new production
The uptick in professional services seems an
anomaly in the light of high and increasing vacancy
rates in offices. The recent increase is perhaps
distorted by the effect of a few large projects and
the effects of sizeable re-developments which are
measured as new-built activity
The costs of orders received contain the estimated
building costs of new construction works in a
specific period. The value of these orders is a good
proxy for future new-built production. From the first
two graphs on this slide we can conclude that
production prospects for most sectors are still very
modest, some sectors showing minor improvements
in recent months
When economic activity starts to improve, demand
for new buildings will gradually pick up. However,
oversupply of buildings is a structural problem in
specific commercial sectors like e.g. offices/prof.
services and retail. In our view, existing real estate
will feel increased competition of new-built
properties during a recovery. This will likely push up
vacancy rates to undesired, higher levels
15
Dutch non-residential: appetite for new buildings still very modest, total orders might bottom out in 2014
Source: CBS, Rabobank, (*) annualized numbers
0.0
0.5
1.0
1.5
2.0
2.5
Jan-0
1
Jan-0
2
Jan-0
3
Jan-0
4
Jan-0
5
Jan-0
6
Jan-0
7
Jan-0
8
Jan-0
9
Jan-1
0
Jan-1
1
Jan-1
2
Jan-1
3
Jan-1
4
EUR bn
Orders Professional Services Orders Public Sector
Orders Industrial
Source: CBS, Rabobank, (*) annualized numbers
0.0
0.3
0.5
0.8
1.0
1.3
Jan-0
1
Jan-0
2
Jan-0
3
Jan-0
4
Jan-0
5
Jan-0
6
Jan-0
7
Jan-0
8
Jan-0
9
Jan-1
0
Jan-1
1
Jan-1
2
Jan-1
3
Jan-1
4
EUR bn
Orders Agriculture Orders Trade & retail
Orders Transport & comm. Orders Other services
Source: CBS, Rabobank, (*) annualized numbers
Costs of orders received & finished works *
Costs of orders received – new buildings*
Costs of orders received – new buildings*
First signs of upcoming stabilisation? Slight pickup in services and public sector Low utilisation curbs new-built demand
5.0
7.0
9.0
11.0
13.0
15.0
Jan-0
1
Jan-0
2
Jan-0
3
Jan-0
4
Jan-0
5
Jan-0
6
Jan-0
7
Jan-0
8
Jan-0
9
Jan-1
0
Jan-1
1
Jan-1
2
Jan-1
3
Jan-1
4
Costs of orders received Costs of finished works

16
Hampered by austerity from both the central government and local governments,
the order backlog for roads has been circling around a very low level of 4.8
months for the past year. Although it seems that additional budget cuts by the
central government will not be necessary, Dutch Statistics recently announced
that local governments expect an increase of their budget deficit of EUR 0.6bn up
to EUR 3.7bn in 2014, perhaps stimulating extra budget cuts. We expect the road
order backlog to stabilise in 2014, provided that public bodies will reduce their
expected budget deficits for 2015
The Ground & Waterworks backlog has grown significantly in 2013, up to a level
of 6.8 months, driven by increased budget from the Deltafonds and the flood
protection programme (HWBP). Investments in dams, sluices and dikes will grow
in the coming years, offering further upside potential for the order backlog. In an
earlier stage (2012) the finalisation of the huge Maasvlakte II project has
contributed to a deflation of the order backlog
According to the budget of the central government (MIRT 2014), the total
infrastructure budget will increase by 8% in 2014 up to ~EUR 7.7bn. This will
mainly benefit larger contractors participating in integrated contracts for new-
built roads and main water works. After 2014 budget for new construction
decreases strongly, which is not compensated by an increase in maintenance
We have our doubts about the magnitude of the 2014 MIRT budget increase, as
public bodies e.g. delay larger road projects in order to effectuate austerity.
Liquidity pressure at contractors is growing because tender costs for awarded
projects are not being compensated quickly enough by the actual start of new
assignments
Necessary upgrades of ageing energy,- water and telecom infrastructure require
considerable investments by private companies. However, we expect e.g. energy
spending to be curbed by losses and debt burdens at energy utility companies
and restricted tariff increases at transmission system operators
Dutch Infrastructure: production suffering from widespread austerity and slow private sector investment climate
Source: EIB (March,2014)
Source: MIRT 2014, EIB, Ministry of Infrastructure (September 2013)
Budget cuts result in significantly lower spending after 2014 Infra expenditure budget Central Government (EUR m)
Roads order backlog suffering from lower budgets Order backlog Infra construction (in months)
4
5
6
7
8
Jan 2
005
Jan 2
006
Jan 2
007
Jan 2
008
Jan 2
009
Jan 2
010
Jan 2
011
Jan 2
012
Jan 2
013
Jan 2
014
Roads Ground and Waterworks
0
1,000
2,000
3,000
4,000
5,000
6,000
7,000
8,000
2008
2009
2010
2011
2012
2013
2014(e
)
2015(e
)
2016(e
)
2017(e
)
2018(e
)
Regional infrastructure Megaprojects Water systems Deltafonds
Roads Railways Waterways HWBP

17
The overview of main European PPP projects in the last 3.5 years indicates that
country shares vary widely. The UK dominated the 2012 European PPP market in
terms of value, overtaking France which led the market in 2011
We foresee a further increase of PPP projects in the Netherlands (mainly civil
infrastructure) and also the size of the projects has the tendency to increase. As
projects become bigger, this will increasingly entice foreign contractors to enter
the Dutch market. These contractors will likely bring along their own advisors,
engineers and banks, resulting in more aggressive pricing at both the contractors
side and the financiers side
As PPP is maturing in the Netherlands, we expect the number of legal disputes to
increase. In practice, the responsibilities of the public clients and contractors are
not always well-defined enough, leading to delays in the execution of projects.
Furthermore, we see an increasing number of disputes about the accuracy of
tender criteria and tender allotments
Until 2007 both the value and number of PPP’s has grown significantly within
Europe. Projecting the need and the current infrastructural conditions on the
diminished public funds available for infrastructure, PPP will become increasingly
attractive in the coming years
It is important to consider the Dutch PPP market in European perspective. In
2012 the European PPP market showed the lowest figures for 12 years. The
market is challenged by (i) budget restraints of governments to introduce large
scale infrastructure or building programmes, (ii) the reliance on bank debt and
the availability of affordable alternative funding and (iii) fading political support
for PPP contracts
We conclude that in recent years the Dutch PPP landscape has been developing
relatively favourably, while for example the political support for PPP in the UK
was fading. The public value for money has been questioned as early refinancing
moments resulted in sizeable benefits for equity investors
Dutch PPP market: opportunities expected to ramp up further, but under very competitive pricing levels and increasing legal disputes
Source: EPEC 2013
0%
20%
40%
60%
80%
100%
1H13 2012 2011 2010
Germany Ireland France Spain Netherlands Italy UK Belgium
Source: EPEC, 2013
1 0 1 0 1
3
8
5
20
10
15 13
17 17 17
27 27
30
24
16
18 18
12
18
0
20
40
60
80
100
120
140
160
0
5
10
15
20
25
30
1990
1991
1992
1993
1994
1995
1996
1997
1998
1999
2000
2001
2002
2003
2004
2005
2006
2007
2008
2009
2010
2011
2012
2013(e
)
EURbn
Value of projects (LH axis) Number of projects (RH axis)
Source: EPEC ,2013
Dutch conditions relatively favourable within European PPP market Dutch market: increasing competition and legal discourse
Total value European PPP market and number of projects
Distribution PPP projects by value – main countries
EUR 7.7bn EUR 11.8bn EUR 17.9bn EUR 13.8bn

5
Developments Europe & US III
19
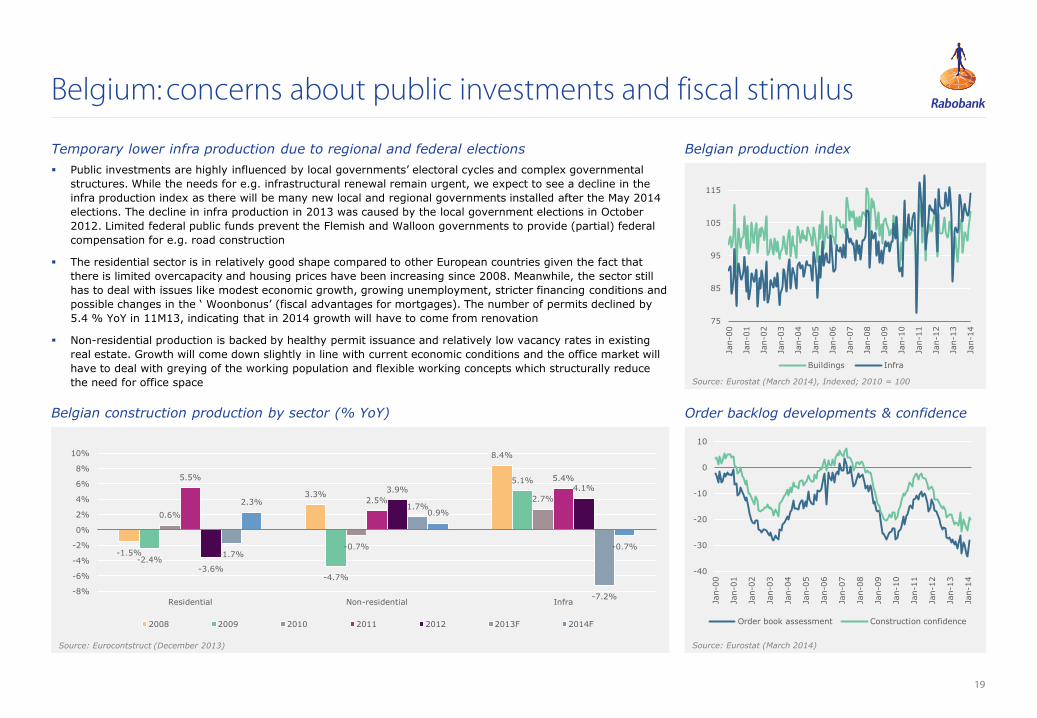
Belgium: concerns about public investments and fiscal stimulus
Source: Eurostat (March 2014), Indexed; 2010 = 100
Source: Eurostat (March 2014) Source: Eurocontstruct (December 2013)
Belgian production index
Order backlog developments & confidence Belgian construction production by sector (% YoY)
-1.5%
3.3%
8.4%
-2.4%
-4.7%
5.1%
0.6%
-0.7%
2.7%
5.5%
2.5%
5.4%
-3.6%
3.9% 4.1%
-1.7%
1.7%
-7.2%
2.3%
0.9%
-0.7%
-8%
-6%
-4%
-2%
0%
2%
4%
6%
8%
10%
Residential Non-residential Infra
2008 2009 2010 2011 2012 2013F 2014F
Public investments are highly influenced by local governments’ electoral cycles and complex governmental
structures. While the needs for e.g. infrastructural renewal remain urgent, we expect to see a decline in the
infra production index as there will be many new local and regional governments installed after the May 2014
elections. The decline in infra production in 2013 was caused by the local government elections in October
2012. Limited federal public funds prevent the Flemish and Walloon governments to provide (partial) federal
compensation for e.g. road construction
The residential sector is in relatively good shape compared to other European countries given the fact that
there is limited overcapacity and housing prices have been increasing since 2008. Meanwhile, the sector still
has to deal with issues like modest economic growth, growing unemployment, stricter financing conditions and
possible changes in the ‘ Woonbonus’ (fiscal advantages for mortgages). The number of permits declined by
5.4 % YoY in 11M13, indicating that in 2014 growth will have to come from renovation
Non-residential production is backed by healthy permit issuance and relatively low vacancy rates in existing
real estate. Growth will come down slightly in line with current economic conditions and the office market will
have to deal with greying of the working population and flexible working concepts which structurally reduce
the need for office space
Temporary lower infra production due to regional and federal elections
-40
-30
-20
-10
0
10
Jan-0
0
Jan-0
1
Jan-0
2
Jan-0
3
Jan-0
4
Jan-0
5
Jan-0
6
Jan-0
7
Jan-0
8
Jan-0
9
Jan-1
0
Jan-1
1
Jan-1
2
Jan-1
3
Jan-1
4
Order book assessment Construction confidence
75
85
95
105
115
Jan-0
0
Jan-0
1
Jan-0
2
Jan-0
3
Jan-0
4
Jan-0
5
Jan-0
6
Jan-0
7
Jan-0
8
Jan-0
9
Jan-1
0
Jan-1
1
Jan-1
2
Jan-1
3
Jan-1
4
Buildings Infra

20
France: battling with unemployment and weak business climate
Source: Eurostat (March 2014). Indexed: 2010=100
Source: Eurostat (March 2014) Source: Euroconstruct (December 2013)
French production index
Order backlog developments & confidence French construction production by sector (% YoY)
In 2014 the ‘advantageous’ VAT rate for residential renovation will be elevated from 7% to 10%. In
combination with still high unemployment rates, wage reductions and unfavourable changes in rental
investment schemes, residential production will decline in the coming year, albeit at a lower pace than in
2013. Social housing ambitions by the central government are expected to offer some consolation to the
number of new building starts and prevent the number to drop under the 2013 low of 330,000 units
Unemployment has reached an all-time high of 11% and a pick-up in private consumption will be curbed as
long as the economic growth engine is still running in low gear. The Hollande administration announced EUR
50bn in tax cuts for businesses, but without clear funding plans yet. Tax cuts will not result in a recovery of
non-residential production before 2015. Firstly, utilisation rates have to improve markedly before corporate
investments in buildings will increase. In the build-up to the regional elections in 2015, local public
investments can slightly spur construction activity in the non-commercial segments
Although the French production indexes seem to edge up from their troughs, it will be a lengthy road towards
full recovery. This is illustrated by the trend in construction confidence. Currently infrastructure seems to have
the best cards to reap the short term benefits of stimulus measures. Main infra contractors fierily count on the
signing of a stimulus package of EUR 3.6bn in 1H14 to expand the road network
Construction recovery curbed by austerity and slowly improving utilisation of businesses
-3.0%
-1.3%
-2.9%
-7.3% -8.3%
-6.5% -5.4%
-8.9%
-3.3%
6.3%
3.0% 1.9%
-0.4%
1.8%
-0.4%
-3.9%
-2.5% -1.1% -1.3%
-2.6%
-0.7%
-10%
-8%
-6%
-4%
-2%
0%
2%
4%
6%
8%
Residential Non-residential Infra
2008 2009 2010 2011 2012 2013F 2014F
-60
-40
-20
0
20
40
60
Jan-0
0
Jan-0
1
Jan-0
2
Jan-0
3
Jan-0
4
Jan-0
5
Jan-0
6
Jan-0
7
Jan-0
8
Jan-0
9
Jan-1
0
Jan-1
1
Jan-1
2
Jan-1
3
Jan-1
4
Order book assessment Construction confidence
80
90
100
110
120
130
Jan-0
0
Jan-0
1
Jan-0
2
Jan-0
3
Jan-0
4
Jan-0
5
Jan-0
6
Jan-0
7
Jan-0
8
Jan-0
9
Jan-1
0
Jan-1
1
Jan-1
2
Jan-1
3
Jan-1
4
Buildings Infra

21
Germany: strong economy drives early spring in construction
Source: Eurostat (March 2014). Indexed: 2010=100
Source: Eurostat (March 2014) Source: Euroconstruct (December 2013)
German production index
Order backlog developments & confidence
German construction production by sector (% YoY)
The issuance of residential permits increased by 13% YoY in 2013 and indicates that residential production is
on the rise. Although mortgage credit growth is quite modest, low interest rates make it attractive for
investors to invest their capital into residential estate rather than in financial products. Low interest rates also
encourage consumers to buy homes instead of parking their cash on a savings account. Furthermore,
residential construction is supported by a falling unemployment rate and strong immigration flows
Economic growth is gathering pace as industrial production is increasing. Driven by both domestic
consumption and export demand, utilisation rates are improving and the demand for new industrial, storage
and commercial buildings is growing. Demand for new office buildings and public buildings is less buoyant due
to the absorption of (regional) overcapacity and budget consolidation at federal and regional governments.
Renovation spending keeps developing steadily, backed by energy efficient building policies
Infra growth was meagre in 2013 due to very bad weather in 1H13 and the phasing out of stimulus packages.
As local authorities are the most important investors in infrastructure, it is encouraging that economic growth
is now accelerating and drives higher (municipal) tax revenues. Also the Federal government is likely to
increase its investments in transport infrastructure. Private investments in energy infrastructure seem to be
curbed by the impact of the energy market reforms (a.o. phasing out nuclear)
Construction supported by wage trends, industrial production and public spending
-0.1%
6.9%
1.3%
-2.0% -1.6%
-4.3%
4.2%
1.1%
0.1%
6.1%
3.3%
5.4%
1.2%
-3.7% -4.5%
1.0%
-1.0%
0.2%
2.6% 2.4%
3.4%
-6%
-4%
-2%
0%
2%
4%
6%
8%
Residential Non-residential Infra
2008 2009 2010 2011 2012 2013F 2014F
-70
-60
-50
-40
-30
-20
-10
0
Jan-0
0
Jan-0
1
Jan-0
2
Jan-0
3
Jan-0
4
Jan-0
5
Jan-0
6
Jan-0
7
Jan-0
8
Jan-0
9
Jan-1
0
Jan-1
1
Jan-1
2
Jan-1
3
Jan-1
4
Order book assessment Construction confidence
70
80
90
100
110
120
130
140
Jan-0
0
Jan-0
1
Jan-0
2
Jan-0
3
Jan-0
4
Jan-0
5
Jan-0
6
Jan-0
7
Jan-0
8
Jan-0
9
Jan-1
0
Jan-1
1
Jan-1
2
Jan-1
3
Jan-1
4
Buildings Infra

22
25
30
35
40
45
50
55
60
65
70
75
Jan 0
1
Jan 0
2
Jan 0
3
Jan 0
4
Jan 0
5
Jan 0
6
Jan 0
7
Jan 0
8
Jan 0
9
Jan 1
0
Jan 1
1
Jan 1
2
Jan 1
3
Jan 1
4
Ireland: construction activity seems to have turned the corner
Note (1): NAMA stands for National Asset Management Agency, NAMA functions as a bad bank, acquiring property development loans from Irish banks in return for government bonds in order to improve the
availability of credit in the Irish economy
Source: Ulster bank, Markit Economics (March 2014)
Source: Euroconstruct, Central Bank of Ireland (March 2014) Source: Euroconstruct (December 2012)
Irish PMI construction activity indicator
GDP, construction & housing completions
Irish construction production by sector (% YoY)
The European Commission recently raised Irish GDP forecasts, based on positive signs like growing domestic
demand and slightly improving unemployment figures. The Irish economy is far from fully ‘cured’ as e.g.
household deleveraging and mortgage arrears remain serious challenges, but we expect the favourable
developments to fuel through to the residential construction sector. It is estimated that Ireland is in need of
30,000 homes yearly, while in recent years hardly 5,000 homes were built. Housing prices in Dublin and in
other urban areas are on the rise and specific locations are actually facing supply shortages
Non-residential construction is primarily driven by public sector spending (>60%) and particularly by NAMA1
and NDFA (PPP) support projects. The support plans imply several billion Euros and will primarily benefit
offices, industrial buildings, schools and healthcare centers. As large international companies are keen to
concentrate their European headquarters in Dublin, shortages for high quality offices in e.g. Dublin’s central
district are growing
Government support is also driving road building and repair projects. Most of these projects will be tendered
as PPP projects. Other main spending categories are water & sewage, rail and energy transmission and
distribution infrastructure. All said, we expect Irish construction to improve gradually during the year, which
should be reflected by the construction activity indicator performing significantly above 50
Overcorrection of construction sector already fostering shortages in specific niches
-15.4%
0.2%
21.2%
-45.9%
-38.8%
-3.5%
-27.4%
-41.3%
-19.2%
-8.0%
-22.1% -25.4%
-18.3%
-7.9%
-19.6%
-8.5%
3.3%
-0.9%
13.6% 10.1%
4.7%
-50%
-40%
-30%
-20%
-10%
0%
10%
20%
30%
Residential Non-residential Infra
2008 2009 2010 2011 2012 2013F 2014F
Growth
Contraction
0
10
20
30
40
50
60
70
80
90
-40%
-30%
-20%
-10%
0%
10%
06 07 08 09 10 11 12 13 14E 15E
Th
ou
san
ds
Housing completions (RH axis)
GDP growth (YoY LH axis)
Construction growth (YoY LH axis)

23
Spain: solving imbalances might stop construction decline in 2015
Source: Eurostat (March 2014). Indexed: 2010=100
Source: Eurostat (March 2014) Source: Euroconstruct (December 2013)
Spanish production index
Order backlog developments & confidence
Spanish construction production by sector (% YoY)
With 26% of the workforce unemployed and a decline in average household disposable income for four
consecutive years, the government plans to boost consumer spending power by major tax reforms. The
reforms should entice companies to hire new employees while simultaneously consumers start to pay higher
taxes for the consumption of goods and services (VAT). The recovery of the residential market will be highly
dependent on improving income prospects, credit availability and the absorption of the huge residential
oversupply created during the boom years. Meanwhile there seems to be a handful of foreign investors back in
the market buying residential properties at huge discounts
The production index and the construction confidence might suggest that Spanish construction is bottoming
out. Given sizeable imbalances (labour market, public budget, private financing) and the oversupply of real
estate it will take a few more years before non-residential production will report modest growth. However, the
rate of decline will decelerate as the export of relatively cheap Spanish goods keeps growing
For growth to return in infrastructure, it is crucial that public finance constraints are being solved. Currently
the government is involved in a dispute with main contractors over the bankruptcy of 9 toll roads. The
government considers to pull out of state guarantees as the awarding of the guarantees would enlarge the
national deficit. This decreases the appetite of private (foreign) investors to participate in new infra projects
Exports growing strongly while construction recovery is hold back by impoverished nation
-30.1%
-6.5% -5.7%
-38.5%
-17.2%
1.7%
-18.2% -18.8%
-16.4% -15.4% -11.9%
-32.3% -30.5%
-20.7%
-44.7%
-19.2%
-14.5%
-42.0%
-6.1% -4.2%
-13.4%
-50%
-40%
-30%
-20%
-10%
0%
10%
Residential Non-residential Infra
2008 2009 2010 2011 2012 2013F 2014F
30
50
70
90
110
130
150
170
190
210
Jan-0
0
Jan-0
1
Jan-0
2
Jan-0
3
Jan-0
4
Jan-0
5
Jan-0
6
Jan-0
7
Jan-0
8
Jan-0
9
Jan-1
0
Jan-1
1
Jan-1
2
Jan-1
3
Jan-1
4
Buildings Infra
-80
-60
-40
-20
0
20
40
60
Jan-0
0
Jan-0
1
Jan-0
2
Jan-0
3
Jan-0
4
Jan-0
5
Jan-0
6
Jan-0
7
Jan-0
8
Jan-0
9
Jan-1
0
Jan-1
1
Jan-1
2
Jan-1
3
Jan-1
4
Order book assessment Construction Confidence

24
United Kingdom: residential construction and infrastructure surging
Source: Eurostat (March 2014). Indexed; 2010=100
Source: Office for National statistics, quarterly moving average, index
2005 = 100 Source: Euroconstruct (December 2013)
UK production index
Order backlog index
UK construction production by sector (% YoY)
The ‘Funding for lending’ and ‘Help to buy’ schemes clearly had an impact on residential production as new
housing starts have grown by 23% YoY in 2013 and mortgage lending was 38% higher in January 2014 than
in January 2013. The new residential market is likely to improve further on the back of increasing consumer
confidence, low interest rates and falling unemployment. So far the ‘Green Deal’ scheme fails to boost energy
efficient renovation and maintenance. In 2013 only 746 green deals have been carried out
New non-residential production is strongly dependent on the new ‘PF2’ scheme for PPP projects. The old
scheme had raised public debate about insufficient flexibility and high contract costs. As a result, the ‘Schools
for the future’ programme was cancelled. Despite the introduction of PF2 early 2013, it has not fuelled new
production substantially yet and a proper pipeline of projects seems to be lacking. Meanwhile, the first green
shoots in private sector funded projects (offices, industrial) are visible and when retail sales really take off,
total commercial construction should provide a foundation for sector growth as of 2015
The UK is still a preferred location for many infrastructure funds. Apart from the initiative(4Q13) to invest up
to GBP 375bn in energy, water, communication and transport projects in the next 2 decades, the government
keeps working hard to attract foreign investment. In February 2014 AMP Capital (AUS) announced that it
plans to raise up to GBP 0.5bn for a UK listed infra fund, scheduled for launch in 1H14
Visible impact of stimulus programmes for new home building and transport infrastructure
-9.8%
0.8%
7.8%
-15.2% -15.0%
3.9%
11.6%
1.8%
10.6%
1.4%
-0.3%
9.6%
-5.1%
-9.7% -8.7%
0.8%
-4.9%
3.4% 5.3%
-2.1%
6.1%
-20%
-15%
-10%
-5%
0%
5%
10%
15%
Residential Non-residential Infra
2008 2009 2010 2011 2012 2013F 2014F
50
70
90
110
Jan-0
0
Jan-0
1
Jan-0
2
Jan-0
3
Jan-0
4
Jan-0
5
Jan-0
6
Jan-0
7
Jan-0
8
Jan-0
9
Jan-1
0
Jan-1
1
Jan-1
2
Jan-1
3
Jan-1
4
Buildings Infra
40
60
80
100
120
140
160
1Q
00
1Q
01
1Q
02
1Q
03
1Q
04
1Q
05
1Q
06
1Q
07
1Q
08
1Q
09
1Q
10
1Q
11
1Q
12
1Q
13
1Q
14
Residential Infrastructure non-residential

25
Looking at construction output in the Nordics, we
conclude that only Norway shows a relatively strong
performance over the full 2010-2014 period. The
other Nordic countries report very divergent
patterns, caused by specific national challenges and
economic structure. However, the 4 Nordic
countries together show a much stronger
construction performance than the total
Euroconstruct 19 countries
Attracted by the steady supply of infrastructure
projects, many European contractors try their luck
in the Nordics. However, foreign firms typically
need to start their operations as a subcontractor as
mostly just local professional qualifications are
recognized by the trade unions
The shale gas boom is offering opportunities for
infra contractors experienced in the ‘power’
segment; shale-based oil, natural gas, pipeline
construction, petrochemical plants and LNG plants.
The growing popularity of PPP is generating
investments in transport infrastructure, resulting in
highway/bridge/tunnel expansions
The pent-up residential demand during the crisis
has led to accelerated growth in the past 3 years. In
2014, we expect that growth will decelerate
somewhat. There is a transition taking place from a
market strongly driven by institutional buyers to
home-buyers who can finally complete their
postponed housing dream
Other regions: Nordics deviating positively from European trend, US benefiting from pent-up residential demand and shale gas
Source: Euroconstruct, index 2008=100
0.5%
1.6%
3.3% 3.6%
-8%
-6%
-4%
-2%
0%
2%
4%
6%
8%
Finland Sweden Denmark Norway
2010 2011 2012 2013F 2014F
Source: Euroconstruct (December 2012)
Source: US Census bureau, FMI Corporation
Nordic vs. European construction index Construction production by country (% YoY)
Nordics: doing better than rest of Europe
Infrastructural production (USD bn)
US construction market outlook (% YoY)
Source: FMI Corporation (December 2013)
80
85
90
95
100
105
110
115
2008 2009 2010 2011 2012 2013 2014
Euroconstruct 19 Nordic 4
0
20
40
60
80
100
120
140
160
180
200
220
2007 2008 2009 2010 2011 2012 2013F 2014F
Power Roads Other/Civil
US: infra and residential opportunities
12.3%
4.7% 4.3%
-30%
-20%
-10%
0%
10%
20%
Residential Non-residential Infra
07 08 09 10 11 12 13E 14E

5
European contractors: metrics & strategy comparison V

27
The decrease in the backlog- to- sales ratio in 2013
is the result of a relatively modest decline in sales,
while the average order backlog experienced an
accelerated decline compared to the previous year.
As of 2014 we expect the ratio to increase
gradually, primarily stimulated by growing order
backlogs. Sales growth can be boosted by cash
generating companies with the means to make
acquisitions or to buy distressed assets and
activities of competitors
Between 2009-2011 large contractors gained
market share at the expense of smaller companies,
which partially explains the increase in the ratio at a
time that construction market conditions in general
worsened significantly
The average EBIT margin of European contractors
increased in 2013. However, the margin on
construction activities is still below 4%, which
emphasizes the vulnerability of pure play
contractors. Given high industry risks, still meagre
order books and a more limited availability of
funding, we also see a renewed interest to refocus
on the core business
Many Dutch firms have acquired projects at or
below cost price due to declining market volumes
and intense competition. On top of that, the
majority of Dutch contractors is primarily active in
the Dutch market. In our view this will at best lead
to a slight improvement of Dutch construction
margins as of 2015
The depressed development of construction
production in Western Europe was continued in
2013 by a YoY decline of 1.2%. Meanwhile the
aggregated sales of the largest European
contractors declined by 1.5%. However, in the past
decade the sales index has developed far more
favorably than the production index
Many companies have softened the effects of
decline by focussing on diversification in e.g.
engineering services, maintenance, energy and PPP
contracts. Others increasingly expanded their
activities outside Europe in order to escape meagre
prospects. M&A activity slowed down somewhat and
deals were relatively small, due to the need to
deleverage (see also next slide)
Metrics: sales developments and margin growth indicate increased diversification at European contractors
Note (1): margins on this slide are calculated from the figures of 23 largest listed European contractors (including 3 Dutch listed companies), Laing O’ Rourke (UK) and the 5 largest non-listed Dutch companies
Source: Annual reports Source: annual reports, based on Bloomberg estimates listed
companies Source: Annual reports, Bloomberg, Euroconstruct,. Index 2004 = 100
Construction backlog/construction sales (%) European contractors EBIT Margin1 (%) European contractors – Sales index1
Last year of decline backlog-to-sales ratio EBIT margins have seen lowest point Diversification helps to mitigate downturn
75
85
95
105
115
125
135
145
155
165
175
04 05 06 07 08 09 10 11 12 13E 14E 15E
Sales index-listed constructors
Production index - Construction Western Europe
6.1% 6.4%
7.2% 7.3%
5.7% 5.5%
5.9%
5.3%
4.3%
5.0%
5.7% 6.0%
0%
2%
4%
6%
8%
04 05 06 07 08 09 10 11 12 13E 14E 15E
EBIT% - all activities
EBIT% - construction
EBIT % - NL construction
average EBIT % - construction
104% 111% 113%
119% 115% 124%
140% 147%
133% 127%
0%
20%
40%
60%
80%
100%
120%
140%
04 05 06 07 08 09 10 11 12 13E
Order backlog as % of sales

28
Less pressure on the financial system might create
willingness among financiers to allow for a slightly
slower pace of restructuring and deleveraging at
construction companies
Despite growing expectations that new stimulus
measures could be introduced in 2014, the ECB
recently announced that it is not very likely that it
will buy loans and other assets from banks in the
short term to support Euro zone recovery
We conclude that the need for deleveraging will
remain in the coming years, whereby contractors
will have to consider asset sales and cost reductions
which provide cash for debt reduction and working
capital support
The average P/E ratio skyrocketed in 2012 due to
huge net losses at various (South)- European
contractors. In 2013 the ratio is still high given the
fact that net profits/losses only edged up modestly
from their troughs, while share prices are strongly
on the rise
We expect a deceleration of share price increases
and gradually improving net profits based on
analysts’ estimates as polled by Bloomberg. As a
result the P/E ratio will decline in 2014-15
We conclude that European construction shares are
becoming more attractive based on the growing
perception that the industry finally bottoms out and
has passed the lowest point
The increase in the EV/EBITDA multiple for 2014 is
largely caused by analysts’ expectations that share
prices keep improving, net debt reduction
progresses slowly and margins will only improve
slightly
We expect that EV/EBITDA multiples in the coming
years might be slightly lower than current analysts’
estimates suggest. EBITDA can improve backed by
increased diversification into non-construction
activities
We also expect certain contractors to refocus on
their core business, resulting in better synergy,
higher operational excellence (see also next slide)
and stronger EBITDA margins
Metrics: relatively slow earnings recovery triggers need for further deleveraging and cash generation
Notes (1): multiples on this slide have been calculated based on figures of 23 listed construction companies, in EV/EBITDA and Net debt/EBITDA calculations no adjustments for non-recourse loans have been made
Source: Bloomberg consensus estimates, annual reports Source: Bloomberg consensus estimates Source: Bloomberg consensus estimates
European contractors: Net debt/EBITDA1 European contractors: P/E ratio1 European contractors: EV/EBITDA1
Deleveraging remains key topic Slow earnings recovery impacts P/E ratio
EV/EBITDA ratio remains relatively high
4.9
6.0
9.0
10.5
8.6
7.3 7.3 6.9 6.8 6.7
7.3 6.8
0
2
4
6
8
10
12
04 05 06 07 08 09 10 11 12 13E 14E 15E
9.4 11.9 11.1
12.8 14.4
11.4 8.9
13.2
52.2
25.0
15.1
9.3
0
10
20
30
40
50
60
04 05 06 07 08 09 10 11 12 13E 14E 15E
0
1
2
3
4
5
04 05 06 07 08 09 10 11 12 13E 14E 15E
29
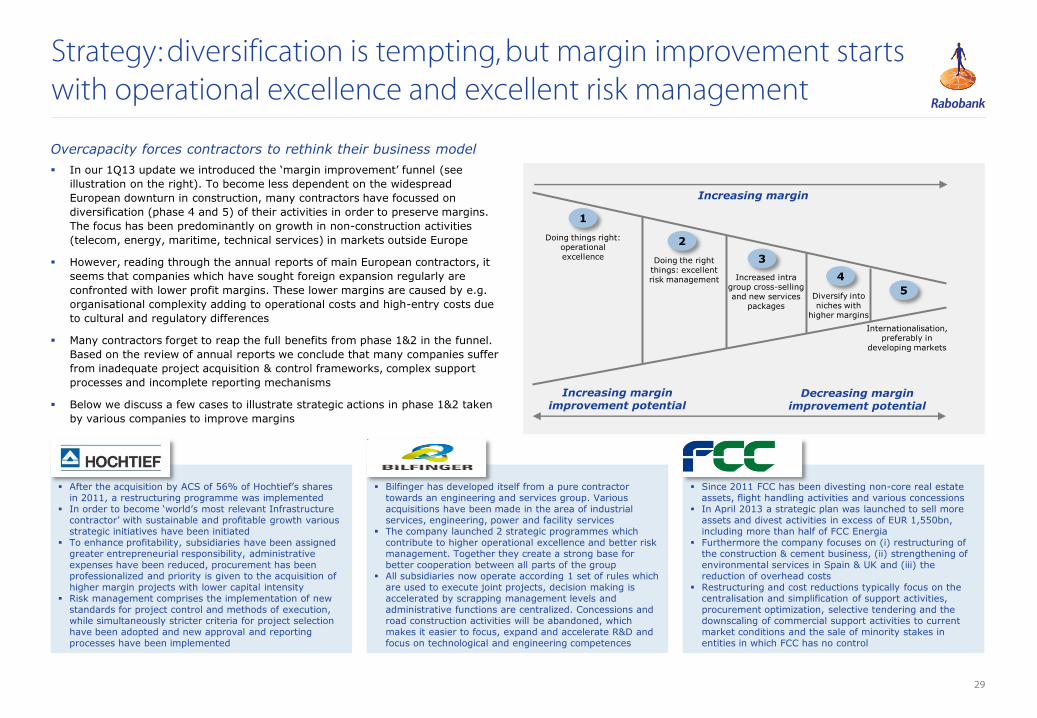
Strategy: diversification is tempting, but margin improvement starts with operational excellence and excellent risk management
In our 1Q13 update we introduced the ‘margin improvement’ funnel (see
illustration on the right). To become less dependent on the widespread
European downturn in construction, many contractors have focussed on
diversification (phase 4 and 5) of their activities in order to preserve margins.
The focus has been predominantly on growth in non-construction activities
(telecom, energy, maritime, technical services) in markets outside Europe
However, reading through the annual reports of main European contractors, it
seems that companies which have sought foreign expansion regularly are
confronted with lower profit margins. These lower margins are caused by e.g.
organisational complexity adding to operational costs and high-entry costs due
to cultural and regulatory differences
Many contractors forget to reap the full benefits from phase 1&2 in the funnel.
Based on the review of annual reports we conclude that many companies suffer
from inadequate project acquisition & control frameworks, complex support
processes and incomplete reporting mechanisms
Below we discuss a few cases to illustrate strategic actions in phase 1&2 taken
by various companies to improve margins
Overcapacity forces contractors to rethink their business model
Increasing margin improvement potential
Decreasing margin improvement potential
1
2
3
4 5
Doing things right: operational excellence Doing the right
things: excellent risk management Increased intra
group cross-selling and new services
packages
Diversify into niches with
higher margins
Internationalisation, preferably in
developing markets
Increasing margin
After the acquisition by ACS of 56% of Hochtief’s shares in 2011, a restructuring programme was implemented
In order to become ‘world’s most relevant Infrastructure contractor’ with sustainable and profitable growth various strategic initiatives have been initiated
To enhance profitability, subsidiaries have been assigned greater entrepreneurial responsibility, administrative expenses have been reduced, procurement has been professionalized and priority is given to the acquisition of higher margin projects with lower capital intensity
Risk management comprises the implementation of new standards for project control and methods of execution, while simultaneously stricter criteria for project selection have been adopted and new approval and reporting processes have been implemented
Bilfinger has developed itself from a pure contractor towards an engineering and services group. Various acquisitions have been made in the area of industrial services, engineering, power and facility services
The company launched 2 strategic programmes which contribute to higher operational excellence and better risk management. Together they create a strong base for better cooperation between all parts of the group
All subsidiaries now operate according 1 set of rules which are used to execute joint projects, decision making is accelerated by scrapping management levels and administrative functions are centralized. Concessions and road construction activities will be abandoned, which makes it easier to focus, expand and accelerate R&D and focus on technological and engineering competences
Since 2011 FCC has been divesting non-core real estate
assets, flight handling activities and various concessions In April 2013 a strategic plan was launched to sell more
assets and divest activities in excess of EUR 1,550bn, including more than half of FCC Energia
Furthermore the company focuses on (i) restructuring of the construction & cement business, (ii) strengthening of environmental services in Spain & UK and (iii) the reduction of overhead costs
Restructuring and cost reductions typically focus on the centralisation and simplification of support activities, procurement optimization, selective tendering and the downscaling of commercial support activities to current market conditions and the sale of minority stakes in entities in which FCC has no control

30
Globalization is progressing quickly in the construction industry. According to a
global study by Oxford Economics1 global construction output will have grown by
70% between 2012 and 2025. Construction production will grow from USD 8,700
bn to USD 15,000 bn. Although the Chinese construction market will grow more
moderately in the coming years, China will be the largest market with a share of
25% of global output in 2025
China, the USA and India together will be responsible for 60% of total output in
2025, while Western Europe will only cover 25% of total production. Within
Europe Germany remains the largest market, but growth will be far from
spectacular. The Netherlands will likely grow in line with the Western European
average which is slightly below 2%. The UK is expected to outperform the
European average based on assumptions that investment capital keeps flowing to
the much needed infrastructure improvements
Developments clearly illustrate that emerging markets will take over the lead
from industrialized countries as population growth and urbanization are soaring.
This implies that European contractors need to expand in foreign markets in
order to preserve critical mass in specific disciplines and to ensure a steady work
stream when domestic markets come to a standstill
However, we already concluded on slide 29 that foreign expansion is not an easy
task (phase 5 in the funnel). Contractors should choose carefully in picking their
preferred regions for growth. For example it means that setting up a foreign
subsidiary may seem interesting, but is of no use when the order book dries up
after a few projects due to potential clients failing to secure financing.
Contractors could be tempted to take aboard too much project risk by ‘pre’-
financing projects by themselves
Other main issues to consider are supply chain & logistics reliability (procurement
and sourcing of materials and equipment), currency issues, repatriation of profits
and equipment and corruption. Research by foreign institutes suggests that a
localization strategy which comprises a.o. the hiring of local employees and
cooperation with local subcontractors through joint ventures is enhancing
performance and margins. Bearing this in mind, expansion will still imply foreign
acquisitions, but could be more organic
Meagre European growth challenges contractors to rethink business models and find solutions to untap foreign markets
Note (1): Construction 2025 report, 2013
65%
48%
45%
41%
37%
35%
52%
55%
59%
63%
0% 20% 40% 60% 80% 100%
2005
2012
2015
2020
2025
Developed Emerging
Source: Construction 2025, Oxford Economics, adapted by Rabobank
0%
2%
4%
6%
8%
10%
Fra
nce
Germ
any
Spain
Neth
erl
ands
Weste
rn E
uro
pe
Sw
eden
Belg
ium
Bra
zil
UK
US
Canada
Colo
mbia
Saudi Ara
bia
Turk
ey
Indonesia
Vie
tnam
Chin
a
India
Nig
eri
a
Source: Construction 2025, Oxford economics, adapted by Rabobank
Construction production CAGR 2013 - 2025
Emerging regions will dominate global construction output in 2025
Construction production in developed & emerging regions

31
Looking at the EBIT margin developments on slide 28, we conclude that Dutch
contractors still face declining margins where it concerns their construction
activities. Meanwhile the European peer group as a whole is reporting slightly
growing margins (on total revenues and construction activities) in 2013
In order to explain margin differences, it is interesting to investigate spending on
main cost categories. On average the group of 10 European contractors is
spending significantly less on subcontractors and building materials than the
group of the 10 Dutch contractors
It could be argued that European contractors, according to their larger size, have
certain economies of scale, while many Dutch contractors lack these
‘procurement’ advantages. However, the Dutch construction sector as a whole is
reporting fairly lower costs than the Dutch top 10. Main Dutch contractors should
at least investigate which options they have to reduce operational costs, as this is
the strongest driver to improve performance and margins
With failure costs estimated at 5-35% of total sales2 or 20% of total costs,
margin improvement potential is huge when these unnecessary costs are
avoided. Failure costs relate e.g. to poor communication & cooperation within the
value chain and ill prepared designs & engineering, resulting in high adaptation
costs. These failure costs likely most strongly present themselves in phase 1 and
2 of the funnel (previous slide) and in subcontracting and material costs (see
graph on the right)
Altogether subcontractors, materials and labour costs make up for 86% of total
costs. Thus failure cost reduction initiatives should focus on these categories.
However, there are also unavoidable failure costs, related to e.g. bankruptcies of
subcontractors or constraints at clients. For example restrictions imposed on
Dutch housing corporations have resulted in the scaling down of new-built
ambitions and cancellations of building plans. Likely, the share of unavoidable
failure costs has grown strongly in recent years
Metrics: cost structure differences between Dutch and European players suggest room for cost reductions
Note (1): companies used for comparison are NCC, Strabag, Skanska, Ferrovial, Bouygues, Vinci, ACS, Bilfinger, Eiffage, FCC, Volker Wessels, Ballast Nedam, BAM, Heijmans, TBI Group, Strukton, Dura Vermeer, Van
Wijnen, Mourik, ASVB
Note (2): Based on research in the UK and the Netherlands (Deloitte)
Costs and depreciation as a percentage of total net revenues
29%
26%
24%
24%
21%
0% 20% 40% 60% 80% 100%
Dutch sector
(CBS)
European 10
Dutch 10(*)
Subcontractors Building materials Employee costs
Source: CBS, annual reports,(*) split between subcontractors and building materials not available
100%
30%
30%
18%
8% 7%
3% 3% 1%
Tota
l costs
Subcontr
acto
rs
Buildin
g m
ate
rials
Gro
ss w
ages
Oth
er
em
plo
yee
costs
Oth
er
costs
Tra
nsport
costs
Depre
cia
tion
Accom
modation
costs
Source: CBS, Rabo analysis, last available data is of 2011
Cost reduction potential curbed by growth unavoidable failure costs Costs categories Dutch construction sector - % of total costs
European contractors seem more cost efficient than Dutch top 10 Main costs categories – costs as % of total revenues (2011)1
92%
86%
81%

32
Rabobank
Industry Knowledge Team
Leontien de Waal
Industry analyst
Contact details
Rabobank
Wholesale Clients Netherlands
Office address
Croeselaan 28
3521 CB Utrecht
Postal address
UCZ5096
P.O. Box 17100
3500 HG Utrecht
The Netherlands
Telephone +31 (0)30 71 22 718
Mobile +31 (0)6 202 90 481
E-mail [email protected]
Rabobank
Coverage Large Corporates
Robbert Klaasman
Sector Head Construction,
Engineering & Maritime Industries
Telephone +31 (0)30 71 24 413
Mobile +31 (0)6 535 71 825
E-mail [email protected]

33
Important notice
This document is prepared by either Coöperatieve Centrale Raiffeisen-Boerenleenbank B.A., trading as Rabobank International (“RI”) or Coöperatieve Centrale Raiffeisen-Boerenleenbank B.A., acting through its New York Branch and any of its associated or affiliated companies and directors, representatives or employees. Coöperatieve Centrale Raiffeisen-Boerenleenbank B.A. is incorporated in the Netherlands. The liability of its members is limited. Coöperatieve Centrale Raiffeisen-Boerenleenbank B.A. is authorised and regulated by De Nederlandsche Bank N.V. Furthermore, RI in the Netherlands is regulated by the Netherlands Authority for the Financial Markets. RI, London Branch is regulated by the Financial Services Authority for the conduct of UK business. RI, London Branch is registered in England and Wales under no. BR002630. With respect to this document, in the U.S.A., any banking services are provided by Coöperatieve Centrale Raiffeisen-Boerenleenbank B.A., New York Branch and any securities related business is provided by Rabo Securities USA, Inc., a U.S. registered broker dealer. This document is directed exclusively to either Eligible Counterparties and Professional Clients on the one hand and Market Counterparties and Intermediate Customers on the other. It is not directed at Retail Clients respectively Private Customers. This document is for information and discussion purposes only. Neither this document nor any other statement (oral or otherwise) made at any time in connection herewith isand is not, and should not be construed as an offer, invitation or recommendation to acquire or dispose of any securities or a commitment to enter into any transaction. Any transaction would be subject to contract, satisfactory documentation and market conditions. All parties are advised to seek independent professional advice as to the suitability of any products and their tax, accounting, legal or regulatory implications. The information and opinions contained in this document have been compiled or arrived at from public sources believed to be reliable, but no representation or warranty, express or implied, is made as to the accuracy, completeness or warranty, express or implied. This document does not constitute investment advice, nor is it intended to be investment research. All opinions expressed in this document are subject to change without notice. This document does NOT purport to be an impartial assessment of the value or prospects of its subject matter and it must not be relied upon by any recipient as an impartial assessment of the value or prospects of its subject matter. The information contained in this document is not to be relied upon by the recipient as authoritative or taken in substitution for the exercise of judgement by any recipient. To the extent permitted by law, neither RI, nor other legal entities in the group to which it belongs accept any liability whatsoever for any direct or consequential loss howsoever arising from any use of this document or its contents or otherwise arising in connection therewith. Insofar as permitted by applicable laws and regulations, Coöperatieve Centrale Raiffeisen-Boerenleenbank B.A. or other legal entities in the group to which it belongs, their directors, officers and/or employees may have had or have a long or short position or act as a market maker and may have traded or acted as principal in the securities described within this document, or related investments, or may otherwise have conflicting interests, including acting as advisors, brokers, bankers or providing services to companies whose securities, or related investments, are mentioned in this document. Further Coöperatieve Centrale Raiffeisen-Boerenleenbank B.A. may have or have had a relationship with or may provide or have provided corporate finance or other services to companies whose securities (or related investments) are described in this document. This document may not be reproduced, distributed or published, in whole or in part, for any purpose, except with the prior written consent of Coöperatieve Centrale Raiffeisen-Boerenleenbank B.A. By accepting this document you agree to be bound by the foregoing restrictions. © www.rabobank.com © Rabobank International Croeselaan 18, 3521 CB Utrecht, The Netherlands © Rabobank International, London Branch Thames Court, One Queenhithe, London EC4V 3RL, United Kingdom © Coöperatieve Centrale Raiffeisen-Boerenleenbank B.A., New York Branch 245 Park Avenue, New York, New York 10167, United States of America