Embed Size (px)
Citation preview

WORKING PAPER
CONSTRUCTING A REAL ESTATE PRICE INDEX:
THE MOROCCAN EXPERIENCE
EL MAHMAH Assil
June 2012

2
CONSTRUCTING A REAL ESTATE PRICE INDEX:
THE MOROCCAN EXPERIENCE
EL MAHMAH Assil
Abstract
In order to monitor price volatility in the property market for the purpose of the central bank mission, a real estate price index (REPI) was jointly constructed and published in 2010 by Central Bank of Morocco and the Land Registry Office. This index captures quarterly changes in Real Estate prices in Morocco, by region and by major city, in residential property, urban lands and commercial property.
This paper identifies the main approaches used internationally for compiling real estate price indexes, and analyzes the applicability of those methodologies to Morocco. It then discusses aspects related to data, methodology and results.
It was prepared for the IFC Conference on “Statistical Issues and Activities in a Changing Environment”, at the BIS on 28-29 August 2012.
Keywords: Property market, Real estate price index, Average and median prices, Repeat sales method, Hedonic price models.

3
SUMMARY
INTRODUCTION...............................................................................................................4
I- Different methods of compiling Real Estate Price Index (REPI) .................................5
I.1. Simple method ............................................................................................................ 5
I.2. Hedonic method.......................................................................................................... 5
I.3. Repeat sales method (RSM) ......................................................................................... 6
II- DATA PROCESSING ....................................................................................................6
II.1. Source and nature of data ............................................................................................ 6
II.2. Data processing............................................................................................................. 9
III- METHODOLOGICAL APPROCH....................................................................... 10
III.1. Difficulties in the development of the real estate price index ..................................... 11
III.2. Reasons for choosing the repeat sales method ........................................................... 11
III.3. Calculation method ................................................................................................... 12
III.4. Calculation of the global index and regional indexes .................................................. 13
IV- RESULT ANALYSIS .................................................................................................... 13
IV.1. Price developments ................................................................................................... 13
IV.2. Number of transactions ............................................................................................. 14
IV.3. REPI by region.......................................................................................................... 15
IV.4. REPI by city .............................................................................................................. 16
IV.5. Importance of tracking property prices...................................................................... 16
CONCLUSION .................................................................................................................. 18
REFERENCES .................................................................................................................. 19
ANNEXES..........................................................................................................................20

4
INTRODUCTION
The real estate sector became a center of attention over the last few years, given the extent of its effects on financial and real spheres and its implications for monetary policy decisions and financial stability.
In the absence of reliable indicators for the Moroccan properties prices, The Central Bank of Morocco and the Land Registry Office began in 2010 a long process of constructing a quarterly real estate price index based on the Office’s Databases, which contain detailed information on all property transactions registered at the national level.
This first experience at the national level represents one of the pioneering attempts for the African continent. It aims to improve the transparency and well functioning of the property market, to refine the analysis of inflationary risks and to monitor real estate risk in the banking system.
However, the construction of such a tool faces many difficulties related mainly to the nature of this asset. Indeed, the housing market shows great heterogeneity, making the adoption of a uniformed approach extremely challenging since prices of different properties are influenced by intrinsic characteristics such as the surface area, number of rooms, age, geographical location…etc. In addition, a property represents a durable asset that rarely changes its owner, making the assessment of prices fluctuations difficult. This large discrepancy between the purchase and resale of the same property complicates the construction of a price index.
In order to limit the effect of the above-mentioned constraints and depending on the nature and richness of the databases, several approaches for developing real estate price index used at the international level are presented and discussed in the first part of this document. The second part describes the available data at national level as well as tests and treatments applied, while the third part focuses on the methodological approach adopted for the construction of the index. Finally, the results of the national index are presented and analyzed in the last part.

5
I- Different methods of compiling Real Estate Price Index (REPI)
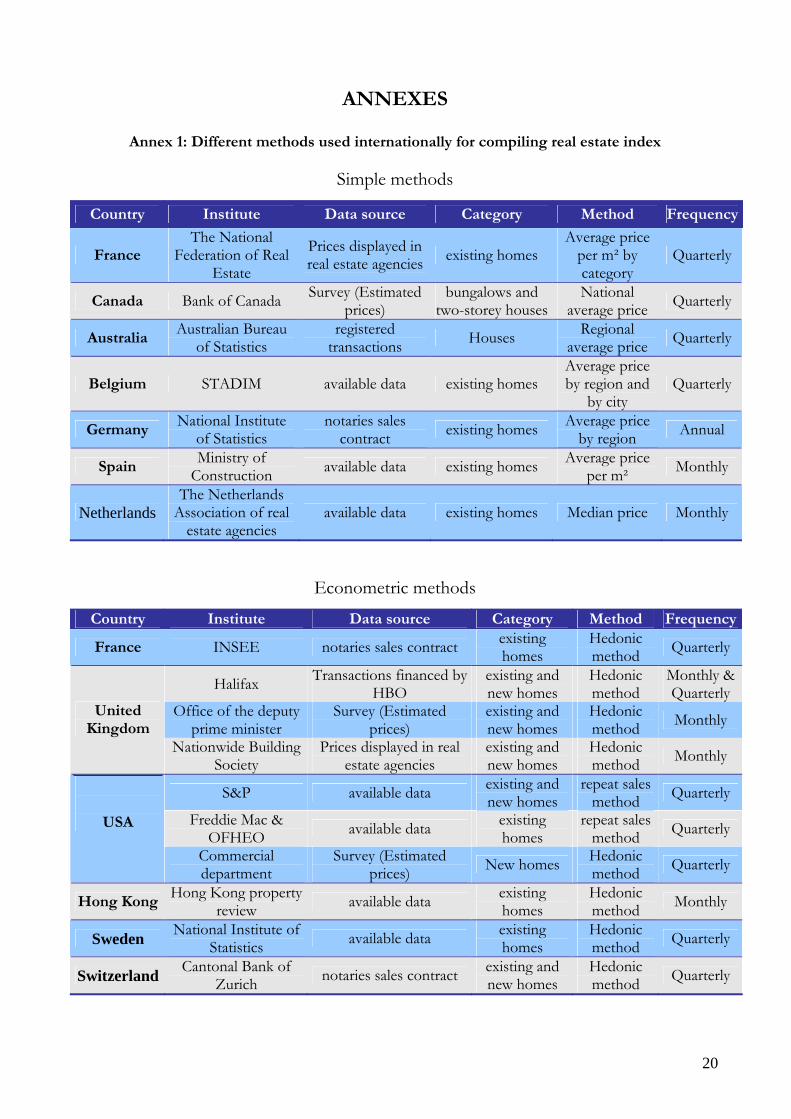
In order to construct a real estate price index, several approaches are adopted internationally, which can be classified into two categories: Simple techniques (simple or weighted average and median price) and econometric techniques (hedonic method and the repeat sales). In each country, there may be many indexes developed using different methods and by different institutions (Annex 1).
Figure 1: Main approaches used internationally to calculate real estate price index
I.1. Simple method
This method measures the simple average, weighted average or median of real estate prices during a given period. Monitoring such indexes does not allow to distinct between price and quality changes. Moreover, the unrepresentative nature of real estate transactions over time can bias the price trends, especially when transactions relate to different ranges of properties between one period and another. This method is used in several countries, including Germany, Australia, Spain and the Netherlands, because of its simplicity and as it does not require detailed data on the characteristics of real estate.
I.2. Hedonic method
This approach is based on the principle that the price of a property depends on its characteristics and its location. Only changes in property prices with similar characteristics from one period to another reflect the changing conditions of supply and demand in the property market. Considering the heterogeneity of properties traded in the real estate market, the implementation of the hedonic method requires the estimation of the effect of a number of characteristics on property price, through econometric equations specified for each elementary area relatively homogeneous and for each type of property.
Main approaches
Econometric methods Simple methods
Average prices
Median prices
Hedonic model
Repeat sales method

6
Then, the coefficients from these equations, considered fixed over the period of calculation of the index, are used to eliminate the quality effect, in order to obtain the variations of the ''real'' prices that reflect supply and demand changing conditions in the market. For each elementary area, the index of property prices is defined as the ratio between the value of a fixed reference property in a current period and its value in the base period index. The implementation of this approach requires, therefore, the existence of a database that contains the characteristics of property with a long history of real estate transactions to estimate the effect of quality.
The advantage of this method is that it can track over time the real value of a sold property,. Also, it allows the valuation of property in view of their characteristics. However, it requires a detailed description of the property’s characteristics over a period of time. This method is used especially in UK, France, Sweden, Switzerland and Hong Kong.
I.3. Repeat sales method (RSM)
The repeat sales method, considered as a variant of the hedonic method, overcomes the problem of heterogeneity of real estate. It consists of constructing a price index based on properties which have been sold more than once during the period under study. It assimilates price fluctuations to the average changes observed on repeat sales. This method, which excludes new property, is difficult to apply at a minute level of strata, because of the relatively small number of such sales. Thus, the lack of data on the characteristics and the technical difficulty of the hedonic method are the main reasons for adopting the repeat sales method.
II- DATA PROCESSING
II.1. Source and nature of data
Data used to construct the real-estate price index are drawn from the database of the Land Registry Office. This Office, which has 75 regional branches at the national level, records the transfer of ownership of property and land titled to the benefit of the purchaser. It has the characteristics and the prices indicated in the properties deeds. In addition to the global coverage of national territory, the recent computerization1 of their database and its update in real time are the main strengths of this database. This latter contains information on more than 3 million registered properties, including those who have never been sold.
The analysis of the databases of this Office and the tests performed on different variables allowed the identification of useful information for constructing a real estate price index on the basis of the exhaustiveness and the quality of available information.
1 It should be noted that the process of computerization of the regional services has not started at the same time, which will result in the need to define a base year that is the same for all the selected cities.

7
Time data integration: The buyer must record the transaction on his property within 18 months at the Land Registry Office. The analysis of the database showed that the delay between the date of the act and the recording date of the sale transaction is in continuous decline. Indeed, it decreased from 73 days on national average in 2006 to 28 days in 2010. This period could be shortened further in the future and exhaustiveness of the databases could be improved through awareness-raising actions by the Office.
Chart 1: Delays between the date of the act and the recording date of the sale transaction
Date of transaction: The date of each real estate transaction (Act Date) is available at the database of the Land Registry Office. For missing data, it has been supplemented from the date of registration (registration date) at the Office using the following formula:
Date_Act =Date_ register - DM
Where DM is the yearly average difference by city, between the date of registration and date of transaction, calculated based on the available observations2.
Price of transactions: Only registration fees collected by the Land Registry Office, representing 1 percent of the price of each transaction, are entered in the database of the Office and not the price of real estate transaction. Thus, prices used in this work are calculated based on the revenues received by the Office.
Types of sales: Total sales, which represent over 92 percent of transactions recorded at the Office, are only taken into consideration in this work. The partial sales are excluded, because the share of property sold is not known and we can not estimate the total price of the property concerned.
2 This method allowed us to recover more than 11 percent of the entire database.
73
67 65
36
28
48
10
20
30 40
50
60
70
80
2006 2007 2008 2009 2010 2011
(Days)
Average 2006-2011: 53 days
8
Category decomposition: This variable, which indicates the nature of property registered, distinguishes nearly 60 different types of property. The Office uses an internal reference to codify the nature of the property subject of the transaction. It is this standard that was adopted for this work.
Categories of real estate: The categories of properties sold were determined by grouping similar consistencies (Annex 3), in order to establish classes as homogeneous as possible. Theses will probably have similar price trends within each strata and a number of observations sufficient to guarantee strong results. Six categories were identified: Apartments, Houses, Villas, Urban lands, Business premises and Offices.
Table 1: Categories of real estate
Type Category Definitions
Apartment a dwelling located in a collective building and comprising one or several rooms
House a single or several-story individual dwelling with no garden Residential
Villa an individual dwelling with a garden
Land Urban land a plot of land located in the urban area
Business premise space fitted for commercial activity
Commercial Office working premises
Characteristics of property: Except for the surface area, identifying the characteristics of real estate involves intense work. Thus, the characteristics identified are: the existence of a garage, garden, pool, courtyards, balconies, roof, basement, number of floors for homes and villas, and the floor number for apartments. Other important features for the application of the hedonic method do not exist in the databases of the Office, especially the number of rooms, age of property, built area ...etc.
Geographic coverage: The choice of the geographical coverage for compiling the real estate price index has focused on the most dynamic cities in each region over the period 2006-2008. The cities selected cover the entire country and represent approximately 86 percent of transactions on average over the period 2006-2008 (Annex 3 for details).

9
Table 2: Geographical distribution of selected cities
Region code selected cities Coverage
rate (percent)Le Grand Casablanca 1 Casablanca, Mohammadia 78,2 Rabat – Salé – Zemmour - Zaër 2 Rabat, Salé, Temara 76,4 Tanger - Tétouan 3 Tanger, Tétouan 76,4 Fès - Boulemane 4 Fès, Sefrou 77,5 Gharb - Chrarda - Bni Hssen 5 Kénitra, Sidi Kacem 69,6 Chaouia - Ouardigha 6 Berrechid, Settat 86 Meknès - Tafilalet 7 Meknès, El Hajeb, Ifrane 97,2 Doukkala - Abda 8 El Jadida, Safi 85 Souss – Massa - Draâ 9 Agadir, Inzegane Aït Melloul 95,8 Marrakech – Tensift - El Haouz 10 Marrakech, Essaouira 100 L'Oriental 11 Oujda, Berkane, Nador 65 Tadla - Azilal 12 Beni Mellal, Fquih Ben Saleh 100 Taza - Al Hoceima - Taounate 13 Taza, Al Hoceima 97,4 Laâyoune – Boujdour - Sakia El Hamra 14 Laâyoune 81,1 Oued Ed-Dahab - Lagouira 15 Dakhla 70 Guelmim - Es-Smara 16 Guelmim 100
National - - 86percent
The breakdown of transactions: It shows that residential property represents 66 percent of all sales, with the predominance of apartments. Urban lands represent nearly 27 percent of the domestic market, while transactions on commercial property make up around 7 percent.
Chart 2: Breakdown of real estate transactions
II.2. Data processing
This database has been subject to special treatment in order to eliminate incomplete observations, data incorrectly entered and inconsistent transactions. Missing data issue has been overcome, especially concerning the variable of "date of transaction", which is directly involved in the calculation of the
Urbain land27,2%
Commercial property
7%
Apartment59%
House4,9%
Office0,7%
Villa1,2%
Commercial6%
Land27%Residential
67%

10
index3, by calculating the average lapse between the date of registration and the date of the transaction. Similarly, the extreme values of price per m² are rejected on the basis of the Box Plot method4, to reduce their impact. Thus, after this phase of pre-treatments, 586 000 transactions were selected on the basis of 700 000 observations.
Considering the large volume of data to be processed each quarter for the development of the real estate price index, the data mining process has been automated allowing a logical and efficient data processing. It can also reduce the time development of the index when changing or updating a file.
In order to respect the requirements of the ISO9001 standard for validating computer applications for data processing, two data processing programs were developed separately with two different software (Stata and SPSS), to compare the results obtained and to ensure the reliability of treatment.
III- METHODOLOGICAL APPROCH
The mean and the median of real estate prices are the most common methods used internationally. However, it is subject to serious bias because it does not distinguish between price fluctuations and changes in the composition of properties sold from one year to another. At the same time, data available at national level, despite their importance, are insufficient for estimating the effect of quality, which is the starting point for applying the hedonic method. Based on the assumption that when a property is sold twice, the quality of the property remains constant, the method adopted is repeat sales method (RSM). Even if there is a problem of selection bias, since the property sold twice are supposed to represent all of the properties, this method was chosen because of its flexibility, transparency and its relevance to the nature of available data at national level.
Figure 2: Methodological approach adopted for the construction of the REPI
3 The Office has made seizure of this variable obligatory from September 2009. 4 Data are considered outliers if their value is outside of this interval:
[Average price per m² ± 1.5 * (Q3-Q1)] with Qi is the ith quartile price per m².
The Land Registry Office
More than 3,000,000
registrations
BANK AL-MAGHRIB
Selection only the total sales since 2003
Approximately 586,000 real estate
sales
Data processing
Simple Techniques
About 73.000
Properties have been sold at least twice
Repeatsales
method
• Average price • Median price
National and regional
Indexes by category
Econometric techniques Hedonicmethod
Adopted method
About 70,000 transactions

11
III.1. Difficulties in the development of the real estate price index
The establishment of a real estate price index at the national level is a very difficult task. In fact:
• The heterogeneity of property makes it difficult to adopt a unique approach to pricing. Several characteristics of a property are involved in the formation of its price, including the size, number of rooms, age and geographical location.
• The wide variation in property prices, which originates in the heterogeneity of real estate. In
addition, distortions in the development of average prices over time are always possible: if during a quarter, transactions concerned mainly new properties in good conditions while in the next quarter, they involve properties not well maintained. This can result in price changes that don’t reflect the actual trend.
• The lack of some important characteristics, such as the number of rooms, age of property or the
built area. This also makes the price per m² widely dispersed for some type of properties.
• The difficulty of distinguishing the actual price changes of the quality that evolves over time.
• The existence of two distinct markets: the new and the old one (According to the census of 2004, over 56 percent of Moroccans are owners of their homes and about 50 percent of houses in Morocco have over 20 years, while 26 percent are over 50 years). This database does not distinguish between new homes and existing homes, because the information needed to set the age of the properties does not exist.
III.2. Reasons for choosing the repeat sales method
The choice of this method is justified by the following reasons:
• The information available in databases of the Office does not allow testing the hedonic method because of the unavailability of the main characteristics of properties (number of rooms, age of the property ...).
• The repeat sales method, unlike the simple methods that involve significant biases due to the heterogeneity of real estate, has the advantage of limiting the effects of this heterogeneity by making the price index based on the same property .
• The variable “surface area” is not involved in the calculation of the index, which will limit the bias of data entry errors of this variable. Moreover, the variable “transaction price” is more controlled at the Office, because tax income is calculated on this basis.
• This method requires no information on the characteristics of each property and therefore is not subject to specification errors.

12
In addition to excluding the new housing market and the difficulty in applying the method to a high level of strata, the following criticism can be brought to the repeat sales method:
• The lack of exhaustiveness of the sample of properties sold, because this method dismisses the property having been exchanged once. Therefore, the available sample is reduced to a number of observations, which can generate a selection bias. In our case, 73 000 transactions were selected by the repeat sales method. However, this exhaustiveness problem can be reduced over time because each edition of this index includes all real estate sold for the second time.
• Updating the index every quarter requires the adjustment of its history, because any new resale of a property is related to the first sale of the same property. Similarly, late registrations of properties sold are also taken into account in the following editions.
III.3. Calculation method
For the repeat sales method, only the price change and the number of transactions are included in the construction of the index. It creates an index sensitive to the market dynamics, taking into account the time distribution of transactions. Thus, each repeated sale (couple of transactions on the same property) is used to calculate a price change. The index is then constructed on the basis of these individual transactions. Formally, the estimating equation is:
SsDPP
sitiss
i
it ,...,1,log =+=⎟⎟⎠
⎞⎜⎜⎝
⎛∑ τ
τ
εβ
with
=isD
1 if ts =
-1 if τ=s , with t>τ
0 else
When τiP : Price of the property at the timeτ , date of the first sale.
itP : Price of the same property at the time t, date of the second sale.
sβ : coefficient to estimate for the period s
τε it : Error term
S : Number of Quarters contained in the study period.
Where 1−= tτ , price development is assimilated to average price movements on repeat sales observed between t and 1−t .
Once estimated, the coefficients sβ used to construct the index on a base of 100 for the quarter t :
)(exp100^^
τββ −= ttI .

13
III.4. Calculation of the global index and regional indexes
The application of RSM to a region and a category of property provides the desired real estate price index. Similarly, the national price index for a given category is calculated from the national database on this relevant category. The index obtained does not differ from the one which is defined as the average of the different regional indexes weighted by the number of transactions, because the repeat sales method implicitly includes the weight (number of transactions) of each region in the global index. Thus, regions with the most transactions have a greater impact in the global index.
The national real estate price index is also obtained by applying the RSM to the national database on all property types.
IV- RESULT ANALYSIS
IV.1. Price developments
The development of a real estate price index in Morocco, year on year, revealed three distinct periods: Between 2006 and 2008, property prices have registered an upward trend, with an average growth rate of 1.3 percent. Thereafter, prices began a downward trend until the first quarter of 2010, with a decrease of 1.2 percent on average. From the second quarter of 2010, prices have rebounded, their average growth rate having risen to 2.3 percent.
Chart 3: Real estate price index
-3
-2
-1
0
1
2
3
4
5
Q106
Q206
Q306
Q406
Q107
Q207
Q307
Q407
Q108
Q208
Q308
Q408
Q109
Q209
Q309
Q409
Q110
Q210
Q310
Q410
Q111
Q211
Q311
Q411
Q112
(%)
1.3%
2.3%
-1.2%
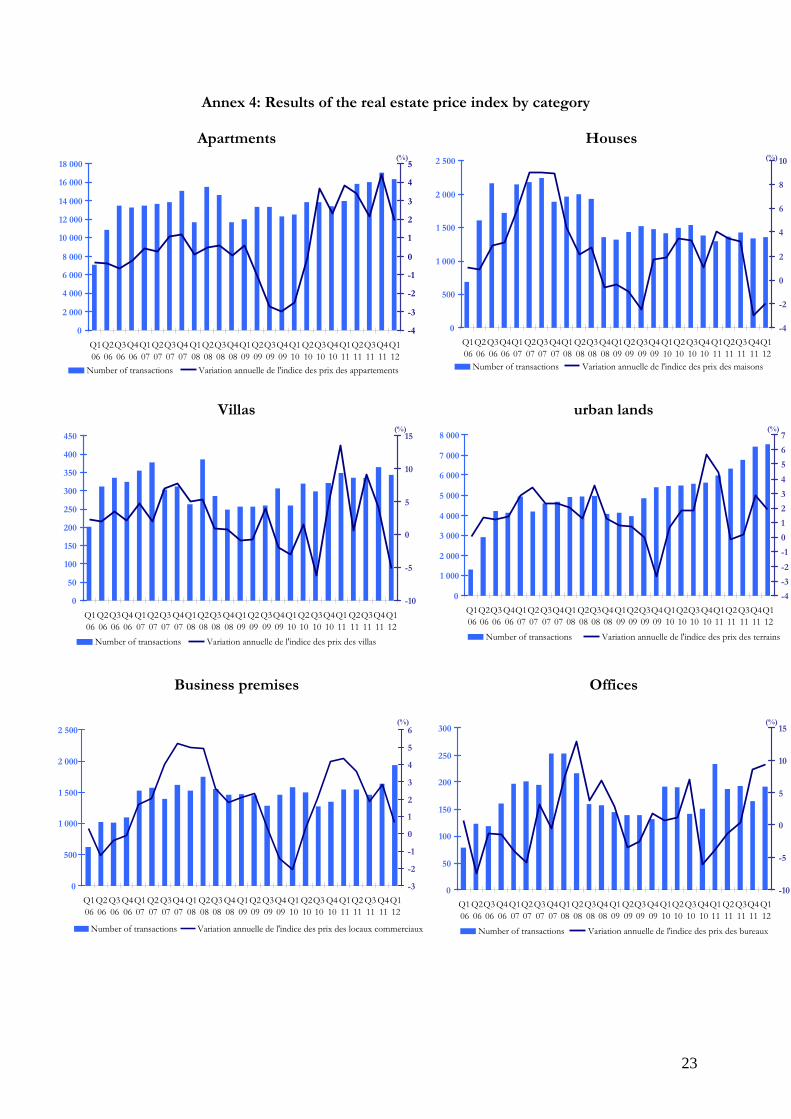
With particular regard to the latest results of the first quarter 2012, property prices grew by 1.1 percent, year on year, after 2.8 percent in the fourth quarter of 2011. This reflects an increase in prices of all real estate categories (Annex 4).

14
Chart 4: Real estate price index by category
-6
-4
-2
0
2
4
6
8
Q106
Q206
Q306
Q406
Q107
Q207
Q307
Q407
Q108
Q208
Q308
Q408
Q109
Q209
Q309
Q409
Q110
Q210
Q310
Q410
Q111
Q211
Q311
Q411
Q112
(%)
Residential Land Commercial
IV.2. Number of transactions
The development of property sales registered at the Land Registry Office has generally three phases. Indeed, the number of transactions increased from 13,800 in the first quarter of 2006 to nearly 26,600 units in the third quarter 2007, reflecting higher sales of residential property, land and commercial estate by 41 percent, 54 percent and 68 percent on average. Then, there was a downward trend, falling to nearly 19,000 sales in the end of 2008, due to the regression of these categories, respectively by 10 percent, 19 percent and 15 percent. From 2009, sales showed an adjustment reaching 28,000 in the fourth quarter 2011, up 13 percent average.
Chart 5: Number of real estate transactions
0
5 000
10 000
15 000
20 000
25 000
30 000
35 000
40 000
Q106
Q206
Q306
Q406
Q107
Q207
Q307
Q407
Q108
Q208
Q308
Q408
Q109
Q209
Q309
Q409
Q110
Q210
Q310
Q410
Q111
Q211
Q311
Q411
Q112
(%)
-30
-20
-10
0
10
20
30
40
50
60
70
Number of transactions Year on year

15
In the first quarter 2012, the number of residential property transactions fell at a quarterly rate of 3.8 percent to 18,022. This decrease particularly concerned apartments and villas with a decline of 4.1 percent and 5.8 percent, respectively. However, the volume of transactions on commercial and land property moved up 17.8 percent and 1.4 percent, respectively. Year on year, all real estate categories recorded higher sales, except for villas and offices whose sales dropped 18 percent and 1.1 percent, respectively.
Chart 6: Number of Real estate transactions by category
0
2 000
4 000
6 000
8 000
10 000
12 000
14 000
16 000
18 000
20 000
Q106
Q206
Q306
Q406
Q107
Q207
Q307
Q407
Q108
Q208
Q308
Q408
Q109
Q209
Q309
Q409
Q110
Q210
Q310
Q410
Q111
Q211
Q311
Q411
Q112
Residential Land Commercial
IV.3. REPI by region
In 2011, the increase ranged from 1 percent in the region of Marrakech-Tensift-El Haouz to 8.3 percent in Gharb-Chrarda-Beni Hssen, while the price decline was mostly observed in large cities of the regions of Tangier-Tetouan, Taza-Al Hoceima-Taounate and Chaouia-Ourdigha. In other regions, prices did not change markedly.
Graph 7: Annual change in prices by region
-6
-4
-2
0
2
4
6
8
10
Oue
d Edd
ahab
-lago
uira
Laây
oune
-Bou
jdou
r-Sak
ia E
l Ham
ra
Gue
lmim
-Es Sm
ara
Sous
s-Mas
sa-D
raâ
Gha
rb-C
hard
a-Be
ni H
ssen
Chao
uia-O
urdigh
a
Mar
rake
ch-T
ensif
t-El H
aouz
Orie
ntal
Gra
nd C
asab
lanca
Rab
at-S
alé-Z
emm
our-Z
aër
Dou
kkala
-Abd
a
Tad
la-A
zilal
Mek
nès-T
afila
lt
Fès-Bo
ulm
ane
Taza
-Al H
oceim
a-Tao
unate
Tan
ger-T
étou
an
(%)
2010 2011

16
IV.4. REPI by city5
By city, property prices broadly increased in 2011. Indeed, with the exception of Tangier, where they fell 1.1 percent, and Marrakech, where they virtually stagnated, prices in other cities increased within a range of 1.1 percent in Rabat and 11.3 percent in El Jadida.
Chart 7: Annual change in prices by City
-6
-4
-2
0
2
4
6
8
10
12
14
Agadir Casablanca El Jadida Fès kénitra Marrakech Meknès Oujda Rabat Tanger
(%)
2010 2011
IV.5. Importance of tracking property prices
The construction of the REPI allowed the analysis of property price fluctuations to evaluate and to understand their effects on the macroeconomic framework in general. Several studies have been conducted in this area, intending to analyze the impact of these price fluctuations on economic activity and inflation, with the aim to test a possible synchronization between the two cycles.
Taken recently into consideration in the informational system of Bank Al-Maghrib, the integration of real estate prices in the analytical device strengthens the monitoring and evaluation of monetary policy and financial stability. Indeed, fluctuations in property prices are sources of potential uncertainties about the development of aggregate demand and inflation, and ultimately on monetary policy decisions. Considering that real estate constitutes the privileged household investment, it should take a strategic position in the financial stability analytical framework.
5 The selection focused on the 10 most dynamic cities in terms of number of property transactions.

17
Chart 8: Year-on-year change in the REPI and core inflation
Chart 9: Change in the REPI and real estate loan interest rates
Moreover, the significant proportion of real estate loans to total loans reinforces the importance of developments in the property market and their implications for the stability of a financial system dominated by banks. Indeed, nearly a third of the credits granted by the banking system are intended to the property sector, hence the emergence of a high risk for banking institutions that see their business broadly focused around a single sector. Thus, fluctuations in the prices of these assets could potentially threaten the functional equilibrium of banking institutions.
Chart 10: Year-on-year change in the REPI and home loans
5,0
5,5
6,0
6,5
7,0
Q106
Q206
Q306
Q406
Q107
Q207
Q307
Q407
Q108
Q208
Q308
Q408
Q1 09
Q2 09
Q3 09
Q4 09
Q1 10
Q2 10
Q3 10
Q4 10
Q111
Q211
Q311
Q411
Q112
(%)
-5
-4
-3
-2
-1
0
1
2
3
4
5(%)
Real estate loan interest rate REPI
-3 -2 -1 0 1 2 3 4 5 6
Q1 08
Q2 08
Q3 08
Q4 08
Q1 09
Q2 09
Q3 09
Q4 09
Q110
Q2 10
Q3 10
Q4 10
Q1 11
Q2 11
Q311
Q411
Q112
(%)
IPCX REPI
-6
-4
-2
0
2
4
6
8
Q4 08
Q1 09
Q2 09
Q3 09
Q409
Q110
Q210
Q310
Q410
Q111
Q211
Q311
Q411
Q112
(%)
8
10
12
14
16
18 (%)
REPI Home loans
18
CONCLUSION
The real estate price indexes (REPI) were jointly constructed by Bank Al-Maghrib and the Land Registry Office on the basis of the latter’s data. These quarterly indexes, which have a base value of 100 in 2006, are calculated following the repeat-sales method that controls the heterogeneity of properties. This method does indeed take into account only the properties sold at least twice during the period under review.
The REPI capture changes in residential property prices nationwide, by region and by major cities in the three major types, namely residential property, urban lands and commercial property, as well as in the six categories: apartment (a dwelling located in a collective building and comprising one or several rooms), house (a single or several-story individual dwelling with no garden), villa (an individual dwelling with a garden), urban land (plot of land located in the urban area), business premises (space fitted for commercial activity) and office (working premises).
These indexes are calculated on the basis of data taken 35 days after the quarter under review, which implies an update of historical data. This update may be important because of the lag between transactions and registrations and/or the integration of property that was sold at least twice during the quarter. This methodologically rigorous approach, however, requires setting a minimum threshold of transactions for its calculation, which does not allow developing indexes for certain cities, regions and/or quarters.
Moreover, to improve the information system, the central Bank of Morocco and the Land Registry Office have started in 2012 the project for developing an index that tracks changes in new property prices, excluded by the RSM. However, due to the unavailability of information on the age of the property, the making of such an indicator faces several challenges.
19
REFERENCES
Bailey, M.J., Muth, R.F., Nourse, H.O., (1963). ‘‘A regression method for real estate price index construction’’. J. Amer. Stat. Assoc. 58 (304), 933-942.
Case K., Schiller R., (1989). ‘‘The efficiency of the market for single family homes’’, American Economic Review, 79, p. 125-137.
Shiller, R.J. (1991): “Arithmetic repeat sales price estimators”. Journal of Housing Economics.
Goetzmann, W.N. (1992). The accuracy of real estate indices: repeat sales estimators. Journal of Real Estate Finance and Economics.
Calhoun C.A. (1996): ‘‘OFHEO House Price Indexes: HPI Technical Description’’.
Calhoun C.A. and Follain J.R., (1997): ‘‘Constructing indices of the price of multifamily properties using the 1991 Residential Finance Survey’’, Journal of Real Estate Finance and Economics.
Meese, R.A., Wallace, N.E. (1997): “The construction of residential housing price indices: a comparison of repeat-sales, hedonic-regression, and hybrid approaches”.
Wood, Robert (2003): A comparison of UK residential house price indices, paper presented at the IMF/BIS conference on real estate indicators and financial stability, Washington.
INSEE-Notaire (2005): ‘‘Les indices Notaires Insee de prix des logements anciens’’, INSEE.
Chau, K. W., S. K. Wong, C. Y. Yiu and H. F. Leung, (2005), “Real Estate Price Indexes in Hong Kong”, Journal of Real Estate Literature, 13, 3, 337–356.
Bourassa, Steven C., Martin Hoesl, and Jian Sun (2006), “A Simple Alternative House Price Index Method,” Journal of Housing Economics 15 80–97.
Case K., Schiller R., (2006) : ‘‘Metro Area Home Price Indices’’.
Meissner, C., Satchell, S. (2007): “A comparison of the Case-Shiller house price index methodology with the FT house price index methodology”.
Standars&Poor’s/Case-Shiller (2008): ‘‘Home price indices: Index Methodology’’.
Thion B., Favarger P. et Hoesli M. (2008): ‘‘Indices des ventes repesées et modification de l’environnement immobilier’’.
Hilbers, Paul, Alexander W. Hoffmaister, Angana Banerji, and Haiyan Shi, (2008), “House Price Developments in Europe: A Comparison” WP/08/211, October.
Nagaraja, C.N., Brown, L.B., Zhao, L. (2009): “An autoregressive approach to house price modelling”.
Mick Silver (2012) “Why House Price Indexes Differ: Measurement and Analysis”, WP/12/125.
20
ANNEXES
Annex 1: Different methods used internationally for compiling real estate index
Simple methods
Country Institute Data source Category Method Frequency
France The National
Federation of Real Estate
Prices displayed in real estate agencies existing homes
Average price per m² by category
Quarterly
Canada Bank of Canada Survey (Estimated prices)
bungalows and two-storey houses
National average price Quarterly
Australia Australian Bureau
of Statistics registered
transactions Houses Regional average price Quarterly
Belgium STADIM available data existing homes Average price by region and
by city Quarterly
Germany National Institute
of Statistics notaries sales
contract existing homes Average price by region Annual
Spain Ministry of
Construction available data existing homes Average price per m² Monthly
Netherlands The Netherlands
Association of real estate agencies
available data existing homes Median price Monthly
Econometric methods
Country Institute Data source Category Method Frequency
France INSEE notaries sales contract existing homes
Hedonic method Quarterly
Halifax Transactions financed by HBO
existing and new homes
Hedonic method
Monthly & Quarterly
Office of the deputy prime minister
Survey (Estimated prices)
existing and new homes
Hedonic method Monthly United
Kingdom Nationwide Building
Society Prices displayed in real
estate agencies existing and new homes
Hedonic method Monthly
S&P available data existing and new homes
repeat sales method Quarterly
Freddie Mac & OFHEO available data existing
homes repeat sales
method Quarterly
USA
Commercial department
Survey (Estimated prices) New homes Hedonic
method Quarterly
Hong Kong Hong Kong property
review available data existing homes
Hedonic method Monthly
Sweden National Institute of
Statistics available data existing homes
Hedonic method Quarterly
Switzerland Cantonal Bank of
Zurich notaries sales contract existing and new homes
Hedonic method Quarterly

21
Annex 2: Definition of properties types
Category Consistence Category code
Land 1 Agricultural dry land 1 Irrigated agricultural land 1 Bare land 1 Agricultural land 1 Irrigated planted land 1 Land intended for building 1
Land
Planted land 1 Villa 2 One-story villa 2 V
illa
Two-story villa 2 Studio 3 Duplex 3 Apartment 3 Duplex apartment 3 Very small apartment 3 A
partm
ent
Room 3 Land with a building 4 Building 4 Dwelling house 4 Ground floor 4 H
ouse
Underground story 4 Commercial building 5 Building for industry or crafts 5 Shop 5 Snack 5 Store 5
Busin
ess p
rem
ises
Business premises 5
Offi
ce
Office 6

22
Annex 3: Structure of real estate transactions by city in 2006-2008
Number of registrations Region City 2006 2007 2008 Average Rank
BERRECHID 9 523 6 811 16 242 10 859 1 SETTAT 8 011 13 379 9 343 10 244 2 KHOURIBGA 4 659 8 191 4 676 5 842 3
CHAOUIA OUARDIGHA
BENSLIMANE 6 782 4 509 5 343 5 545 4 EL JADIDA 12 018 11 688 14 763 12 823 1 SAFI 7 857 8 922 8 757 8 512 2 SIDI-BENNOUR 7 101 5 870 4 801 5 924 3
DOUKKALA-ABDA
SIDI SMAIL ZMAMRA 1 209 5 254 3 232 4 FES 26 904 32 034 28 546 29 161 1 SEFROU 3 478 4 124 4 077 3 893 2 KARIA BA MOHAMED 702 917 915 845 3
FES-BOULEMANE
BOULMANE 1 78 40 4 KENITRA 17 980 17 946 17 363 17 763 1 SIDI-KACEM 7 678 8 141 8 620 8 146 2 SIDI SLIMANE 4 166 5 040 5 047 4 751 3
GHARB CHRARDA - BENI HSSEN
SOUK ELARBAA 3 048 2 369 2 845 2 754 4 CASABLANCA 92 941 104 639 95 886 97 822 2
GRAND CASABLANCA MOHAMMEDIA 7 331 8 244 8 303 7 959 2
GUELMIM-ES-SMARA GUELMIM 518 544 418 493 1 LAAYOUNE-BOUJDOUR-SAKIA-EL-HAMRA LAAYOUNE 1 240 1 998 2 193 1 810 1
MARRAKECH 17 278 11 939 13 741 14 319 1 ESSAOUIRA 3 013 4 065 4 340 3 806 2 AL HAOUZ 2 311 3 250 5 131 3 564 3 EL KELAA 1 860 2 301 2 326 2 162 4 BENGUERIR 831 2 029 1 528 1 463 5
MARRAKECH-TENSIFT-AL HAOUZ
CHICHAOUA 456 764 916 712 6 MEKNES 17 758 21 750 24 700 21 403 1 EL HAJEB 2 354 4 533 5 532 4 140 2 IFRANE 1 535 2 962 2 173 2 223 3 KHENIFRA 1 665 1 742 1 922 1 776 4 ERRACHIDIA 1 136 1 174 1 350 1 220 5
MEKNES-TAFILALET
MIDELT 712 731 810 751 6 OUJDA 12 508 15 768 17 456 15 244 1 BERKANE 5 469 7 751 6 373 6 531 2 NADOR 2 501 2 667 3 161 2 776 3
ORIENTAL
TAOURIRT 698 731 725 718 4 OUED ED-DAHAB-LAGOUIRA DAKHLA 868 1 030 958 952 1
TEMARA 15 102 21 781 25 650 20 844 1 SALE 17 960 15 894 26 028 19 961 2 RABAT 10 888 11 966 13 076 11 977 3 KHEMISSET 7 036 9 362 8 407 8 268 4
RABAT-SALE-ZEMMOUR-ZAËR
ROMMANI 3 321 2 914 3 274 3 170 5 AGADIR 14 486 17 789 16 928 16 401 1 INEZGANE AIT MELLOUL 7 216 6 532 3 660 5 803 2 TAROUDANT 2 611 3 819 3 104 3 178 3 TIZNIT 2 581 2 847 2 220 2 549 4
SOUSS-MASSA-DARAA
OUARZAZATE 904 1 184 1 299 1 129 5 FQUIH BEN SALAH 5 599 7 899 8 277 7 258 1 BENI-MELLAL 5 518 4 940 5 418 5 292 2 TADLA-AZILAL AZILAL 613 533 516 554 3 TANGER 18 628 24 809 32 088 25 175 1 TETOUAN 6 302 6 929 8 168 7 133 2 LARACHE 4 033 5 418 5 220 4 890 3
TANGER-TETOUAN
MDIQ FNIDEQ 204 1 437 821 4 TAZA 5 209 6 355 5 716 5 760 1 TAOUNATE 1 135 1 218 1 318 1 224 2 AL HOCEIMA 817 822 1 158 932 3
TAZA-HOCEIMA-TAOUNATE
GUERCIF 0 1 281 641 4
23
Annex 4: Results of the real estate price index by category
Apartments Houses
Villas urban lands
Business premises
Offices
0 2 000
4 000
6 000
8 000
10 000
12 000
14 000
16 000
18 000
Q1 06
Q2 06
Q3 06
Q4 06
Q1 07
Q2 07
Q3 07
Q4 07
Q1 08
Q2 08
Q3 08
Q408
Q1 09
Q2 09
Q3 09
Q4 09
Q1 10
Q2 10
Q3 10
Q410
Q111
Q211
Q311
Q411
Q112
-4
-3
-2
-1
0
1
2
3
4
5(%)
Number of transactions Variation annuelle de l'indice des prix des appartements
0
500
1 000
1 500
2 000
2 500
Q106
Q206
Q306
Q406
Q107
Q207
Q307
Q4 07
Q1 08
Q2 08
Q3 08
Q4 08
Q1 09
Q2 09
Q3 09
Q409
Q110
Q210
Q310
Q410
Q111
Q211
Q311
Q411
Q112
-4
-2
0
2
4
6
8
10(%)
Number of transactions
Variation annuelle de l'indice des prix des maisons
0 50
100 150 200
250
300
350
400
450
Q1 06
Q2 06
Q3 06
Q4 06
Q1 07
Q2 07
Q3 07
Q4 07
Q1 08
Q2 08
Q3 08
Q408
Q1 09
Q2 09
Q3 09
Q4 09
Q1 10
Q2 10
Q3 10
Q410
Q111
Q211
Q311
Q411
Q112
-10
-5
0
5
10
15(%)
Number of transactions Variation annuelle de l'indice des prix des villas
0
1 000
2 000
3 000
4 000
5 000
6 000
7 000
8 000
Q106
Q206
Q306
Q406
Q107
Q207
Q307
Q4 07
Q1 08
Q2 08
Q3 08
Q4 08
Q1 09
Q2 09
Q3 09
Q409
Q110
Q210
Q310
Q410
Q111
Q211
Q311
Q411
Q112
-4
-3
-2
-1
0
1
2
3
4
5
6
7(%)
Number of transactions Variation annuelle de l'indice des prix des terrains
0
500
1 000
1 500
2 000
2 500
Q1 06
Q2 06
Q3 06
Q4 06
Q1 07
Q2 07
Q3 07
Q4 07
Q1 08
Q2 08
Q3 08
Q408
Q1 09
Q2 09
Q3 09
Q4 09
Q1 10
Q2 10
Q3 10
Q410
Q111
Q211
Q311
Q411
Q112
-3
-2
-1
0
1
2
3
4
5
6(%)
Number of transactions Variation annuelle de l'indice des prix des locaux commerciaux
0
50
100
150
200
250
300
Q106
Q206
Q306
Q406
Q107
Q207
Q307
Q407
Q1 08
Q2 08
Q3 08
Q4 08
Q1 09
Q2 09
Q3 09
Q409
Q110
Q210
Q310
Q410
Q111
Q211
Q311
Q411
Q112
-10
-5
0
5
10
15(%)
Number of transactions Variation annuelle de l'indice des prix des bureaux