Embed Size (px)
Citation preview

1
CONSTRUCTING A HOUSE PRICE INDEX FOR TURKEY1
Aslı Kaya2, Ayça Topaloğlu Bozkurt2, Emine Meltem Baştan2, Özgül Atılgan Ayanoğlu2
July, 2012
Abstract
In this paper, we present experiences of Central Bank of Turkey in compiling and developing a House Price
Index (HPI). HPI, which is constructed by using the method of “Stratified Median Price”, covers all houses
subject to loan approvals all over the country. We focus on why developing a house price index for Turkey
was needed, sources and coverage of the index, reasons behind implementing the stratified median price
approach, application of stratification and weighting procedures in building the index. In addition, method
of developing a new-housing price index is discussed and indices compiled on the basis of 26 NUTS 2
regions are reviewed. Finally, empirical relations between interest rates, housing loans and HPI are
analyzed.
1The authors would like to thank Timur Hülagü, Dilek Talı and Emel Dinçer for their valuable comments.
2Statistics Department, Central Bank of Turkey. Corresponding author: Özgül Atılgan Ayanoğlu (E-mail:
[email protected]) The views expressed in this paper are those of authors and do not necessarily reflect the views of the
Central Bank of Turkey or its staff.

2
I. Introduction
The primary goal of the Central Bank of the Republic of Turkey (CBRT) is to achieve and maintain price
stability through the framework of inflation targeting policy. Accordingly, predicting the future course of
inflation in a precise manner is a crucial objective to maintain this goal. Therefore, monitoring
developments in house prices is an important factor underlying monetary policy decisions aimed at
maintaining price stability. A true measure of house prices is also an important concern for promoting
financial stability.
Within this framework, constructing a house price index (HPI) for Turkey had long been one of the
considerations of the CBRT. The implementation of inflation targeting regime since 2006 has reinforced
that intention as the CBRT also has to be aware of any factor that may have an impact on price stability.
Moreover, the global financial crisis in 2008, and the enactment of mortgage law in 2007 also made it clear
that a house price index was needed for Turkey.
This paper intends to present our experiences of compiling and constructing an HPI by using the Stratified
Median Price Method. Within this context, we first stress the importance of monitoring house prices from
the perspective of central banks. Secondly, the methodology including data sources, scope and analysis are
explained.3 Finally, we discuss our results and provide an analysis of empirical relations between interest
rates, housing loans and the index.
Developing such a measure is a challenging task in practice. The main challenge is the heterogeneous
nature of the housing market. No dwelling is the same of the other, differing according to various
characteristics relating to physical attributes or to locations. Moreover, the characteristics of the houses
transacted in the market may change over time. Another challenge is the illiquidity of the housing market in
the sense that sales of houses are not frequent. In addition, it is not easy to observe the price of a dwelling
before the sale is realized and the actual sale prices are usually not reported. In the face of such challenges,
we take into account available sources, approaches and methodologies to be able to construct the most
representative index.
There are four main methods suggested for constructing a house price index in the literature: Repeated
Sales Method, Hedonic Regression, Sales Price Appraisal Ratio Model and Stratification. Considering the
data availability and statistical applicability, we decided to use stratified median price method for
constructing an HPI for Turkey.
3 Prasad and Richards (2006 and 2008) on stratification and documents of Australian Bureau of Statistics (2006 and 2009) on
developing a house price index for Australia using stratification constituted guidance for our study.

3
The structure of the paper is as follows. In the next section, we emphasize the importance of monitoring
house prices for central banks. Then, we introduce our methodology in section 3. Section 4 presents our
results and section 5 concludes the paper.
II. The Importance of Monitoring House Prices for Central Banks
Monitoring house prices is of significant interest for central banks from a number of perspectives. Changes
in house prices play an important role in the transmission mechanism of monetary policy and may have a
significant impact on aggregate demand and inflation. The housing market can influence monetary
transmission through three channels, the interest rates, the asset prices and the credit channel.
The interest rate channel has a direct effect on consumption and investment decisions and ultimately
economic activity and inflation. Expansionary monetary policy in the form of lowering interest rates will
increase the demand for housing which leads to higher house prices. The resulting increase in total wealth
will in turn raise household consumption and aggregate demand. The fact that a number of countries
experienced an environment of historically low interest rates and rapid increase in house prices during the
last decade highlights the important role of the monetary policy on the housing market.
The asset price channel relates to the wealth effect generated by increasing house prices leading to higher
consumption possibilities, causing pressure on consumer prices. Another perspective regarding the impact
of house prices is that, rising house prices may stimulate housing construction expenditures and thereby
increase aggregate demand. The recent economic crisis designated that the developments in asset prices,
especially housing prices, could have significant negative effects on the real economy.
In the years leading to the crisis in the United States, interest rates had been at historical lows as the
Federal Reserve Bank had cut interest rates significantly to avoid going into recession in the early 2000s.
Low interest rates reduced borrowing costs and created easy credit conditions encouraging households to
invest in housing, leading to house price increases. Easy credit conditions coupled with the expectations
that house prices would continue to rise, encouraged speculation and some households even started to buy
second homes in order to profit from house price increases triggering a housing boom. Expectations of
continuous rise in house prices led the investors to undertake adjustable-rate mortgage loans and the
eagerness of the banks to get higher interest earnings led them to extend loans to sub-prime borrowers
with low credibility which were securitized. The above mentioned reasons caused the sub-prime mortgage
market develop fast.
From the second quarter of 2006, the housing market began to cool down with prices starting to drop.
Borrowers found it difficult to sell houses or refinance through mortgage. As a result of the slowdown in

4
the housing boom coupled with slowly climbing interest rates, large numbers of sub-prime mortgage clients
were unable to repay their loans. Consequently, defaults over such loans started and securities backed with
sub-prime mortgages lost most of their net worth and financial health leading to a global financial crisis.
The recent crisis showed that large increases in asset prices can be a threat to price stability. Since the
crisis, there has been an increasing recognition among economists and policymakers that central banks
should monitor asset prices as well as goods prices (Blanchard et al., 2010).
Before the recent financial crisis, the common view both in academia and in central banks was that
achieving price and output stability would promote financial stability. Thus, almost all central banks in both
advanced and emerging countries adopted monetary policy frameworks with price stability as the primary
objective (IMF Monetary and Capital Markets Department, 2010). However, an important lesson learned
from the crisis is that, in an environment in which prices of goods and services follow a stable path,
increasing asset prices stands as a violating factor to financial stability. An exclusive focus of monetary
policy on achieving price stability is inappropriate in a world where asset-price misalignments and financial
imbalances are increasingly prevalent (Bean, 2003). Central banks should view price stability and financial
stability as highly complementary and mutually consistent objectives, to be pursued within a unified policy
framework (Bernanke and Gertler, 1999). As a matter of fact, the opinion that central banks having risks in
their financial system should not totally ignore the bubbles in asset prices is gradually becoming
widespread in global platforms.
The credit channel has fairly similar effects. Whenever demand is encouraged by an expansion in credits,
house prices go upwards increasing the housing wealth which induces consumption expenditure4.
The recent financial crisis has also raised the question of whether a central bank should be concerned
about housing price inflation. In practice, many central banks target the inflation rate measured by the
consumer price index (CPI) and housing in the form of rental prices is an important component of the
consumption basket.
4 Unlike many other assets, housing can be used as collateral for loans. When house prices rise, there is an increase in the amount
of collateral at home owners' disposal. This can also pave the way for houses to be used as collateral in extension of further credits since the lenders are usually prepared to lend more when there is more collateral (Benito et al., 2006). The increase in the value of
assets that can be used as collateral also enhances the borrowing possibilities of individuals. The self-feeding mechanism created in
this way may lead to bubbles in the housing market. In case macroeconomic conditions begin to reverse, the mutuality between
two markets may intensify the worsening of the economic situation (IMF, 2006).

5
Under these observations and theoretical considerations5, it is evident that constructing a house price
index will be of great importance for many institutions, prominently central banks, which pays attention to
price stability.
III. Methodology
a) Data Sources and Scope
In the housing market, prices of properties become available when they are actually sold but actual
transaction prices are usually not reported. Therefore, a proxy price which is both reliable and able to
reflect the actual price is needed. As a starting point of finding an appropriate proxy for price, banks and
real estate appraisal companies were inquired as possible data sources. A pilot study was carried out for
Ankara and valuation reports which are prepared by real estate appraisal companies at the time of
approval of individual housing loans extended by banks were compiled and analyzed. Analysis of the
compiled data demonstrated that appraised value for a dwelling can be used as a proxy for price in the
absence of reliable administrative records for transaction prices. In addition, the study designated that
valuation reports could be rich data sources since they contain detailed qualities of the dwellings as well as
information about the location of the dwellings. On the other hand, we observed that valuation reports
prepared by real estate appraisal companies did not have standard formats. As a result, two critical
decisions have been made after the pilot study. First, banks have been determined to be the primary data
source. Second, appraised values of dwellings are determined to be used as a proxy for price.
From the viewpoint of the CBRT, the presence of an official valuation of a dwelling is sufficient to be
included in the data scope. Therefore, the actual sale of the property and utilization of the loan is not
required and all appraised houses are included in the scope.
The appraised values of houses are reported on a monthly basis via a standard format determined by the
CBRT (See Appendix 1). While designing the standardized reporting format, a selection was made among
the variables existing in the valuation reports. They were chosen according to their importance in
constructing a representative index taking into account the alternative methods that could be used in the
future. The format consists of a wide set of variables including quality characteristics of the dwellings. In
addition to the variables provided by the banks, some other variables required for calculation of the index
are produced out of the collected variables. Unit price, which is calculated by dividing the value of a
property by its gross area of use, is one of those variables.
5 Fenwick (2009) sums up the importance of house price indices as follows: He states that calculating an HPI is crucial as it is a
macroeconomic indicator signaling the path of inflation - gaining particular importance under inflation targeting regime-, a measure of wealth, a variable that can be used to measure the risk of financial stability, a variable that can be used as a deflator in the
calculation of national accounts and an input that can be used in the calculation of other price indices.

6
The set of valuation data is classified according to the year of construction and mainly two types of indices
are produced based on this classification. To construct the House Price Index for Turkey (THPI), all valuation
reports are used; whereas, to construct the New Housing Price Index for Turkey (TNHPI), valuation reports
for houses built in the current and previous years are used.
b) Compilation and Data Control
As mentioned in the previous part, data required for constructing the HPI are provided by the banks
extending housing loans. Banks transfer the data of the related month in the first 10 business days of the
following month by using the predetermined reporting format to the CBRT. At the first stage of
constructing the index, the data are exposed to certain controls. After the initial controls by the banks, the
data are transferred electronically to the CBRT. A second control is conducted by the CBRT while
transferring data to the database. Banks are informed of the data that violate the control criteria and are
asked to make necessary corrections. After the elimination of erroneous data, remaining data is used in the
calculation. At the second stage of constructing the index, the data set is exposed to extreme value analysis
by using the Tukey’s Hinges method. According to this method, unit prices which qualify the following
equation are accepted as extreme values and excluded from the analysis;
where
= Lower Quartile and = Upper Quartile
c) Stratified Median Price Method
As monitoring house prices is of significant interest to central banks, constructing a robust indicator of
developments in the housing market is crucial. However, measuring house prices accurately is a very
complicated exercise due to certain characteristics of the housing market. First of all, the housing market is
quite heterogeneous in nature. It is composed of units which are totally unique to themselves. That is, no
dwelling is the same of the other, differing according to various characteristics relating to physical
attributes or to locations. Secondly, the market is illiquid in the sense that sales of houses are not frequent.
Moreover, it is not easy to observe the price of a dwelling before the sale is realized and the actual sale
prices are usually not reported. Considering these complexities, we tried to capture the most
representative index by trying to obtain the most realistic values of the dwellings as well as building up a
sample that has a high representation for reflecting the general features of the region for which the index is
calculated.

7
In the literature, there are 4 main methods used in the calculation of house price indices (Eurostat
Handbook on Residential Property Price Indices, 2011): Repeated Sales Method, Hedonic Regression, Sales
Price Appraisal Ratio Model and Stratification. Each of these methods has certain advantages and
disadvantages. In addition, depending on the differences in their calculation methods, each of them may
require data sets differing in terms of both sample size and content of the data. One of these methods is
the repeated sales method, which compares the sale prices of the same dwellings from different regions
sold at least twice during the period covered by the dataset. The index is formulated by taking the ratio of
the first sale price to the second one. The hedonic method rests upon the formation of a regression model
in which the dependent variable is the price of houses and the explanatory variables are those representing
the quality of the dwellings which have considerable impact on the prices. The sales price appraisal ratio
model defines two prices: the appraised value determined by considering the qualities and the actual
transaction price. The index is calculated by taking the ratio of these two prices.
The “Stratified Median Price Method”, which has been preferred for constructing the HPI for Turkey is
based upon the idea of dividing the heterogeneous housing market into homogeneous strata. Strata are
defined considering the balance of homogeneity of housing characteristics and the number of observations
required for producing a reliable median unit price. The median unit price for each stratum is then
weighted to reach the overall price index.
As in the hedonic model, there is an emphasis on the characteristics of the dwellings that have impact on
the price. However, the focus on this method is on forming homogeneous strata in terms of both price and
quality. Since homogeneity is a crucial concept for this method, the criterion according to which
homogeneity is determined constitutes a considerable part of the analysis.6 Country experiences and
guidelines such as Eurostat Handbook on Residential Property Prices Indices (2011) provide different
insights in terms of the criteria to be selected. According to Eurostat Handbook, area of the structure, area
of the land, the location of the property, the age of the structure and the type of the structure are the most
important price determining characteristics of properties.
In our study, the variable chosen in forming the strata is geographical location, where the housing market is
divided into regional units. The reference point for such a grouping is NUTS. The first regional unit is NUTS
Level 2 while the second one is NUTS Level 3 which represents the provinces. The last unit corresponds to
towns, constituting the core unit for strata. Monthly data availability is also taken into account in
6 Despite all the advantages of this method over other methods such as requiring a less complicated data set spanning over a shorter period, it also
has certain drawbacks. Since the qualities of the dwellings are not depicted as clear as in the hedonic model, the method may have deficiencies in reflecting the compositional changes taking place in the dwellings of the selected sample. This deficiency may also lead to a bias in the index in that the disruption caused by the compositional change cannot be corrected since its impact cannot be detected. Moreover, the method is prone to the
number of data collected for each stratum. For periods in which sufficient data cannot be collected, the median price may not represent the
intrinsic characteristics of that stratum, leading to a situation which cannot be corrected without continuous tracing of the strata.

8
determining the strata. In case of insufficient data7 for the towns, provinces are accepted as strata.
Similarly, in case of insufficient data for provinces, NUTS Level 2 units are accepted as strata.8
Another significant aspect of this method is the measure of median price. The HPI relies on the assumption
that the median unit price of appraised houses is indicative of the median unit price of all houses sold. The
median unit price denotes the median price calculated by using a quarterly dataset of unit prices including
the reference month, the preceding month and the succeeding month by excluding the extreme values in
each stratum. Since the distribution of the unit prices in a stratum is positively skewed, the median value
produces a more robust indicator than the mean value (EUROSTAT, RPPI Handbook, 2011). Moreover, it is
more likely that median prices filter out the outliers and reflect the central tendency better than mean
prices. For these reasons, a median based measure tends to be less volatile than a mean based measure
(McDonald and Smith, 2009).
d) Data Analysis and Construction of HPI
The most important and challenging part of the method of stratified median price is forming homogenous
strata having similar price distributions i.e. possessing analogous house properties. According to Hansen
(2006) it is possible to generate good estimates of short-term price movements from median prices, if the
medians are taken from an appropriately stratified data sample that is designed to address the key
problems of compositional change. For the Australian case, Olczyk and Lane (2008) group suburbs that have
similar price levels and price movements in order to stabilize the city-wide movements over time and
capture the pure price evolution of the housing stock.
Within this context, we observed that the geographical units of Turkey could form the strata. Therefore, a
geographical unit is determined as a stratum if the number of observations is sufficient and the distribution
converges to a normal distribution to calculate the median price.
The THPI is calculated by weighing the median unit price of each stratum which is defined as the
geographical unit having sufficient number of data by using stratified median price method. The stratum
may be a town, a province or a territorial unit according to the number of observations and the distribution
of the data. For constructing the overall index; at the first stage the weighted average of the median unit
prices for each town is taken to constitute median unit prices for provinces. At the second stage, the
median unit prices of the provinces are weighted to constitute the median unit prices of the territorial
units. Finally, the overall index is computed by taking the weighted average of median unit prices of the
7 50 observations are accepted to be sufficient for each stratum.
8 When a unit is accepted as the stratum, median for that unit is calculated using the whole data gathered for that unit. Therefore,
due to insufficiency of data, it is possible to observe NUTS Level 2 units which are accepted as strata in the calculation of the index.

9
territorial units. For constructing the TNHPI, the median unit prices of the provinces are weighted to
constitute the unit price for the whole country directly.
Considering the geographical scope, the THPI, which is constructed on a countrywide basis, covers data
pertaining to all appraised houses in 73 provinces and 26 NUTS9 Level 2 regions covering those provinces.
Eight provinces are excluded from the scope due to insufficient number of observations. While constructing
the TNHPI, data pertaining to the valuations of new houses in 26 provinces where there are sufficient
observations are used.
Whether to use the unit price or the appraised value itself is also an important issue that has to be taken
into account for constructing the HPI. “The simplest measures of house price changes are based on some
measure of central tendency from the distribution of house prices sold in a period, in particular the mean
or the median. Since house price distributions are generally positively skewed (predominantly reflecting the
heterogeneous nature of housing, the positive skew in income distributions and the zero lower bound on
transaction prices), the median is typically used rather than the mean”(EUROSTAT,RPPI Handbook, 2011).
We observed that the distribution of the data set used in constructing the HPI for Turkey is skewed to the
right almost for each stratum. An example of a right skewed distribution of house prices can be seen in
Figure 1. Moreover, the defined strata have more homogenous distributions in terms of unit prices in
comparison to the appraised values. As a result of the aforementioned distribution analysis, we decided to
use the unit price rather than the appraised value, and the median unit prices rather than the mean unit
prices.
9 Nomenclature of Territorial Units for Statistics (NUTS) is the regional unit classification designed for Turkey in compliance with the
European Union Regional Statistics System to develop a comparable statistical database.
Figure 1.Whole data set

10
We aimed to obtain the optimum stratification that ensures both homogenous groupings and sufficient
number of observations for each stratum in each period. While analyzing the data, we noticed that the
distribution approximates to normal distribution when there are 50 or more observations for each month.
Following Olczyk and Lane (2008), who constructed visual quality measures while refining the stratification
for Australian House Price Index, we used histograms and boxplots in the decision making process of
constructing strata. The histogram of the number of observations received from Town A, which is
determined to be a stratum, can be seen in Figure 2, whereas Figure 3 shows the same kind of a histogram
for Town B, which is not determined to be a stratum. As Figure 3 displays, we received less than 40
observations from Town B in each month. Therefore, Town B does not satisfy our sufficient number of
observations criterion.
*Indicates months starting from January 2010
Examining the boxplots of unit prices for each geographical unit, we explored the distributional properties
of each unit and the variations in medians and interquartile ranges. From the box-plot presentation in
Figure 4, a steady median unit price for Town A is observed for each month, whereas as seen in Figure 5,
Town B shows a volatile unit price distribution which is a long way off a normal distribution. In the case of
Town A, it can easily be seen that, range of the data, median of the data as well as the range of the first and
the third quartiles are all close to each other in each period. However, in the case of Town B, the median,
the first and the third quartiles change from period to period. For this reason, we decided that if a town has
at least 50 data in each period and converges to normal distribution then it becomes a stratum, otherwise
it does not.
Figure 2. Data from Town A Figure 3. Data from Town B

11
*Indicates months starting from January 2010
After deciding on the strata on geographical basis, we investigated whether each cluster has smaller and
more homogenous strata in itself. Because the data include the information of number of rooms we tried
to subgroup the data accordingly. For instance, for Town A, houses are separated into 3 groups for each
period; houses including less than 4 rooms form Group 3, houses including 4 rooms form Group 4 and
houses including more than 4 rooms form Group 5. It can be seen from the histograms depicted in Figures
6-11 that the number of data in each group differs from each other considerably and majority of the
observations appear in Group 4. The box-plot presentations support the view that the structure of the
distributions highly depends on the number of observations. It can be observed from the box-plot
presentation for Group 4 that the median, the first and the third quartiles of house prices exhibit a
relatively stable structure, whereas they show a volatile structure for the other two groups. Therefore,
since the house prices are not evenly distributed between the groups and prices do not represent a normal
distribution for each group, we decided not to create sub-strata by adding another dimension to
the stratification procedure such as the number of rooms.
Figure 4. Unit Price for Town A Figure 5. Unit Price for Town B

12
*Indicates months starting from January 2010
Figure 6.Data for Group 3 Figure 7.Appraised Value for Group 3
Figure 8.Data for Group 4
Figure 10.Data for Group 5
Figure 9.Appraised Value for Group 4
Figure 11.Appraised Value for Group 5

13
Following the decision of using median prices and defining the strata on geographical basis, another
issue that comes into question is to whether to use the unit price or the appraised value itself. Unit
price is calculated by dividing the appraised value of a dwelling by its gross area of use. By this way it
covers the effect of the gross area of use to the price. Moreover, there is a high and positive
correlation between the gross area of use and the number of rooms which can be observed from
Figure 12 below. As seen in the figure, there is a meaningful discrepancy in the gross area of different
groups based on the number of rooms. In other words, as the number of rooms gets higher, the area
gets larger.
Due to the high correlation between the gross area of use and number of rooms, unit price also
covers the effect of number of rooms. As it can be seen in the box-plot presentations below in
Figures 13 and 14, the difference between the medians of the unit prices for each subgroup
according to the number of rooms becomes insignificant in the case of unit price compared to the
appraised value. Figure 15 below also displays that unit price distribution for each subgroup formed
based on number of rooms resemble each other.
For these reasons, we decided to use unit price rather than appraised value of dwellings in
constructing the index.
Figure 12.Gross Area of Use and Number of

14
e) Weighting and Calculation
• Weighting
Another important issue for constructing the index is determining the weights to be used. Data on
house sales registered by the General Directorate of Land Registry and Cadastre (LRC) are used as
weights for aggregating the strata in constructing the THPI, whereas building occupancy permit
statistics issued by TURKSTAT are used for weighting in computing the TNHPI.
Figure 13.Appraised Value and Number of Rooms Figure 14.Unit Price and Number of Rooms
Figure 15. Unit Price and Number of Rooms

15
Weights used to produce the THPI are updated each year with the weights calculated using the
number of houses sold in the related stratum in the previous year. In calculating the indices for the
very first years of the series, 2010 and 2011, house sales data for 2011 are used as an exception.
On the other hand, building occupancy permits issued in the two consecutive years preceding the
reference year are used to calculate the weights for constructing the TNHPI.
• Calculation
The House Price Index (2010=100), which measures changes in the house prices compared with the
base year, is calculated using the Chain Laspeyres Index method. The reason for the implementation
of the chain index method is that the weights are updated each year.
Calculation of the Index for the Base Year:
: index for the reference month of the base year, ωi0: weight for stratum i in the base
year,
: price for stratum i for the reference month in the base year, pik0: price for stratum i
for the month k in the base year.
: price for stratum i for the month k in the base year.
weight for stratum i in the base year
Calculating the Chained Index:
: index for the reference month,
: weight for stratum i in the current year
: price for stratum i for the reference month,
: price for stratum i for December the previous year,
: index for December the previous year.

16
IV. Results
The indices we constructed consist of the THPI, the TNHPI and indices developed on the basis of
NUTS Level 2. Additionally, indices for all houses and new houses are calculated for three large
provinces, namely İstanbul, Ankara and İzmir. The base year for indices is 2010. All series starting
from January 2010 are announced on a monthly basis.
a) House Price Index for Turkey (THPI)
Figure 16. THPI and Square Meter Prices Figure 17. THPI Annual Percentage Changes
As it can be seen from Figure 16, the THPI has shown an increasing trend from the beginning. From
January 2010 to April 2012, the index increased by 24.4 percent. However, the increase expressed in
real terms10 in the same period is 4.6 percent. The unit price calculated for the whole country was
872.0 TL at the beginning of 2010 and it increased to 1085.1 TL in April 2012.
b) New Housing Price Index for Turkey (TNHPI)
Figure 18. THPI and TNHPI Figure 19. TNHPI Annual Percentage Changes
10
The real change is computed by using the CPI (2003=100).

17
The TNHPI has also shown an increasing trend similar to the THPI but it shows a slightly more volatile
pattern (Figure 18) mainly due to the structure of the new housing market. From January 2010 to
April 2012, TNHPI increased by 25.3 percent. The real increase in the same period is 5.3 percent.
c) House Price Indices for Three Large Provinces
Figure 20. HPI for Three Large Provinces
Istanbul, Ankara and Izmir are the three largest provinces of Turkey. As it can be seen in Figure 20,
the index for Istanbul shows more or less the same pattern with the countrywide index. This is
because Istanbul has the biggest share in the total number of observations and has the highest
weight in calculating the index for the whole country. In the period from January 2010 to April 2012,
the highest increase has been observed in the house price index of Istanbul. It can also be observed
from Figure 21 that the square meter prices in Istanbul are much higher than those in Ankara and
Izmir.
d) House Price Indices for NUTS Level 2
Despite the fact that median prices are calculated by using a quarterly dataset of unit prices including
the reference month, the preceding month and the succeeding month, the number of data for some
provinces is not sufficient to produce a robust median. In such cases, the NUTS Level 2 units become
strata and the median price is calculated by using the aggregated data of all provinces covered in that
unit. Indices developed on the basis of NUTS Level 2 are calculated for 26 regions and five of the
regions are strata themselves.
Figure 21. Square Meter Prices for Three Large Provinces

18
Figure 22. Annual Percentage Changes of HPI at NUTS Level 2 (April 2012)*
*See appendix for Level 2 definitions.
As it is seen in Figure 22, there is an annual price increase in real terms in fourteen of the NUTS Level
2 units, while there is an annual real price decrease in others by April 2012.
e) Interest Rates, Housing Loans and HPI
Decreasing inflation starting from 2002 has led to the realization of deferred consumption and
investment, causing an increase in household demand for housing loans. Consequently, housing
loans have increased considerably until the year 2011. The accelerated growth of housing loans since
2002 can be observed from Figure 23. The share of housing loans in GDP has been increased from 0.1
percent in 2002 to 2.1 percent in 2006. It showed a decreasing trend and dropped to 1.6 percent in
2008. After the recovery in economic activity, an increasing trend followed and the share of housing
loans reached to 2.9 percent in 2010. Reserve requirement ratios started to be used as an active
policy tool by the CBRT and have been increased starting from the end of 2010 leading to a decrease
in supply for loans. The policy of increasing the reserve requirement ratios, coupled with the decision
of Banking Regulation and Supervision Agency on limiting the loan amount to 75 percent of the value
of the house at the beginning of 2011 resulted in a decrease in the share of housing loans in GDP to
2.3 percent in 2011.

19
Figure 23. Share of Housing Loans in GDP
The inverse relationship between the housing loan interest rates and the amount of housing loans
extended can be observed from Figure 24. An increase in interest rates leads to an increase in
borrowing costs causing households delay their consumption and investment decisions. In such
periods the households are less inclined to get housing loans. On the contrary, a decrease in interest
rates leads to a decrease in borrowing costs triggering the realization of deferred consumption and
investment resulting in an increase in demand for loans.
Figure 24. Interest Rates and Housing Loans
*Quarterly extended housing loans, The Banks Association of Turkey
**Quarterly average interest rates on housing loans, CBRT
Figure 25 is also supportive of the inverse relationship between the housing loan interest rates and
the demand for housing loans. The number of observations denotes the number of valuation reports
prepared at the time of approval of individual housing loans. Considering that the number of

20
observations is an indicator of demand for housing loans, it can be observed from the graph that, as
the interest rates increase the demand for housing loans decreases.
Figure 25. Interest Rates and Number of Observations
*Monthly average interest rates on housing loans, CBRT
The effect of interest rates on house prices can be observed from Figure 26. Monthly growth rate in
the house price index is inversely related with the interest rates in the period from January 2010 to
April 2012. In the periods of lower interest rates, the decline in borrowing costs encourages
households to get housing loans and invest in housing, leading to higher house prices. On the
contrary, when the housing loan interest rates go up the demand for housing loans decrease leading
to lower house prices.
Figure 26. Interest Rates and HPI
*Monthly average interest rates on housing loans, CBRT
21
V. Conclusion
It is widely acknowledged that monitoring changes in house prices constitutes a significant
component in the decision making process of monetary policy. Moreover, the recent global financial
crises showed that asset price bubbles can threaten financial stability and thereby may have an
impact on price stability. Therefore, in the absence of a countrywide index, constructing a house
price index for Turkey has been of great importance for the CBRT.
The CBRT launched an HPI to monitor house prices starting from January 2010. In this paper, we
present our experiences of compiling and constructing an HPI emphasizing the methodology used.
Out of several approaches for constructing an HPI existing in the literature, we decided to use
stratified median price method considering the data availability and statistical applicability. By
implementing this method, housing market is divided into strata that will lead to form more
homogenous groups than the entire population. The aim is to overcome the heterogeneity problem
of housing market and eliminate the effect of compositional change that may be observed in the
data set from period to period.
For the implementation of the method we needed a proxy price due to the absence of reliable
administrative records for transaction prices. As a proxy, we used appraised values assigned by real
estate appraisal companies at the time of approval of individual housing loans.
Another consideration has been whether to use mean or median values of unit prices. We observed
that rather than the mean value, the median value better reflects the central tendency where unit
prices of houses show positively skewed distribution. This finding is also consistent with the related
literature. Moreover, it is more likely that median value filters out the outliers and tends to be less
volatile than the mean value. Therefore, we preferred using the median value to be able to produce
a robust measure of house prices.
Indices constructed consist of the THPI, the TNHPI and indices developed on the basis of NUTS Level
2. Additionally, indices for all houses and new houses are calculated for three large provinces. Both
THPI and TNHPI show an increasing trend from the beginning of the series. However this is mainly
due to the existing high inflation rate in Turkey. In real terms, house prices increase slowly, and there
seems no evidence of a house price bubble so far.
Improving the stratification by introducing new variables to construct more homogenous strata is
among the first plans for future work. It is also intended to explore the feasibility of other methods,
mainly the hedonic regression method, whenever a sufficiently long series of data becomes available.

22
VI. References
Australian Bureau of Statistics, (2006). A Guide to House Price Indexes: Australia 2006. OECD- IMF
Workshop-Real Estate Price Indexes, Paris.
Bean C., (2003). Asset Prices, Financial Imbalances and Monetary Policy: Are Inflation Targets
Enough? Monetary Stability, Financial Stability and the Business Cycle Conference, BIS, Basel
Benito A., Thompson J., Waldron M., Wood R., (2006). House Prices and Consumer Spending. Bank of
England Quarterly Bulletin, Summer 2006.
Bernanke B., Gertler M., (1999). Monetary Policy and Asset Price Volatility. New Challenges for
Monetary Policy Symposium, Federal Reserve Bank of Kansas City
Blanchard O., Dell’Ariccia G. and Mauro P.,(2010). Rethinking macroeconomic policy.IMF Staff
Position Note, SPN/10/03.
EUROSTAT. (November 2011). Handbook on Residential Property Price Indices.
http://epp.eurostat.ec.europa.eu/portal/page/portal/hicp/methodology/owner_occupied_ho
using_hpi/rppi_handbook.
Fenwick, D. (2009). A statistical System for Residential Property Price Indices. Eurostat – IAOS – IFC
Conference on Residential Property Price Indices. Basel, Switzerland: BIS.
Hansen, J. (2006-03). Australian House Prices: A Comparison of Hedonic and Repeat-sales Measures.
Reserve Bank of Australia.
IMF. (2006). Financial Soundness Indicators: . Compilation Guide.
IMF Monetary and Capital Markets Department. (2010). Central Banking Lessons from the Crisis.
Bundesbank Spring Conference
McDonald C., Smith M. (August 2009). Developing stratified housing price measures for New Zealand.
Reserve Bank of New Zealand, www.rbnz.govt.nz/research/discusspapers.
Olczyk, A., Lane, S. (2008). Refining the Stratification for the Established House Price Index. Australian
Bureau of Statistics, Canberra.
Pink B., (2009). House Price Indexes: Concepts, Sources and Methods, Australia. Australian Bureau of
StatisticsInformation Paper
Prasad, N. , Richards, A. (2006-04). Measuring Housing Price Growth – Using Stratification to Improve
Median-based Measures. Reserve Bank of Australia.

23
Prasad, N. , Richards, A. (2008). Improving Median Housing Price Indexes through Stratification. The
Journal of Real Estate Research, 30, 45-71.

24
VII. Appendix
1. Standard Data Reporting Format
1 Bank Code
2 In-Bank Tracking Number
3 Party Preparing the Valuation Report
4 Tax Id Number of the Valuation Company
5 Date of Valuation Report
6 Province
7 District
8 Quarter/Village
9 Sheet Number
10 Plot Number
11 Parcel Number
12 Block Number
13 Floor Number
14 Single Space Number
15 Type of Title
16 Type of Dwelling (Detached or Apartment Block)
17 Quarter
18 Avenue
19 Street
20 Site Name
21 Construction Level of the Dwelling
22 Security
23 Parking Lot
24 Swimming Pool
25 Elevator
26 Heating System
27 Number of Total Floors
28 Quality of the Construction
29 Year of Construction
30 Structure of the Construction
31 Saloon
32 Room
33 Kitchen
34 Bathroom
35 Balcony
36 Gross Area of Use
37 Appraised Value
38 Amount of Loan
39 Date of Loan Extension
40 Notes
25
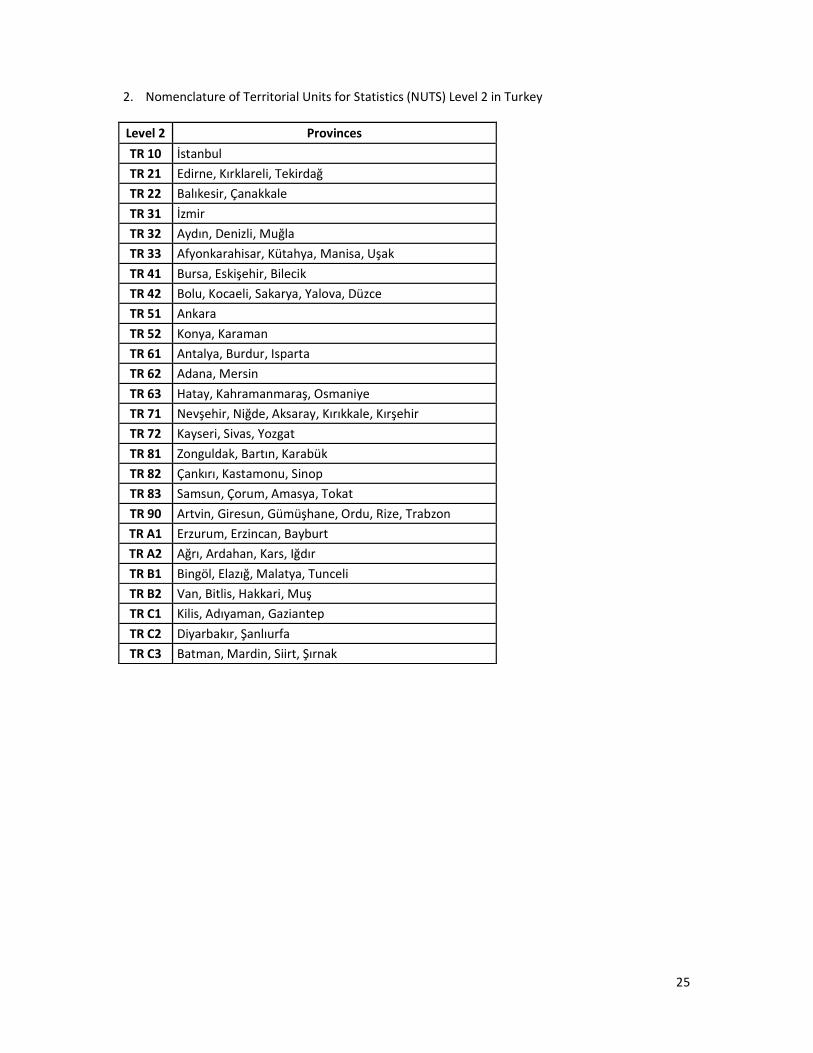
2. Nomenclature of Territorial Units for Statistics (NUTS) Level 2 in Turkey
Level 2 Provinces
TR 10 İstanbul
TR 21 Edirne, Kırklareli, Tekirdağ
TR 22 Balıkesir, Çanakkale
TR 31 İzmir
TR 32 Aydın, Denizli, Muğla
TR 33 Afyonkarahisar, Kütahya, Manisa, Uşak
TR 41 Bursa, Eskişehir, Bilecik
TR 42 Bolu, Kocaeli, Sakarya, Yalova, Düzce
TR 51 Ankara
TR 52 Konya, Karaman
TR 61 Antalya, Burdur, Isparta
TR 62 Adana, Mersin
TR 63 Hatay, Kahramanmaraş, Osmaniye
TR 71 Nevşehir, Niğde, Aksaray, Kırıkkale, Kırşehir
TR 72 Kayseri, Sivas, Yozgat
TR 81 Zonguldak, Bartın, Karabük
TR 82 Çankırı, Kastamonu, Sinop
TR 83 Samsun, Çorum, Amasya, Tokat
TR 90 Artvin, Giresun, Gümüşhane, Ordu, Rize, Trabzon
TR A1 Erzurum, Erzincan, Bayburt
TR A2 Ağrı, Ardahan, Kars, Iğdır
TR B1 Bingöl, Elazığ, Malatya, Tunceli
TR B2 Van, Bitlis, Hakkari, Muş
TR C1 Kilis, Adıyaman, Gaziantep
TR C2 Diyarbakır, Şanlıurfa
TR C3 Batman, Mardin, Siirt, Şırnak