Embed Size (px)
Citation preview
Consolidation Activity in the Southern California Area Prepared by BST Associates For the Alameda Corridor Transportation Authority March 2004
Alameda Corridor Consolidation Activity Study
March, 2004 Prepared by BST Associates Page i
Table of Contents 1 Executive Summary................................................................................................................ 3
1.1 Introduction and Study Purpose ...................................................................................... 3
1.2 Consolidation Activity.................................................................................................... 3
1.2.1 Factors Affecting Consolidation Activity 4
1.2.2 Distribution of Container Flows in San Pedro Bay 5
2 Review of Key Trends ............................................................................................................ 7
2.1 San Pedro Bay Port Container Trends ............................................................................ 7
2.1.1 Trends by Trade Route 8
2.2 Southern California Intermodal Traffic Trends ............................................................ 10
2.2.1 Intermodal Traffic Trends 10
2.2.2 Evaluation of Inland Destinations 12
2.3 Changes in Logistics Patterns ....................................................................................... 14
2.3.1 Factors Impacting Ocean Carriers 14
2.3.2 Factors Affecting Shippers 15
2.3.3 Comparison of Marine versus Domestic Container Usage 17
3 Estimate of Consolidation Activity in Southern California .................................................. 18
3.1 Third Party Logistics Transload Operators ................................................................... 18
3.1.1 Description of Third Party Logistics Transload Operators 18
3.1.2 Business Location 18
3.1.3 Business Characteristics 19
3.1.4 Survey Process and Results 20
3.2 Large Industrial Firms................................................................................................... 21
3.2.1 Description of Large Distribution Centers and Industrial Users 21
3.2.2 Business Location 21
3.2.3 Large Retailers 22
3.2.4 Survey 24
3.3 Small Firms ................................................................................................................... 25
3.4 Summary Results and Conclusions............................................................................... 27

Alameda Corridor Consolidation Activity Study
March, 2004 Prepared by BST Associates Page ii
List of Tables Table 1 – Third Quarter 2003 Capture Rate of San Pedro Bay Port Container Traffic (TEUS) 3
Table 2 – Distribution of San Pedro Bay Import Containers (2002) 6
Table 3 – U.S. and Southern California Area Intermodal Trends (containers) 11
Table 4 – Comparison of Container Dimensions 16
Table 5 – Comparison of North American Marine and Domestic Container Utilization for the First Three Quarters of 2001, 2002 and 2003 17
Table 6 – Top 40 U.S. Importers and Exporters in 2002 23
Table 7 – Distribution of San Pedro Bay Container Traffic in 2002 27
Table 8 - Distribution of Southern California Area Intermodal Traffic in 2002 28
List of figures Figure 1 – Distribution of San Pedro Bay Containers (2002) 5
Figure 2 – San Pedro Bay Container Trends 1990-2002 (Total TEUS) 7
Figure 3 – San Pedro Bay Port Market Share of Imports from Asia 8
Figure 4 – San Pedro Bay Port Market Share of U.S. Exports 9
Figure 5 – Comparison of Eastbound Intermodal Traffic from the Los Angeles BEA and Full Container Imports from San Pedro Bay Ports 12
Figure 6 – Destination of Containers Moving Eastbound from the U.S. S.W. Region 13
Figure 7 - Map of Inland Markets 13
Figure 8 – San Pedro Bay Container Trends (Full TEUS) 14
Figure 9 – Recent Growth in Doublestack Railcar Inventory 16
Figure 10 – Location of Third Party Logistics Transload Operators 19
Figure 11 – Modal Distribution of Import Containers Handled by Third Party Logistics Operators 20
Figure 12 – Location and Year of Construction of Large Industrial Buildings 21
Figure 13 – Growth in Southern California Area Industrial Real Estate Market 22
Figure 14 – Modal Distribution of Import Containers Handled by Large Firms 24
Figure 15 – Location of Small Firms 25
Figure 16 – Modal Distribution of Import Containers Handled by Small Firms 26
Alameda Corridor Consolidation Activity Study
March, 2004 Prepared by BST Associates Page 3
1 Executive Summary
1.1 Introduction and Study Purpose The Alameda Railroad Corridor consists of a 20-mile long, multiple-track rail system designed to link the rail facilities of the Port of Los Angeles and the Port of Long Beach with the transcontinental rail network of the Union Pacific Railroad Company (UP) and the Burlington Northern and Santa Fe Railway Company (BNSF), near downtown Los Angeles. The Railroad Corridor consolidated the freight rail traffic from 90 miles of pre-existing rail lines onto a single fully grade-separated route.
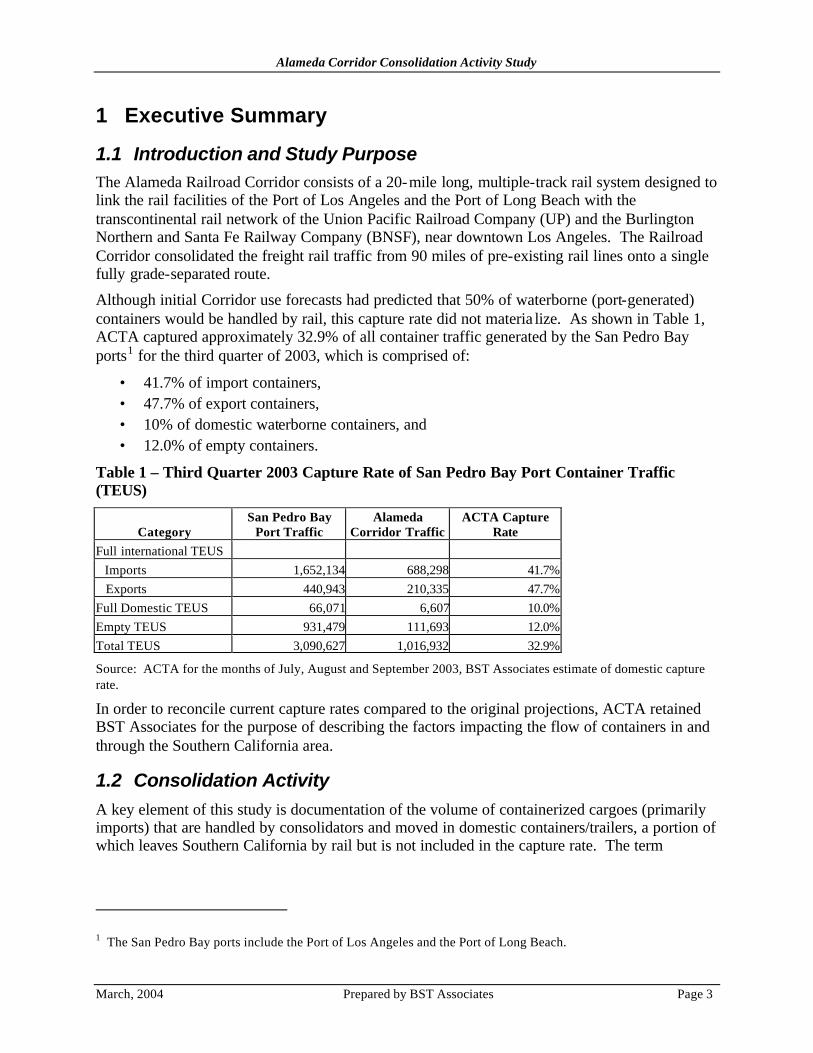
Although initial Corridor use forecasts had predicted that 50% of waterborne (port-generated) containers would be handled by rail, this capture rate did not materia lize. As shown in Table 1, ACTA captured approximately 32.9% of all container traffic generated by the San Pedro Bay ports1 for the third quarter of 2003, which is comprised of:
• 41.7% of import containers, • 47.7% of export containers, • 10% of domestic waterborne containers, and • 12.0% of empty containers.
Table 1 – Third Quarter 2003 Capture Rate of San Pedro Bay Port Container Traffic (TEUS)
Category San Pedro Bay
Port Traffic Alameda
Corridor Traffic ACTA Capture
Rate Full international TEUS Imports 1,652,134 688,298 41.7% Exports 440,943 210,335 47.7%Full Domestic TEUS 66,071 6,607 10.0%Empty TEUS 931,479 111,693 12.0%Total TEUS 3,090,627 1,016,932 32.9%
Source: ACTA for the months of July, August and September 2003, BST Associates estimate of domestic capture rate.
In order to reconcile current capture rates compared to the original projections, ACTA retained BST Associates for the purpose of describing the factors impacting the flow of containers in and through the Southern California area.
1.2 Consolidation Activity A key element of this study is documentation of the volume of containerized cargoes (primarily imports) that are handled by consolidators and moved in domestic containers/trailers, a portion of which leaves Southern California by rail but is not included in the capture rate. The term
1 The San Pedro Bay ports include the Port of Los Angeles and the Port of Long Beach.

Alameda Corridor Consolidation Activity Study
March, 2004 Prepared by BST Associates Page 4
transload is used later in this report to represent both transload and crossdock activity. These activities2 include:
• Transfer waterborne cargo from marine containers directly into domestic containers/trailers (mainly 48’/53’) and then immediately shipping these containers by truck and rail to final destinations. This direct transfer activity generally represents a small percentage of the consolidation activity.
• Transfer of waterborne cargo from marine containers directly to warehouses and distribution centers, in which they may perform a variety of value-added services. Then, at a later date, consolidators reload the cargo into domestic containers/trailers (mainly 48’/53’) for truck and rail shipment to final destinations. This activity accounts for the majority of the consolidation activities. The value added services that can be provided by transload operators include:
o Manifest verification – verify that the items on the manifest match the contents of the container,
o Labeling – attaching a label to an article, o Palletizing – placing stock keeping units (skus 3) for a particular store(s) on a pallet in
a secure manner for distribution, o Shrink wrapping – wrapping the pallet with plastic to protect it and aid in its transit, o Pick and pack - assemble an order of skus for a specific store(s) and pack it for
shipment, o DC bypass – a direct move from the consolidator to a retail store(s), o Merge in transit - package two different products together, and o Reverse Logistics - returning unsold merchandise to the DC, among others.
1.2.1 Factors Affecting Consolidation Activity
Several factors are inducing shippers and carriers to implement transload operations.
Large retail firms are engaged in transload activities to support promotional activities at specific stores or seasonal activities/holidays. Existing retailers also receive waterborne cargo with an unspecified destination upon entry, which is then handled at a transload facility. Some larger retailers have recently decided to start transload/crossdock operations (e.g., Home Depot). In addition, there are new entrants into the LA area that are using transload operations (e.g., Kohl's Department Stores). Finally, several small and mid-sized retailers (e.g., Williams-Sonoma, internet fulfillment firms) are beginning to use transload operations.
2 In its purest form cross-docking is the action of unloading materials from an incoming trailer or rail car and immediately loading these materials in outbound trailers or rail cars, thus eliminating the need for warehousing (storage). In reality, pure cross-docking is rare outside of transportation hubs and hub-and-spoke type distribution networks. Many "cross-docking" operations require large staging areas where inbound materials are sorted, consolidated, and stored until the outbound shipment is complete and ready to ship. This staging may take hours, days, or even weeks in which case the "staging area" is essentially a "warehouse". 3 SKU stands for Stock Keeping Unit and is a number associated with a product for inventory purposes. The number is used to identify an individual product.

Alameda Corridor Consolidation Activity Study
March, 2004 Prepared by BST Associates Page 5
Ocean carriers are currently experiencing significant growth in the number of empty containers that they handle, due to an imbalance between full inbound (import) and full outbound (export) containers. This imbalance results in higher costs to the shipping lines, because they must bear the transportation cost of returning the empty containers from inland destinations. It can also impact the availability of containers at overseas load ports. Some ocean carriers have responded to this predicament by providing more favorable rates from port to port (Hong Kong to Los Angeles) compared to inland point rates (Hong Kong through Los Angeles to Chicago). This rate differential places the responsibility for managing the inland transportation costs on the importer. Importers respond by accepting the marine container at a transload facility near the ports, and then the empty container is drayed back to the ocean carrier at its container terminal.
1.2.2 Distribution of Container Flows in San Pedro Bay
In 2002, the San Pedro Bay ports handled 10.6 million TEUS. As indicated in Figure 1, full import container represented 54% of total containers, followed by empty containers (28% of total), full exports (16% of total containers) and full domestic containers (2% of total containers).
Figure 1 – Distribution of San Pedro Bay Containers (2002)
Distribution of San Pedro Bay Containers (2002)
Imports (full)54%
Exports (full)16%
Domestic (full)2%
Empty28%
As shown in Table 2, approximately 64% of imported containerized cargo (3.6 million TEUS) is estimated to move by rail either directly or after transloading and 36% by truck only (2.0 million TEUS).
Import containers are handled by the following sources and modes. Approximately 2.4 million TEUS were moved directly in marine containers by intermodal rail services to inland points in the U.S., most of which are located east of the Rocky Mountains.
Alameda Corridor Consolidation Activity Study
March, 2004 Prepared by BST Associates Page 6
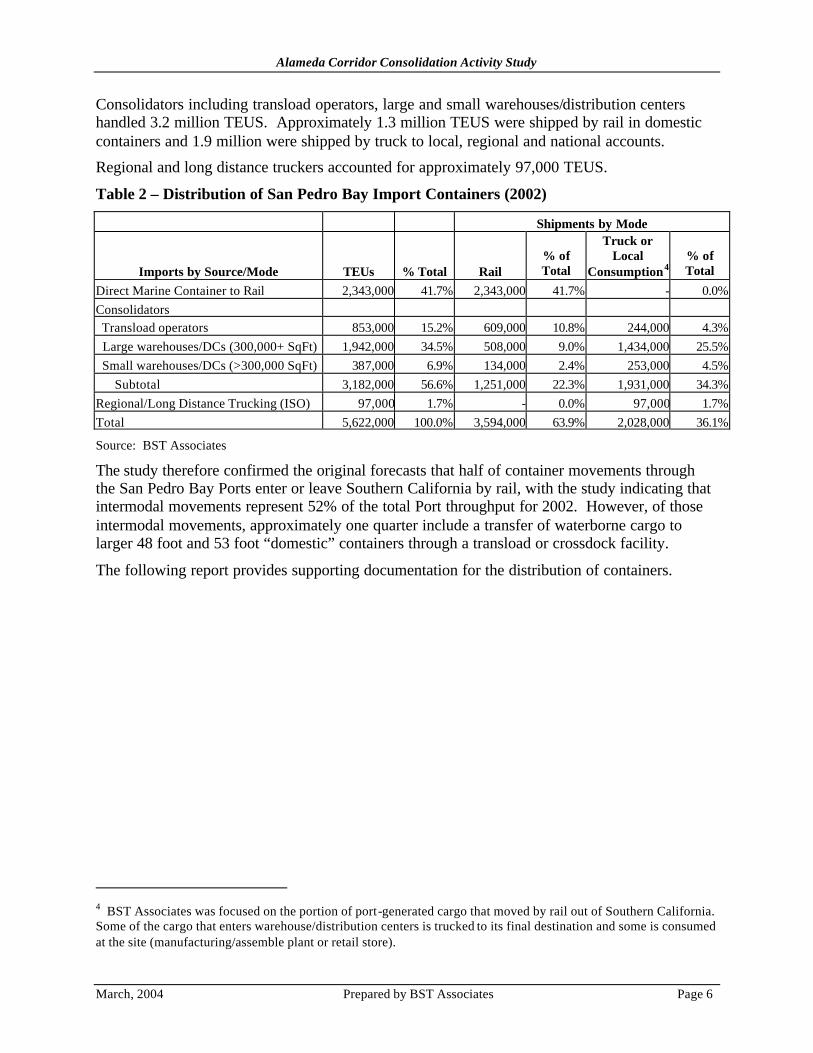
Consolidators including transload operators, large and small warehouses/distribution centers handled 3.2 million TEUS. Approximately 1.3 million TEUS were shipped by rail in domestic containers and 1.9 million were shipped by truck to local, regional and national accounts.
Regional and long distance truckers accounted for approximately 97,000 TEUS.
Table 2 – Distribution of San Pedro Bay Import Containers (2002)
Shipments by Mode
Imports by Source/Mode TEUs % Total Rail % of Total
Truck or Local
Consumption4% of Total
Direct Marine Container to Rail 2,343,000 41.7% 2,343,000 41.7% - 0.0%Consolidators Transload operators 853,000 15.2% 609,000 10.8% 244,000 4.3% Large warehouses/DCs (300,000+ SqFt) 1,942,000 34.5% 508,000 9.0% 1,434,000 25.5% Small warehouses/DCs (>300,000 SqFt) 387,000 6.9% 134,000 2.4% 253,000 4.5% Subtotal 3,182,000 56.6% 1,251,000 22.3% 1,931,000 34.3%Regional/Long Distance Trucking (ISO) 97,000 1.7% - 0.0% 97,000 1.7%Total 5,622,000 100.0% 3,594,000 63.9% 2,028,000 36.1%
Source: BST Associates
The study therefore confirmed the original forecasts that half of container movements through the San Pedro Bay Ports enter or leave Southern California by rail, with the study indicating that intermodal movements represent 52% of the total Port throughput for 2002. However, of those intermodal movements, approximately one quarter include a transfer of waterborne cargo to larger 48 foot and 53 foot “domestic” containers through a transload or crossdock facility.
The following report provides supporting documentation for the distribution of containers.
4 BST Associates was focused on the portion of port-generated cargo that moved by rail out of Southern California. Some of the cargo that enters warehouse/distribution centers is trucked to its final destination and some is consumed at the site (manufacturing/assemble plant or retail store).
Alameda Corridor Consolidation Activity Study
March, 2004 Prepared by BST Associates Page 7
2 Review of Key Trends This section provides a review of key trends affecting container transportation in Southern California. It focuses on intermodal rail transportation, which is the primary source of revenue for ACTA.
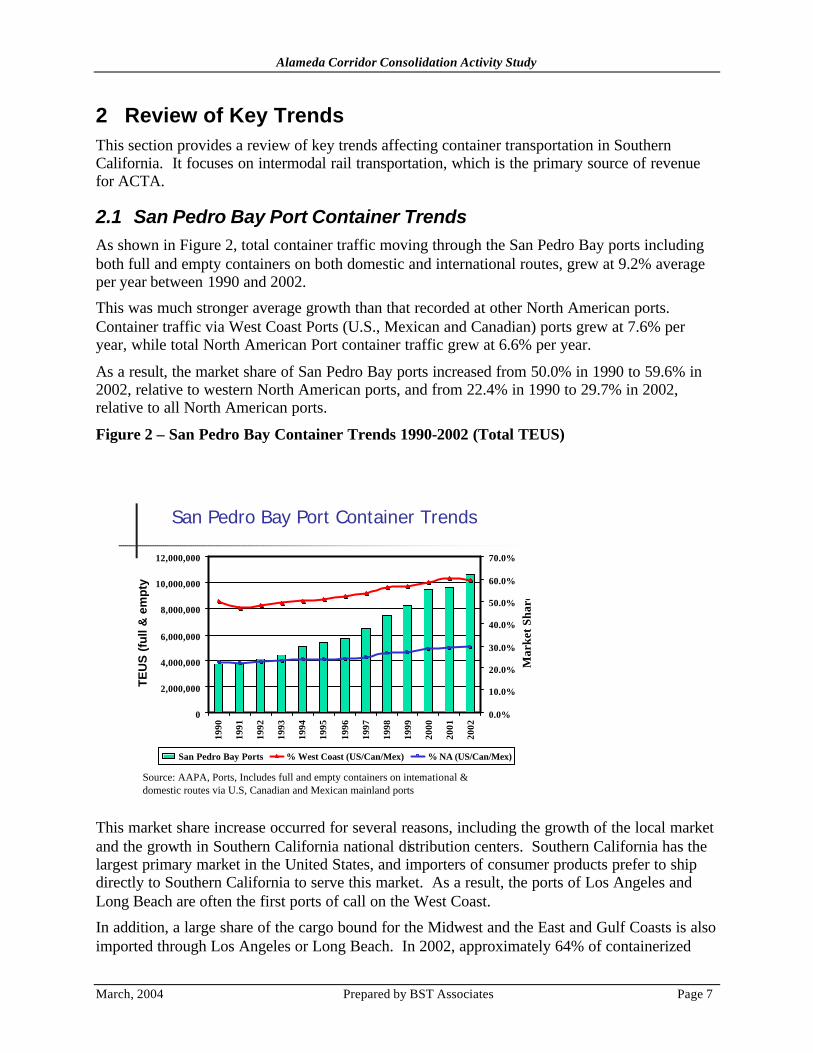
2.1 San Pedro Bay Port Container Trends As shown in Figure 2, total container traffic moving through the San Pedro Bay ports including both full and empty containers on both domestic and international routes, grew at 9.2% average per year between 1990 and 2002.
This was much stronger average growth than that recorded at other North American ports. Container traffic via West Coast Ports (U.S., Mexican and Canadian) ports grew at 7.6% per year, while total North American Port container traffic grew at 6.6% per year.
As a result, the market share of San Pedro Bay ports increased from 50.0% in 1990 to 59.6% in 2002, relative to western North American ports, and from 22.4% in 1990 to 29.7% in 2002, relative to all North American ports.
Figure 2 – San Pedro Bay Container Trends 1990-2002 (Total TEUS)
San Pedro Bay Port Container Trends
0
2,000,000
4,000,000
6,000,000
8,000,000
10,000,000
12,000,000
1990
1991
1992
1993
1994
1995
1996
1997
1998
1999
2000
2001
2002
TEU
S (
full
& e
mpt
y)
0.0%
10.0%
20.0%
30.0%
40.0%
50.0%
60.0%
70.0%
Mar
ket S
hare
San Pedro Bay Ports % West Coast (US/Can/Mex) % NA (US/Can/Mex)
Source: AAPA, Ports, Includes full and empty containers on international & domestic routes via U.S, Canadian and Mexican mainland ports
This market share increase occurred for several reasons, including the growth of the local market and the growth in Southern California national distribution centers. Southern California has the largest primary market in the United States, and importers of consumer products prefer to ship directly to Southern California to serve this market. As a result, the ports of Los Angeles and Long Beach are often the first ports of call on the West Coast.
In addition, a large share of the cargo bound for the Midwest and the East and Gulf Coasts is also imported through Los Angeles or Long Beach. In 2002, approximately 64% of containerized
Alameda Corridor Consolidation Activity Study
March, 2004 Prepared by BST Associates Page 8
cargo imported through the San Pedro Bay ports were shipped by rail to these discretionary markets.
Finally, the San Pedro Bay ports also have new, large container terminals and each has the available land and resources to continue to handle increased volumes.
2.1.1 Trends by Trade Route
This section focuses on the recent trends in import and export containerized trade.
2.1.1.1 Imports
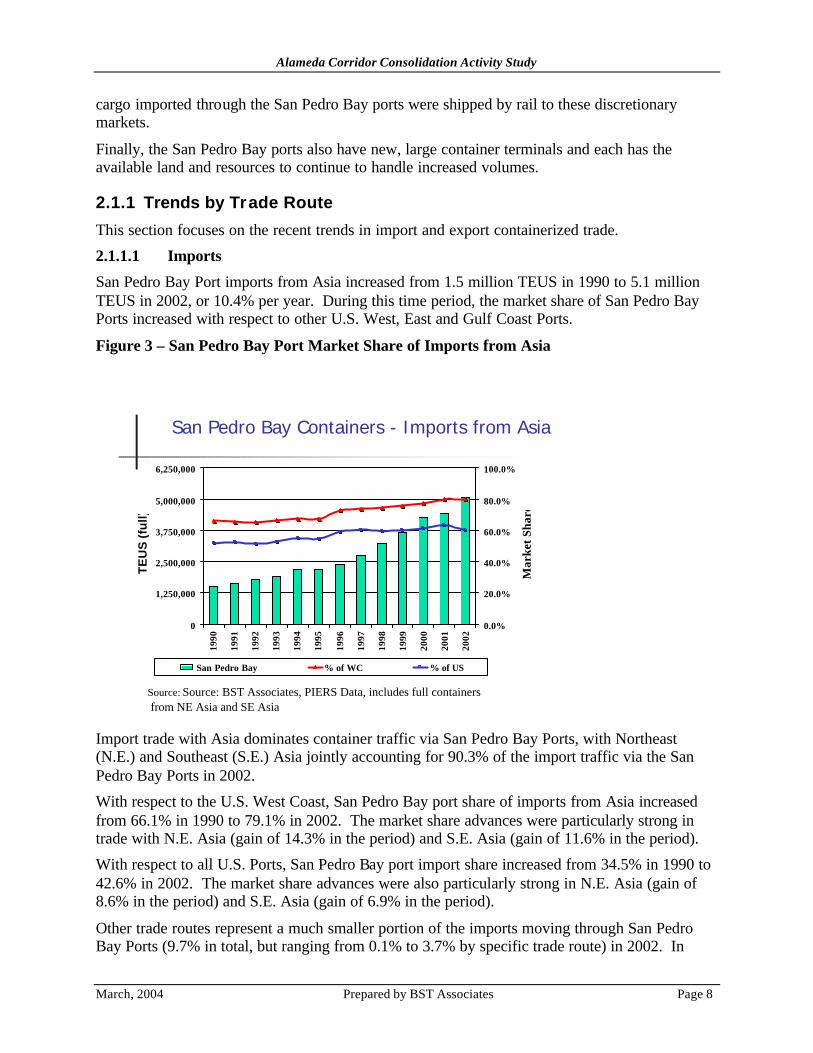
San Pedro Bay Port imports from Asia increased from 1.5 million TEUS in 1990 to 5.1 million TEUS in 2002, or 10.4% per year. During this time period, the market share of San Pedro Bay Ports increased with respect to other U.S. West, East and Gulf Coast Ports.
Figure 3 – San Pedro Bay Port Market Share of Imports from Asia
San Pedro Bay Containers - Imports from Asia
0
1,250,000
2,500,000
3,750,000
5,000,000
6,250,000
1990
1991
1992
1993
1994
1995
1996
1997
1998
1999
2000
2001
2002
TE
US
(fu
ll)
0.0%
20.0%
40.0%
60.0%
80.0%
100.0%
Mar
ket S
hare
San Pedro Bay % of WC % of US
Source: Source: BST Associates, PIERS Data, includes full containersfrom NE Asia and SE Asia
Import trade with Asia dominates container traffic via San Pedro Bay Ports, with Northeast (N.E.) and Southeast (S.E.) Asia jointly accounting for 90.3% of the import traffic via the San Pedro Bay Ports in 2002.
With respect to the U.S. West Coast, San Pedro Bay port share of imports from Asia increased from 66.1% in 1990 to 79.1% in 2002. The market share advances were particularly strong in trade with N.E. Asia (gain of 14.3% in the period) and S.E. Asia (gain of 11.6% in the period).
With respect to all U.S. Ports, San Pedro Bay port import share increased from 34.5% in 1990 to 42.6% in 2002. The market share advances were also particularly strong in N.E. Asia (gain of 8.6% in the period) and S.E. Asia (gain of 6.9% in the period).
Other trade routes represent a much smaller portion of the imports moving through San Pedro Bay Ports (9.7% in total, but ranging from 0.1% to 3.7% by specific trade route) in 2002. In

Alameda Corridor Consolidation Activity Study
March, 2004 Prepared by BST Associates Page 9
most of these routes, San Pedro Bay Ports gained market share, however, on some routes (notably Europe, South America and India), San Pedro Bay Ports lost market share between 1990 and 2002 relative to other U.S. Ports.
2.1.1.2 Exports.
San Pedro Bay container exports to Asia increased from 709,000 TEUS in 1990 to 1.3 million TEUS in 2002, or 5.2% average per year, as shown in Figure 4. Exports peaked in 1997, but then fell in 1998 and 1999 as a result of the Asian financial crisis and the strong U.S. dollar. Exports climbed back to 1997 levels in 2000 and remained steady at this level during 2001 and 2002.
Figure 4 – San Pedro Bay Port Market Share of U.S. Exports
San Pedro Bay Containers - Exports to Asia
0
1,250,000
2,500,000
3,750,000
5,000,000
6,250,000
1990
1991
1992
1993
1994
1995
1996
1997
1998
1999
2000
2001
2002
TE
US
(fu
ll)
0.0%
20.0%
40.0%
60.0%
80.0%
100.0%
Mar
ket S
hare
San Pedro Bay % of WC % of US
Source: Source: BST Associates, PIERS Data, includes full containersfrom NE Asia and SE Asia
As with imports, trade with Asia (NE and S.E. Asia) dominates export container traffic moving via San Pedro Bay Ports. N.E. and S.E. Asia accounted for 83.9% of the export traffic shipped via the San Pedro Bay Ports in 2002. The market share of San Pedro Bay Ports also increased for exported containers to Asia during the period. With respect to the U.S. West Coast, San Pedro Bay port market share increased from 43% in 1990 to 55% in 2002. The market share advances for exports were particularly strong in trade with N.E. Asia (gain of 12.1% in the period) and S.E. Asia (gain of 16.9% in the period). With respect to all U.S. Ports, San Pedro Bay port market share increased from 32% in 1990 to 42% in 2001, falling to 41% in 2002. The market share advances were also particularly strong in N.E. Asia during this period (gain of 9.8% in the period) and S.E. Asia (gain of 12.0% in the period).
As with imports, other trade routes represented a much smaller portion of San Pedro Bay port throughput (9.7% in total but ranging from 0.1% to 5.5% by specific trade route) in 2002. For most of these routes, San Pedro Bay Ports gained market share, but in some routes (Europe,
Alameda Corridor Consolidation Activity Study
March, 2004 Prepared by BST Associates Page 10
Mideast and Africa), San Pedro Bay Ports experienced a decline in market share relative to other Ports.
2.2 Southern California Intermodal Traffic Trends Intermodal traffic refers to containers and/or trailers that are transferred from trucks to railcars for carriage to more distant locations. Intermodal containers, which originate or terminate at the San Pedro Bay Ports, represent a significant portion of ACTA’s revenue.
Most of these intermodal containers consist of imports from Asia that are bound for destinations east of the Rocky Mountains. The further from a port that a container terminates, the more transport methods that are available for the shipment. These alternatives may include intermodal shipment from other North American West Coast Ports or all-water ocean services that transport the container by water from the Asian port via the Panama or Suez Canal to a Port on the East or Gulf coasts. Most of the competition that San Pedro Bay Ports face is related to intermodal discretionary traffic.
This section identifies that national and regional trends that shape this market.
2.2.1 Intermodal Traffic Trends
According to the Association of American Railroads (AAR), intermodal containers/trailers moved on U.S. railroads increased at an average annual rate of 6.7% between 1988 and 1995 and then slowed to 0.4% from 1995 through 2002. Container traffic has grown much more rapidly than trailer traffic, however, with container counts first surpassing trailer counts in 1992. Intermodal container traffic in the U.S. grew at 9.9% per year from 1988 to 1995, before slowing to 6.3% from 1995 to 2002.
In the Los Angeles Business Economic Area (which is somewhat similar to the 10-county Southern California area defined in ACTA’s Use and Operating Agreement)5, intermodal traffic (in both directions) increased at an average annual rate of 10.3% between 1988 and 1995 and then slowed to 7.4% from 1995 through 2002.
5 The Los Angeles Business Economic Area is defined as Imperial, Kern, Los Angeles, Orange, Riverside, San Bernardino, San Luis Obispo, Santa Barbara, and Ventura counties in California and Los Angeles Paz and Yuma counties in Arizona. For the purposes of this report, the LA BEA is equivalent with the 10-county region in the LA area with respect to intermodal rail traffic.

Alameda Corridor Consolidation Activity Study
March, 2004 Prepared by BST Associates Page 11
Table 3 – U.S. and Southern California Area Intermodal Trends (containers 6)
U.S. Intermodal Traffic Southern California Area SC % Year Containers Trailers Total Eastbound Westbound Total of U.S.
1988 2,298,527 3,481,020 5,779,547 570,893 513,410 1,084,303 19%1989 2,491,093 3,496,262 5,987,355 655,817 528,995 1,184,812 20%1990 2,754,829 3,451,953 6,206,782 657,564 648,669 1,306,233 21%1991 3,044,574 3,201,560 6,246,134 797,210 634,332 1,431,542 23%1992 3,363,244 3,264,597 6,627,841 876,718 670,870 1,547,588 23%1993 3,692,502 3,464,126 7,156,628 938,305 764,193 1,702,498 24%1994 4,375,726 3,752,502 8,128,228 1,038,845 936,820 1,975,665 24%1995 4,443,709 3,492,463 9,095,701 1,111,719 1,043,259 2,154,978 24%1996 4,553,605 3,568,462 9,316,146 1,235,447 1,090,298 2,325,745 25%1997 5,244,401 3,453,907 8,698,308 1,261,264 1,145,812 2,407,076 28%1998 5,419,631 3,353,032 8,772,663 1,487,312 1,142,851 2,630,163 30%1999 5,700,219 3,207,407 8,907,626 1,676,812 1,320,119 2,996,931 34%2000 6,288,260 2,888,630 9,176,890 1,872,820 1,426,104 3,298,924 36%2001 6,332,021 2,603,423 8,935,444 1,956,840 1,439,016 3,395,856 38%2002 6,805,000 2,526,000 9,331,000 2,084,356 1,473,322 3,557,678 38%Compound Annual Growth Rates 1988-1995 9.9% 0.0% 6.7% 10.0% 10.7% 10.3% 1995-2002 6.3% -4.5% 0.4% 9.4% 5.1% 7.4% 1988-2002 8.1% -2.3% 3.5% 9.7% 7.8% 8.9%
Source: BST Associates, data from Surface Transportation Board and Association of American Railroads
Eastbound intermodal traffic increased from 570,893 units in 1988 to 2.1 million in 2002, or 9.7% average per year, while westbound intermodal traffic increased 7.8% average per year during the same period. Southern California area intermodal traffic increased from 19% of total U.S. intermodal traffic in 1988 to 38% in 2002.
Nearly all of the eastbound intermodal traffic is comprised of full import containers (both marine and transloaded) bound for locations east of the Rocky Mountains. As shown in Figure 5, eastbound intermodal traffic from Southern California area is closely correlated with imports generated at the San Pedro Bay Ports. The rate of growth of eastbound intermodal traffic, which grew 10.1% per year between 1990 and 2002, closely matched the annual growth of San Pedro Bay full container imports, which grew 10.4% annually during this time period.
6 Rail traffic is reported in number of containers, regardless of their length.

Alameda Corridor Consolidation Activity Study
March, 2004 Prepared by BST Associates Page 12
Figure 5 – Comparison of Eastbound Intermodal Traffic from the Los Angeles BEA and Full Container Imports from San Pedro Bay Ports
Relationship between Port Imports and Eastbound Railroad Containers
0.0
0.5
1.0
1.5
2.0
2.5
3.0
3.5
1990 1991 1992 1993 1994 1995 1996 1997 1998 1999 2000 2001 2002
Inde
x (1
990
= 10
0)
Import TEUs Eastbound Lifts
Source: BST Associates, using STB/ICC, PIERS Data
2.2.2 Evaluation of Inland Destinations
Trends in eastbound container traffic serving intermodal markets are described in this section, using data from the Intermodal Association of North America (IANA). As shown in Figure 6, the key inland destinations for containers moving from the Southwest region (California, Arizona and Nevada) are the Midwest, Southcentral, Southeast and Northeast regions. Figure 7 presents a map of these regions.
Nearly all containers moving from the Southwest region originate in the Southern California area. In addition, nearly all of the eastbound container movements from the Southwest region are comprised of Asian imports moving from the San Pedro Bay Ports to inland discretionary markets by rail.
Overall, the Southwest Region’s share of intermodal markets (defined as those U.S. regions located east of the Rocky Mountains) declined from 65% in 2001 to 57% in 2003. Some of the Southwest Region’s decline in market share between 2001 and 2003 was caused by congestion occurring as a result of the ILWU lockout in October 2002. During the lockout, shippers were forced to find alternative methods of transporting containerized goods, including a shift to other West Coast Ports (such as Vancouver, B.C.), increased use of all-water services to East and Gulf Coast Ports, pre-positioning cargoes prior to the strike, and shift to air transport for higher valued cargoes.

Alameda Corridor Consolidation Activity Study
March, 2004 Prepared by BST Associates Page 13
Figure 6 – Destination of Containers Moving Eastbound from the U.S. S.W. Region
Eastbound Intermodal Containers from Southwest U.S. (Containers)
0
25,000
50,000
75,000
100,000
125,000
150,000
175,000
200,000
225,000
Q1-01 Q2-01 Q3-01 Q4-01 Q1-02 Q2-02 Q3-02 Q4-02 Q1-03 Q2-03 Q3-03
Mid-West Northeast Southcentral Southeast
Source: BST Associates, using IANA Data
Figure 7 - Map of Inland Markets
WI
OH
MO
MN
MI
KYKS
INIL
IA
Northwest
Mountain Central
Mid-WestSouthwest
Southcentral Southeast
Eastern Canada
Western Canada
Northeast
Source: IANA
Alameda Corridor Consolidation Activity Study
March, 2004 Prepared by BST Associates Page 14
2.3 Changes in Logistics Patterns Before 2000, ocean carriers typically decided which ports to use and directed inland distribution patterns. However, shippers now control much of the containerized cargo distribution for two primary reasons: the growing imbalance between imports and exports, and the growth in distribution centers.
2.3.1 Factors Impacting Ocean Carriers
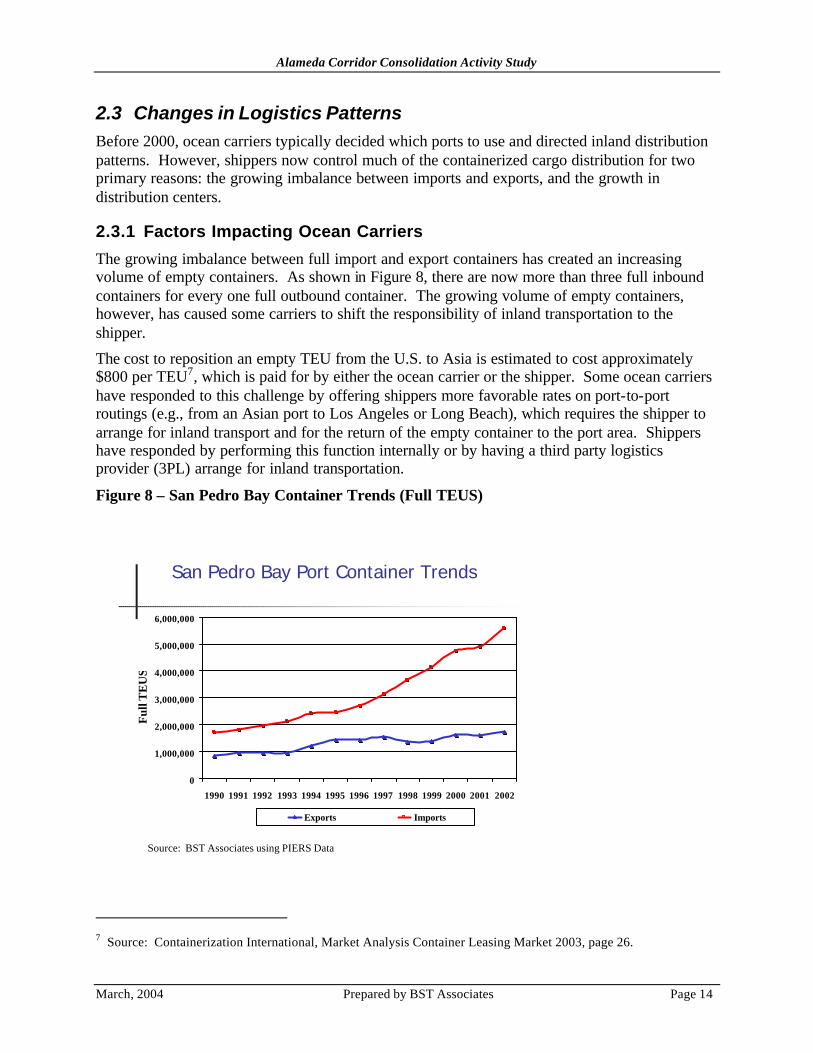
The growing imbalance between full import and export containers has created an increasing volume of empty containers. As shown in Figure 8, there are now more than three full inbound containers for every one full outbound container. The growing volume of empty containers, however, has caused some carriers to shift the responsibility of inland transportation to the shipper.
The cost to reposition an empty TEU from the U.S. to Asia is estimated to cost approximately $800 per TEU7, which is paid for by either the ocean carrier or the shipper. Some ocean carriers have responded to this challenge by offering shippers more favorable rates on port-to-port routings (e.g., from an Asian port to Los Angeles or Long Beach), which requires the shipper to arrange for inland transport and for the return of the empty container to the port area. Shippers have responded by performing this function internally or by having a third party logistics provider (3PL) arrange for inland transportation.
Figure 8 – San Pedro Bay Container Trends (Full TEUS)
San Pedro Bay Port Container Trends
0
1,000,000
2,000,000
3,000,000
4,000,000
5,000,000
6,000,000
1990 1991 1992 1993 1994 1995 1996 1997 1998 1999 2000 2001 2002
Ful
l TE
US
Exports Imports
Source: BST Associates using PIERS Data
7 Source: Containerization International, Market Analysis Container Leasing Market 2003, page 26.

Alameda Corridor Consolidation Activity Study
March, 2004 Prepared by BST Associates Page 15
2.3.2 Factors Affecting Shippers
Shippers (particularly retailers) have introduced increasingly sophisticated logistics systems to properly match demand in stores with their supply chains. Since the mid-1990s, the real price of durable goods has decreased virtually every year. This has occurred due to increased production in low-cost regions (particularly in China) as well as productivity improvements by other manufacturers. In an era of falling retail prices, shippers must generate profits by reducing their transportation costs. There is continuous pressure on shippers to lower truck, rail and inventory costs. As Cass Logistics8 points out, shippers have responded by finding ways to lower transportation costs:
“Transportation costs have declined by 24 percent during these 22 years (since 1981). Inventory carrying costs have declined by 66 percent. We reduced inventory investment during 2002 and our inventory carrying costs declined to a record low, due to the 1.6 percent commercial paper interest rate. With the record low achieved during 2002, total logistics declined by more than 54 percent during these 22 years”.
One of the ways that shippers are controlling costs is through the greater use of consolidation centers, including both transload and crossdock activity, which includes:
• Transfer of incoming waterborne cargo directly to outgoing domestic containers/trailers (mainly 48’/53’ containers) without storing it in between. The value added by these centers is generally limited to inventory logistics programming. This activity is a small portion of consolidation activity.
• Transfer of incoming waterborne cargo directly to a distribution center, whereupon a variety of value-added services are undertaken and then the cargo is loaded into domestic containers/trailers for transport to its ultimate destination. This activity represents the majority of the consolidation activity in the Southern California area.
Table 4 describes the dimensions and capacity of the main containers available to shippers in North America. Containers that are 20-, 40- and 45-feet in length are carried on ocean container carriers, while 28-, 48- and 53-foot containers are only used domestically in North America. Some low-density lightweight cargoes (such as toys, apparel, electronic equipment, sporting goods, shoes) cube out the capacity of a container before they reach the maximum weight that can be carried. Other cargoes (such as auto parts, steel fasteners, food products and the like) reach a maximum weight before they reach maximum capacity. As a result, more lightweight cargoes can be carried in the largest containers. Consolidators report that the contents of 1.5 to 1.7 40-foot standard marine containers can be consolidated into one 53-foot domestic container. Ocean carriers have responded to this by using a greater number of high cube 40-foot containers (which have a height of 9’6” as compared with a standard 40-foot container with a height of 8’6”). In addition, ocean carriers are beginning to use more 45-foot containers, which provide even more capacity than the high cube 40-foot container.
8 Source: 14th Annual "State Of Logistics Report” The Case for Reconfiguration, Cass Information Systems, Inc. and Prologis, June 2, 2002. Cass Logistics is the oldest and largest provider of freight invoice payment, audit and information services in North America. The estimates of transportation costs are based upon the statistics of their clients.
Alameda Corridor Consolidation Activity Study
March, 2004 Prepared by BST Associates Page 16
Table 4 – Comparison of Container Dimensions
Dimensions (Feet) TEU Equivalencies
Container Size Length Height Width
Volume (cubic feet) 20- foot
40-standard
40-highcube
45-highcube
20 foot 19.3 7.8 7.7 1,149 1.0 0.48 0.46 0.3828 foot high-cube 27.3 8.9 8.3 2,029 1.8 0.86 0.80 0.6740 foot 39.5 7.8 7.7 2,372 2.1 1.00 0.94 0.7940 foot, high cube 39.5 8.3 7.7 2,524 2.2 1.06 1.00 0.8445 foot, high cube 44.5 8.8 7.7 3,014 2.6 1.27 1.19 1.0048 foot, high cube 47.5 8.8 8.2 3,427 3.0 1.44 1.36 1.1453 foot, high cube 52.5 8.8 8.2 3,787 3.3 1.60 1.50 1.26
Source: The Official Intermodal Equipment Register
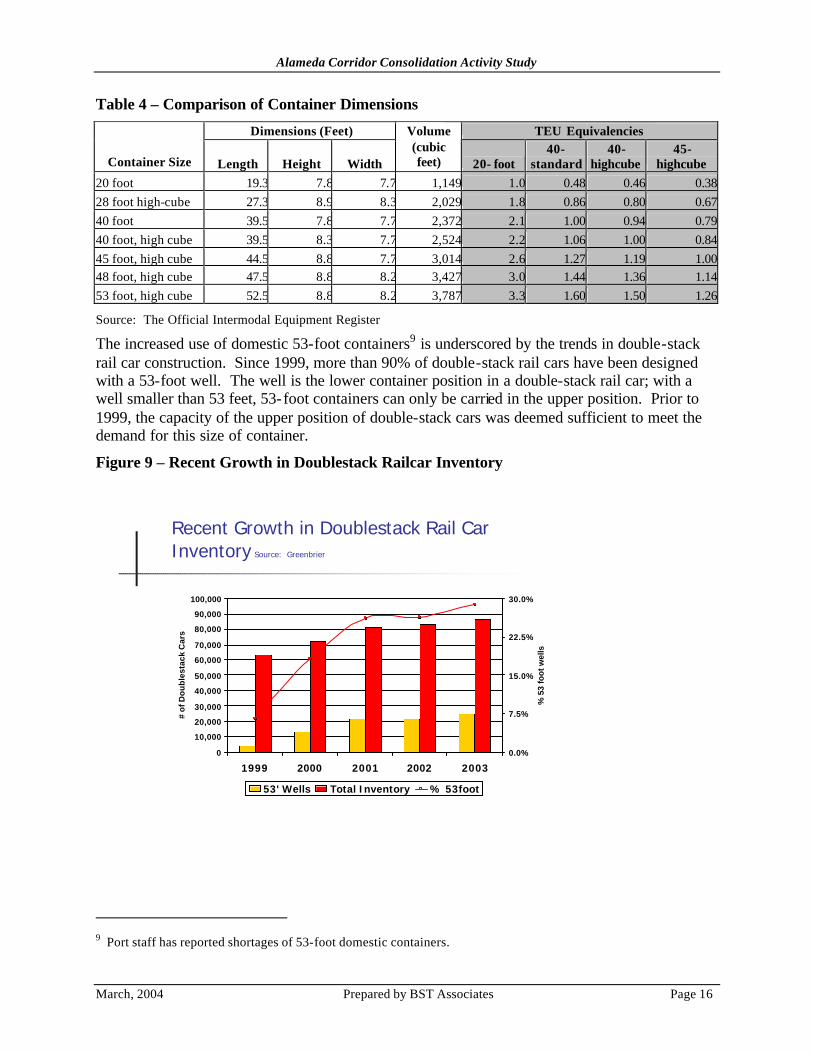
The increased use of domestic 53-foot containers9 is underscored by the trends in double-stack rail car construction. Since 1999, more than 90% of double-stack rail cars have been designed with a 53-foot well. The well is the lower container position in a double-stack rail car; with a well smaller than 53 feet, 53-foot containers can only be carried in the upper position. Prior to 1999, the capacity of the upper position of double-stack cars was deemed sufficient to meet the demand for this size of container.
Figure 9 – Recent Growth in Doublestack Railcar Inventory
Recent Growth in Doublestack Rail Car Inventory Source: Greenbrier
0
10,000
20,000
30,000
40,000
50,000
60,000
70,000
80,000
90,000
100,000
1999 2000 2001 2002 2003
# o
f Do
ub
lest
ack
Car
s
0.0%
7.5%
15.0%
22.5%
30.0%
% 5
3 fo
ot
wel
ls
53' Wells Total Inventory % 53foot
9 Port staff has reported shortages of 53-foot domestic containers.
Alameda Corridor Consolidation Activity Study
March, 2004 Prepared by BST Associates Page 17
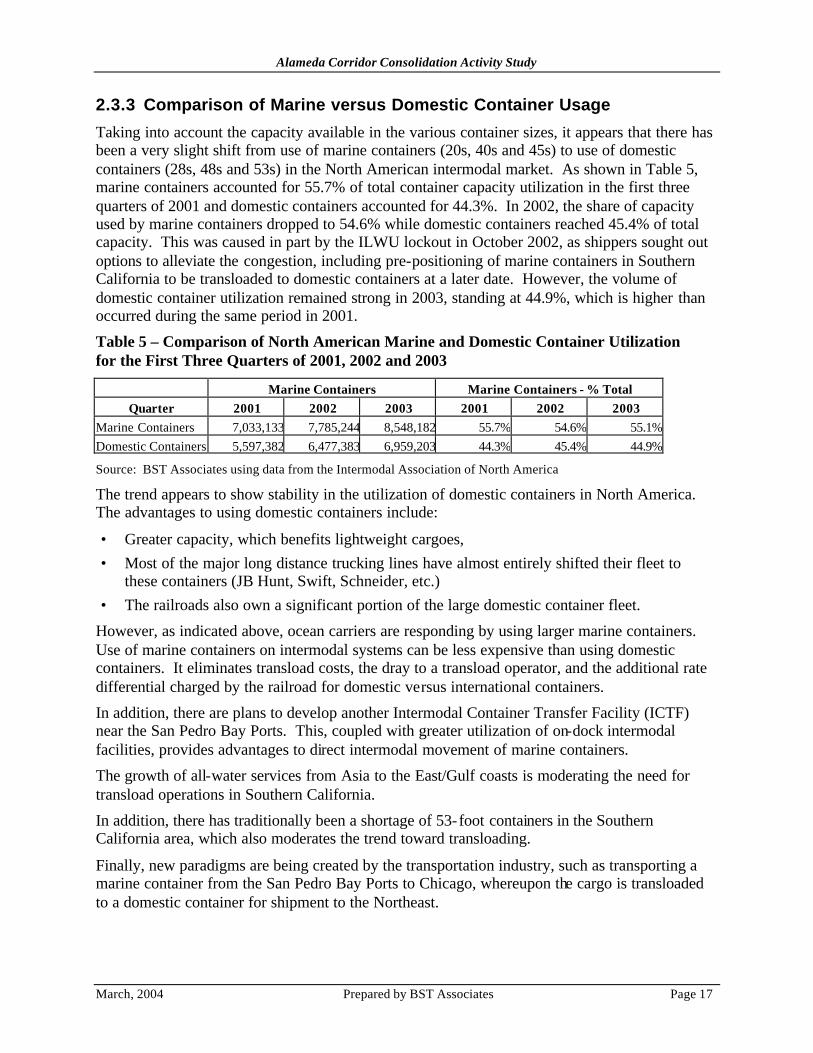
2.3.3 Comparison of Marine versus Domestic Container Usage
Taking into account the capacity available in the various container sizes, it appears that there has been a very slight shift from use of marine containers (20s, 40s and 45s) to use of domestic containers (28s, 48s and 53s) in the North American intermodal market. As shown in Table 5, marine containers accounted for 55.7% of total container capacity utilization in the first three quarters of 2001 and domestic containers accounted for 44.3%. In 2002, the share of capacity used by marine containers dropped to 54.6% while domestic containers reached 45.4% of total capacity. This was caused in part by the ILWU lockout in October 2002, as shippers sought out options to alleviate the congestion, including pre-positioning of marine containers in Southern California to be transloaded to domestic containers at a later date. However, the volume of domestic container utilization remained strong in 2003, standing at 44.9%, which is higher than occurred during the same period in 2001.
Table 5 – Comparison of North American Marine and Domestic Container Utilization for the First Three Quarters of 2001, 2002 and 2003
Marine Containers Marine Containers - % Total Quarter 2001 2002 2003 2001 2002 2003
Marine Containers 7,033,133 7,785,244 8,548,182 55.7% 54.6% 55.1%Domestic Containers 5,597,382 6,477,383 6,959,203 44.3% 45.4% 44.9%
Source: BST Associates using data from the Intermodal Association of North America
The trend appears to show stability in the utilization of domestic containers in North America. The advantages to using domestic containers include:
• Greater capacity, which benefits lightweight cargoes, • Most of the major long distance trucking lines have almost entirely shifted their fleet to
these containers (JB Hunt, Swift, Schneider, etc.) • The railroads also own a significant portion of the large domestic container fleet.
However, as indicated above, ocean carriers are responding by using larger marine containers. Use of marine containers on intermodal systems can be less expensive than using domestic containers. It eliminates transload costs, the dray to a transload operator, and the additional rate differential charged by the railroad for domestic versus international containers.
In addition, there are plans to develop another Intermodal Container Transfer Facility (ICTF) near the San Pedro Bay Ports. This, coupled with greater utilization of on-dock intermodal facilities, provides advantages to direct intermodal movement of marine containers.
The growth of all-water services from Asia to the East/Gulf coasts is moderating the need for transload operations in Southern California.
In addition, there has traditionally been a shortage of 53-foot containers in the Southern California area, which also moderates the trend toward transloading.
Finally, new paradigms are being created by the transportation industry, such as transporting a marine container from the San Pedro Bay Ports to Chicago, whereupon the cargo is transloaded to a domestic container for shipment to the Northeast.

Alameda Corridor Consolidation Activity Study
March, 2004 Prepared by BST Associates Page 18
3 Estimate of Consolidation Activity in Southern California BST Associates undertook a survey of the primary transload and crossdock operators in the Southern California area in order to better understand the flow of containerized cargoes. The main goal of the surveys was to define the characteristics and size of the intermodal transport market that uses domestic containers.
The survey differentiated three distinct types of operations that receive containers from the San Pedro Bay Ports and then ship the reassembled contents by rail in domestic containers:
• Third party logistics (“3PL”) transload operators – specialty firms that manage transportation flows and distribution centers for large and small shippers. This survey focused on third party logistics operators that provide transload services.
• Large distribution centers – defined as industrial buildings larger than 300,000 square feet. This real estate market includes most of the Southern California area’s distribution centers and warehouses.
• Small distribution firms – defined as importers, exporters, and transportation service providers that use facilities, which are less than 300,000 square feet (excluding the transload operators).
3.1 Third Party Logistics Transload Operators This section describes the results of the survey of transload operators.
3.1.1 Description of Third Party Logistics Transload Operators
BST Associates utilized the following process to establish a comprehensive list of transload operators in Southern California:
• Who’s Who in Logistics, Armstrong’s Guide to Global Supply Chain Management, Armstrong & Armstrong, Inc., 2003,
• Leonard’s Guide, National Warehouse and Distribution Directory, 2003, • Directory of Freight Forwarding Services, online service, among others.
This list was supplemented with information from the Ports of Los Angeles and Long Beach10 and by extensive Internet searches. BST Associates interviewed firms in this line of business in person and by telephone.
3.1.2 Business Location
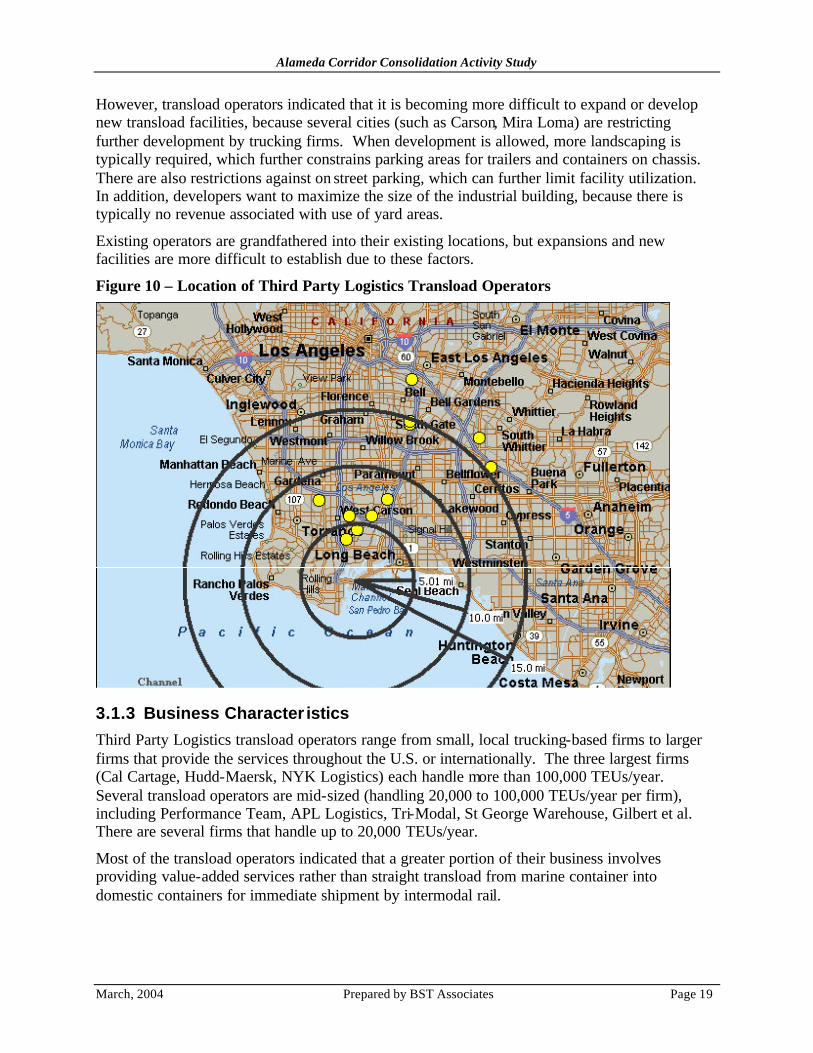
Transload operators are generally located in close proximity to the San Pedro Bay Ports, because it is easier for them to make multiple truck trips between the port terminals and transload facilities. Most are located within a 15-mile radius of the San Pedro Bay Ports. Figure 10 indicates the general locations of these firms.
10 We wish to thank Mr. Mike Debernardo, Port of Los Angeles for his kind assistance in this effort.
Alameda Corridor Consolidation Activity Study
March, 2004 Prepared by BST Associates Page 19
However, transload operators indicated that it is becoming more difficult to expand or develop new transload facilities, because several cities (such as Carson, Mira Loma) are restricting further development by trucking firms. When development is allowed, more landscaping is typically required, which further constrains parking areas for trailers and containers on chassis. There are also restrictions against on street parking, which can further limit facility utilization. In addition, developers want to maximize the size of the industrial building, because there is typically no revenue associated with use of yard areas.
Existing operators are grandfathered into their existing locations, but expansions and new facilities are more difficult to establish due to these factors.
Figure 10 – Location of Third Party Logistics Transload Operators
3.1.3 Business Character istics
Third Party Logistics transload operators range from small, local trucking-based firms to larger firms that provide the services throughout the U.S. or internationally. The three largest firms (Cal Cartage, Hudd-Maersk, NYK Logistics) each handle more than 100,000 TEUs/year. Several transload operators are mid-sized (handling 20,000 to 100,000 TEUs/year per firm), including Performance Team, APL Logistics, Tri-Modal, St George Warehouse, Gilbert et al. There are several firms that handle up to 20,000 TEUs/year.
Most of the transload operators indicated that a greater portion of their business involves providing value-added services rather than straight transload from marine container into domestic containers for immediate shipment by intermodal rail.
Alameda Corridor Consolidation Activity Study
March, 2004 Prepared by BST Associates Page 20
There are dynamic competitive forces impacting transload operators, including:
• Competition on price and service among mid and large sized 3PLs for the accounts of large and mid-sized retailers. Firms that are affiliated with an ocean carrier are pricing aggressively. Firms that are not affiliated with ocean carriers view this as an attempt to use the transload process to induce the shipper to use the ocean carrier.
• Facility requirements are also becoming more expensive and demanding for firms serving the large retailers. In particular, Internet tracking capabilities and warehouse inventory systems (Radio Frequency Identification or RFID) are now being required by importers. This is adding to the cost and scale of transload operations.
• Smaller players compete on price and personal approach. As indicated previously, many of the smaller firms have their main base in trucking. Others provide related services; such as export reload services, NAFTA trade (with Canada and Mexico) and/or domestic trade to round out their business plans.
3.1.4 Survey Process and Results
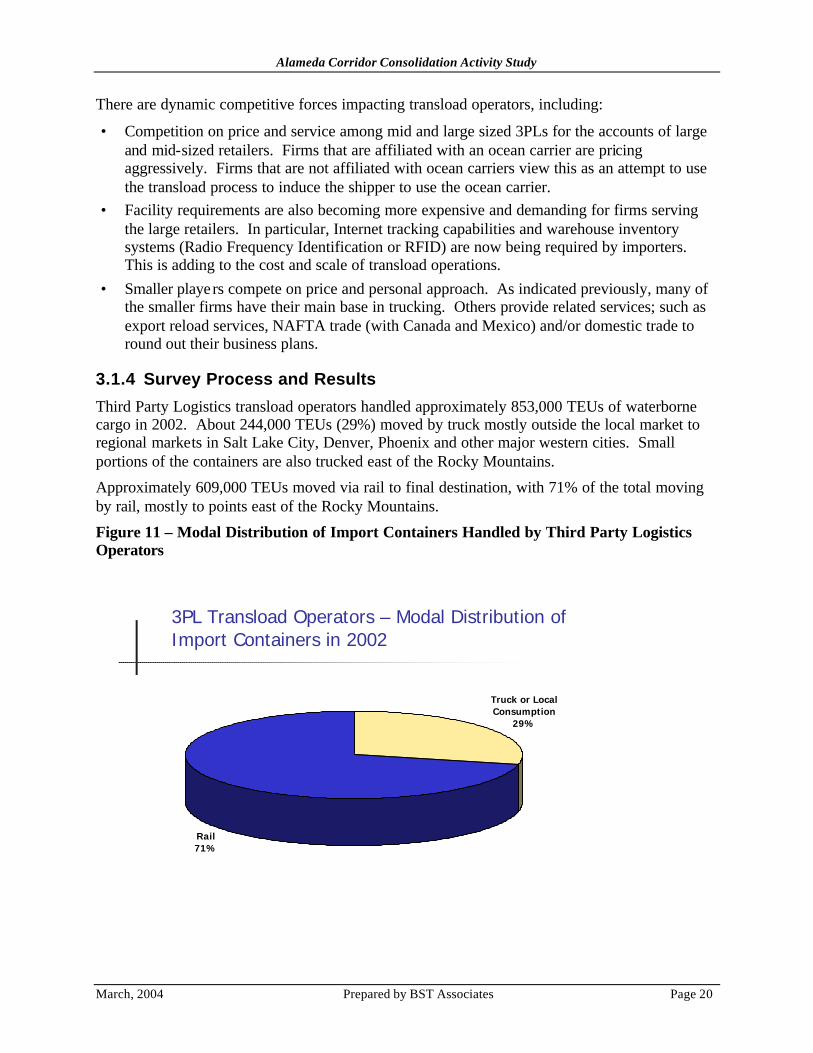
Third Party Logistics transload operators handled approximately 853,000 TEUs of waterborne cargo in 2002. About 244,000 TEUs (29%) moved by truck mostly outside the local market to regional markets in Salt Lake City, Denver, Phoenix and other major western cities. Small portions of the containers are also trucked east of the Rocky Mountains.
Approximately 609,000 TEUs moved via rail to final destination, with 71% of the total moving by rail, mostly to points east of the Rocky Mountains.
Figure 11 – Modal Distribution of Import Containers Handled by Third Party Logistics Operators
3PL Transload Operators – Modal Distribution of Import Containers in 2002
Truck or Local Consumption
29%
Rail71%
Alameda Corridor Consolidation Activity Study
March, 2004 Prepared by BST Associates Page 21
3.2 Large Industrial Firms This section describes the results of the survey of large industrial firms.
3.2.1 Description of Large Distribution Centers and Industrial Users
BST Associates utilized the CoStar property database and Dun & Bradstreet data to identify the large distribution centers and industrial users in Southern California, focusing on industrial buildings greater than 300,000 square feet in size. CoStar’s database assisted in the identification of important property characteristics such as owner’s name, address, phone number, type of building, size of building, and year built, while the Dun and Bradstreet data added information on the types of businesses, number of employees, revenue, and other data. In those cases in which the owner of the building was an investment firm, Internet searches and directories were utilized to reveal the user of the facility. After establishing the user’s name, contact person and phone number, they were contacted by telephone.
3.2.2 Business Location
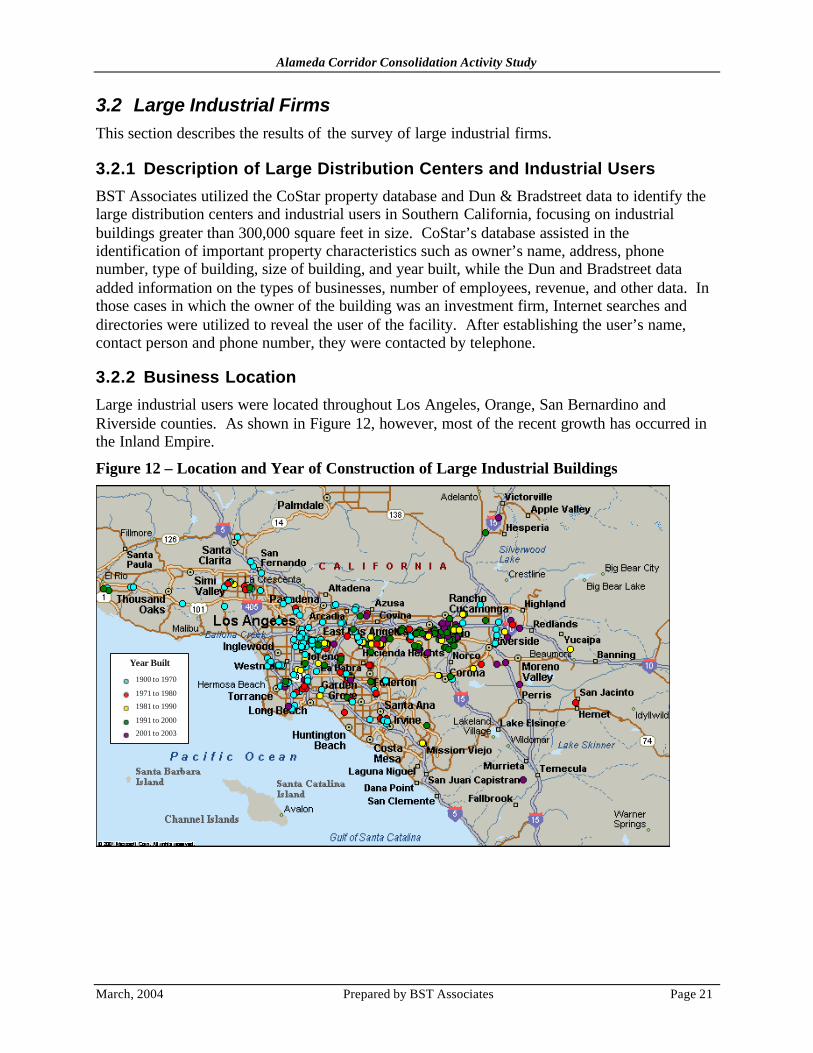
Large industrial users were located throughout Los Angeles, Orange, San Bernardino and Riverside counties. As shown in Figure 12, however, most of the recent growth has occurred in the Inland Empire.
Figure 12 – Location and Year of Construction of Large Industrial Buildings
1900 to 1970
1971 to 1980
1981 to 1990
1991 to 2000
2001 to 2003
Year Built
Alameda Corridor Consolidation Activity Study
March, 2004 Prepared by BST Associates Page 22
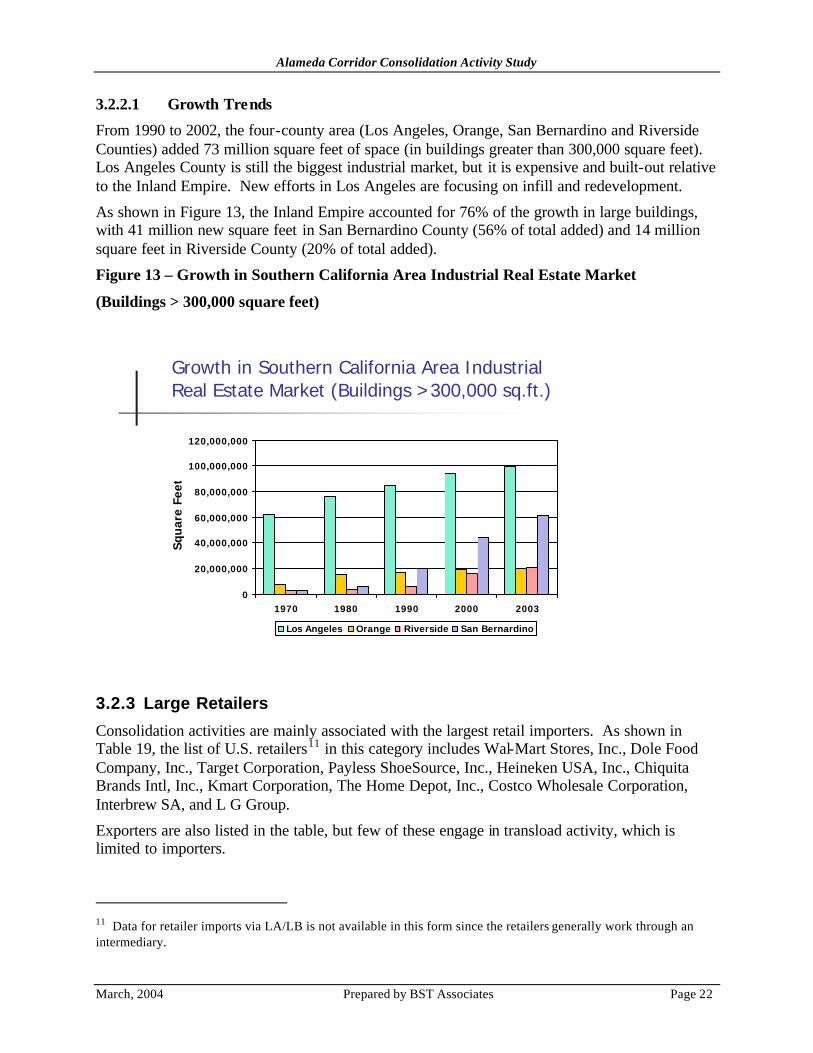
3.2.2.1 Growth Trends
From 1990 to 2002, the four-county area (Los Angeles, Orange, San Bernardino and Riverside Counties) added 73 million square feet of space (in buildings greater than 300,000 square feet). Los Angeles County is still the biggest industrial market, but it is expensive and built-out relative to the Inland Empire. New efforts in Los Angeles are focusing on infill and redevelopment.
As shown in Figure 13, the Inland Empire accounted for 76% of the growth in large buildings, with 41 million new square feet in San Bernardino County (56% of total added) and 14 million square feet in Riverside County (20% of total added).
Figure 13 – Growth in Southern California Area Industrial Real Estate Market
(Buildings > 300,000 square feet)
Growth in Southern California Area Industrial Real Estate Market (Buildings >300,000 sq.ft.)
0
20,000,000
40,000,000
60,000,000
80,000,000
100,000,000
120,000,000
1970 1980 1990 2000 2003
Sq
uar
e Fe
et
Los Angeles Orange Riverside San Bernardino
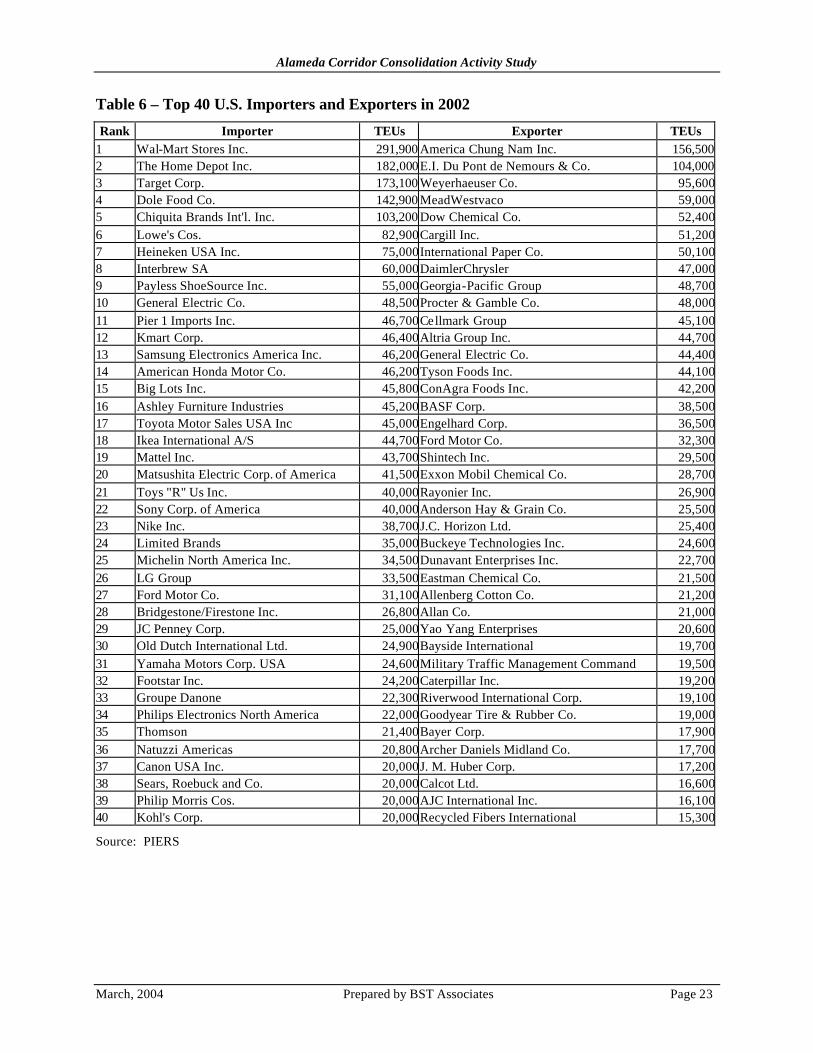
3.2.3 Large Retailers
Consolidation activities are mainly associated with the largest retail importers. As shown in Table 19, the list of U.S. retailers11 in this category includes Wal-Mart Stores, Inc., Dole Food Company, Inc., Target Corporation, Payless ShoeSource, Inc., Heineken USA, Inc., Chiquita Brands Intl, Inc., Kmart Corporation, The Home Depot, Inc., Costco Wholesale Corporation, Interbrew SA, and L G Group.
Exporters are also listed in the table, but few of these engage in transload activity, which is limited to importers.
11 Data for retailer imports via LA/LB is not available in this form since the retailers generally work through an intermediary.
Alameda Corridor Consolidation Activity Study
March, 2004 Prepared by BST Associates Page 23
Table 6 – Top 40 U.S. Importers and Exporters in 2002
Rank Importer TEUs Exporter TEUs 1 Wal-Mart Stores Inc. 291,900 America Chung Nam Inc. 156,5002 The Home Depot Inc. 182,000E.I. Du Pont de Nemours & Co. 104,0003 Target Corp. 173,100 Weyerhaeuser Co. 95,6004 Dole Food Co. 142,900 MeadWestvaco 59,0005 Chiquita Brands Int'l. Inc. 103,200 Dow Chemical Co. 52,4006 Lowe's Cos. 82,900Cargill Inc. 51,2007 Heineken USA Inc. 75,000International Paper Co. 50,1008 Interbrew SA 60,000DaimlerChrysler 47,0009 Payless ShoeSource Inc. 55,000Georgia-Pacific Group 48,70010 General Electric Co. 48,500Procter & Gamble Co. 48,00011 Pier 1 Imports Inc. 46,700Cellmark Group 45,10012 Kmart Corp. 46,400Altria Group Inc. 44,70013 Samsung Electronics America Inc. 46,200General Electric Co. 44,40014 American Honda Motor Co. 46,200Tyson Foods Inc. 44,10015 Big Lots Inc. 45,800ConAgra Foods Inc. 42,20016 Ashley Furniture Industries 45,200BASF Corp. 38,50017 Toyota Motor Sales USA Inc 45,000Engelhard Corp. 36,50018 Ikea International A/S 44,700Ford Motor Co. 32,30019 Mattel Inc. 43,700Shintech Inc. 29,50020 Matsushita Electric Corp. of America 41,500Exxon Mobil Chemical Co. 28,70021 Toys "R" Us Inc. 40,000Rayonier Inc. 26,90022 Sony Corp. of America 40,000Anderson Hay & Grain Co. 25,50023 Nike Inc. 38,700J.C. Horizon Ltd. 25,40024 Limited Brands 35,000Buckeye Technologies Inc. 24,60025 Michelin North America Inc. 34,500Dunavant Enterprises Inc. 22,70026 LG Group 33,500Eastman Chemical Co. 21,50027 Ford Motor Co. 31,100Allenberg Cotton Co. 21,20028 Bridgestone/Firestone Inc. 26,800Allan Co. 21,00029 JC Penney Corp. 25,000Yao Yang Enterprises 20,60030 Old Dutch International Ltd. 24,900Bayside International 19,70031 Yamaha Motors Corp. USA 24,600Military Traffic Management Command 19,50032 Footstar Inc. 24,200Caterpillar Inc. 19,20033 Groupe Danone 22,300Riverwood International Corp. 19,10034 Philips Electronics North America 22,000Goodyear Tire & Rubber Co. 19,00035 Thomson 21,400Bayer Corp. 17,90036 Natuzzi Americas 20,800Archer Daniels Midland Co. 17,70037 Canon USA Inc. 20,000J. M. Huber Corp. 17,20038 Sears, Roebuck and Co. 20,000Calcot Ltd. 16,60039 Philip Morris Cos. 20,000AJC International Inc. 16,10040 Kohl's Corp. 20,000Recycled Fibers International 15,300
Source: PIERS
Alameda Corridor Consolidation Activity Study
March, 2004 Prepared by BST Associates Page 24
3.2.4 Survey
BST Associates contacted 69 large industrial firms during the survey, most of which operated distribution centers.
The survey results were combined into two groups with similar characteristics: Los Angeles-Orange Counties, and San Bernardino-Riverside Counties (i.e. the “Inland Empire”).
In the Los Angeles-Orange County area, the firms that were surveyed accounted for 15% of the space in this two-county area (in buildings that were 300,000 square feet or more). Survey responses indicated that 69% of respondents received containers from Ports, while 31% of respondents did not receive containers from Ports. Firms in the Los Angeles-Orange County area accounted for approximately 33% of waterborne containers moving through large industrial buildings.
In the Inland Empire, the firms that were surveyed represented 29% of the space in this two county area. These firms were actively engaged in trade through the San Pedro Bay Ports, with 80% of respondents indicating that they received containers from Ports, while only 20% of respondents did not receive containers from Ports. The large firms in Inland Empire accounted for approximately 66% of waterborne containers moving through large industrial buildings.
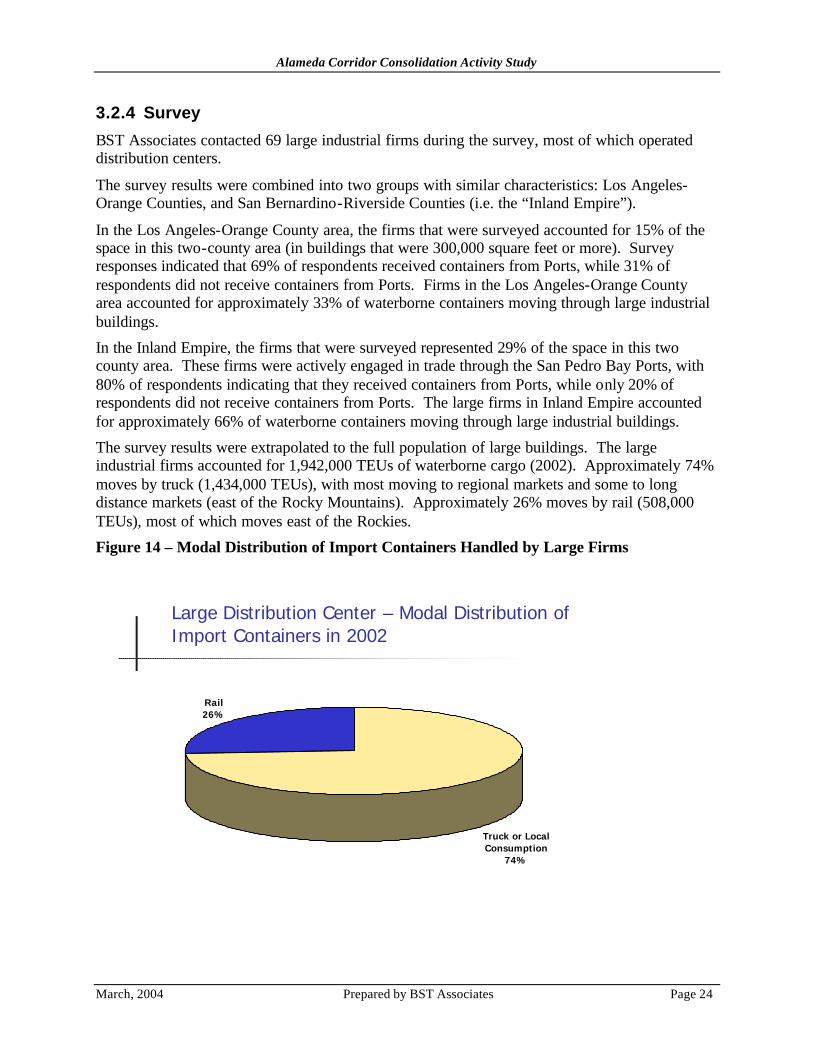
The survey results were extrapolated to the full population of large buildings. The large industrial firms accounted for 1,942,000 TEUs of waterborne cargo (2002). Approximately 74% moves by truck (1,434,000 TEUs), with most moving to regional markets and some to long distance markets (east of the Rocky Mountains). Approximately 26% moves by rail (508,000 TEUs), most of which moves east of the Rockies.
Figure 14 – Modal Distribution of Import Containers Handled by Large Firms
Large Distribution Center – Modal Distribution of Import Containers in 2002
Truck or Local Consumption
74%
Rail26%

Alameda Corridor Consolidation Activity Study
March, 2004 Prepared by BST Associates Page 25
3.3 Small Firms BST Associates obtained a list of more than 25,000 businesses engaged in transportation services, warehousing, importing, exporting, and wholesale trade12. The list was screened to be sure that there were no duplicates with the other two surveys. As shown in Figure 15, these small firms are spread out throughout Southern California. However, approximately 72% of the firms were located in Los Angeles and Orange counties, 10% in San Bernardino and Riverside counties, 11% in San Diego county and the remainder in the other five counties of the Southern California area.
Figure 15 – Location of Small Firms
BST Associates assigned random numbers to the database of businesses, then selected firms in groups of one hundred, beginning with random number 1 through 100. A total of 1,338 small firms were contacted by telephone, and a total of 485 surveys were completed. Most of these firms had between 5 and 25 employees.
The survey results indicated:
• 25 of the respondents (5%) received waterborne cargo from the Ports • 49 of the respondents (10%) received import containers from other sources
(mainly NAFTA – Mexico/Canada)
12 Dun and Bradstreet records indicate if the primary, secondary or tertiary line of business involves these activities.

Alameda Corridor Consolidation Activity Study
March, 2004 Prepared by BST Associates Page 26
• 411 of the respondents (85%) did not import or export cargo
Extrapolating from the survey results to the estimated total container traffic generated by the small firms was complicated somewhat by the large number of firms that do not handle any cargo moving through the Ports. In order to minimize the effect of this large number of zeroes, the technique used was to estimate a “mean of means”. Under this method, the survey responses were sampled five separate times. Random numbers were assigned to each of the survey responses during each of the samplings, and 80 responses chosen at random. Means were calculated for each of these survey subsets, then the mean of all of the means calculated. This “mean of means” was then used to extrapolate to the total universe (i.e., the 25,000 total firms).
The survey results indicated that:
• Small firms accounted for 387,000 TEUs of waterborne cargo in 2002. • Approximately 65% of these containers leave the small firms’ premises by truck (253,000
TEUs) and • Approximately 35% of these containers leave the small firms’ premises by rail (134,000
TEUs)
Figure 16 – Modal Distribution of Import Containers Handled by Small Firms
Small Firm – Modal Distribution of Import Containers in 2002
Rail35%
Truck or Local Consumption
65%
Alameda Corridor Consolidation Activity Study
March, 2004 Prepared by BST Associates Page 27
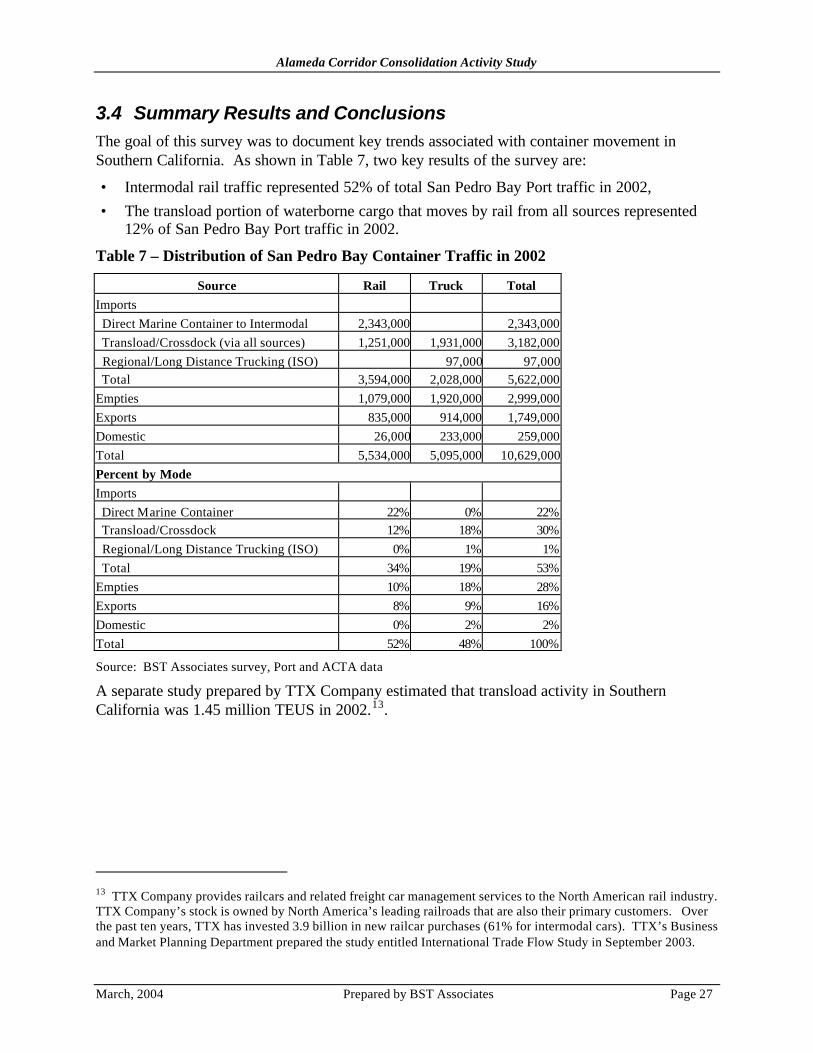
3.4 Summary Results and Conclusions The goal of this survey was to document key trends associated with container movement in Southern California. As shown in Table 7, two key results of the survey are:
• Intermodal rail traffic represented 52% of total San Pedro Bay Port traffic in 2002, • The transload portion of waterborne cargo that moves by rail from all sources represented
12% of San Pedro Bay Port traffic in 2002.
Table 7 – Distribution of San Pedro Bay Container Traffic in 2002
Source Rail Truck Total Imports Direct Marine Container to Intermodal 2,343,000 2,343,000 Transload/Crossdock (via all sources) 1,251,000 1,931,000 3,182,000 Regional/Long Distance Trucking (ISO) 97,000 97,000 Total 3,594,000 2,028,000 5,622,000 Empties 1,079,000 1,920,000 2,999,000 Exports 835,000 914,000 1,749,000 Domestic 26,000 233,000 259,000 Total 5,534,000 5,095,000 10,629,000 Percent by Mode Imports Direct Marine Container 22% 0% 22% Transload/Crossdock 12% 18% 30% Regional/Long Distance Trucking (ISO) 0% 1% 1% Total 34% 19% 53% Empties 10% 18% 28% Exports 8% 9% 16% Domestic 0% 2% 2% Total 52% 48% 100%
Source: BST Associates survey, Port and ACTA data
A separate study prepared by TTX Company estimated that transload activity in Southern California was 1.45 million TEUS in 2002.13.
13 TTX Company provides railcars and related freight car management services to the North American rail industry. TTX Company’s stock is owned by North America’s leading railroads that are also their primary customers. Over the past ten years, TTX has invested 3.9 billion in new railcar purchases (61% for intermodal cars). TTX’s Business and Market Planning Department prepared the study entitled International Trade Flow Study in September 2003.
Alameda Corridor Consolidation Activity Study
March, 2004 Prepared by BST Associates Page 28
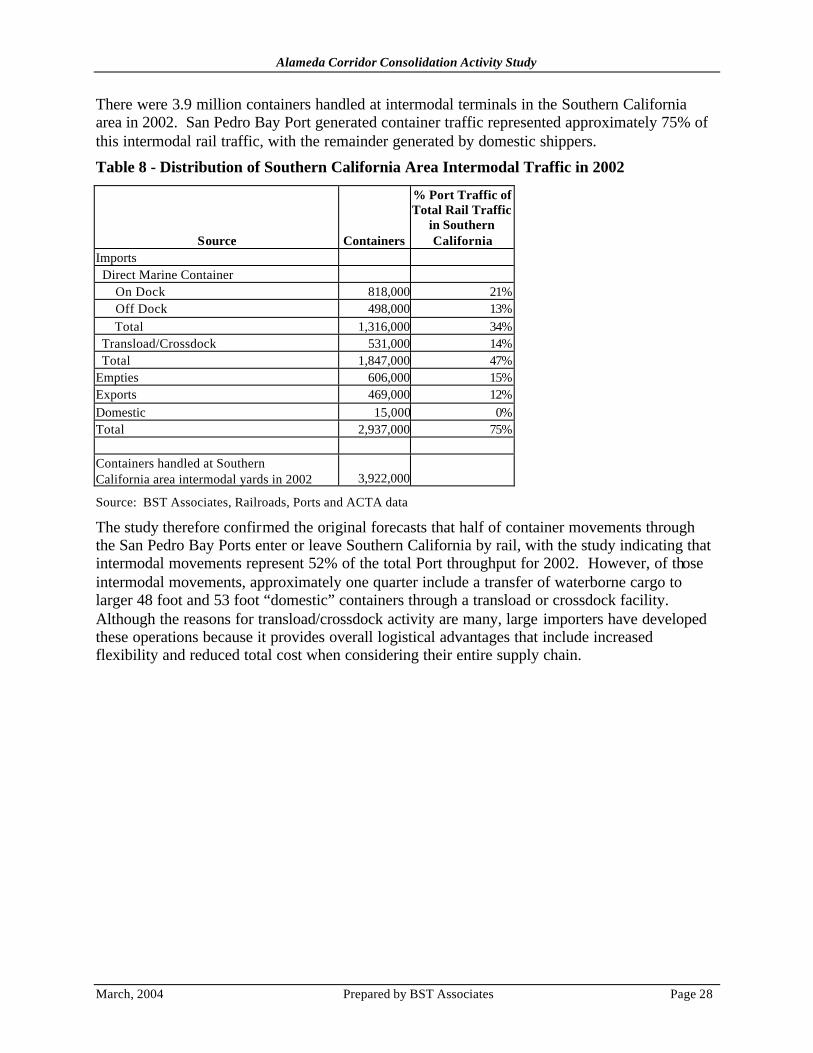
There were 3.9 million containers handled at intermodal terminals in the Southern California area in 2002. San Pedro Bay Port generated container traffic represented approximately 75% of this intermodal rail traffic, with the remainder generated by domestic shippers.
Table 8 - Distribution of Southern California Area Intermodal Traffic in 2002
Source Containers
% Port Traffic of Total Rail Traffic
in Southern California
Imports Direct Marine Container On Dock 818,000 21% Off Dock 498,000 13% Total 1,316,000 34% Transload/Crossdock 531,000 14% Total 1,847,000 47% Empties 606,000 15% Exports 469,000 12% Domestic 15,000 0% Total 2,937,000 75% Containers handled at Southern California area intermodal yards in 2002 3,922,000
Source: BST Associates, Railroads, Ports and ACTA data
The study therefore confirmed the original forecasts that half of container movements through the San Pedro Bay Ports enter or leave Southern California by rail, with the study indicating that intermodal movements represent 52% of the total Port throughput for 2002. However, of those intermodal movements, approximately one quarter include a transfer of waterborne cargo to larger 48 foot and 53 foot “domestic” containers through a transload or crossdock facility. Although the reasons for transload/crossdock activity are many, large importers have developed these operations because it provides overall logistical advantages that include increased flexibility and reduced total cost when considering their entire supply chain.