Embed Size (px)
Citation preview

Hospital Consolidation: Analysis of Acute Sector M&A Activity

Executive summary

Hospital Consolidation: Analysis of Acute Sector M&A Activity 3
Deloitte’s analysis of hospital performance up to three years1 after being acquired in 2007 or 2008 suggests:
• The financial and operational performance for recently acquired hospitals improved post-deal more than non-acquired peers during same time period. However, most acquired hospitals’ performance stayed below their peers’.
• National chains appear to be more successful at achieving financial value from acquisitions compared to local/regional chains. The quantifiable value from local/regional deals varies widely; data suggest lower performers acquired in-market demonstrate improved performance but remain lower performers compared to peer groups.
Executive summary: Key findings
1 Analysis in this report covers years 2005 through 2010.

Hospital Consolidation: Analysis of Acute Sector M&A Activity 4
These findings underscore five themes:
• The importance of post-acquisition operating intensity: Acquisitors should consider optimizing synergies around supply chain costs, labor, and payer contracts to enhance value creation. National chains seem to do this better than regional/local operators.
• The importance of volume: Expansion of volume via payer contracts and physician referrals is likely to be critical to value creation. National chains seem to increase volumes more than regional/local operators.
• Considering strategic value creation as the financial justification for selecting acquisitions, especially by local acquirers: The data suggest a majority of acquired hospitals fail to deliver improved operating margins post-transaction when compared with median peer groupings. National chains seem to purchase hospitals on the basis of their accretive value; regional/local operators appear less inclined.
• The importance of expense management: Attention to post-deal expense management, controls, scale and systems, and inter-organizational synergies is likely to impact the value created from the transaction. Many acquisitors appear to have successfully managed expenses post-deal; this may become more difficult in future transactions due to regulatory changes and cost pressures.
• Exposures of over-use: The correlation of higher volumes with greater financial success lends itself to regulatory scrutiny about necessity of care, an area of increased concern to regulators. The acute sector, particularly national chains, should consider credentialing physicians and managing patient care consistent with evidence-based practices.
Executive summary: Implications

Objective, methodology, and study description

Hospital Consolidation: Analysis of Acute Sector M&A Activity 6
The acute sector is under stress:
• Increased margin pressures, especially in the core inpatient business, resulting from payer mix erosion, higher supply chain and labor costs, and increased competition in traditional and niche programs
• Increased regulatory compliance costs due to the Affordable Care Act, ICD-10 conversion, HITECH, anti-fraud and other federal and state laws and rules
• Increased responsibility for public transparency to collect and report valid and reliable measures of safety, outcomes, adherence to evidence-based practices, efficiency, waste, and patient experiences
• Increased operational integration of physicians, allied health professionals, post-acute providers, and retail health in value-based delivery systems
• Payment reforms, including bundled payments, quality-contingent payments, and declining Medicare reimbursement rates
• Increased implementation of clinical improvements based on new diagnostic and therapeutic models, new ways of engaging patients (consumers) and the ongoing convergence of physical and behavioral health, and allopathic and alternative health strategies
For these and other reasons, acute sector consolidation is likely to accelerate as hospitals seek sustainability.
Other considerations:
• Operating conditions over the study period coincided with the 2008 economic downturn, which likely impacted the conduct of the marketplace and most likely the performance of the deals.
• The outcome of merger & acquisition (M&A) transactions may well become evident some years after the deal and, thus, will not necessarily be apparent during the time period analyzed in this study.
• Although M&A deals are typically financially motivated, the impact of other deal motivators, such as enhancing local competitiveness through enhanced service offerings, expanding geographic footprint, etc., should not be discounted.
Context
Acute Hospital Deal Flow
Num
ber
of a
nnou
nced
dea
ls
Source: Data from Modern Healthcare, January 28, 2013.
10391 85 89 92
109
0
20
40
60
80
120
100
2007 2008 2009 2010 2011 2012Year

Hospital Consolidation: Analysis of Acute Sector M&A Activity 7
Methodology
• 101 acute hospital sector M&A transactions in 2007-2008 were analyzed: the transactions were categorized into national (defined as an acquisition of an acute hospital or hospital system by a multi-hospital system that operates in multiple markets) and regional/local (defined as an acquisition of an acute hospital or hospital system by a regional/local health system)
*Identifying sample:
131 M&A transactions were identified in the time period of 2007 (n=72) through 2008 (n=59) using the following inclusion criteria:
• Target was an acute hospital or hospital system
• Transaction was completed (closed) in time period and had not been withdrawn
• Both mergers and acquisitions were analyzed
101 out of 131 transactions were available for financial measures analysis based upon Medicare Cost Report data availability
2 Cohort, used here and throughout this paper, is defined as a group of hospitals analyzed in this study. It does not include all hospitals that were acquired in 2007 and 2008, rather it is a subset of all acquired hospitals.
National Regional/local Total
2007 31 30 61
2008 21 19 40
Total 52 49 101
Source: Deloitte analysis
• Three measures (defined in Appendix B) were used to analyze the performance of the acquired hospital cohorts2 pre-merger and up to three years post-merger:
1. EBITDA margin
2. Operating expense per Adjusted Patient Day [APD] (Case Mix Index [CMI]-adjusted)
3. Adjusted discharges
• In addition, the acquired hospitals performance in these measures was compared to that of two groups: a peer group of acute hospitals (same bed size and CMI as acquired hospitals) and all acute hospitals (using Medicare Cost Report data [2010])

Hospital Consolidation: Analysis of Acute Sector M&A Activity 8
Methodology: Sample characteristics and peer comparisons
Baseline statistic (at year of deal)
Regional/local Deal Targets
National DealTargets
Target Hospital Peer Group*
All Acute Hospitals
Number of hospitals 49 52 1,434 4,797
Number of markets (defined by Core Based Statistical Area)
38 38 338 448
Average Length of Stay (ALOS) (median)
4.2 4.1 4.0 3.6
Bed size(median) 134 160 137 82
Case Mix Index (median) 1.3 1.4 1.3 1.2
EBITDA margin (median) 3.3% 4.5% 10.2% 10.2%
Expense per Adjusted Patient Days (Case Mix Index-weighted) (median)
$1,229 $1,344 $1,243 $1,315
Net Revenue per Adjusted Patient Days (Case Mix Index-weighted) (median)
$1,148 $1,310 $1,241 $1,298
Occupancy (median) 54% 57% 56% 46%
*Target hospital peer group includes hospitals from Medicare Cost Report data that match target hospitals on bed size and case-mix index.
Source: Deloitte analysis; Medicare Cost Report data
Note: Definitions in Appendices A and B

Analysis of 2007 transactions

Hospital Consolidation: Analysis of Acute Sector M&A Activity 10
Operating performance
• Operating performance in the acute hospital sector appeared to be eroding going into the 2008 economic downturn. By 2010, operating performance of all analyzed organizational categories had returned to pre-downturn (2007) levels.
• Operating performance, as measured by EBITDA margin, for all target hospitals analyzed was consistently below all hospitals and peer comparison groups over the five years analyzed.
• In the post-deal period to 2010, the targets studied did not close the gap with the benchmark comparison groups. However, hospitals acquired by national organizations saw less erosion in operating performance through the downturn and by 2010 had halved the gap with peer group performance.
Operating expenses
• National systems have more successfully flattened increases in total operating expenses (as measured per adjusted day) for acquired facilities studied post-deal, while cost containment for regional/local deals studied was similar to that of the peer group, rising steadily post-deal.
• The total operating expenses of the regional/local cohort plateaued post-deal before rising to mirror those of the peer group and national deal cohort.
Volume
• The peer group discharge volume grew steadily over the five-year period. Volume trends for regional/local acquired hospitals in our study were relatively close to both the peer group and all-hospital group by 2010 after starting from a diverse base in deal year.
• Volume trends for targets acquired by national systems saw increases in volume above the trend for both regional/local cohort and peer group hospitals from one-year, post-deal onwards.
Key findings: 2007 deals
Hospital Consolidation: Analysis of Acute Sector M&A Activity 11
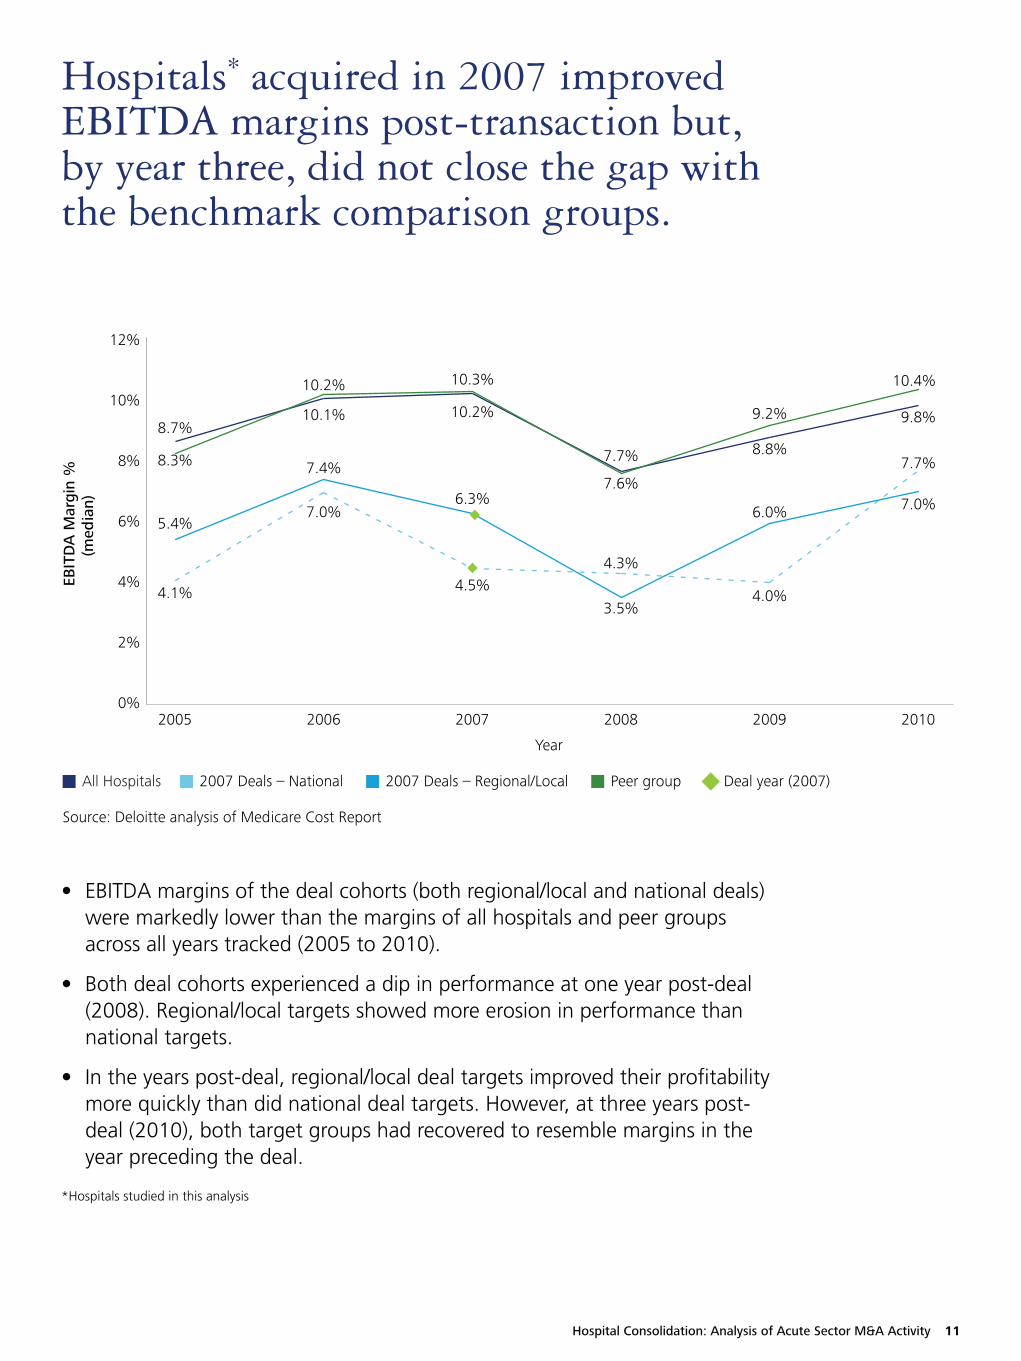
Hospitals* acquired in 2007 improved EBITDA margins post-transaction but, by year three, did not close the gap with the benchmark comparison groups.
• EBITDA margins of the deal cohorts (both regional/local and national deals) were markedly lower than the margins of all hospitals and peer groups across all years tracked (2005 to 2010).
• Both deal cohorts experienced a dip in performance at one year post-deal (2008). Regional/local targets showed more erosion in performance than national targets.
• In the years post-deal, regional/local deal targets improved their profitability more quickly than did national deal targets. However, at three years post-deal (2010), both target groups had recovered to resemble margins in the year preceding the deal.
EBIT
DA
Mar
gin
% (m
edia
n)
0%
2%
4%
6%
8%
10%
12%
Year
8.3%
4.1%
5.4%
8.7% 10.1%
7.0%
7.4%
10.2%
10.2%
4.5%
6.3%
10.3%
7.7%
4.3%
3.5%
7.6%
8.8%
4.0%
6.0%
9.2% 9.8%
10.4%
7.7%
7.0%
2005 2006 2007 2008 2009 2010
All Hospitals 2007 Deals – National 2007 Deals – Regional/Local Peer group Deal year (2007)
Source: Deloitte analysis of Medicare Cost Report
*Hospitals studied in this analysis

Hospital Consolidation: Analysis of Acute Sector M&A Activity 12
The operating expenses growth rate slowed for acquired hospital cohort (2007) post-transaction. At three years post-transaction, expenses of acquired hospital cohort were similar to peer group and far below all-hospital group.
• From deal year (2007) to three years post-deal (2010), total operating expenses per adjusted patient days of regional/local cohort were lower than national deal cohort but mirrored that of peer group, rising slowly over that time but falling well below the all-hospitals group.
• In comparison to pre-merger, total operating expenses were higher post-deal for both deal cohorts. At three years post-deal (2010), both deal cohorts’ total operating expenses per adjusted patient days resembled that of the peer reference group.
• Halting a trend of increasing expenses the two years preceding deal, national targets studied peaked in 2007 (deal-year) and then decreased total operating expenses slightly (-2 percent) at one year post-deal. These remained relatively flat post-deal compared with a steady increase in the peer group. By 2010, median total operating expenses per adjusted patient days were nearly identical in the national cohort and peer group.
Ope
rati
ng E
xpen
se p
er A
djus
ted
Pt. D
ays
(CM
I Wt)
(med
ian)
$1,000
$1,100
$1,200
$1,300
$1,400
$1,500
Year
2005 2006 2007 2008 2009 2010
$1,147
$1,083
$1,172
$1,107
$1,231
$1,230
$1,189
$1,115
$1,315
$1,334
$1,235
$1,242
$1,358
$1,312
$1,255
$1,270
$1,401
$1,439
$1,330 $1,330
$1,329
$1,304
$1,249
$1,282
All Hospitals 2007 Deals – National 2007 Deals – Regional/Local Peer group Deal year (2007)
Source: Deloitte analysis of Medicare Cost Report

Hospital Consolidation: Analysis of Acute Sector M&A Activity 13
• At deal year (2007), patient volume of the national deal cohort dipped sharply when compared with the year preceding the deal and was well below peer group levels in that year. Patient volume of the national deal cohort accelerated one year post-deal whereas volume of the regional/local group declined at this time.
• Deal targets saw substantial gains in patient volume from one to three years post-deal (2008 to 2010).
• Both regional and national deal cohorts surpassed the peer group with higher patient volumes by three years post-deal (2010).
In comparison to relatively steady growth of the peer group, deal targets studied saw gains in patient volume by two years post-deal.
Adj
uste
d D
isch
arge
s (m
edia
n)
2005 2006 2007 2008 2009 2010
Year
7,579
12,327
12,854
8,006
12,564
12,737 12,636 12,844
7,858
9,859
11,876
13,274
7,556
14,159
11,227
13,557
7,605
14,304
12,358
13,644
7,878
15,538
13,800
13,662
6,000
16,000
7,000
8,000
9,000
10,000
11,000
12,000
13,000
14,000
15,000
All Hospitals 2007 Deals – National 2007 Deals – Regional/Local Peer group Deal year (2007)
Source: Deloitte analysis of Medicare Cost Report

Analysis of 2008 transactions

Hospital Consolidation: Analysis of Acute Sector M&A Activity 15
Operating performance
• Operating performance for hospitals in both the regional/local and national acquired cohorts improved from 2008 to 2010.
• EBITDA margin for 2008 deal targets (both groups) were considerably lower than both the peer group and the all-hospitals comparison group.
• Regional/local deals concluded in 2008 show a negative EBITDA, suggesting insufficient income to cover fixed costs. Growth in EBITDA post-deal to 2010 suggests expense management and cost control to achieve a positive earnings position, but one which falls well below that of peers.
• Regional/local acquired hospitals had a negative median EBITDA margin in 2008, potentially due to these smaller hospitals having increased operating issues during the market downturn because of their size.
• EBITDA margin for national acquired hospitals displayed net improvements greater than those of the regional/local and the median was the same as the peer group in 2010.
Operating expenses
• Compared with the relatively steady increase in expenses over time in the peer group, the regional/local cohort’s operating expenses swung markedly, particularly at the one-year, post-deal point. By 2010, both deal target groups expenses ended up exceeding those of the reference groups.
Volume
• Volume increased for national targets post-deal at a higher rate, exceeding that of the peer and all-hospitals reference groups post-deal to 2010.
• Regional/local acquired hospitals had lower volume levels when compared to peer group and national target group. Two years post-deal, this group had slightly increased volume compared with that of the deal year.
Key findings: 2008 deals

Hospital Consolidation: Analysis of Acute Sector M&A Activity 16
• Operational performance of both target deal cohorts (national and regional/local) was well below that of the reference all-hospital and peer groups for most of the five years measured. Targets of national buyers sustained higher margins than targets of local buyers at time of and after the deal. The national deal cohort’s performance improved markedly from 2009 to 2010, reaching that of the reference groups in 2010.
• Performance of the regional/local cohort eroded substantially in the two years pre-deal to a negative position in the deal year (2008). By 2010, this group had recovered to 2005 performance levels. However, the performance gap widened between the peer group and the regional targets from 3 percent in 2005 to 5 percent in 2010.
Hospitals* acquired in 2008 had EBITDA margins that trended back positively post-transaction – reversing the negative trend seen up to two years prior to transaction.
EBIT
DA
Mar
gin
%
(med
ian)
2005 2006 2007 2008 2009 2010
Year
8.7%
5.0%
5.3%
8.3%
10.1%
7.2%
1.4%
10.2%
10.2%
4.9%
0.9%
10.3%
7.7%
3.9%
-1.8%
7.6%
8.8%
3.4%
2.2%
9.2% 9.8%10.3% 10.4%
5.2%
-2%
12%
0%
2%
4%
6%
8%
10%
All Hospitals 2007 Deals – National 2007 Deals – Regional/Local Peer group Deal year (2008)
Source: Deloitte analysis of Medicare Cost Report
*Hospitals studied in this analysis

Hospital Consolidation: Analysis of Acute Sector M&A Activity 17
• When compared with the relatively steady increase in expenses over time in the peer group, the regional/local cohort’s operating expenses swung markedly, particularly at the one-year, post-deal point (14 percent growth).
• Targets of national buyers sustained higher operating expenses than the peer group over the five years measured. At one year post-deal the variance was the lowest, with a difference of $47. The highest variance ($161) was at two years post-deal.
• Total operating expenses for both national and regional/local deal cohorts exceeded that of the peer group in the two years post-deal.
Total operating expenses for acquired hospitals* exceeded that of the peer group in the two years post-deal.
Ope
rati
ng E
xpen
se p
er A
dj. P
t. D
ays
(CM
I Wt.
)(m
edia
n)
Year
$1,147
$1,270
$1,039
$1,107
$1,231
$1,230
$1,134
$1,115
$1,315
$1,348
$1,277
$1,242
$1,358
$1,344
$1,226
$1,270
$1,401
$1,329
$1,402
$1,282
$1,439
$1,490
$1,372
$1,329
$1,000
$1,100
$1,200
$1,300
$1,400
$1,600
$1,500
2005 2006 2007 2008 2009 2010
All Hospitals 2007 Deals – National 2007 Deals – Regional/Local Peer group Deal year (2008)
Source: Deloitte analysis of Medicare Cost Report
*Hospitals studied in this analysis

Hospital Consolidation: Analysis of Acute Sector M&A Activity 18
• Patient volume of the peer group grew gradually over the five year period. The volume in the national deal group dipped sharply at the deal year (2008) and then recovered, substantially exceeding the peer group by 2010.
• Regional/local deal cohort volume was consistently below that of the peer group, both pre- and post-deal. The highest variance was at one year post-deal (6,141). While the gap narrowed at two years post-deal, regional/local deal target volume remained well below that of the peer-group adjusted discharges.
• By two years post-deal, both regional/local and national deal groups had improved volume relative to their position in both the pre-deal (2007) and deal (2008) years.
Compared to steadiness in peer group, acquired hospitals* experienced decreased volume around transaction. By two years post-deal, acquired hospitals* recovered to exceed their pre-deal volumes.
Adj
uste
d D
isch
arge
s(m
edia
n)
Year
6,000
20,000
2005 2006 2007 2008 2009 2010
8,006
16,372
8,223
12,636
7,579
16,314
8,654
12,844
7,858
15,154
9,385
13,274
7,556
12,418
9,194
13,557
7,605
17,655
7,503
13,644 13,662
18,798
7,878
9,677
8,000
10,000
12,000
14,000
16,000
18,000
All Hospitals 2007 Deals – National 2007 Deals – Regional/Local Peer group Deal year (2008)
Source: Deloitte analysis of Medicare Cost Report
*Hospitals studied in this analysis

Comparison of 2007 and 2008 transactions
Hospital Consolidation: Analysis of Acute Sector M&A Activity 20
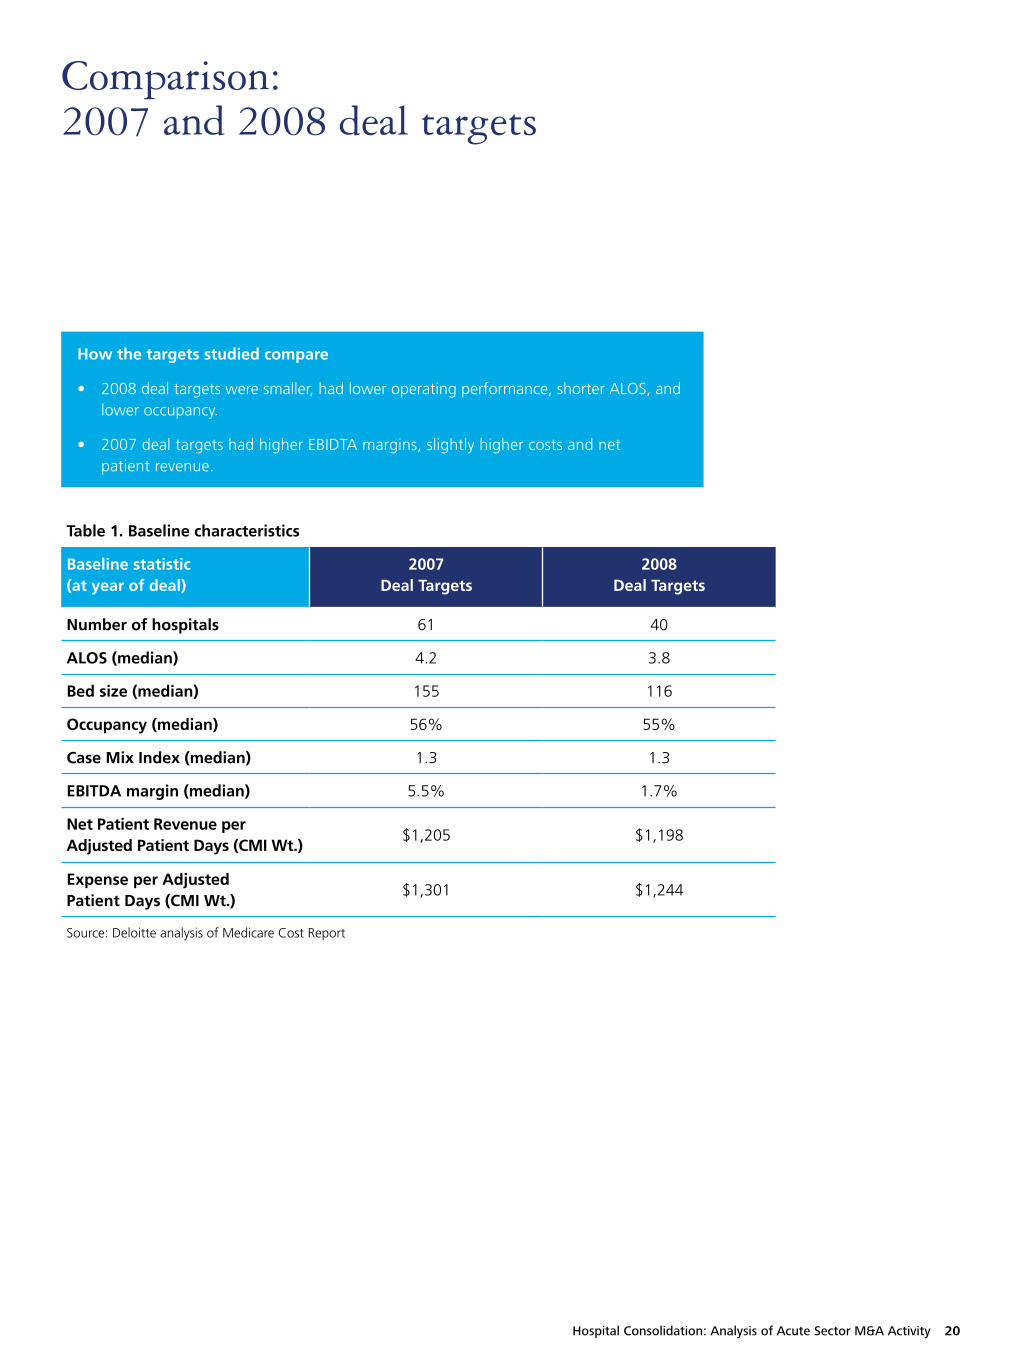
Comparison: 2007 and 2008 deal targets
Table 1. Baseline characteristics
Baseline statistic (at year of deal)
2007 Deal Targets
2008 Deal Targets
Number of hospitals 61 40
ALOS (median) 4.2 3.8
Bed size (median) 155 116
Occupancy (median) 56% 55%
Case Mix Index (median) 1.3 1.3
EBITDA margin (median) 5.5% 1.7%
Net Patient Revenue per Adjusted Patient Days (CMI Wt.)
$1,205 $1,198
Expense per Adjusted Patient Days (CMI Wt.)
$1,301 $1,244
Source: Deloitte analysis of Medicare Cost Report
How the targets studied compare
• 2008 deal targets were smaller, had lower operating performance, shorter ALOS, and lower occupancy.
• 2007 deal targets had higher EBIDTA margins, slightly higher costs and net patient revenue.

Hospital Consolidation: Analysis of Acute Sector M&A Activity 21
Key findings: 2007 and 2008 deals
Operating performance
• Pre-and post-deal performance by both target cohorts in both years analyzed (2007 and 2008 deals) fell well short of peer group performance.
• The target hospitals studied from 2008 (both deal groups) had poorer performance (EBITDA margins) pre-deal than those in 2007 cohort, particularly in the regional/local cohorts. By 2010, the improvements in regional/local performance were greater post-deal in the 2008 targets – 7 percent change in 2008 targets vs. 1 percent change in 2007 targets.
Operating expenses
• Operating expenses increased post-deal but varied widely between deal cohorts.
• Regional/local target hospitals acquired in 2007 had a significantly smaller increase in operating expenses (1 percent growth) compared to target hospitals in 2008 (14 percent growth).
• By 2010, expenses in both target cohorts exceeded that of the peer comparison group.
Volume
• Despite ups and downs, by 2010 both deal cohorts (national and regional/local) in both years (2007 and 2008) experienced post-deal volume growth to exceed that of previous past five years.
• National chain targets studied appear to have gained higher increases in volume than regional/local targets studied from both years.
Comparison: 2007 and 2008 Deals

Appendix

Hospital Consolidation: Analysis of Acute Sector M&A Activity 23
Appendix A: Glossary
Category Definition
ALOS Average Length of Stay. The average period of time that patients stay in a hospital. Calculated by dividing the total days by the number of cases.
Adjusted discharges Measure of patient volume that adjusts the number of discharges (hospitalizations) to reflect the impact of both inpatient and outpatient volume.
Adjusted patient day Hospital average daily population that is adjusted to reflect both inpatient and outpatient volume.
Case mix index A hospital’s CMI represents the average diagnosis-related group (DRG) relative weight for that hospital. It is calculated by summing the DRG weights for all Medicare discharges and dividing by the number of discharges. Source: CMS.gov
CBSA Core Based Statistical Area. A collective term for both metropolitan and micropolitan statistical areas - geographic entities delineated by the Office of Management and Budget for use by Federal statistical agencies in collecting, tabulating, and publishing Federal statistics. Source: http://www.census.gov/population/metro/
EBITDA Earnings before interest, taxes, depreciation, and amortization. Measure of a hospital’s cash flow.
EBITDA margin EBITDA divided by net patient revenue. Measurement of hospital operating profitability.
Medicare Cost Report Medicare-certified institutional providers are required to submit an annual cost report. The cost report contains information about the providers including financial data, utilization data, and facility characteristics. Source: CMS.gov
Net patient revenue Revenue actually collected by the hospital from services to patients. Calculation: total gross revenue from service to inpatients and outpatients minus total deductions from revenue.

Hospital Consolidation: Analysis of Acute Sector M&A Activity 24
Appendix B: Definitions of calculations
Measure Calculation
Adjusted Discharges Admissions * adjustment factor
Net Revenue per Adjusted Patient Days (CMI weighted)
Net patient revenue/adjusted patient days/CMI
Total Operating Expense per Adjusted Patient Days (CMI weighted)
Operating expense/adjusted patient days/CMI
EBITDA margin % EBITDA/net patient revenue

Hospital Consolidation: Analysis of Acute Sector M&A Activity 25
ContactsTo begin a discussion or for further information on Deloitte life sciences and health care M&A or corporate finance-related offerings.
Global Health Care Sector LeaderRuss RudishPrincipalDeloitte Consulting LLP [email protected]
Corporate Finance LLCSimon GisbyManaging DirectorDeloitte Corporate Finance [email protected]
Financial Advisory ServicesJimmy PetersonPrincipalDeloitte Financial Advisory Services [email protected]
M&A Transaction ServicesPhilip PfrangPartnerDeloitte & Touche LLP [email protected]
Lisa NixDirector Deloitte & Touche LLP [email protected]
Kyle WoitelPartnerDeloitte Tax LLP [email protected]
M&A Consulting ServicesBrian FlaniganPrincipalDeloitte Consulting LLP [email protected]
Clark KnappPrincipalDeloitte Consulting [email protected]
Mitch MorrisPrincipalDeloitte Consulting [email protected]
Adam F. Sorensen, MPHSenior ManagerDeloitte Consulting [email protected]
AcknowledgementsWe wish to thank Jennifer Bohn, Katrina Drake Hudson, Amy Coffey, Jaya Agarwal, Wendy Gerhardt, and Maulesh Shukla and the many others who contributed their ideas and insights to this project.
To learn more about the Deloitte Center for Health Solutions, its projects and events, please visit: www.deloitte.com/centerforhealthsolutions.
AuthorsPaul H. Keckley, PhDDeloitte LLP Deloitte Center for Health SolutionsExecutive [email protected]
Adam F. Sorensen, MPHDeloitte Consulting LLPHealth Care Providers M&A [email protected]
Sheryl Coughlin, PhD, MHADeloitte LLPDeloitte Center for Health Solutions Head of [email protected]
Leslie Korenda, MPHDeloitte LLPDeloitte Center for Health Solutions Research [email protected]
Dan GuszDeloitte Consulting LLPHealth Care Providers M&A [email protected]

About DeloitteDeloitte refers to one or more of Deloitte Touche Tohmatsu Limited, a UK private company limited by guarantee, and its network of member firms, each of which is a legally separate and independent entity. Please see www.deloitte.com/about for a detailed description of the legal structure of Deloitte Touche Tohmatsu Limited and its member firms. Please see www.deloitte.com/us/about for a detailed description of the legal structure of Deloitte LLP and its subsidiaries. Certain services may not be available to attest clients under the rules and regulations of public accounting.
About the Deloitte Center for Health SolutionsThe Deloitte Center for Health Solutions is the health services research arm of Deloitte LLP. Our goal is to inform all stakeholders in the health care system about emerging trends, challenges, and opportunities using rigorous research. Through our research, roundtables, and other forms of engagement, we seek to be a trusted source for relevant, timely, and reliable insights.
Copyright © 2013 Deloitte Development LLC. All rights reserved.
Member of Deloitte Touche Tohmatsu Limited
DisclaimerThis publication is solely for informational and educational purposes. It does not take into account the particular investment objectives, financial situations, or needs of individual recipients. Information contained in this publication should not be construed as a recommendation or offer to sell, or a recommendation or solicitation of an offer to buy, any security. Where the results of analysis are discussed in this publication, the results are based on the application of economic logic and specific assumptions. These results are not intended to be predictions of events or future outcomes. This publication does not provide information reasonably sufficient upon which to base any investment decision and must not be used for that purpose. It is based on information that we consider reliable, but we do not represent that it is accurate or complete, and it should not be relied upon as such.
Deloitte is not, by means of this publication, rendering accounting, business, financial, investment, legal, tax, or other professional advice or services to any person. This publication is not a substitute for such professional advice or services, nor should it be used as a basis for any decision or action that may affect your business. Before making any decision or taking any action that may affect your business, you should consult a qualified professional advisor. Deloitte shall not be responsible for any loss sustained by any person who uses or relies on this publication.