Embed Size (px)
Citation preview

Connecting structure and dynamics to rheological performance of complex fluids
by
Abhishek M. Shetty
A dissertation submitted in partial fulfillment of the requirements for the degree of
Doctor of Philosophy (Chemical Engineering)
in The University of Michigan 2010
Doctoral Committee:
Professor Michael J. Solomon, Chair Professor Mark A. Burns Professor Ronald G. Larson Assistant Professor Anish Tuteja

© Abhishek M. Shetty
2010
ii
Dedication
This dissertation is dedicated to my parents for their unconditional support and innumerable sacrifices.
iii
Table of Contents Dedication ................................................................................................................................................ii
List of Figures .........................................................................................................................................vi
List of Tables............................................................................................................................................ x
Abstract ....................................................................................................................................................xi
CHAPTER 1 INTRODUCTION...............................................................................................................1
1.1 Complex Fluids...........................................................................................................................................1
1.2 Dynamic Light Scattering ......................................................................................................................7
1.3 Confocal laser scanning microscopy.................................................................................................9
1.4 Outline of the dissertation .................................................................................................................10
1.5 References.................................................................................................................................................13
CHAPTER 2 AGGREGATION IN DILUTE SOLUTIONS OF HIGH MOLAR MASS
POLY(ETHYLENE) OXIDE AND ITS EFFECT ON TURBULENT DRAG REDUCTION........... 17
2.1 Chapter Summary ..................................................................................................................................17
2.2 Introduction .............................................................................................................................................19
2.3 Experimental Section ...........................................................................................................................24
2.3.1 Materials: ..........................................................................................................................................24
2.3.2 Dynamic Light Scattering (DLS) .............................................................................................24
2.3.3 Turbulent drag reduction characterization.......................................................................26
2.4 Results.........................................................................................................................................................28
2.4.1 DLS of dilute aqueous solutions of PEO...............................................................................28

iv
2.4.2 Manipulation of PEO aggregate structure with addition of salt. ..............................31
2.4.3 Effect of aggregate structure on turbulent drag reduction.........................................33
2.5 Discussion .................................................................................................................................................36
2.6 Conclusions...............................................................................................................................................41
2.7 References.................................................................................................................................................59
CHAPTER 3 MULTIANGLE DEPOLARIZED DYNAMIC LIGHT SCATTERING OF SHORT
FUNCTIONALIZED SINGLEWALLED CARBON NANOTUBES.................................................. 63
3.1 Chapter Summary ..................................................................................................................................63
3.2 Introduction .............................................................................................................................................64
3.3 Materials and Methods. .......................................................................................................................66
3.3.1 Materials ...........................................................................................................................................66
3.3.2 Depolarized Dynamic Light Scattering of Carbon Nanotubes: Modeling and
Experiment......................................................................................................................................................67
3.3.3 Atomic Force Microscopy ..........................................................................................................70
3.4 Experimental Section. ..........................................................................................................................71
3.4.1 DDLS of dilute functionalized SWNT samples. .................................................................71
3.4.2 Atomic force microscopy. ..........................................................................................................74
3.5 Conclusion.................................................................................................................................................76
3.6 References.................................................................................................................................................84
CHAPTER 4 DIRECT VISUALIZATION OF GLASSY DYNAMICS IN A MODEL POLAYMAIDE
ROD SYSTEM......................................................................................................................................... 88
4.1 Chapter Summary ..................................................................................................................................88

v
4.2 Introduction .............................................................................................................................................90
4.3 Experimental Section ...........................................................................................................................92
4.3.1 Materials ...........................................................................................................................................92
4.3.2 Methods.............................................................................................................................................93
4.3.2.1 Sample preparation.............................................................................................................93
4.3.2.2 Confocal laser scanning microscopy (CLSM) ...........................................................93
4.3.2.3 Image analysis .......................................................................................................................93
4.3.2.4 Rheology ..................................................................................................................................95
4.4 Results.........................................................................................................................................................96
4.4.1 Arrested dynamics by CLSM and Image correlation analysis....................................96
4.4.2 Rheological Characterization...................................................................................................98
4.5 Discussion .............................................................................................................................................. 100
4.6 Conclusion.............................................................................................................................................. 104
4.7 References.............................................................................................................................................. 114
CHAPTER 5 CONCLUSIONS AND FUTURE WORK ....................................................................118
5.1 Conclusions............................................................................................................................................ 118
5.2 Future Work.......................................................................................................................................... 120
5.3 References.............................................................................................................................................. 123

vi
List of Figures
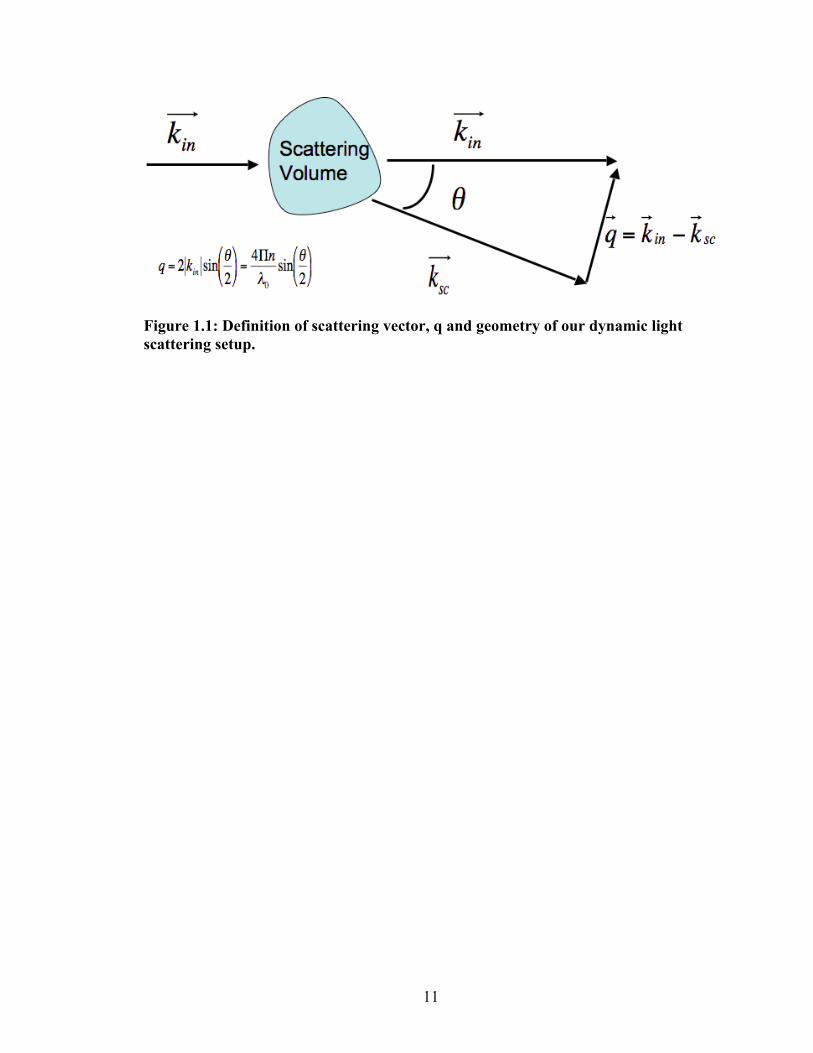
Figure 1.1: Definition of scattering vector, q and geometry of our dynamic light scattering setup. ..... 11
Figure 1.2: Schematic of the Leica SP2 TCS Confocal laser scanning microscope52...................................... 12
Figure 2.1: Quiescent rheological characterization of aqueous PEO WSR‐301 (Mw~ 4 x 10⁶ g/mole) at
T=250 C in a 20 60 mm cone and plate geometry. The viscosity, η, is plotted for a series of PEO
concentrations (500‐8000 ppm) as a function of shear rate,
€
γ.. The dashed curves are best fits
to the data for the FENE‐P constitutive equation with ηs= 0.001 Pa‐sec and L2=1000................... 43
Figure 2.2: Concentration dependence of the viscoelastic relaxation time (ms) of WSR‐301 from
FENE‐P curve fits for the experimental data from Fig. 2.1 at various concentrations. The
horizontal line is the dilute solution prediction by Zimm theory. ............................................................ 44
Figure 2.3: Intensity autocorrelation function g2(τ) for 20 ppm (c/c* ~ 0.03) PEO WSR‐301 as a
function of scattering angle, q................................................................................................................................... 45
Figure 2.4: Probability distribution function of the DLS decay time spectrum for 20 ppm PEO WSR‐
301, obtained from CONTIN deconvolution of g2(τ) reported in Fig. 2.3. ............................................. 46
Figure 2.5: Prandtl‐von Karman plots for different PEO WSR‐301 concentrations ranging from 1‐25
ppm. As discussed in the text, the lower curve is the Prandtl‐Karman (PK) law for a Newtonian
solvent and the upper curve is the maximum drag reduction asymptote for polymer turbulent
drag reduction. ................................................................................................................................................................ 47
Figure 2.6: Peak relaxation rate, Γ, from CONTIN deconvolution as a function of the scattering vector
q for different dilute concentrations (5‐50 ppm) of PEO WSR‐301......................................................... 48
Figure 2.7: Peak relaxation rate, Γ, from CONTIN deconvolution as a function of the scattering vector
q for different dilute concentrations (15‐150ppm) of monodisperse PEO‐1182K (Mw ~ 1.2 x 10⁶
g/mole, Mw/Mn~1.12). ................................................................................................................................................. 49

vii
Figure 2.8: The effect of MgSO4 concentration on the q‐dependence of the peak relaxation rate Γ at 5
ppm for PEO WSR‐301................................................................................................................................................. 50
Figure 2.9: Comparison of the DLS decay time spectrum for 150 ppm monodispersed PEO‐1182K (Mw
~ 1.2 x 10⁶ g/mole, Mw/Mn~1.12) in deionized water (aqueous) and with guanidine sulfate salt
(0.85M GuS) at different scattering angles.......................................................................................................... 51
Figure 2.10: Peak decay relaxation rate, Γ, as a function of q for the deionized water (aqueous) and
guanidine sulfate salt (0.85M GuS) case (150 ppm monodisperse PEO‐1182K). .............................. 52
Figure 2.11: Effect of guanidine sulfate salt (GuS) concentration and 1M magnesium sulfate (MgSO4)
on the q‐dependence of Γ for monodisperse aqueous PEO‐1182K (150 ppm). ................................. 53
Figure 2.12: Effect of magnesium sulfate (0.5M MgSO4) addition on the turbulent drag reduction
behavior of dilute PEO WSR‐301 solutions......................................................................................................... 54
Figure 2.13: Comparison of the onset wall shear stress for turbulent drag reduction, τw*, for WSR 301
with 0.5 M MgSO4 and in pure aqueous solution. The horizontal line is the onset stress
prediction given by Virk for PEO, based on single molecule physics, computed as discussed in
the text. ............................................................................................................................................................................... 55
Figure 2.14: Summary of DLS results, plotted as Γ/q2 to emphasize the deviation from center‐of‐mass
diffusion, for the two polymers and salts studied. The curve is the theoretical prediction for a
Gaussian coil52. ................................................................................................................................................................ 56
Figure 2.15: Schematic illustration of the hypothesis that small scattering angle DLS measurements of
PEO would yield a characterization of the size of the aggregates observed in this study.............. 57
Figure 3.1: Comparison of the polarized (VV) and depolarized (VH) intensity autocorrelation
functions g2(τ) of SWCNT‐PABS in the concentration range c=0.01‐0.1 mg/ml at scattering
angle, θ=45°. The inset plot shows the probability distribution function of the DLS decay time
spectrum in the VV and VH scattering planes for the above concentrations, obtained from a
CONTIN deconvolution of g2(τ)................................................................................................................................ 77
Figure 3.2: Comparison of the DLS decay time spectrum of c=0.01 mg/ml of SWCNT‐PABS in
deionized water (aqueous) and with magnesium chloride salt (5mM MgCl2) at θ=45° as a
function of time. .............................................................................................................................................................. 78

viii
Figure 3.3: Peak decay relaxation time, τ, as a function of time of c=0.01 mg/ml of SWCNT‐PABS in
deionized water (aqueous) and with magnesium chloride salt (5mM MgCl2) at θ=45. .................. 79
Figure 3.4: Comparison of the polarized (VV) and depolarized (VH) intensity autocorrelation
functions g2(τ) of SWCNT‐PABS at c=0.01 mg/ml and at different scattering angles. The inset
plot shows the probability distribution function, obtained from a CONTIN deconvolution of the
measured VV and VH autocorrelation functions at different scattering angles.................................. 80
Figure 3.5: Γ Vs q2 plot of SWCNT‐PABS and SWCNT‐PEG at c=0.01 mg/ml obtained from VV and VH
scattering. Error bars reported are standard error of the mean............................................................... 81
Figure 3.6: AFM micrographs for thin films of dried SWCNTs dispersions. Fig. a) corresponds to PEG
functionalized SWCNTs and Fig. b) corresponds to PABS functionalized SWCNTs. We found that
theSWCNT‐PABS were more stable than the SWCNT‐PEG. Dried films of suspensions of PEG‐
SWCNTs were prone to aggregation as can be seen in Fig. a). The scale bar is 1 µms. Fig. c) and
d) show the distribution of CNT lengths for SWCNT‐PEG and SWCNT‐PABS respectively.
Similarly, Fig. e) and f) correspond to the distribution of CNT diameters for SWCNT‐PEG and
SWCNT‐PABS respectively. ........................................................................................................................................ 82
Figure 4.1: Representative 2D confocal micrographs of a rod suspension as a function of increasing
rod volume fraction, ϕ, for a rod suspension with aspect ration, r = 212. (a) ϕ=0.0005, (b)
ϕ=0.001, (c) ϕ=0.0025, (d) ϕ=0.005, (e) ϕ=0.01(f) ϕ=0.03. ......................................................................105
Figure 4.2: Change of Correlation coefficient, R with volume fraction, ϕ as a function of increasing
time intervals between images for a rod suspension with aspect ratio, r =212...............................106
Figure 4.3: Plot of onset volume fraction Vs aspect ratio that compares our experimental values with
existing rod theory predictions. The solid square symbols are the arrest volume fractions
obtained via confocal microscopy and image processing. The top two dashed lines are the ideal
glass transition volume fractions for spherocylinders and tangent bead rods obtained from NMCT
theory. The dashed upper line is a prediction by Philipse et al., for an arrest volume fraction where
one first sees arrest in a rod suspension due to no sideways translation movement possible. The lower
solid line is the minimum percolation volume fraction of random homogenous rod network. The
dashed lower line is the Edwards and Evans prediction for an arrest volume fraction for a highly

ix
entangled rod system where rotational diffusion of rods is seriously constrained. Error bars in this
figure are less than the size of the datum points. .................................................................................................107
Figure 4.4: Elastic (G’) and Viscous moduli (G”) as a function of percent strain at an angular frequency
of 6.28Hz. .........................................................................................................................................................................108
Figure 4.5: Elastic modulus obtained from the plateau region of G’ Vs % strain curves (as shown in
Fig. 4.4) plotted as a function of effective volume fraction, (ϕ‐ϕ g).........................................................109
Figure 4.6: Volume fraction dependence of yield strain for the different aspect ratios studied...........110
Figure 4.7: Total interaction potential, UTot(r)/kBT between two parallel polyamide rods plotted as a
function of interaxial distance between the rods. The surface charge density on the rods,
σ=0.00179 C/m2 used for calculating the electrostatic interactions was estimated from the zeta
potential measurement. The zeta potential was measured using a Zetasizer Nano series (Malvern,
United Kingdom. The non-retarded Hamaker constant for the polyamide rods was estimated from
Lifshitz theory to be 1.29E-20 J. The Debye length used is 2 nm.................................................................111
x
List of Tables
Table 2.1: Onset stress (τw*) and slope increment (δ) values obtained from drag reduction
measurements for the different polymer and salt concentrations used in the study. ..................... 58
Table 3.1: Summary of translational diffusion coefficient (Dt), rotational diffusion coefficient (Dr),
length (L) and diameter (D) values obtained from DDLS and AFM measurements for SWCNT‐
PABS and SWCNT‐PEG samples. Reported uncertainties correspond to the standard error of the
mean..................................................................................................................................................................................... 83
Table 4.1: Aspect ratios of all the rod suspensions synthesized and used in the study, as taken from
measurements in Wilkins et al29., and confirmed by reflection CLSM imaging. ...............................112
Table 4.2: Onset volume fraction, ϕg obtained from Confocal microscopy for all the aspect ratios
studied...............................................................................................................................................................................113
xi
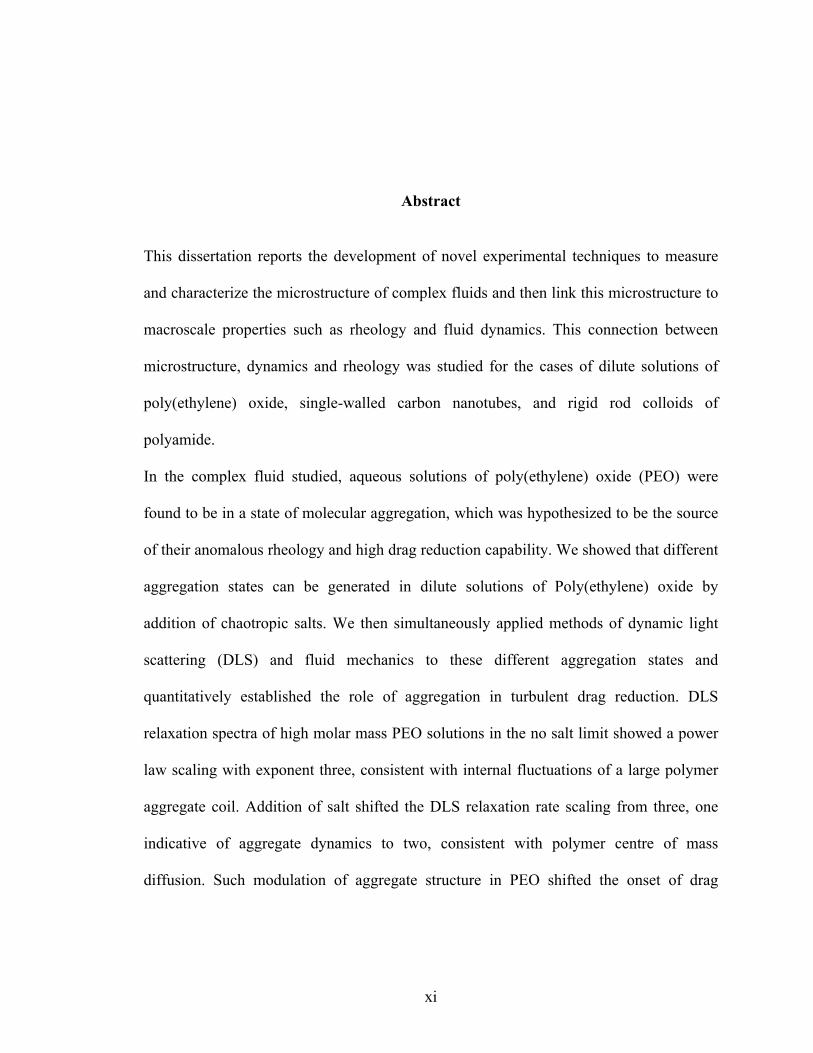
Abstract
This dissertation reports the development of novel experimental techniques to measure
and characterize the microstructure of complex fluids and then link this microstructure to
macroscale properties such as rheology and fluid dynamics. This connection between
microstructure, dynamics and rheology was studied for the cases of dilute solutions of
poly(ethylene) oxide, single-walled carbon nanotubes, and rigid rod colloids of
polyamide.
In the complex fluid studied, aqueous solutions of poly(ethylene) oxide (PEO) were
found to be in a state of molecular aggregation, which was hypothesized to be the source
of their anomalous rheology and high drag reduction capability. We showed that different
aggregation states can be generated in dilute solutions of Poly(ethylene) oxide by
addition of chaotropic salts. We then simultaneously applied methods of dynamic light
scattering (DLS) and fluid mechanics to these different aggregation states and
quantitatively established the role of aggregation in turbulent drag reduction. DLS
relaxation spectra of high molar mass PEO solutions in the no salt limit showed a power
law scaling with exponent three, consistent with internal fluctuations of a large polymer
aggregate coil. Addition of salt shifted the DLS relaxation rate scaling from three, one
indicative of aggregate dynamics to two, consistent with polymer centre of mass
diffusion. Such modulation of aggregate structure in PEO shifted the onset of drag

xii
reduction by a factor of 2.5 and thus was found directly related to its drag reducing
behavior.
We introduced a fast, non-invasive and reproducible method based on multi-angle
depolarized dynamic light scattering to characterize the length and diameter of single-
walled carbon nanotubes. Carbon nanotube dimensions were determined from
simultaneous characterization of the mean translational and rotational diffusivities and
using a anisotropic rigid rod model. The method was found to have quality comparable to
the standard methods such as atomic force microscopy and transmission electron
microscopy; however, the scattering method developed required much less time to
execute.
We synthesized a simple model system consisting of self-assembled polyamide
anisotropic colloids to study and characterize arrested dynamics in rod shaped colloidal
particles via methods like confocal laser scanning microscopy and rheology. The glass
transition volume fraction (φg) obtained in this study was found to be aspect ratio
dependent, but was slightly lower than the theoretical and simulation scaling predictions
for the minimum percolation volume fraction in a random homogenous network of rods.
Rheological characterization of these rod suspensions revealed a unique power law
scaling with exponent three for the elastic modulus, irrespective of the aspect ratio of the
rod suspension studied.

1
CHAPTER 1 INTRODUCTION
1.1 Complex Fluids
Complex fluids are present everywhere around us. The term complex fluid refers
to a class of materials that can neither be classified as a pure liquid nor a solid. Their
behavior generally lies between that of a solid and liquid. For instance the mechanical
response of solids and liquids under the application of stress or shear is to either maintain
its state (solid) or deform continuously (liquid). These mechanical responses characterize
a solid and liquid and they are said to exhibit elasticity and viscosity respectively.
Complex fluids behave differently in this case since they behave both as solids and
liquids at different time scales and hence are viscoelastic in nature. Typical examples of
these fluids include polymer solutions, colloidal suspensions, micellar solutions,
surfactant monolayers and microemulsions. All these above examples of complex fluids
have complex rheological behavior when a stress or strain is applied to them. For
example polymer solutions and melts behave differently under different shear rates. At
very low shear rates their viscosity is a constant like a liquid (referred to as zero shear
viscosity), but then at higher shear rates their viscosity decreases with increasing shear
rate (referred to as shear thinning).
Complex fluids have always attracted significant attention in the scientific
community due to their practical usefulness in applications such as fast ocean transport1,
2, tertiary oil recovery3, coatings4-6, reinforced composite materials, pulp and paper
making7, wastewater treatment8, drug delivery9-11 etc. Complex fluids are loosely defined

2
as liquid-based materials possessing a characteristic microscopic structural length scale,
due to the presence of a self-assembled or colloidal phase. It is this length scale, which
plays a very important role in determining its properties for different applications12.
Super-molecular structures (length scale ~ 0.5µm) present in dilute solutions of high
molecular weight water soluble polymers give them unusual hydrodynamic flow
properties. Dissolution of water soluble polymers like poly(ethylene) oxide can
significantly modify turbulence in a fluid leading to drastic reduction in friction. The
dynamic interactions between turbulence and the super molecular structures present in
these solutions plays a significant role in drag reduction. It is thus important that we have
a detailed understanding of the microscopic structure and dynamics of complex fluids,
since knowledge gained can then be fruitfully applied to make advances in their
applications.
The field of complex fluids is enormous and this dissertation is a small subset of
this area. In my dissertation I have looked into three different types of complex fluids –
high molar mass water-soluble polymers, single walled carbon nanotube suspensions and
polyamide rod shaped colloidal suspensions. As described before complex fluids are
characterized by a microscopic length scale, which determines its usage in applications.
In this dissertation by using the above three complex fluids we have tried to probe three
different length scales. The length scale of water-soluble polymer was Rg ~100-300 nm,
carbon nanotubes was L ~ 0.5-1µm and for polyamide rod suspensions was L ~ 3-20 µm,
where Rg. is the radius of gyration of the polymer coil and L is the length of the carbon
nanotube or polyamide rod. The major theme of this work has been to understand how
these different length scales present in complex fluids interact in solution at the

3
microscopic level and impact applications at the macroscale. Many of the material
properties of these complex fluids in applications are dictated by this structure and
dynamics relationship. Some questions which this thesis has been based on are as
follows- 1) What is the typical size of a dilute polymer aggregate and how does it matter
for applications like drag reduction? 2) Can theories like translational and rotational
diffusion that have been canonical to the understanding of rigid rod polymers be applied
to characterize the dimensions of carbon nanotubes? 3) How does anisotropy in
microstructure affect arrested colloidal suspension dynamics and what parameters does it
depend on? In the next paragraphs we discuss each of above-mentioned complex fluids in
detail.
Water soluble polymers are an important component of many complex fluid
formulations used in applications ranging from tertiary oil recovery3 to drug delivery10.
They have been a subject of great scientific and commercial interest, particularly the key
water soluble polymer poly(ethylene) oxide (PEO)13-16. Interestingly, intrinsic polymer
properties such as conformational polymer coil size or the radius of gyration (Rg),
intrinsic viscosity ([η]), second virial coefficient (A2) etc of the polymer depend heavily
on the solvent17. The nature of poly(ethylene) oxide in solution depends to a great extent
on the polymer-solvent interactions. PEO has been used heavily both in industry and
academia, but still its dilute solution properties in solution are not very clear. Polymer
aggregation even in the dilute limit is a very common condition of aqueous PEO
solutions18. Due to this aggregation, dilute bead spring models such as Zimm and Rouse,
which have been canonical to the understanding of polymer solution dynamics, fail to
capture the viscoelastic properties of PEO in solution. Molecular aggregation in aqueous

4
PEO solutions has been hypothesized to be the source of their anomalous rheology19 and
flow behavior20. Most of the unusual properties of PEO have been attributed to the
hydrogen bonding between the ether oxygen atom in PEO and hydrogen in the water
molecule16, 21. One of the most striking applications of PEO is in fast ocean transport
where a small amount (ppm) of this polymer when added to a turbulent Newtonian fluid
like water can lead to drastic reduction in skin friction. Our main interest (see Chapter 2)
was to investigate the relationship between aggregate structure and flow behavior (drag
reduction)1.The major purpose of this work was to improve fundamental understanding of
flow effects on dilute water-soluble polymers. The lack of appropriate experimental data
in this regard makes it an interesting and challenging problem to study. So an
experimental plan to investigate effect of molecular conformation on flow behavior is
needed, which can then stimulate the development of a new constitutive polymer model
for PEO. We apply methods like dynamic light scattering and fluid mechanics in a single
plan to discover the correspondence between the microscopic aggregation state and flow
behavior in these solutions. An increased micro level understanding of this sort can
benefit areas far removed from polymer science such as oil and ocean transport, tertiary
oil recovery, drug delivery etc where use of complex fluid formulations are very
common.
Carbon nanotubes (CNTs) have received a great deal of attention since their
discovery by Iijima in 199122. Enormous progress has been made towards carbon
nanotube applications like composite materials, transistors, logic devices and
nanoelectronic devices, and sensors and actuators for molecular imaging23. Most often
these applications require efficient dispersion or solubilization of CNTs in solution24. The

5
state of aggregation of the nanotubes (or the absence of it) and their dynamic nature in
solvents control a number of important physical properties of the composite medium. For
instance, the fabrication of nanocomposites and the preparation of nanotube pastes for
field emission displays generally require uniform dispersion of CNTs for optimal
performance25. These dispersions are typically complex fluids where physical interactions
of the carbon nanotube in the solvent at the microscale lead to interesting macroscale
phenomena. For instance the dispersion quality in carbon nanotubes is highly dependent
on concentration where bundling of carbon nanotubes has been seen at high
concentration24. Understanding of geometrical properties of single walled carbon
nanotubes (SWCNTs) such as length, diameter and aspect ratio is crucial for making
advances in their commercial applications since most of the properties of SWCNTs such
as electrical, mechanical and optical depend on nanotube dimensions26. Fagan et al
recently showed that the optical response of SWCNTs is highly dependent on carbon
nanotube length27. Fluorescence microscopy experiments have revealed that the uptake of
DNA wrapped SWCNTs by human lung fibroblast cells is also length dependent. A
minimum length threshold was determined in their experiments (L< 200nm), above
which the SWCNTS were excluded from cell uptake28. Therefore precise characterization
of single-walled carbon nanotube length and diameter is essential in a number of areas,
particularly for optimizing and predicting their phase behavior and rheological properties
for applications. Also due to the relative insolubility of SWCNTs in water and organic
solvents not much progress has been made in estimating the hydrodynamic properties of
SWCNTs in solution. Some recent attempts at understanding the mechanics and
dynamics of SWCNTs have been fruitful29. There has been a constant drive for

6
development of techniques, which can help evaluate the dispersion and stability of
CNTs30, determine SWCNT dimensions26 and dynamics31 in solution. So there is still
scope for development of new techniques for nanotube characterization. Our main
motivation (see Chapter 3) was to develop a fast, non-invasive and robust technique to
determine SWCNT dimensions and dynamics in solution. The work was aimed at
characterization and quantification of dispersions of single walled carbon nanotubes
(SWCNTs) in solvent media. Development of such techniques can help improve
fundamental understanding of liquid phase behavior of complex fluid dispersions
containing carbon nanotubes which can then be applied to develop scalable techniques
for directed and self assembly of CNTs.
Colloidal suspensions consist of particles that are of the order from nanometer to
micron in size which have been dispersed in a solvent. Colloidal suspensions can be
broadly divided into two categories – those in which the particle building block is
isotropic (spherical colloids) and those in which the particle is anisotropic (nonspherical
colloids). Nonspherical colloids such as rods, discs, dumbbells etc have complex phase
behavior compared to spherical colloids32, which makes them interesting to study. This is
due to the higher number of degrees of freedom present in nonspherical colloids due to
shape anisotropy32. Significant amount of experimental and theoretical work has been
done that elucidates how the rheology and dynamics of anisometric colloids differs from
that of spherical colloids. Molecular dynamic simulations on packings prepared with the
mechanical contraction method reveal significant differences between random packings
of spheres and thin rods33, 34. A sharp maximum in the contact number distribution for rod
packings has been seen35. Rod shaped particles also show an interesting phase separation

7
phenomena called the isotropic-nematic phase transition when their concentration crosses
a critical concentration36. Rod suspensions depending on their interaction strength, aspect
ratio and volume fraction form structures ranging from fractals to heterogeneous
networks at much lower volume fractions compared to spherical colloidal suspensions37.
Although rod suspensions have attracted interest in the soft matter community, not much
has been done to investigate the effect of microstructure due to anisotropy on arrested or
slow dynamics of rod shaped colloids. So our main motivation was to study arrested
dynamics in a model rod system (see Chapter 4). The model system we used comprised
of self-assembled polyamide rods dispersed in an aqueous surfactant solution. Confocal
microscopy, image processing and rheology were used in this investigation. The results
obtained can broadly be applied to develop complex fluid stabilization strategies, which
play a key role in the consumer products such as detergents cosmetics etc. Also
generating such data can help validate existing rod theories for gelation and vitrification.
We now turn to a brief overview of some of the characterization methods that
were used in this work to accomplish the above mentioned goals.
1.2 Dynamic Light Scattering
Dynamic light scattering (DLS), also commonly known as photon correlation
spectroscopy, is a powerful tool to study complex fluid properties. Typical applications of
DLS include study of translational as well as internal coil motions of a polymer coil in
solution38, measuring rotational diffusion in anisotropic colloidal suspensions39,
investigating arrested dynamics in soft matter systems40. DLS typically probes dynamics
over a wide range of time scales from 10‐8 to 103 seconds41. In this work we have
used DLS effectively to characterize high molar mass PEO solutions in Chapter 2 and

8
Carbon nanotube suspensions in Chapter 3. In a typical DLS measurement temporal
intensity fluctuations in the scattered light are determined as a function of
scattering angle, θ. An important parameter in DLS is the wave vector, q which
depends on the geometry of the light scattering device as shown in Fig. 1.1. kin and
ksc represent the incident and scattered vectors respectively and q is defined as kin ‐
ksc. The magnitude of q is given by
€
q =4πnλsin θ
2
, where n is the refractive index, λ is the wavelength of the incident
laser beam used in the setup and θ is the scattering angle. The significance of q lies
in the fact that scattering generated at a particular q is due to structural correlations
on a characteristic length scale l* where l* ~ 2π/q. Here l* represents a size over
which spatial correlations are measured. In DLS the time dependent intensity
fluctuations for instance from a polymer coil are measured in the form of a
normalized intensity autocorrelation function, g2(q,t). Here, g2(q,t) =
<I(q,0)I(q,t)>/(<I(q)>e)2 where I is the intensity of scattered light and <I>e is the
ensemble averaged scattered intensity of light. In dilute solutions g2(q,t) is an
exponentially decaying function from which the diffusion coefficient of the polymer
coil can be derived. From this diffusion coefficient measurement an effective
hydrodynamic coil size of the polymer coil can be calculated via the Stokes Einstein
equation41. Alternatively, the diffusion coefficient can be used to extract the size of
particles diffusing in a colloidal suspension42.

9
1.3 Confocal laser scanning microscopy
Confocal laser scanning microscopy (CLSM) is a very widely used technique in
biological sciences as well as soft matter physics for direct visualization of 3D structures
and dynamics of these systems. CLSM has been used successfully to provide useful
insights in colloidal crystallization43-45, electric field induced rupturing of colloidal gels46,
heterogeneity in colloidal gels47, interactions in protein assemblies and colloid polymer
mixtures48etc. It has been used to study arrested dynamics in hard sphere colloidal
glasses49 as well as in mechanical characterization of soft viscoelastic solids such as
biofilms50.
Confocal laser scanning microscopy works on the principle of point by point
illumination of an object in a sample volume. Fig. 1.4 shows the schematic of a CLSM.
Laser light, after it has been directed by the dichroic mirror, passes through the
microscope objective and illuminates the sample. The light scattered (fluoresced light or
just scattered and reflected light in case of no flurophores) then reaches the photo
multiplier tube (PMT), which acts as a detector. The light on its way back from the
sample passes through a pinhole that is placed in the conjugate focal plane of the sample
right in front of the PMT. It is this pinhole that rejects all the out of focus light from
reaching the PMT and makes it even possible to image dense samples with high solid
content.
In a typical CLSM experiment, the computer reconstructs a two dimensional (x-y
plane) image from a point by point by illumination of the specimen This is generally
called an optical section of the image. A three dimensional reconstruction of the image
involves measuring a series of such optical sections at different depths with the help of a

10
motor which moves the sample in a direction (z-direction) perpendicular to the image
plane (x-y direction). It is this sectioning capability, which makes CLSM a great tool for
3D visualization. Recent developments in image processing and synthesis of new model
colloidal materials have now extended the use of CLSM in quantification of colloidal
suspension dynamics51. We use CLSM and image processing in Chapter 4 for studying
arrested dynamics in a model rod system.
1.4 Outline of the dissertation
The central goal of this dissertation is to develop novel experimental techniques to study
and characterize microstructure in complex fluids and relate this to observable
macroscale phenomena. Three different complex fluids have been used in this
dissertation namely- high molar mass poly(ethylene) oxide solutions, short functionalized
single walled carbon nanotube suspensions and surfactant stabilized polyamide rod
suspensions. Chapter 1 presents results of dynamic light scattering and fluid flow of
dilute high molar mass poly(ethylene) oxide solutions. In chapter 2 we introduce
depolarized dynamic light scattering as a potential tool to characterize carbon nanotube
dimensions and dynamics. Study of structural and dynamical transitions in a model rod
system via confocal microscopy, image processing and rheology is presented in chapter
4. Finally conclusions from this dissertation and possible areas of future investigation are
discussed in chapter 5.
11
Figure 1.1: Definition of scattering vector, q and geometry of our dynamic light scattering setup.

12
Figure 1.2: Schematic of the Leica SP2 TCS Confocal laser scanning microscope52.

13
1.5 References
1. Virk, P. S., Drag reduction fundamentals. Aiche Journal 1975, 21, (4), 625-656.
2. Figueredo, R. C. R.; Sabadini, E., Firefighting foam stability: the effect of the drag reducer poly(ethylene) oxide. Colloids and Surfaces a-Physicochemical and Engineering Aspects 2003, 215, (1-3), 77-86.
3. Morgan, S. E.; McCormick, C. L., Water-soluble polymers in enhanced oil-recovery. Progress in Polymer Science 1990, 15, (1), 103-145.
4. Trancik, J. E.; Barton, S. C.; Hone, J., Transparent and catalytic carbon nanotube films. Nano Letters 2008, 8, (4), 982-987.
5. Green, A. A.; Hersam, M. C., Colored semitransparent conductive coatings consisting of monodisperse metallic single-walled carbon nanotubes. Nano Letters 2008, 8, (5), 1417-1422.
6. Bekyarova, E.; Itkis, M. E.; Cabrera, N.; Zhao, B.; Yu, A. P.; Gao, J. B.; Haddon, R. C., Electronic properties of single-walled carbon nanotube networks. Journal of the American Chemical Society 2005, 127, (16), 5990-5995.
7. Addai-Mensah, J.; Yeap, K. Y.; McFarlane, A. J., The influential role of pulp chemistry, flocculant structure type and shear rate on dewaterability of kaolinite and smectite clay dispersions under couette Taylor flow conditions. Powder Technology 2007, 179, (1-2), 79-83.
8. Rodriguez, S.; Romero, C.; Sargenti, M. L.; Muller, A. J.; Saez, A. E.; Odell, J. A., Flow of polymer-solutions through porous-media. Journal of Non-Newtonian Fluid Mechanics 1993, 49, (1), 63-85.
9. Jia, N. Q.; Lian, Q.; Shen, H. B.; Wang, C.; Li, X. Y.; Yang, Z. N., Intracellular delivery of quantum dots tagged antisense oligodeoxynucleotides by functionalized multiwalled carbon nanotubes. Nano Letters 2007, 7, (10), 2976-2980.
10. Gil, E. S.; Hudson, S. A., Stimuli-reponsive polymers and their bioconjugates. Progress in Polymer Science 2004, 29, (12), 1173-1222.
11. Andrews, R.; Jacques, D.; Rao, A. M.; Rantell, T.; Derbyshire, F.; Chen, Y.; Chen, J.; Haddon, R. C., Nanotube composite carbon fibers. Applied Physics Letters 1999, 75, (9), 1329-1331.
12. Larson, R. G., The Structure and Rheology of Complex Fluids. New York: Oxford University Press: 1999.
13. Vlassopoulos, D.; Schowalter, W. R., Steady viscometric properties and characterization of dilute drag-reducing polymer-solutions. Journal of Rheology 1994, 38, (5), 1427-1446.

14
14. Wolff, C., On the real molecular-weight of polyethylene oxide of high molecular-weight in water. Canadian Journal of Chemical Engineering 1980, 58, (5), 634-636.
15. Toryanik, A. I., A structural model of an aqueous-solution of poly(ethylene oxide). Journal of Structural Chemistry 1984, 25, (3), 385-388.
16. Tasaki, K., Poly(oxyethylene)-water interactions: A molecular dynamics study. Journal of the American Chemical Society 1996, 118, (35), 8459-8469.
17. Rubinstein, M.; Colby, R. H., Polymer Physics. Oxford University Press: 2004.
18. Polverari, M.; vandeVen, T. G. M., Dilute aqueous poly(ethylene oxide) solutions: Clusters and single molecules in thermodynamic equilibrium. Journal of Physical Chemistry 1996, 100, (32), 13687-13695.
19. Kalashnikov, V. N., Shear-rate dependent viscosity of dilute polymer-solutions. Journal of Rheology 1994, 38, (5), 1385-1403.
20. Dunlop, E. H.; Cox, L. R., Influence of molecular aggregates on drag reduction. Physics of Fluids 1977, 20, (10), S203-S213.
21. Smith, G. D.; Bedrov, D.; Borodin, O., Molecular Dynamics Simulation Study of Hydrogen Bonding in Aqueous Poly(Ethylene Oxide) Solutions. Physical Review Letters 2000, 85, (26), 5583-5586.
22. Iijima, S., Helical microtubules of graphitic carbon. Nature 1991, 354, (6348), 56-58.
23. Baughman, R. H.; Zakhidov, A. A.; de Heer, W. A., Carbon nanotubes - the route toward applications. Science 2002, 297, (5582), 787-792.
24. Amiran, J.; Nicolosi, V.; Bergin, S. D.; Khan, U.; Lyons, P. E.; Coleman, J. N., High quality dispersions of functionalized single walled nanotubes at high concentration. Journal of Physical Chemistry C 2008, 112, (10), 3519-3524.
25. Meyyappan, M., Carbon Nantubes Scinece and Applications. CRC Press LLC: 2005.
26. Badaire, S.; Poulin, P.; Maugey, M.; Zakri, C., In Situ Measurements of Nanotube Dimensions in Suspensions by Depolarized Dynamic Light Scattering. Langmuir 2004, 20, (24), 10367-10370.
27. Fagan, J. A.; Simpson, J. R.; Bauer, B. J.; Lacerda, S. H. D.; Becker, M. L.; Chun, J.; Migler, K. B.; Walker, A. R. H.; Hobbie, E. K., Length-dependent optical effects in single-wall carbon nanotubes. Journal of the American Chemical Society 2007, 129, (34), 10607-10612.
28. Becker, M. L.; Fagan, J. A.; Gallant, N. D.; Bauer, B. J.; Bajpai, V.; Hobbie, E. K.; Lacerda, S. H.; Migler, K. B.; Jakupciak, J. P., Length-dependent uptake of DNA-wrapped single-walled carbon nanotubes. Advanced Materials 2007, 19, (7), 939-945.

15
29. Duggal, R.; Pasquali, M., Dynamics of individual single-walled carbon nanotubes in water by real-time visualization. Physical Review Letters 2006, 96, (24), 246104.
30. Lee, J. Y.; Kim, J. S.; An, K. H.; Lee, K.; Kim, D. Y.; Bae, D. J.; Lee, Y. H., Electrophoretic and dynamic light scattering in evaluating dispersion and size distribution of single-walled carbon nanotubes. Journal of Nanoscience and Nanotechnology 2005, 5, (7), 1045-1049.
31. Fakhri, N.; Tsyboulski, D. A.; Cognet, L.; Weisman, R. B.; Pasquali, M., Diameter-dependent bending dynamics of single-walled carbon nanotubes in liquids. Proceedings of the National Academy of Sciences of the United States of America 2009, 106, (34), 14219-14223.
32. Glotzer, S. C.; Solomon, M. J., Anisotropy of building blocks and their assembly into complex structures. Nature Materials 2007, 6, (8), 557-562.
33. Wouterse, A.; Luding, S.; Philipse, A. P., On contact numbers in random rod packings. Granular Matter 2009, 11, (3), 169-177.
34. Wouterse, A.; Williams, S. R.; Philipse, A. P., Effect of particle shape on the density and microstructure of random packings. Journal of Physics-Condensed Matter 2007, 19, (40), 406215.
35. Sacanna, S.; Rossi, L.; Wouterse, A.; Philipse, A. P., Observation of a shape-dependent density maximum in random packings and glasses of colloidal silica ellipsoids. Journal of Physics-Condensed Matter 2007, 19, (37), 376108.
36. Onsager, L., The effects of shape on the interaction of colloidal particles. Annals of the New York Academy of Sciences 1949, 51, (4), 627-659.
37. Solomon, M. J.; Spicer, P. T., Microstructural regimes of colloidal rod suspensions, gels and glasses. Soft Matter 2010, 6, (7), 1391-1400.
38. Shetty, A. M.; Solomon, M. J., Aggregation in dilute solutions of high molar mass poly(ethylene) oxide and its effect on polymer turbulent drag reduction. Polymer 2009, 50, (1), 261-270.
39. Shetty, A. M.; Wilkins, G. M. H.; Nanda, J.; Solomon, M. J., Multiangle Depolarized Dynamic Light Scattering of Short Functionalized Single-Walled Carbon Nanotubes. Journal of Physical Chemistry C 2009, 113, (17), 7129-7133.
40. Wilkins, G. M. H.; Spicer, P. T.; Solomon, M. J., Colloidal System To Explore Structural and Dynamical Transitions in Rod Networks, Gels, and Glasses. Langmuir 2009, 25, (16), 8951-8959.
41. Berne, B. J.; Pecora, R., Dynamic Light Scattering. J Wiley, New York: 1976.
42. Russel, W. B.; D.A., S.; Schowalter, W. R., Colloidal Dispersions. Cambridge University Press: 1989.

16
43. Gasser, U.; Weeks, E. R.; Schofield, A.; Pusey, P. N.; Weitz, D. A., Real-space imaging of nucleation and growth in colloidal crystallization. Science 2001, 292, (5515), 258-262.
44. Shereda, L. T.; Larson, R. G.; Solomon, M. J., Local stress control of spatiotemporal ordering of colloidal crystals in complex flows. Physical Review Letters 2008, 101, (3), 038301.
45. Solomon, T.; Solomon, M. J., Stacking fault structure in shear-induced colloidal crystallization. Journal of Chemical Physics 2006, 124, (13), 134905.
46. Kogan, M.; Solomon, M. J., Electric-Field-Induced Yielding of Colloidal Gels in Microfluidic Capillaries. Langmuir 26, (2), 1207-1213.
47. Dibble, C. J.; Kogan, M.; Solomon, M. J., Structural origins of dynamical heterogeneity in colloidal gels. Physical Review E 2008, 77, (5), 041403.
48. Stradner, A.; Sedgwick, H.; Cardinaux, F.; Poon, W. C. K.; Egelhaaf, S. U.; Schurtenberger, P., Equilibrium cluster formation in concentrated protein solutions and colloids. Nature 2004, 432, (7016), 492-495.
49. Vanblaaderen, A.; Wiltzius, P., Real-space structure of colloidal hard-sphere glasses. Science 1995, 270, (5239), 1177-1179.
50. Hohne, D. N.; Younger, J. G.; Solomon, M. J., Flexible Microfluidic Device for Mechanical Property Characterization of Soft Viscoelastic Solids Such as Bacterial Biofilms. Langmuir 2009, 25, (13), 7743-7751.
51. Crocker, J. C.; Grier, D. G., Methods of digital video microscopy for colloidal studies. Journal of Colloid and Interface Science 1996, 179, (1), 298-310.
52. Solomon, M. J.; Kogan, M., Confocal Optical Microscopy. Encyclopedia of Condensed Matter Physics 2005.

17
CHAPTER 2 AGGREGATION IN DILUTE SOLUTIONS OF HIGH MOLAR MASS
POLY(ETHYLENE) OXIDE AND ITS EFFECT ON TURBULENT DRAG REDUCTION
2.1 Chapter Summary
In this chapter we apply methods of dynamic light scattering (DLS) and fluid mechanics
to quantitatively establish the role of aggregation in the turbulent drag reduction of high
molar mass poly(ethylene oxide) (PEO) solutions. By means of DLS, we show that the
dilute aqueous solutions of high molar mass PEO (Mw ~ 4 x 10⁶ g/mole) are aggregated
and that this aggregate structure can be manipulated by addition of the chaotropic salt
guanidine sulfate (GuS) or the divalent salt magnesium sulfate (MgSO4). In aqueous
solution, we find Γ ~ q2.8±0.1, where Γ is the DLS correlation function relaxation rate and
q is the scattering vector. This scaling is consistent with internal motions of a large coil or
aggregate. Addition of salt progressively decreases the scaling to Γ ~ q2.0±0.1 (at 0.5M of
MgSO4) consistent with center of mass diffusion of isolated coils. We further find that
manipulating the aggregation state of PEO with MgSO4 shifts the critical condition for
onset of turbulent drag reduction at dilute concentrations in pipe flow by a factor of 2.5.
Because this critical condition is inversely proportional to the viscoelastic relaxation time
of the polymer solution, we conclude that the aggregation state and the turbulent drag
reduction behavior of PEO are strongly correlated. This correlation definitively confirms
prior speculation (Cox et al. Nature 249, 1974; Vlachogiannis et al. Physics of Fluids, 15,
(12), 2003) that the high molar mass PEO commonly used in literature studies of
turbulent drag reduction is in a state of aggregation. Furthermore, the quantitative

18
differences in quiescent DLS characterization and turbulent flow pressure drop
measurements suggest that high molar mass PEO undergoes flow-induced deaggregation
in transport systems with shear stresses as low as 0.5 Pa.
19
2.2 Introduction
Poly(ethylene oxide) (PEO) is an important commodity polymer used as a dilute additive
in applications such as turbulent drag reduction, oil drilling and recovery, papermaking,
wastewater treatment and drug delivery1-7. Fundamental understanding of PEO solution
structure, dynamics and rheology may be fruitfully applied to advance these applications.
However, the dilute solution properties of PEO have generated controversy because of
significant differences between experimental observations and well-established classical
theories of polymer science. For example the aqueous solubility of PEO is unexpected:
the closest counterparts of PEO in the homologous series of polyethers, poly(methylene)
oxide and poly(propylene) oxide, are both practically insoluble in water8. Aqueous
solutions of PEO display a temperature dependence of solvent quality that is the inverse
of typical polymer solvent pairs9. The aqueous PEO phase diagram also contains closed
loop regions10-12. These anomalous solubility properties are a consequence of hydrogen
bonding between the ether oxygen atom in PEO and the hydrogen in the water molecule
8, 9, 13-15.
Among the most extensively studied of the anomalous properties of aqueous PEO
solutions is its clustering behavior. It has been reported that, above a critical
concentration that is molecular weight dependent, polymer clusters (or aggregates)
coexist in equilibrium with free polymer coils16. Others have found that, at concentrations
much below the critical overlap concentration (c*), PEO exists as two phases, each of
different polymer concentration. The polymer rich phase of these two has been reported
to organize into a liquid-crystalline fibrillar network that leads to properties such as shear
thinning and elasticity 17.
20
Aggregation of PEO in solution has been studied by electron microscopy,
dynamic light scattering (DLS), static light scattering (SLS) and small angle neutron
scattering (SANS)16,18,19. Electron micrographs of dilute solutions PEO in
dimethylformamide and water solutions subjected to drying revealed supermolecular
structures that were much larger than the molecular dimensions of PEO18,20. DLS of
dilute solutions of PEO in methanol yielded intensity autocorrelation functions consistent
with two relaxation times. The ability of low molecular weight PEO used in the study to
form clusters depended on the history of the sample and the temperature used. The fast
relaxation mode was attributed to the well-solvated dispersed monomolecular species and
the slow relaxation mode was caused by the formation of aggregates in solution21. Both
relaxation modes (as characterized by a relaxation rate, Γ) scaled with the scattering
vector, q, as Γ ~ q2, consistent with polymer centre of mass diffusion22.
Zimm plot analysis of SLS measurements of dilute PEO solutions has revealed
curvature at low angles 10, 23. Such curvature is thought to be a very sensitive indicator of
aggregation in solution24. Hammouda and coworkers recently concluded from SANS
measurements that hydrogen bonding and hydrophobic interactions in PEO/water
systems have a primary role in the formation of aggregates19. They observed two
correlation lengths in the SANS scattering spectrum. The long range correlation was due
to clustering and the short range one was due to single polymer chains19, 25.
The anomalous rheology of dilute aqueous solutions of PEO has also been taken
as evidence for presence of aggregates26, 27. (Here we define an aggregate in a dilute
solution is a polymer structure comprised of more than one molecular chain, but which is
not a sample spanning network or gel.) Dilute linear (Zimm and Rouse) and non-linear

21
bead spring (FENE) constitutive polymer models, which are based on parameters such as
the molar mass of a single polymer chain and polymer contour length, fail to capture the
rheological behavior of these solutions. For example, from measurements of capillary
filament breakup, Tirtaatmadja et al have reported that the structure of high molar mass
PEO at ~ 10 - 100 ppm concentrations is not consistent with the prediction of the Zimm
model28.
Measurements reported in Fig. 2.1 support the Tirtaatmadja et al. finding of a
significant discrepancy between constitutive equations based on single molecule theory,
and the rheology of aqueous PEO. Fig. 2.1 reports the shear-rate dependent viscosity of a
common high molar mass PEO, WSR-301 (Dow Chemical, M ~ 4 x 10⁶ g/mole; c/c* =
620 ppm). The least squared error fits plotted in Fig. 2.1 are for the shear–rate dependent
rheology of the FENE-P (finite extensible, nonlinear elastic dumbbell, pre-averaged)
constitutive equation29. The constitutive equation relaxation times obtained are much
larger than would be predicted by the single molecule Zimm theory, even given
extrapolations to low concentrations (Fig. 2.2).
An important feature of dilute aqueous solutions of high molar mass PEO is their
ability to reduce friction drag in flow. It is well known that the addition of a small amount
of high molar mass polymer to a turbulent Newtonian fluid flow results in drag
reduction30, 31. High molecular weight PEO is the most commonly used polymer for
turbulent drag reduction in aqueous solutions since significant drag reduction can be
achieved at very small concentrations32, 33. However, the drag reduction capacity of
dilute PEO appears to be much greater than predicted by dilute solution constitutive
equations34.

22
The role of PEO aggregation in turbulent drag reduction can be indirectly inferred from
literature measurements. For example, viscoelastic relaxation times extracted from
measurements of the onset shear stress of turbulent drag reduction in pipe flow do not
agree with estimates for single molecules of PEO, as computed from the Zimm model34.
(This assignment is possible because the onset condition for turbulent drag reduction is
inversely proportional to the solution viscoelastic relaxation time35.) Second, Dunlop and
Cox concluded that molecular aggregates exist in dilute PEO solutions by monitoring the
rate of change of torque with time in a spinning disk apparatus. The immediate minima
preceding a steady state value in the characteristic torque-time curve was argued to be
due to presence of aggregates36. Third, Libertore et al and Vlachogiannis et al have
inferred the presence of aggregates in PEO solutions by showing that loss of turbulent
drag reduction with time in PEO solutions was not related to the reduction in molecular
weight of the solutions due to scission37, 38. Fourth, by means of small angle light
scattering (SALS) and rheoptics, Libertore and coworkers observed signatures of
structural heterogeneities in PEO solutions under shear which they attributed to polymer
aggregation39, 40. Further support for the effect of aggregation on PEO drag reduction
comes from direct numerical simulation. Far greater magnitudes of the polymer
relaxation time have been required to model the turbulent statistics and onset phenomena
of turbulent drag reduction than could be supported by single chain theories of polymer
dynamics41.
However, because experiments have yet to directly probe molecular structure and
turbulent flow behavior in the same PEO system, the experimental evidence for a role of
aggregation in PEO turbulent drag reduction is indirect. A definitive approach to directly
23
link aggregation with the anomalous drag reduction behavior of PEO would be to disrupt
aggregate structure in a polymer of a particular molar mass through the effect of an
additive. Such additives exist: Little and coworkers have studied the effect of salts like
magnesium sulfate and potassium carbonate on the turbulent drag reduction of PEO42, 43.
They show that progressive addition of salt decreases the drag-reducing tendency of these
solutions. Yuan and coworkers have likewise demonstrated that such salts can be used as
an agent to disrupt hydrogen bonding capability in aqueous soluble polymers such as
poly(N-isopropylacrylamide)44. Lim and coworkers have found that addition of salts
shifts the theta point, Tθ, of polymer-salt mixtures, which in turn has an effect on their
drag reduction characteristics45. Based on these observations, we hypothesized that
divalent and/or chaotropic salts might be a suitable method to disrupt the aggregate
structure of PEO. At concentrations ~ 0.1-1M, chaotropic salts disrupt local water
structure and are perhaps best known for their role as agents of cell lysis and protein
denaturation 46.
Thus, the approach of this work is to systematically create different polymer
aggregation states in the same polymer system by addition of the salts discussed above.
Subsequently, using these polymer states, we examine the aggregate structure (by DLS)
and flow behavior (by drag reduction measurements) of dilute PEO solutions.
The organization of the chapter is as follows. We first present DLS results of high
molar mass PEO solutions in deionized water. These results are consistent with the dilute
aggregate hypothesis. Next, by means of DLS, we show that the salts magnesium sulfate
and guanidine sulfate can indeed be used as a tool to manipulate the aggregate structure
of dilute PEO solutions. We finally demonstrate the significant effect of aggregate

24
structure on the drag-reducing tendency of these solutions by comparing results of the
DLS studies with the parallel studies of turbulent drag reduction.
2.3 Experimental Section
2.3.1 Materials:
Two different grades of high molar mass poly(ethylene oxide) (PEO) were used in this
study. The first is a polydisperse PEO with manufacturer reported molar mass Mw~
4 x 10⁶ g/mole (WSR-301, Dow Chemicals). The second is a monodisperse PEO with
Mw~ 1.2 x 10⁶ g/mole (PEO-1182K, Polymer laboratories; Mw/Mn~1.12). The overlap
concentrations, c* as determined by the measurement of intrinsic viscosity (data not
shown) are 620 ppm and 2600 ppm respectively. Dilute solutions of these polymers were
prepared with HPLC grade water (Sigma Aldrich, for light scattering measurements) and
with de-ionized water (for turbulent drag reduction experiments) from stock solutions. To
prevent shear degradation, polymer solutions were prepared in 0.1L (for light scattering)
and 1L (for drag reduction) bottles placed on rollers (Wheaton Science Products) rotating
at 3-6 rpm for ~ 24 - 48 hours. The salts guanidine sulfate (GuS, Sigma Aldrich) and
magnesium sulfate (MgSO4, Sigma Aldrich) were prepared in the concentration range
0.1M - 1M. Experiments were performed within 3-4 days after dilution to minimize any
possible degradation due to aging.
2.3.2 Dynamic Light Scattering (DLS)
DLS was performed on a compact goniometer system (ALV, Langen, Germany)
equipped with a multi-tau digital correlator (ALV-5000E, Langen, Germany). The
minimum delay time of the correlator used was 12.5 ns. A Laser source with wavelength

25
of
€
λ0 = 488 nm (Innova 70C, Coherent Inc., Santa Clara, CA) was used. Measurements
were done in the angular range q = 200-1150 (5.94 µm-1 < q < 28.86 µm-1) so as to span
at least a decade in q, the scattering vector, where
€
q =4πn sin θ
2
λ0. Here n is the refractive
index of the solvent, λ0 is the wavelength of incident light source and θ is the scattering
angle. In a typical DLS experiment, the normalized intensity autocorrelation function,
g2(t) = <I(t)I(0)>/<I>2 is measured. In dilute solution g2(t) is an exponentially decaying
function:
€
g2(t) = exp(−2Γt) = exp(−2t /τ ) (2-1)
Here Γ is the previously described DLS relaxation rate, inversely related to the DLS
relaxation time, τ, of the polymer. Both quantities are q-dependent. Typical
measurements of the measured g2(τ) for a 20 ppm (c/c* ~ 0.03) aqueous solution of PEO
WSR 301 over a range of scattering angles are plotted in Fig. 2.3. The probability
distribution of the relaxation time spectra was obtained by a CONTIN (constrained
regularization) deconvolution of the correlation functions47. (Other means of analysis,
such as the method of cumulants, yield analogous results.) Fig. 2.4 reports the probability
distribution function of the CONTIN relaxation time spectrum measured for a typical
duration of 600 s. All measurements are at T = 298 ± 0.5 K. The sample vials used were
cleaned by first sonicating them in acetone for about an hour, drying them overnight and
then subjecting them to UV ozone treatment (UVO cleaner, Jelight, Irvine, CA) to ensure
that they were free from any organic residue. The polymer and salt solutions prepared
were filtered using a 1.5 µm filter (Whatman 25mm GD/X syringe filters) prior to DLS
measurements.
26
2.3.3 Turbulent drag reduction characterization
The pipe flow experiment for characterization of polymer turbulent drag reduction has
been previously described 48. The apparatus has the following capabilities: First, to access
the very low wall shear stresses (
€
τw ~ 0.5 - 1 Pa) associated with the onset of turbulent
drag reduction in high molar mass aggregated PEO solutions, a test section consisting of
½ inch diameter stainless-steel pipe was used. Second, to access the small pressure drops
associated with low wall shear rates, a highly sensitive differential pressure transducer
(GP50, Grand Island, NY, range 0 – 0.18 psi) was used. Pressure drop measurements
were performed across a test section 0.7m long. The pressure transducer responses were
acquired via a National Instruments LABVIEW data acquisition system (Model USB-
6009). Since fully developed flow is more difficult to realize in polymer solutions than in
Newtonian fluids, a large entrance length (L/D=290) was incorporated prior to the test
section49. We found that no static pressure correction was required in our pressure drop
measurements due to the relatively low Reynolds number (~104) of the experiments50.
The standard means to report friction drag reduction for a polymer is the Prandtl-
van Karman plot35. The axes of the plot are
€
1f
(ordinate) and
€
Re f (abscissa). Here f
is the friction factor,
€
f =2τwUav2 ρ
, where
€
τw is the wall shear stress,
€
Uav is the mean fluid
velocity in the flow direction averaged across the pipe’s cross-section. Re is the Reynolds
number given by
€
Re =dUav
ν s
, where d is the pipe diameter and
€
ν s is the kinematic
viscosity of the fluid. Fig. 2.5 reports drag reduction measurements for different

27
concentrations of WSR-301 as a Prandtl-van Karman plot. The lower solid line is the
Prandtl-Karman (PK) curve – the friction drag for a Newtonian fluid - and the upper solid
line is the maximum drag reduction asymptote (MDR) – an (empirical) upper bound for
friction drag reduction in polymer flows. Functional forms for these two limiting
behaviors are given in the reference by Virk35. In Fig. 2.5, as the ordinate increases,
friction drag decreases. The performance of the device over the conditions of interest
(400 < Re
€
f < 1000) was verified by measurements with water. As shown in Fig. 2.5,
the results for water agree well with the Newtonian result, the Prandtl – van Karman line.
At dilute polymer concentrations, pressure drop flow rate measurements in pipe
flow follow the Prandtl - Karman (Newtonian) curve until a critical wall shear rate
€
τw* is
reached. Above this point, as shown in Fig 2.5 for a dilute solution of the high molar
mass polymer PEO, Virk discusses that
€
τw* is determined by a critical Weissenberg
number (Wi*). This critical Weissenberg number for the onset of drag reduction depends
on polymer related variables and is given by
€
Wi* =λτw
*
µ, where λ is the relaxation time of
the polymer,
€
τw* is the onset wall stress and µ is the viscosity of the solvent35. Further,
Virk also shows that this critical Weissenberg number is a constant for all drag reduction
flows and is given by
€
Wi* =5.5Kλ
H, where Kλ is the width of the relaxation time spectrum
for the polymer and H is the heterogeneity index of the polymer. (Note Kλ and H are both
phenomenological constants for a particular polymer-solvent combination. For example,
Virk lists Kλ = 1 and H = 3.5 for WSR 301. Thus, Wi* = 1.6 for this polymer.)
This discussion anticipates the potential relationship between onset of turbulent
drag reduction and aggregate structure. Aggregation will affect the viscoelastic relaxation

28
time of the dilute polymer solution. This effect will shift the onset condition for turbulent
drag reduction because onset is controlled by a critical Wi*.
A general equation to correlate the drag reduction behavior for a polymer is35:
€
1f
= 4 + δ( ) log10 Re f( ) − 0.4 −δ log10 Re f( )*
(2-2)
Here δ is the slope increment, which increases with increasing polymer concentration and
polymer molecular weight.
€
Re f( )* is the value of
€
Re f( ) at the onset of drag
reduction. It is the point where the polymer drag reduction curve intersects the Prandtl-
Karman curve. Note that
€
Re f( )*is simply related to the onset condition,
€
τw* through the
following equations:
€
Re f( )*
=2uτ
*dν s
where
€
uτ* =
τw*
ρ (2-3)
In the above equations
€
uτ* is the onset pipe friction velocity and d is the diameter of the
pipe used for the study. Note that knowledge of the onset condition and slope increment
specifies the turbulent drag reduction of a polymer in turbulent flow in a pipe of a
particular diameter. Generally,
€
τw* and delta are both a function of polymer molar mass
(and/or aggregate structure). δ is also a function of the polymer concentration with a
typical dependence of δ~c1/2 observed35.
2.4 Results
2.4.1 DLS of dilute aqueous solutions of PEO.
The q-dependence of the DLS relaxation rate at dilute concentrations of PEO WSR-301
as obtained by CONTIN deconvolution is plotted in Fig. 2.6. In particular, CONTIN

29
analysis of the measured g2(t) yielded a single-mode relaxation at all conditions. The
peak of the CONTIN relaxation spectrum for each scattering vector, q, and polymer
concentration, c, studied is plotted. The data show negligible dependence on polymer
concentration over the 5 – 50 ppm range studied. Thus, we conclude that these
measurements are indeed performed in the dilute regime, consistent with the measured
overlap concentration for this system, c* = 620 ppm. All further measurements reported
in this paper are in this dilute concentration range.
Interestingly, the power law scaling of the measured relaxation rate Γ with q is not
consistent with center-of-mass diffusion of a single-polymer coil (where Brownian
motion of the entire polymer coil is measured). For a dilute polymer system, in the limit
qRh << 1, Γ = Dq2, where D is the self-diffusion coefficient of the polymer coil22.
Instead, a power law fit to the Fig. 2.6 data yields Γ= 1.47 x 10⁻¹⁸q 2.8± 0.1. The
discrepancy between the theoretical and experimental scaling exponents is significant.
We conclude that the q range of our instrument, 5.94 µm-1 < q < 28.86 µm-1, is not such
that qRh < 1. From published correlations, we predict the single molecule Rh ~ 85 nm for
the PEO studied in Fig. 2.6, a size for which qRh ~ 151 (qRh=0.5 at θ = 20°).
To explain this puzzling result, we recall that the dynamic response of a polymer chain in
the qRh >> 1 limit for the Zimm model in a good solvent is Γ = 0.07kTq3/η, where η is
the viscosity of the solvent, k is the Boltzmann constant and T is the temperature22. The
predicted Γ ~ q3 scaling has been previously observed by Adam and Deslanti for dilute
solutions of very large (Mw = 24 x 106 g/mole) polystyrene molecules in benzene52. The
scaling exponent of three reflects internal fluctuations of the polymer coil with inclusion
of hydrodynamic interactions.
30
Based on these previous observations for large single chains, we hypothesize that the
unusual scaling reported in Fig. 2.6 is due to the effect of internal fluctuations of large
single polymer aggregates. That is, if WSR-301 aggregates to the extent that the Fig. 2.6
measurements are in the regime qRh,agg>> 1, then the scaling of Fig. 2.6 could be
explained by the Zimm model result Γ ~ q3. This hypothesis implicitly assumes that
internal fluctuations of large polymer aggregates and large single polymer chains yield
comparable DLS relaxation spectra. The plausibility of this point is addressed further in
the discussion section.
We now turn to the magnitude of the prefactor, 1.47 x 10⁻¹⁸, determined from Fig. 2.6
The Zimm model theory predicts a prefactor magnitude of 3.24 x 10⁻¹⁹ and 2.77 x 10⁻¹⁹
for a theta and good solvent, respectively (for the viscosity of H2O at T = 298 K). Thus,
although the q3 scaling of Fig. 2.6 agrees well with the aggregate hypothesis, the prefactor
differs significantly from the Zimm theory. This discrepancy is perhaps not unexpected,
since the theory was developed for the dynamics of a single bead-spring chain. This point
is further addressed as well in the discussion section. We determined that other potential
explanations of the Fig. 2.6 results were not consistent with the data. In particular, the
results are not explained by the semi-dilute dynamics of polymer solutions because in the
semi-dilute regime bimodal relaxation behavior is observed22, 53. Moreover, both
relaxation modes in semi-dilute solutions show Γ ~ q2 scaling54, 55. We also considered
the effect of polydispersity. To address this point, we performed DLS of dilute solutions
of a high molar mass monodisperse PEO with Mw~ 1.2 x 10⁶ g/mole. In Fig. 2.7 we
report the DLS relaxation rate at dilute concentrations of monodisperse PEO (Mw = 1.2 x
106 g/mole; 15-150ppm) as obtained by CONTIN deconvolution. The critical overlap
31
concentration measured for this polymer is c* = 2600 ppm (data not shown). The best-fit
relationship to the data in Fig. 2.7 is: Γ = 2.67 x 10⁻¹⁷q2.7±0.1. Thus, we conclude that the
q3 scaling characteristic of internal dynamics is independent of polydispersity. In
addition, it appears that the scaling prefactor is a function of polydispersity and/or molar
mass, since it changes by about a factor of ten as the system is varied from the
polydisperse WSR-301 to the monodisperse polymer with molecular weight of 1.2 x 10⁶
g/mole.
2.4.2 Manipulation of PEO aggregate structure with addition of salt.
We studied the effect of the salts guanidine sulfate (GuS) and magnesium sulfate
(MgSO4) on the DLS relaxation spectra of dilute solutions of aqueous PEO. As in the
case of the salt-free solutions, CONTIN deconvolution showed a single, q-dependent
peak in the decay spectrum. Fig. 2.8 reports the q-dependence of this relaxation rate of a
5ppm solution of WSR-301 (polydisperse; Mw ~ 4 x 10⁶ g/mole) for MgSO4 added at
concentrations of 0.25 M, 0.5 M and 1.0 M. Salt free data from Fig. 2.6 are also plotted
for reference. The figure shows that the relaxation rates scale as a power law for all
MgSO4 concentrations. We find that the magnitude of the scaling exponent
monotonically decreases with salt concentration from 2.8 ± 0.1 for salt free solutions to
1.9 ± 0.1 for 1.0 M MgSO4 additives (errors reported are standard error of the mean of
three replications of the curves).
Earlier we discussed two limiting cases for the DLS relaxation spectrum of dilute
solutions. In the limit qRh<< 1, Γ ~ q2, reflecting center-of-mass diffusion; for qRh >> 1,
Γ ~ q3, reflecting internal coil dynamics. Thus, the likely interpretation of the Fig. 2.8 is
that the addition of salt shifts the DLS relaxation spectrum between these two limits. To
32
yield the shift in limits, addition of salt could destroy the aggregate structure found in
aqueous solution. As the balance between aggregates and single chains shifts, Rh
decreases, and the change in limiting scaling behavior is realized.
A check of this interpretation would be to compute an effective Rh from the diffusive
scaling at high salt concentrations, and assess whether this Rh is consistent with the
expected dimensions of high molar mass PEO. To perform this calculation, we use the
Stokes-Einstein relationship,
€
Rh =kbT6πηD
. Here η is the viscosity of the salt-solution
(measured by capillary viscometry to be 0.00133 Pa-s). By this method, we estimate Rh
~ 290 nm for WSR 301 in 0.5 M MgSO4. This value of Rh is large – corresponding to an
effective molar mass ~ 3 x 10⁷ g/mole, on the boundary of a physically realistic value and
perhaps indicating that PEO in salt solution still comprises some residual aggregate
character. Nevertheless, the key finding is that the addition of salt decreases the effective
size of WSR301 into a range where its center of mass diffusion can be measured by DLS.
To address whether the Fig. 2.8 observations are specific to the particular polymer/salt
pair studied, we performed an additional study with a different polymer (150 ppm
monodisperse PEO with Mw~1.2 x 10⁶ g/mole) and a different salt (GuS). A comparison
of the DLS relaxation spectrum for PEO in salt-free and 0.85 M GuS solution is plotted
in Fig. 2.9. Although both solutions yield only a single relaxation peak, the peaks are
significantly broader for the aqueous solution than for the salt solution. The shift in the
peak location measures the change in polymer fluctuations. The q-dependence of this
change is plotted in Fig. 2.10. The results for this polymer/salt pair are consistent with
Fig. 2.8: the relaxation rate scaling shifts from one indicative of aggregate dynamics (Γ ~
q2.7) to one characteristic of polymer center-of-mass diffusion (Γ ~ q2.0).
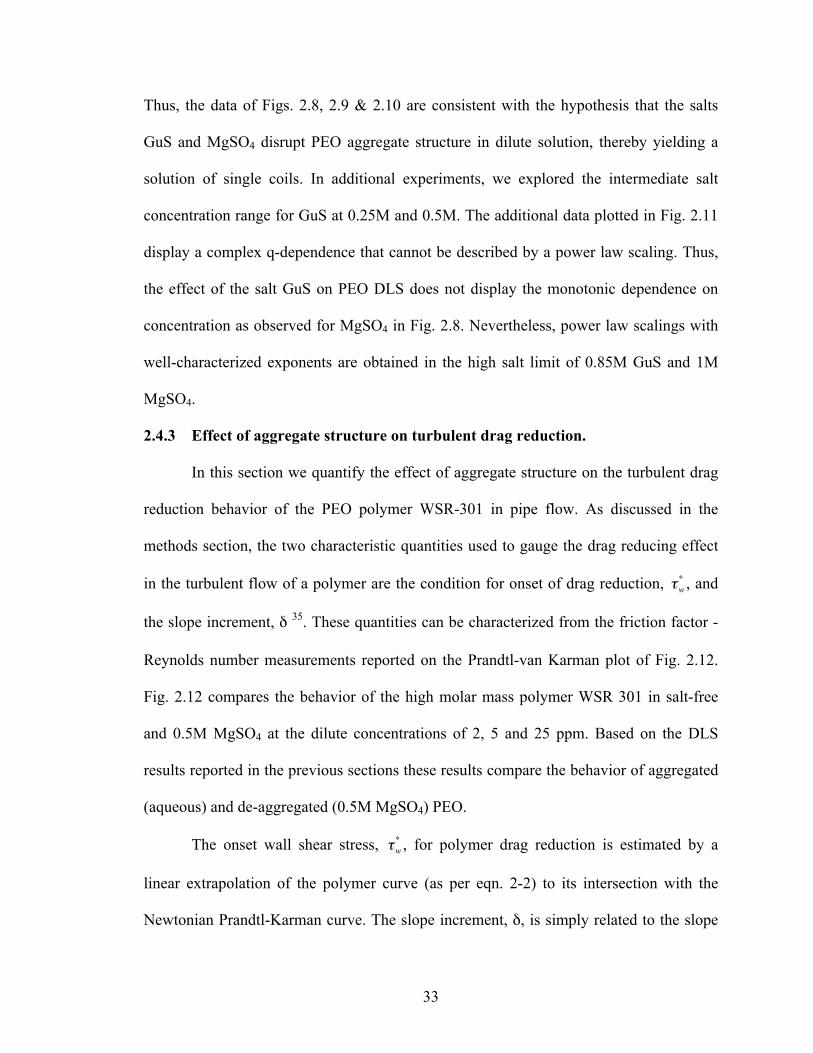
33
Thus, the data of Figs. 2.8, 2.9 & 2.10 are consistent with the hypothesis that the salts
GuS and MgSO4 disrupt PEO aggregate structure in dilute solution, thereby yielding a
solution of single coils. In additional experiments, we explored the intermediate salt
concentration range for GuS at 0.25M and 0.5M. The additional data plotted in Fig. 2.11
display a complex q-dependence that cannot be described by a power law scaling. Thus,
the effect of the salt GuS on PEO DLS does not display the monotonic dependence on
concentration as observed for MgSO4 in Fig. 2.8. Nevertheless, power law scalings with
well-characterized exponents are obtained in the high salt limit of 0.85M GuS and 1M
MgSO4.
2.4.3 Effect of aggregate structure on turbulent drag reduction.
In this section we quantify the effect of aggregate structure on the turbulent drag
reduction behavior of the PEO polymer WSR-301 in pipe flow. As discussed in the
methods section, the two characteristic quantities used to gauge the drag reducing effect
in the turbulent flow of a polymer are the condition for onset of drag reduction,
€
τw* , and
the slope increment, δ 35. These quantities can be characterized from the friction factor -
Reynolds number measurements reported on the Prandtl-van Karman plot of Fig. 2.12.
Fig. 2.12 compares the behavior of the high molar mass polymer WSR 301 in salt-free
and 0.5M MgSO4 at the dilute concentrations of 2, 5 and 25 ppm. Based on the DLS
results reported in the previous sections these results compare the behavior of aggregated
(aqueous) and de-aggregated (0.5M MgSO4) PEO.
The onset wall shear stress,
€
τw* , for polymer drag reduction is estimated by a
linear extrapolation of the polymer curve (as per eqn. 2-2) to its intersection with the
Newtonian Prandtl-Karman curve. The slope increment, δ, is simply related to the slope
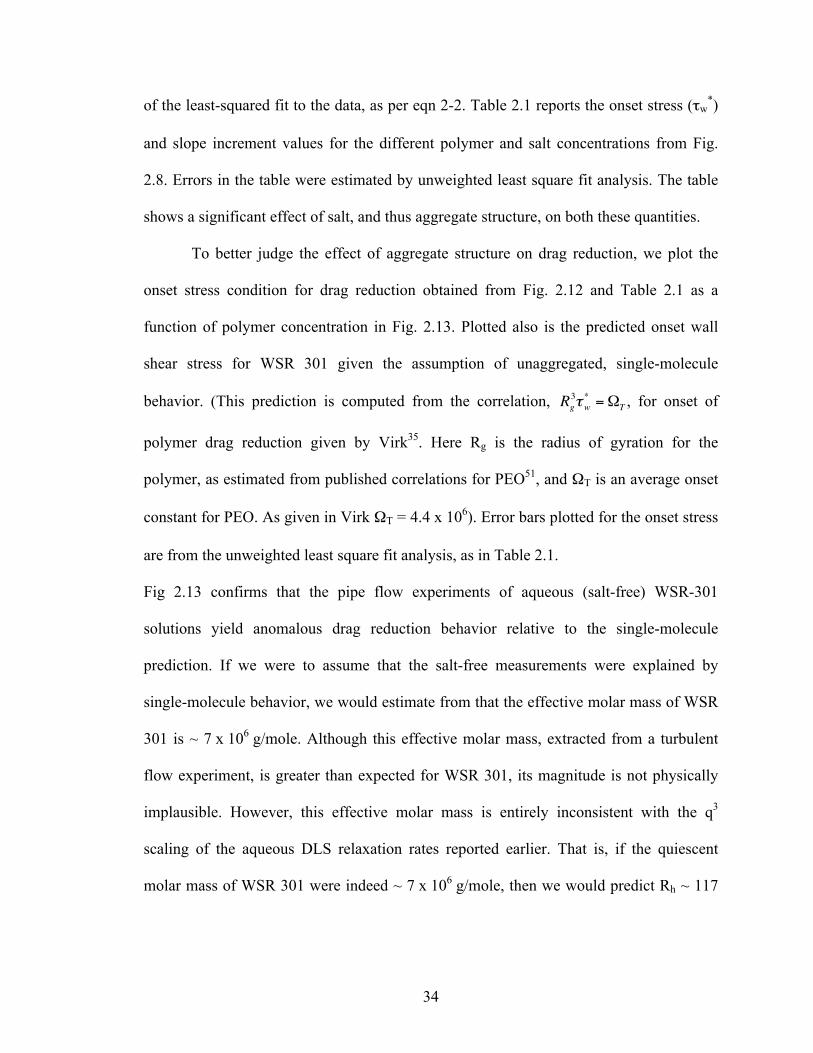
34
of the least-squared fit to the data, as per eqn 2-2. Table 2.1 reports the onset stress (τw*)
and slope increment values for the different polymer and salt concentrations from Fig.
2.8. Errors in the table were estimated by unweighted least square fit analysis. The table
shows a significant effect of salt, and thus aggregate structure, on both these quantities.
To better judge the effect of aggregate structure on drag reduction, we plot the
onset stress condition for drag reduction obtained from Fig. 2.12 and Table 2.1 as a
function of polymer concentration in Fig. 2.13. Plotted also is the predicted onset wall
shear stress for WSR 301 given the assumption of unaggregated, single-molecule
behavior. (This prediction is computed from the correlation,
€
Rg3τw* =ΩT , for onset of
polymer drag reduction given by Virk35. Here Rg is the radius of gyration for the
polymer, as estimated from published correlations for PEO51, and ΩT is an average onset
constant for PEO. As given in Virk ΩT = 4.4 x 10⁶). Error bars plotted for the onset stress
are from the unweighted least square fit analysis, as in Table 2.1.
Fig 2.13 confirms that the pipe flow experiments of aqueous (salt-free) WSR-301
solutions yield anomalous drag reduction behavior relative to the single-molecule
prediction. If we were to assume that the salt-free measurements were explained by
single-molecule behavior, we would estimate from that the effective molar mass of WSR
301 is ~ 7 x 10⁶ g/mole. Although this effective molar mass, extracted from a turbulent
flow experiment, is greater than expected for WSR 301, its magnitude is not physically
implausible. However, this effective molar mass is entirely inconsistent with the q3
scaling of the aqueous DLS relaxation rates reported earlier. That is, if the quiescent
molar mass of WSR 301 were indeed ~ 7 x 10⁶ g/mole, then we would predict Rh ~ 117

35
nm, a value characterizable by DLS, as well as consistent with the observation of a q2
scaling of the polymer relaxation rate, rather than the measured q3 dependence.
The difference between the DLS and turbulent drag reduction data is likely
explained by a role for flow-induced de-aggregation of WSR-301 in the turbulent pipe
flow experiments. If the Re ~104 flow breaks down aggregate structure of quiescently
aggregated solutions, then the effectively single-molecular behavior of Fig. 2.13. is
explained. Because the effect of de-aggregation is apparent in the onset condition, its
effect is already significant in the piping system for flows as weak as τw ~ 0.5 Pa.
Turning to the drag reduction in the 0.5M MgSO4 solutions, we find that the
observed behavior is much closer to the single-molecule prediction. This result is quite
consistent with the molecular scale DLS measurements. Could the observed shift in the
onset stress for WSR 301 be explained by a change in solvent quality from good (salt
free) to theta (0.5M MgSO4), as supposed to a change in the aggregate structure as
suggested by the light scattering measurements? To address this possibility, consider the
following analysis:
From the Zimm bead spring theory for single polymer chains, the relaxation time
€
λ ~ [η]ηsM RT , where ηs is the solvent viscosity, R is the ideal gas constant, T is the
absolute temperature and [η] is the intrinsic viscosity of the polymer. In a good solvent
system, [η] ~Mw0.8 and for a theta solvent, [η] ~Mw
0.5 (from Mark-Houwink equation)56.
Based on the critical Weissenberg number, Wi*57-59, for onset of polymer drag reduction
given by Virk 35,
€
Wi* =λτw
*
µ, we estimate
€
τw,T*
τw,G* , where the subscripts T and G indicate a
theta (PEO-0.5M MgSO4) and good solvent (PEO-salt free) respectively. We compute
this ratio to be 1.5, which is less than the experimentally observed ratio of 2.5. Thus, we

36
conclude the differences in Fig. 2.13 are not simply a consequence of solvent quality
effects.
Furthermore, the measured slope increments, δ, for both the aqueous polymer and
polymer-salt case in our studies have approximately a square root dependence with
concentration, which is consistent with Virk’s results (based on analysis not shown of the
Table 2.1 results). The slope increments observed in the salt case are considerably lower
than observed in the aqueous polymer case.
Thus, we conclude that addition of salt modulates the aggregate structure of
WSR-301. This modulation is directly correlated to the drag reduction behavior of WSR-
301. By linking molecular and macro scale observations, the combination of turbulent
drag reduction data (Figs. 2.12 and 2.13) and DLS characterization of the polymer
solutions (Figs. 2.6 -2.11) establishes that aggregate structure plays a significant role in
the turbulent drag reduction of high molar mass PEO.
2.5 Discussion
The principal result of the DLS studies is that the effective size of high molar mass PEO
in aqueous solution is too large for center of mass diffusion to be probed in a wide-angle
light scattering device. The scaling of the relaxation rate, Γ, with q3 observed is
reminiscent of the pioneering work of Adam and Deslanti52, in which internal
fluctuations of a large polystyrene chain were probed in benzene. Because the bare
hydrodynamic radius of a single molecule of WSR 301 PEO is too small to yield the
result Γ~ q3 by itself, we propose that the scaling is due to the effects of aggregation.
However, this hypothesis raises a number of questions. For example, Γ ~ q3 is a
prediction of the Zimm model for internal coil motions52 – it is valid for a Gaussian chain

37
with hydrodynamic interactions. How good is the hypothesized analogy between a large
aggregate and single polymer coil? To address this question, we plot in Fig. 2.14 the
theoretical curve Γ = 0.07kTq3/η for the Zimm model along with the dilute, aqueous PEO
data. (These data are as Fig. 2.6 and Fig 2.7; however, they are now replotted as Γ/q2 to
emphasize the deviation from center-of-mass diffusion, which would appear as a
horizontal line in the figure.) It is clear from Fig. 2.14 that the PEO relaxation rate data
obeys the correct scaling as the internal fluctuation theory but falls below the predicted
curve. This discrepancy in prefactor depends on the details of the polymer – we observe a
different prefactor for the polydisperse, high molar mass WSR 301 (A = 1.47 x 10⁻¹⁸)
than for the monodisperse polymer of 1.2M molar mass (A = 2.67 x 10⁻¹⁷). To our
knowledge there is as yet no theory or simulation of dilute aggregate dynamics that
would explain the correspondence between our measurements and those of Adam and
Deslanti52. Yet, the correspondence is reasonable: Just as in a single Gaussian coil, for
which the dynamics of the two chain ends contribute negligibly to the internal q3
dynamics, so would the contacts between the multiple PEO molecules in an aggregated
cluster be expected to negligibly affect internal dynamics. Then, because the Zimm
model scaling is independent of molar mass, dilute aggregate high q dynamics would be
similar to the single molecule prediction.
In considering the results of Fig. 2.6 & 2.7, we note that our measurements appear
to disagree with previous DLS studies of dilute PEO dynamics. These previous studies
have reported observation of two relaxation rates, both of which scaled as q2 16, 21, 60. In
the present study a single dominant relaxation rate scaling as q3 is observed. Can these

38
different data sets be reconciled? One difference in the studies is the concentration.
Although all these studies are dilute (c<c*), the earlier work of Duval et al (c/c*>0.1) as
well as Ho et al (c/c*>0.3) are at greater concentration than our work (for which 0.001 <
c/c* <0.08). Moreover, Polverari et al observed two peaks in their PEO DLS relaxation
spectrum above a molecular weight dependent critical self-association concentration. If
the self-association that leads to aggregation is viewed as a phase separation (akin to a
micellization transition) in which single chains are in equilibrium with aggregate clusters,
it seems likely that the ultra-dilute concentrations of this study render the concentration
of single chains so small as to be undetectable by DLS. Thus, the observation of single
relaxation behavior here is not inconsistent with the earlier studies, but instead is
explained by the ultra-dilute concentration range studied. (Recall that these ultra-dilute
concentrations are exactly the ones of interest for applications such as turbulent drag
reduction.)
To further test this explanation, we performed DLS experiments at a higher, but
still dilute, concentration (100 ppm WSR 301: c/c* = 0.16). We observed two peaks in
the DLS relaxation spectrum. Thus, we conclude that at ultra-low concentrations (c/c* <
0.1), PEO quiescent dynamics is dominated by the behavior of aggregate clusters.
Although the quiescent dynamics of high molar mass PEO is dominated by the
effect of polymer aggregates, the analysis of the drag reduction measurements of Fig.
2.13 also supports a role for flow-induced de-aggregation in turbulent flow. For example,
although the shift in drag reduction onset condition (and therefore viscoelastic relaxation
time) upon addition of MgSO4 is too great to be explained as a simple effect of solvent
quality, the apparent molar mass for WSR-301 extracted by application of Virk’s well-

39
established phenomenology is ~ 7 x 10⁶ g/mole, a number that is reasonably explained by
single-molecule ideas. A probable explanation of the difference between the quiescent
DLS and the turbulent results is the effect of flow-induced degradation. Here two
possibilities should be considered. The first is single-chain scission due to covalent bond
breakage. The second is PEO aggregate degradation due to rupture of intermolecular
associations mediated by, for example, hydrogen bonding61.
Polymer chain scission is typically apparent in Prandtl-van Karman plots such as
Fig. 2.12 as deviation at high Ref0.5 from eqn. (2-2). The deviation results in a maximum
in f-0.5 with further decline as Ref0.5 increases48,62. Furthermore, the onset of these
deviations can be quantitatively predicted by the Kolmogorov cascade theory of turbulent
chain scission by Vanapalli et al63. By considering these two effects below, we conclude
that the measurements here are not affected by single chain scission.
First, we observe no deviation from eqn (2-2) in the Prandtl-Karman plots (Fig.
2.5 and Fig. 2.12). Indeed, Vanapalli et al have shown that for PEO with mean molar
mass of about 4 x 10⁶ g/mole, polymer scission affects the drag reduction curves only for
€
Re f( ) values greater than ~ 100048, much larger than the values probed in this study.
Second, application of the Kolmogorov cascade scission theory given the covalent bond
strength of PEO (~ 4.1 nN63) yields an expected onset of covalent scission for
€
Re f( ) ~
2300, well above the range of our measurements. This estimate is given by
€
Fmax ~πµ 2 Re
32 L2
4ρd2 ln L a( ) where Fmax = 4.1nN, µ is the viscosity, Re is the Reynolds number,
ρ is the fluid density, d is a characteristic geometric dimension of the flow, a is a
characteristic radius of the polymer chain and L is the contour length of the polymer

40
chain63. Thus, we also conclude that the 7 x 10⁶ g/mole estimate of the effective molar
mass of PEO in the drag reduction experiment is not a consequence of polymer chain
scission. Instead, the quiescent aggregate structure quantified by the DLS does not appear
to fully survive the turbulent flow.
Even though some flow-induced de-aggregation is observed, because the addition
of salt significantly reduces the measured turbulent drag reduction in a way that cannot be
explained by simple solvent effects, we conclude that the differences in Figs. 2.12 and
2.13 are due to the effect of salt on residual aggregate structure. If the aggregate
hypothesis is correct, can we estimate from these data a lower bound on the size of the
PEO aggregates studied? This question is addressed by Fig. 2.15, which plots
schematically the transition from low q to high q behavior that would be observed for
different aggregate sizes. The DLS data reported in Fig. 2.6 & 2.7 must fall on the right
hand side of Fig. 2.15. What size range is consistent with the qRh >> 1 constraint and the
q-range of our instrument? For guidance, we return to the earlier work of Adam and
Delsanti52, who found q3 scaling for measurements on single chains provided qRg > 4.4.
If we apply this constraint, we conclude that a lower bound for Rg,agg ~ 740 nm for the
polymers studied here. Improving this estimate should be a principal aim of future work.
We conclude the discussion by suggesting a way in which small-angle dynamic
light scattering64 could be applied to definitively characterize the size of PEO aggregates
at ultra-dilute conditions. As discussed earlier, the dynamic response of a dilute polymer
solution can be divided into different regimes based on the magnitude of the
dimensionless scale qRh, where Rh is the hydrodynamic radius of the polymer and q is the
scattering wave vector, as schematically plotted in Fig 2.15. In a sufficiently small q

41
limit, the dynamic light scattering spectra of dilute PEO solutions should be consistent
with centre of mass diffusion of multi-molecule aggregates with an effective
hydrodynamic radius that is many times greater than the hydrodynamic response of a
single molecule of PEO. In the high q limit internal dynamics are probed, as per Fig. 2.6
& 2.7. The transition between the two dynamical regimes occurs at qRagg ~ 1. Given
estimates from this study, Ragg could be as large as 740 nm. Thus a DLS device that can
probe q << 1.33 µm-1 is required, corresponding to θ << 6°. Such small-angle DLS
instruments have recently become available64, 65.
2.6 Conclusions
This work addresses the problem of PEO aggregation in aqueous solution by building
upon the earlier work of Polverari et al, Hammouda et al, and Liberatore et al 16, 19, 25, 39,
40. The current study uses a unique chaotropic/inorganic salt and simultaneous dynamic
light scattering/fluid dynamics methodology to study dilute PEO aggregate flow
properties. We find:
1) The DLS relaxation spectra of high molar mass dilute aqueous PEO solutions show a
single peak that scales as Γ~ q3, where Γ is the relaxation rate and q is the scattering
vector. This scaling is consistent with DLS detection of internal fluctuations of a
polymer aggregate of size at least 740 nm.
2) Addition of an inorganic (MgSO4) or chaotropic salt (GuS) decreases the power law
scaling of the relaxation rate scaling from q3 to q2. This shift from a scaling indicative of
aggregate dynamics (Γ ~ q3) to one characteristic of polymer center-of-mass diffusion
(Γ ~ q2) shows that these salts are effective de-aggregation agents for PEO.

42
3) The DLS results are predictive of the behavior of PEO in turbulent flow. Addition of
MgSO4 significantly decreases the effectiveness of PEO as a drag reduction agent. The
effect is greater than can be explained by single molecular solvent quality effects. The
level of drag reduction observed when compared to the DLS measurements suggests that
turbulent flow de-aggregates high molar mass PEO, even in mild flow systems with shear
stresses ~ 0.5 Pa.
These results improve our fundamental understanding of the behavior of dilute solutions
of high molar mass PEO by placing bounds on the size of quiescent aggregates, by
demonstrating the effect of salt on aggregate structure and by linking aggregate structure
to flow behavior of PEO.

43
Figure 2.1: Quiescent rheological characterization of aqueous PEO WSR-301 (Mw~ 4 x 10⁶ g/mole) at T=250 C in a 20 60 mm cone and plate geometry. The viscosity, η, is plotted for a series of PEO concentrations (500-8000 ppm) as a function of shear rate,
€
γ.. The dashed curves are best fits to the data for the FENE-P constitutive
equation with η s= 0.001 Pa-sec and L2=1000.

44
Figure 2.2: Concentration dependence of the viscoelastic relaxation time (ms) of WSR-301 from FENE-P curve fits for the experimental data from Fig. 2.1 at various concentrations. The horizontal line is the dilute solution prediction by Zimm theory.
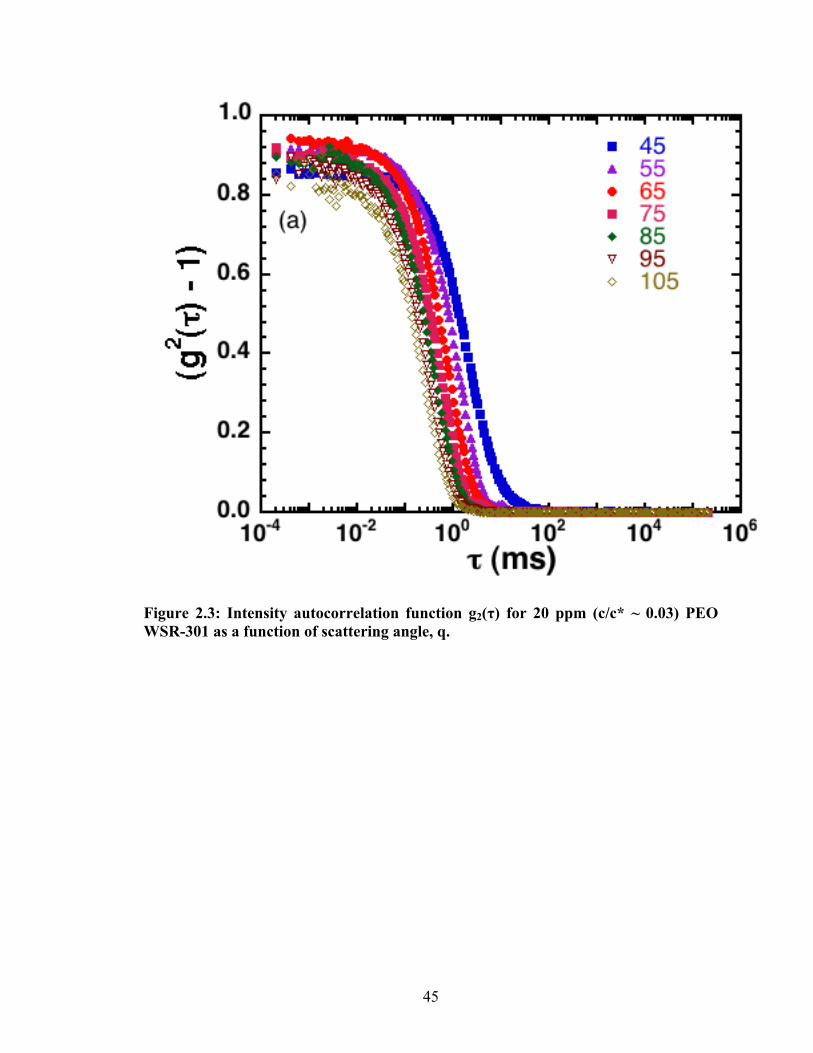
45
Figure 2.3: Intensity autocorrelation function g2(τ) for 20 ppm (c/c* ~ 0.03) PEO WSR-301 as a function of scattering angle, q.
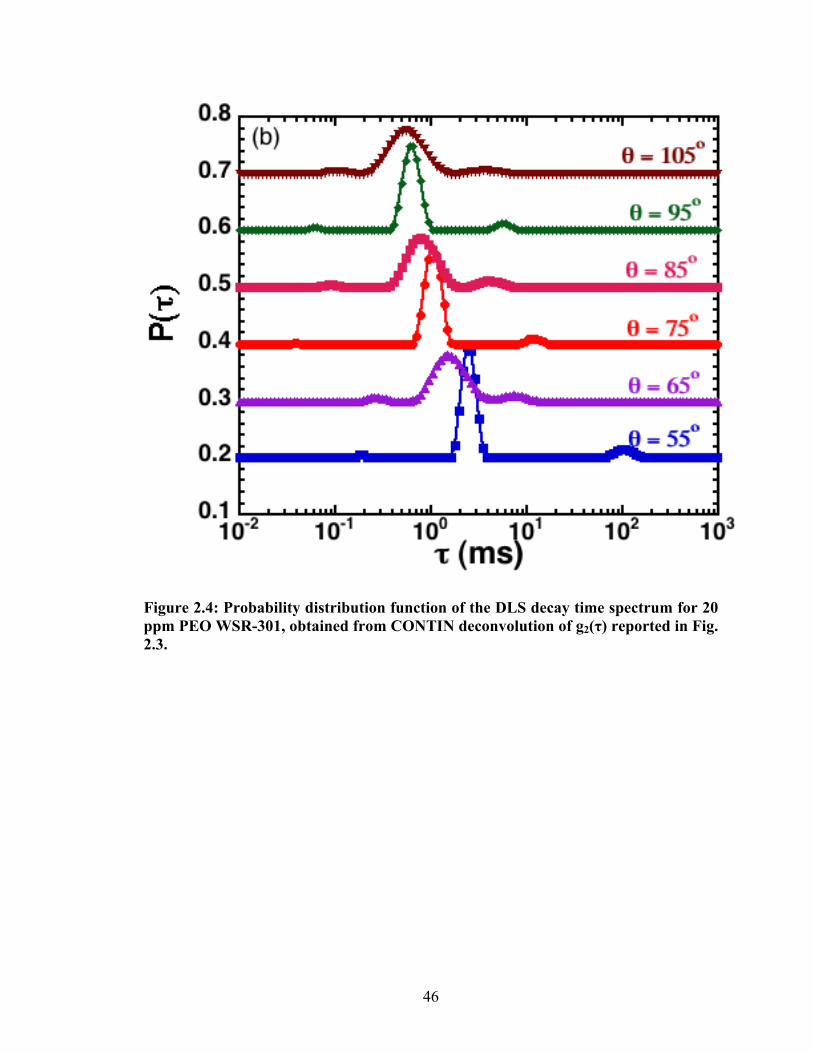
46
Figure 2.4: Probability distribution function of the DLS decay time spectrum for 20 ppm PEO WSR-301, obtained from CONTIN deconvolution of g2(τ) reported in Fig. 2.3.
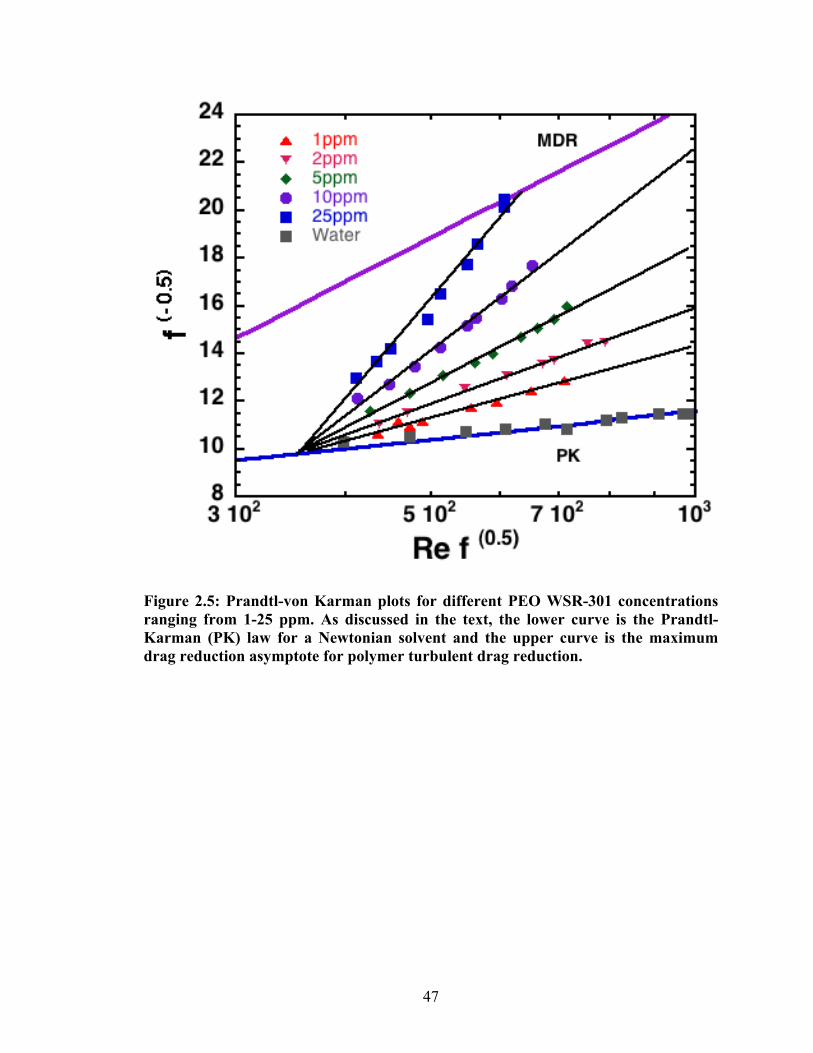
47
Figure 2.5: Prandtl-von Karman plots for different PEO WSR-301 concentrations ranging from 1-25 ppm. As discussed in the text, the lower curve is the Prandtl-Karman (PK) law for a Newtonian solvent and the upper curve is the maximum drag reduction asymptote for polymer turbulent drag reduction.

48
Figure 2.6: Peak relaxation rate, Γ, from CONTIN deconvolution as a function of the scattering vector q for different dilute concentrations (5-50 ppm) of PEO WSR-301.

49
Figure 2.7: Peak relaxation rate, Γ, from CONTIN deconvolution as a function of the scattering vector q for different dilute concentrations (15-150ppm) of monodisperse PEO-1182K (Mw ~ 1.2 x 10⁶ g/mole, Mw/Mn~1.12).

50
Figure 2.8: The effect of MgSO4 concentration on the q-dependence of the peak relaxation rate Γ at 5 ppm for PEO WSR-301.

51
Figure 2.9: Comparison of the DLS decay time spectrum for 150 ppm monodispersed PEO-1182K (Mw ~ 1.2 x 10⁶ g/mole, Mw/Mn~1.12) in deionized water (aqueous) and with guanidine sulfate salt (0.85M GuS) at different scattering angles.

52
Figure 2.10: Peak decay relaxation rate, Γ, as a function of q for the deionized water (aqueous) and guanidine sulfate salt (0.85M GuS) case (150 ppm monodisperse PEO-1182K).

53
Figure 2.11: Effect of guanidine sulfate salt (GuS) concentration and 1M magnesium sulfate (MgSO4) on the q-dependence of Γ for monodisperse aqueous PEO-1182K (150 ppm).
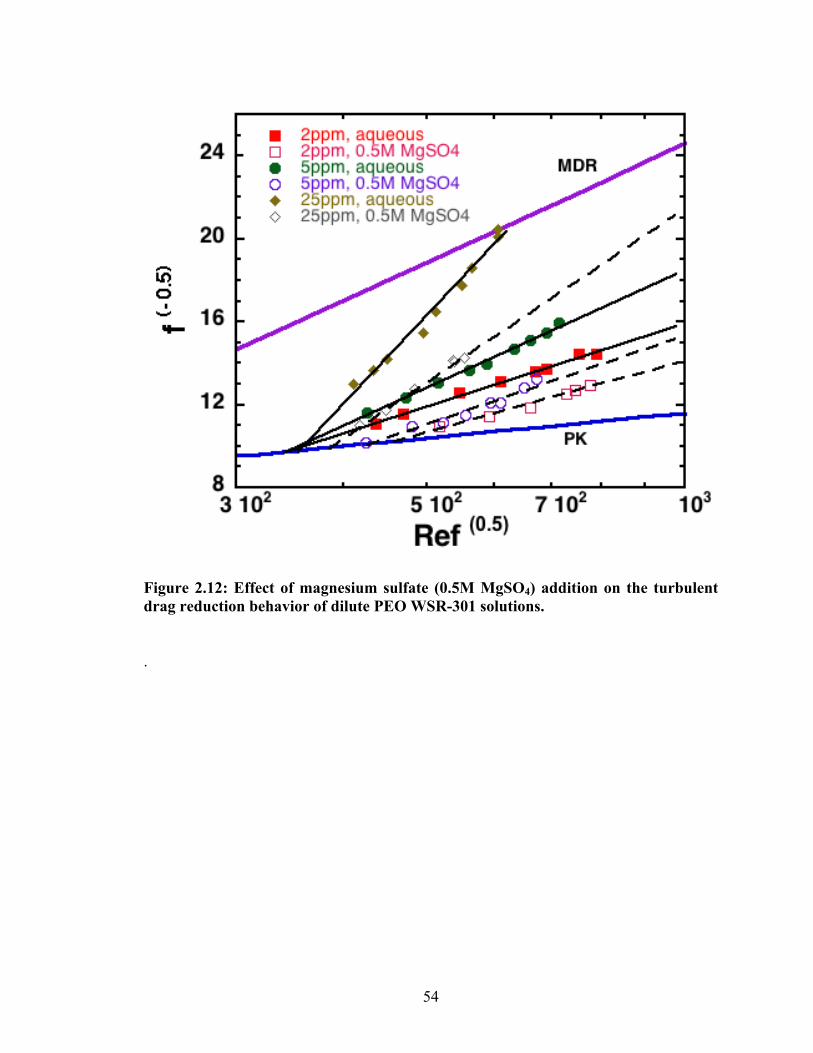
54
Figure 2.12: Effect of magnesium sulfate (0.5M MgSO4) addition on the turbulent drag reduction behavior of dilute PEO WSR-301 solutions.
.

55
Figure 2.13: Comparison of the onset wall shear stress for turbulent drag reduction, τw*, for WSR 301 with 0.5 M MgSO4 and in pure aqueous solution. The horizontal line is the onset stress prediction given by Virk for PEO, based on single molecule physics, computed as discussed in the text.

56
Figure 2.14: Summary of DLS results, plotted as Γ/q2 to emphasize the deviation from center-of-mass diffusion, for the two polymers and salts studied. The curve is the theoretical prediction for a Gaussian coil52.
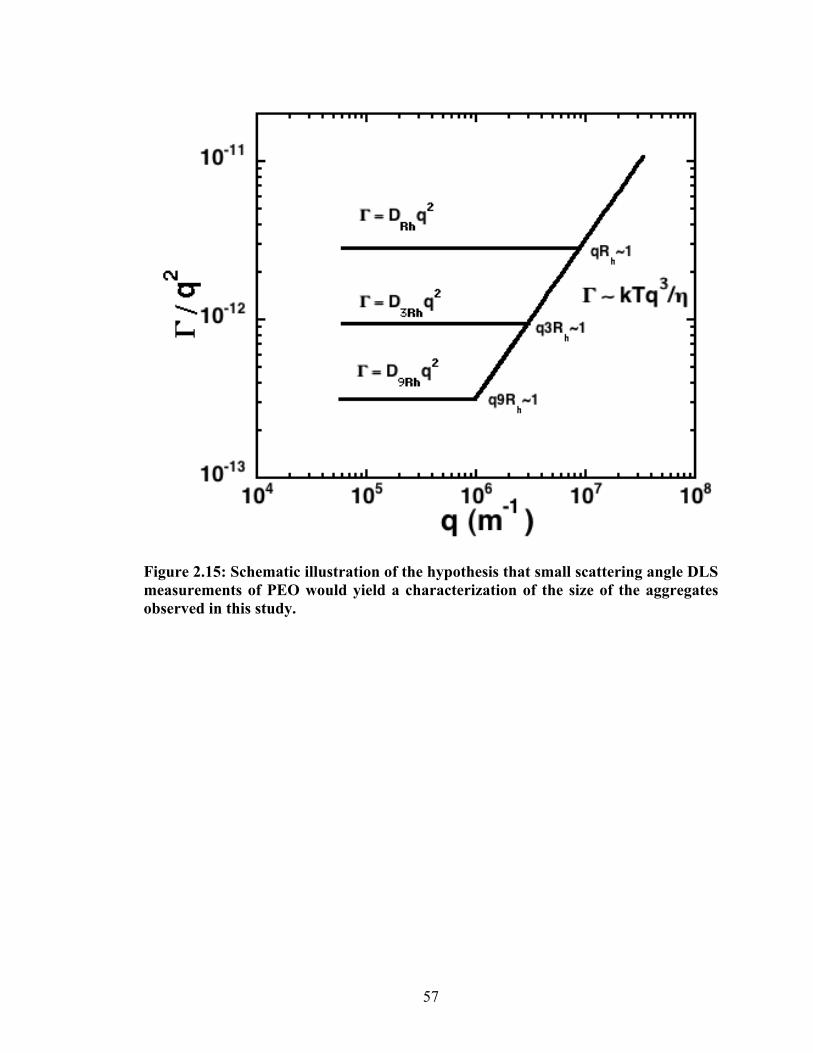
57
Figure 2.15: Schematic illustration of the hypothesis that small scattering angle DLS measurements of PEO would yield a characterization of the size of the aggregates observed in this study.

58
Concentration (ppm)
WSR-301
Onset Stress,
τw*
(Aqueous)
Onset Stress,
τw*
(0.5 M
MgSO4)
Slope
increment, δ
(Aqueous)
Slope
increment, δ
(0.5 M
MgSO4)
1 0.54±0.15 1.34±0.15 9.9 8.4
2 0.52±0.14 1.53±0.18 13.4 11.4
5 0.52±0.16 1.39±0.33 19 14.6
10 0.53±0.3 1.03±0.14 28.1 18.2
25 0.53±0.24 1.08±0.18 44 28
Table 2.1: Onset stress (τw*) and slope increment (δ) values obtained from drag reduction measurements for the different polymer and salt concentrations used in the study. .

59
2.7 References
1. Baghdadi, H. A.; Sardinha, H.; Bhatia, S. R. Journal of Polymer Science Part B-Polymer Physics 2005, 43, (2), 233-240.
2. Morgan, S. E.; McCormick, C. L. Progress in Polymer Science 1990, 15, (1), 103-145.
3. Gil, E. S.; Hudson, S. A. Progress in Polymer Science 2004, 29, (12), 1173-1222.
4. Figueredo, R. C. R.; Sabadini, E. Colloids and Surfaces a-Physicochemical and Engineering Aspects 2003, 215, (1-3), 77-86.
5. Kauser, N.; Dos Santos, L.; Delgado, M.; Muller, A. J.; Saez, A. E. Journal of Applied Polymer Science 1999, 72, (6), 783-795.
6. Rodriguez, S.; Romero, C.; Sargenti, M. L.; Muller, A. J.; Saez, A. E.; Odell, J. A. Journal of Non-Newtonian Fluid Mechanics 1993, 49, (1), 63-85.
7. Addai-Mensah, J.; Yeap, K. Y.; McFarlane, A. J. Powder Technology 2007, 179, (1-2), 79-83.
8. Toryanik, A. I. Journal of Structural Chemistry 1984, 25, (3), 385-388.
9. Dormidontova, E. E. Macromolecules 2002, 35, (3), 987-1001.
10. Straziel.C. Makromolekulare Chemie-Macromolecular Chemistry and Physics 1968, 119, (DEC), 50-63.
11. Saeki, S.; Kuwahara, N.; Nakata, M.; Kaneko, M. Polymer 1976, 17, (8), 685-689.
12. Malcolm, G. N.; Rowlinson, J. S. Transactions of the Faraday Society 1957, 53, (7), 921-931.
13. Dormidontova, E. E. Macromolecules 2004, 37, (20), 7747-7761.
14. Smith, G. D.; Bedrov, D.; Borodin, O. Physical Review Letters 2000, 85, (26), 5583.
15. Tasaki, K. Journal of the American Chemical Society 1996, 118, (35), 8459-8469.
16. Polverari, M.; vandeVen, T. G. M. Journal of Physical Chemistry 1996, 100, (32), 13687-13695.
17. Kalashnikov, V. N. Journal of Polymer Science Part B-Polymer Physics 1999, 37, (22), 3208-3216.
18. Cunibert.C; Ferrando, R. Polymer 1972, 13, (8), 379-382.
19. Hammouda, B.; Ho, D.; Kline, S. Macromolecules 2002, 35, (22), 8578-8585.

60
20. Cuniberti, C. Polymer 1975, 16, (4), 306-307.
21. Duval, M.; Sarazin, D. Polymer 2000, 41, (7), 2711-2716.
22. Berne, B. J.; Pecora, R., Dynamic Light Scattering. J Wiley, New York: 1976.
23. Polik, W. F.; Burchard, W. Macromolecules 1983, 16, (6), 978-982.
24. McIntyre, D.; Gornick, F., Light scattering from dilute polymer solutions. Gordon and Breach Science publishers, New York: 1964.
25. Hammouda, B.; Ho, D. L.; Kline, S. Macromolecules 2004, 37, (18), 6932-6937.
26. Vlassopoulos, D.; Schowalter, W. R. Journal of Rheology 1994, 38, (5), 1427-1446.
27. Kalashnikov, V. N. Journal of Rheology 1994, 38, (5), 1385-1403.
28. Tirtaatmadja, V.; McKinley, G. H.; Cooper-White, J. J. Physics of Fluids 2006, 18, (4), 043101.
29. Purnode, B.; Crochet, M. J. Journal of Non-Newtonian Fluid Mechanics 1998, 77, (1-2), 1-20.
30. Choi, H. J.; Jhon, M. S. Industrial & Engineering Chemistry Research 1996, 35, (9), 2993-2998.
31. Berman, N. S. Annual Review of Fluid Mechanics 1978, 10, 47-64.
32. Berman, N. S. Physics of Fluids 1977, 20, (5), 715-718.
33. White, C. M.; Mungal, M. G. Annual Review of Fluid Mechanics 2008, 40, 235-256.
34. Larson, R. G. Journal of Rheology 2005, 49, (1), 1-70.
35. Virk, P. S. Aiche Journal 1975, 21, (4), 625-656.
36. Dunlop, E. H.; Cox, L. R. Physics of Fluids 1977, 20, (10), S203-S213.
37. Vlachogiannis, M.; Liberatore, M. W.; McHugh, A. J.; Hanratty, T. J. Physics of Fluids 2003, 15, (12), 3786-3794.
38. Liberatore, M. W.; Baik, S.; McHugh, A. J.; Hanratty, T. J. Journal of Non-Newtonian Fluid Mechanics 2004, 123, (2-3), 175-183.
39. Liberatore, M. W.; Pollauf, E. J.; McHugh, A. J. Journal of Non-Newtonian Fluid Mechanics 2003, 113, (2-3), 193-208.
40. Liberatore, M. W.; McHugh, A. J. Journal of Non-Newtonian Fluid Mechanics 2005, 132, (1-3), 45-52.

61
41. Shin, M.; Shaqfeh, E. S. G. Centre for Turbulence Research: Annual Research Briefs 2005, 389.
42. Little, R. C. Journal of Applied Polymer Science 1971, 15, (12), 3117-3125.
43. Little, R. C.; Patterso.Rl. Journal of Applied Polymer Science 1974, 18, (5), 1529-1539.
44. Yuan, G. C.; Wang, X. H.; Han, C. C.; Wu, C. Macromolecules 2006, 39, (18), 6207-6209.
45. Lim, S. T.; Hong, C. H.; Choi, H. J.; Lai, P. Y.; Chan, C. K. Epl 2007, 80, (5).
46. Boom, R.; Sol, C. J. A.; Salimans, M. M. M.; Jansen, C. L.; Wertheimvandillen, P. M. E.; Vandernoordaa, J. Journal of Clinical Microbiology 1990, 28, (3), 495-503.
47. Provencher, S. W. Computer Physics Communications 1982, 27, (3), 229-242.
48. Vanapalli, S. A.; Islam, M. T.; Solomon, M. J. Physics of Fluids 2005, 17, (9), 095108.
49. Draad, A. A.; Kuiken, G. D. C.; Nieuwstadt, F. T. M. Journal of Fluid Mechanics 1998, 377, 267-312.
50. McKeon, B. J.; Smits, A. J. Measurement Science & Technology 2002, 13, (10), 1608-1614.
51. Devanand, K.; Selser, J. C. Macromolecules 1991, 24, (22), 5943-5947.
52. Adam, M.; Delsanti, M. Macromolecules 1977, 10, (6), 1229-1237.
53. Sun, T.; King, H. E. Macromolecules 1996, 29, (9), 3175-3181.
54. Amis, E. J.; Han, C. C. Polymer 1982, 23, (10), 1403-1406.
55. Eisele, M.; Burchard, W. Macromolecules 1984, 17, (8), 1636-1638.
56. Rubinstein, M.; Colby, R. H., Polymer Physics. Oxford University Press: 2004.
57. Sureshkumar, R.; Beris, A. N.; Handler, R. A. Physics of Fluids 1997, 9, (3), 743-755.
58. Sreenivasan, K. R.; White, C. M. Journal of Fluid Mechanics 2000, 409, 149-164.
59. Dimitropoulos, C. D.; Sureshkumar, R.; Beris, A. N. Journal of Non-Newtonian Fluid Mechanics 1998, 79, (2-3), 433-468.
60. Ho, D. L.; Hammouda, B.; Kline, S. R. Journal of Polymer Science Part B-Polymer Physics 2003, 41, (1), 135-138.
61. Horn, A. F. Nature 1984, 312, (5990), 140-141.
62
62. Elbing, B. R.; Winkel, E. S.; Solomon, M. J.; Ceccio, S. L. Experiments in Fluids 2008, 47, (6), 1033-1044.
63. Vanapalli, S. A.; Ceccio, S. L.; Solomon, M. J. Proceedings of the National Academy of Sciences of the United States of America 2006, 103, (45), 16660-16665.
64. Cipelletti, L.; Weitz, D. A. Review of Scientific Instruments 1999, 70, (8), 3214-3221.
65. Ferri, F. Review of Scientific Instruments 1997, 68, (6), 2265-2274.
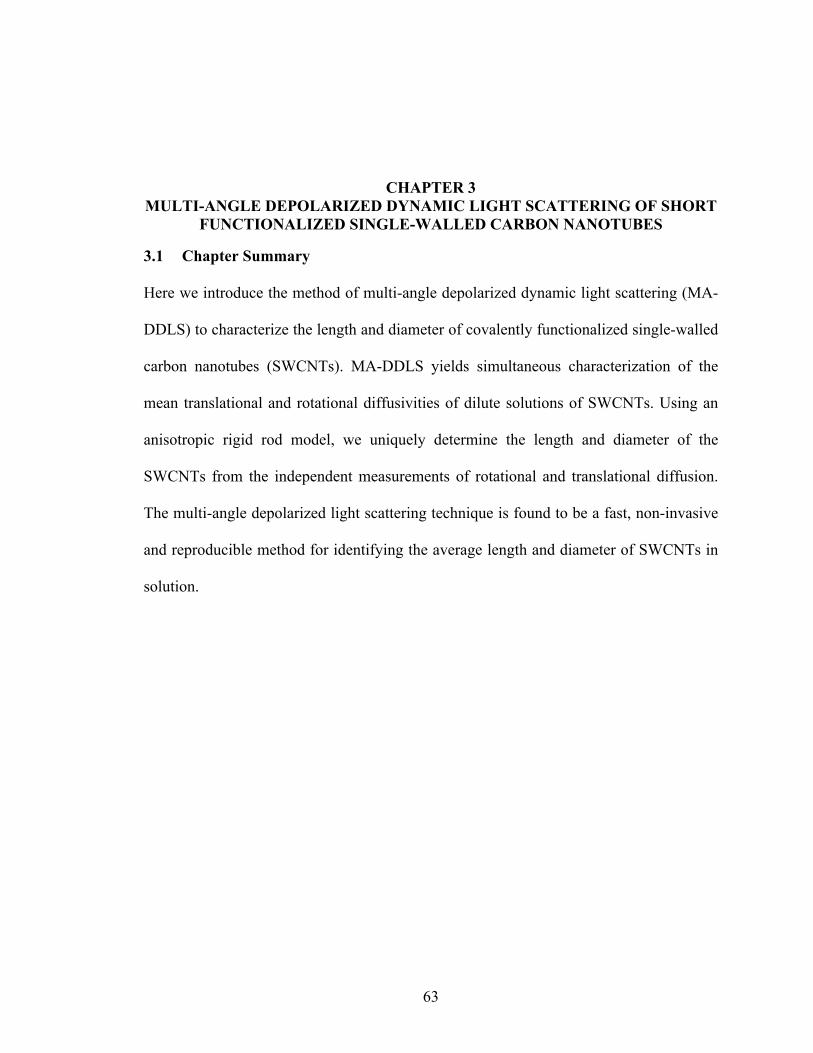
63
CHAPTER 3 MULTI-ANGLE DEPOLARIZED DYNAMIC LIGHT SCATTERING OF SHORT
FUNCTIONALIZED SINGLE-WALLED CARBON NANOTUBES
3.1 Chapter Summary
Here we introduce the method of multi-angle depolarized dynamic light scattering (MA-
DDLS) to characterize the length and diameter of covalently functionalized single-walled
carbon nanotubes (SWCNTs). MA-DDLS yields simultaneous characterization of the
mean translational and rotational diffusivities of dilute solutions of SWCNTs. Using an
anisotropic rigid rod model, we uniquely determine the length and diameter of the
SWCNTs from the independent measurements of rotational and translational diffusion.
The multi-angle depolarized light scattering technique is found to be a fast, non-invasive
and reproducible method for identifying the average length and diameter of SWCNTs in
solution.

64
3.2 Introduction
Carbon nanotubes (CNTs) have attracted tremendous attention over the past decade due
to their potential applications in areas ranging from sensors1-5, coatings6-8, molecular
nanoelectronic devices9, 10, reinforced composite materials11 and heat transfer media12, 13
to biological applications like drug delivery14, molecular markers15 and probes16. Steps
necessary for such applications, including processing and purification of carbon
nanotubes (CNTs), as well as final device fabrication/assembly often involve the
dispersion or solubilization of CNTs in a variety of solvents17. Most often, applications
demand the control of length and diameter of nanotubes as they are critical for the wide
tuning of electrical18, mechanical11 and optical properties19 of CNTs. In addition,
dimensions of nanotubes are critical in predicting the phase behavior and rheology of
CNTs in suspensions20. Thus, many applications rely on the effective dispersion of CNTs
in solution as well as the knowledge of the dimensions of the CNTs at any given state of
dispersion20.
The morphology and microscopic structure of CNTs in solution has been studied by
various techniques including small angle neutron scattering21-26, small angle light
scattering27, 28, ultra small angle X-ray scattering21, 27, 28 and size exclusion
chromotagraphy29 but there are few techniques which are able to characterize the
dimensions of the constituent nanotubes themselves. Currently, direct imaging techniques
like transmission electron microscopy (TEM) and atomic force microscopy (AFM) are
most commonly used to characterize the average dimensions of carbon nanotubes30, 31.
Although these measurements are broadly successful, they suffer from certain
disadvantages. First, AFM and TEM are ex-situ; a droplet of the CNT solution is dried

65
typically on a silicon surface or a TEM grid and then imaged. The results obtained thus
do not necessarily reflect the in situ morphology and state of aggregation of tubes in
solution. In particular, aggregation of the CNTs32 could cause difficulty in imaging
individual tubes. Second, there is a strong possibility of interaction between the sample
and the substrate (grid) that can affect aggregation and resolvability. Third, the sample
volume that can be probed by TEM or AFM is relatively small. Thus, multiple images are
required to generate the good statistics necessary to measure average CNT dimensions.
Further, microscopy methods require significant time for characterization with often
requiring extensive sample preparation. (For example, imaging 200-2000 rods of a
nanotube sample by AFM might require as many as 8-10 hours of instrument time33.)
In addition to direct imaging methods like microscopy, recently, Parra-Vasquez and
coworkers introduced a viscosity-based method for the determination of the length of
dilute single walled carbon nanotube (SWCNT) suspensions33. Their method relies on
analysis of the zero shear viscosities of the SWCNT dispersions. General application of
this method in dilute systems requires precise measurement of dispersion viscosities that
are only a few percent more than the solvent viscosity34. Recently, Badaire et al. showed
that depolarized dynamic light scattering (DDLS) performed at a single angle could be
used to identify the dimensions of carbon nanotubes35. The data analysis procedure,
involving non-linear fitting of a 3-parameter model, complicates the wide applicability of
this method.
In this chapter we introduce a simple and fast method based on DDLS performed at
multiple scattering angles (MA-DDLS) to characterize the mean length and diameter of
functionalized SWCNTs dispersed in solution. Since the rotational and translational

66
diffusion display different functional dependencies on rod length and diameter, CNT
dimensions can be uniquely determined from these two measurements. The technique
provides independent characterization of the rotational and translational diffusion of
aqueous dispersions of SWCNTs without the computational complexity of single
scattering angle measurements. The method is of broad interest because it reduces the
need to perform time-consuming microscopy methods like TEM or AFM. It also yields
the dimensions of SWCNTs in solution without the complicating affects of drying and
adsorption. This method could be coupled with size exclusion based separation methods
designed to fractionate SWCNTs36.
In this chapter we report the light scattering dynamics of SWCNTs solubilized in water
using functionalized groups such as poly(amino benzene sulfonic acid) (PABS) and
poly(ethylene glycol) (PEG). These functional moieties attach covalently to the nanotube
surface making them soluble in aqueous media. Synthesis of such covalently
functionalized, well-dispersed and water-soluble SWCNTs has been reported in the
literature previously37, 38. In dilute solutions we find that the nanotubes exhibit dynamics
consistent with the Brownian motion of a rigid rod. Using an anisotropic rigid rod model
we determine the length and diameter of SWCNT from the translational and rotational
diffusion coefficient of the SWCNTs measured by DDLS and compare to the results
obtained from atomic force microscopy (AFM) measurements.
3.3 Materials and Methods.
3.3.1 Materials
SWCNTs functionalized with PABS and PEG were purchased from Carbon Solutions
Inc. and were dispersed in de-ionized water to the required concentrations. The samples

67
were prepared by dispersing the functionalized nanotube samples using a bath sonicator
for 2 hours. Samples were first prepared at a typical concentration of 1 mg/ml and then
diluted to test concentrations in the range 0.01 - 0.1 mg/ml. Both PABS and PEG
functionalized SWCNTs form stable aqueous dispersions as per ref39 and our own
observations. Therefore a dilute solution of such functionalized tubes are ideal for testing
the performance of multi-angle DDLS for characterization of SWNT dimensions.
3.3.2 Depolarized Dynamic Light Scattering of Carbon Nanotubes: Modeling and
Experiment
Multi-angle polarized (VV) and depolarized (VH) dynamic light scattering were
performed on a compact goniometer (ALV, Langen, Germany) equipped with a multi-
tau digital correlator (ALV-5000E, Langen, Germany). The addition of a Glan-Thompson
prism polarizer (Newport Corporation), positioned between the sample and the detector,
enabled selective collection of either the vertically (polarized scattering, VV) and
horizontally (depolarized scattering, VV) polarized light scattering. The minimum delay
time of the correlator used was 12.5 ns. The laser source (
€
λ0= 488 nm, Innova 70C,
Coherent Inc., Santa Clara, CA) was vertically polarized. Now as seen in the Chapter 2,
dynamic light scattering (DLS) quantifies time-dependent fluctuations of light scattered
from a specimen. Because these fluctuations are generated by random motion of the
scatterers, diffusion coefficients can be obtained from analysis of the intensity-intensity
autocorrelation of the time-dependent scattering,
€
g2(q,t) = I(q,t)I(q,0) I(q) 2 where
€
q =4πnsin θ
2
λ0 is the scattering wave vector. Here n is the refractive index of the solvent
(n=1.33 for deionized water), λ0 is the wavelength of the incident light source, and θ is

68
the scattering angle. In the dilute limit, the measurement yields the self-diffusivity, which
can be converted to an effective hydrodynamic size using the Stokes-Einstein equation40.
Although in standard DLS only light scattered with polarization parallel to the incident
beam is measured (VV scattering), with depolarized dynamic light scattering (DDLS)
additional information about rotational diffusion can be obtained if there is anisotropy in
the particle’s polarizability, as is the case for carbon nanotubes41. In DDLS, light
scattered with polarization perpendicular to the incident light (VH scattering) is
measured. Thus in a DDLS experiment, the polarized (VV), g2,VV(q,t) and depolarized
(VH), g2,VH(q,t) intensity autocorrelation functions are independently measured at
different scattering angles, q,. Here the polarized (VV), g2,VV(q,t) and depolarized (VH),
g2,VH(q,t) intensity autocorrelation functions are defined as follows,
g2,VV(q,t) = <IVV(q,t)IVV(q,0)>/<IVV>2 (3-1a)
g2,VH(q,t) = <IVH(q,t)IVH(q,0)>/<IVH>2 (3-1b)
I(q,t) is the time-dependent intensity of scattered light and subscripts VV and VH
represent polarized and depolarized scattering respectively. q in these expressions
denotes that these quantities are angularly dependent. The brackets denote the time-
average. All correlation functions were collected for duration at least 1000 times longer
than the longest relaxation time of the sample studied. In the dilute limit both g2,VV(q,t)
and g2,VH(q,t) are exponentially decaying functions.
€
g2,VV(q,t) = exp(−2ΓVV t) = exp(−2t/τVV ) (3-2a)
€
g2,VH(q,t) = exp(−2ΓVHt) = exp(−2t/τVH ) (3-2b)
Here Γ is the DLS relaxation rate, (Γ=1/τ), which is inversely related to the relaxation
time (τ) of the sample. Experimental relaxation time distributions were extracted from the

69
measured g2,VV(q,t) and g2,VH(q,t) by a CONTIN deconvolution of the respective
correlation functions. CONTIN is a constrained regularization algorithm widely used to
obtain relaxation time information from the intensity autocorrelation function42.
Using equations 3-2a and 3-2b, relaxation rates can be obtained from polarized (ΓVV) and
depolarized (ΓVH) dynamic light scattering for each of the scattering angles studied.
The relaxation rate (Γ=1/τ), obtained from polarized (ΓVV) and depolarized (ΓVH)
dynamic light scattering are related to the translational (Dt) and rotational (Dr) diffusion
coefficient respectively by the simple expressions: 43
€
ΓVV =Dtq2 , (3-3)
and
€
ΓVH =Dtq2 + 6Dr . (3-4)
The power of the MA-DDLS method stems from the fact that the VH autocorrelation
function for optically anisotropic particles such as carbon nanotubes is sensitive to
rotational diffusion, particularly at low scattering vectors q. Eqns. (3-3) and (3-4) are
explicitly developed for the case of optically anisotropic rods and assume decoupling of
rotational and translational diffusion. Depolarized dynamic light scattering has been well
studied in solutions of rigid rod macromolecules44, colloids43, 45 and viruses46. The origin
of these equations and their application to the study of rotational diffusion has been
reviewed before47, 48.
Measurements of the relaxation rate at a range of scattering angles yield both the
translational (Dt) and rotational (Dr) diffusivity. Further, Dt and Dr obtained from DDLS
are related to the hydrodynamic dimensions of the SWCNTs by slender body theory49.

70
For an anisotropic rigid cylindrical rod, the coefficients are given by the simple
expressions:
€
Dt =kBT
6πηsaln 2a
b
+ln 2 -1
(3-5)
and
€
Dr =3kBT8πηsa
3
ab
2
(ln ab
)2
ab
2
ln ab
+ ln2 −1
+ 0.651(ln
ab
)2
(3-6)
Here a and b are the half-length and half-diameter of the cylinder, kB is the Boltzmann
constant, T is the temperature and ηs is the solvent viscosity.
Because the characterization of Dt and Dr from eqns. 3-5 and 3-6 requires DDLS
measurements at several q values, we refer to the method as multi-angle DDLS (MA-
DDLS). As we will see, characterization of DDLS at multiple angles yields a simple
method, and thereby distinguishes it from the initial results of Badaire et al35. To test the
MA-DDLS method, PABS and PEG functionalized SWCNT in the concentration range
c=0.01-0.1 mg/ml were used.
3.3.3 Atomic Force Microscopy
In order to compare the sizes estimated from DDLS experiments for the nanotubes, we
independently characterized the length and diameter of the SWCNTs by Atomic Force
Microscopy (AFM). A Nanoscope IIIa phase microscope (Veeco Instruments Inc.,
Plainview, NY, USA) coupled with a J scanner at a scan speed of 1 Hz was used. A
silicon cantilever (NSC15/no Al, MikroMasch, San Jose, CA, USA) with drive frequency
f=275.94 Hz probed the sample. The samples were prepared by placing a droplet of the

71
aqueous dispersions of the carbon nanotubes on a silicon wafer and allowing the sample
to dry.
3.4 Experimental Section.
3.4.1 DDLS of dilute functionalized SWNT samples.
Fig. 3.1 shows the experimentally measured polarized (VV) and depolarized (VH)
correlation functions, g2,VV(q,t) and g2,VH(q,t) measured at the scattering angles, θ=450
(q=13.09 µm-1) for the SWNT-PABS samples in the concentration range c=0.01-0.1
mg/ml. The data show that the depolarized correlation function for all the SWCNT
dispersions decays faster than the polarized correlation function. This observation is
consistent with the functional forms of eqns. 3-3 and 3-4. The inset of Fig. 3-1 shows the
relaxation rate distributions obtained by CONTIN48 deconvolution of the VV and VH
correlation functions. The CONTIN analysis yielded a single mode peak in the relaxation
spectrum of both polarized and depolarized scattering. Further, the data showed
negligible change in the peak value of the CONTIN relaxation spectrum in the
concentration range studied with dilution, indicating that these measurements are indeed
performed in a dilute regime. Note that the VV relaxation time distributions in the c= 0.1
mg/ml and c=0.025 mg/ml are broad compared to the c=0.01 mg/ml case. Thus, all
further measurements on the SWCNT samples reported are at a concentration of c= 0.01
mg/ml where both the VV and VH relaxation peak widths at c= 0.01mg/ml are narrow
(half-width relative to peak maximum ~ 5%). This narrow width is a qualitative
indication that the samples studied were not aggregated.
As a quantitative test that the specimens were free of aggregates, we studied the
effect of adding magnesium chloride (MgCl2) on the polarized relaxation spectra of a

72
dilute SWCNT solution. Salts like MgCl2 have been used to induce aggregation in
monodisperse colloidal rod systems49. If our test samples were indeed aggregated, then
we would expect similar relaxation spectra to that of samples with MgCl2 added (negative
control). Fig. 3-2 shows the effect of the addition of 5mM MgCl2 on the polarized (ΓVV)
DLS relaxation rate spectrum of SWCNT-PABS, sequentially after addition of salt. The
addition of salt progressively changed the relaxation rate distribution from a strictly
monomodal to a more bimodal distribution. The bimodal distribution consists of fast and
slow modes, interpreted as the response of individual and aggregated SWCNT rods,
respectively.
In Fig. 3.3 we plot the characteristic relaxation times obtained from Fig. 3.2 by
CONTIN deconvolution as a function of time. The magnitude of the fast mode relaxation
times obtained was time independent. The peak relaxation time of the fast mode is also
equal to the relaxation time of a salt free aqueous SWCNT-PABS dispersion (as reported
in Fig. 3.1). This agreement implies that the fast relaxation mode can be attributed to the
well-dispersed individual rods, as is found in salt-free aqueous SWCNT-PABS
dispersions. Fig. 3.3 also clearly reveals that the slow mode progressively grows with
time until it reaches a steady state after 70 minutes. The slow mode is clearly an
indication of the formation of SWNCT-PABS aggregates in solution. Comparing Figs.
3.1, 3.2 and 3.3 we notice that the salt-free SWCNT solutions show no features of
aggregation as observed in the SWCNT solutions with added MgCl2. These data indicate
that solutions of SWCNT comprise well-dispersed individual nanotubes. These
measurements also indirectly support the efficacy of covalent functionalization as a
means to achieve stable dispersion of short SWCNTs. Finally, comparison of MA-DDLS

73
results against a control experiment with added MgCl2 can serve as a general test of
aggregation of functionalized SWCNTs dispersed in aqueous solution.
From eqn. (3-1) and (3-2), both ΓVV and ΓVH are expected to be q-dependent. In
order to extract translational and rotational diffusion coefficients of SWCNT samples we
linearly extrapolated ΓVV and ΓVH in q2. Multiple VV and VH measurements were
performed on dilute SWCNT-PABS and SWCNT-PEG samples over the angular range
θ=450-1150 (13.09 µm-1 < q < 28.86 µm-1). In Fig. 3.4 we report the VV and VH
correlation functions for a SWCNT-PABS sample studied at these scattering angles. The
inset of Fig. 3.4 reports the probability distribution function of the CONTIN relaxation
time spectrum for both VV and VH correlation functions. Similar results were obtained
with SWCNT-PEG dispersions (data not shown).
In anticipation of data reduction as per eqns. (3-3) and (3-4) the relaxation rates,
ΓVV and ΓVH from both SWCNT-PABS and SWCNT-PEG were plotted as a function of
q2 in Fig. 3.5. The slope of ΓVV versus q2 corresponds to the translational diffusion
coefficient of the SWCNTs in solution. The intercept of the plot of ΓVH versus q2 is six
times the rotational diffusion coefficient of the SWCNTs, as per eqn 3-4. Linear fits to
the data were used to estimate the rotational and translational coefficients of the samples.
Table 1 reports the translational and rotational diffusion coefficient values for both the
SWCNT-PABS and SWCNT-PEG samples. Errors reported in the table are the standard
error of the mean of three independent measurements for each sample. From equations
(3-3) and (3-4) the rotational diffusion coefficients are Dr, PABS = 44 ± 9 s-1 and Dr, PEG =
170 ± 5 s-1 and the translational diffusion coefficients are Dt, PABS = 3.58 ± 0.03 µm2/s and
Dt, PEG = 4.09 ± 0.03 µm2/s for SWCNT-PABS and SWCNT-PEG samples respectively.

74
Using eqns (3-1)-(3-4), we computed the length and diameter of the SWCNTs consistent
with the two independent measurements of Dr and Dt. We find that the SWCNT-PABS
sample has an average length of 949±70 nm and an average diameter of 0.8±0.3 nm. The
SWCNT-PEG sample has an average length of 541±6 nm and an average diameter of
4.4±0.2 nm. Table 1 also reports the sensitivity of the slender body theory (eqns 3-5 and
3-6) in estimating the length and diameter of the SWCNT-PABS and SWCNT-PEG
samples from the experimentally measured translational and rotational diffusion
coefficients. Diameter estimation is a factor of five times more sensitive than length
estimation.
3.4.2 Atomic force microscopy.
For comparison with the results obtained from DDLS, we also performed AFM studies
on the diluted CNTs samples as shown in Fig. 3.6a and 3.6b. These figures show thin
films of dried SWCNT-PEG and SWCNT-PABS samples, respectively, used for
statistical analysis of average SWCNT dimensions. We measured the average length of
50 nanotubes from the SWCNT-PEG system to be 458 ± 29 nm and average length from
the SWCNT-PABS system to be 408 ± 50 nm. (Uncertainties in the measurements
correspond to the standard error of the mean of the measurements from 50 SWCNTs. The
diameters of the SWCNTs were measured using the height profile registered during
acquisition of the AFM image.) The average diameter of the SWCNT-PEG system was
6.8 ± 0.7 nm and average diameter of the SWCNT-PABS system was 8.4 ± 0.8 nm. The
diameters of the SWCNTs were measured using the height profile registered during
acquisition of the AFM image.) The average diameter of the SWCNT-PEG system was
6.8 ± 0.7 nm and average diameter of the SWCNT-PABS system was 8.4 ± 0.8 nm. The

75
statistical distributions of the dimensions of the carbon nanotubes are shown in the
histogram plot of Fig. 3-6c-f.
Although the AFM and MA-DDLS derived dimensions agree qualitatively, there are
quantitative differences between the methods especially for the result obtained for
SWCNT-PABS. In this case, the lengths of the SWCNT-PABS measured by AFM are up
to a factor of 2 larger and the diameters are up to a factor of 4 larger than the dimensions
reported for solutions of the same SWCNTs as measured by MA-DDLS.
Other methods have also found quantitative disagreement between AFM and bulk
solution characterization methods. For example, Parra-Vasquez and coworkers compared
viscosity-based measurements of the length of nanotubes to results obtained from AFM33.
They reported differences in the lengths of the nanotubes of up to 30% between
independently prepared samples. They also found that relative to their viscosity-based
characterization of the nanotube length, AFM was dependent on sample preparation,
sample sizes and wafer surfaces. Their finding is consistent with our results that the
dimensions measured by AFM differ from the measurements of the nanotube dimensions
by MA-DDLS. Reasons for the discrepancy between solution based methods like MA-
DDLS and microscopy methods such as AFM might include the following: First, AFM
measurements were done at much higher concentrations when compared to MA-DDLS
measurements (to sample enough SWCNTs for statistical analysis). Higher
concentrations might promote aggregation that would interfere with the single tube
characterization that is of interest here. Second, AFM requires dry films of the CNT
suspensions. Drying of the suspensions might induce complications such as aggregation
and bundling in the CNTs. These reasons likely contribute to the observation apparent in
Table 3.1, that the relative error in the MA-DDLS characterization is less than that
observed for the AFM studies.

76
3.5 Conclusion
To conclude, we discuss bounds of applicability of the MA-DDLS method and thereby
explore its scope for broader application. First, the data analysis procedure used assumes
that the SWCNTs are rigid. Recent work of Duggal et al. suggests that SWCNTs up to
about 1 µm in length can be treated as rigid50. (For longer rods, adaptation of eqns. 3-5
and 3-6 to include the effects of finite flexibility would be feasible.) Second, the
theoretical framework of MA-DDLS assumes that the SWCNT are subject to Brownian
motion. As the SWCNTs become longer, or for the case of multi-walled tubes, the system
would likely crossover into a limit for which the CNT dynamics would not be
significantly affected by Brownian motion. However, from previous studies of colloidal
rod rotational diffusion, the rod length required to reach this non-Brownian limit would
be no less than about 4 µm51. Third, the nanotubes must not be so small that additional
higher order relaxation modes appear in the DLS correlation functions52. From literature
work, this limit imposes the constraint qL <~ 10. For the angular range of typical wide-
angle light scattering devices, we thus conclude that the SWCNT tube length ought to be
L ~ 300 nm or greater. Thus, the MA-DDLS method is appropriate for the rapid
characterization of SWCNT dimensions for tubes of length in the approximate range 300
nm < L < 4 µm. This range is consistent with the dimensions of SWCNTs of interest for
many different applications, including sensing1, conduction53 and molecular marking15.
Thus, we have shown that multi-angle DDLS is a simple, non-invasive tool to determine
the average length and diameter of SWCNT. The length and diameter of the nanotubes
are determined from the translational and rotational diffusion coefficient measurements,
with considerable advantages relative to other sizing techniques.

77
Figure 3.1: Comparison of the polarized (VV) and depolarized (VH) intensity autocorrelation functions g2(τ) of SWCNT-PABS in the concentration range c=0.01-0.1 mg/ml at scattering angle, θ=45°. The inset plot shows the probability distribution function of the DLS decay time spectrum in the VV and VH scattering planes for the above concentrations, obtained from a CONTIN deconvolution of g2(τ).

78
Figure 3.2: Comparison of the DLS decay time spectrum of c=0.01 mg/ml of SWCNT-PABS in deionized water (aqueous) and with magnesium chloride salt (5mM MgCl2) at θ=45° as a function of time.

79
Figure 3.3: Peak decay relaxation time, τ, as a function of time of c=0.01 mg/ml of SWCNT-PABS in deionized water (aqueous) and with magnesium chloride salt (5mM MgCl2) at θ=45.
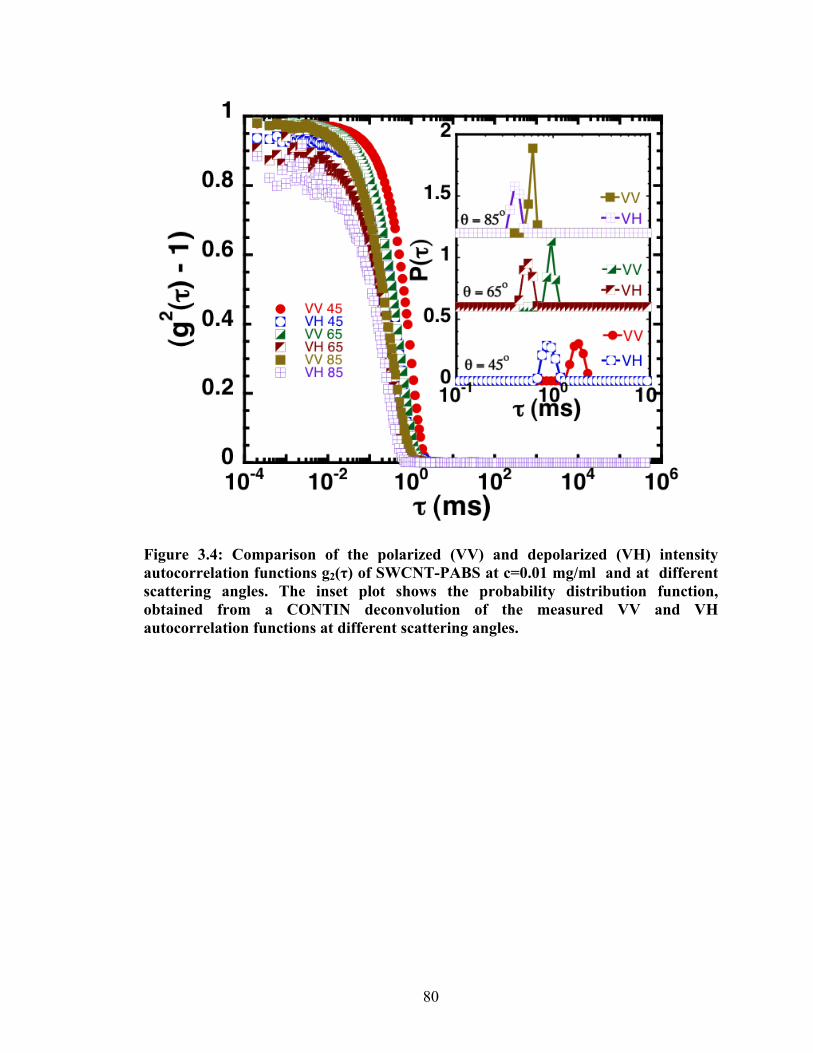
80
Figure 3.4: Comparison of the polarized (VV) and depolarized (VH) intensity autocorrelation functions g2(τ) of SWCNT-PABS at c=0.01 mg/ml and at different scattering angles. The inset plot shows the probability distribution function, obtained from a CONTIN deconvolution of the measured VV and VH autocorrelation functions at different scattering angles.
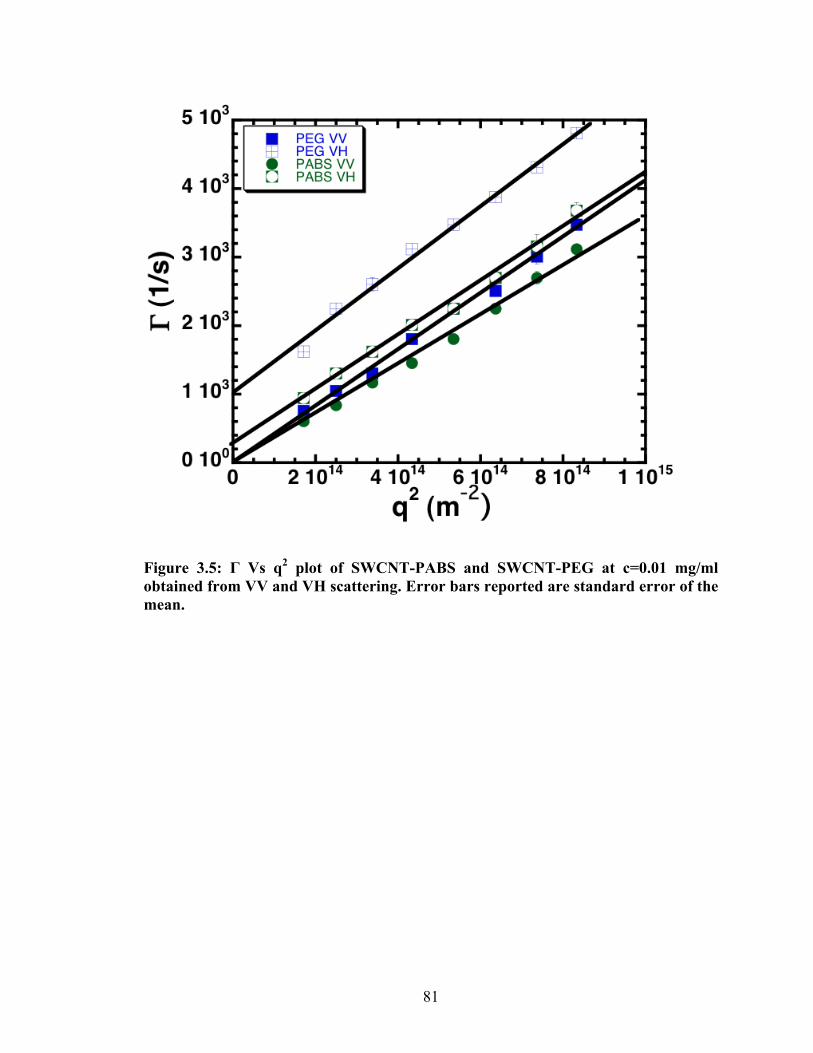
81
Figure 3.5: Γ Vs q2 plot of SWCNT-PABS and SWCNT-PEG at c=0.01 mg/ml obtained from VV and VH scattering. Error bars reported are standard error of the mean.

82
Figure 3.6: AFM micrographs for thin films of dried SWCNTs dispersions. Fig. a) corresponds to PEG functionalized SWCNTs and Fig. b) corresponds to PABS functionalized SWCNTs. We found that theSWCNT-PABS were more stable than the SWCNT-PEG. Dried films of suspensions of PEG-SWCNTs were prone to aggregation as can be seen in Fig. a). The scale bar is 1 µms. Fig. c) and d) show the distribution of CNT lengths for SWCNT-PEG and SWCNT-PABS respectively. Similarly, Fig. e) and f) correspond to the distribution of CNT diameters for SWCNT-PEG and SWCNT-PABS respectively.
83
Functionality
Dt (µm2/s)
Dr (1/s)
L (nm)
DDLS
D (nm)
DDLS
L (nm)
AFM
D (nm)
AFM
PEG
4.09 ± 0.03
170 ± 5
541±6 4.4±0.2 458±29 6.8 ± 0.7
PABS
3.58 ± 0.03
44 ± 9
949±70 0.8±0.3 408±50 8.4 ± 0.8
Table 3.1: Summary of translational diffusion coefficient (Dt), rotational diffusion coefficient (Dr), length (L) and diameter (D) values obtained from DDLS and AFM measurements for SWCNT-PABS and SWCNT-PEG samples. Reported uncertainties correspond to the standard error of the mean.

84
3.6 References
1. Dai, L. M.; Soundarrajan, P.; Kim, T., Sensors and sensor arrays based on conjugated polymers and carbon nanotubes. Pure and Applied Chemistry 2002, 74, (9), 1753-1772.
2. Modi, A.; Koratkar, N.; Lass, E.; Wei, B. Q.; Ajayan, P. M., Miniaturized gas ionization sensors using carbon nanotubes. Nature 2003, 424, (6945), 171-174.
3. Heller, I.; Janssens, A. M.; Mannik, J.; Minot, E. D.; Lemay, S. G.; Dekker, C., Identifying the mechanism of biosensing with carbon nanotube transistors. Nano Letters 2008, 8, (2), 591-595.
4. Bekyarova, E.; Kalinina, I.; Itkis, M. E.; Beer, L.; Cabrera, N.; Haddon, R. C., Mechanism of ammonia detection by chemically functionalized single-walled carbon nanotubes: In situ electrical and optical study of gas analyte detection. Journal of the American Chemical Society 2007, 129, (35), 10700-10706.
5. Bekyarova, E.; Davis, M.; Burch, T.; Itkis, M. E.; Zhao, B.; Sunshine, S.; Haddon, R. C., Chemically functionalized single-walled carbon nanotubes as ammonia sensors. Journal of Physical Chemistry B 2004, 108, (51), 19717-19720.
6. Green, A. A.; Hersam, M. C., Colored semitransparent conductive coatings consisting of monodisperse metallic single-walled carbon nanotubes. Nano Letters 2008, 8, (5), 1417-1422.
7. Trancik, J. E.; Barton, S. C.; Hone, J., Transparent and catalytic carbon nanotube films. Nano Letters 2008, 8, (4), 982-987.
8. Bekyarova, E.; Itkis, M. E.; Cabrera, N.; Zhao, B.; Yu, A. P.; Gao, J. B.; Haddon, R. C., Electronic properties of single-walled carbon nanotube networks. Journal of the American Chemical Society 2005, 127, (16), 5990-5995.
9. Appenzeller, J.; Martel, R.; Derycke, V.; Radosavjevic, M.; Wind, S.; Neumayer, D.; Avouris, P., Carbon nanotubes as potential building blocks for future nanoelectronics. Microelectronic Engineering 2002, 64, (1-4), 391-397.
10. LeMieux, M. C.; Roberts, M.; Barman, S.; Jin, Y. W.; Kim, J. M.; Bao, Z. N., Self-sorted, aligned nanotube networks for thin-film transistors. Science 2008, 321, (5885), 101-104.
11. Andrews, R.; Jacques, D.; Rao, A. M.; Rantell, T.; Derbyshire, F.; Chen, Y.; Chen, J.; Haddon, R. C., Nanotube composite carbon fibers. Applied Physics Letters 1999, 75, (9), 1329-1331.
12. Nanda, J.; Maranville, C.; Bollin, S. C.; Sawall, D.; Ohtani, H.; Remillard, J. T.; Ginder, J. M., Thermal conductivity of single-wall carbon nanotube dispersions: Role of interfacial effects. Journal of Physical Chemistry C 2008, 112, (3), 654-658.

85
13. Biercuk, M. J.; Llaguno, M. C.; Radosavljevic, M.; Hyun, J. K.; Johnson, A. T.; Fischer, J. E., Carbon nanotube composites for thermal management. Applied Physics Letters 2002, 80, (15), 2767-2769.
14. Jia, N. Q.; Lian, Q.; Shen, H. B.; Wang, C.; Li, X. Y.; Yang, Z. N., Intracellular delivery of quantum dots tagged antisense oligodeoxynucleotides by functionalized multiwalled carbon nanotubes. Nano Letters 2007, 7, (10), 2976-2980.
15. Welsher, K.; Liu, Z.; Daranciang, D.; Dai, H., Selective Probing and Imaging of Cells with Single Walled Carbon Nanotubes as Near-Infrared Fluorescent Molecules. Nano Lett. 2008, 8, (2), 586-590.
16. Wong, S. S.; Joselevich, E.; Woolley, A. T.; Cheung, C. L.; Lieber, C. M., Covalently functionalized nanotubes as nanometre-sized probes in chemistry and biology. Nature 1998, 394, (6688), 52-55.
17. Moore, V. C.; Strano, M. S.; Haroz, E. H.; Hauge, R. H.; Smalley, R. E.; Schmidt, J.; Talmon, Y., Individually Suspended Single-Walled Carbon Nanotubes in Various Surfactants. Nano Lett. 2003, 3, (10), 1379-1382.
18. Wu, Z. C.; Chen, Z. H.; Du, X.; Logan, J. M.; Sippel, J.; Nikolou, M.; Kamaras, K.; Reynolds, J. R.; Tanner, D. B.; Hebard, A. F.; Rinzler, A. G., Transparent, conductive carbon nanotube films. Science 2004, 305, (5688), 1273-1276.
19. Rajan, A.; Strano, M. S.; Heller, D. A.; Hertel, T.; Schulten, K., Length-dependent optical effects in single walled carbon nanotubes. Journal of Physical Chemistry B 2008, 112, (19), 6211-6213.
20. Davis, V. A.; Ericson, L. M.; Parra-Vasquez, A. N. G.; Fan, H.; Wang, Y. H.; Prieto, V.; Longoria, J. A.; Ramesh, S.; Saini, R. K.; Kittrell, C.; Billups, W. E.; Adams, W. W.; Hauge, R. H.; Smalley, R. E.; Pasquali, M., Phase Behavior and rheology of SWNTs in superacids. Macromolecules 2004, 37, (1), 154-160.
21. Hough, L. A.; Islam, M. F.; Hammouda, B.; Yodh, A. G.; Heiney, P. A., Structure of semidilute single-wall carbon nanotube suspensions and gels. Nano Letters 2006, 6, (2), 313-317.
22. Dror, Y.; Pyckhout-Hintzen, W.; Cohen, Y., Conformation of polymers dispersing single-walled carbon nanotubes in water: A small-angle neutron scattering study. Macromolecules 2005, 38, (18), 7828-7836.
23. Wang, H.; Zhou, W.; Ho, D. L.; Winey, K. I.; Fischer, J. E.; Glinka, C. J.; Hobbie, E. K., Dispersing single-walled carbon nanotubes with surfactants: A small angle neutron scattering study. Nano Letters 2004, 4, (9), 1789-1793.
24. Zhou, W.; Islam, M. F.; Wang, H.; Ho, D. L.; Yodh, A. G.; Winey, K. I.; Fischer, J. E., Small angle neutron scattering from single-wall carbon nanotube suspensions: evidence for isolated rigid rods and rod networks. Chemical Physics Letters 2004, 384, (1-3), 185-189.

86
25. Yurekli, K.; Mitchell, C. A.; Krishnamoorti, R., Small-angle neutron scattering from surfactant-assisted aqueous dispersions of carbon nanotubes. Journal of the American Chemical Society 2004, 126, (32), 9902-9903.
26. Fagan, J. A.; Landi, B. J.; Mandelbaum, I.; Simpson, J. R.; Bajpai, V.; Bauer, B. J.; Migler, K.; Walker, A. R. H.; Raffaelle, R.; Hobbie, E. K., Comparative measures of single-wall carbon nanotube dispersion. Journal of Physical Chemistry B 2006, 110, (47), 23801-23805.
27. Schaefer, D. W.; Zhao, J.; Brown, J. M.; Anderson, D. P.; Tomlin, D. W., Morphology of dispersed carbon single-walled nanotubes. Chemical Physics Letters 2003, 375, (3-4), 369-375.
28. Schaefer, D.; Brown, J. M.; Anderson, D. P.; Zhao, J.; Chokalingam, K.; Tomlin, D.; Ilavsky, J., Structure and dispersion of carbon nanotubes. Journal of Applied Crystallography 2003, 36, 553-557.
29. Bauer, B. J.; Becker, M. L.; Bajpai, V.; Fagan, J. A.; Hobbie, E. K.; Migler, K.; Guttman, C. M.; Blair, W. R., Measurement of single-wall nanotube dispersion by size exclusion chromatography. Journal of Physical Chemistry C 2007, 111, (48), 17914-17918.
30. Terrones, M., Science and technology of the twenty-first century: Synthesis, properties and applications of carbon nanotubes. Annual Review of Materials Research 2003, 33, 419-501.
31. Dong, Q.; Gregory, J. W.; Wing Kam, L.; Min-Feng, Y.; Rodney, S. R., Mechanics of carbon nanotubes. Applied Mechanics Reviews 2002, 55, (6), 495-533.
32. Li, Q. W.; Zhu, Y. T.; Kinloch, I. A.; Windle, A. H., Self-organization of carbon nanotubes in evaporating droplets. Journal of Physical Chemistry B 2006, 110, (28), 13926-13930.
33. Parra-Vasquez, A. N. G.; Stepanek, I.; Davis, V. A.; Moore, V. C.; Haroz, E. H.; Shaver, J.; Hauge, R. H.; Smalley, R. E.; Pasquali, M., Simple length determination of single-walled carbon nanotubes by viscosity measurements in dilute suspensions. Macromolecules 2007, 40, (11), 4043-4047.
34. Solomon, M. J.; Boger, D. V., The rheology of aqueous dispersions of spindle-type colloidal hematite rods. Journal of Rheology 1998, 42, (4), 929-949.
35. Badaire, S.; Poulin, P.; Maugey, M.; Zakri, C., In Situ Measurements of Nanotube Dimensions in Suspensions by Depolarized Dynamic Light Scattering. Langmuir 2004, 20, (24), 10367-10370.
36. Heller, D. A.; Mayrhofer, R. M.; Baik, S.; Grinkova, Y. V.; Usrey, M. L.; Strano, M. S., Concomitant length and diameter separation of single-walled carbon nanotubes. Journal of the American Chemical Society 2004, 126, (44), 14567-14573.

87
37. B. Zhao, H. H. R. C. H., Synthesis and Properties of a Water-Soluble Single-Walled Carbon Nanotube-Poly(aminobenzene sulfonic acid) Graft Copolymer. Advanced Functional Materials 2004, 14, (1), 71-76.
38. Zhao, B.; Hu, H.; Yu, A.; Perea, D.; Haddon, R. C., Synthesis and Characterization of Water Soluble Single-Walled Carbon Nanotube Graft Copolymers. J. Am. Chem. Soc. 2005, 127, (22), 8197-8203.
39. Amiran, J.; Nicolosi, V.; Bergin, S. D.; Khan, U.; Lyons, P. E.; Coleman, J. N., High quality dispersions of functionalized single walled nanotubes at high concentration. Journal of Physical Chemistry C 2008, 112, (10), 3519-3524.
40. Berne, B. J.; Pecora, R., Dynamic Light Scattering. J Wiley, New York: 1976.
41. Hobbie, E. K., Optical anisotropy of nanotube suspensions. Journal of Chemical Physics 2004, 121, (2), 1029-1037.
42. Provencher, S. W., Contin - a general-purpose constrained regularization program for inverting noisy linear algebraic and integral-equations. Computer Physics Communications 1982, 27, (3), 229-242.
43. Matsuoka, H.; Morikawa, H.; Yamaoka, H., Rotational diffusion of ellipsoidal latex particles in dispersion as studied by depolarized dynamic light scattering. Colloids and Surfaces a-Physicochemical and Engineering Aspects 1996, 109, 137-145.
44. Drogemeier, J.; Eimer, W., Polarized and depolarized dynamic light-scattering study on f-actin in solution - comparison with model-calculations. Macromolecules 1994, 27, (1), 96-101.
45. Lehner, D.; Lindner, H.; Glatter, O., Determination of the translational and rotational diffusion coefficients of rodlike particles using depolarized dynamic light scattering. Langmuir 2000, 16, (4), 1689-1695.
46. Cush, R.; Dorman, D.; Russo, P. S., Rotational and translational diffusion of tobacco mosaic virus in extended and globular polymer solutions. Macromolecules 2004, 37, (25), 9577-9584.
47. Pecora, R., Dynamic Light Scattering: Applications of Photon Correlation Spectroscopy. Plenum Press, New York and London: 1985.
48. Doi, M.; Edwards, S. F., The Theory of Polymer Dynamics Clareendon Press, Oxford: 1986.
49. Brenner, H., Rheology of a dilute suspension of axisymmetric brownian particles. Int. J. Multiphase Flow 1973, 1, 195-341.
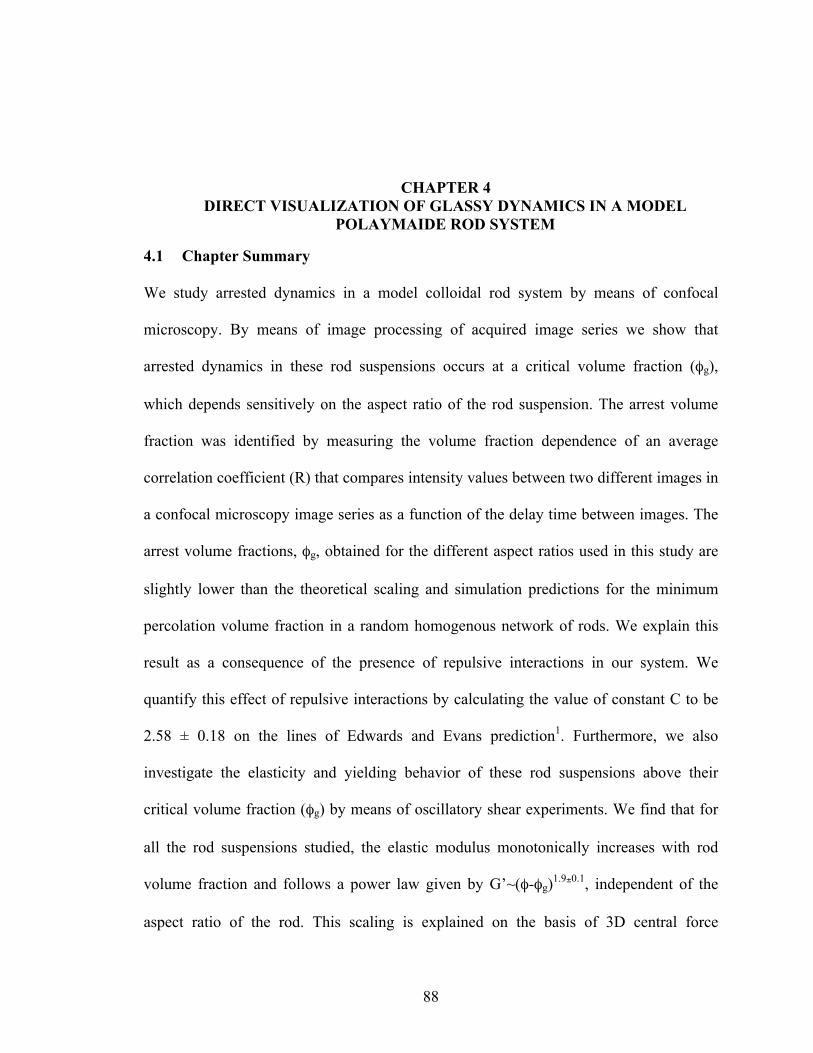
88
CHAPTER 4 DIRECT VISUALIZATION OF GLASSY DYNAMICS IN A MODEL
POLAYMAIDE ROD SYSTEM
4.1 Chapter Summary
We study arrested dynamics in a model colloidal rod system by means of confocal
microscopy. By means of image processing of acquired image series we show that
arrested dynamics in these rod suspensions occurs at a critical volume fraction (φg),
which depends sensitively on the aspect ratio of the rod suspension. The arrest volume
fraction was identified by measuring the volume fraction dependence of an average
correlation coefficient (R) that compares intensity values between two different images in
a confocal microscopy image series as a function of the delay time between images. The
arrest volume fractions, φg, obtained for the different aspect ratios used in this study are
slightly lower than the theoretical scaling and simulation predictions for the minimum
percolation volume fraction in a random homogenous network of rods. We explain this
result as a consequence of the presence of repulsive interactions in our system. We
quantify this effect of repulsive interactions by calculating the value of constant C to be
2.58 ± 0.18 on the lines of Edwards and Evans prediction1. Furthermore, we also
investigate the elasticity and yielding behavior of these rod suspensions above their
critical volume fraction (φg) by means of oscillatory shear experiments. We find that for
all the rod suspensions studied, the elastic modulus monotonically increases with rod
volume fraction and follows a power law given by G’~(φ-φg)1.9±0.1, independent of the
aspect ratio of the rod. This scaling is explained on the basis of 3D central force

89
percolation theory where rods form a rod network of freely jointed rods, which resist
stretching but are amenable to bending motions in the network.

90
4.2 Introduction
Colloidal suspensions containing rod shaped particles find wide usage in applications
such as functional ceramics2, polymer nanocomposites3, magnetic recording4, 5 and pulp
and papermaking6. Rod shaped particles are also key components of many industrial
products such as paints7, inks8, cosmetics7 and greases9 and they also possess potentially
valuable optical properties10. Depending on their interaction strength, aspect ratio and
volume fraction, rod suspensions form microscopic structures ranging from fractals11 to
bundles to homogeneous networks12. Rod shaped particles are also of intense interest due
to their ability to modify rheology at much lower volume fractions than their spherical
counterparts13.
The dynamics and microstructure of rod suspensions have been studied by the techniques
of confocal microscopy14, fluorescence video microscopy15, dynamic light scattering16,
small angle light scattering11, depolarized light scattering17 and rheology12, 18, 19. Although
many studies have considered the behavior of rod suspensions with fluid-like rheology,
comparatively little experimental work has been done on arrested or slow dynamics of
rod shaped colloids. One obstacle to studies of this kind has been the lack of a good
model system in which properties such as aspect ratio and interaction potential may be
independently tuned and thus the effect of these variables on network or gel structures
probed. Although experimental data in the literature are limited, theoretical and
simulation studies20-26 are available. Monte Carlo simulations performed by Schilling et
al., to study the effect of depletion on percolation threshold of nanorod networks revealed
that the percolation threshold depended both on the depletion force and the aspect ratio of
the rod suspension26. Recently Yatsenko et al., developed a theory which predicts that the
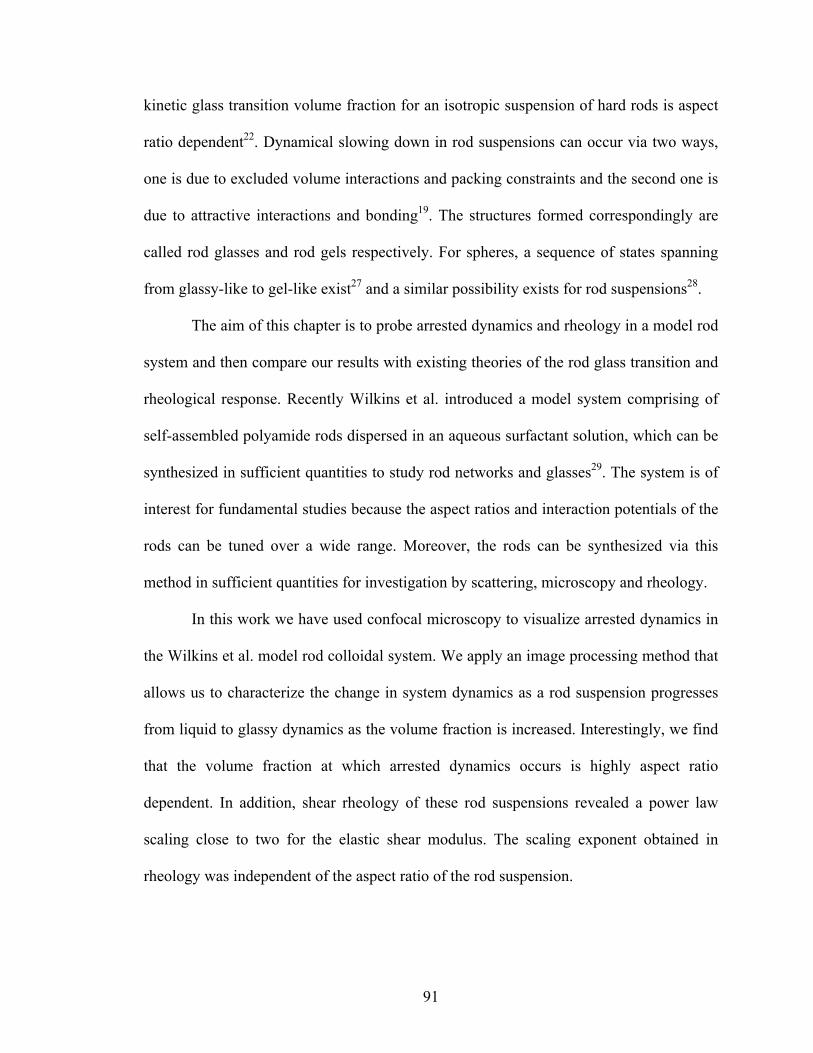
91
kinetic glass transition volume fraction for an isotropic suspension of hard rods is aspect
ratio dependent22. Dynamical slowing down in rod suspensions can occur via two ways,
one is due to excluded volume interactions and packing constraints and the second one is
due to attractive interactions and bonding19. The structures formed correspondingly are
called rod glasses and rod gels respectively. For spheres, a sequence of states spanning
from glassy-like to gel-like exist27 and a similar possibility exists for rod suspensions28.
The aim of this chapter is to probe arrested dynamics and rheology in a model rod
system and then compare our results with existing theories of the rod glass transition and
rheological response. Recently Wilkins et al. introduced a model system comprising of
self-assembled polyamide rods dispersed in an aqueous surfactant solution, which can be
synthesized in sufficient quantities to study rod networks and glasses29. The system is of
interest for fundamental studies because the aspect ratios and interaction potentials of the
rods can be tuned over a wide range. Moreover, the rods can be synthesized via this
method in sufficient quantities for investigation by scattering, microscopy and rheology.
In this work we have used confocal microscopy to visualize arrested dynamics in
the Wilkins et al. model rod colloidal system. We apply an image processing method that
allows us to characterize the change in system dynamics as a rod suspension progresses
from liquid to glassy dynamics as the volume fraction is increased. Interestingly, we find
that the volume fraction at which arrested dynamics occurs is highly aspect ratio
dependent. In addition, shear rheology of these rod suspensions revealed a power law
scaling close to two for the elastic shear modulus. The scaling exponent obtained in
rheology was independent of the aspect ratio of the rod suspension.
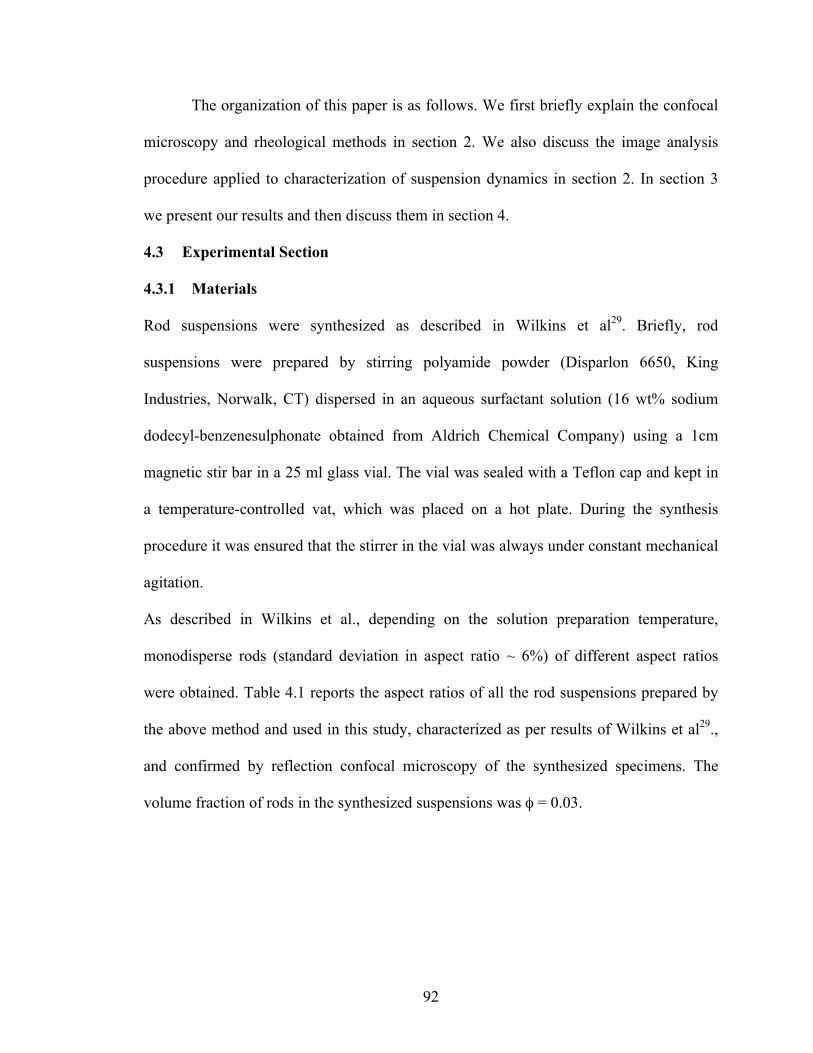
92
The organization of this paper is as follows. We first briefly explain the confocal
microscopy and rheological methods in section 2. We also discuss the image analysis
procedure applied to characterization of suspension dynamics in section 2. In section 3
we present our results and then discuss them in section 4.
4.3 Experimental Section
4.3.1 Materials
Rod suspensions were synthesized as described in Wilkins et al29. Briefly, rod
suspensions were prepared by stirring polyamide powder (Disparlon 6650, King
Industries, Norwalk, CT) dispersed in an aqueous surfactant solution (16 wt% sodium
dodecyl-benzenesulphonate obtained from Aldrich Chemical Company) using a 1cm
magnetic stir bar in a 25 ml glass vial. The vial was sealed with a Teflon cap and kept in
a temperature-controlled vat, which was placed on a hot plate. During the synthesis
procedure it was ensured that the stirrer in the vial was always under constant mechanical
agitation.
As described in Wilkins et al., depending on the solution preparation temperature,
monodisperse rods (standard deviation in aspect ratio ~ 6%) of different aspect ratios
were obtained. Table 4.1 reports the aspect ratios of all the rod suspensions prepared by
the above method and used in this study, characterized as per results of Wilkins et al29.,
and confirmed by reflection confocal microscopy of the synthesized specimens. The
volume fraction of rods in the synthesized suspensions was φ = 0.03.

93
4.3.2 Methods
4.3.2.1 Sample preparation
Colloid rods synthesized as described above were diluted to different volume fractions
using HPLC grade water for both confocal microscopy and rheological measurements
(0.0005<φ< 0.03). Dilute solutions of these rod suspensions were prepared with HPLC
grade water (Sigma Aldrich) and placed on rollers (Wheaton Science Products) rotating
at 3-6 rpm for about 30-45 minutes. The slow tumbling on the rollers dispersed the rod
particles effectively as evidenced by Fig. 4.1(b)-(f).
4.3.2.2 Confocal laser scanning microscopy (CLSM)
Imaging was performed using the reflection (scattering) mode of an inverted Leica TCS
SP2 confocal microscope using a 100x oil-immersion objective with a numerical aperture
of 1.4 and laser excitation at λ = 488 nm. For rod suspension dynamics measurement, an
image stack comprising of 40 images (2D slices) were taken with time interval between
two consecutive images fixed at 1.635s. For rods with the high aspect ratios of 212 and
101, all images collected were of dimension 150 um by 150um with corresponding pixel
sizes of 292.29nm by 292.29 nm in the x and y axes. Alternatively, for rods with lower
aspect ratio 50 and 28, the images collected were of dimension 75um by 75um with
corresponding pixel sizes of 147 nm by 147nm. Imaging was performed at least 25-30
um from the cover slip to avoid wall effects.
4.3.2.3 Image analysis
Image analysis was performed on CLSM images to extract quantitative information about
the Brownian motion of the rods in the concentrated suspensions. Ideally, such analysis
can yield the positions and orientations of all the rods in the specimen per a method such

94
as that of Mohraz and Solomon14. This work used CLSM coupled with quantitative image
processing to visualize fluorescent colloidal rods and study jamming and order/disorder
transitions in rod sediments. Recently Mukhija and Solomon used CLSM to quantify
single-particle translational and rotational diffusion of fluorescent colloidal rods30. We
could not use the above techniques in this work for the following reasons. First, rods
synthesized in our method were not fluorescent. Second, because of the small diameter of
our rods (~ 90 nm, much smaller than the wavelength of laser light used in CLSM), such
direct methods could not be successfully applied to our model system. Instead, we
developed a method based on correlating the spatially dependent image intensity values
between images separated by a delay time Δt. As rods undergo Brownian displacements,
cross-correlation statistics applied to pairs of images will become progressively less
correlated, thereby facilitating differentiations between suspensions with fluid-like and
glass-like dynamics.
This correlation image analysis was performed with the Image Correlation plugin31
available in the Image J software made available by National Institute of Health
(http://rsb.info.nih.gov/ij). The statistic used to correlate two images was the Pearson
correlation coefficient, calculated for two images I1 and I2 separated by some delay time
Δt according to the following equation:
€
R =
(I1(mi,n j ) −j=1
n
∑ I1−
i=1
m
∑ )(I2(mi,n j ) − I−
2)
(mn −1)σ I1σ I 2
where m and n are the number of pixels in the x and y directions respectively, I1(mi,nj)
and I2(mi,nj) are the intensity values at the pixel location (mi,nj), of the images 1 and 2
respectively. Here,
€
I1−
and
€
I2−
are the mean intensity values for the entire image and
€
σ I1

95
and
€
σ I 2 are their standard deviations. The image series, comprising 40 images was cross
correlated for a range of delay times varying from Δt =1.6s to Δt = 63.8s. More details
can be obtained from the following documentation:
(http://www.gsca.net/IJ/ImageCorrelationJ.html).
An average correlation coefficient was obtained for each of these intervals as described
above. This average correlation coefficient was then plotted as function of volume
fraction of the rod suspension to indirectly characterize dynamics. In the past DLS has
been the principle method used to study arrested dynamics in colloidal rod suspensions29,
particularly low-volume fraction gels16. However, in the case of the polyamide rod
suspensions, DLS failed due to multiple scattering, which is a common condition for the
high volume fraction rod suspensions used in our study32.
4.3.2.4 Rheology
Rheological measurements were performed on an ARG2 stress controlled rheometer, TA
instruments. A 2°, 60mm cone and plate geometry was used. All measurements were
performed at a constant temperature of 25° C. A solvent trap around the sample
minimized solvent evaporation during the experiment. To avoid effects from loading and
shear history on our measurements, a specific protocol was followed. All measurements
were pre-sheared at a low steady shear 10(1/s) for 30 s followed by sample equilibration
on the rheometer plate for 2 minutes. A similar protocol to minimize shear history effects
has been used in a study of the glassy rheology of hard spheres33.
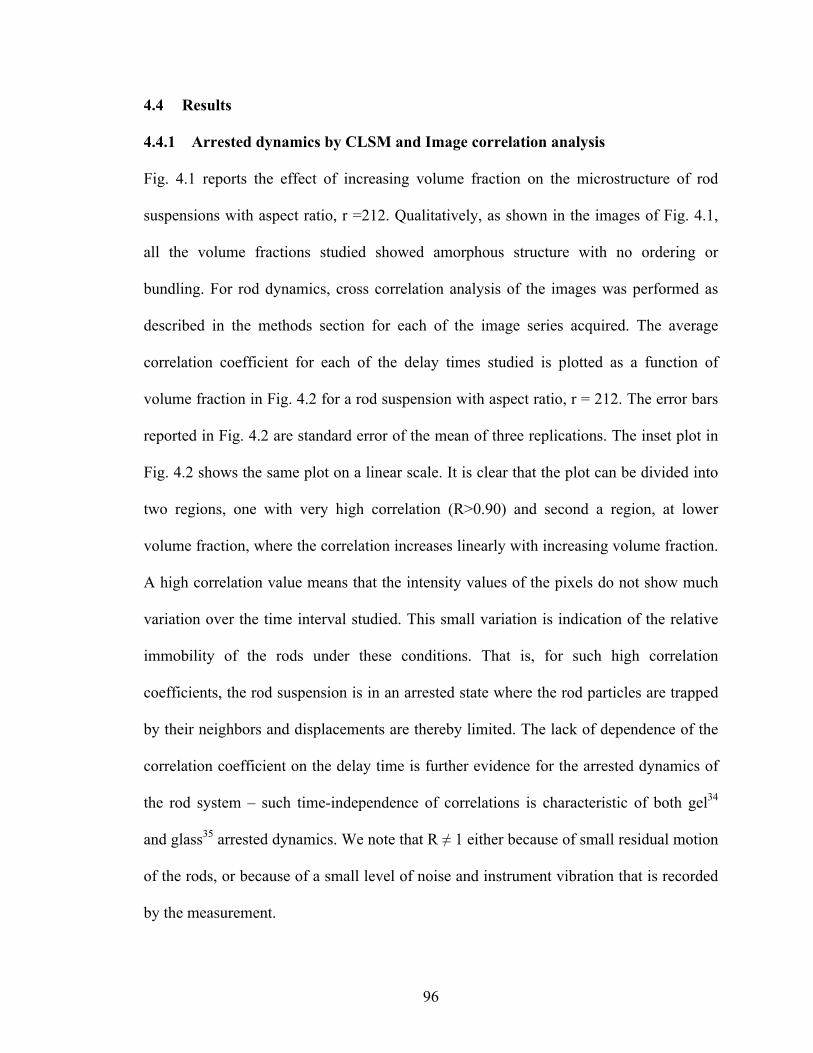
96
4.4 Results
4.4.1 Arrested dynamics by CLSM and Image correlation analysis
Fig. 4.1 reports the effect of increasing volume fraction on the microstructure of rod
suspensions with aspect ratio, r =212. Qualitatively, as shown in the images of Fig. 4.1,
all the volume fractions studied showed amorphous structure with no ordering or
bundling. For rod dynamics, cross correlation analysis of the images was performed as
described in the methods section for each of the image series acquired. The average
correlation coefficient for each of the delay times studied is plotted as a function of
volume fraction in Fig. 4.2 for a rod suspension with aspect ratio, r = 212. The error bars
reported in Fig. 4.2 are standard error of the mean of three replications. The inset plot in
Fig. 4.2 shows the same plot on a linear scale. It is clear that the plot can be divided into
two regions, one with very high correlation (R>0.90) and second a region, at lower
volume fraction, where the correlation increases linearly with increasing volume fraction.
A high correlation value means that the intensity values of the pixels do not show much
variation over the time interval studied. This small variation is indication of the relative
immobility of the rods under these conditions. That is, for such high correlation
coefficients, the rod suspension is in an arrested state where the rod particles are trapped
by their neighbors and displacements are thereby limited. The lack of dependence of the
correlation coefficient on the delay time is further evidence for the arrested dynamics of
the rod system – such time-independence of correlations is characteristic of both gel34
and glass35 arrested dynamics. We note that R ≠ 1 either because of small residual motion
of the rods, or because of a small level of noise and instrument vibration that is recorded
by the measurement.

97
In Fig. 4.2, the region where the correlation value decreases linearly with volume fraction
means that there is a significant change in the intensity values of the pixels for the delay
times studied. This behavior implies that the rods in the suspension have significant
mobility, indicative of a suspension with fluid-like dynamics. The significant effect of
delay time on the correlation coefficient is further evidence of the fluid-like dynamics of
the rods in this volume fraction range (Recall that for single-particle diffusion,
characteristic displacements grow as the square root of time). Linear extrapolation from
the liquid phase region into the arrested phase region gives the onset volume fraction (ϕg)
for arrested dynamics. Such an analysis for the r=212 rod suspension studied in Fig. 4.2
gives
€
φg = 0.0029 ± 0.0002 . Similar analysis was performed for the suspensions
comprised of rods of other aspect ratio. These results are reported in Table 4.2.
In Fig. 4.3, we plot the onset volume fraction, henceforth referred to as a glass transition
volume fraction, φg, as a function of aspect ratio (solid squares). Also plotted in Fig. 4.3
are the naïve mode coupling theory (NMCT) ideal glass transition volume fractions for
tangent bead rods and spherocylinders22. The two upper dashed lines are the NMCT
predictions for the spherocylinders and tangent bead respectively (For these theoretical
results, behavior is only available for r < 40). The dashed upper line is a prediction by
Philipse et al., for an arrest volume fraction in a rod suspension when all translation
motions of a rod perpendicular to its long axis are blocked. Edwards and Evans using
self-consistent mean field theory predict an arrest volume fraction in a rod suspension,
which is aspect ratio dependent. They found the following relation, ϕarrest=0.785C/r, where
r=L/d is the aspect ratio of the rod1 and C is a numerical constant which has been set to
unity for plotting this prediction1. The dashed lower line in Fig. 4.3 is this Edwards and

98
Evans prediction. The solid line plotted in Fig. 4.3 is the minimum percolation volume
fraction of a random homogenous network of rods which is given as follows:
ϕpercolation=0.7/r. This percolation prediction of ϕpercolation=0.7/r represents a lower
boundary for the hard rod glass regime and is also in suitable agreement with the
Edwards and Evans prediction (ϕarrest=0.785/r). Our experimental results are slightly
lower than these predictions. The most plausible explanation for this result is that our rod
system has significant interactions. Modeling our data on the lines of Edwards and Evans
(ϕarrest=0.785C/r) yields a value of C=2.58 ± 0.18. A higher C value obtained compared to
unity explains the experimental data being below the theoretical and simulation scaling
predictions. It also indicates that non-idealities such as interactions might be present in
the rod system, which is causing this discrepancy. To further confirm this it is required
that we estimate the interaction potential for our model rod system. This is addressed
further in the discussion section.
4.4.2 Rheological Characterization
In Fig. 4.4 we show the elastic and viscous moduli, G’ and G’’ at a frequency, ω = 6.28
(1/s) as a function of % strain for two different volume fractions (φ=0.04 and 0.03) in the
glassy regime (above φg for that rod suspension). These measurements are for a rod
suspension with an aspect ratio, L/D = 28. Results are in close agreement with the strain
dependence of the elastic moduli seen in other soft glassy systems36-39. At low percent
strains both elastic modulus, G’ and storage modulus, G” are independent of % strain
reflecting the linear behavior. In the linear regime G’ is about an order of magnitude
higher than G”. With further increase in % strain, G’ decreases while G” passes through a
maximum before decreasing. The decrease is characteristic of yielding and liquid-like

99
behavior. The point at which G” crosses G’ signals the transition from a viscoelastic solid
to a viscoelastic liquid which is also termed as the yield point of the sample.
In Fig. 4.5 we plot the values of elastic modulus corresponding to the linear region or the
plateau region versus effective volume fraction, (φ-φg) for different aspect ratio rod
suspensions. (Here φg is obtained from confocal microscopy and image processing as
described before and (φ-φg) signifies the volume fraction contribution above the arrested
volume fraction for all the aspect ratios studied). Note that here we do not subtract the
liquid phase contribution to the elastic modulus because oscillatory shear experiments
showed that it could not be measured. The data show no dependence on the aspect ratio
of the rod. The most plausible explanation for this result is that the rod suspensions
investigated here all form a network structure. The viscoelasticity of such a network
structure is dictated by number of contact points in the network and the average length of
the rod between the contact points40, rather than the aspect ratio of the rod building
blocks. Given the lack of aspect ratio dependence we collect all the data together to
characterize a power law scaling exponent. A power law fit to the data reveals that G’
scales as (φ-φg)1.9±0.1. We address the magnitude of the power law scaling seen here later
in the discussion section. Lastly we would like to comment on the yield strain, εy,
obtained from the nonlinear rheological characterization (See Fig. 4.4). Yield strain
values for each of the rod suspensions studied were obtained from the maximum in the
viscous loss modulus (G’’)37. The dependence of εy on volume fraction for the different
aspect ratios is shown in Fig. 4.6. It is evident from Fig. 4.6. that the yield strain shows
no volume fraction dependence. In this regard our measurements appear to disagree with
viscoelastic measurements performed by Hough et al., on surfactant stabilized single

100
walled carbon nanotubes where a φ dependent εy was found49. So no comparison to their
φ dependent yield strain theory was possible.
4.5 Discussion
In Fig. 4.3, we observed that our experimental results are lower than the theoretical and
scaling predictions for the minimum volume fraction for percolation. Now these
theoretical and scaling predictions have been developed for rigid rods where the principle
mode of pair interactions between the rods is the excluded volume repulsion1, 41.
Therefore probable explanations for this discrepancy could be attributed to deviations of
the polyamide rods from hard rod behavior. Such deviations might include some
flexibility of the rods and/or potential interactions between the rods. We have addressed
both these issues below.
The effect of stiffness on our measurements can be quantified by calculating the
persistence length, Lp, for the rods. In this case we use a model of an inextensible elastic
beam where the ratio of bending stiffnes, κ, to the thermal energy (kBT) yields a
characteristic persistence length Lp= κ/kBT42. Bending stiffness can be calculated by the
following expression κ=EI, where E is the elastic modulus and I is the moment of inertia
about the rods axis. Such estimates have been used previously to estimate the Brownian
bending dynamics of single walled carbon nanotubes15. Based on this the persistence
length of the polyamide rods used in this study (L ~ 2.5 - 19 µm) is estimated to be ~
0.009 - 0.072 m, a value more than three orders of magnitude greater than the rod length.
From these estimates, one would conclude that that the polyamide rods are rigid since L
<< Lp. However, we include the observation that this estimate does not seem consistent
with observations of the rods by CLSM in the dilute limit. For example, for the high

101
aspect ratio rod suspension, L/D = 212, used in the study we observed apparent shape
fluctuations along the rods major axis when the rods are undergoing thermal undulations
in solution. This uncertainty would support future direct measurements of the persistence
length of the rods. Recently Duggal et al developed a fluorescence video microscopy
based method to analyze shape fluctuations of single walled carbon nanotubes in solution
to estimate their persistence lengths15. Using such a method for the high aspect ratio rods
in our case could in principle provide an independent estimate for the persistence length.
Interactions between colloidal rod particles can play a significant role in
determining their behavior in solution43. Here we have attempted to calculate the
interaction potential between two polyamide rods. There are two major contributions to
the interaction potential between the polyamide rods in our case: 1) repulsive electrostatic
interactions (UCharge) due to negative charges on the rods (independently measured via a
electrophoretic measurement) and 2) attractive van der Waals interactions (UVdW) due to
the random rod contacts present in our rod system. Therefore the total interaction
potential normalized by thermal energy, kBT, can be described as follows:
€ €
UTot
kBT=UVdW
kBT+UCh arg e
kBT.
The interaction is of course a function of the mutual orientation of the rods. Two limiting
cases can be identified in which the rods are either in parallel or perpendicular
orientations. Due to the complicated calculations for the general case of arbitrary
orientation, we restrict our calculations to the case of the two rods orientated in parallel,
since this case will yield the strongest interaction. Formulae for the van der Waals
interaction potential between two similar parallel rods has been derived and are given by

102
€
UVdW (r) =−AL R
24r32
, where A is the non retarded Hamaker constant, L is the length of the
rod, R is the radius of the rod and r is interaxial separation distance between the two
rods44. The above expression holds for small interaxial separations r < 2R. The
Coulombic or electrostatic interaction between two parallel rods has been analytically
developed by solving the linear Poisson-Boltzmann equation. The screened electrostatic
potential between two parallel rods of linear line charge density ξ is given by
€
UCh arg e (r) =2ξ 2
εrε0K0(
rλD) , where r is the interaxial distance between the rods, λD is the
Debye length, εr is the dielectric constant of the medium (in our case water), ε0 is the
permittivity in vaccum and K0 is the zeroth-order modified Bessel function of the second
kind45-48. The linear line charge density ξ is related to the surface charge density σ on a
rod with radius R as follows
€
ξ =2πσλDK1(
RλD)
, where K1 is the zeroth- order modified Bessel
function of the first kind45-48. The total interaction potential between two parallel rods
was calculated by using the above expressions for the van der Waal and electrostatic
interactions. Parameters used above in the estimating the potentials were obtained from
the following measurements and calculations: The surface charge density on the rods,
σ=0.00179 C/m2 used for calculating the electrostatic interactions was estimated from the
zeta potential measurement. The zeta potential was measured using a Zetasizer Nano
series (Malvern, United Kingdom) in a high salt limit (0.001 M KCl) where the
Smoluchowski equation can be applied. The non-retarded Hamaker constant for the
polyamide rods was estimated from Lifshitz theory44 to be 1.29E-20 J. The Debye length
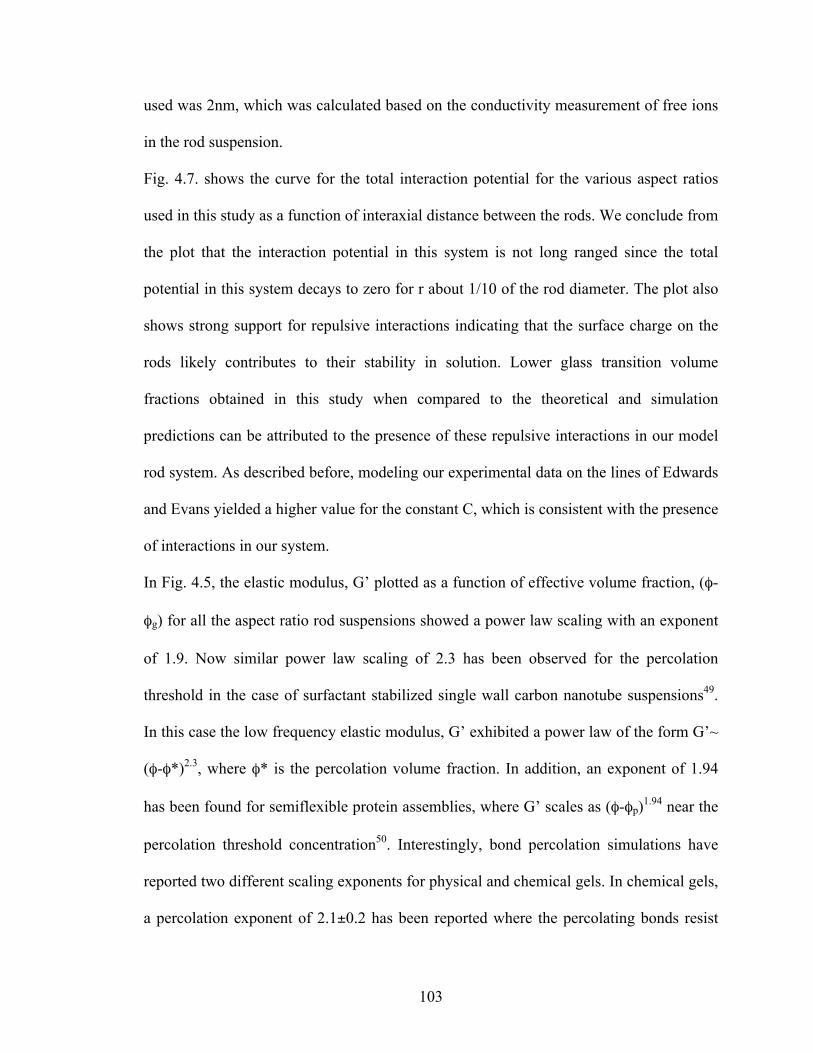
103
used was 2nm, which was calculated based on the conductivity measurement of free ions
in the rod suspension.
Fig. 4.7. shows the curve for the total interaction potential for the various aspect ratios
used in this study as a function of interaxial distance between the rods. We conclude from
the plot that the interaction potential in this system is not long ranged since the total
potential in this system decays to zero for r about 1/10 of the rod diameter. The plot also
shows strong support for repulsive interactions indicating that the surface charge on the
rods likely contributes to their stability in solution. Lower glass transition volume
fractions obtained in this study when compared to the theoretical and simulation
predictions can be attributed to the presence of these repulsive interactions in our model
rod system. As described before, modeling our experimental data on the lines of Edwards
and Evans yielded a higher value for the constant C, which is consistent with the presence
of interactions in our system.
In Fig. 4.5, the elastic modulus, G’ plotted as a function of effective volume fraction, (φ-
φg) for all the aspect ratio rod suspensions showed a power law scaling with an exponent
of 1.9. Now similar power law scaling of 2.3 has been observed for the percolation
threshold in the case of surfactant stabilized single wall carbon nanotube suspensions49.
In this case the low frequency elastic modulus, G’ exhibited a power law of the form G’~
(φ-φ*)2.3, where φ* is the percolation volume fraction. In addition, an exponent of 1.94
has been found for semiflexible protein assemblies, where G’ scales as (φ-φp)1.94 near the
percolation threshold concentration50. Interestingly, bond percolation simulations have
reported two different scaling exponents for physical and chemical gels. In chemical gels,
a percolation exponent of 2.1±0.2 has been reported where the percolating bonds resist

104
stretching but are free to rotate under effect of strain. While for physical gels a scaling
exponent of 3.75±0.11 has been found where the percolating bonds are amenable to both
stretching and rotating51. In contrast, experimental investigation of volume fraction
dependence of the elastic moduli in case of colloidal silica gels have revealed a exponent
of 3±0.5 which is in between the two bond percolation predictions. The similarity of the
exponent obtained in our experiments with the central force percolation theory obtained
for chemical gels suggest that our rods form a rod network of freely jointed rods which
resist stretching but are amenable to bending motions in the network.
4.6 Conclusion
In this work we have reported a study of the microstructure and rheology of a model rod
colloidal system in the vicinity of glass transition. We have developed a method based on
image correlation of spatial pixel intensity values to investigate the onset of arrested
dynamics in a rod suspension. The glass transition volume fractions obtained By CLSM
and image processing are found to be highly aspect ratio dependent and are lower than
the scaling and simulation predictions for minimum volume fraction for percolation. We
explain this discrepancy on the basis of repulsive attractions present in the model rod
system. Oscillatory shear experiments revealed an unique power law dependence for the
elastic modulus with volume fraction, irrespective of the aspect ratio of the rod. The
power law exponent obtained can be explained on the basis of a 3D percolation theory
where the major contribution to rod elasticity comes from bending of rods.

105
Figure 4.1: Representative 2D confocal micrographs of a rod suspension as a function of increasing rod volume fraction, ϕ, for a rod suspension with aspect ration, r = 212. (a) ϕ=0.0005, (b) ϕ=0.001, (c) ϕ=0.0025, (d) ϕ=0.005, (e) ϕ=0.01(f) ϕ=0.03.

106
Figure 4.2: Change of Correlation coefficient, R with volume fraction, ϕ as a function of increasing time intervals between images for a rod suspension with aspect ratio, r =212.

107
Figure 4.3: Plot of onset volume fraction Vs aspect ratio that compares our experimental values with existing rod theory predictions. The solid square symbols are the arrest volume fractions obtained via confocal microscopy and image processing. The top two dashed lines are the ideal glass transition volume fractions for spherocylinders and tangent bead rods obtained from NMCT theory. The dashed upper line is a prediction by Philipse et al., for an arrest volume fraction where one first sees arrest in a rod suspension due to no sideways translation movement possible. The lower solid line is the minimum percolation volume fraction of random homogenous rod network. The dashed lower line is the Edwards and Evans prediction for an arrest volume fraction for a highly entangled rod system where rotational diffusion of rods is seriously constrained. Error bars in this figure are less than the size of the datum points.

108
Figure 4.4: Elastic (G’) and Viscous moduli (G”) as a function of percent strain at an angular frequency of 6.28Hz.

109
Figure 4.5: Elastic modulus obtained from the plateau region of G’ Vs % strain curves (shown in Fig. 4.4) plotted as a function of effective volume fraction, (ϕ-ϕ g).

110
Figure 4.6: Volume fraction dependence of yield strain for the different aspect ratios studied.

111
Figure 4.7: Total interaction potential, UTot(r)/kBT between two parallel polyamide rods plotted as a function of interaxial distance between the rods. The surface charge density on the rods, σ=0.00179 C/m2 used for calculating the electrostatic interactions was estimated from the zeta potential measurement. The zeta potential was measured using a Zetasizer Nano series (Malvern, United Kingdom. The non-retarded Hamaker constant for the polyamide rods was estimated from Lifshitz theory to be 1.29E-20 J. The Debye length used is 2 nm.

112
T (°C) R =L/d
62 28±2
87 50±3
92 101±6
96 212±12
Table 4.1: Aspect ratios of all the rod suspensions synthesized and used in the study, as taken from measurements in Wilkins et al29., and confirmed by reflection CLSM imaging.

113
r =L/d ϕg
28±2 0.0146±0.0007
50±3 0.0081±0.0003
101±6 0.0053±0.0001
212±12 0.0029±0.0002
Table 4.2: Onset volume fraction, ϕg obtained from Confocal microscopy for all the aspect ratios studied.

114
4.7 References
1. Edwards, S. F.; Evans, K. E., Dynamics of highly entangled rod-like molecules. Journal of the Chemical Society-Faraday Transactions Ii 1982, 78, 113-121.
2. Lewis, J. A., Colloidal processing of ceramics. Journal of the American Ceramic Society 2000, 83, (10), 2341-2359.
3. Hasegawa, N.; Kawasumi, M.; Kato, M.; Usuki, A.; Okada, A., Preparation and mechanical properties of polypropylene-clay hybrids using a maleic anhydride-modified polypropylene oligomer. Journal of Applied Polymer Science 1998, 67, (1), 87-92.
4. Arnoldussen, T. C.; Rossi, E. M., Materials for magnetic recording. Annual Review of Materials Science 1985, 15, 379-409.
5. Inaba, H.; Ejiri, K.; Abe, N.; Masaki, K.; Araki, H., The advantages of the thin magnetic layer on a metal particulate tape. Ieee Transactions on Magnetics 1993, 29, (6), 3607-3612.
6. Lima, M. M. D.; Borsali, R., Rodlike cellulose microcrystals: Structure, properties, and applications. Macromolecular Rapid Communications 2004, 25, (7), 771-787.
7. Nishinari, K., Rheological and related studies on industrially important polysaccharides and proteins. Journal of Central South University of Technology 2007, 14, 498-504.
8. Hong, L.; Anthony, S. M.; Granick, S., Rotation in suspension of a rod-shaped colloid. Langmuir 2006, 22, (17), 7128-7131.
9. Magnin, A.; Piau, J. M., Application of freeze-fracture technique for analyzing the structure of lubricant greases. Journal of Materials Research 1989, 4, (4), 990-995.
10. Velikov, K. P.; van Dillen, T.; Polman, A.; van Blaaderen, A., Photonic crystals of shape-anisotropic colloidal particles. Applied Physics Letters 2002, 81, (5), 838-840.
11. Mohraz, A.; Moler, D. B.; Ziff, R. M.; Solomon, M. J., Effect of monomer geometry on the fractal structure of colloidal rod aggregates. Physical Review Letters 2004, 92, (15), 155503.
12. Wierenga, A.; Philipse, A. P.; Lekkerkerker, H. N. W.; Boger, D. V., Aqueous dispersions of colloidal boehmite: Structure, dynamics, and yield stress of rod gels. Langmuir 1998, 14, (1), 55-65.
13. Vigolo, B.; Coulon, C.; Maugey, M.; Zakri, C.; Poulin, P., An experimental approach to the percolation of sticky nanotubes. Science 2005, 309, (5736), 920-923.
14. Mohraz, A.; Solomon, M. J., Direct visualization of colloidal rod assembly by confocal microscopy. Langmuir 2005, 21, (12), 5298-5306.

115
15. Duggal, R.; Pasquali, M., Dynamics of individual single-walled carbon nanotubes in water by real-time visualization. Physical Review Letters 2006, 96, (24), 246104.
16. Mohraz, A.; Solomon, M. J., Gelation and internal dynamics of colloidal rod aggregates. Journal of Colloid and Interface Science 2006, 300, (1), 155-162.
17. Shetty, A. M.; Wilkins, G. M. H.; Nanda, J.; Solomon, M. J., Multiangle Depolarized Dynamic Light Scattering of Short Functionalized Single-Walled Carbon Nanotubes. Journal of Physical Chemistry C 2009, 113, (17), 7129-7133.
18. Fan, Z. H.; Advani, S. G., Rheology of multiwall carbon nanotube suspensions. Journal of Rheology 2007, 51, (4), 585-604.
19. Solomon, M. J.; Boger, D. V., The rheology of aqueous dispersions of spindle-type colloidal hematite rods. Journal of Rheology 1998, 42, (4), 929-949.
20. Letz, M.; Schilling, R.; Latz, A., Ideal glass transitions for hard ellipsoids. Physical Review E 2000, 62, (4), 5173-5178.
21. Philipse, A. P.; Verberkmoes, A., Statistical geometry of caging effects in random thin-rod structures. Physica a-Statistical Mechanics and Its Applications 1997, 235, (1-2), 186-193.
22. Yatsenko, G.; Schweizer, K. S., Glassy dynamics and kinetic vitrification of isotropic suspensions of hard rods. Langmuir 2008, 24, (14), 7474-7484.
23. Theenhaus, T.; Allen, M. P.; Letz, M.; Latz, A.; Schilling, R., Dynamical precursor of nematic order in a dense fluid of hard ellipsoids of revolution. European Physical Journal E 2002, 8, (3), 269-274.
24. Yatsenko, G.; Schweizer, K. S., Ideal vitrification, barrier hopping, and jamming in fluids of modestly anisotropic hard objects. Physical Review E 2007, 76, (4), 041506.
25. Yatsenko, G.; Schweizer, K. S., Ideal glass transitions, shear modulus, activated dynamics, and yielding in fluids of nonspherical objects. Journal of Chemical Physics 2007, 126, (1), 014505.
26. Schilling, T.; Jungblut, S.; Miller, M. A., Depletion-induced percolation in networks of nanorods. Physical Review Letters 2007, 98, (10), 108303.
27. Trappe, V.; Sandkuhler, P., Colloidal gels - low-density disordered solid-like states. Current Opinion in Colloid & Interface Science 2004, 8, (6), 494-500.
28. Solomon, M. J.; Spicer, P. T., Microstructural regimes of colloidal rod suspensions, gels and glasses. Soft Matter 2010, 6, (7), 1391-1400.
29. Wilkins, G. M. H.; Spicer, P. T.; Solomon, M. J., Colloidal System To Explore Structural and Dynamical Transitions in Rod Networks, Gels, and Glasses. Langmuir 2009, 25, (16), 8951-8959.
116
30. Mukhija, D.; Solomon, M. J., Translational and rotational dynamics of colloidal rods by direct visualization with confocal microscopy. Journal of Colloid and Interface Science 2007, 314, (1), 98-106.
31. Chinga, G.; Syverud, K., Quantification of paper mass distributions within local picking areas. Nordic Pulp & Paper Research Journal 2007, 22, (4), 441-446.
32. Berne, B. J.; Pecora, R., Dynamic Light Scattering. J Wiley, New York: 1976.
33. Koumakis, N.; Schofield, A. B.; Petekidis, G., Effects of shear induced crystallization on the rheology and ageing of hard sphere glasses. Soft Matter 2008, 4, (10), 2008-2018.
34. Solomon, M. J.; Varadan, P., Dynamic structure of thermoreversible colloidal gels of adhesive spheres. Physical Review E 2001, 63, (5), 051402.
35. Vanmegen, W.; Underwood, S. M.; Pusey, P. N., Dynamics of hard spherical colloids from the fluid to the glass. Journal of the Chemical Society-Faraday Transactions 1991, 87, (3), 395-401.
36. Derec, C.; Ducouret, G.; Ajdari, A.; Lequeux, F., Aging and nonlinear rheology in suspensions of polyethylene oxide-protected silica particles. Physical Review E 2003, 67, (6), 061403.
37. Helgeson, M. E.; Wagner, N. J.; Vlassopoulos, D., Viscoelasticity and shear melting of colloidal star polymer glasses. Journal of Rheology 2007, 51, (2), 297-316.
38. Mason, T. G.; Lacasse, M. D.; Grest, G. S.; Levine, D.; Bibette, J.; Weitz, D. A., Osmotic pressure and viscoelastic shear moduli of concentrated emulsions. Physical Review E 1997, 56, (3), 3150-3166.
39. Senff, H.; Richtering, W.; Norhausen, C.; Weiss, A.; Ballauff, M., Rheology of a temperature sensitive core-shell latex. Langmuir 1999, 15, (1), 102-106.
40. Hill, R. J., Elastic Modulus of Microfibrillar Cellulose Gels. Biomacromolecules 2008, 9, (10), 2963-2966.
41. Philipse, A. P., The random contact equation and its implications for (colloidal) rods in packings, suspensions, and anisotropic powders. Langmuir 1996, 12, (5), 1127-1133.
42. Larson, R. G., The Structure and Rheology of Complex Fluids. New York: Oxford University Press: 1999.
43. Russel, W. B.; D.A., S.; Schowalter, W. R., Colloidal Dispersions. Cambridge University Press: 1989.
44. Israelachvilli, J. N., Intermolecular and Surface forces: With applications to colloidal and biological systems. 1985.

117
45. Brenner, S. L.; McQuarri.Da, Theory of electrostatic interaction between parallel cylindrical polyelectrolytes. Journal of Colloid and Interface Science 1973, 44, (2), 298-317.
46. Brenner, S. L.; Parsegia.Va, Physical method for deriving electrostatic interaction between rod-like polyions at all mutual angles. Biophysical Journal 1974, 14, (14), 327-334.
47. Ohshima, H., Electrostatic interaction between two parallel cylinders. Colloid and Polymer Science 1996, 274, (12), 1176-1182.
48. Ohshima, H., Surface charge density surface potential relationship for a cylindrical particle in an electrolyte solution. Journal of Colloid and Interface Science 1998, 200, (2), 291-297.
49. Hough, L. A.; Islam, M. F.; Hammouda, B.; Yodh, A. G.; Heiney, P. A., Structure of semidilute single-wall carbon nanotube suspensions and gels. Nano Letters 2006, 6, (2), 313-317.
50. van der Linden, E.; Parker, A., Elasticity due to semiflexible protein assemblies near the critical gel concentration and beyond. Langmuir 2005, 21, (21), 9792-9794.
51. Sahimi, M.; Arbabi, S., Mechanics of disordered solids .2. percolation on elastic networks with bond-bending forces. Physical Review B 1993, 47, (2), 703-712.
118
CHAPTER 5 CONCLUSIONS AND FUTURE WORK
5.1 Conclusions
In this thesis we have developed novel experimental techniques to characterize
microstructure in complex fluids and we have been successful in relating the
microstructure to rheological performance of complex fluids. In this chapter we
summarize the key findings of this study.
In Chapter 2, the problem of PEO aggregation in aqueous solution was
investigated and its role in turbulent drag reduction was quantified by using a novel
experimental design, which involved a unique chaotropic/inorganic salt and simultaneous
dynamic light scattering/fluid dynamics methodology to study dilute PEO aggregate flow
properties. The DLS relaxation spectra of high molar mass dilute aqueous PEO solutions
showed a unique scaling for the relaxation rate with a power law exponent of there. This
scaling was found consistent with internal fluctuations of a large polymer aggregate coil.
Addition of an inorganic (MgSO4) or chaotropic salt (GuS) decreased the power law
scaling exponent of the relaxation rate from three to two. This shift of the power law
scaling exponent from three (indicative of aggregate dynamics) to two (characteristic of
polymer center-of-mass diffusion) showed that these salts are effective de-aggregation
agents for PEO. Further it was also shown that such modulation of aggregate structure in
PEO is directly related to its drag reduction performance in fluid flow applications. These
results have improved our fundamental understanding of the behavior of dilute PEO
119
solutions in flow by demonstrating the effect of salt on aggregate structure and by linking
aggregate structure to flow behavior of PEO.
In Chapter 3, we showed that Multi- angle depolarized dynamic light scattering
(MA-DDLS) can be used as a potential tool to characterize single walled carbon
nanotubes (SWCNTs). Multi-angle DDLS is shown to be a simple, non-invasive tool for
determination of the length and diameter of SWCNTs. The length and diameter of the
nanotubes were determined from independent translational and rotational diffusion
coefficient measurements in the dilute limit, with considerable advantages relative to
other sizing techniques such as atomic force microscopy and transmission electron
microscopy. The method developed is of considerable merit since it reduces the need to
use time-consuming microscopy based methods. The bounds of applicability of the MA-
DDLS method were also discussed.
In Chapter 4, CLSM and rheology was used to characterize the microstructure and
dynamics of a model rod system. An image processing method based on image
correlation of spatial pixel intensity values was developed to characterize the change in
rod suspension dynamics from liquid to glassy as the rod volume fraction was increased.
The glass transition volume fractions obtained were found to be highly aspect ratio
dependent and were found to be lower than the scaling and simulation predictions for
aspect ratio dependent percolation. Such deviations of the polyamide rods from hard rod
behavior were attributed to the flexibility of the rods and/or potential interactions
between rods. Rheological experiments revealed a unique power law dependence for the
elastic modulus with volume fraction. The scaling exponent obtained was also found to
be independent of the aspect ratio of the rod. The power law exponent obtained via

120
rheology was explained on the basis of a 3D percolation theory where the major
contribution to rod elasticity comes from bending of the rods. These results can broadly
be applied for developing complex fluid stabilization strategies, which play a key role in
consumer products such as shampoo, detergents, gels etc. Another merit of this work is
that these experimental data can be used for validation of existing rod network or gel
theories.
5.2 Future Work
In Chapter 2, a lower bound on the size of PEO aggregates was placed and this was found
to be around 740 nm and a DLS device that can probe q<< 1.33 µm-1 or θ<<6° was
suggested, where q and θ are the wave vector and scattering angle respectively. The way
forward to improve this estimate would be a nice extension for the work done in Chapter
2. Current DLS instruments do not have the capability to probe polymer dynamics at such
low scattering angles or wave vectors. Thus this would require that a small angle
dynamic light scattering device be built which can probe such small wave vectors. In a
sufficiently small angle limit the DLS spectra of dilute PEO solutions would be
consistent with centre of mass diffusion of multi-molecule aggregates with an effective
hydrodynamic size that is many times greater than the hydrodynamic response of a single
molecule of PEO1. Therefore a small angle dynamic light scattering device would have
the capability to probe centre of mass diffusion of large aggregate coils such as of those
of PEO. Such small angle DLS instruments have recently become available where the
polymer dynamics can be measured at angles as low as 0.4°2, 3. The device relies on
measuring autocorrelation functions by resolving the time dependence of the speckle
121
pattern on a CCD camera2. These correlations once measured can then be analyzed using
the CONTIN algorithm4 to give an effective coil size for the PEO aggregate.
In Chapter 2 the MA-DDLS has been successfully applied to short functionalized
monodisperse carbon nanotubes. The data analysis procedure used in Chapter 2 assumed
that the single walled carbon nanotubes (SWCNTs) used are rigid. This was a reasonable
assumption since a recent study has shown that SWCNTs up to about 1 µm in length can
be treated as rigid5. But often carbon nanotubes used for several applications are longer
(several µms in length) and also the distribution of lengths may not be monodisperse. The
MA-DDLS method should be extended to longer carbon nanotubes in a future study. For
longer rods, it would require that the equations used for modeling the polarized and
depolarized correlation functions be modified to include the effects of finite flexibility
and polydispersity6, 7.
In chapter 3 the change in microstructure and dynamics in a model rod system
was studied both as a function of aspect ratio and volume fraction. There might be other
parameters, which were not investigated in this study such as the interaction potential
between the rods, which might have considerable effect on arrested dynamics of rod
suspensions. The effect of interaction potential on glassy dynamics of rod suspensions
would be an interesting future study. The interaction potential between the rods can be
varied by a polymer induced depletion interaction8 and the effect of this on glass
transition volume fractions, φg, would greatly improve fundamental understanding of rod
network formation. Also the effect of stiffness on our measurements is uncertain at this
point. This uncertainty would require a future study where the persistent length of the
rods could be measured. In this regard a recent technique developed by Duggal et al.,

122
would be handy. The method relies on estimating shape fluctuations of rods in solvents to
estimate their persistent lengths5.

123
5.3 References
1. Shetty, A. M.; Solomon, M. J., Aggregation in dilute solutions of high molar mass poly(ethylene) oxide and its effect on polymer turbulent drag reduction. Polymer 2009, 50, (1), 261-270.
2. Cipelletti, L.; Weitz, D. A., Ultralow-angle dynamic light scattering with a charge coupled device camera based multispeckle, multitau correlator. Review of Scientific Instruments 1999, 70, (8), 3214-3221.
3. Ferri, F., Use of a charge coupled device camera for low-angle elastic light scattering. Review of Scientific Instruments 1997, 68, (6), 2265-2274.
4. Provencher, S. W., Contin - a general-purpose constrained regularization program for inverting noisy linear algebraic and integral-equations. Computer Physics Communications 1982, 27, (3), 229-242.
5. Duggal, R.; Pasquali, M., Dynamics of individual single-walled carbon nanotubes in water by real-time visualization. Physical Review Letters 2006, 96, (24), 246104.
6. Mansfield, M. L.; Douglas, J. F., Transport properties of rodlike particles. Macromolecules 2008, 41, (14), 5422-5432.
7. Pecora, R., Dynamic Light Scattering: Applications of Photon Correlation Spectroscopy. Plenum Press, New York and London: 1985.
8. Wilkins, G. M. H.; Spicer, P. T.; Solomon, M. J., Colloidal System To Explore Structural and Dynamical Transitions in Rod Networks, Gels, and Glasses. Langmuir 2009, 25, (16), 8951-8959.


![University of Groningen Nonlinear dynamics of melted ... · Polymer liquids show very rich and complex rheological behavior [1-3]. While recent research efforts were focused on dynamics](https://img.dokumen.tips/doc/110x75/5f95254b10b40c72276ee8d7/university-of-groningen-nonlinear-dynamics-of-melted-polymer-liquids-show-very.jpg)