Embed Size (px)
Citation preview

New York City Department of Environmental Protection
Conine Project Water Quality Monitoring Report
December 2012
Prepared in accordance with Section 4.6 of the July 2007 United States Environmental Protection Agency Filtration Avoidance Determination
Carter H. Strickland, Jr., Commissioner Department of Environmental Protection
Paul V. Rush, P.E., Deputy Commissioner
Bureau of Water Supply


i
Table of Contents Table of Contents ............................................................................................................................. i List of Figures ................................................................................................................................ iii List of Tables ................................................................................................................................. iii Executive Summary ........................................................................................................................ 1 1. Introduction ............................................................................................................................. 3
Background ................................................................................................................................. 3 2. The Conine Stream Restoration Project .................................................................................. 7 3. Conine Restoration Project Water Quality Monitoring Program ........................................... 9
Background ................................................................................................................................. 9 Sampling Locations ................................................................................................................ 9 Streamflow Estimates ........................................................................................................... 11 Loading Calculations ............................................................................................................ 11 Study Period .......................................................................................................................... 11
4. Results and Discussion ......................................................................................................... 15 4.1 Loading ......................................................................................................................... 15 4.2 Flow-Concentration Relationships................................................................................ 18
5. Conclusion ............................................................................................................................ 23 References ..................................................................................................................................... 25


iii
List of Figures Figure 1-1 The Red Falls restoration project, Phase I proposed area, 2005. ................................. 4 Figure 1-2 The Red Falls restoration project, Phase II proposed area, 2005. ................................ 5 Figure 2-1 Conine Project Pre-Restoration, 2005. ......................................................................... 8 Figure 2-2 Conine Project Post-Restoration, 2009. ....................................................................... 8 Figure 3-1 Batavia Kill sampling locations. .................................................................................... Figure 3-2 Autosampler on the Batavia Kill at Red Falls (S10). ..................................................... Figure 3-3 The Batavia Kill sampling location (S10) before (a, b, and c) and after Tropical Storm Irene (d). ............................................................................................................................. 14 Figure 4-1 Turbidity “Loading” at the Conine Project area upstream and downstream sites for before and after the installation of the project. ............................................................................. 15 Figure 4-2 Total Suspended Solids Loading (kg) at the Conine Project area upstream and downstream sites for before and after the installation of the project. ........................................... 16 Figure 4-3 A comparison of the upstream turbidity “load” vs. the downstream turbidity “load” before and after the Conine project installation. ............................................................................... Figure 4-4 A comparison of the upstream total suspended solids loads vs. the downstream load before and after the Conine project installation. ........................................................................... 18 Figure 4-5 Turbidity vs. flow at the time of sample before and after project installation at a) the site above the Conine restoration project (S10-RF) and b) the site below the Conine restoration project (S10).................................................................................................................................. 20 Figure 4-6 Total suspended solids concentration vs. flow at the time of sample before and after project installation at a) the site above the Conine Restoration Project (S10-RF) and b) the site below the Conine Restoration Project (S10). .................................................................................... Figure 5-1 Conine Project in relation to S10 and additional mass failures below the project area, but upstream of the sampling location. ......................................................................................... 24
List of Tables Table 1-1 Stream Restoration Projects installed on the Batavia Kill and West Kill, 1999-2011. . 3 Table 3-1 Turbidity and total suspended solids samples collected during storm events from April 2004-March 2011. ......................................................................................................................... 13


1
Executive Summary Section 4.6 of the 2007 FAD requires the New York City Department of Environmental
Protection (DEP) to submit a report on the Conine Water Quality Monitoring project by December 31, 2012. The objective of this monitoring program was to quantify the effectiveness of a stream restoration project at reducing turbidity and suspended sediment in the Batavia Kill stream.
The monitoring program was based on collecting samples during storm events both
upstream and downstream of the project area before and after implementation of the project. It was assumed that if the turbidity and suspended sediment loads in the Batavia Kill before and after restoration could be quantified, then the potential impact of the project on these loads could be evaluated. Samples from storm events were collected for more than six years. Before project construction, more than three years of sampling was conducted at sites above and below the Conine project area. After construction of the project, sampling was continued for another three years in an effort to determine the project’s potential impact on turbidity and total suspended sediment in the Batavia Kill. The monitoring of total suspended solids and turbidity loading before and after restoration at the Conine stream restoration project in Ashland, NY, on the Batavia Kill, did not demonstrate a conclusively significant change in either variable over a range of flows. While there was a slight decline in the concentration vs. flow relationships below the site, the change was relatively small and the data were highly variable, so the practical significance of this change with regard to turbidity and total suspended concentrations is not compelling. The study’s findings are discussed in the conclusion of the report.


3
1. Introduction Background
The New York City Department of Environmental Protection (DEP) Stream Management Program (SMP), established as part of the DEP’s Filtration Avoidance Program, is a partnership working to protect and/or restore achievable levels of stream system stability and ecological integrity by facilitating the long term stewardship of NYC West of Hudson streams and floodplains. The framework for the program is the City’s partnership with soil and water conservation districts and Cornell Cooperative Extension of Ulster County to develop stream management plans and implement their recommendations. Stream management plans prioritize reaches for various levels of intervention, including stream restoration.
Stream restoration projects are a core element of the SMP. To date, the SMP and its partners have designed and constructed stream restoration projects at more than 30 reaches throughout the West of Hudson Watershed. This monitoring study at the Conine Project is located on the Batavia Kill, a major tributary to the Schoharie Creek in Greene County, NY. Observations and sampling have documented that the Batavia Kill delivers a significant quantity of suspended sediment and turbid water to Schoharie Creek, the main inflow to Schoharie Reservoir. On the Batavia Kill prior to the close of the monitoring in August 2011, five restoration projects had sought to restore stream system stability on a total of 2.9 miles of the stream, as depicted in Table 1-1. Table 1-1 Stream Restoration Projects installed on the Batavia Kill and West Kill, 1999-2011. Stream Restoration Project Year Built Project Length (ft)
Batavia Kill Brandywine 1999 3,800 Maier Farm 1999 1,650 Big Hollow 2001 5,130 Ashland Connector 2006 3,400 Conine 2007 1,650
The SMP promotes an approach to stream and floodplain management that advocates the use
of natural channel design (NCD) as an important approach to restoring “stability” and proper functioning condition to a stream reach, in part because this enables multiple goals to be achieved. The NCD approach is founded in the application of fluvial geomorphic (stream form and function) principles to stream channel restoration and streambank stabilization. The stated goals of these projects include a water quality benefit through minimizing erosion of streambanks and the streambed, protecting adjacent infrastructure and property (flood hazard mitigation), and enhancing habitat qualities.
The SMP has been perceived as a turbidity reduction program because its projects address
eroding streambanks and thus the most visible pollutant from this source is suspended sediments. The ability of stream restoration projects to reduce turbidity has been of interest to watershed stakeholders since the SMP’s inception. Previously, DEP sought quantitative evaluation of the

4
impact of stream restoration on turbidity by monitoring changes in streambank erosion rates pre- and post-restoration at three restoration projects on the Batavia Kill in cooperation with Greene County Soil and Water Conservation District (GCSWCD). In that study, statistically significant reductions in bank erosion rates were specifically attributable to restoration projects (Chen et al. 2004, Chen et al. 2005).
In a parallel effort, DEP also initiated a water quality sampling program above and below one restoration project site, attempting to capture the impact of restoration on turbidity loading and total suspended sediment concentration after restoration as compared to before restoration, as discussed later in this report. Attempting to monitor a reduction in stream turbidity from a single, localized demonstration project given the extremely high natural background loading and variability of suspended sediment in this particular geologic setting has been the primary challenge to designing an effective study. For this reason, the site selection process was extremely important. DEP believes that to succeed, the site selected must have a significant turbidity “signal,” above versus below loading or concentration, in its pre-restored condition. To identify a site of this contributing magnitude, DEP initiated extensive storm event sampling beginning in 1995. The “Red Falls” site in Prattsville, aptly named for its red color in storm events, was identified because of its expansive size and contribution to turbidity on the Batavia Kill. The Red Falls Project encompassed two sites, Phase I and Phase II. Phase I was above the Falls itself (shown below), and Phase II included a reach approximately 1,600 feet downstream of the Falls, owned at the time by the Conine family, and now by DEP.
Figure 1-1 The Red Falls restoration project, Phase I proposed area, 2005.

Introduction
5
Through its SMP contract with GCSWCD, DEP began the extensive stream geomorphic and hillslope geotechnical assessments, and topographic surveys necessary to commence the design of a restoration project. In 2005, the Phase I project area was deemed infeasible due to extensive additional geotechnical monitoring requirements taken together with limitations imposed by the State Historic Preservation Office that identified a rare complete mill complex and extensive features of unusual significance (among the most important in NYS) at the Red Falls site. After consultation with EPA, additional design effort ceased at the Red Falls Phase I. Because the monitoring plan underway by DEP encompassed the downstream Phase II reach, DEP decided to continue the study and focus instead on the impact of restoration at the Phase II site. As a result, the Red Falls project was renamed the Conine project.
Figure 1-2 The Red Falls restoration project, Phase II proposed area, 2005.


7
2. The Conine Stream Restoration Project
The GCSWCD oversaw all aspects of the design of the Conine stream restoration project between 2005 and 2007. Stream restoration projects seek to mimic the naturally occurring dynamic equilibrium in streams -- a “most probable state” for hydraulic geometry variables that result from the variable flow and sediment regime paired with the channel boundary conditions. The general approach to natural stream channel design is to estimate that “most probable state” and determine how to best achieve the channel form within the project constraints, and then realize that state with the minimum possible intervention. For the Conine project, GCSWCD used traditional engineering regime equations in addition to the natural channel design approach. The channel was designed to provide for sediment transport and passage of the base, bankfull and flood flows, with considerations for future channel boundary conditions and provides both riffles and pools appropriate to the valley setting, which change in their shape, length and spacing as the channel meanders through the reach.
The design incorporated three general types of in-stream structures to promote reach stability including; rock vanes, cross vanes, and root wads. The structures also provided significant benefits by enhancing fisheries habitat through the reach, while generating a bed and bank form suitable for the proposed stream type. The use of five rock vanes was employed to impede bank erosion by reducing shear stress along the streambanks to allow for the establishment of vegetation and creating scour pools downstream, thus enhancing fisheries habitat. The vanes were keyed into the streambanks to a minimum of 20 feet to prevent scour and flanking of the structures in large flood events. Two rock cross vanes were installed through the project length to provide grade control for the channel bottom. The cross vane structures re-directed channel currents and provide energy dissipation, while maintaining transitions between physical bed features. Construction of the project began in August 2007 and was completed in November 2007.
Establishment of an effective riparian buffer zone is critical to the long term success of a stream restoration projects. A combination of dormant plant material, conservation seed mixtures, and plantings of live trees and shrubs were employed to initiate the development of a functioning riparian community in the disturbed floodplain and along the streambanks. The GCSWCD completed its Conine Stream Restoration Project Design and Implementation Report in 2009, with photographs documenting pre- and post-restoration condition and the construction process (see http://www.catskillstreams.org/pdfs/projectmappdfs/schohariepdfs/coninepdf). The GCSWCD has overseen geomorphic monitoring of the restoration project since construction to determine if the project has adjusted its planform, dimension or profile beyond what is expected and acceptable. Monitoring results show very minimal adjustment during the monitoring study, within expected and acceptable ranges. The monitoring report can be viewed at http://www.catskillstreams.org/pdfs/Conine_report.pdf.
8
Figure 2-1 Conine Project Pre-Restoration, 2005.
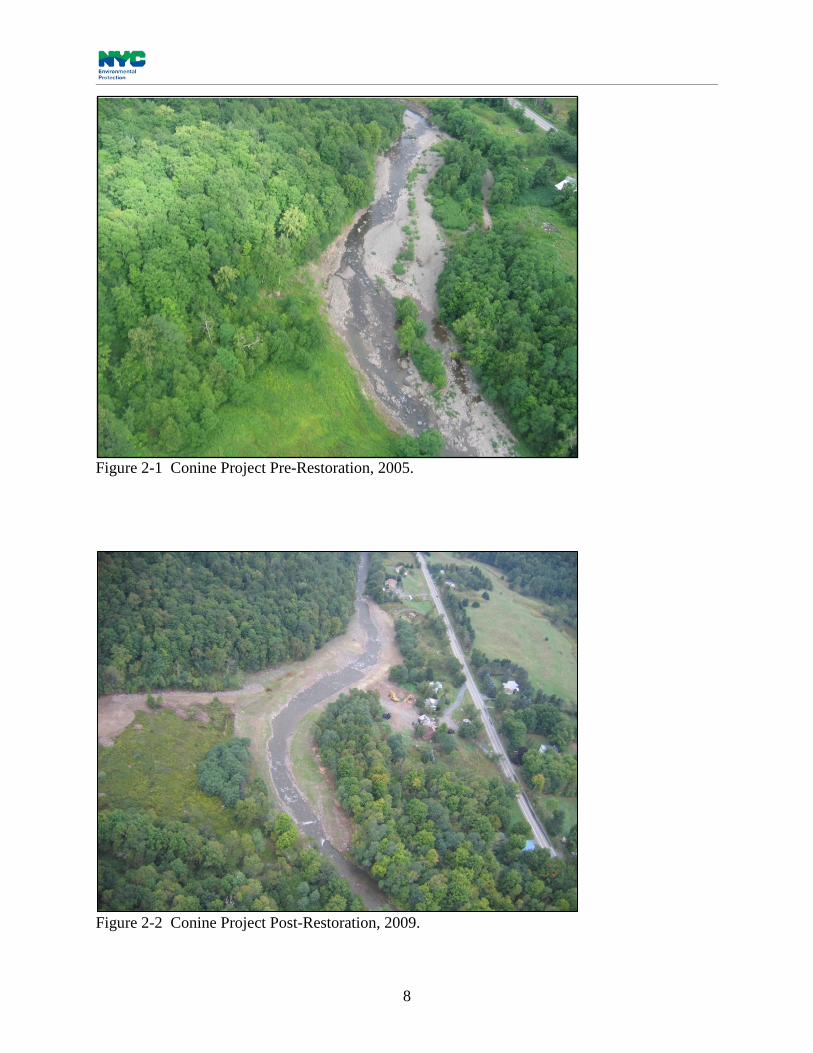
Figure 2-2 Conine Project Post-Restoration, 2009.

9
3. Conine Restoration Project Water Quality Monitoring Program
Background The objective of this monitoring program was to quantify the effectiveness of a stream
restoration project at reducing turbidity and suspended sediment in the Batavia Kill stream. A monitoring program was designed for the Conine Project that was based on collecting samples during storm events both upstream and downstream of the project area before and after implementation of the project. It was assumed that if the turbidity and suspended sediment loads in the Batavia Kill before and after restoration could be quantified, then the potential impact of the project on these loads could be evaluated. Sampling Locations The sampling program for the Conine project included three sampling sites (see Figure 3-1). These were:
Site code S10: Batavia Kill (~1 mile) downstream of the Conine project area. The site was located just upstream from the Rt. 23A bridge, near the confluence of the Batavia Kill and Schoharie Creek. Site code S10-RF: Batavia Kill at Red Falls, between the Red Falls and Conine Restoration project zones. Site code SBB: Brandau Brook, a small tributary that enters the Batavia Kill immediately below the Red Falls waterfall, between sites S10-RF and S10, and which also contributes a quantity of sediment to the Batavia Kill.

10
Autosamplers were installed at each location to allow collection of samples during storm events, as the timing and intensity of storms cannot always be predicted accurately. The goal was to collect several storms throughout the year, including several autumn storms, a mid-winter thaw event, spring storms, and any major summer storms. Samples were collected from the onset of the storm and sampling continued through the end of the storm until the streamflow had quit falling. A subset of the collected samples were selected and submitted for laboratory analysis of turbidity and total suspended solids. Samples were selected based on a review of the storm hydrograph. The goal was to select a baseline sample before the stream began to rise, several samples on the rising limb of the hydrograph, samples near the peak of the hydrograph, and some samples on the falling limb of the hydrograph.
S10-RF
S10
Conine Project Area
SBB
Figure 3-1 Batavia Kill sampling locations.
Figure 3-2 Autosampler on the Batavia Kill at Red Falls (S10).

Conine Restoration Project Water Quality Monitoring Program
11
Streamflow Estimates The streamflow data for the hydrographs and loading calculations were provided by either the U.S. Geological Survey (USGS) gage on Batavia Kill at Red Falls or by DEP staff following USGS protocols. The discharge for the S10-RF monitoring site came directly from the USGS gage, and the discharge at the downstream site (S10) was estimated by applying a correction factor to account for the difference in drainage basin size between the two sites. (The drainage area for the S10-RF site is 177.6 km2 (68.6 mi2), while the drainage area for S10 is 188.7 km2 (72.8 mi2), so the flow at S10-RF was multiplied by 1.06 to estimate the flow at the S10 site. DEP developed a stream stage height-flow relationship at the Brandau Brook site (SBB). Stage height was measured every 15 minutes by a pressure transducer and recorded by a datalogger. The developed rating equations were applied to these data to estimate flow for this particular site. Loading Calculations
Loading estimates for total suspended solids for the time period represented by each sample are calculated in kilograms (kg) based on sample concentrations and flow values. Total event loads are then determined by the summation of these individual estimates. Turbidity loads are calculated based on the NTU values for each sample to assist in determining the relative contribution of turbidity from each sample location, but it should be noted that turbidity loads are not strictly a mass load because turbidity readings are not a concentration. However, it can be regarded in a similar manner, and considered a quasi-load. The loadings from Brandau Brook (SBB) and the Red Falls (S10-RF) sites were combined to provide an estimate of the loading upstream of the Conine project and compared to the downstream site (S10). Study Period
As discussed above, the original study plan was to monitor a project in the Red Falls area, upstream of the Conine project. Sampling began in 1998. However, because the original project could not be constructed, the sampling plan was changed to target the Conine project, which was completed in 2007. To have a balanced approach to assessing the potential impacts of the project on water quality, this report focuses on samples collected from 2004-2007 for the pre-implementation phase of the project, and from 2008-2011 as the post-implementation phase, i.e. about three and a half years of sampling before and after the project.

12
Table 3-1 lists the sample dates and number of samples submitted from each site for each storm for turbidity and total suspended solids, respectively. It should be noted that total suspended solids were not analyzed for the August 21-24, 2009 event. Also, samples were not collected from the Brandau Brook site (SBB) for the April 15-18, 2007, the August 21-24, 2009, and the March 5-14, 2011 events. However, the contribution of Brandau Brook to the loadings was generally less than two percent, so in these cases the upstream load used in the analysis was derived only from the Batavia Kill at Red Falls site (S10-RF). Also, the peak flow for each storm at the USGS gage on the Batavia Kill at Red Falls is also included in the table.

Conine Restoration Project Water Quality Monitoring Program
13
Table 3-1 Turbidity and total suspended solids samples collected during storm events from April 2004-March 2011. The peak stormflow from the USGS gage on Batavia Kill at Red Falls for each event is also listed.
Storm
ID
Start Date
End Date
Number of Turbidity Samples
Number of Total Suspended Solids
Samples Peak Stormflow at Red Falls (cfs) S10 S10-RF SBB S10 S10-RF SBB
34 04/12/04 04/15/04 14 13 14 14 13 14 321 35 08/12/04 08/15/04 11 13 15 11 13 15 1,370 36 09/17/04 09/20/04 18 13 5 18 13 5 9,070 38 11/28/04 11/30/04 15 15 15 15 15 15 1,390 40 03/28/05 04/06/05 38 40 33 38 40 33 10,000 41 10/07/05 10/10/05 15 15 13 15 15 13 321 42 10/24/05 10/27/05 8 11 6 8 11 6 2,270 43 11/29/05 12/01/05 13 14 14 13 14 14 2,620 44 01/13/06 01/16/06 11 11 8 11 11 8 826 45 06/26/06 06/30/06 24 21 8 24 21 8 3,070 46 10/20/06 10/23/06 11 5 10 11 5 10 596 47 10/27/06 10/30/06 15 17 17 15 17 17 1,060 48 11/16/06 11/18/06 9 10 10 9 10 10 1,520 49 04/15/07 04/18/07 16 15 - 16 15 - 11,200
The Conine restoration project was installed in August 2007 and plantings completed in November 2007. 50 10/11/07 10/13/07 16 16 10 16 16 10 506 51 10/26/07 10/29/07 12 13 11 12 13 11 943 52 11/15/07 11/16/07 14 11 10 14 11 10 906 53 07/23/08 07/25/08 16 17 10 16 17 10 513 54 09/06/08 09/08/08 6 7 7 6 7 7 70 56 08/21/09 08/24/09 17 17 - - - - 175 57 01/22/10 01/27/10 16 19 18 16 19 18 3,390 58 03/12/10 03/19/10 16 15 13 16 15 13 1,010 59 09/29/10 10/04/10 15 15 13 15 15 13 8,917 60 10/14/10 10/17/10 14 14 14 14 14 14 925 61 11/30/10 12/03/10 15 15 9 15 15 9 2,718 62 03/05/11 03/14/11 21 18 - 21 18 - 3,626
The autosamplers and other equipment at these sites were washed away and lost by the floodwaters from Tropical Storm Irene, effectively bringing an end to the sampling program (see Figure 3-3).

14
Figure 3-3 The Batavia Kill sampling location (S10) before (a, b, and c) and after Tropical Storm Irene (d).
a) b)
c) d)

15
4. Results and Discussion 4.1 Loading
Storm loads were calculated for sites above and below the Conine project area to determine the quantity of turbidity and sediment entering and leaving the project area. Loadings from a variety of storms were determined before (April 2004-March 2007) the project was installed and after (Oct. 2007-March 2011) the project was installed. The project was completed in August 2007 and plantings installed in November 2007. Due to the nature of the Batavia Kill watershed a large quantity of turbidity and sediment are produced upstream of the project area. Additional turbidity and sediment are entrained into the stream as the stormflow passes through the project area. The objective of the sampling was to determine if the Conine project reduced the contribution from the project reach compared to the upstream loading.
Figure 4-1 displays the results for the turbidity “loadings.” Figure 4-2 shows results for the suspended sediment loadings. In general the project did not impact the loadings, and similar quantities of sediment and turbidity were added to the storm load from the project area before and after the installation of the stream restoration project.
Figure 4-1 Turbidity “Loading” at the Conine Project area upstream and downstream sites for before and after the installation of the project. The stormflow peak for each storm is also displayed. Also, the upstream contribution for the following three storms did not include an estimate of turbidity loading from Brandau Brook: April 15-18, 2007, August 21-24, 2009, and March 5-14, 2011.

16
Figure 4-2 Total Suspended Solids Loading (kg) at the Conine Project area upstream and downstream sites for before and after the installation of the project. The stormflow peak for each storm is also displayed. Also, the upstream contribution for the following two storms did not include an estimate of total suspended solids loading from Brandau Brook: April 15-18, 2007 and March 5-14, 2011.
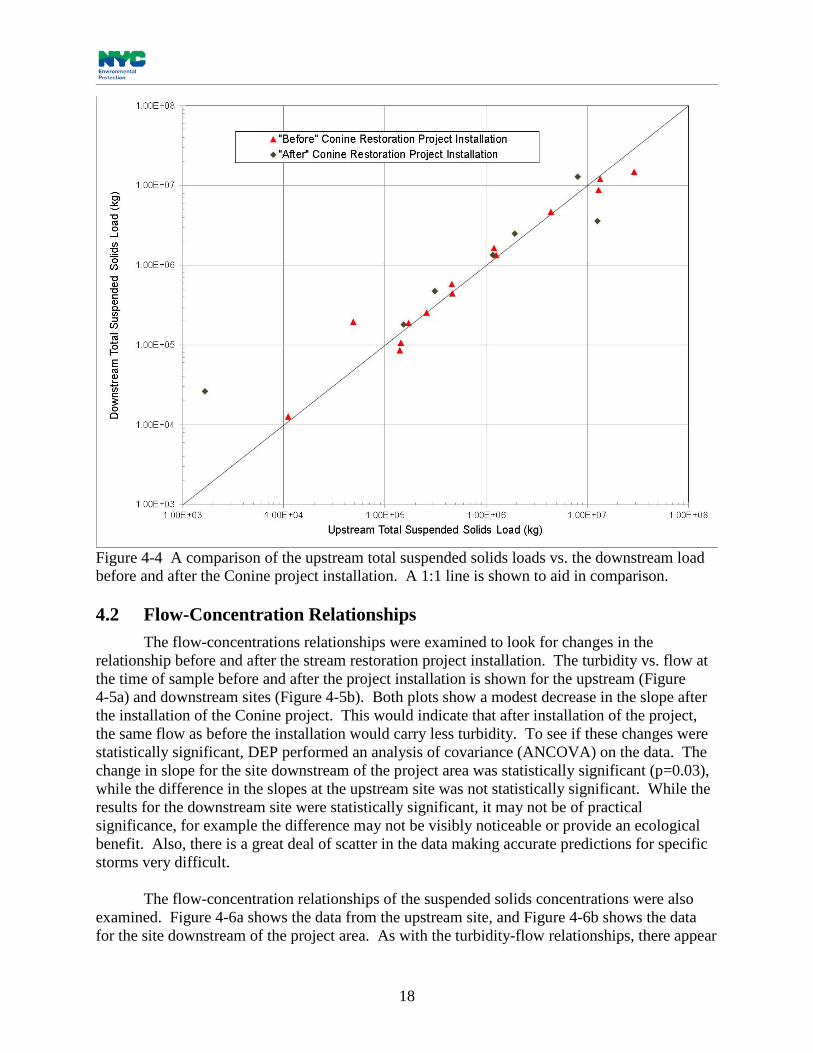
The load from the upstream area was compared to the load downstream of the project area for each of the storms sampled. Figure 4-3 displays the turbidity “loading” data while Figure 4-4 displays the suspended sediment loadings. If there was no net increase in loading, the points would lie along the 1:1 line, while points below the line would indicate a reduction in load at the downstream site. The results do not demonstrate a meaningful improvement post construction.

Results and Discussion
17
Figure 4-3 A comparison of the upstream turbidity “load” vs. the downstream turbidity “load” before and after the Conine project installation. A 1:1 line is shown to aid in comparison.
18
Figure 4-4 A comparison of the upstream total suspended solids loads vs. the downstream load before and after the Conine project installation. A 1:1 line is shown to aid in comparison. 4.2 Flow-Concentration Relationships
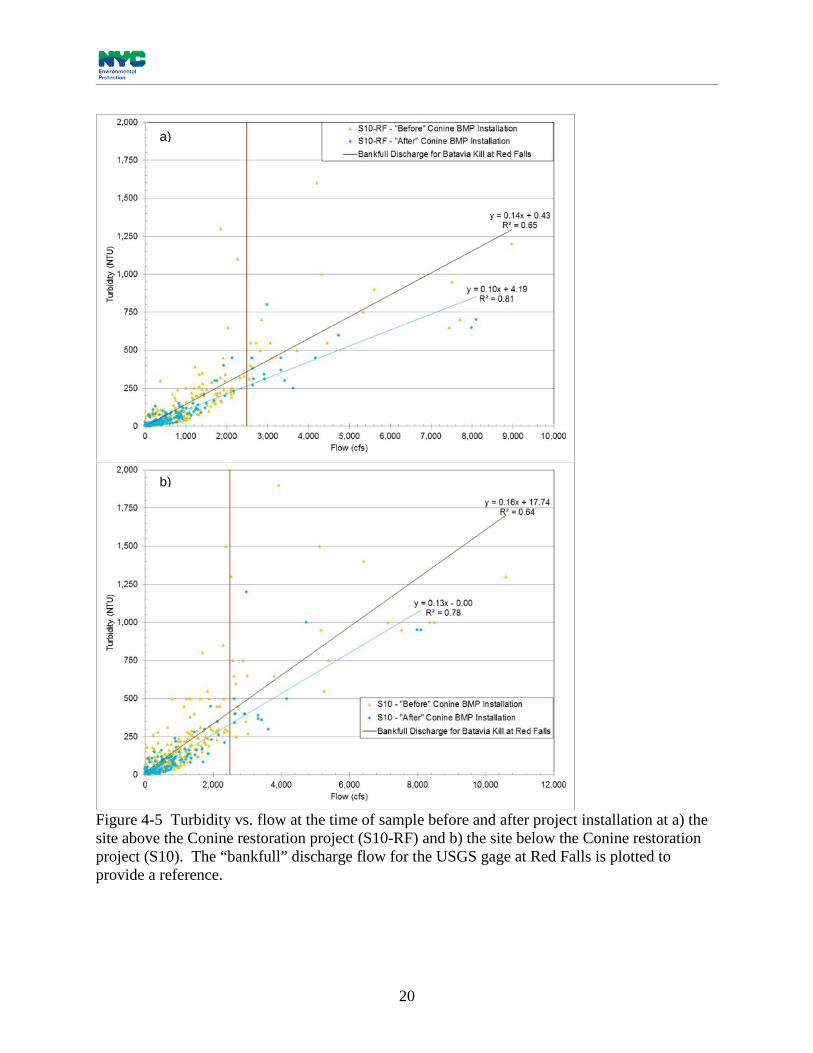
The flow-concentrations relationships were examined to look for changes in the relationship before and after the stream restoration project installation. The turbidity vs. flow at the time of sample before and after the project installation is shown for the upstream (Figure 4-5a) and downstream sites (Figure 4-5b). Both plots show a modest decrease in the slope after the installation of the Conine project. This would indicate that after installation of the project, the same flow as before the installation would carry less turbidity. To see if these changes were statistically significant, DEP performed an analysis of covariance (ANCOVA) on the data. The change in slope for the site downstream of the project area was statistically significant (p=0.03), while the difference in the slopes at the upstream site was not statistically significant. While the results for the downstream site were statistically significant, it may not be of practical significance, for example the difference may not be visibly noticeable or provide an ecological benefit. Also, there is a great deal of scatter in the data making accurate predictions for specific storms very difficult.
The flow-concentration relationships of the suspended solids concentrations were also
examined. Figure 4-6a shows the data from the upstream site, and Figure 4-6b shows the data for the site downstream of the project area. As with the turbidity-flow relationships, there appear

Results and Discussion
19
to be small decreases in the slopes after the project installation. DEP performed the analysis of covariance analysis on the results, and again the change in slope for the site downstream of the project area was statistically significant (p=0.04), while the difference in the slopes at the upstream site was not statistically significant. As noted above for the turbidity results, while the results for the downstream site were statistically significant, it may not be of practical significance because of the variability in the data.
20
Figure 4-5 Turbidity vs. flow at the time of sample before and after project installation at a) the site above the Conine restoration project (S10-RF) and b) the site below the Conine restoration project (S10). The “bankfull” discharge flow for the USGS gage at Red Falls is plotted to provide a reference.
a)
b)

Results and Discussion
21
a)
b)
Figure 4-6 Total suspended solids concentration vs. flow at the time of sample before and after project installation at a) the site above the Conine Restoration Project (S10-RF) and b) the site below the Conine Restoration Project (S10). The “bankfull” discharge flow for the USGS gage at Red Falls is plotted to provide a reference.


23
5. Conclusion Samples from storm events were collected for more than six years. Before project
construction, more than three years of sampling was conducted at sites above and below the Conine project area. After construction of the project, sampling was continued for another three years to determine the project’s potential impact on turbidity and total suspended sediment in one reach of the Batavia Kill. The data collected do not show a significant reduction in turbidity and sediment loads downstream of the project area. However, there was a slight, and statistically significant, decrease in the flow-concentration relationships for both turbidity and total suspended solids for the stream site below the project area. This would indicate that flows below the project now carry less turbidity and sediment than equivalent flows carried before the project was installed. The site above the Conine restoration project did not show a statistically significant change. However, while there was a statistically significant change at the downstream site, the change was relatively small and the data were highly variable, so the practical significance of this change with regard to turbidity and total suspended concentrations is not compelling. Also, the changes noted through the site were negligible compared to the total loading and overwhelmed by the overall loads coming from the Batavia Kill basin.
There are several possible explanations why a more obvious change in turbidity and total
suspended solids was not observed below the restoration project, as discussed below. It could be that given the geomorphic conditions and geological setting of the Batavia
Kill watershed, the restoration project was not able to reduce the turbidity and total suspended solids in a significant fashion, and no differences in loading were readily observed.
Another possibility could be that the sampling was not able to detect a change. A recent
paper on the influence of sampling frequency on estimating loads (Jones et al. 2012) discusses the difficulty in sampling programs of this type. The authors note that “… sampling frequency is now, and is likely to remain, a limiting factor in load estimation and water quality modeling.” They also state that “… it can be difficult to determine an acceptable sampling frequency a priori. Sampling frequency may be an especially important factor in load calculation for small watersheds, flashier flow regimes, and readily-soluble or sediment-associated constituents.” It is evident that it is very difficult to collect grab samples at a frequency that will provide a precise estimate, thus introducing error into the load estimation due to the high variability of the results.
Additionally, in the case of the Conine project, it seems likely that the suspensoids signal
from above the site could overwhelm the smaller signal from the project site. As previously mentioned, the Conine project area receives a large load of sediments from farther upstream (71 mi2 of the Batavia Kill’s drainage area plus the massive hillslope failure immediately above Red Falls) and then contributes an additional amount as the stream flows through the area. This small incremental change to a large load did not provide a large “signal,” and changes to this “signal” would have needed to be fairly large to differentiate a change in conditions from the “noise” in the data.
Another factor is that the downstream monitoring location was approximately one mile
downstream of the project, and inputs from this area could have produced additional “noise” that drowned out the project’s signal. Figure 5-1 is an aerial photograph from 2009 showing the

24
approximately one-mile stream reach between the Conine stream restoration project and S10 (downstream sampling location) in relation to two mass failures. The failure closest to the Conine project (Figure 5-1 inset a) was documented in a 2009 aerial photo and appears to have substantially deteriorated between 2006 and 2009. The second failure (Figure 5-1 inset b) was documented in the 2003 stream feature inventory of the Batavia Kill. The downstream monitoring site may not have bracketed the project area tightly enough to isolate the potential impact of the project.
Figure 5-1 Conine Project in relation to S10 and additional mass failures below the project area, but upstream of the sampling location.
Finally, it is also possible that more time is needed for the site to “mature.” The
vegetation along the left bank of the Batavia Kill along the major clay source needs time to become established to improve isolation of the clay source and provide maximum protection to the streambank’s stability. Restoration projects strive to meet multiple objectives in addition to water quality benefits. The Conine project has provided other benefits to the watershed, including reducing the safety hazard and property losses from high flows, improving aquatic and fisheries habitat, and increasing the recreational and aesthetic values of the Batavia Kill. Most importantly, it has prevented the massive hillslope at the Conine reach from evolving into the condition viewed upstream at Red Falls (Figure 1-1).
a)
b)

25
References Chen, Y., Bhatia, S.K., Buchanan, J.B., and DeKoskie, D. 2004. Evaluation of the Effectiveness
of Stream Restoration in Batavia Kill Watershed. International Erosion Control Association (IECA) 2004 Conference Proceedings Publication, Steamboat Springs, CO.
Chen, Y., Bhatia, S.K., Buchanan, J.B., DeKoskie, D., and VanSchaack, R. 2005. Effectiveness
of Stream Restoration in Reducing Stream Bank Erosion: The Case of Batavia Kill Stream Restoration Projects, New York. American Society of Civil Engineers (ASCE) 2005 Conference Proceedings Publication, Reston, VA.
EPA (U.S. Environmental Protection Agency). 2002. New York City Filtration Avoidance
Determination. http://www.epa.gov/region02/water/nycshed/2002fad.pdf (accessed 12/04/12).
EPA (U.S. Environmental Protection Agency). 2007. New York City Filtration Avoidance
Determination. http://www.epa.gov/region2/water/nycshed/2007finalfad.pdf (accessed 12/04/12).
DEP. 2001. New York City’s 2001 Watershed Protection Program Summary, Assessment and
Long-term Plan. Valhalla, NY. 657 p. DEP. 2006. 2006 Watershed Protection Program Summary and Assessment. Bureau of Water
Supply. Valhalla, NY. 494 p. GCSWCD, 2007. Conine Stream Restoration Project Design and Implementation Report, Greene
County Soil and Water Conservation District, Cairo, NY: Available at http://www.catskillstreams.org/pdfs/projectmappdfs/schohariepdfs/conine.pdf.
Jones, A. S., Horsburgh, J. S., Mesner, N. O., Ryel, R. J. and Stevens, D. K. 2012. Influence of
sampling frequency on estimation of annual total phosphorus and total suspended solids loads. Journal of the American Water Resources Association, 48: 1258–1275. doi: 10.1111/j.1752-1688.2012.00684.x.