Embed Size (px)
Citation preview

Columbia International Publishing Journal of Vibration Analysis, Measurement, and Control (2015) Vol. 3 No. 1 pp. 34-43 doi:10.7726/jvamc.2015.1003
Research Paper
______________________________________________________________________________________________________________________________ *Corresponding e-mail: [email protected] 1 National Institute of Technology Karnataka, Surathkal, Mangalore, India
34
Condition Monitoring of Single Point Cutting Tool through Vibration Signals using Decision Tree Algorithm
N Gangadhar1, Hemantha Kumar 1*, and S Narendranath1
Received 31 December 2014; Published online 27 June 2015 © The author(s) 2015. Published with open access at www.uscip.us
Abstract
Tool condition monitoring in machining plays a crucial role in modern manufacturing systems, finding tool wear state in early with the help of monitoring system will reduce downtime and excessive power drawing while machining. It also increases machining quality as well as surface finish of machined components. Vibration analysis of mechanical systems can be used to identify the tool condition to distinguish good and worn tool. This paper deals with the vibration signals acquired using the accelerometer in a lathe with fresh and worn tool for the fault diagnosis through machine learning approach for online tool condition monitoring. The statistical features were extracted from the vibration signals. Significantly important features were selected using J48 decision tree algorithm and it is used as a classifier too. The selected features were given as inputs for the classifier and their classification accuracies were compared. Results of (J48) algorithm were used to learn and classify the condition of tool and also found its accuracy as of 95%. Hence, the results of the decision tree model can be practically used for diagnosing the condition of the tool wear. Keywords: Condition monitoring; Decision tree algorithm; Feature selection; Machine learning approach
1. Introduction Traditional machining operations like turning, milling, drilling, grinding etc. play an enormous role in production systems (Rehorn et al. (2006)). The quality of the surface finish and the dimensions of the machined parts are having direct influence of the health of the cutting edge and failure of the cutting edge is the major cause of the unplanned interruption in a machining environment, which results in larger down time (Jantunen (2002)). Numerical methods and analytical models are generally accepted for tool wear estimation with limited accuracy in comparison with modern online condition monitoring methods (Scheffer et al. (2005)). Li (2001) presented a state of art which reviews usage of Acoustic Emission (AE) method of cutting tool condition monitoring. Choi et al. (1999) developed a real time tool condition monitoring system by combining AE method with measurement of cutting forces for turning operations. Jemielniak and Otman (1998) used statistical

N Gangadhar, Hemantha Kumar, and S Narendranath / Journal of Vibration Analysis, Measurement, and Control (2015) Vol. 3 No. 1 pp. 34-43
35
features such as root mean square (RMS) value, skewness and kurtosis of the AE signal for the detection of catastrophic tool failure. Dimla (2002) has shown that substantially little AE is generated during the tool wear process in comparison with the AE signal generated because of tool breakage and fracture. Lim (1995) illustrated the conditions of the cutting tool that can be detected from the corresponding vibration signatures acquired during machine turning operations. Taysir et al. (1994) used ultrasonic method for online monitoring of tool wear. Abu-Zahra and Yu (2003) studied the gradual wear of carbide tool inserts during turning operations using discrete wavelet transform of ultrasound waves. In the present study, an attempt is made to use vibration signals for the purpose of fault diagnosis of single point cutting tool. To extract significant features, descriptive statistical features like mean, median, kurtosis etc., were used. Important features were selected and classification was carried out using J48 decision tree algorithm.
2. Experimental Setup The Fig. 1 and Fig. 2 illustrate the line diagram and experimental test setup used for fault diagnosis of cutting tool purpose. The accelerometer is mounted on tool holder using magnetic mount. The piezoelectric accelerometer measures the response of the cutting tool to the excitation force. The output of the accelerometer is connected to the National Instruments DAQ system. The program was developed in LabVIEW to acquire vibration signals.
Fig. 1. Line diagram of experimental setup.
Fig. 2. Experimental setup.
N Gangadhar, Hemantha Kumar, and S Narendranath / Journal of Vibration Analysis, Measurement, and Control (2015) Vol. 3 No. 1 pp. 34-43
36
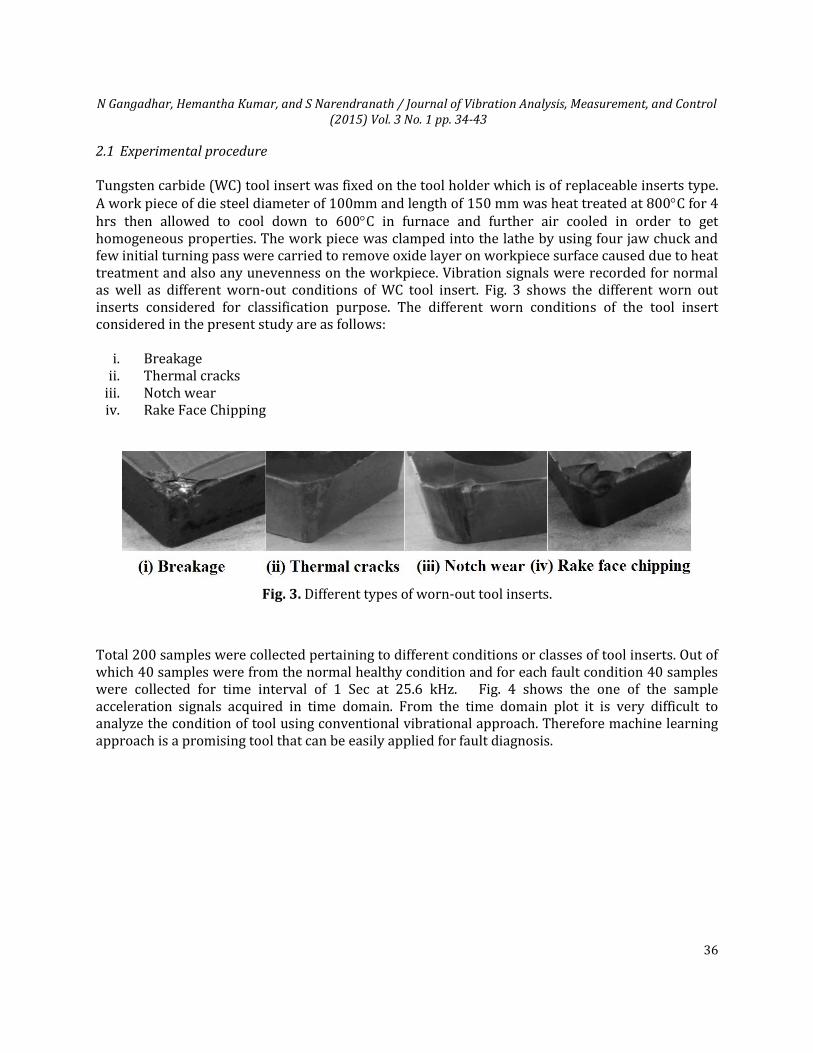
2.1 Experimental procedure Tungsten carbide (WC) tool insert was fixed on the tool holder which is of replaceable inserts type. A work piece of die steel diameter of 100mm and length of 150 mm was heat treated at 800C for 4 hrs then allowed to cool down to 600C in furnace and further air cooled in order to get homogeneous properties. The work piece was clamped into the lathe by using four jaw chuck and few initial turning pass were carried to remove oxide layer on workpiece surface caused due to heat treatment and also any unevenness on the workpiece. Vibration signals were recorded for normal as well as different worn-out conditions of WC tool insert. Fig. 3 shows the different worn out inserts considered for classification purpose. The different worn conditions of the tool insert considered in the present study are as follows:
i. Breakage ii. Thermal cracks
iii. Notch wear iv. Rake Face Chipping
Fig. 3. Different types of worn-out tool inserts.
Total 200 samples were collected pertaining to different conditions or classes of tool inserts. Out of which 40 samples were from the normal healthy condition and for each fault condition 40 samples were collected for time interval of 1 Sec at 25.6 kHz. Fig. 4 shows the one of the sample acceleration signals acquired in time domain. From the time domain plot it is very difficult to analyze the condition of tool using conventional vibrational approach. Therefore machine learning approach is a promising tool that can be easily applied for fault diagnosis.

N Gangadhar, Hemantha Kumar, and S Narendranath / Journal of Vibration Analysis, Measurement, and Control (2015) Vol. 3 No. 1 pp. 34-43
37
Fig. 4. Acceleration signals with healthy and faulty cutting tool inserts in time domain.
0.0 0.2 0.4 0.6 0.8 1.0-25
-20
-15
-10
-5
0
5
10
15
20
25(a) Healthy cutting tool
Acc
eler
ati
on
(g)
Time (s)
0.0 0.2 0.4 0.6 0.8 1.0-25
-20
-15
-10
-5
0
5
10
15
20
25(b) Breakage cutting tool
Acc
eler
ati
on
(g)
Time (s)
0.0 0.2 0.4 0.6 0.8 1.0-25
-20
-15
-10
-5
0
5
10
15
20
25(c) Thermally cracked cutting tool
Acc
eler
ati
on
(g)
Time (s)
0.0 0.2 0.4 0.6 0.8 1.0-25
-20
-15
-10
-5
0
5
10
15
20
25(d) Notch wear cutting tool
Acc
eler
ati
on
(g)
Time (s)
0.0 0.2 0.4 0.6 0.8 1.0-25
-20
-15
-10
-5
0
5
10
15
20
25(e) Rake face chipping cutting tool
Acc
eler
ati
on
(g)
Time (s)

N Gangadhar, Hemantha Kumar, and S Narendranath / Journal of Vibration Analysis, Measurement, and Control (2015) Vol. 3 No. 1 pp. 34-43
38
3. Statistical Feature Extraction
From the vibration signals, descriptive statistical parameters such as mean, median, mode, kurtosis, skewness, standard error, standard deviation, minimum, maximum, sum, and range are computed to serve as features. They are named as ‘statistical features’ here. Brief descriptions about the extracted features are given below.
Standard error: Standard error is a measure of the amount of error in the prediction of y for an individual x in the regression, where x and y are the sample means and ‘n’ is the sample size. The standard error of the predicted
𝑌 = √1
𝑛−2[∑(𝑦 − 𝑦)2 −
[∑(𝑥−𝑥)(𝑦−𝑦)]2
(𝑥−𝑥)2 ] (1)
Standard deviation: This is a measure of the effective energy or power content of the vibration signal. The following formula was used for computation of standard deviation.
= √∑ 𝑥2−(∑ 𝑥)2
𝑛(𝑛−1) (2)
Sample variance: It is variance of the signal points and the following formula was used for computation of sample variance.
2 =∑ 𝑥2−(∑ 𝑥)2
𝑛(𝑛−1) (3)
Kurtosis: Kurtosis indicates the flatness or the spikiness of the signal. Its value is very low for normal condition of the cutting tool and high for the faulty condition of the tool due to the spiky nature of the signal.
𝐾𝑢𝑟𝑡𝑜𝑠𝑖𝑠 = {𝑛(𝑛+1)
(𝑛−1)(𝑛−2)(𝑛−3)∑ (
𝑥𝑖−𝑥
𝑠)
4
} −3(𝑛−1)2
(𝑛−2)(𝑛−3) (4)
where ‘s’ is the sample standard deviation. Skewness: Skewness characterizes the degree of asymmetry of a distribution around its mean. The following formula was used for computation of skewness.
𝑆𝑘𝑒𝑤𝑛𝑒𝑠𝑠 =𝑛
𝑛−1∑ (
𝑥𝑖−𝑥
𝑠)
3
(5)
Range: It refers to the difference between maximum and minimum signal point values for a given signal. Minimum value: It refers to the minimum signal point value in a given signal. As the tool gets worn-out, the vibration levels seem to go high. Therefore, it can be used to detect tool wear condition. Maximum value: It refers to the maximum signal point value in a given signal.

N Gangadhar, Hemantha Kumar, and S Narendranath / Journal of Vibration Analysis, Measurement, and Control (2015) Vol. 3 No. 1 pp. 34-43
39
Sum: It is the totality of all feature values for each sample.
4. Decision Tree
A decision tree is a tree based knowledge methodology used to represent classification rules (Quinlan (1986), Sugumaran et al. (2007) and Shaktivel et al. (2010)). A standard tree induced with J48 consists of a number of branches, one root, a number of nodes and a number of leaves (Fig. 5). One branch is a chain of nodes from the root to a leaf; and each node involves one attribute. The occurrence of an attribute in a tree provides the information about the importance of the associated attribute. The procedure of forming the Decision Tree and exploiting the same for feature selection is characterized by the following:
The set of features available at hand forms the input to the algorithm; the output is the Decision Tree.
The decision tree has leaf nodes, which represent class labels, and other nodes associated with the classes being classified.
The branches of the tree represent each possible value of the feature node from which they originate.
The decision tree can be used to classify feature vectors by starting at the root of the tree and moving through it until a leaf node, which provides a classification of the instance, is identified.
At each decision node in the decision tree, one can select the most useful feature for classification using appropriate estimation criteria. The criterion used to identify the best feature invokes the concepts of entropy reduction and information gain – discussed in the following subsection.
4.1 Information Gain and Entropy Reduction ‘Information gain’ is the expected reduction in entropy caused by portioning the samples according to this feature. ‘Entropy’ is a measure of homogeneity of the set of instances. Information gain measures how well a given attribute separates the training examples according to their target classification. The measure is used to select among the candidate features at each step while growing the tree. Information gain (S, A) of a feature A relative to a collection of examples S, is defined as:
Gain (S, A) = Entropy (S) − ∑|S|
|S|∈Value(A) Entropy(S) (6)
where, Values (A) is the set of all possible values for attribute A, Sv is the subset of S for which feature A has value v (i.e., Sv = {s S | A(s) = v}).
Note the first term in the equation for Gain is just the entropy of the original collection S and the second term is the expected value of the entropy after S is partitioned using feature A. The expected entropy described by the second term is the direct sum of the entropies of each subset Sv, weighed by the fraction of samples |Sv|/|S| that belong to Sv. Gain (S,A) is therefore the expected reduction in entropy caused by knowing the value of feature A. Entropy is given by

N Gangadhar, Hemantha Kumar, and S Narendranath / Journal of Vibration Analysis, Measurement, and Control (2015) Vol. 3 No. 1 pp. 34-43
40
Entropy(S) = ∑ −Pi log2 Pici=1 (7)
where, c is the number of classes Pi is the proportion of S belonging to class ‘i’.
5. Results and Discussion
The vibration signals were recorded for normal and different worn conditions of the tool inserts. The statistical features explained in section 3 were treated as features and act as input to the algorithm. The corresponding status or condition of the classified data will be the required output of the algorithm. This input and corresponding output together forms the dataset. The dataset is used by decision tree J48 algorithm for generating the decision tree for the purpose of feature selection and classification. 5.1 Feature Extraction and Selection
Twelve statistical features were extracted from the vibration signals. Significant features are extracted using decision tree. Researchers have to extract all statistical features and then select the best ones. Here, decision tree was used for feature selection (Sugumaran et al. (2007)). The generated decision tree is depicted in Fig. 5.
Fig. 5. Decision tree – Vibration Signals.
The Decision tree algorithm (J48 algorithm) has been applied to the problem under discussion. In decision tree (Fig. 5.), the feature that occurs first will be the root node and the same will be the

N Gangadhar, Hemantha Kumar, and S Narendranath / Journal of Vibration Analysis, Measurement, and Control (2015) Vol. 3 No. 1 pp. 34-43
41
best feature for classification. The other features in the tree are in the order of importance. In the decision tree, only seven features are present namely Maximum, Standard Error, Range, Skewness, Kurtosis, Mean and Median in the order of importance.
The classification accuracy of the decision tree algorithm is presented in Table 1. The interpretation of the confusion matrix is as follows:
The diagonal elements in the confusion matrix show the number of correctly classified instances.
In the first row, the first element shows the number of data points that belong to ‘healthy’ class and classified by the classifier as ‘healthy’.
In the first row, the second element shows the number of data points belonging to ‘healthy’ class but misclassified as Breakage it’s none
In the first row, the third element shows the number of ‘healthy’ data points misclassified as Thermal cracks
In the first row, the fourth element shows the number of ‘healthy’ data points misclassified as Notch wear and so on.
Table 1 Confusion matrix-Vibration signal
a b c d e
40 0 0 0 0 a - Healthy
0 37 1 1 1 b - Breakage
0 1 38 1 0 c - Thermal cracks
0 1 0 38 1 d - Notch wear
0 1 1 1 37 e - Rake face chipping
The detailed class-wise accuracy of the J48 algorithm is presented in Table 2. Out of the terms used in Table 2, ‘TP rate’ and ‘FP rate’ are very important. The ‘TP rate’ stands for true positive and its value should be close to ‘1’ for better classification accuracy. The ‘FP rate’ stands for false positive and its value should be close to ‘0’ for better classification accuracy. In the present study, from Table 2, one can see the closeness of ‘TP rate’ to ‘1’ and ‘FP rate’ to ‘0’. The both values confirm that the built model is good one.
Table 2 Detailed accuracy by class
TP Rate FP Rate Precision Recall F-Measure ROC Area Class
1 0 1 1 1 1 Healthy
0.95 0.016 0.974 0.95 0.962 0.997 Breakage
0.975 0.006 0.951 0.975 0.963 0.995 Thermal cracks
0.95 0.016 0.974 0.95 0.962 0.997 Notch wear
0.95 0.006 0.974 0.95 0.962 0.997 Rake face chipping

N Gangadhar, Hemantha Kumar, and S Narendranath / Journal of Vibration Analysis, Measurement, and Control (2015) Vol. 3 No. 1 pp. 34-43
42
The diagonal elements in the confusion matrix show the number of correctly classified instances. For example (Table 1.) in the first row, 40 instances are correctly classified as ‘Healthy’. Here, out of 200 data points, 10 data points were misclassified by the algorithm with a classification accuracy of 95% for vibration signals.
6. Conclusions
Condition monitoring of a Tungsten carbide (WC) cutting tool was carried out by using vibration signals and the statistical features were extracted. The features were classified from acquired vibration signals, a model was built using data modelling technique. Decision tree (J48) algorithm was used to learn and classify the condition of the cutting tool, also found its accuracy as of 95%. Hence, the results of the decision tree model can be practically used for condition monitoring of a Tungsten carbide cutting tool.
References A. G. Rehorn, J. Jiang, and P. E. Orban., 2005, "State-of-the-art in methods and results in tool condition
monitoring: a review", The International Journal of Advanced Manufacturing Technology, Vol. 26, pp. 693-710. http://dx.doi.org/10.1007/s00170-004-2038-2
E. Jantunen., 2002, "A summary of methods applied to tool condition monitoring in drilling", International Journal of Machine Tools & Manufacture, Vol. 42, pp. 997-1010. http://dx.doi.org/10.1016/S0890-6955(02)00040-8
C. Scheffer, H. Engelbrecht, and P. S. Heyns., 2005, "A comparative evaluation of neural networks and hidden Markov models for monitoring tool wear", Neural Computing and Applications, Vol. 14, pp. 325 -336. http://dx.doi.org/10.1007/s00521-005-0469-9
X. Li., 2001 "A brief review: acoustic emission method for tool wear monitoring during turning", International Journal of Machine Tools & Manufacture, Vol. 42, pp. 157-165. http://dx.doi.org/10.1016/S0890-6955(01)00108-0
D. Choi, W.T. Kwon and C.N. Chu., 1999, "Real-time monitoring of tool fracture in turning using sensor fusion", International Journal of Advanced Manufacturing Technology, Vol. 15 (5), pp. 305–310. http://dx.doi.org/10.1007/s001700050071
K. Jemielniak and O. Otman., 1998, "Tool failure detection based on analysis of acoustic emission signals", Journal of Material Processing Technology, Vol. 76, pp. 192–197. http://dx.doi.org/10.1016/S0924-0136(97)00379-8
D. E. Dimla., 2002, "The correlation of vibration signal features to cutting tool wear in a metal turning operation", The International Journal of Advanced Manufacturing Technology, Vol. 19, pp. 705-713. http://dx.doi.org/10.1007/s001700200080
G. H. Lim., 1995, "Tool-wear monitoring in machine turning", Journal of Materials Processing Technology, Vol. 51 (1-4), pp. 25-36. http://dx.doi.org/10.1016/0924-0136(94)01354-4
H. Taysir, Nayfeh, K. Osama, Eyada and John C. Duke., 1994, "An Integrated Ultrasonic Sensor for Monitoring Gradual Wear On-line during Turning operations", Int. J. Mach. Tools Manufacturing, Vol. 35 (10), pp. 1385-1395.
N. H. Abu-Zahra and G. Yu., 2003, "Gradual wear monitoring of turning inserts using wavelet analysis of ultrasound waves", Int. J. of Mach. Tools and Manufacturing, Vol. 43 (4), pp. 337-343.

N Gangadhar, Hemantha Kumar, and S Narendranath / Journal of Vibration Analysis, Measurement, and Control (2015) Vol. 3 No. 1 pp. 34-43
43
http://dx.doi.org/10.1016/S0890-6955(02)00274-2
J. R. Quinlan, 1986, "Induction of Decision Trees", Machine Learning, Vol. 1, pp. 81-106. http://dx.doi.org/10.1007/BF00116251
V. Sugumaran, V. Muralidharan, and K. I. Ramachandran., 2007, "Feature selection using Decision Tree and classification through Proximal Support Vector Machine for fault diagnostics of roller bearing", Mechanical Systems and Signal Processing, Vol. 21 (2), pp. 930-942. http://dx.doi.org/10.1016/j.ymssp.2006.05.004
N. R. Sakthivel, V. Sugumaran, B. B. Nair., 2010, "Comparison of decision tree-fuzzy and rough set-fuzzy methods for fault categorization of mono-block centrifugal pump", Mechanical Systems and Signal Processing, Vol. 24 (6), pp. 1887-1906. http://dx.doi.org/10.1016/j.ymssp.2010.01.008