Embed Size (px)
Citation preview

Columbia International Publishing Journal of Vibration Analysis, Measurement, and Control (2014) Vol. 2 No. 1 pp. 41-56 doi:10.7726/jvamc.2014.1004
Research Article
______________________________________________________________________________________________________________________________ *Corresponding e-mail: [email protected] 1 Washington State University Tri-Cities, School of Mechanical and Materials Engineering
41
A Study of Vibration Control of a Critical Lift Tower
Joshua Snyder1* and Changki Mo1 Received 4 November 2014; Published online 3 January 2015 © The author(s) 2014. Published with open access at www.uscip.us
Abstract This paper provides insight into the seismic analysis of a braced frame structure and subsequent design of a tuned mass damper system to reduce seismic-induced deflections. The braced frame structure houses an east-west direction-limited monorail crane used for hoisting equipment up, over, and down into an acrylic test vessel. With close proximity of the equipment and test vessel, excessive deflection of the structure can result in unallowable damage. Using modern finite element analysis software, the system was analyzed with appropriate beam geometry, materials, and expected loading to be as prototypic as possible. The results of this paper provide a basis for enhancing an existing system to reduce the chance of potential damage during seismic events. Keywords: Vibration Analysis; Tuned Mass Damper; Seismic; ANSYS Workbench; Pendulum
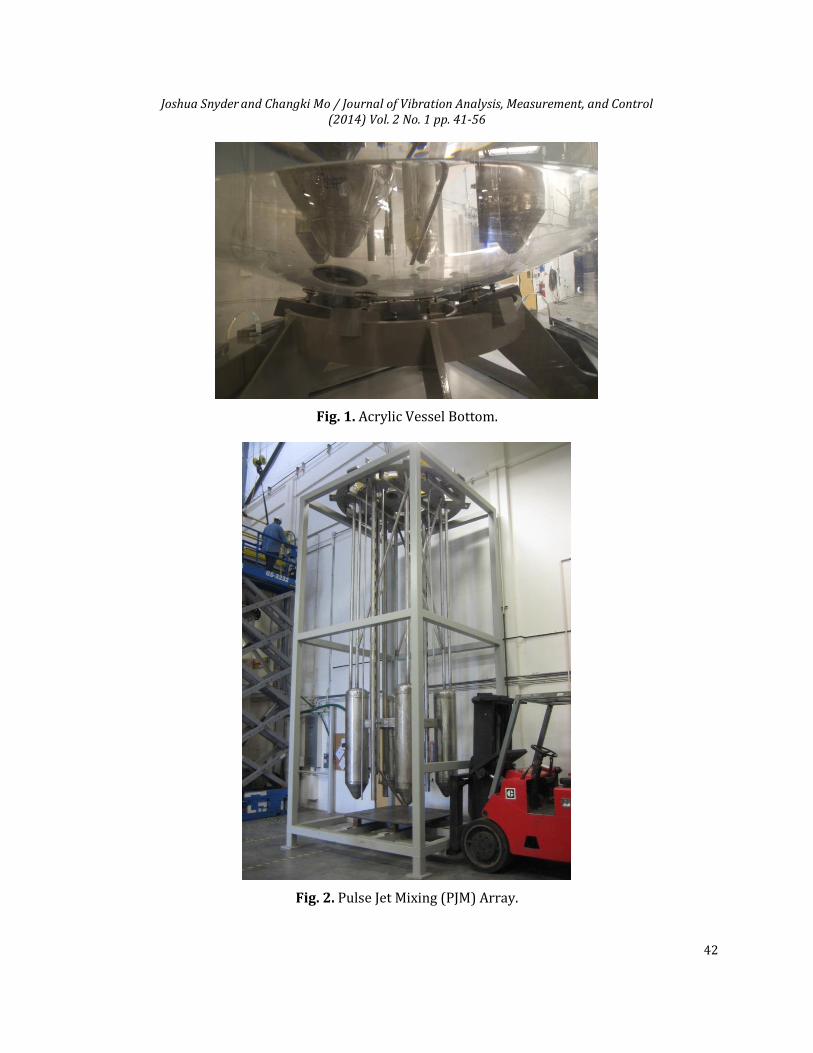
1. Introduction 1.1 Background and Motivation Mid Columbia Engineering, Inc. (MCE) in Richland, WA houses the Large Scale Integrated Testing (LSIT) demonstration platform. This platform uses inert simulants to mimic the rheological properties of the Hanford tank waste. This inert simulant slurry is mixed using pulse jet mixing (PJM) technology that employs a system of cycled vacuum and compressed air to drive the simulant slurry into the vessel bottom resulting in a stirring action within the vessel. To enable complete study of the mixing characteristics within the vessel, the test vessel has been made of clear acrylic to enable observation all around the vessel bottom as shown in Figure 1. The PJM arrays themselves consist of clusters of smaller pressure chambers to allow for suction and driving of the simulant slurry. An example of a PJM array can be seen in Figure 2.
Joshua Snyder and Changki Mo / Journal of Vibration Analysis, Measurement, and Control (2014) Vol. 2 No. 1 pp. 41-56
42
Fig. 1. Acrylic Vessel Bottom.
Fig. 2. Pulse Jet Mixing (PJM) Array.

Joshua Snyder and Changki Mo / Journal of Vibration Analysis, Measurement, and Control (2014) Vol. 2 No. 1 pp. 41-56
43
These PJM arrays are designed such that they are interchangeable within the acrylic test vessel using an east-west direction-limited monorail crane that hoists the PJM array up, travels west to a position over the acrylic vessel, and lowers the PJM array into the acrylic vessel.
Fig. 3. Lifting Process. During lift operations, it has been observed how small changes of external forces such as crane operating speed, outdoor wind speed vibrating the building, et cetera can result in sway of the PJM array while suspended. It has been determined that damage to the acrylic vessel would result in a crippling of the project schedule and budget due to a long lead time for a replacement vessel.

Joshua Snyder and Changki Mo / Journal of Vibration Analysis, Measurement, and Control (2014) Vol. 2 No. 1 pp. 41-56
44
1.2 Objectives and Scope This paper evaluates the effects of seismically induced loading on the direction-limited monorail crane support structure, application of a passive tuned mass damper system (TMD), and optimization of TMD parameters to minimize deflection of the PJM array during lifting operations. The goal for deflection reduction is 25% or better. A brief introduction to the philosophy of vibration control is presented in Section 2, discussion of assumptions and modeling of the lift tower is presented in Section 3, the design seismic event is discussed in Section 4, and the simulation of the structural model and seismic event is presented in Section 5.
2. Vibration Control using TMDs 2.1 Introduction The control of structural vibrations produced by earthquake or wind loads can be performed by various fundamental means. These conceptual approaches include modifying the stiffness, mass, damping, or geometry of the existing structure or by providing passive or active counter forces. To date some methods of structural control have been used successfully and newly proposed methods offer the possibility of extending applications and improving efficiency. It has been established that structural control is a critical part of designing important new structures, such as hospitals, and, in some cases, for retrofitting existing structures for earthquake and wind. However, to date most existing and planned strategies are passive tuned mass or isolation approaches. TMDs are a type of passive energy absorbing system typically consisting of a mass, a spring, and a viscous damper attached to a vibrating system to reduce undesirable vibrations. TMD systems are a practical, well accepted strategy in the area of structural control for flexible structures, and particularly for tall buildings. The mechanism of suppressing structural vibrations by attaching a TMD to the structure is to transfer the vibration energy of the structure to the TMD and to dissipate the energy in the damper of the TMD. In other words, the frequency of the damper is tuned to a particular structural frequency so that when the frequency is excited, the TMD will resonate out of phase with the structural motion. Compared to control devices that are connected to structural elements or joints, the TMD involves a relatively large mass and displacements. In some cases, spacing restrictions will not permit traditional TMD configurations and have led to alternative configurations, including pendulums, inverted pendulums, water tanks (Ghorbani-Tanha et al. (2006)), and slide tables (see Table 1 for different TMD systems currently in place). Coil springs or variable stiffness pneumatic springs typically provide the stiffness for the tuning of most types of TMDs. One of the limitations to the TMD system is the sensitivity related to the small bandwidth of the frequency tuned control it provides and the resulting potential variation in tuning the TMD frequency to the controlled frequency of a structure. If the frequency of the disturbing force shifts even slightly, then the effect of the TMD is reduced. In some cases, improper tuning can even intensify the vibration, rather than suppress it. Examples of Existing Structures Utilizing TMD’s are listed in Table 1.

Joshua Snyder and Changki Mo / Journal of Vibration Analysis, Measurement, and Control (2014) Vol. 2 No. 1 pp. 41-56
45
Table 1 Structures Utilizing TMD’s.
Name of Structure City/Country Type of Damper Date of Installation John Hancock Building Boston, USA Slide Table 1977 Chiba Port Tower Chiba, Japan Slide Table 1986 Crystal Tower Osaka, Japan Pendulum 1990 Sydney Tower Sydney, Australia Pendulum 1980 Chifley Tower Sydney, Australia Pendulum 1993 Rokko Island P&G Kobe, Japan Pendulum 1993 Citigroup Center New York, USA Slide Table 1978 One Wall Centre Vancouver, Canada Tuned Liquid Column
Dampers 2001
Akashi Kaikyo Bridge Kobe, Japan Pendulum 1995 Taipei 101 Taipei, Taiwan Pendulum 2004 Comcast Center Philadelphia, USA Tuned Liquid Column
Dampers 2008
2.2 Overview of TMD Optimization for Single-Degree-of-Freedom Systems A typical TMD consists of a mass which moves relative to the structure and is attached to it by a spring and a viscous damper as shown in Figure 4 (Rao (2011)) for a single-degree-of-freedom (SDOF) system.
Mass of main structure(m1)
F0sint
x1(t)
x2(t)
k1
2
k1
2
k2 c2
m2
TMDRigid
base Fig. 4. Tuned Mass Damper Mounted on a Main Structure.
The equations of motion for the two masses are given by:
𝑚1�̈�1 + 𝑘1𝑥1 + 𝑘2(𝑥1 − 𝑥2) + 𝑐2(�̇�1 − �̇�2) = 𝐹0𝑠𝑖𝑛𝜔𝑡 (1) 𝑚2�̈�2 + 𝑘2(𝑥2 − 𝑥1) + 𝑐2(�̇�2 − �̇�1) = 0 (2)

Joshua Snyder and Changki Mo / Journal of Vibration Analysis, Measurement, and Control (2014) Vol. 2 No. 1 pp. 41-56
46
where m1 and k1 are mass and stiffness of main structure, and m2, k2, and c2 are mass, stiffness, and damping coefficient of TMD. It is assumed that a force input 𝐹0𝑠𝑖𝑛𝜔𝑡 is applied to the main structure, and x1 and x2 are vertical motions of main structure and TMD, respectively. By defining: 𝜇 = 𝑚2 𝑚1⁄ : Mass ratio = TMD mass/mass of main structure
𝜔𝑇 = √𝑘2 𝑚2⁄ : Natural frequency of TMD
𝜔𝑀 = √𝑘1 𝑚1⁄ : Natural frequency of main structure 𝑟1 = 𝜔𝑇 𝜔𝑀⁄ : Natural frequency ratio 𝑟2 = 𝜔 𝜔𝑀⁄ : Forced frequency ratio 𝜁 = 𝑐2 𝑐𝑐⁄ : Damping ratio, 𝑐𝑐 = 2𝑚2𝜔𝑀: Critical damping coefficient The magnitudes X1 and X2 can be expressed as:
𝑋1
𝐹0 𝑘1⁄= [
(2𝜁𝑟2)2+(𝑟22−𝑟1
2)2
(2𝜁𝑟2)2(𝑟22−1+𝜇𝑟2
2)2
{𝜇𝑟12𝑟2
2−(𝑟22−1)(𝑟2
2−𝑟12)}
2]1 2⁄
(3)
and
𝑋2
𝐹0 𝑘1⁄= [
(2𝜁𝑟2)2+𝑟14
(2𝜁𝑟2)2(𝑟22−1+𝜇𝑟2
2)2
{𝜇𝑟12𝑟2
2−(𝑟22−1)(𝑟2
2−𝑟12)}
2]1 2⁄
(4)
Equations (3) and (4) show that the amplitude of vibration of the main mass is a function of mass ratio, ratio of natural frequencies, forced frequency ratio, and damping ratio.
𝑟1 =1
1+𝜇 (5)
A TMD satisfying equation (5) can be correctly called the tuned vibration absorber. Equation (5) is substituted into equation (3) to make the resulting equation applicable to the case of optimal tuning. The resulting optimal damping ratio is:
𝜁𝑜𝑝𝑡𝑖𝑚𝑎𝑙 = √3𝜇
8(1+𝜇)3 (6)
Utilizing equations (5) and (6), the optimal mass m2, spring (with stiffness k2), and viscous damper (with coefficient c2) can be determined for a SDOF system. When dealing with multiple-degree-of-freedom (MDOF) systems, more advanced techniques such as finite element analysis (FEA) are required to understand the characteristics of the system and the response to excitation.
3. ANSYS Model To perform the required seismic simulation for the lift tower, ANSYS Workbench 14.0 (WB14) was chosen due to familiarity with the software as well as the ability to import seismic time history data into the model. The lift tower was a modification to the existing MCE fabrication facility that resulted in an increased height from 35 to 55 feet and installation of an 8-ton monorail crane. The lift tower is a bolted steel frame that is rigidly supported at its base to the existing MCE facility main structural beams. Figure 5 below shows part of the lift tower steel work prior to installation (note that two beams are not installed at that time).

Joshua Snyder and Changki Mo / Journal of Vibration Analysis, Measurement, and Control (2014) Vol. 2 No. 1 pp. 41-56
47
Fig. 5. Lift Tower Prior to Installation.
Using the dimensions, beam geometry, and beam materials provided by the fabricator, a line body model was created with beam elements. The construction point locations used are provided in Table 2.
Table 2 Construction Point Locations.
Node (See Figure 6) X-Direction (in) Y-Direction (in) Z-Direction (in) 1 249 408.6875 305 2 0 408.6875 305 3 0 387.8125 0 4 249 387.8125 0 5 249 647.5 305 6 0 626.75 305 7 0 626.75 0 8 249 647.5 0 9 178.6875 641.640625 305
10 119 636.6666667 305 11 59.5 631.7083333 305 12 178.6875 641.640625 0 13 119 636.6666667 0 14 59.5 631.7083333 0 15 118.8456 522.6706 305 16 0 512.7384 159.4659 17 119.3714 512.2026 0 18 249 523.0935 158.886 19 178.6875 641.640625 225 20 178.6875 350.390625 225

Joshua Snyder and Changki Mo / Journal of Vibration Analysis, Measurement, and Control (2014) Vol. 2 No. 1 pp. 41-56
48
Fig. 6. Lift Tower Model Geometry without TMD.
Table 3 Geometric and Material Properties of Model Elements.
Description Shape Material Tensile Strength (ksi)
Ultimate Strength (ksi)
Simplified Geometry (in)
Reference
Column HSS 5x5x3/16 ASTM A500 Grade B
46 58 Length 1: 5.00 Length 2: 5.00 Thickness 1: 0.1875 Thickness 2: 0.1875
AISC (2005)
Cross Bracing L 5x5x5/16 ASTM A36 36 58 Length 1: 5.00 Length 2: 5.00 Thickness 1: 0.3125 Thickness 2: 0.3125
AISC (2005)
Joist 1 W 10x12 ASTM A992 50 65 Width: 3.96 Height: 9.87 Web: 0.19 Flange: 0.21
AISC (2005)
Joist 2 W 12x16 ASTM A992 50 65 Width: 3.99 Height: 11.99 Web: 0.22 Flange: 0.265
AISC (2005)
Header W 12x26 ASTM A992 50 65 Width: 6.49 Height: 12.22 Web: 0.23 Flange: 0.38
AISC (2005)
Crane Beam S 15x50 ASTM A572 Grade 55
55 70 Width: 5.64 Height: 15 Web: 0.55 Flange: 0.622
AISC (2005)
Crane Cable Circular ASTM A36 36 58 Radius: 0.5 AISC (2005) TMD Circular ASTM A36 36 58 See Section 6.0 AISC (2005)

Joshua Snyder and Changki Mo / Journal of Vibration Analysis, Measurement, and Control (2014) Vol. 2 No. 1 pp. 41-56
49
For the beam cross-sectional properties, the geometry was simplified to decrease the complexity of the modeling effort and to utilize pre-existing shapes established in WB14. For example, an I-beam is simplified to remove the complex radii but is still dependent on the height, width, flange thickness, and web thickness. Table 3 provides the description, shape, material, tensile strength, ultimate strength, and simplified geometry for all members used in the model. The crane cabling consists of four 0.5 inch diameter cables and is represented as a single cable with an equivalent diameter of 1 inch. The cable is modeled as a pendulum (pin connection) with a horizontal location equivalent to the center of the acrylic vessel and a vertical height equivalent to the top of the PJM array an inch before it is set (maximum cable length). Figure 7 shows the model with beam sizes prior to the TMD being installed.
Fig. 7. Lift Tower Model Sizes without TMD.
4. Seismic The 1940 El Centro earthquake was chosen as the design seismic event for this paper. Figure 8 shows the ground acceleration for the 40-second duration 1940 El Centro seismic event (University of California – San Diego) in the North-South direction.
To analyze the effects of seismic loading, the Response Spectrum Analysis method within WB14 was chosen. The requirements of this analysis type required that the data provided in Figure 8 be modified to meet the limitations of the analysis type. These limitations include: input must be frequency vs. acceleration, no more than 100 data points, and no negative values. To reduce the number of data points down to 100, a Fast Fourier Transform (FFT) was performed on the data to convert the time values to frequency and the areas of sensitivity were determined (approximately 4 and 6 Hz). It was determined during the Modal Analysis (see Section 5.2) of the structure that the natural frequency of the structure without the TMD is 4.5875 Hz. A total of 100 data points were chosen that encompassed the 4-6 Hz range and values were scaled to ensure no negative values

Joshua Snyder and Changki Mo / Journal of Vibration Analysis, Measurement, and Control (2014) Vol. 2 No. 1 pp. 41-56
50
(absolute value of minimum acceleration term added to every data point). The resulting frequency (Hz) vs. Acceleration (in/sec2) data points are provided in Table 4 and graphically in Figure 9. Note that the zero acceleration term was later omitted from the Response Spectrum Analysis.
Fig. 8. 1940 El Centro Seismic Event Time History.
Fig. 9. Modified 1940 El Centro Seismic Event Time History.
-11-10-9-8-7-6-5-4-3-2-10123456789
10
0 5 10 15 20 25 30 35 40
Acc
ele
rati
on
(ft
/se
c^2
)
Time (sec)
0
50
100
150
200
250
3.5 4.5 5.5 6.5
Acc
ele
rati
on
(in
/se
c^2
)
Frequency (Hz)

Joshua Snyder and Changki Mo / Journal of Vibration Analysis, Measurement, and Control (2014) Vol. 2 No. 1 pp. 41-56
51
Table 4 Modified El Centro Seismic Data.
Frequency (Hz)
Acceleration (in/sec2)
Frequency (Hz)
Acceleration (in/sec2)
Frequency (Hz)
Acceleration (in/sec2)
3.858386852 99.95703266 4.66425 147.521889 5.49454 196.597747 3.882807022 99.9699473 4.68867 142.8090595 5.51896 172.6577428 3.907227192 98.41375398 4.71309 137.0779653 5.54338 164.485032 3.931647362 95.66127858 4.73751 130.4851035 5.5678 167.5035066 3.956067532 92.66992281 4.76193 123.6048821 5.59222 170.5929056 3.980487702 90.24299294 4.78635 116.8949294 5.61664 166.53736 4.004907872 91.31743338 4.81077 110.4112841 5.64106 155.2817983 4.029328042 101.5256117 4.83519 103.9657766 5.66548 141.192953 4.053748212 122.4605694 4.85961 97.37029325 5.6899 128.9396164 4.078168382 148.8402984 4.88403 90.55083635 5.71432 120.662902 4.102588552 172.4102218 4.90845 83.53564055 5.73874 115.3121076 4.127008722 185.1588089 4.93287 76.40785764 5.76316 110.40335 4.151428892 184.757123 4.95729 69.2580484 5.78758 104.2535435 4.175849062 177.4717197 4.98171 62.13673246 5.812 96.73195079 4.200269232 171.7058815 5.00613 55.04750043 5.83642 88.66846817 4.224689402 170.8970657 5.03056 47.94355845 5.86084 80.88810001 4.249109572 173.1415111 5.05498 40.75363467 5.88526 73.68485619 4.273529742 174.8367463 5.0794 33.47023898 5.90968 66.84862763 4.297949912 174.1086229 5.10382 26.4821234 5.9341 59.42226356 4.322370082 171.9025933 5.12824 20.56459123 5.95852 54.15660237 4.346790252 170.359554 5.15266 15.92910288 5.98294 68.12148255 4.371210422 170.4714423 5.17708 11.8638665 6.00736 119.6897158 4.395630592 171.6958046 5.2015 7.522963289 6.03178 190.9476194 4.420050762 173.0681158 5.22592 2.890331986 6.0562 234.9297605 4.444470932 174.0715199 5.25034 0 6.08062 229.6304711 4.468891102 174.6813845 5.27476 1.818435871 6.10504 195.669437 4.493311272 174.4905412 5.29918 8.746707814 6.12946 165.1207645 4.517731442 172.522419 5.3236 19.50389167 6.15388 153.1008413 4.542151612 168.6015409 5.34802 35.27411934 6.1783 154.6478032 4.566571782 163.7987606 5.37244 64.63699974 6.20272 156.942664 4.590991952 159.2521767 5.39686 118.5871975 6.22714 151.3971237 4.615412122 155.2804663 5.42128 184.5025366 6.25156 137.4831222 4.639832292 151.5315711 5.4457 225.5103716 6.27598 120.4577364
5. Simulation The following subsections cover the process of taking the model described in Section 3 and performing the seismic analysis of the system using the data provided in Table 4. 5.1 Static Structural After developing the model as described in Section 3, ANSYS Mechanical is opened up within WB14 and associated connections and loading are applied. For this system, the four columns are modeled as fixed-connections. For the initial loading, the crane cable is loaded at 16000 pounds (limit of crane beam) and standard earth gravity is applied. The initial conditions are shown in the figure

Joshua Snyder and Changki Mo / Journal of Vibration Analysis, Measurement, and Control (2014) Vol. 2 No. 1 pp. 41-56
52
below. Note that the system weight is 7290.6 pounds determined by the geometry properties dialog box.
Fig. 10. Static Structural without TMD.
5.2 Modal Analysis
Fig. 11. Modal Analysis Results of Lift Tower without TMD.
Before performing the Response Spectrum Analysis, a Modal Analysis must be performed which will give the modes/eigenvalues of the structure. The resulting modes of the system without the TMD are shown in the figure below. The first mode frequency is 4.5875 Hz with the crane loaded.

Joshua Snyder and Changki Mo / Journal of Vibration Analysis, Measurement, and Control (2014) Vol. 2 No. 1 pp. 41-56
53
5.3 Response Spectrum Analysis The Response Spectrum Analysis is performed following the Modal Analysis. The Response Spectrum Analysis performs the following functions (EDR MEDESO):
Calculates the participation factor for each of the structural frequencies, Finds the maximum accelerations from the given response specter for each mode, Scales the modal displacements found in the modal analysis to physical mode shapes based
on acceleration, participation factors, and circular frequencies, And finally superimposes these modal results to the final result using the single point
response spectrum (SRSS) method. To get the process started, the modified 1940 El Centro seismic data is applied by adding “RS Acceleration” to the “Response Spectrum Analysis” tree and adding data from Table 4. Through trial-and-error, it was determined that maximum deflection is found by applying seismic loading in the z-direction (parallel with the crane beam). In the “Solutions” tree, directional deformation probes are applied to node 20 (see Figure 6) to provide deflections in x- and z-directions resulting from the seismic event. These initial values are 0.34747 in (x-direction) and 0.54211 in (z-direction). This results in a total deflection of 0.64391 in. These values provide the baseline for reduction of seismic induced deflection. 5.4 PTMD Addition
Fig. 12. PTMD Addition.
Through trial-and-error with different TMD systems in WB14, it was determined that an undamped pendulum tuned mass damper system (PTMD) was ideal for reduction of crane beam deflection. To

Joshua Snyder and Changki Mo / Journal of Vibration Analysis, Measurement, and Control (2014) Vol. 2 No. 1 pp. 41-56
54
model the PTMD, an additional node and geometry were defined. The PTMD node was set directly underneath node 13 (see Figure 6) at an arbitrary initial y-direction, an element added between the two nodes, and an initial radius assigned (round cross-section) for the element. These values are later adjusted as described in Section 5.8. 5.5 Goal Driven Optimization With the PTMD node and geometry defined, an arbitrary load is applied on the PTMD node. Modal Analysis and Response Spectrum Analysis are performed again with the arbitrary set of geometry and loading condition. In order to perform a Goal Driven Optimization, certain parameters need to be identified as driving factors. For this paper the driving parameters are:
PTMD node location (length) PTMD cross-section (diameter) PTMD mass Crane Cable deflection, x-direction Crane Cable deflection, z-direction PTMD deflection, x-direction PTMD deflection, z-direction
Once the driving parameters are identified, “Goal Driven Optimization” is selected from the WB14 toolbox. The interface provides the ability to identify ranges of values for the input parameters (node location, diameter, and mass) and generate results for the output parameters (Crane Cable deflections and PTMD deflections). The advantage of this tool is that it allows you to run multiple iterations of the simulation without manually inputting the values into the Geometry and Model. The Project Schematic Tree for the whole simulation model is shown in the Figure 13.
Fig. 13. Complete Project Schematic Tree.

Joshua Snyder and Changki Mo / Journal of Vibration Analysis, Measurement, and Control (2014) Vol. 2 No. 1 pp. 41-56
55
The program allows the ability to assign objectives to the input parameters (diameter, length, and mass) and output parameters (deflections). By adjusting the objectives, the optimal configuration of the input parameters are determined that result in the desired output parameters. In other words, by adjusting the length, diameter, and mass of the pendulum the directional deflections of the Crane Cable can be minimalized. The results of the Goal Driven Optimization process are outlined in Section 6.0.
6. Results Results are summarized in Table 5. Table 5 Summary of Results.
PTMD Parameters Crane Cable Deflections PTMD Deflections P1-Node
(in) P2-
Radius (in)
P3-Mass (lb)
Total Mass (lb)
P4-Crane x-defl. (in)
P4-reduction
(%)
P5-Crane z-defl. (in)
P5-reduction
(%)
Total defl. (in)
Total reduction
(%)
P6-TMD x-defl. (in)
P7-TMD z-defl.
(in) 516.74 3.8558 198.4 1828.89 0.11559 66.73 0.39993 26.23 0.41630 35.35 0.0001789 0.3259 515.5 3.7646 255.5 1825.84 0.11824 65.97 0.40997 24.38 0.42668 33.74 0.0001741 0.32261 516.57 3.8833 96.43 1752.61 0.11123 67.99 0.39981 26.25 0.41499 35.55 0.00017735 0.32452 514.2 3.6255 260.64 1732.71 0.12882 62.93 0.46241 14.70 0.48002 25.45 0.00017147 0.32274 515.28 3.7661 143.35 1717.80 0.1165 66.47 0.42303 21.97 0.43878 31.86 0.00017281 0.32155 514.63 3.5318 119.9 1511.96 0.13367 61.53 0.45943 15.25 0.47848 25.69 0.00015682 0.28916 515.49 3.5786 213.72 1632.84 0.12744 63.32 0.40836 24.67 0.42778 33.57 0.00012457 0.22757 514.93 3.5106 151.89 1523.90 0.15739 54.70 0.44011 18.81 0.46741 27.41 0.00019185 0.35486 516.02 3.5677 71.794 1476.11 0.15659 54.93 0.39984 26.24 0.42941 33.31 0.00018807 0.35725 523 0.875 1250 1329.58 0.1049 69.81 0.44817 17.33 0.46028 28.52 0.002001 1.0517 522.51 0.82302 1225.8 1296.51 0.13177 62.08 0.43963 18.90 0.45895 28.72 0.0019924 0.96179 522.92 0.86259 1101.2 1178.60 0.089857 74.14 0.42864 20.93 0.43796 31.98 0.0019874 1.1543 532.16 0.6787 731.83 775.85 0.11032 68.25 0.46616 14.01 0.47904 25.60 0.0023669 1.153 532.23 0.68677 704.81 749.86 0.11672 66.41 0.46555 14.12 0.47996 25.46 0.0022234 1.1356
The final chosen parameter set (bold above) was a PTMD cable length of 104.44 in (~8.70 ft), PTMD cable radius of 0.68677 in, and PTMD mass of 704.81 lb (total mass of 749.86 lb). These parameters resulted in a crane cable x-direction deflection of 0.11672 in (66.41% reduction), crane cable z-direction deflection of 0.46555 in (14.12% reduction), and total crane cable deflection of 0.47996 in (25.46% reduction). Running a Modal Analysis (pre-seismic) with these parameters produced a first mode frequency of 4.3201 Hz (Appendix B). No limiting parameter was set for the PTMD deflection but the total deflection is such that it is negligible. 6.1 Performance Verification In order to verify the performance of the PTMD system, the magnitude of the seismic event was drastically increased to see a system total deflection (no PTMD) of over two inches (enough to make PJM array contact acrylic vessel wall for some array types). In order to see this amount of deflection, the values shown in Table 4 were scaled with a constant value of 360 in/sec2. The resulting deflections without PTMD on the crane cable were 1.1391 in (x-direction), 1.8021 in (z-direction), and 2.13193 in (total). Adding the PTMD to the system resulted in a crane cable x-direction deflection of 0.38673 in (66.05% reduction), crane cable z-direction deflection of 1.5517 in (13.89% reduction), and total crane cable deflection of 1.59917 in (24.99% reduction). These values provide verification that the PTMD system works appropriately.

Joshua Snyder and Changki Mo / Journal of Vibration Analysis, Measurement, and Control (2014) Vol. 2 No. 1 pp. 41-56
56
7. Conclusion Utilizing a pendulum tuned mass damper (PTMD) it is possible to meet or exceed the goal of 25% reduction in total deflection due to seismic excitation for the MCE Lift Tower while supporting a PJM array installation. The subsequent deflection of the PTMD was small enough that it did not warrant additional design restrictions. As a result, if the PTMD system is decided as being a warranted upgrade to the existing system, minimal modification to the lift tower external siding would provide the required space for the PTMD deflection.
References AISC Committee on Manuals and Texts (2005). Steel Construction Manual. American Institute of Steel
Construction, Inc., 13th Edition. Avila, Carmona, Doz de Carvalho, Lima, and Souza dos Santos (2013). Vibration Control of a Gym Floor Using
Tuned Mass Dampers: A Numerical Analysis. Modern Mechanical Engineering (Vol. 3, pp. 9-16). http://dx.doi.org/10.4236/mme.2013.33A002 Avila and Goncalves (January-March 2009). Optimal Configurations of Composite Multiple Mass Dampers in
Tall Buildings. Journal of the Brazilian Society of Mechanical Sciences and Engineering, Vol. XXXI, No. 1, pp. 75-82.
Le Bourva, Dallard, Fitzpatrick, Flint, Low, Smith, and Willford (2001). The London Millennium Footbridge. The Structural Engineer, Vol. 79, No. 22, pp. 17-33.
EDR MEDESO. ANSYS Tutorial: Earthquake analyses in workbench. http://www.edr.se/blogg/blogg/ansys_tutorial_earthquake_analyses_in_workbench.
Ghorbani-Tanha, Okhovat, and Rahimian (October 12-13, 2006). Tuned Mass Damper for Seismic Response Reduction of Tehran Tower. 4th International Conference on Earthquake Engineering, Paper No. 132.
Tejashri S. Gulve and Pranesh Murnal (August 2013). Feasibility of Implementing Water Tank as Passive Tuned Mass Damper. International Journal of Innovative Technology and Exploring Engineering (IJITEE), Vol. 3, Issue 3, pp. 12-19.
Huei-Huang Lee (2012). Finite Element Simulations with ANSYS Workbench 14: Theories, Applications, Case Studies. SDC Publications. ISBN: 978-1-58503-725-4.
Singiresu S. Rao (2011). Mechanical Vibrations. Prentice Hall. Fifth Edition. University of California – San Diego, El Centro Seismic Data. http://webshaker.ucsd.edu/homework221.html. Vaicaitis and Webster (2003). Application of Tuned Mass Dampers to Control Vibrations of Composite Floor
Systems. American Institute of Steel Construction. Engineering Journal, pp. 116-124.