Embed Size (px)
Citation preview

Columbia International Publishing Journal of Vibration Analysis, Measurement, and Control (2014) Vol. 2 No. 1 pp. 16-29 doi:10.7726/jvamc.2014.1002
Research Article
______________________________________________________________________________________________________________________________ *Corresponding e-mail: [email protected] 1 National Institute of Technology Karanataka, Surathkal, Mangalore, India
16
Computational and Experimental Approach for Fault Detection of Gears
Kiran Vernekar1, Hemantha Kumar1*, and K V Gangadharan1
Received 16 October 2014; Published online 3 January 2015 © The author(s) 2014. Published with open access at www.uscip.us
Abstract Gear is one of the most important transmission component used in gear box. This paper attempts for damage detection of gear box used in internal combustion (IC) engine using Multi-body dynamics (MBD) analysis and validating results experimentally using conventional vibration spectrum analysis. For virtual damage detection, the gearbox model was developed on the basis of a multi-body dynamics method and dynamics simulations for healthy as well as defective gear condition have been carried out with the specialized multi-body dynamics software (MSC ADAMS/view). Experiment was carried out on two stroke internal combustion engine gearbox without considering the combustion, vibration signals were collected for healthy as well as defective gear condition. The signals were analyzed in time and frequency domain for fault detection. An experimental and simulation result demonstrates the dynamics behaviour in frequency domain is dominated by gear mesh frequency (GMF) and amplitude modulations of gear mesh frequencies harmonics. Based on the simulation results obtained which fairly matches with experimental results, MBD analysis can be effectively used for fault prediction of machine components. Keywords: Gear box; Multi-body dynamics; Internal combustion engine; Damage detection
1. Introduction Condition monitoring is a predictive maintenance technique i.e. maintenance of machinery based on an indication of a problem is about to occur and thus unexpected failure of machinery system can be prevented which in turn improves safety. The purpose of this analysis is to simulate vibration signals generated by the MBD model of the gearbox using MSC ADAMS/View software and verify it with experimental vibration signals. Vibration analysis is most important technique which is extensively used for condition monitoring of machinery systems. Spectrum analysis plays important role in fault detection of any rotary

Kiran Vernekar, Hemantha Kumar, and K V Gangadharan / Journal of Vibration Analysis, Measurement, and Control (2014) Vol. 2 No. 1 pp. 16-29
17
machine equipment. It demonstrates certain information on operating condition that determines the malfunctions such as rotary imbalance, shaft misalignment, bearing and gear damages. Time domain represents the dynamic responses depend on the interaction of many components of the system. Generally a perfect gear in mesh produces a perfectly smooth sinusoidal signal in time domain and a prominent gear running frequency, gear mesh frequencies and its harmonics in frequency domain. Faults in gear system such as broken tooth, misalignment will results in change in pattern of frequency spectrum which indicates development of fault or failure of component. Few researchers carried out study on development of dynamic model of a planetary gear system and analyzed using MBD analysis software MSC ADAMS (Dresig and Schreiber, 2005; Dąbrowski
and Adamczyk, 2012). Kong et al. (2008) developed industrial gearbox model using ADAMS and studied the gear health diagnostic for healthy and artificial induced gear teeth condition. Vernekar et al. (2014) implemented Fast Fourier transformation and wavelet transformations for fault detection of gearbox. Wu et al. (2011) carried out dynamic simulation of differential planetary gear model based on nonlinear multi body dynamics software model. In the study (sommer et al., 2011), the multi body kinematic model of slider crank mechanism was analyzed and demonstrated the effect dynamic loading on gear teeth with defects during transient, start-up, and steady-state operation. Özgüven and Houser (1988) studied mathematical modelling of gears for dynamic analysis. Vernekar et al. (2014) carried out experimental investigation of fault diagnosis of bearing used in IC engine using machine learning approach. Very limited literatures were found in fault detection using MBD analysis and no researcher’s reported comparison of both computational and experimental approach for fault detection. This paper attempts to demonstrate a novel method for fault detection of the engine using computational MBD analysis and validate it with experimental results. 1.1 Fourier transform Fourier transform (FT) based spectral analysis is the dominant analytical tool for frequency domain analysis. Fourier transform is most widely used in vibration signal analysis. It simply converts given signal from time domain to frequency domain by integrating the given function over the entire time period. FT for the angular frequency ω = 2πf and time t is given by,
𝑋(⍵) = ∫ 𝑥(𝑡)+∞
−∞
𝑒−𝑗⍵𝑡 𝑑𝑡 𝑓𝑜𝑟𝑤𝑎𝑟𝑑 𝑡𝑟𝑎𝑛𝑠𝑓𝑜𝑟𝑚 (1)
𝑥(𝑡) =1
2𝜋∫ 𝑋(⍵)𝑒𝑗⍵𝑡 +∞
−∞
𝑑 𝜔 𝐼𝑛𝑣𝑒𝑟𝑠𝑒 𝑡𝑟𝑎𝑛𝑠𝑓𝑜𝑟𝑚 (2)
where X (ω) is the Fourier transform of the signal X (t). Using these equations, a signal X (t) can be transformed into the frequency domain and back again. The FT is well suited to analyze stationary periodic functions-which will exactly repeat themselves once over period, without modification. Fourier transform is particularly used to convert a function from the continuous time to the continuous frequency domain, where as Fast Fourier Transform (FFT) is an efficient algorithm to compute the discrete Fourier transform and it’s inverse with considerable savings in computational time. FT technique earned much of the importance in processing stationary signal. FFT is the one of

Kiran Vernekar, Hemantha Kumar, and K V Gangadharan / Journal of Vibration Analysis, Measurement, and Control (2014) Vol. 2 No. 1 pp. 16-29
18
the extension of it. Frequency domain not only detects the fault but also indicates the cause of the defect in the machinery system (Vernekar et al., 2014).
2. Computational Approach Though MBD Analysis In this research, Kawasaki Bajaj (KB-100) two stroke spark ignition engine gearbox has been considered for the study. Generally, the engine conditions are monitored at idle speed, which is nearer to 1000 rpm. The computational MBD analysis and experiment analysis have been carried out at constant rotational engine crank speed of 1100 rpm at 4th gear position. Fig. 1 shows the KB-100 gear box used for research purpose. The characteristic vibration frequencies of the engine are listed in Table 1.
Fig.1. Sectioned view of engine.
Table 1 Characteristic vibration frequency at engine running speed.
Parameters Frequency (Hz)
Gear rotational frequency 4.87
Pinion rotational frequency 5
Gear mesh frequency (GMF) 117 Crank shaft rotating frequency (fs) 18
A 3-D CAD model of gear box was developed by using Pro/Engineer wildfire software is as shown in fig. 2. Fig. 2(b) and 2(c) shows the condition of the gear model. For virtual fault detection, tooth profile error is artificially incorporated by removing one tooth from the gear as shown in fig. 2(c). The spur gear model parameters which resemble the actual experimental gear condition are listed in Table 2.

Kiran Vernekar, Hemantha Kumar, and K V Gangadharan / Journal of Vibration Analysis, Measurement, and Control (2014) Vol. 2 No. 1 pp. 16-29
19
(a)
(b)
(c)
Fig. 2. CAD models (a) Gear box transmission assembly (b) Healthy gear (c) Faulty gear.
Table 2 Model parameters.
Parameters Values Module m 1.75 No. of teeth on pinion Z1 23 No. of teeth on gear Z2 24 Pressure angle Φ 20 deg Face width F 9.5 Base circle diameter Bd 38.7 mm Tooth thickness t 2.75 mm Pitch circle diameter of gear Pg 42 mm Pitch circle diameter of pinion Pp 40.25 mm Gear ratio G.R. 1.04

Kiran Vernekar, Hemantha Kumar, and K V Gangadharan / Journal of Vibration Analysis, Measurement, and Control (2014) Vol. 2 No. 1 pp. 16-29
20
2.1 Multi-body dynamics Model ADAMS /view software has been used for MBD analysis to detect faults in IC engine gearbox. The CAD model developed in Pro/Engineer was imported to MSC ADAMS/view software to perform MBD analysis. In order to satisfy operating condition contact forces and constraints are applied on the model, which is shown in Table 3. Table 3 Constraints in MBD model.
Between bodies Type of joint Gear and shaft Fixed joint Shaft and ground Revolute joint Piston and cylinder Translation joint Cylinder and ground Fixed joint Connecting rod and piston Revolute joint Connecting rod and crank shaft Revolute joint
Fig. 3 shows multi body model of gearbox transmission system in MSC ADAMS/view working environment. For simplifying the model, bearings were replaced with revolute joint.
Fig. 3. Multi body model of gearbox.

Kiran Vernekar, Hemantha Kumar, and K V Gangadharan / Journal of Vibration Analysis, Measurement, and Control (2014) Vol. 2 No. 1 pp. 16-29
21
Table 4 presents information regarding mass, moment of inertia and centre of gravity (w.r.t. coordinate system) of some important MBD model components. Table 4 Topology of MBD model.
Body Mass (kg)
Ixx
(mm4) Iyy
(mm4) Izz
(mm4) Centre of gravity
(in mm) x y z
Gear 0.085 20.91 11.03 11.03 97.63 -35.5 -7 Pinion 0.066 16.98 8.94 8.94 1.31 55.42 -7 Connecting rod 0.125 179.9 170.48 12.4 1.3 55.4 -7 Crank shaft 1.6 1407.94 1365.67 1284.67 9.6 1.16 -7 Piston 0.116 54.3 52.7 50.7 0 124 -7 Cylinder 2 3152.15 2098.63 1582.44 28.5 99.8 -7
The contact force of the gear in mesh is described by using contact mechanics model which is determined by parameters such as stiffness, force exponent and damping coefficient [4]. The meshing between gears was modeled based on ADAMS Impact algorithm. Fig. 4 shows the contact force model. The contact force can be expressed in equation (3). The contact force composes elastic component K(x-x_0) and damping force CS dx/dt, which is the function of contact collision velocity.
𝐹 = {𝐾 (𝑥 − 𝑥𝑜) + 𝐶𝑆𝑥 ̇ 𝑥 < 𝑥𝑜 0 𝑥 ≥ 𝑥𝑜
(3)
Fig. 4. Contact force model. Fig. 5. Damping force vs. Penetration depth.
From equation (3), 𝑥0 − 𝑥 is the deformation in the process of contact-collision and it shows that the contact will not occur while x ≥ x0 and hence the contact force is zero. Contact occurs while x<x0 and the contact force is related to the parameters such as stiffness ‘K’, the deformation x0-x, contact force exponent ‘e’, damping coefficient ‘C’ and the penetration depth ‘d’ which is the maximum value of 𝑥0 − 𝑥. ‘S’ is the step function which can be defined as follows.

Kiran Vernekar, Hemantha Kumar, and K V Gangadharan / Journal of Vibration Analysis, Measurement, and Control (2014) Vol. 2 No. 1 pp. 16-29
22
𝑆 = {
0 𝑥 > 𝑥0(3 − 2𝑑)∆𝑑2 𝑥0 − 𝑑 < 𝑥 < 𝑥0 1 𝑥 ≤ 𝑥0 − 𝑑
(4)
By the definition of step function in equation (4), damping force is defined as a cubic function of penetration depth. To avoid the function discontinuity caused by the dramatic variation of the damping force while contact-collision occurs (fig. 5).Whenever the penetration depth of the two contacted bodies becomes zero the damping force is set to zero and damping force reaches maximum value ‘Fmax’, when the specified penetration depth ‘d’ is approached (Kong et al., 2008). The stiffness between gear teeth pair in contact can be determined by Hertzian elastic contact theory as expressed in equation (5). In this model the stiffness is described by a pair of ideal cylinders in contact (Johnson, 1985).
{
𝑘 =
4
3𝑅12𝐸∗ =
4
3[𝑖𝑑1 cos 𝛼𝑡 𝑡𝑎𝑛 𝛼
′𝑡
2(1 + 𝑖) cos 𝛽𝑏]
12
𝐸∗
1
𝐸∗=1 − 𝜈1
2
𝐸1+1 − 𝜈2
2
𝐸2𝛽𝑏 = a tan(tan𝛽 𝑐𝑜𝑠 𝛼𝑡)
(5)
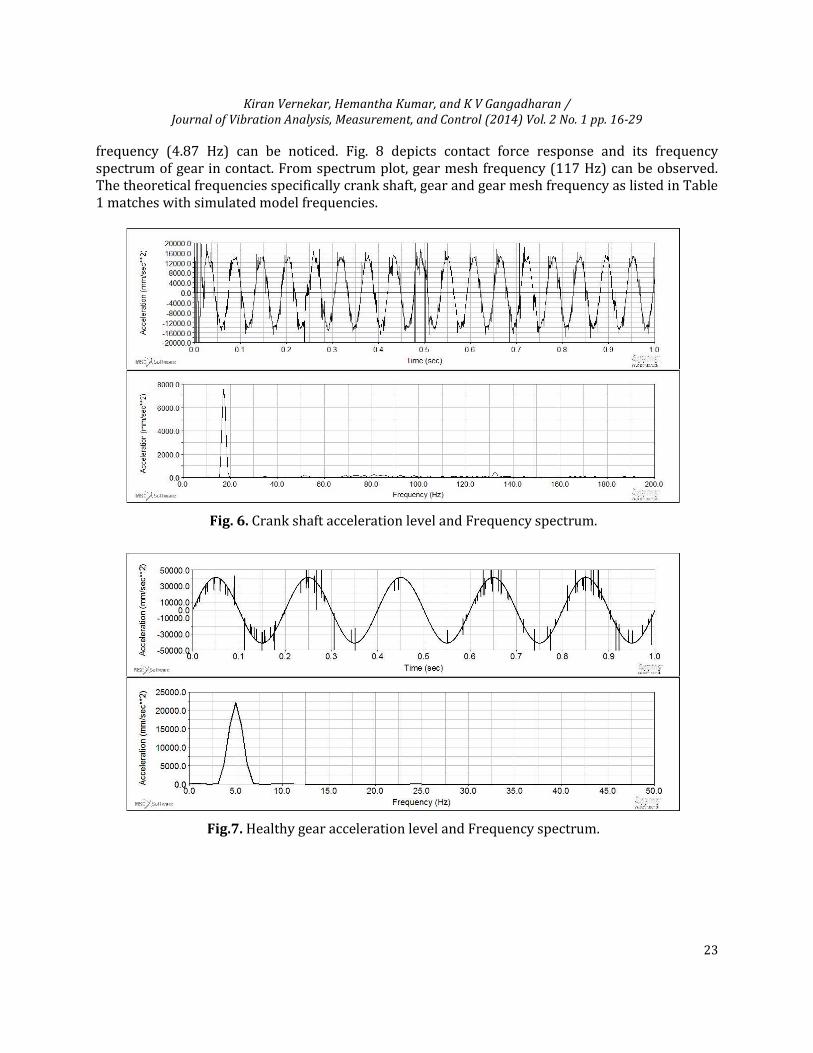
In the equation above the ‘R’ is an equivalent radius of two contacting bodies, E* is an equivalent Young’s modulus of two contacting bodies, ‘i’ is a gear ratio, ‘d1’ is a diameter of standard pitch circle, αt’, αt is a transverse pressure angle at engaged and standard pitch circle, ‘β’, ‘βb’ is a helical angle at the pitch and base circle. ‘ν1’, ‘ν2’is a Poisson ratio of the pinion and gear. E1’, ‘E2’ are the Young’s modulus of pinion and gear respectively. In the model it was assumed that the gear and pinion are made from the steel, with same material properties such as Young's modulus 2 x10⁵ N/mm2, Poisson's ratio 0.3 and density 7850 kg/m3. Stiffness ‘K’ value found to be 1 x 10⁵ N/mm which is calculated based on equation (5). The damping coefficient ‘C’ takes value from 0.1 to 1% of K, in simulation it is set to 100 N-s/mm. Other parameters like force exponent ‘e’ is set to 2.2 and penetration depth ‘d’ is assumed as 0.01 mm have been set as per recommended values (Giesbers , 2012). 2.2 Simulation results The simulation results for MBD model of gearbox with good condition and faulty condition of gear are presented in this section. In this study all response are measured with respect to vertical direction of the global coordinate system. Rotational speed of 5 Hz was applied on pinion as indicated in Table 1. 2.2.1 Healthy gear simulation In this section MBD simulation results for gearbox with healthy gear are presented. Fig. 6 shows crank shaft acceleration response and frequency spectrum, 18 Hz (1100 rpm) is the crankshaft rotary frequency which can be noticed from the frequency spectrum. Fig. 7 shows acceleration response and frequency spectrum of gear. From spectrum plot, peaks corresponding gear rotational
Kiran Vernekar, Hemantha Kumar, and K V Gangadharan / Journal of Vibration Analysis, Measurement, and Control (2014) Vol. 2 No. 1 pp. 16-29
23
frequency (4.87 Hz) can be noticed. Fig. 8 depicts contact force response and its frequency spectrum of gear in contact. From spectrum plot, gear mesh frequency (117 Hz) can be observed. The theoretical frequencies specifically crank shaft, gear and gear mesh frequency as listed in Table 1 matches with simulated model frequencies.
Fig. 6. Crank shaft acceleration level and Frequency spectrum.
Fig.7. Healthy gear acceleration level and Frequency spectrum.

Kiran Vernekar, Hemantha Kumar, and K V Gangadharan / Journal of Vibration Analysis, Measurement, and Control (2014) Vol. 2 No. 1 pp. 16-29
24
Fig. 8. Healthy gear Contact Forces and Frequency spectrum.
2.2.2 Faulty gear simulation The MBD simulation of same gearbox for gear with simulated artificial defect was carried out keeping same parameters and operating conditions as presented in previous section. The crank shaft acceleration response and frequency spectrum are same as illustrated in fig. 6. Fig. 9 illustrates faulty gear acceleration response and its frequency spectrum, higher acceleration levels are observed with faulty gear MBD simulation w.r.t the MBD simulation of healthy gear.
Fig.9. Faulty gear acceleration level and Frequency spectrum.

Kiran Vernekar, Hemantha Kumar, and K V Gangadharan / Journal of Vibration Analysis, Measurement, and Control (2014) Vol. 2 No. 1 pp. 16-29
25
Fig. 10. Faulty gear Contact forces and Frequency spectrum.
Fig. 10 demonstrates contact force and its frequency spectrum, from contact force analysis there is increase in contact force (0.275 N to 1.5 N) with respect to healthy gear are observable and also from frequency spectrum due to frequency modulations GMF with side bands are observable, which determines existence of fault in gearing operation of gearbox.
3. Experimental Verification
The engine test rig has been developed to study fault detection of gear used in IC engine. The
details about the experimental setup and procedure are discussed in the following sections. 3.1 Experimental setup description The fig’s. 11 and 12 illustrate the line diagram and experimental test setup used for fault detection of gear box used in IC engine. The experiments were conducted on the KB-100 engine without considering the combustion. In order to meet the simulation conditions experiments were carried out constant crankshaft speed of 1100 rpm at 4th gear position. The engine was driven by 3 HP DC motor. The data has been acquired using NI-9234 data acquisition (DAQ) card and analyzed using Lab-View software from National Instruments (NI). Piezoelectric accelerometer with an operating frequency range between 1 to 5000 Hz was used to pick-up vibration signals (magnitude of acceleration with respect to time). The sampling frequency of 25.6 KHz was used to collect the data for 1 second.

Kiran Vernekar, Hemantha Kumar, and K V Gangadharan / Journal of Vibration Analysis, Measurement, and Control (2014) Vol. 2 No. 1 pp. 16-29
26
Fig.11. Line diagram of experimental setup.
Fig.12. Experimental set-up of gear box fault detection.
3.2 Experimental procedure In this experiment, the vibration signal was acquired from a healthy gear condition at constant crank shaft speed of 1100 rpm (18 Hz), which is considered as the baseline. In second test, artificial fault is induced by removing one tooth from the gear as shown in fig. 13 and the corresponding vibration readings were extracted.

Kiran Vernekar, Hemantha Kumar, and K V Gangadharan / Journal of Vibration Analysis, Measurement, and Control (2014) Vol. 2 No. 1 pp. 16-29
27
Fig.13. Gear conditions
(a) Healthy gear (b) Gears with simulated artificial fault.
In case of gear vibration, gear mesh frequency (GMF) is important, which is generated due to modulation phenomena. In faulty condition there exists increase in magnitude in GMF which is the indication of defective condition of gear (Lokesha et al. 2011).
4. Experimental Results
4.1 Experiment 1: Healthy gear
In this section, experimental result on fault detection of gearbox using conventional vibration technique is demonstrated. The experimental results with healthy condition of gear are shown in fig. 14. Time domain plot fig. 14 (a) represents the dynamic responses and fig. 14 (b) illustrates, frequency spectrum pertaining to healthy gear condition. From spectrum plot peak frequency component at 18 Hz, which is the running frequency of the crank shaft rotation (fs) is observable.
(a)
(b) Fig.14. Vibration response of a healthy gear. (a) Vibration response in Time domain
(b) Frequency spectrum.
0.0 0.2 0.4 0.6 0.8 1.0
-2.0
-1.5
-1.0
-0.5
0.0
0.5
1.0
1.5
Acc
eler
ati
on
(g)
Time (s) 0 20 40 60 80 100 120 140 160 180 2000.00
0.02
0.04
0.06
0.08
GMF
4xfs
3xfs
fs
2xfs
Accele
rati
on
(g
)
Frequency (Hz)

Kiran Vernekar, Hemantha Kumar, and K V Gangadharan / Journal of Vibration Analysis, Measurement, and Control (2014) Vol. 2 No. 1 pp. 16-29
28
Another frequency with high peak is at 36 Hz (2×fs), which is occurred due to misalignment of shaft and most of the rest of the peaks are multiples of crank shaft rotating frequencies. Gear mesh frequency at 117 Hz can also be observed in the same frequency spectrum plot. It can be noticed from frequency spectrum that the vibration of the crank shaft has highest influence on the spectrum of the gearbox, which is dominant among all the frequencies and thus gear rotating frequency (4.87 Hz) is not be noticeable in the frequency spectrum. 4.2 Experiment 2: Gear with simulated artificial fault Fig. 15 demonstrates vibration response of faulty gear in time and frequency domain. From time domain response as shown in fig. 15 (a), it can be observed that the acceleration level is increased with reference to fig. 14 (a). The increase in the amplitude of GMF (117 Hz) can be visualized in frequency spectrum as shown in fig. 14 (b). The magnitude of GMF is increased from 0.025 to 0.11 m/s2, which indicates the presence of fault in the gearbox.
(a)
(b) Fig.15. Vibration response of a faulty gear. (a) Vibration response in Time domain
(b) Frequency spectrum.
5. Conclusion This investigation outlines the effectiveness and reliability of MSC ADAMS to perform the MBD simulation of an IC engine gear box and to validate with experiment. MBD analysis has been carried out using contact algorithm for virtual fault detection of gear box. In experimental analysis, the vibration signals were acquired from engine gear box using accelerometer and analyzed using conventional vibration analysis. MBD analysis can be successfully used to analyze the each individual component of the system, whereas experimental investigation gives system level information. In MBD analysis, gear acceleration levels are evaluated based on body centre mass relative to reference frame (coordinate system), whereas in case of experiment the acceleration levels are depends on location of the accelerometer. From the spectrum analysis, gear meshing frequencies are observable and the localization of GMF in ADAMS/view simulation result is same as experimental result. From this it can be concluded that MBD analysis can be effectively used for
0.0 0.2 0.4 0.6 0.8 1.0
-8
-6
-4
-2
0
2
4
6
8
Acc
eler
ati
on
(g)
Time (s) 0 20 40 60 80 100 120 140 160 180 2000.00
0.02
0.04
0.06
0.08
0.10
0.12
fs
2xfs3xfs
GMF
Acc
eler
atio
n (
g)
Frequency (Hz)

Kiran Vernekar, Hemantha Kumar, and K V Gangadharan / Journal of Vibration Analysis, Measurement, and Control (2014) Vol. 2 No. 1 pp. 16-29
29
fault prediction of machine components and to study behaviour of modeled systems, which may reduce some costs of field testing.
Acknowledgements The authors acknowledge the funding support from SOLVE: The Virtual Lab @ NITK (www.solve.nitk.ac.in) and experimental facility provided by Centre for System Design (CSD): A Centre of excellence at NITK-Surathkal.
References Dąbrowski, D. and Adamczyk, J. (2012). Analysis of vibrations generated by the multi-body model of a
planetary gear. Mechanics and Control, Vol.31. http://dx.doi.org/10.7494/mech.2012.31.4.143
Dresig, Hans, and Uwe Schreiber (2005). Vibration analysis for planetary gears. Modelling and multi body simulation. International Conference on Mechanical Engineering and Mechanics. Proceedings of ICMEM2005 (pp. 24-28).
Giesbers, J. (2012). Contact mechanics in MSC ADAMS-A technical evaluation of the contact models in multibody dynamics software MSC ADAMS.
K. L. Johnson. (1985). Contact Mechanics, Cambridge University Press. http://dx.doi.org/10.1017/CBO9781139171731
Vernekar, K., Kumar, H., & Gangadharan, K. V. (2014). Gear Fault Detection Using Vibration Analysis and Continuous Wavelet Transform. Procedia Materials Science, (Vol.5, pp.1846-1852). Elsevier. http://dx.doi.org/10.1016/j.mspro.2014.07.492
Vernekar, K., Kumar, H., & Gangadharan, K. V. (2014). Fault diagnosis of deep groove ball bearing through discrete wavelet features using support vector machine. COMADEM international, Vol. 17, 31-37.
Kong, D., Meagher, J. M., Xu, C., Wu, X. and Wu, Y. (2008). Nonlinear contact Analysis of gear teeth for malfunction diagnostics.
Lokesha, M., Majumder, M. C., Ramachandran, K. P.,Raheem, K. F. A. (2011). Fault diagnosis in gear using wavelet envelope power spectrum. International Journal of Engineering, Science and Technology, Vol.3, No.8, 156-167.
MSC Inc., MSC ADAMS reference manual.
Özgüven H.N., Houser D.R. (1988). Mathematical Models used in Gear Dynamics – A Review. Journal of Sound and Vibration, Vol.121, No.3, 383-411 http://dx.doi.org/10.1016/S0022-460X(88)80365-1
Sommer A., Meagher J., Wu X. (2011). Gear Defect Modeling of a Multiple-Stage Gear Train, Modelling and Simulation in Engineering, Vol. 18, 1–8. http://dx.doi.org/10.1155/2011/754257
Wu X., Meagher J., Sommer A.(2011). A differential planetary gear model with backlash and teeth damage, rotating machinery. Structural Health Monitoring, Shock and Vibration, Vol. 5, 203-215.