Embed Size (px)
Citation preview

Condition Monitoring for PredictiveMaintenance:A Tool for Systems Prognosis within the
Industrial Internet Applications
Douglas OkaforChukwuekwe
Reliability, Availability, Maintainability and Safety (RAMS)
Supervisor: Per Schjølberg, IPKCo-supervisor: Tommy Glesnes, Karsten Moholt AS
Department of Production and Quality Engineering
Submission date: August 2016
Norwegian University of Science and Technology


Part 1: Main Report
RAMSReliability, Availability,
Maintainability, and Safety
Condition Monitoring for Predictive
Maintenance: A Tool for Systems Prognosis
within the Industrial Internet Applications
Douglas Okafor Chukwuekwe
July 2016
MASTER THESIS (TPK4950)
Department of Production and Quality Engineering
Norwegian University of Science and Technology
Supervisor: Per Schjølberg (Associate Professor, NTNU-Trondheim)
Co-Supervisor: Tommy Glesnes (Chief Technical Officer, Karsten Moholt AS)
i
Preface
This report is submitted in partial fulfilment of the requirements for the award of an MSc degree
in the study programme: Reliability, Availability, Maintainability and Safety (RAMS). The thesis
was carried out during the Spring semester of 2016. It is particularly focused on using condition
monitoring as a maintenance activity to the benefit of predictive maintenance and prognosis
within the Industrial Internet of Things (IIoT).
I was inspired to pursue this project topic in the course of my work as a Research Assistant
at the NTNU’s department of Production and Quality Engineering (IPK) during the Summer of
2015. The theme of the study was proposed by my supervisor, Associate Professor Per Schjøl-
berg. The thesis was carried out in partnership with Karsten Moholt AS with active support
from Mr. Tommy Glesnes, the Chief Technical Officer of the company and my co-supervisor.
The head of department, Professor Jørn Vatn, also played a key role in this research.
The readers of this report should have some basic knowledge in maintenance engineering
principles, fundamental physics and stochastic processes. Two peer-reviewed papers form part
of this report. As a whole, the report represents my main research achievements during my MSc
study. The theories and models developed in the report/papers were based on other existing
theories and models. You should pay attention to the common aphorism often attributed to
the famous statistician, George Box, who was quoted to have clarified his claims by saying, "All
models are wrong, some are useful."
Trondheim, 29-Jul-2016
Douglas Okafor Chukwuekwe
ii
Acknowledgements
I am grateful to my supervisor, Associate Professor Per Schjølberg, who provided useful insights
while guiding me in this thesis. I am equally grateful to my co-supervisor, Mr. Tommy Glesnes,
for his contributions and support through his wealth of experience and loads of study materials
and training manuals provided for this research. I am grateful to the staff and management of
Karsten Moholt AS for contributing their facility and resources to aid the successful completion
of this report.
Prior to this final report I extracted a paper which was peer-reviewed and accepted for pre-
sentation at the Euro Maintenance Conference 2016. The RAMS group offered me a grant to
attend the Conference in Athens, Greece. I wish to thank Professor Jørn Vatn for all his moral
support and for facilitating the department’s financial support for my research and conference
participation. I also wish to thank the European Federation of National Maintenance Societies
(EFNMS), with special thanks to Mr. Cosmas Vamvalis, the Chairman and CEO of the EFNMS
for his encouragement during the process. A second peer-reviewed paper based on this thesis
has been accepted and would be presented at the International Conference on Maintenance
Engineering (InCoME), August 2016 at the University of Manchester, UK.
I gained lots of inspiration from Marvin Rausand (Professor emeritus), I remain grateful to
him and all the other professors who taught me at the NTNU in the course of this MSc study.
After thirteen years of completing my bachelor’s degree, an industry work experience of
twelve years, and five years of marriage blessed with two children, the decision to come to the
NTNU (arguably one of the best technical universities in Europe) for my master’s degree was
always going to be a tough call. I am to that end profoundly grateful to my loving wife, Amaka,
and our lovely children, Royal and Honour, for their understanding and support throughout this
challenging episode.
I would like to thank my friends, colleagues and members of the Overcomers’ Chapel Inter-
national for their numerous assistance.
And, . . . to my parents Maazi na Lolo Moses & Mary Ani (in memoriam).
God bless you all!
O.D.C.
iii
Summary
As organisations strive to reach their production targets there are assets that are critical to their
operations. The reliability and availability of these critical assets directly impact the profit mar-
gins of the organisations and by implication their continued existence. Within an organisation’s
maintenance function, predictive maintenance techniques such as condition monitoring and
prognosis have today gained an increased attention because they are important to balance the
dilemma between maintenance costs and technical acceptability. The level of competence and
success recorded with the vibration based condition monitoring techniques means that they
have found useful applications within varied industries from aerospace to manufacturing as
well as the oil and gas industry in recent times.
However, as the transition is made away from traditional manufacturing and standalone
systems, a major concern expressed within the industry is that the current approach presented
within Industry 4.0 (the Industrial Internet of Things (IIoT)) for implementing predictive main-
tenance places too much emphasis on low level data monitoring to a degree that compromises
the level of competence already achieved within the industrial application of vibration based
condition monitoring, and there is so far no proven method to overcome the challenge.
The ultimate goal of any condition monitoring system is to gain capability to predict the fu-
ture of the equipment monitored. Such a goal would be hard to reach by simply monitoring low
level data such as temperature and pressure as currently suggested in the literature related to
Industry 4.0 although there are still not many publications available in this area. The Industrial
Internet of Things is a new and evolving paradigm, therefore research and implementation are
still in their formative stages. Previous publications are quick to highlight the strategic impor-
tance of big data but fail to demonstrate how it can be organised and analysed for the purpose
of predictive maintenance and for completing the maintenance decision loop. From the per-
spective of maintenance, the obvious weakness in the present big data exists in the fact that
they are collected mainly for operational reasons and only serve maintenance purposes often
“accidentally” or as an afterthought at the best.
In this thesis, investigations have been carried out and the results reported can bridge some
of the existing gaps. Using vibration monitoring of rotating equipment as a case study, it was
iv
demonstrated that the next generation of condition monitoring can integrate well into the In-
dustrial Internet beyond low level data monitoring which is currently the case. It was shown
that the application of a systematically selected stochastic process to low level data provides the
required scaling up of vibration data to produce a more realistic and more practicable solution
compared with any existing technique for the implementation of predictive maintenance within
the Industry 4.0 environment. Machine generated real data and an industry grade software were
deplored to obtain results which are not only compatible with the proposed Industry 4.0 refer-
ence architecture but also show a higher level of service when utilising the proposed condition
monitoring technique. Using modern sensors and instrumentation techniques, vibration data
is collected in a structured manner for the main purpose of predictive maintenance. The col-
lected data is dimensioned and treated in a form compatible with Industry 4.0 requirement for
single value data while retaining the original properties of vibration data. It was proposed to
capture multiple snapshots of vibration patterns to which a single average value is assigned to
the frequency spikes for every successive and corresponding time horizon. These values are ag-
gregated over time and a regression is run adopting the technique of the autoregressive moving
average (ARMA) to predict future failures. This is essentially a machine learning model that fol-
lows the propagation of an existing degradation over time and then estimates a future time when
the degradation is beyond a predefined threshold. This gives room for planning and arranging
for logistics in advance to minimise or totally avoid downtime.
Hence this new approach is expected to radically redefine the use of vibration based condi-
tion monitoring techniques within the Industrial Internet of Things without any loss of fidelity
in its application to predictive maintenance and thereby ensuring safe cost reduction and the
optimal utilisation of asset value. It is expected that the proposed solutions are refined further
through collaborative efforts of researchers and the end-users in the industry.
v
Recommendations
The concept of end-of-life or remaining useful life prediction is not an easy technique. The
challenges listed in this section are not exhaustive but they help to highlight the difficulties en-
countered in predictive maintenance applications. Integrating this into the new and evolving
paradigm referred to as Industry 4.0 or more generally the Industrial Internet of Things (IIoT)
can be very challenging as well. This thesis is valuable for future research, the following recom-
mendations are hereby made for further investigation:
• The aspect dealing with lifetime modelling faced the challenge of incomplete observation,
a term generally referred to as censoring and data truncation. It is necessary to investigate
better ways to handle this problem that would lead to a more robust lifetime model.
• In order to derive full benefits from the vibration based condition monitoring of rotating
equipment, the vibration signature should be analysed for its descriptive accuracy, diag-
nostic powers and prognostic capabilities. Diagnosis was not adequately covered in this
study. Researching different imaging techniques and computer vision systems would en-
hance the results when integrated into the machine learning algorithm for the IIoT.
• The quality of data used affects the final results, it is important to research more advanced
and more compatible signal processing and instrumentation techniques.
• Integration of predictive maintenance capabilities from an early design phase in future
products and in future production lines. Industry 4.0 implementation pays attention to
both products and production equipment because the product of one company could be
the production equipment of another company.
• By design, robustness and resilience of products and production assets must address is-
sues of cyber security, activities of criminal hackers and unethical competitors. Advanced
encryption techniques should be investigated and comprehensive risk assessment must
be carried out to establish the links between individual risks and the possible consequences.
• Further research is required to address the needs of standardisation, interoperability, open
systems applications, and adaptability.
vi
Structure of the Report
This master thesis has two main parts:
• Main report: this is the main part of the report. It covers the background, the problem
description and thesis objectives. It includes the research methodology, the main results,
discussion, recommendations and summary.
• Papers/articles: This part includes two peer-reviewed papers written and presented at in-
ternational conferences. This is in fulfilment of one of the thesis’ sub-objectives to present
at least one paper at a reputable International conference. The articles are undergoing
further review for publication in scientific/technological journals. These articles docu-
ment my main research achievements during the MSc programme. They are related to
the theme of this thesis and the specialisation project completed earlier during the Au-
tumn semester of 2015.

vii
List of Papers
Paper 1:
Reliable, Robust and Resilient Systems – Towards Development of a Predictive Maintenance
Concept within an Industry 4.0 Environment
Paper 2:
Condition Monitoring for Predictive Maintenance – Towards Systems Prognosis within the In-
dustrial Internet of Things
Contents
Preface . . . . . . . . . . . . . . . . . . . . . . . . . . . . . . . . . . . . . . . . . . . . . . . . i
Acknowledgements . . . . . . . . . . . . . . . . . . . . . . . . . . . . . . . . . . . . . . . . . ii
Summary . . . . . . . . . . . . . . . . . . . . . . . . . . . . . . . . . . . . . . . . . . . . . . . iii
Recommendations . . . . . . . . . . . . . . . . . . . . . . . . . . . . . . . . . . . . . . . . . v
Structure of the Report . . . . . . . . . . . . . . . . . . . . . . . . . . . . . . . . . . . . . . . vi
List of Papers . . . . . . . . . . . . . . . . . . . . . . . . . . . . . . . . . . . . . . . . . . . . vii
1 Introduction 1
1.1 Background . . . . . . . . . . . . . . . . . . . . . . . . . . . . . . . . . . . . . . . . . . 1
1.2 Objectives . . . . . . . . . . . . . . . . . . . . . . . . . . . . . . . . . . . . . . . . . . . 2
1.3 Limitations . . . . . . . . . . . . . . . . . . . . . . . . . . . . . . . . . . . . . . . . . . . 3
1.4 Approach . . . . . . . . . . . . . . . . . . . . . . . . . . . . . . . . . . . . . . . . . . . . 4
1.5 Structure of the Main Report . . . . . . . . . . . . . . . . . . . . . . . . . . . . . . . . 4
2 A Review of Maintenance Philosophies: Ancient and Modern 6
2.1 Corrective Maintenance . . . . . . . . . . . . . . . . . . . . . . . . . . . . . . . . . . . 7
2.2 Preventive Maintenance . . . . . . . . . . . . . . . . . . . . . . . . . . . . . . . . . . . 8
2.3 Predictive Maintenance . . . . . . . . . . . . . . . . . . . . . . . . . . . . . . . . . . . 9
2.4 Condition Based Maintenance (CBM) . . . . . . . . . . . . . . . . . . . . . . . . . . . 11
2.5 Reliability Centred Maintenance (RCM) . . . . . . . . . . . . . . . . . . . . . . . . . . 12
2.6 Failure Modes, Effects and Criticality Analysis (FMECA) . . . . . . . . . . . . . . . . 14
3 Fundamentals of Vibration Analysis and the Lifetime Models 16
3.1 Fundamentals of Vibration Analysis . . . . . . . . . . . . . . . . . . . . . . . . . . . . 16
viii
CONTENTS ix
3.1.1 The Root Mean Square (RMS) Value . . . . . . . . . . . . . . . . . . . . . . . . 18
3.1.2 The Fast Fourier Transform (FFT) . . . . . . . . . . . . . . . . . . . . . . . . . 20
3.2 Lifetime Models . . . . . . . . . . . . . . . . . . . . . . . . . . . . . . . . . . . . . . . . 21
3.2.1 Parametric Families of Lifetime Distribution . . . . . . . . . . . . . . . . . . . 22
3.2.2 Non-Parametric Families of Lifetime Distribution . . . . . . . . . . . . . . . . 24
3.2.3 Case Study: Analysing the Ball Bearings Failure Data . . . . . . . . . . . . . . 26
4 Rotating Machines Prognostics: The Science & Art of Vibration Technique 29
4.1 Mechanical Vibration and the ISO 10816 and ISO 7919 . . . . . . . . . . . . . . . . . 30
4.1.1 ISO 10816 (Parts 1 and 3) . . . . . . . . . . . . . . . . . . . . . . . . . . . . . . 30
4.1.2 ISO 7919 (Parts 1 to 5) . . . . . . . . . . . . . . . . . . . . . . . . . . . . . . . . 32
4.2 Frequency Peaks as Discrete Values . . . . . . . . . . . . . . . . . . . . . . . . . . . . 32
4.3 The Autoregressive Moving Average (ARMA) Models . . . . . . . . . . . . . . . . . . 36
4.4 Case Study: Implementing System Prognosis with the Thruster Gearbox Bearing
Spectra . . . . . . . . . . . . . . . . . . . . . . . . . . . . . . . . . . . . . . . . . . . . . 37
5 A Business Case Study for PdM: The Karsten Moholt Experience 42
6 Smart Maintenance: Interfacing Vibration Data with the IIoT 47
6.1 Computerised Maintenance Management System (CMMS) . . . . . . . . . . . . . . 48
6.2 Machine Learning and M2M Communication . . . . . . . . . . . . . . . . . . . . . . 50
6.3 The Industry 4.0 and its Key Enabling Technologies (KETs) . . . . . . . . . . . . . . 50
6.4 Smart Maintenance in the Context of Industry 4.0 . . . . . . . . . . . . . . . . . . . . 55
7 Discussion and Conclusion 58
7.1 Discussion . . . . . . . . . . . . . . . . . . . . . . . . . . . . . . . . . . . . . . . . . . . 58
7.2 Conclusions . . . . . . . . . . . . . . . . . . . . . . . . . . . . . . . . . . . . . . . . . . 60
A Acronyms 61
B Figures from the ISO 10816-1:1995(E) and Karsten Moholt 66
B.1 General form of vibration velocity acceptance criteria . . . . . . . . . . . . . . . . . 66

CONTENTS x
B.2 Comparison of vector change and change in magnitude for a discrete frequency
component . . . . . . . . . . . . . . . . . . . . . . . . . . . . . . . . . . . . . . . . . . . 66
B.3 Vibration analysis flow chart . . . . . . . . . . . . . . . . . . . . . . . . . . . . . . . . 66
Bibliography 70
Resume 75
List of Figures
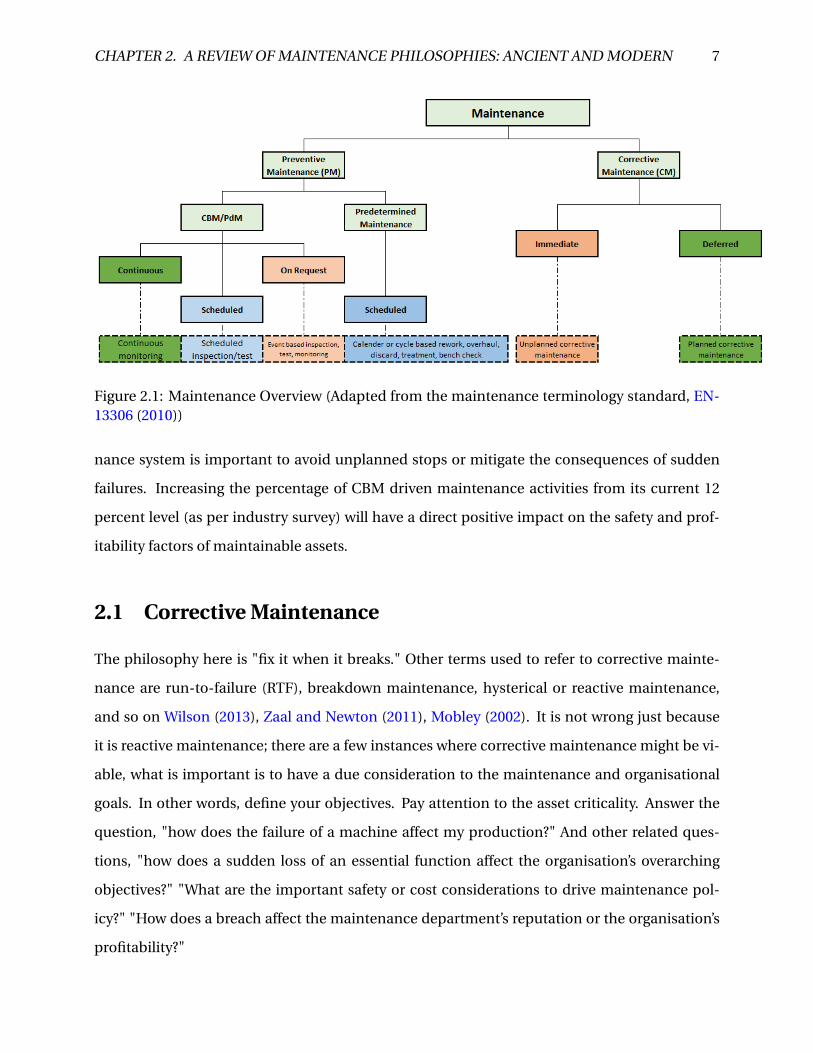
2.1 Maintenance Overview (Adapted from the maintenance terminology standard, EN-
13306 (2010)) . . . . . . . . . . . . . . . . . . . . . . . . . . . . . . . . . . . . . . . . . 7
2.2 The bath tub curve for machine wear (wear rate indicates failure rate) . . . . . . . . 9
2.3 The P-F Curve (The Figure depicts the three maintenance philosophies described
in the report. PM is a naive maintenance activity carried out at some conserva-
tive and arbitrary point "2" where the machine condition still has a high survival
probability. The PdM/CBM is implemented to prevent the machine from reaching
point "F" unexpectedly. After point "F," a functional failure has occurred and cor-
rective maintenance is initiated to restore the lost function. Note that point "1" is
not necessarily related to the age of the machine.) . . . . . . . . . . . . . . . . . . . . 10
2.4 Maintenance Task Assignment/Decision Logic Vatn (2007) . . . . . . . . . . . . . . 13
3.1 Time Waveforms, Frequency Spectrum and the Fast Fourier Transform . . . . . . . 19
3.2 Ball Bearings . . . . . . . . . . . . . . . . . . . . . . . . . . . . . . . . . . . . . . . . . . 25
3.3 Minitab Output for the Ball Bearings Failure Distribution ID Plot (The Figure shows
that the lifetime distribution model assumed for an analysis will influence the re-
sults. The MTTF estimates for example gave slightly different values across the
distribution models.) . . . . . . . . . . . . . . . . . . . . . . . . . . . . . . . . . . . . . 28
4.1 Points for Measuring Vibration . . . . . . . . . . . . . . . . . . . . . . . . . . . . . . . 31
4.2 Spectral Patterns for Parallel/Angular Misalignment of a Shaft Rotating at the Shaft
Rate Frequency "1X". . . . . . . . . . . . . . . . . . . . . . . . . . . . . . . . . . . . . . 33
xi
LIST OF FIGURES xii
4.3 Forcing Frequencies and Frequency Peaks in Spectrum (The Figure shows three
simple sinusoidal waveforms from the shaft, blades and coils combining into a
complex overall vibration signal. When the FFT is applied to the complex vibration
signal, the frequencies are separated into their respective peaks, note: 55 Hz for the
shaft (corresponding to "1X"), 220 Hz for the Coils (corresponding to "4X") and 385
Hz for the blades (corresponding to "7X.")) . . . . . . . . . . . . . . . . . . . . . . . . 35
4.4 Waterfall Plot of Spectra from Different Survey Periods (The Figure is a screen
shot from the Omnitrend software analytical tool used for this thesis courtesy of
Karsten Moholt AS. It shows the spectra from survey periods indicated by date. 5
peaks occurring between 250 Hz and 300 Hz were averaged to smoothen the data’s
variability) . . . . . . . . . . . . . . . . . . . . . . . . . . . . . . . . . . . . . . . . . . . 38
4.5 First Order Linear Regression of Vibration Severity/Peaks (The Figure shows an
insert of the final tables used to implement first order linear regression on the vi-
bration severity data. The model for predicting next period vibration severity is
derived and shown. The line fit plot gives an indication of how the predicted and
observed values match each other. The model is valid as the p-value is less than
0.05.) . . . . . . . . . . . . . . . . . . . . . . . . . . . . . . . . . . . . . . . . . . . . . . 40
5.1 A Thruster’s Pinion Bearing and Rollers show extensive damage: a confirmation of
an earlier vibration analysis carried out by Karsten Moholt predicting the damage 45
6.1 A Screen Shot of a CAMP System Input Window . . . . . . . . . . . . . . . . . . . . . 49
6.2 Collaborative Interactions within the Smart Factory (from Kagermann et al. (2013)) 51
6.3 The Smart Maintenance Concept . . . . . . . . . . . . . . . . . . . . . . . . . . . . . . 56
B.1 General form of vibration velocity acceptance criteria . . . . . . . . . . . . . . . . . 67
B.2 Comparison of vector change and change in magnitude for a discrete frequency
component . . . . . . . . . . . . . . . . . . . . . . . . . . . . . . . . . . . . . . . . . . . 68
B.3 Vibration analysis flow chart . . . . . . . . . . . . . . . . . . . . . . . . . . . . . . . . 69
List of Tables
3.1 Conversion Table for Harmonics Vibration . . . . . . . . . . . . . . . . . . . . . . . . 18
3.2 Millions of Revolution to Fatigue Failure for 23 Units of Ball Bearings . . . . . . . . 27
5.1 Machines and the Suitable CM Technologies for Defects Identification (adapted
from the Mobius Institutes’ Category I Vibration Training Course Book) . . . . . . . 43
xiii
Chapter 1
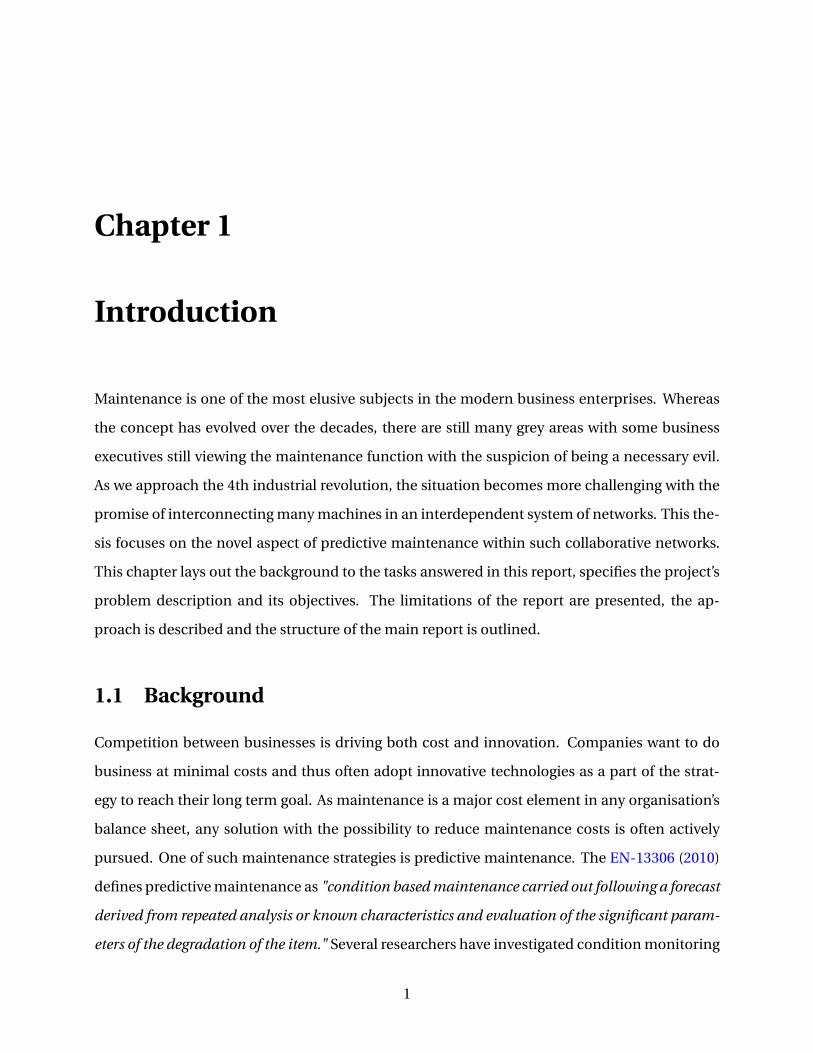
Introduction
Maintenance is one of the most elusive subjects in the modern business enterprises. Whereas
the concept has evolved over the decades, there are still many grey areas with some business
executives still viewing the maintenance function with the suspicion of being a necessary evil.
As we approach the 4th industrial revolution, the situation becomes more challenging with the
promise of interconnecting many machines in an interdependent system of networks. This the-
sis focuses on the novel aspect of predictive maintenance within such collaborative networks.
This chapter lays out the background to the tasks answered in this report, specifies the project’s
problem description and its objectives. The limitations of the report are presented, the ap-
proach is described and the structure of the main report is outlined.
1.1 Background
Competition between businesses is driving both cost and innovation. Companies want to do
business at minimal costs and thus often adopt innovative technologies as a part of the strat-
egy to reach their long term goal. As maintenance is a major cost element in any organisation’s
balance sheet, any solution with the possibility to reduce maintenance costs is often actively
pursued. One of such maintenance strategies is predictive maintenance. The EN-13306 (2010)
defines predictive maintenance as "condition based maintenance carried out following a forecast
derived from repeated analysis or known characteristics and evaluation of the significant param-
eters of the degradation of the item." Several researchers have investigated condition monitoring
1
CHAPTER 1. INTRODUCTION 2
as a key maintenance activity necessary for the implementation of predictive maintenance on
production assets. What is common between these researchers is their utilisation of the optimi-
sation model to achieve their objective functions, Rausand and Vatn (2008), Wang (2008), Schef-
fer and Girdhar (2004). The gap between existing optimisation models’ theories and practice will
increase as systems become more complex within the Industrial Internet of Things (IIoT). So far,
there is no proven technique to bridge this gap.
This thesis uses condition monitoring of rotating machinery (by means of the vibration tech-
nique) as a case study. As discussed in Lu et al. (2009) and Márquez et al. (2012), the vibration
based condition monitoring has a proven track record in wind turbines as well as other rotating
equipment applications. However, at the dawn of Industry 4.0 Kagermann et al. (2013), Evans
and Annunziata (2012), a major concern expressed by my industry partner in this thesis is that
there is a high chance of loss of fidelity in the representation of vibration data. The reason is that
under current Industry 4.0 propositions, focus is on monitoring low level data such as tempera-
ture, pressure, flow rate, vibration root mean square (RMS) values, and so on. On the contrary,
the success of the vibration based condition monitoring is derived from its capability to handle
a multiple dimension of data from time waveforms, frequency spectra and phasors. The vibra-
tion signature is analysed not just as a science but also as an art and the outcome is used for
maintenance decision support. With an improved data representation technique and the appli-
cation of smart machine learning algorithms within the sphere of the IIoT, the science aspect of
the data analysis can be overcome but the art part is intractable because it is based on human
experience, intuition and subjective reasoning. Rotating machine prognostics is discussed in a
greater detail in chapter 4 and in chapter 6 it was argued that an efficient integration of vibra-
tion data with the IIoT is an irreducible minimum for smart maintenance, chapter 5 provides
the cost benefits for implementing predictive maintenance.
1.2 Objectives
The main objective of this master thesis is to present how predictive maintenance can be used
for prognosis by relying on the vibration based condition monitoring of rotating machinery
while recording data in an Industry 4.0 compliant manner. The peer-reviewed conference pa-
CHAPTER 1. INTRODUCTION 3
pers presented in the course of this thesis and master programme are integrated into the objec-
tive of the study. The main objective is achieved by performing the following tasks which form
part of the thesis sub-objectives:
1. Identify and clarify the main maintenance philosophies applied to production assets, state
the key underlying assumptions and the pros and cons associated with each.
2. Discuss the fundamental basis of the science for vibration analysis and present some gen-
eral lifetime models.
3. Study how the vibration technique is used for rotating machinery condition monitoring
and present how this can be used for diagnosis and prognosis – causes of failure and re-
maining useful life (RUL) prediction.
4. Provide a case study to justify the utilisation of condition monitoring on critical assets as
a means to reduce costs safely.
5. Identify and present possible approaches and the benefits of integrating vibration data
with the IIoT to achieve smart maintenance.
1.3 Limitations
This master thesis is time limited to twenty weeks based on the applicable rules at the university.
The main audiences are college students, professors and members of the industry with some
backgrounds in maintenance engineering theories and practice, rotating machinery, vibration
analysis, data sciences and stochastic processes.
The IIoT is a new and evolving paradigm, literature in the area was scarce and hard to find.
Only a limited amount of vibration data was available as a conscious effort was made to use
actual measurements from real assets. Where the amount of available information was deemed
insufficient or out of step with the desired format, certain assumptions and honest estimates
were made and documented. Signal processing, programming and advanced instrumenta-
tion/automation techniques are beyond the scope of this report.
CHAPTER 1. INTRODUCTION 4
1.4 Approach
A review of relevant literature was carried out in order to reach the thesis sub-objectives. This
approach was combined with theoretical research and case study to achieve the main objec-
tive. I worked with an industry partner, Karsten Moholt AS, to collect and analyse real vibra-
tion data and ran simulations using the Omnitrend software licenced to the company as well
as the Minitab package licenced to the NTNU. Simulation results illustrated the validity of my
argument and are expected to enhance readers’ understanding. I visited the partner company
to make personal observations and to interview experts. I followed the insights and informed
recommendations made by my supervisor and co-supervisor while carrying out those tasks ini-
tially thought to be beyond my competence and availed myself of every learning opportunity
provided throughout the process of completing this thesis.
1.5 Structure of the Main Report
The rest of the main report is organised as follows:
• Chapter 2 provides an overview of maintenance philosophies and clarifies related termi-
nologies;
• chapter 3 covers the fundamentals of vibration analysis and introduces some illustrative
lifetime models;
• in chapter 4, the vibration based condition monitoring methodology is described in de-
tail and the autoregressive moving average (ARMA) technique is used to support machine
learning capability for a rotating equipment prognosis;
• chapter 5 presents a case study using real data to highlight the importance of predictive
maintenance as a safe cost cutting mechanism;
• chapter 6 discusses the necessary approaches and the requirements to interface vibration
data and the IIoT, that is to provide the basis for smart maintenance application within
Industry 4.0;

CHAPTER 1. INTRODUCTION 5
• and chapter 7 presents a discussion of the main results and concludes the report with
some insights.

Chapter 2
A Review of Maintenance Philosophies:
Ancient and Modern
The maintenance terminology standards (EN-13306 (2010)) defines maintenance as “the com-
bination of all technical, administrative and managerial actions during the life cycle of an item
intended to retain it in, or restore it to, a state in which it can perform the required function”.
Maintenance management on the other hand determines the maintenance objectives, strate-
gies and responsibilities, execution of consciously selected action plans to meet the overall or-
ganisational and maintenance objectives. It was equally shown in Wilson (2002) that effective
maintenance means carrying out tasks at the right time with both speed and skill. When dis-
cussing maintenance theory it is necessary to clarify the terminology, structure and objectives
of different maintenance philosophies. In a broad sense, three maintenance practises, namely
corrective maintenance, preventive maintenance, and predictive maintenance are discussed in
this chapter. The three broad categories of maintenance philosophises presented were further
linked with other maintenance concepts such as condition based maintenance (CBM), reliabil-
ity centred maintenance (RCM), reactive, proactive and precision maintenance. Figure 2.1 pro-
vides an overview. The average percentages of the different maintenance types shown, based
on data available from industry, indicates that more than 55 percent of all maintenance related
activities fall within corrective maintenance and that means that more than half of the times,
maintenance activities happen as a surprise to maintenance managers with its natural conse-
quence of suboptimal value realisation on physical assets. A well structured predictive mainte-
6
CHAPTER 2. A REVIEW OF MAINTENANCE PHILOSOPHIES: ANCIENT AND MODERN 7
Figure 2.1: Maintenance Overview (Adapted from the maintenance terminology standard, EN-13306 (2010))
nance system is important to avoid unplanned stops or mitigate the consequences of sudden
failures. Increasing the percentage of CBM driven maintenance activities from its current 12
percent level (as per industry survey) will have a direct positive impact on the safety and prof-
itability factors of maintainable assets.
2.1 Corrective Maintenance
The philosophy here is "fix it when it breaks." Other terms used to refer to corrective mainte-
nance are run-to-failure (RTF), breakdown maintenance, hysterical or reactive maintenance,
and so on Wilson (2013), Zaal and Newton (2011), Mobley (2002). It is not wrong just because
it is reactive maintenance; there are a few instances where corrective maintenance might be vi-
able, what is important is to have a due consideration to the maintenance and organisational
goals. In other words, define your objectives. Pay attention to the asset criticality. Answer the
question, "how does the failure of a machine affect my production?" And other related ques-
tions, "how does a sudden loss of an essential function affect the organisation’s overarching
objectives?" "What are the important safety or cost considerations to drive maintenance pol-
icy?" "How does a breach affect the maintenance department’s reputation or the organisation’s
profitability?"

CHAPTER 2. A REVIEW OF MAINTENANCE PHILOSOPHIES: ANCIENT AND MODERN 8
Rather than carefully anticipating and planning in advance for events, reactive maintenance
is a fire brigade approach. Generally speaking, running a production asset primarily based on
reactive or corrective maintenance mode is not the right way to do business today. This is be-
cause a production facility run in this way always finds itself merely reacting to situations and
trying to catch up with stakeholders’ expectations. It is important to take advantage of technol-
ogy and more sophisticated maintenance processes to achieve better results.
2.2 Preventive Maintenance
In order to prevent a maintainable asset from failing, reduce the probability of loss of function
or attain a reasonable level of dependability it requires the performance of certain maintenance
tasks, given that the item is used within its intended design. Other terms commonly used to refer
to preventive maintenance (PM) includes scheduled or predetermined maintenance, historical,
calender or cycle based maintenance, inter alia. The maintenance tasks performed before an
asset enters a failed state is referred to as preventive maintenance Rausand and Høyland (2004),
Scheffer and Girdhar (2004). The guiding theory of the PM philosophy is to "fix it before it fails."
The underlying assumption thus is that every machine will suffer certain amounts of degrada-
tion as it ages in operation and will eventually fail with time and/or use.
Predetermined maintenance is a preventive maintenance activity carried out on hard time
basis by assigning lifetime distributions to components based on assumptions or experiments.
Typically, the facts of these assumptions are observations carried out on another related com-
ponent. The current maintenance activity is "called out" based on that historically documented
information but without any recourse to the actual performance of the item, it does not mat-
ter whether the item is presently functioning or is in a failed state, it has to be discarded, ser-
viced or overhauled so long as the predetermined interval has been attained. Predetermined
maintenance is not proven to be founded on sophisticated technology or procedure. It is of-
ten criticised for being a wasteful maintenance philosophy. It has become less popular over the
last decades. The rising popularity of smart sensors and advanced instrumentation techniques
mean that the advantages of condition based maintenance have become more obvious. An-
other disadvantage of PM as proven by Okoh and Haugen (2013) is that maintenance activities
CHAPTER 2. A REVIEW OF MAINTENANCE PHILOSOPHIES: ANCIENT AND MODERN 9
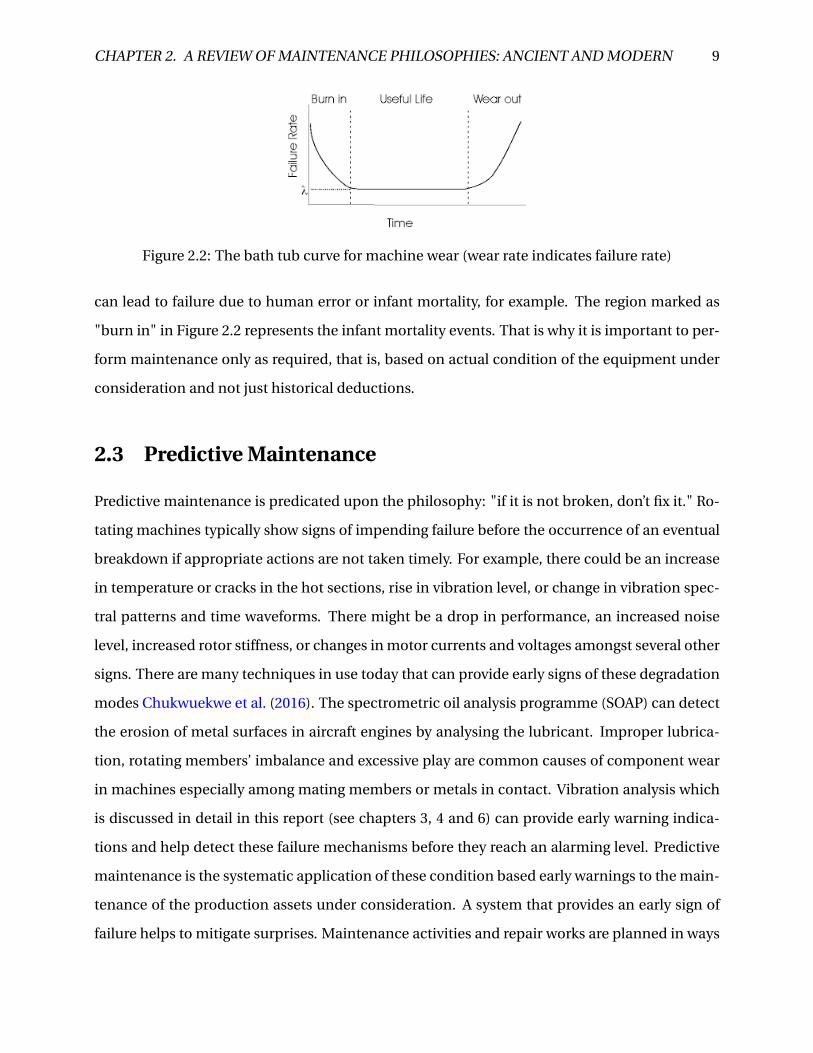
Figure 2.2: The bath tub curve for machine wear (wear rate indicates failure rate)
can lead to failure due to human error or infant mortality, for example. The region marked as
"burn in" in Figure 2.2 represents the infant mortality events. That is why it is important to per-
form maintenance only as required, that is, based on actual condition of the equipment under
consideration and not just historical deductions.
2.3 Predictive Maintenance
Predictive maintenance is predicated upon the philosophy: "if it is not broken, don’t fix it." Ro-
tating machines typically show signs of impending failure before the occurrence of an eventual
breakdown if appropriate actions are not taken timely. For example, there could be an increase
in temperature or cracks in the hot sections, rise in vibration level, or change in vibration spec-
tral patterns and time waveforms. There might be a drop in performance, an increased noise
level, increased rotor stiffness, or changes in motor currents and voltages amongst several other
signs. There are many techniques in use today that can provide early signs of these degradation
modes Chukwuekwe et al. (2016). The spectrometric oil analysis programme (SOAP) can detect
the erosion of metal surfaces in aircraft engines by analysing the lubricant. Improper lubrica-
tion, rotating members’ imbalance and excessive play are common causes of component wear
in machines especially among mating members or metals in contact. Vibration analysis which
is discussed in detail in this report (see chapters 3, 4 and 6) can provide early warning indica-
tions and help detect these failure mechanisms before they reach an alarming level. Predictive
maintenance is the systematic application of these condition based early warnings to the main-
tenance of the production assets under consideration. A system that provides an early sign of
failure helps to mitigate surprises. Maintenance activities and repair works are planned in ways
CHAPTER 2. A REVIEW OF MAINTENANCE PHILOSOPHIES: ANCIENT AND MODERN 10
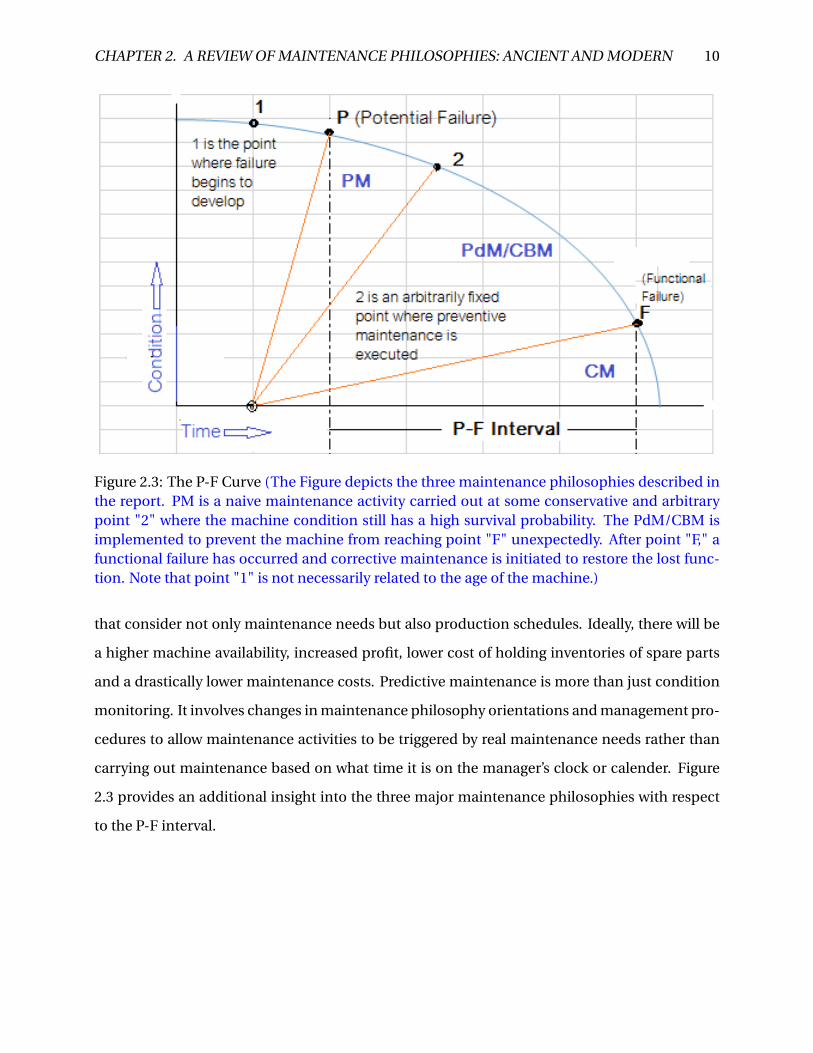
Figure 2.3: The P-F Curve (The Figure depicts the three maintenance philosophies described inthe report. PM is a naive maintenance activity carried out at some conservative and arbitrarypoint "2" where the machine condition still has a high survival probability. The PdM/CBM isimplemented to prevent the machine from reaching point "F" unexpectedly. After point "F," afunctional failure has occurred and corrective maintenance is initiated to restore the lost func-tion. Note that point "1" is not necessarily related to the age of the machine.)
that consider not only maintenance needs but also production schedules. Ideally, there will be
a higher machine availability, increased profit, lower cost of holding inventories of spare parts
and a drastically lower maintenance costs. Predictive maintenance is more than just condition
monitoring. It involves changes in maintenance philosophy orientations and management pro-
cedures to allow maintenance activities to be triggered by real maintenance needs rather than
carrying out maintenance based on what time it is on the manager’s clock or calender. Figure
2.3 provides an additional insight into the three major maintenance philosophies with respect
to the P-F interval.
CHAPTER 2. A REVIEW OF MAINTENANCE PHILOSOPHIES: ANCIENT AND MODERN 11
2.4 Condition Based Maintenance (CBM)
The EN-13306 (2010) defines condition monitoring as any activity or set of activities, performed
either manually or automatically, intended to measure at predetermined intervals the character-
istics and parameters of the actual state of an item. One of the main application areas of the CM
technique is in condition based maintenance (CBM). CBM is a preventive maintenance which
includes a combination of condition monitoring and/or inspection and/or testing, analysis and
the required maintenance actions. These activities maybe scheduled, on request or on a contin-
uous basis. The principal objective of the CBM technique is that the condition of the asset is the
driver for its maintenance Zaal and Newton (2011). In order for condition monitoring and by
extension condition based maintenance to be implementable, the following are necessary and
sufficient preconditions to be met:
1. There must be a possibility to detect reduced failure resistance related to any identified
failure mode
2. There must be a possibility to unambiguously define potential failure conditions that are
detectable by systematic and explicit task(s)
3. The system is not prone to shock failures instead there is a reasonably consistent age in-
terval or lapse of time between the potential failure and actual or functional failure. This
is related to the concept of fault latency Simeu-Abazi and Bouredji (2006).
Rausand and Vatn (2008), Vatn (2007) and Mobley (2002) present a more detailed discussion on
the concept of CBM.
It is necessary to highlight that condition monitoring only tells us the functional status of the
machine and helps us to be able to plan in advance to respond to any maintenance demands, it
does not help in any way to enhance the reliability of the machine or delay its failure (except if
additional measures were taken). In other words, it helps to anticipate and meet maintenance
needs before equipment breakdown. This is proactive maintenance, a term which also defines
other strategies such as precision maintenance, root cause failure analysis and reliability cen-
tred maintenance. The term "proactive" is instructive because in that sphere, rather than just
reacting to the impulse of a sudden failure, a conscious effort is made not only to predict and re-
CHAPTER 2. A REVIEW OF MAINTENANCE PHILOSOPHIES: ANCIENT AND MODERN 12
spond to the possibility of a failure but also to address its root cause for the purpose of learning
and to forestall future events. It is great to be able to use the CBM to identify failures before they
occur but it is even more beneficial to dig into the roots of the failure causes and use that knowl-
edge to improve the reliability of the machine. That leads to a new paragraph and a discussion
on reliability centred maintenance.
2.5 Reliability Centred Maintenance (RCM)
Reliability Centred Maintenance (RCM) is a method for maintenance planning developed in the
sixties within the aviation industry and later adapted to other industries and military depart-
ments Rausand and Vatn (2008). The logic of an RCM analysis as a maintenance management
method is to use the failure mode/failure cause in the Failure Modes, Effects and Criticality Anal-
ysis (FMECA) to establish ways by which the appropriate maintenance actions can be used to
overcome failures or degradation tendencies in an asset.
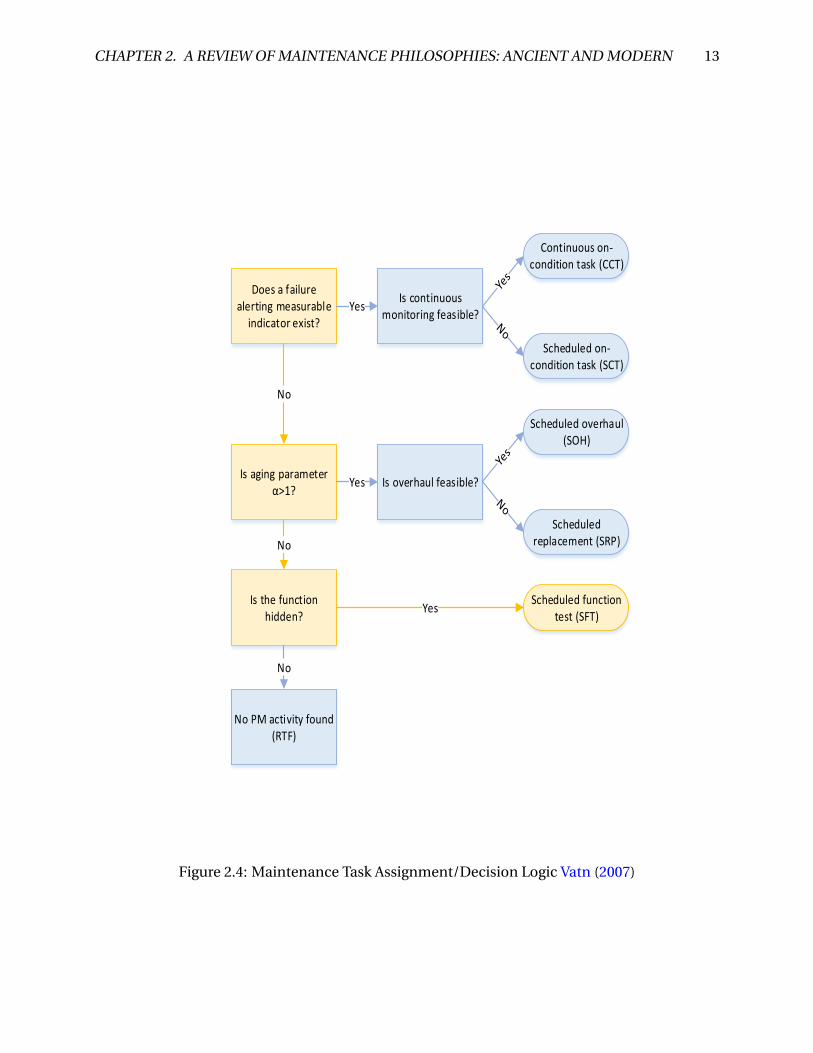
As pinpointed by Vatn (2007), the main objectives of RCM analysis are:
• Identification of effective maintenance tasks;
• Evaluation of the identified tasks by performing some cost–benefit analysis, and
• Preparation of a plan for carrying out the identified maintenance tasks at optimal inter-
vals.
Figure 2.4 shows a typical application of RCM analysis in maintenance task assignment leading
to a scheduled function test (SFT) Vatn (2007).
The basic assumption of the RCM analysis is that every machine has a limited useful life
and will eventually degrade to a failed state (P-F curve, ref. Figure 2.3). The absolute validity
of these assumptions has been challenged by Mobley (2002) who argues that if a physical asset
was properly designed; installed, operated and maintained the right way, that asset can have
a perpetual availability and an endless life except for a few random failures or external factors
such as an operator error.
The RCM analysis is not a quantitative method Vatn (2007) and thus cannot be used to de-
termine an optimum maintenance interval. Professors Rausand and Vatn identified 12 steps
CHAPTER 2. A REVIEW OF MAINTENANCE PHILOSOPHIES: ANCIENT AND MODERN 13
Does a failure alerting measurable
indicator exist?
Is aging parameter α>1?
No
Is continuous monitoring feasible?
Yes
Is the function hidden?
No PM activity found (RTF)
No
No
Is overhaul feasible?Yes
Continuous on-condition task (CCT)
Scheduled on-condition task (SCT)
Scheduled replacement (SRP)
Scheduled overhaul (SOH)
Scheduled function test (SFT)
Yes
Figure 2.4: Maintenance Task Assignment/Decision Logic Vatn (2007)
CHAPTER 2. A REVIEW OF MAINTENANCE PHILOSOPHIES: ANCIENT AND MODERN 14
for carrying out the RCM analysis some of which are: identification and selection of systems,
Functional Failure Analysis (FFA), selection of critical item(s) or maintenance significant items
(MSI), collection and analysis of data, FMECA, selection of maintenance actions, maintenance
interval determination, and in-service data collection and updating Rausand and Vatn (2008).
The reliability centred maintenance is in many respects a classical example of proactive mainte-
nance tool. It incorporates, at some stages, certain aspects of root cause analysis and the failure
modes and effects analysis, for example.
2.6 Failure Modes, Effects and Criticality Analysis (FMECA)
Predictive maintenance requires condition monitoring on the components and systems that
make up a production plant. It is however both costly and unrealistic to monitor every sin-
gle piece of item in complex production plants. The FMECA provides a technique to select the
components or systems with the highest importance while prioritising for the predictive main-
tenance applications. FMECA is a semi quantitative (often, bottom-up) analysis used to assess
what effects the failure of particular components will have on the functioning of the whole sys-
tem as designed Rausand (2014), Rausand and Vatn (2008). The FMECA is often adapted as a
part of RCM activities and has proven use in functional failure identification and maintenance
significant item (MSI) categorisation. The FMECA is a good first step for reliability engineers
to estimate system structures and parameters such as mean time to repair (MTTR), mean time
to failure (MTTF), mean time between repair (MTBR), failure rate or force of mortality (FOM),
among others. It is used to identify components or systems with significant importance to be
placed under condition monitoring or to draw up preventive maintenance strategy.
Experience with the application and use of the FMECA technique has proven that the use
of the so-called TOP event (a term associated with fault tree analysis (FTA) as a basis for the
analysis can significantly simplify the analysis and make the workload less cumbersome. The
TOP event may be defined, for example, as safety, system availability, environmental hazard,
punctuality, production loss or an accident. By considering an applicable TOP event in a conse-
quence analysis, the FMECA finds useful application in the barrier model for safety as shown in
the Swiss cheese model by Reason and Reason (1997) to balance production and protection.
CHAPTER 2. A REVIEW OF MAINTENANCE PHILOSOPHIES: ANCIENT AND MODERN 15
Several published standards and procedures provide useful guidance and a more detailed in-
formation on how to conduct the FMEA/FMECA MIL-STD-1629A (1980), MIL-STD-2155 (1985),
IEC-60812 (1985), BS-5760-5 (1996), and SAE-ARP-5580 (2001).
The current chapter provides a review of some relevant maintenance concepts and philoso-
phies. The discussion is by no means exhaustive but a motivation was provided as a basis for
understanding the applications presented in later chapters. It is also intended in parts to an-
swer the question, "why is maintenance important?" and "why is it necessary to consider pro-
duction concerns while scheduling maintenance?" The latter question form part of the issues
addressed with predictive maintenance. Other challenges that could be overcome by following
effective maintenance philosophies were also highlighted. The key objectives include reliability
growth and improvement, energy and resource efficiency, maintenance costs reduction, im-
proved product quality, optimised asset value and increased profitability.
Chapter 3
Fundamentals of Vibration Analysis and the
Lifetime Models
Whilst there is an increased focus on big data, it has been noted that most organisations do
not have a proven system for running data analytics and getting the best out of the prevalent big
data. The reason is often that the industry has not done enough to integrate stochastic processes
into their maintenance decision models. This chapter introduces the fundamentals of vibration
analysis and proposes how the data generated can be treated with existing statistical methods.
A few practical interpretations are provided to illustrate the discussion.
3.1 Fundamentals of Vibration Analysis
Production facilities are replete with rotating and reciprocating machines. For that reason, vi-
bration based condition monitoring is arguably the most popular technique in the industry to-
day. It is used to give an indication of system malfunction by measuring vibration signals Wang
(2008). The two important quantities often measured are frequency and magnitude of vibration.
The displacement, velocity (often the preferred choice) and acceleration parameters are related
to one another and are representations of magnitude Mobley (2002). Vibrations are measured
in time domain and then converted to the frequency domain by means of frequency analysers
for example the mathematical algorithm known as Fast Fourier Transform (FFT) analysers.
If we consider vibration as our monitored quantity to be periodic and about an equilibrium
16

CHAPTER 3. FUNDAMENTALS OF VIBRATION ANALYSIS AND THE LIFETIME MODELS 17
position then we can make a prediction based on the laws of physics. If T is the period of vibra-
tion, V(t) its velocity measured at time, t then the root mean square (RMS) value of this velocity
is proportional to the vibration energy given as:
Vrms =√
1
T
∫ T
0V (t )2 d t (3.1)
it follows that the average value is given as:
Vavg = 1
T
∫ T
0V (t )d t (3.2)
and the fundamental frequency,
f = 1
T
By following the Laws of Physics, we define the crest factor as
Fc =Vpeak
Vrms
and the form factor as
Ft = Vrms
Vavg
If we assume that the vibration function V(t) under investigation is sinusoidal, then
V(t) = V · sin(wt) (3.3)
which returns the following values:
Vpeak = V
Vavg = 2V
π= 0.636V
Vrms = Vp2= 0.707V
Fc =p
2 = 1.414
Ft = 1.11
CHAPTER 3. FUNDAMENTALS OF VIBRATION ANALYSIS AND THE LIFETIME MODELS 18
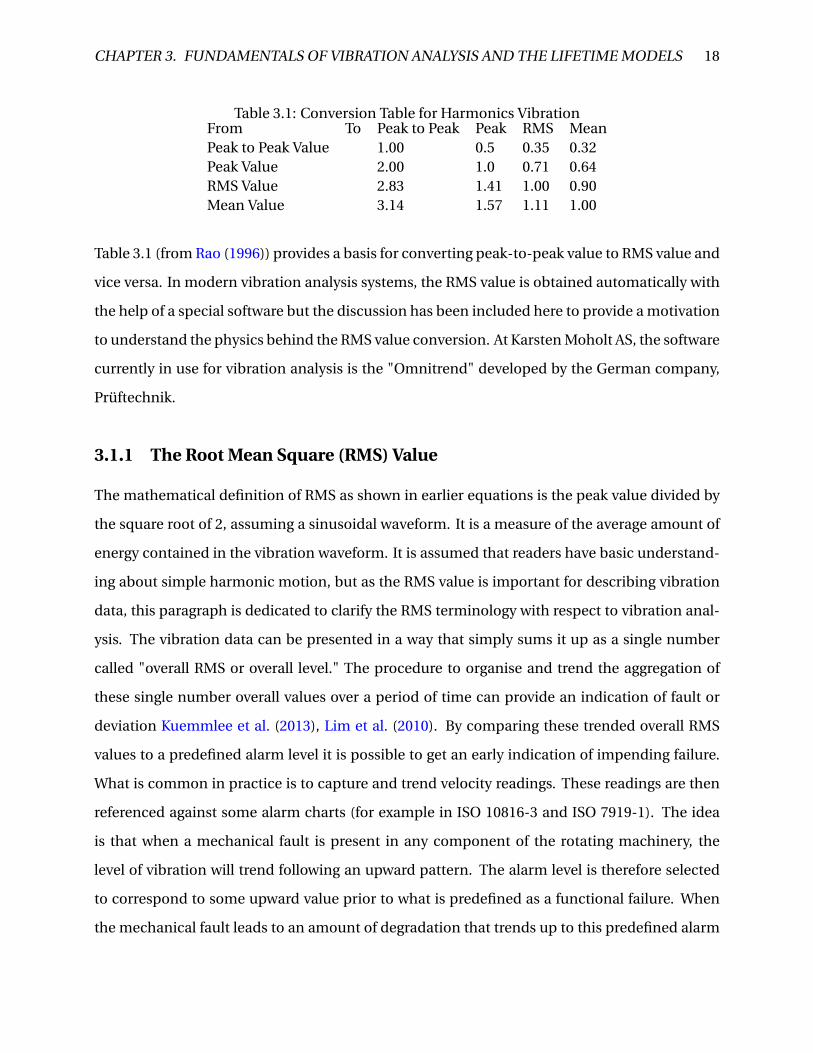
Table 3.1: Conversion Table for Harmonics VibrationFrom To Peak to Peak Peak RMS MeanPeak to Peak Value 1.00 0.5 0.35 0.32Peak Value 2.00 1.0 0.71 0.64RMS Value 2.83 1.41 1.00 0.90Mean Value 3.14 1.57 1.11 1.00
Table 3.1 (from Rao (1996)) provides a basis for converting peak-to-peak value to RMS value and
vice versa. In modern vibration analysis systems, the RMS value is obtained automatically with
the help of a special software but the discussion has been included here to provide a motivation
to understand the physics behind the RMS value conversion. At Karsten Moholt AS, the software
currently in use for vibration analysis is the "Omnitrend" developed by the German company,
Prüftechnik.
3.1.1 The Root Mean Square (RMS) Value
The mathematical definition of RMS as shown in earlier equations is the peak value divided by
the square root of 2, assuming a sinusoidal waveform. It is a measure of the average amount of
energy contained in the vibration waveform. It is assumed that readers have basic understand-
ing about simple harmonic motion, but as the RMS value is important for describing vibration
data, this paragraph is dedicated to clarify the RMS terminology with respect to vibration anal-
ysis. The vibration data can be presented in a way that simply sums it up as a single number
called "overall RMS or overall level." The procedure to organise and trend the aggregation of
these single number overall values over a period of time can provide an indication of fault or
deviation Kuemmlee et al. (2013), Lim et al. (2010). By comparing these trended overall RMS
values to a predefined alarm level it is possible to get an early indication of impending failure.
What is common in practice is to capture and trend velocity readings. These readings are then
referenced against some alarm charts (for example in ISO 10816-3 and ISO 7919-1). The idea
is that when a mechanical fault is present in any component of the rotating machinery, the
level of vibration will trend following an upward pattern. The alarm level is therefore selected
to correspond to some upward value prior to what is predefined as a functional failure. When
the mechanical fault leads to an amount of degradation that trends up to this predefined alarm
CHAPTER 3. FUNDAMENTALS OF VIBRATION ANALYSIS AND THE LIFETIME MODELS 19
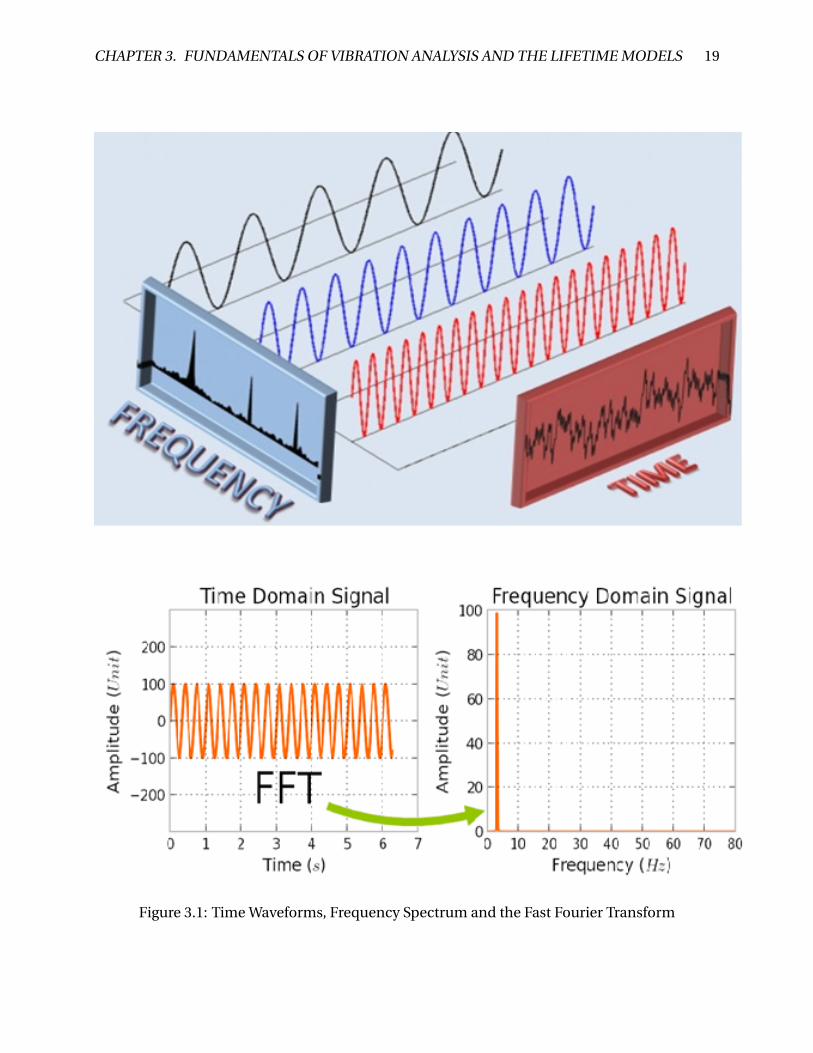
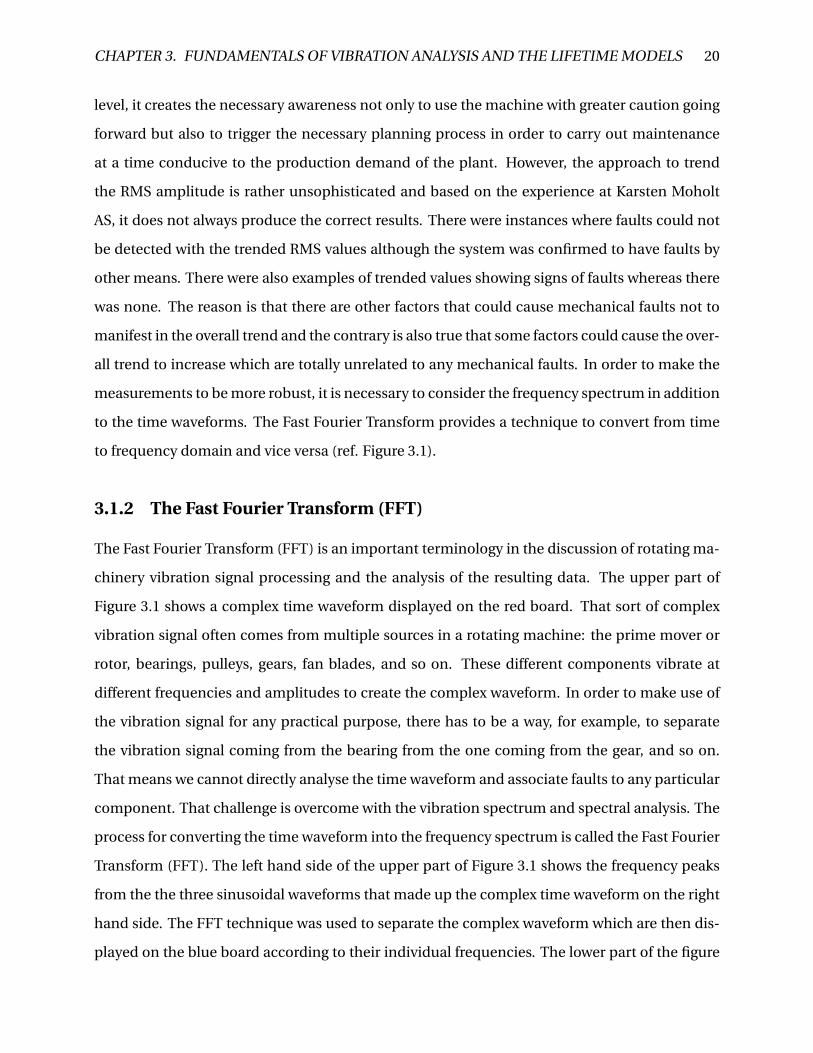
Figure 3.1: Time Waveforms, Frequency Spectrum and the Fast Fourier Transform
CHAPTER 3. FUNDAMENTALS OF VIBRATION ANALYSIS AND THE LIFETIME MODELS 20
level, it creates the necessary awareness not only to use the machine with greater caution going
forward but also to trigger the necessary planning process in order to carry out maintenance
at a time conducive to the production demand of the plant. However, the approach to trend
the RMS amplitude is rather unsophisticated and based on the experience at Karsten Moholt
AS, it does not always produce the correct results. There were instances where faults could not
be detected with the trended RMS values although the system was confirmed to have faults by
other means. There were also examples of trended values showing signs of faults whereas there
was none. The reason is that there are other factors that could cause mechanical faults not to
manifest in the overall trend and the contrary is also true that some factors could cause the over-
all trend to increase which are totally unrelated to any mechanical faults. In order to make the
measurements to be more robust, it is necessary to consider the frequency spectrum in addition
to the time waveforms. The Fast Fourier Transform provides a technique to convert from time
to frequency domain and vice versa (ref. Figure 3.1).
3.1.2 The Fast Fourier Transform (FFT)
The Fast Fourier Transform (FFT) is an important terminology in the discussion of rotating ma-
chinery vibration signal processing and the analysis of the resulting data. The upper part of
Figure 3.1 shows a complex time waveform displayed on the red board. That sort of complex
vibration signal often comes from multiple sources in a rotating machine: the prime mover or
rotor, bearings, pulleys, gears, fan blades, and so on. These different components vibrate at
different frequencies and amplitudes to create the complex waveform. In order to make use of
the vibration signal for any practical purpose, there has to be a way, for example, to separate
the vibration signal coming from the bearing from the one coming from the gear, and so on.
That means we cannot directly analyse the time waveform and associate faults to any particular
component. That challenge is overcome with the vibration spectrum and spectral analysis. The
process for converting the time waveform into the frequency spectrum is called the Fast Fourier
Transform (FFT). The left hand side of the upper part of Figure 3.1 shows the frequency peaks
from the the three sinusoidal waveforms that made up the complex time waveform on the right
hand side. The FFT technique was used to separate the complex waveform which are then dis-
played on the blue board according to their individual frequencies. The lower part of the figure
CHAPTER 3. FUNDAMENTALS OF VIBRATION ANALYSIS AND THE LIFETIME MODELS 21
shows a transformation from time domain (time versus amplitude) to the frequency domain
(frequency versus amplitude) using the FFT. McInerny and Dai (2003), Fessler and Sutton (2003)
are among a rich encyclopedia of materials written on signal processing and the role of the FFT
in signal analysis.
In the context of Industry 4.0, what has been proposed in this report (see chapters 4 and 6) is
to use the frequency peaks from the FFT spectral analysis as a basis for determining the extent
of tolerable degradations and the setting of the alarm limits. Because these are single values,
they are automatically compatible with the current proposals within Industry 4.0 for the use of
single, discrete numbers. The sidebands and harmonics from the spectral analysis will also be
modelled as single values and the data can be organised and treated together in a structured
way using already well studied lifetime models and stochastic processes.
3.2 Lifetime Models
This section highlights the importance of data in machine health monitoring including activi-
ties related to prognosis or predictive maintenance Lindqvist (2006). The purpose is not to write
an in-dept report on stochastic processes (such topics have been rigorously treated in the math-
ematical/statistical body of knowledge), instead a motivation is provided for understanding the
basis for the lifetime distributions of maintainable assets. The concept of lifetime modelling is
used to study how machine failures and the representative data are distributed over a time pe-
riod. This essentially entails that data is first of all collected and further that a statistical model
is fitted on the data or estimated for it. The emphasis is on the failure and maintenance data for
repairable components such as ball bearings or systems such as rotating machinery. Depend-
ing on one of two approaches, we have either the parametric or the non-parametric families of
lifetime distributions. Both are covered in many standard statistics textbooks. At the end of the
chapter, the Minitab statistical software is used to test a standard data set from ball bearings. By
observing and plotting the ball bearings failure data, four different lifetime distribution models
were separately assumed. The results were compared with each other to help identify which
models fit the data best. It was easy to see by inspection that the data set is best described by
the lognormal distribution but in more complex cases a test is required. The Anderson-Darling’s
CHAPTER 3. FUNDAMENTALS OF VIBRATION ANALYSIS AND THE LIFETIME MODELS 22
goodness-of-fit is included in Minitab but can also be computed manually and may satisfy the
requirement for such a test. The lower the Anderson-Darling goodness-of-fit value the better
the assumed model fit the analysed data. The general focus is on the analysis of machine data
for maintenance decision purposes not the statistical inferences. Equations and relationships
between functions are stated in this report without any further proof.
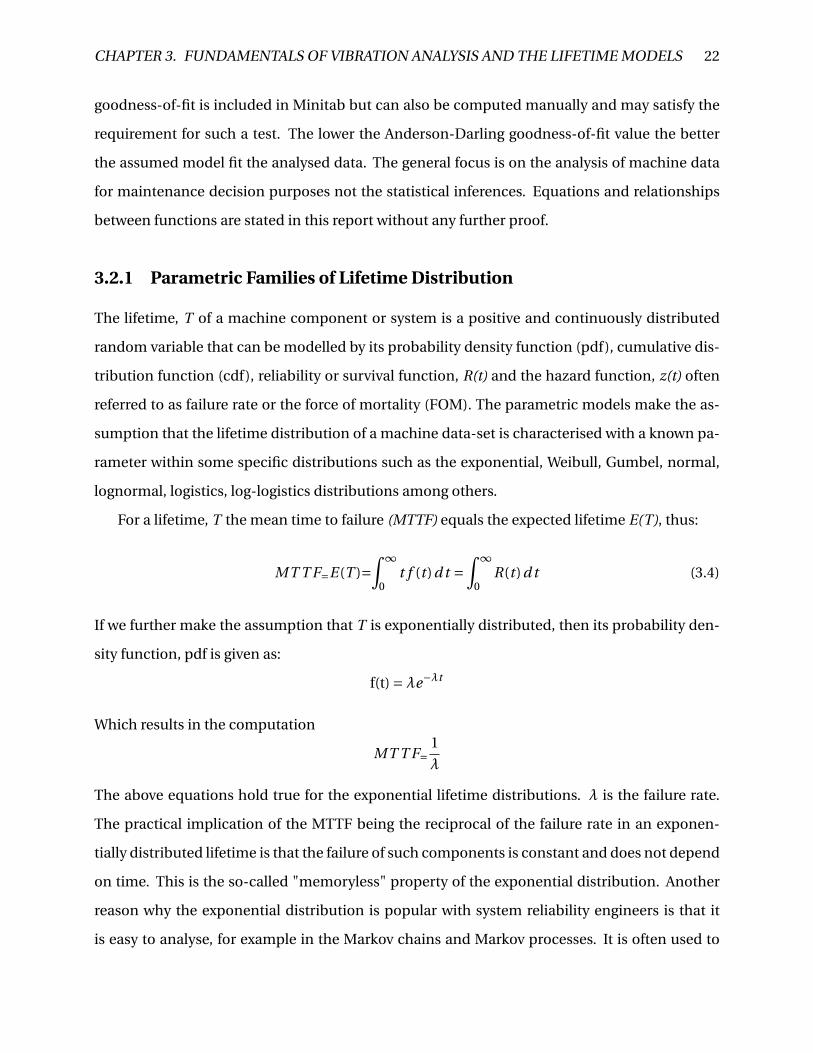
3.2.1 Parametric Families of Lifetime Distribution
The lifetime, T of a machine component or system is a positive and continuously distributed
random variable that can be modelled by its probability density function (pdf), cumulative dis-
tribution function (cdf), reliability or survival function, R(t) and the hazard function, z(t) often
referred to as failure rate or the force of mortality (FOM). The parametric models make the as-
sumption that the lifetime distribution of a machine data-set is characterised with a known pa-
rameter within some specific distributions such as the exponential, Weibull, Gumbel, normal,
lognormal, logistics, log-logistics distributions among others.
For a lifetime, T the mean time to failure (MTTF) equals the expected lifetime E(T), thus:
MT T F=E(T )=∫ ∞
0t f (t )d t =
∫ ∞
0R(t )d t (3.4)
If we further make the assumption that T is exponentially distributed, then its probability den-
sity function, pdf is given as:
f(t) =λe−λt
Which results in the computation
MT T F=1
λ
The above equations hold true for the exponential lifetime distributions. λ is the failure rate.
The practical implication of the MTTF being the reciprocal of the failure rate in an exponen-
tially distributed lifetime is that the failure of such components is constant and does not depend
on time. This is the so-called "memoryless" property of the exponential distribution. Another
reason why the exponential distribution is popular with system reliability engineers is that it
is easy to analyse, for example in the Markov chains and Markov processes. It is often used to
CHAPTER 3. FUNDAMENTALS OF VIBRATION ANALYSIS AND THE LIFETIME MODELS 23
describe the times to failure of components that experience wear out after some expected time
in service. Common examples are high grade integrated circuits and capacitors used in special
applications such as space missions. If the criticality of components known to have exponen-
tial lifetime distributions permits, the most efficient maintenance policy would be to run such
components till they fail and then a repair or replacement is carried out. There is a debate in
the maintenance engineering community as to what state the system is restored after the failure
event. Some are pessimistic and say that it is restored to the state it was immediately before it
failed; whereas some are optimistic and argue that the system was renewed, in other words, it
was restored to an as good as new condition. Maybe the true state after the so-called renewal
process is somewhere between what the pessimists and the optimists postulate but so far there
is neither a methodology nor a literature to point out where this compromise position might be.
The Weibull distribution is also another type of lifetime distribution that is studied very often
by reliability and maintenance engineers. Unlike the exponential distribution, it is modelled
with at least two parameters. The lifetime T of any component can be modelled as coming
from a Weibull distribution with a shape parameter α and a scale parameter β (both α and β
are greater than zero). It is shown in Rausand and Høyland (2004) that for a Weibull distributed
lifetime, its survival function
R(t) = e−(λt )α
And the expected lifetime is computed as
E(T )=∫ ∞
0R(t )d t =
∫ ∞
0e−(λt )α d t (3.5)
The theory of extreme values provides an understanding that enables the Weibull distribution to
be used to model the minimum of a certain class of distribution if the data-set represent a large
number of independent positive variables. The extreme value could be the failure of the weakest
link in a chain with each chain exposed to an independent failure mode such as stress or fatigue.
It could also be the failure of a system which is comprised of a large number of components in
series assuming that the failure mechanisms in the individual components are approximately
independent. Above all, the greatest attraction of the Weibull distribution to engineers and sys-
tem analysts is empirical. The Weibull distribution has been used to successfully model failure
CHAPTER 3. FUNDAMENTALS OF VIBRATION ANALYSIS AND THE LIFETIME MODELS 24
data with either an increasing or decreasing failure rate. The Weibull regreesion model (Attardi
et al. (2005)) also has the so-called proportional hazard property and it is the only log-location-
scale-survival-regression model known to have this property. That means that the hazard rate
is a product of two factors: one factor is a function of time but not of a certain covariate vec-
tor and the second factor is a function of a certain covariate vector but not of time. This is an
important analytical technique when considering the concept of relative or competing risks. In
the analysis of the failure of a rotating equipment, it may be necessary to answer the question of
a particular component’s failure resulting from the factors of fatigue or corrosion among other
failure mechanisms.
The lognormal distribution (Pascual and Montepiedra (2005), Peng and Tseng (2009)) is the
last of the survey of common distribution models discussed in this section to provide the moti-
vation for using parametric models in data analysis. The lognormal distribution is widely con-
sidered to be an appropriate model for the times to failure when the failures result from degra-
dation processes in a multiplicative combination with some random rates. This model has been
used widely to describe the time to fracture resulting from fatigue crack propagation in metals.
It is an important model to consider while carrying out vibration analysis of rotating equipment
in the context of this report.
3.2.2 Non-Parametric Families of Lifetime Distribution
The non-parametric model is used when nothing is known about the distribution of the studied
lifetimes or when the available knowledge is not sufficient to assume any lifetime model. How-
ever, it is often useful in practice for analysts to compare the results from the parametric and
non-parametric models of the same data-set. The aim of the non-parametric technique is to
estimate some of the functions earlier discussed under the parametric models: the probability
density function (pdf), cumulative distribution function (cdf), reliability or survival function,
R(t) and the hazard function, z(t). Two methods (the Kaplan-Meier Estimator and the Nelson-
Aalen Estimator) used widely in the non-parametric technique for data analysis are presented
below. Lindqvist and Doksum (2003) and Lindqvist and Langseth (2005) provide additional ma-
terials to aid the understanding of the basis for these estimation methods and other related
topics.
CHAPTER 3. FUNDAMENTALS OF VIBRATION ANALYSIS AND THE LIFETIME MODELS 25
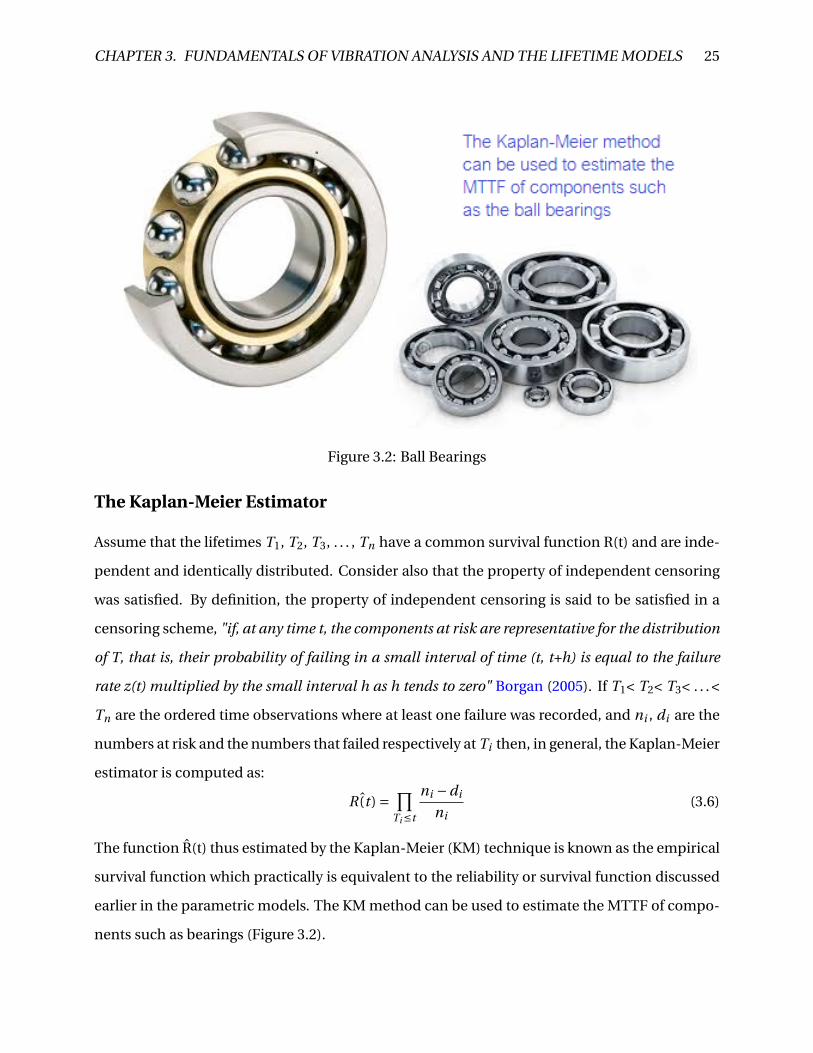
Figure 3.2: Ball Bearings
The Kaplan-Meier Estimator
Assume that the lifetimes T1, T2, T3, . . . , Tn have a common survival function R(t) and are inde-
pendent and identically distributed. Consider also that the property of independent censoring
was satisfied. By definition, the property of independent censoring is said to be satisfied in a
censoring scheme, "if, at any time t, the components at risk are representative for the distribution
of T, that is, their probability of failing in a small interval of time (t, t+h) is equal to the failure
rate z(t) multiplied by the small interval h as h tends to zero" Borgan (2005). If T1< T2< T3< . . . <
Tn are the ordered time observations where at least one failure was recorded, and ni , di are the
numbers at risk and the numbers that failed respectively at Ti then, in general, the Kaplan-Meier
estimator is computed as:
ˆR(t ) = ∏Ti≤t
ni −di
ni(3.6)
The function R̂(t) thus estimated by the Kaplan-Meier (KM) technique is known as the empirical
survival function which practically is equivalent to the reliability or survival function discussed
earlier in the parametric models. The KM method can be used to estimate the MTTF of compo-
nents such as bearings (Figure 3.2).
CHAPTER 3. FUNDAMENTALS OF VIBRATION ANALYSIS AND THE LIFETIME MODELS 26
The Nelson-Aalen Estimator
The Nelson-Aalen technique is used as an estimator for the cumulative hazard function, ˆZN A
and it is defined as
ˆZN A = ∑Ti≤t
di
ni(3.7)
In Meeker and Escobar (2014), it is shown that the Nelson-Aalen estimator (or simply, the Nelson
estimator), ˆZN A is asymptotically equivalent to the Kaplan-Meier estimator, R̂(t). The Nelson-
Aalen estimator is not included in the 2015 version of the Minitab statistical software (Minitab
version 17.2.1) used to demonstrate the discussed concepts in the next section but it does in-
clude the so-called "hazard-plot," which in fact is not a correct approximation to the cumulative
hazard function estimated by Nelson-Aalen.
The ideas discussed in the preceding paragraphs are further illustrated through a case study
using publicly available standard data from ball bearing observations. The main focus of this
report is not on the statistical inferences instead the objective is to find a valid ground upon
which to base the maintenance decision process. Discussions on hypothesis testing, confidence
intervals, censoring, standard deviation and variance are well covered in statistical textbooks
hitherto referenced in this report.
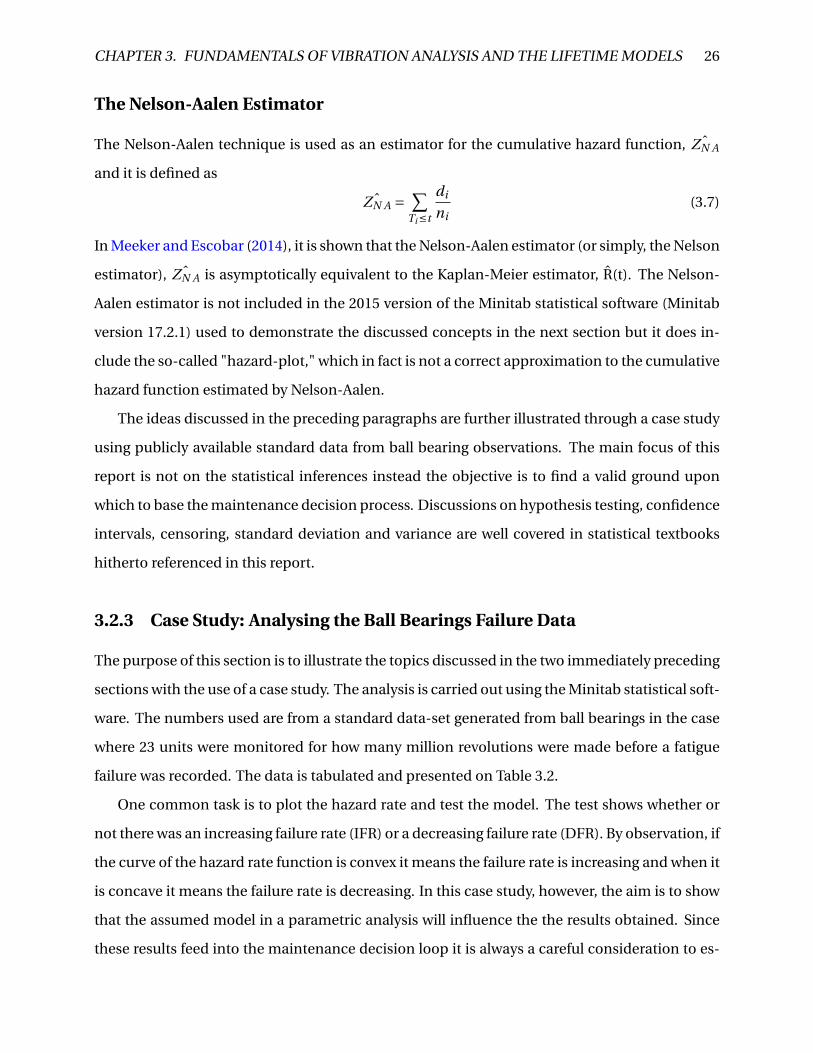
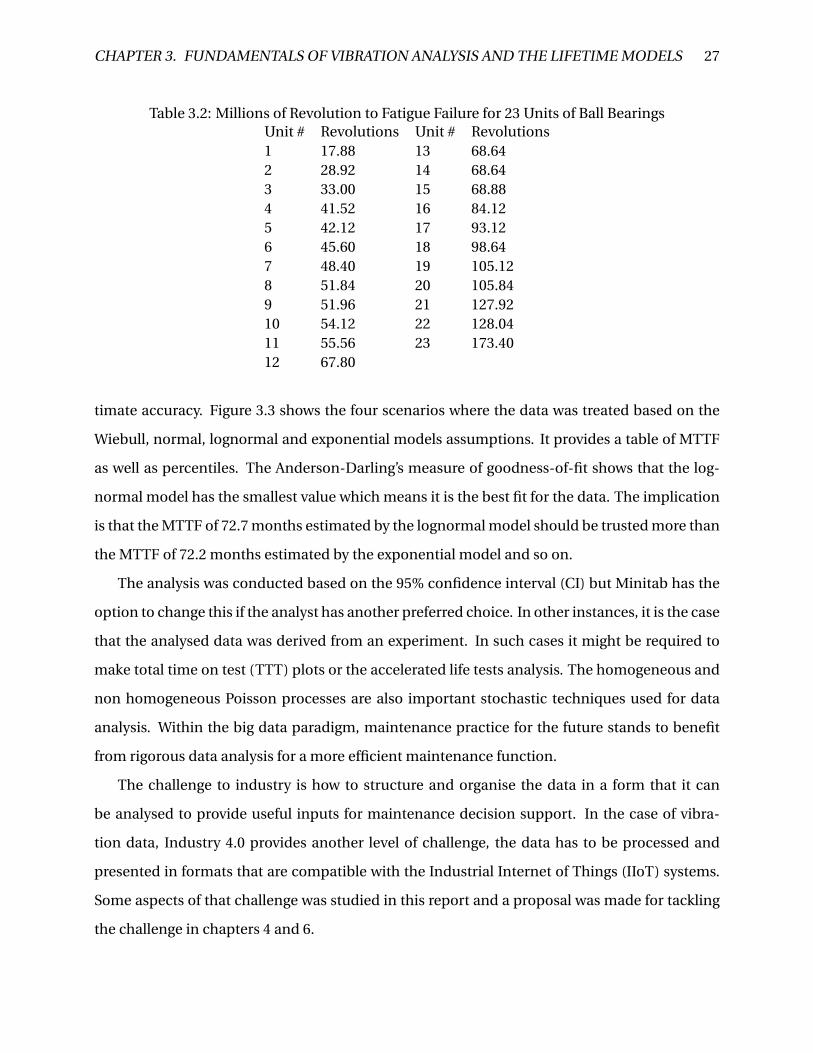
3.2.3 Case Study: Analysing the Ball Bearings Failure Data
The purpose of this section is to illustrate the topics discussed in the two immediately preceding
sections with the use of a case study. The analysis is carried out using the Minitab statistical soft-
ware. The numbers used are from a standard data-set generated from ball bearings in the case
where 23 units were monitored for how many million revolutions were made before a fatigue
failure was recorded. The data is tabulated and presented on Table 3.2.
One common task is to plot the hazard rate and test the model. The test shows whether or
not there was an increasing failure rate (IFR) or a decreasing failure rate (DFR). By observation, if
the curve of the hazard rate function is convex it means the failure rate is increasing and when it
is concave it means the failure rate is decreasing. In this case study, however, the aim is to show
that the assumed model in a parametric analysis will influence the the results obtained. Since
these results feed into the maintenance decision loop it is always a careful consideration to es-
CHAPTER 3. FUNDAMENTALS OF VIBRATION ANALYSIS AND THE LIFETIME MODELS 27
Table 3.2: Millions of Revolution to Fatigue Failure for 23 Units of Ball BearingsUnit # Revolutions Unit # Revolutions1 17.88 13 68.642 28.92 14 68.643 33.00 15 68.884 41.52 16 84.125 42.12 17 93.126 45.60 18 98.647 48.40 19 105.128 51.84 20 105.849 51.96 21 127.9210 54.12 22 128.0411 55.56 23 173.4012 67.80
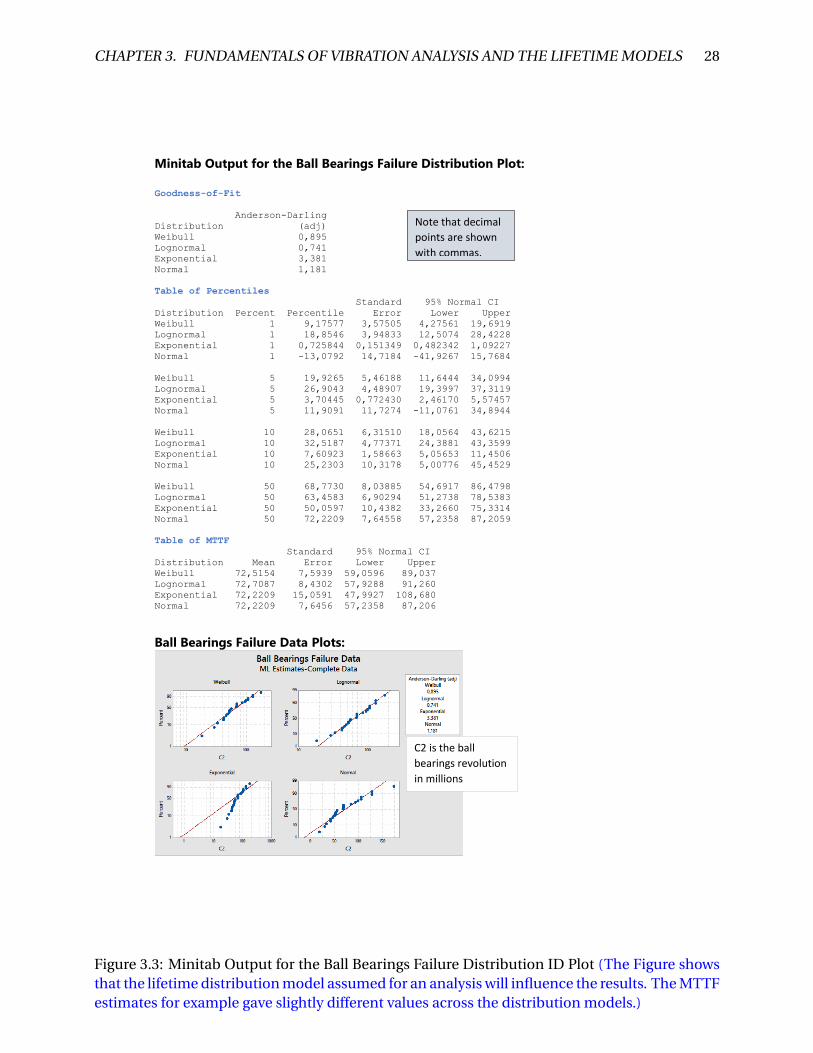
timate accuracy. Figure 3.3 shows the four scenarios where the data was treated based on the
Wiebull, normal, lognormal and exponential models assumptions. It provides a table of MTTF
as well as percentiles. The Anderson-Darling’s measure of goodness-of-fit shows that the log-
normal model has the smallest value which means it is the best fit for the data. The implication
is that the MTTF of 72.7 months estimated by the lognormal model should be trusted more than
the MTTF of 72.2 months estimated by the exponential model and so on.
The analysis was conducted based on the 95% confidence interval (CI) but Minitab has the
option to change this if the analyst has another preferred choice. In other instances, it is the case
that the analysed data was derived from an experiment. In such cases it might be required to
make total time on test (TTT) plots or the accelerated life tests analysis. The homogeneous and
non homogeneous Poisson processes are also important stochastic techniques used for data
analysis. Within the big data paradigm, maintenance practice for the future stands to benefit
from rigorous data analysis for a more efficient maintenance function.
The challenge to industry is how to structure and organise the data in a form that it can
be analysed to provide useful inputs for maintenance decision support. In the case of vibra-
tion data, Industry 4.0 provides another level of challenge, the data has to be processed and
presented in formats that are compatible with the Industrial Internet of Things (IIoT) systems.
Some aspects of that challenge was studied in this report and a proposal was made for tackling
the challenge in chapters 4 and 6.
CHAPTER 3. FUNDAMENTALS OF VIBRATION ANALYSIS AND THE LIFETIME MODELS 28
Minitab Output for the Ball Bearings Failure Distribution Plot:
Goodness-of-Fit
Anderson-Darling
Distribution (adj)
Weibull 0,895
Lognormal 0,741
Exponential 3,381
Normal 1,181
Table of Percentiles
Standard 95% Normal CI
Distribution Percent Percentile Error Lower Upper
Weibull 1 9,17577 3,57505 4,27561 19,6919
Lognormal 1 18,8546 3,94833 12,5074 28,4228
Exponential 1 0,725844 0,151349 0,482342 1,09227
Normal 1 -13,0792 14,7184 -41,9267 15,7684
Weibull 5 19,9265 5,46188 11,6444 34,0994
Lognormal 5 26,9043 4,48907 19,3997 37,3119
Exponential 5 3,70445 0,772430 2,46170 5,57457
Normal 5 11,9091 11,7274 -11,0761 34,8944
Weibull 10 28,0651 6,31510 18,0564 43,6215
Lognormal 10 32,5187 4,77371 24,3881 43,3599
Exponential 10 7,60923 1,58663 5,05653 11,4506
Normal 10 25,2303 10,3178 5,00776 45,4529
Weibull 50 68,7730 8,03885 54,6917 86,4798
Lognormal 50 63,4583 6,90294 51,2738 78,5383
Exponential 50 50,0597 10,4382 33,2660 75,3314
Normal 50 72,2209 7,64558 57,2358 87,2059
Table of MTTF
Standard 95% Normal CI
Distribution Mean Error Lower Upper
Weibull 72,5154 7,5939 59,0596 89,037
Lognormal 72,7087 8,4302 57,9288 91,260
Exponential 72,2209 15,0591 47,9927 108,680
Normal 72,2209 7,6456 57,2358 87,206
Ball Bearings Failure Data Plots:
Note that decimal
points are shown
with commas.
C2 is the ball
bearings revolution
in millions
Figure 3.3: Minitab Output for the Ball Bearings Failure Distribution ID Plot (The Figure showsthat the lifetime distribution model assumed for an analysis will influence the results. The MTTFestimates for example gave slightly different values across the distribution models.)
Chapter 4
Rotating Machines Prognostics: The Science
& Art of Vibration Technique
Vibration is characterised with frequency (measured in Hertz, CPM or RPM) and amplitude
(measured either as peak, peak-to-peak or RMS values). The vibration energy can be described
in terms of either the displacement (measured in micrometres), velocity (measured in millime-
tres per second) or acceleration (measured in metres per square second) caused by its transmis-
sion. A vibration signal can be related to another vibration or reference signal in terms of phase.
There are several international standards dedicated to best practises in vibration analysis. They
are mostly focused on the area of using vibration analysis for the purpose of operational mon-
itoring and acceptance testing of rotating equipment or reciprocating machines. They often
generally cover diagnosis but there is so far neither an existing standard nor is there available
any proven technique to use vibration analysis to implement system prognosis. This is impor-
tant because gaining an early awareness about an impending failure provides the opportunity
to mitigate surprises and plan maintenance based on a schedule to optimise production time
and reduce downtime. This chapter proposes a technique that provides a basis for using vibra-
tion analysis to carry out system prognosis within the framework of a predictive maintenance
policy. The result can be treated with the stochastic processes and lifetime models introduced
earlier in chapter 3 but as shown later in chapter 6 it is equally compatible with Industry 4.0 pro-
posals and reference architecture. The discussion begins with an introduction to two important
standards to aid a better understanding of the topic.
29
CHAPTER 4. ROTATING MACHINES PROGNOSTICS: THE SCIENCE & ART OF VIBRATION TECHNIQUE30
4.1 Mechanical Vibration and the ISO 10816 and ISO 7919
4.1.1 ISO 10816 (Parts 1 and 3)
The ISO 10816 is one of the key international standards that set out the procedures and con-
ditions for measurement and evaluation of vibration data. The ISO 10816 specifically focuses
on measurements made on non-rotating/nonreciprocating parts of the machine. It stipulates
two evaluation criteria. These are the magnitude of vibration and the change of vibration. The
vibration signal captured from a machine is specified to be broadband in the sense that the
frequency spectrum of the equipment under consideration is reasonably covered. The appro-
priate frequency range for any given type of machine will depend on its configuration and the
experience with its vibratory behaviour.
The overarching objective of any vibration analysis system is to determine the vibration
severity of a machine and the trend of the vibration over time, increasing or decreasing. In
order to meet this objective, measurements are made at carefully selected measurement points
and often in two or three different directions which are mutually perpendicular (ref. Figure 4.1).
This results in a set of vibration data representing vibration magnitude. By definition, vibration
severity is the maximum broadband magnitude value measured under agreed machine support
and operating conditions ISO10816-3 (2009). In many machines a single vibration severity value
is enough to characterise the vibration level however in other cases it will be insufficient and
a more accurate representation will depend on a number of severity values from several loca-
tions. The vibration severity at each bearing housing or pedestal is compared with the four
predetermined evaluation zones (Zones A, B, C and D) stipulated by the ISO 10816-1 and ISO
10816-3 standards to give the indication of normalcy, alarm or trip ISO10816-1 (1995). More in-
formation and chats are provided in the appendices to this report. The measuring positions are
marked and subsequent measurements are taken from the same positions with the same trans-
ducer orientations and similar operating conditions, otherwise it may produce an erroneous
result when trended over time. When these conditions are met, significant changes from the
established normal vibration readings must be investigated further to avoid reaching a position
which could be dangerous to the continued operation of the machine. It is however important to
note that in some cases some deviations cannot be detected unless the frequency components

CHAPTER 4. ROTATING MACHINES PROGNOSTICS: THE SCIENCE & ART OF VIBRATION TECHNIQUE31
Item 1: Measuring points for small electrical machines
Item 2: Measuring points for housing-type bearings
Item 3: Measuring points for pedestal bearings
Figure 4.1: Points for Measuring VibrationISO10816-1 (1995)
CHAPTER 4. ROTATING MACHINES PROGNOSTICS: THE SCIENCE & ART OF VIBRATION TECHNIQUE32
of the vibration signal is analysed. A case study at the end of this chapter shows the benefits of
such analysis.
4.1.2 ISO 7919 (Parts 1 to 5)
The ISO 7919 standards cover the so-called "shaft vibration" and are formerly entitled: "Mechan-
ical Vibration of non-reciprocating machines - Measurements on rotating shafts and evaluation
criteria." Thus, the ISO 7919 standards compliment the ISO 10816 standards though with the
key difference that the ISO 7919 address measurement of vibration on rotating parts whereas
the ISO 10816 address measurement of vibration on non-rotating/nonreciprocating parts. Ma-
chines with flexible rotor arrangements are typical of scenarios where vibration measurements
are preferably made on the rotating parts in order to obtain a better result. Shaft vibration mea-
surements are also the preferred choice when the casings are relatively more stiff or heavier
compared to the machine’s rotor mass. Measuring shaft vibration directly on the rotating parts
helps to determine: changes in the behaviour of vibration, disproportionate kinetic loading, and
radial clearance monitoring ISO7919-1 (1996). Issues of kinetic loading and radial clearances are
not within the scope of this report; the technicalities of the ISO 7919 is not investigated further.
4.2 Frequency Peaks as Discrete Values
There are several rigorous mathematical theories which have been developed and applied in
the field of vibration analysis. Such theories, some of which are grounded in classical physics
or calculus, have been proven in other credible sources and would not be repeated here. How-
ever, vibration analysis is not all about mathematics and the sciences, it generally also engages
the human creative and imaginative energy. Such creative, imaginative skills are elements of
the arts which the vibration analysts must include in their analytical tool boxes. I earlier men-
tioned that frequency is measured either in hertz (which by definition means cycles per sec-
ond) or in CPM/RPM. The third unit of frequency is "Orders," an important measure that aids a
more imaginative and more useful interpretation of the relationship between the rotating mem-
bers’ turning speeds/frequencies, forcing frequencies/excitation energies and their frequency
responses in the spectrum. Figure 4.2 shows a rotating machine and the frequency spectrum
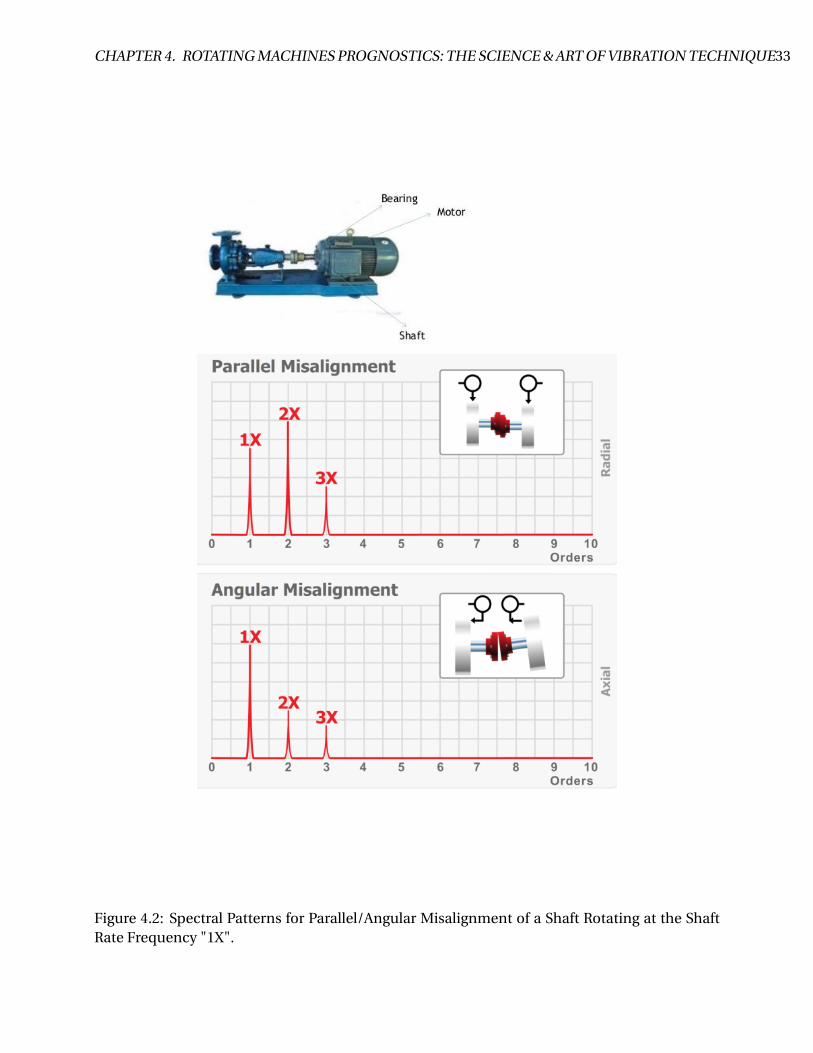
CHAPTER 4. ROTATING MACHINES PROGNOSTICS: THE SCIENCE & ART OF VIBRATION TECHNIQUE33
Figure 4.2: Spectral Patterns for Parallel/Angular Misalignment of a Shaft Rotating at the ShaftRate Frequency "1X".
CHAPTER 4. ROTATING MACHINES PROGNOSTICS: THE SCIENCE & ART OF VIBRATION TECHNIQUE34
patterns (peaks shown in "orders"). A trained vibration analyst can distinguish between a par-
allel or angular misalignment of the shaft by observing the patterns.
The fundamental question is what is order? Imagine sitting a set of twins (a girl and a boy)
on a four-arm merry-go-round rotating on a shaft at a certain frequency. Imagine that the initial
orientation of the four arms align with the cardinal points (north, south, east, and west). Imag-
ine that the boy and the girl sit on the north and south arms facing each other. Each of the twins
will pass in front of an observer standing at a fixed position nearby once each time the merry-
go-round makes one full revolution irrespective of its frequency. In terms of order, the girl or
the boy considered separately passes at one times the shaft rate; and considered together they
pass at two times the shaft rate, conventionally abbreviated "1X" and "2X" respectively. It does
not matter if the actual turning speed of the merry-go-round was 50 Hz, 1000 Hz or changing.
Knowing the frequency of occurrence of an event relative to the turning speed is very useful in
vibration analysis. Units of orders provide a clue to the source of peaks in the frequency spec-
trum. From the merry-go-round example cited above, a peak present at 2 orders (that is, 2X) can
be easily related to the "twins" pass frequency and thereby helping to eliminate other sources
as possible causes of the fault. The example can be expanded to include an electric motor, a
pump or compressor and so on. In an induction motor where the rotor was wound with 38 bars,
a peak present at "38X" could relate to a trouble with one of the bars; it does not matter if it is
used with a variable-frequency drive (VFD) or fixed-speed systems, the absolute frequency in
hertz or CPM is not of any practical interest. Therefore, it is valuable to relate every peak in the
spectrum to the motor shaft rate ("1X") and also to relate one peak to the other. Another benefit
of measuring frequency unit in "orders" is that it makes it easier to compute forcing frequencies.
In general, forcing frequencies (also known as defect or fault frequencies) is computed by mul-
tiplying the number of components by the shaft rate. Refer to Figure 4.3, the blade pass rate is
equal to the number of blades times the shaft rate of the shaft the blades are mounted on (that is,
7 X 3,300 = 23,100 RPM or 7 X 55 = 385 CPS, as in the current example). The lengths of the respec-
tive peaks are single discrete values which represent the magnitude or severity of vibration. If,
for example, something goes wrong with the blades but not with the shaft and coil such that the
vibration energy from the blades should increase, the magnitude of the frequency peak at 385
Hz increases in response. If the vibration energy increases even further, peak equally increases
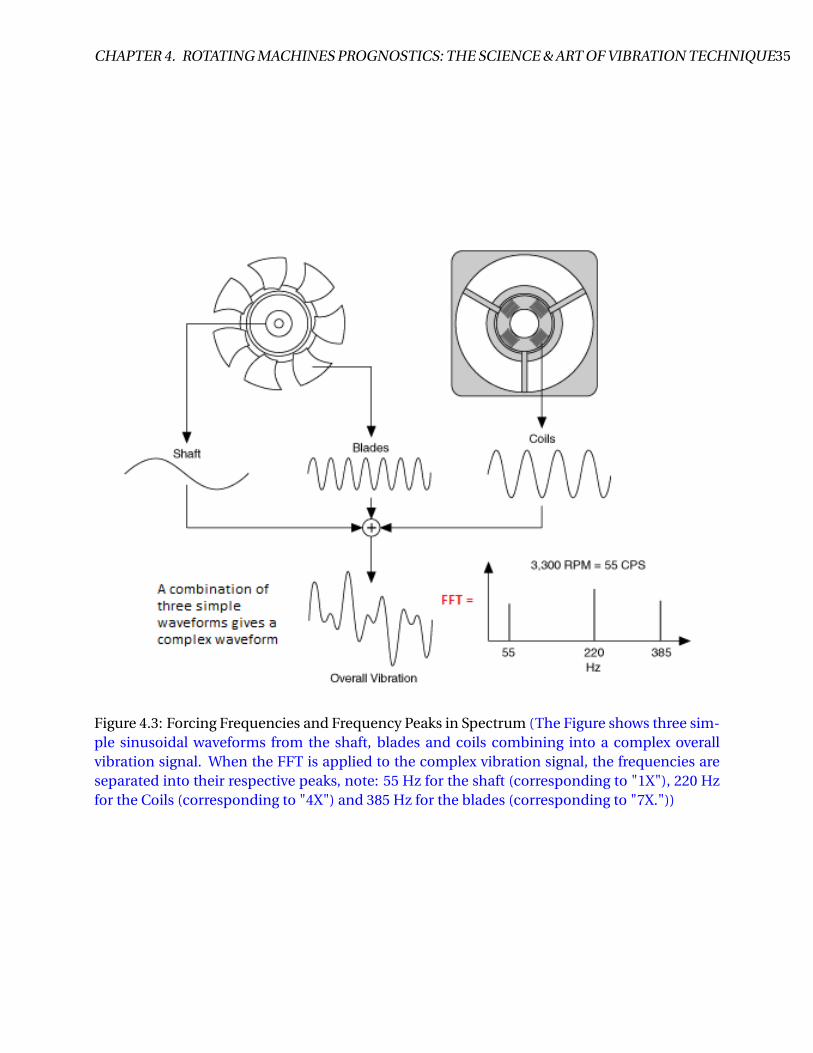
CHAPTER 4. ROTATING MACHINES PROGNOSTICS: THE SCIENCE & ART OF VIBRATION TECHNIQUE35
Figure 4.3: Forcing Frequencies and Frequency Peaks in Spectrum (The Figure shows three sim-ple sinusoidal waveforms from the shaft, blades and coils combining into a complex overallvibration signal. When the FFT is applied to the complex vibration signal, the frequencies areseparated into their respective peaks, note: 55 Hz for the shaft (corresponding to "1X"), 220 Hzfor the Coils (corresponding to "4X") and 385 Hz for the blades (corresponding to "7X."))
CHAPTER 4. ROTATING MACHINES PROGNOSTICS: THE SCIENCE & ART OF VIBRATION TECHNIQUE36
in response. The study conducted in thesis shows that there is a possibility to use this frequency
response feature for prognosis by applying some stochastic techniques. The remaining part of
the current chapter is dedicated to discussing how to follow this pattern over time and predict
when in the future the peak from the blades becomes dangerous to the continued operation of
the machine.
4.3 The Autoregressive Moving Average (ARMA) Models
ARMA is a popular time series analysis tool for forecasting because it provides a reasonably more
accurate result than the cumulative and naive models and is simple to implement. The major
drawback often encountered in the use of the ARMA model is its requirement for a large amount
of historic data in order to be able to produce an accurate result. Abrahart and See (2000) and
Khashei et al. (2009) among others proffer a combination of the "moving averages" with the
artificial neural networks (ANN) and fuzzy logic as a possible solution. This report does not focus
on that integration instead it advocates the correct use of prevalent "big data" to overcome the
hurdle of historic data. It can be decided how many periods should be included in the model.
For example, a 2 period moving average (MA) or 14 period MA could be the preferred choice.
The main driver for how many periods to include is the length of time for which the history
is relevant. Adapting this model for the purpose of prognosis on a maintainable system, any
record of history held prior to an overhaul is not relevant in the next round of prognosis after
the overhaul though the data may be useful for benchmarking or comparison in the future. The
general form of an M-Period ARMA model is shown in equation 4.1.
ˆxt ,t+1 =∑t
i=t+1−M xi
M(4.1)
where
ˆxt ,t+1 = is the forecast for period t+1 (that is the future) from period t (today)
xi = the value of the measurement made at the earliest period of the M-period considered
M = number of relevant periods
CHAPTER 4. ROTATING MACHINES PROGNOSTICS: THE SCIENCE & ART OF VIBRATION TECHNIQUE37
There is no hard and fast way for choosing M. A large M is generally preferred when the goal
is to predict way into the future. Period as used here is not defined. It can be a month, a quarter
or a year. It is important to note that it is more practicable to predict a range of values rather than
just predicting a single value. That is, it is more realistic to predict that an equipment will fail 30
to 34 weeks from now rather than predicting that the equipment will fail on the evening of the
32nd week from today, and so on. The challenge is overcome by the introduction of "confidence
intervals" and the consideration of random fluctuations but that aspect was left out of this report
for a future investigation.
4.4 Case Study: Implementing System Prognosis with the Thruster
Gearbox Bearing Spectra
The ARMA model introduced in the previous section and the lifetime models discussed in chap-
ter 3 are validated in this section through a case study of measurements made on a roller ele-
ment bearing at one of Karsten Moholt customer’s machines. The velocity spectrum for a com-
ponent of the thruster system, that is one of the gearbox bearings was analysed. The waterfall
plot of the spectra from the bearing is shown in Figure 4.4. Each spectrum represents the fre-
quency response in a specific survey period shown against the date of the survey. The passing
and successive survey period spectra are superimposed for easier visualisation. The survey pe-
riods are assumed to be at six months interval. That is a logical deduction but it was not exactly
the case. It is important to assume an equal interval to proceed with the regression analysis. The
results of the regression analysis is shown on Figure 4.5. The numbers used for the regression
were obtained by taking the average of 5 peaks on a survey period: the maximum peak for the
period, two next lower peaks on the left and two next lower peaks on the right. The frequency
range of interest was from 250 Hz to 300 Hz (this frequency range is associated with the bearing
of interest). The vibration severity or peaks are measured in millimetres per second.
From the regression analysis, the model for predicting the next period’s expected vibration
severity was derived as 1.096117 + 0.795704 * Yt (where Yt is the vibration severity of the most
recent survey period.) The model predicted the vibration severity for period 9 as 4.96 millime-
tres per second. Having a systematic way to carry out such predictions has many benefits. In the
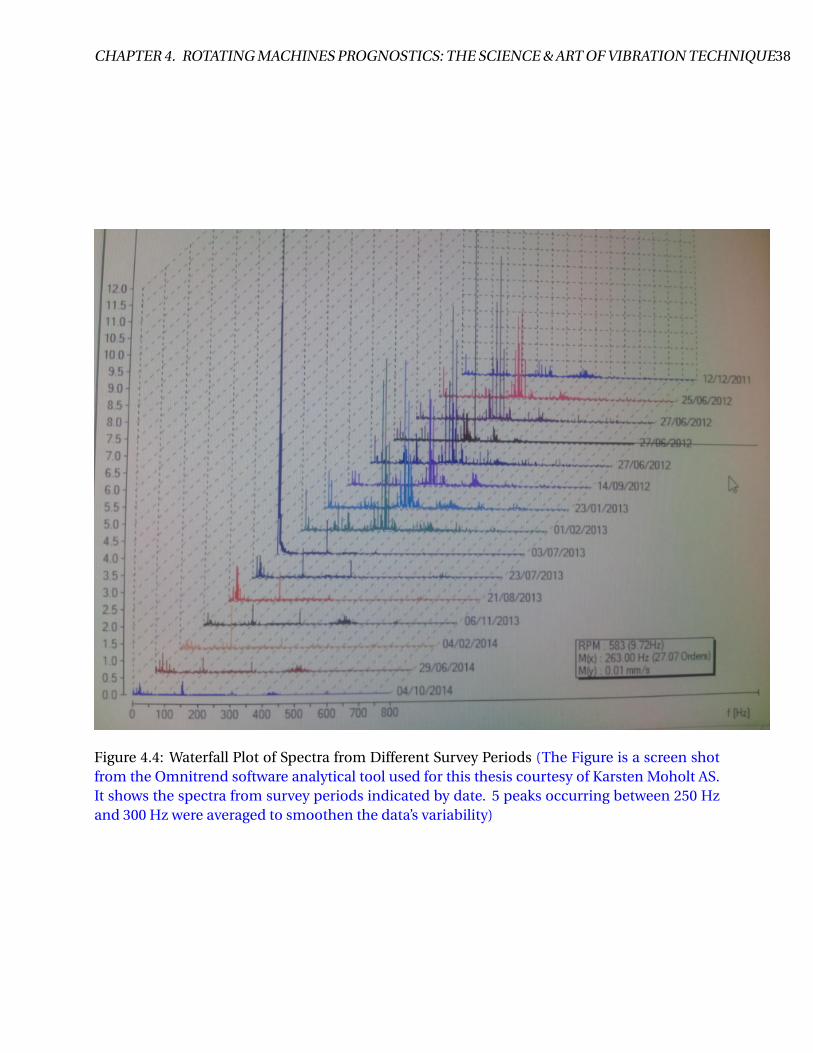
CHAPTER 4. ROTATING MACHINES PROGNOSTICS: THE SCIENCE & ART OF VIBRATION TECHNIQUE38
Figure 4.4: Waterfall Plot of Spectra from Different Survey Periods (The Figure is a screen shotfrom the Omnitrend software analytical tool used for this thesis courtesy of Karsten Moholt AS.It shows the spectra from survey periods indicated by date. 5 peaks occurring between 250 Hzand 300 Hz were averaged to smoothen the data’s variability)
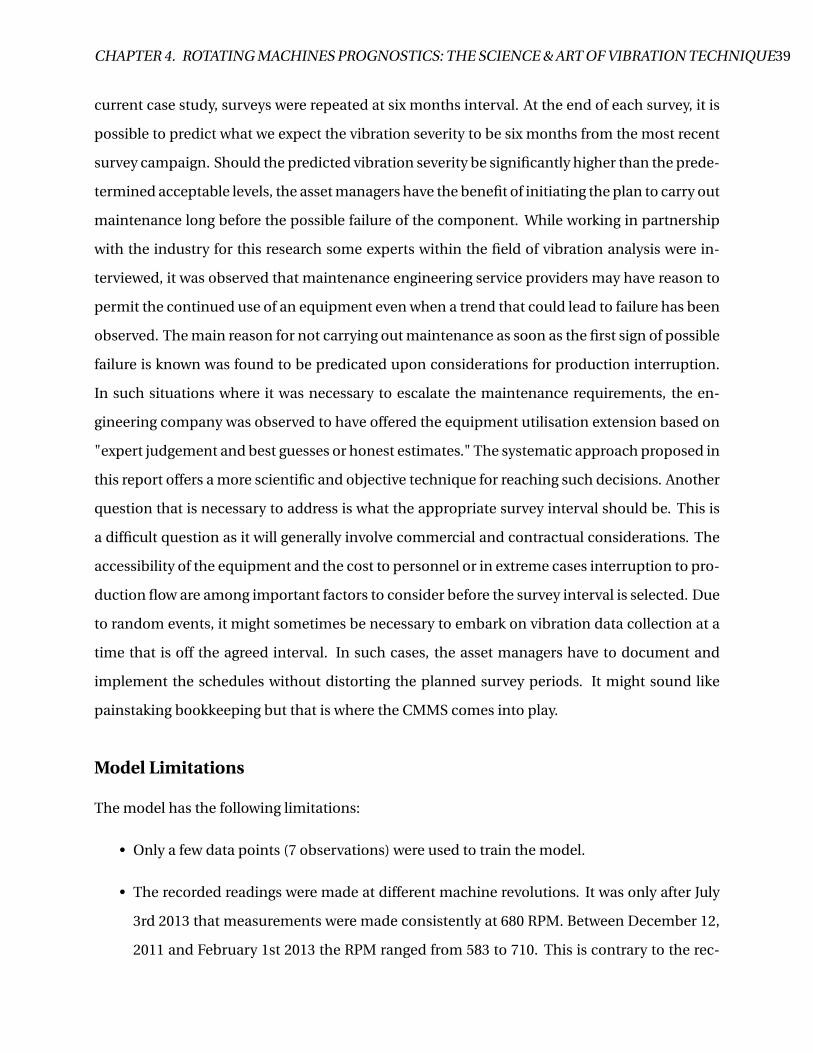
CHAPTER 4. ROTATING MACHINES PROGNOSTICS: THE SCIENCE & ART OF VIBRATION TECHNIQUE39
current case study, surveys were repeated at six months interval. At the end of each survey, it is
possible to predict what we expect the vibration severity to be six months from the most recent
survey campaign. Should the predicted vibration severity be significantly higher than the prede-
termined acceptable levels, the asset managers have the benefit of initiating the plan to carry out
maintenance long before the possible failure of the component. While working in partnership
with the industry for this research some experts within the field of vibration analysis were in-
terviewed, it was observed that maintenance engineering service providers may have reason to
permit the continued use of an equipment even when a trend that could lead to failure has been
observed. The main reason for not carrying out maintenance as soon as the first sign of possible
failure is known was found to be predicated upon considerations for production interruption.
In such situations where it was necessary to escalate the maintenance requirements, the en-
gineering company was observed to have offered the equipment utilisation extension based on
"expert judgement and best guesses or honest estimates." The systematic approach proposed in
this report offers a more scientific and objective technique for reaching such decisions. Another
question that is necessary to address is what the appropriate survey interval should be. This is
a difficult question as it will generally involve commercial and contractual considerations. The
accessibility of the equipment and the cost to personnel or in extreme cases interruption to pro-
duction flow are among important factors to consider before the survey interval is selected. Due
to random events, it might sometimes be necessary to embark on vibration data collection at a
time that is off the agreed interval. In such cases, the asset managers have to document and
implement the schedules without distorting the planned survey periods. It might sound like
painstaking bookkeeping but that is where the CMMS comes into play.
Model Limitations
The model has the following limitations:
• Only a few data points (7 observations) were used to train the model.
• The recorded readings were made at different machine revolutions. It was only after July
3rd 2013 that measurements were made consistently at 680 RPM. Between December 12,
2011 and February 1st 2013 the RPM ranged from 583 to 710. This is contrary to the rec-
CHAPTER 4. ROTATING MACHINES PROGNOSTICS: THE SCIENCE & ART OF VIBRATION TECHNIQUE40
Survey Period Y X
2 2.29 0.65
3 2.55 2.29
4 2.34 2.55
5 2.42 2.34
6 2.84 2.42
7 3.86 2.84
8 4.86 3.86
Model Prediction for: 9 4.96
Prediction model based on regression analysis = Intercept + Coefficient of X * the last Y observation
= 1.096117 + 0.795704 * 4.86 = 4.96 mm/s vibration severity
SUMMARY OUTPUT
Regression Statistics
Multiple R 0.776153
R Square 0.602413
Adjusted R Square 0.522896
Standard Error 0.673223
Observations 7
ANOVA
df SS MS F Significance
F
Regression 1 3.4336 3.4336 7.575866 0.040194
Residual 5 2.266143 0.453229
Total 6 5.699743
Coefficients Standard
Error t Stat P-value Lower 95% Upper 95%
Lower 95.0%
Upper 95.0%
Intercept 1.096117 0.744827 1.471639 0.201092 -0.81852 3.010756 -0.81852 3.010756
X 0.795704 0.289092 2.752429 0.040194 0.05257 1.538838 0.05257 1.538838
RESIDUAL OUTPUT PROBABILITY OUTPUT
Observation Predicted Y Residuals Percentile Y
1 1.613324 0.676676 7.142857 2.29
2 2.918279 -0.36828 21.42857 2.34
3 3.125162 -0.78516 35.71429 2.42
4 2.958064 -0.53806 50 2.55
5 3.02172 -0.18172 64.28571 2.84
6 3.355916 0.504084 78.57143 3.86
7 4.167534 0.692466 92.85714 4.86
Survey Period Y X
1 0.65
2 2.29 0.65
3 2.55 2.29
4 2.34 2.55
5 2.42 2.34
6 2.84 2.42
7 3.86 2.84
8 4.86 3.86
0
2
4
6
0 2 4 6
Y
X
X Line Fit Plot
Y
Predicted Y
Figure 4.5: First Order Linear Regression of Vibration Severity/Peaks (The Figure shows an insertof the final tables used to implement first order linear regression on the vibration severity data.The model for predicting next period vibration severity is derived and shown. The line fit plotgives an indication of how the predicted and observed values match each other. The model isvalid as the p-value is less than 0.05.)
CHAPTER 4. ROTATING MACHINES PROGNOSTICS: THE SCIENCE & ART OF VIBRATION TECHNIQUE41
ommendations made in ISO7919-1 (1996) and ISO10816-3 (2009) and certainly has an in-
fluence on the derived model.
• Frequency peaks were measured without linking them with their corresponding phase
angles. Treating frequency as a vector quantity rather than as a scalar produces better
results as shown in the standards referenced in the above bullet point.
• The interval between the survey periods were not equal. In some cases it was approxi-
mately six months but it was not generally the case.
• The regression analysis has been carried out using the data analysis function in Microsoft
Excel. It was sufficient to demonstrate the result but a commercial application would re-
quire a more advanced software perhaps application tailored computing.
In order to overcome the aforementioned limitations, the pursuit of predictive maintenance
and prognostic techniques need be a rigorously implemented policy. Lots of data are now be-
ing generated within industrial applications and with the continued improvements in sensor
technology, data mining will witness an upward trend. It is necessary to look into the generated
data, structure and analyse it to help in maintenance decision support as well as other value
added services. Data scientists will play an increasingly important role in the future of mainte-
nance practice. Analysing a sufficient amount of data from the same or similar machines with
some statistical techniques such as the lifetime models introduced in chapter 3 will improve
asset reliability and availability. The application of the Nelson-Aalen estimator and the Kaplan-
Meier estimator techniques introduced also in chapter 3 to the relevant data sets can aid better
understanding of components’ failure trajectories and a more accurate estimation of the ma-
chine’s MTTF for example. The big data is important but the systematic analysis of the big data
provides the value adding perspective that would help organisations to realise their overarching
business functions to maximise stakeholders’ value.
Chapter 5
A Business Case Study for PdM: The Karsten
Moholt Experience
This chapter answers one of the report’s sub-objectives. It seeks to justify why predictive main-
tenance (PdM) regime provides better incentives for businesses compared to plants running in
predominantly corrective and/or preventive maintenance modes. The sub-objective is reached
by means of cost assumptions on a thruster assembly based on Karsten Moholt’s experience.
The numbers and costs used were derived from actual engineering specifications and current
market index.
Whereas this report is primarily focused on vibration analysis (VA) and the vibration based
condition monitoring (VBCM), the current chapter has a broader coverage of the predictive
maintenance philosophy. In practice, a PdM regime embraces more than one form of condition
monitoring (CM). For example, the typical defects that can be detected by means of a VA are gear
wear or broken tooth and bearing defects. Seal wear or leakages are better detected through oil
analysis techniques or by means of other sensor technologies. Table 5.1 provides a more com-
prehensive picture of some machine components and the suitable CM techniques for detecting
faults. A physical plant is often comprised of different components from tens of components to
thousands of components depending on the complexity and scale of operation. Maintenance
in such circumstances entail mixing and matching of different maintenance philosophies. At
the scale of hundreds or thousands of components, the computerised maintenance manage-
ment systems (CMMS) are usually almost inevitable. The CMMS is important to organise tasks,
42
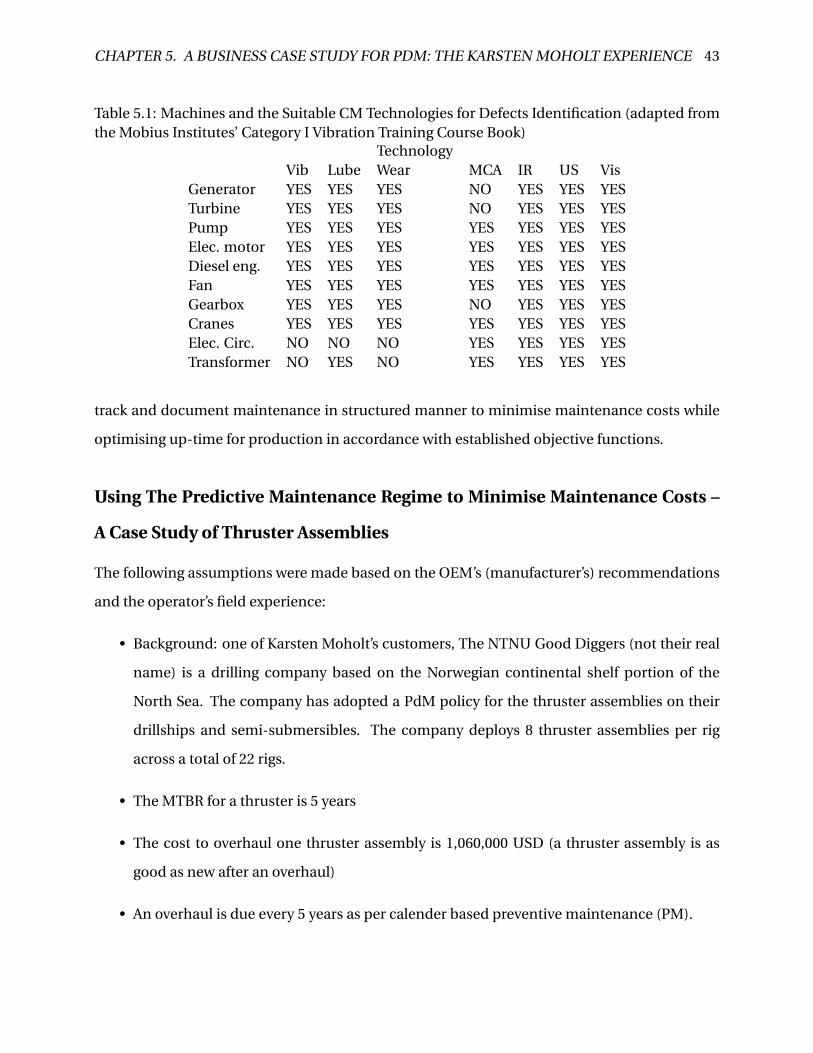
CHAPTER 5. A BUSINESS CASE STUDY FOR PDM: THE KARSTEN MOHOLT EXPERIENCE 43
Table 5.1: Machines and the Suitable CM Technologies for Defects Identification (adapted fromthe Mobius Institutes’ Category I Vibration Training Course Book)
TechnologyVib Lube Wear MCA IR US Vis
Generator YES YES YES NO YES YES YESTurbine YES YES YES NO YES YES YESPump YES YES YES YES YES YES YESElec. motor YES YES YES YES YES YES YESDiesel eng. YES YES YES YES YES YES YESFan YES YES YES YES YES YES YESGearbox YES YES YES NO YES YES YESCranes YES YES YES YES YES YES YESElec. Circ. NO NO NO YES YES YES YESTransformer NO YES NO YES YES YES YES
track and document maintenance in structured manner to minimise maintenance costs while
optimising up-time for production in accordance with established objective functions.
Using The Predictive Maintenance Regime to Minimise Maintenance Costs –
A Case Study of Thruster Assemblies
The following assumptions were made based on the OEM’s (manufacturer’s) recommendations
and the operator’s field experience:
• Background: one of Karsten Moholt’s customers, The NTNU Good Diggers (not their real
name) is a drilling company based on the Norwegian continental shelf portion of the
North Sea. The company has adopted a PdM policy for the thruster assemblies on their
drillships and semi-submersibles. The company deploys 8 thruster assemblies per rig
across a total of 22 rigs.
• The MTBR for a thruster is 5 years
• The cost to overhaul one thruster assembly is 1,060,000 USD (a thruster assembly is as
good as new after an overhaul)
• An overhaul is due every 5 years as per calender based preventive maintenance (PM).

CHAPTER 5. A BUSINESS CASE STUDY FOR PDM: THE KARSTEN MOHOLT EXPERIENCE 44
• Estimated PM per year (covering the costs for routine inspections, filter change, fluid
change/top up among other PM tasks = 25,000 USD
• The dry dock cost per rig (that is 8 thrusters) is 400,000 USD per day
• Docking mean downtime is estimated to be 20 days
For the PM policy:
• The cost to overhaul one thruster = 1,060,000 USD every 5 years (or 212,000 USD per year)
PM tasks = 125,000 USD every 5 years (25,000 USD per year)
• For one rig (total of 8 thrusters), dry dock cost per day for 20 days MDT = 400,000 X 20 =
8,000,000 USD per rig every 5 years or 1,000,000 USD per thruster every 5 years (that is
1,600,000 USD per rig per year or 200,000 per thruster per year)
• In 5 years, the estimated total maintenance cost per thruster = Cost of PM + cost of over-
haul + cost of dry dock for the period = 125,000 + 1,060,000 + 1,000,000 = 2,185,000 USD
per thruster every 5 years (or 437,000 USD per thruster per year)
• This gives 2,185,000 X 8 = 17,480,000 USD per rig every 5 years (or 3,496,000 USD per rig
per year)
• and 17,480,000 X 22 = 384,560,000 USD in 5 years (or 76,912,000 USD per year) for the
entire platform operated by the NTNU Good Diggers but only with respect to the mainte-
nance of thrusters.
For the PdM policy:
With the implementation of a predictive maintenance policy, it is practicable to extend the
MTBR by a factor of 1.2 from 5 years to 1.2 X 5 = 6 years. That gives the following computa-
tions:
• The one year total average maintenance cost of each thruster = Cost PM + cost of overhaul
+ cost of dry dock (yearly average each) = 25,000 + (1,060,000/6) + (1,000,000/6) = 25,000 +
176,667 + 166,667 = 368,334 USD per thruster per year.
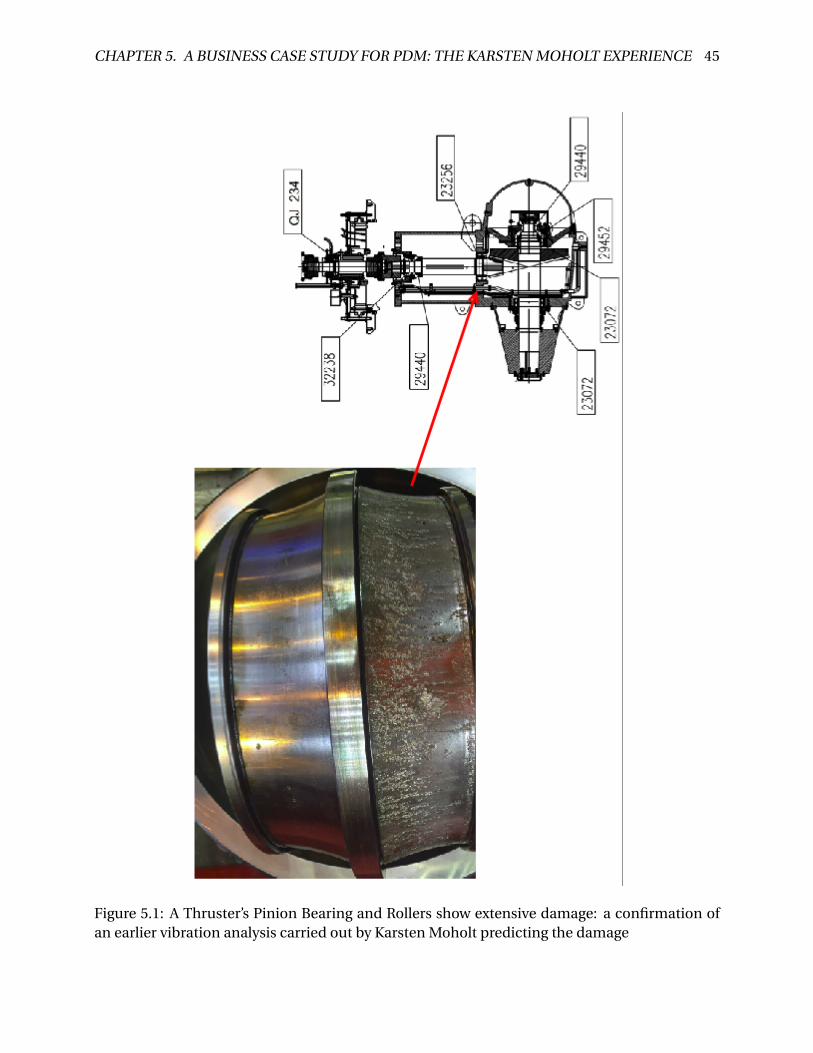
CHAPTER 5. A BUSINESS CASE STUDY FOR PDM: THE KARSTEN MOHOLT EXPERIENCE 45
Figure 5.1: A Thruster’s Pinion Bearing and Rollers show extensive damage: a confirmation ofan earlier vibration analysis carried out by Karsten Moholt predicting the damage

CHAPTER 5. A BUSINESS CASE STUDY FOR PDM: THE KARSTEN MOHOLT EXPERIENCE 46
Alternatively, rather than extending by a factor of 1.2 as earlier proposed, it was argued that
a sufficient evidence exists to support extending the MTBR by a factor of 1.5, that is from 5 years
to 1.5 X 5 = 7.5 years. In that case, the following computations will apply:
• The one year total average maintenance cost of each thruster = Cost PM + cost of over-
haul + cost of dry dock (yearly average each) = 25,000 + (1,060,000/7.5) + (1,000,000/7.5) =
25,000 + 141,333 + 133,333 = 299,666 USD per thruster per year.
The NTNU Good Digger’s maintenance budget for a total asset of 22 rigs (focusing only on the
thrusters – 8 per rig) the three cost scenarios outlined above compares as follows:
1. The calender driven PM policy (5 years interval) = 437,000 X 8 X 22 = 76,912,000 USD total
per year
2. PdM 6 years policy = 368,334 X 8 X 22 = 64,826,784 USD total per year
3. PdM 7.5 years policy = 299,666 X 8 X 22 = 52,741,216 USD total per year
4. Compared to the ordinary calender PM, the PdM programme with a 6 years renewal pol-
icy offers cost savings of 12,085,216 USD per year and the alternative 7.5 years renewal
policy offers cost savings of 24,170,784 USD per year to the operators from the thruster
maintenance budget alone.
During the actual investigation by Karsten Moholt, it was found that only 9 thrusters showed
signs of deviation after 5 years and required maintenance. However, because PdM is still an
ongoing investigation within the oil and gas sector, the calendar PM was followed and all the
thrusters were overhauled as per the operator’s maintenance programme recognised by the Nor-
wegian regulatory authorities. Figure 5.1 shows one of the thrusters that was found to have
a damaged bearing. Modifying the assumptions made in this case study will produce slightly
different cost savings but under any reasonable set of assumptions, the savings will always be
substantial. In contrast, the total cost of acquiring a world class CM technology is likely to be
a fraction of a million USD. The conclusion is that predictive maintenance is an economically
beneficial policy for every production asset. It is recommended that every asset manager should
investigate the use of PdM to increase asset availability and boost productivity.
Chapter 6
Smart Maintenance: Interfacing Vibration
Data with the IIoT
There is a paradigm shift away from traditional manufacturing and standalone systems towards
more integrated and smart factory concepts known as Industry 4.0 or advanced manufacturing.
However, a major concern expressed within the industry is that the current approach presented
within Industry 4.0 (that is, the Industrial Internet of Things (IIoT) Evans and Annunziata (2012)
for implementing predictive maintenance places too much emphasis on low level data moni-
toring to a degree that compromises the level of competence already achieved within the indus-
trial application of vibration based condition monitoring, and there is so far no proven method
to overcome the challenge. Advanced signal processing techniques have been rigorously de-
rived elsewhere and there is no doubt that the requirements for the digitisation of analogue
signals have been met in other applications. The knowledge gap formulated as one of the sub-
objectives and addressed in this report is the articulation of a method that provides the possibil-
ity to apply vibration analysis solutions to predictive maintenance services within the Industry
4.0 frameworks. The reference architectures proposed within Industry 4.0 advocate the use of
single values for measured parameters. When applied to vibration based condition monitoring,
it is important that the single value digital data interfaced with the Industry 4.0 smart mainte-
nance loops does not lead to results which are considerably less accurate than today’s level of
competence in vibration analysis. The method proposed in this report is to use the "peaks" from
spectral analysis as a representation of this single values. Future developments should ensure
47
CHAPTER 6. SMART MAINTENANCE: INTERFACING VIBRATION DATA WITH THE IIOT 48
that each peak is associated with its phase angle and the vector is resolved to obtain the resul-
tant peak which is the actual value used for the analysis or results computation when fed into
an algorithm. The result is a system that makes use of a single value data and also provides an
accurate representation of the vibration energy produced by the rotating machinery. The Com-
puterised Maintenance Management System (CMMS) forms an important foundational basis
for the success of the proposed solution. For the purpose of clarification of terminologies, ma-
chine learning and machine-to-machine (M2M) communication are discussed. The enabling
technologies that are driving the progress towards Industry 4.0 are defined and finally the con-
cept of smart maintenance is presented in the context of these evolving paradigms.
6.1 Computerised Maintenance Management System (CMMS)
CMMS underscores the importance of computer tools in the execution of asset integrity sys-
tems and maintenance functions. It offers platforms for information storage and retrieval, data
analysis and synthesis, as well as events coordination. There are many useful applications of the
CMMS in the industry today but it is still believed to be greatly under utilised and limited well
below its capability. In current industry applications, the CMMS is often used as equipment in-
formation storage tool and to hold data necessary for PM decisions and maintenance planning.
Gabbar et al. (2003), for example, propose a more extended use, a system of an automated RCM
which aims to integrate the RCM process with the CMMS. In an Industry 4.0 environment, the
current sub-optimal use of the CMMS will be extended in two important ways. First, it’s design
will make it possible to integrate actual equipment and maintenance key performance indica-
tors (KPIs) directly into the decision loop for an effective coordination between maintenance
and operational activities. Currently, interfaces are achieved with maintenance planning per-
sonnel in plants where such systems exist otherwise lack of proper coordination will gradually
develop into an undesirable event. Direct link between actual performance measurements and
the CMMS will boost confidence in the results obtained from an analysis and help to achieve
a more realistic physical systems approximation. It will have a direct positive impact on safety
and asset availability as well as lower operating and support costs. The second area is the in-
corporation of an artificial neural network (ANN) based on the cloud system and other KETs
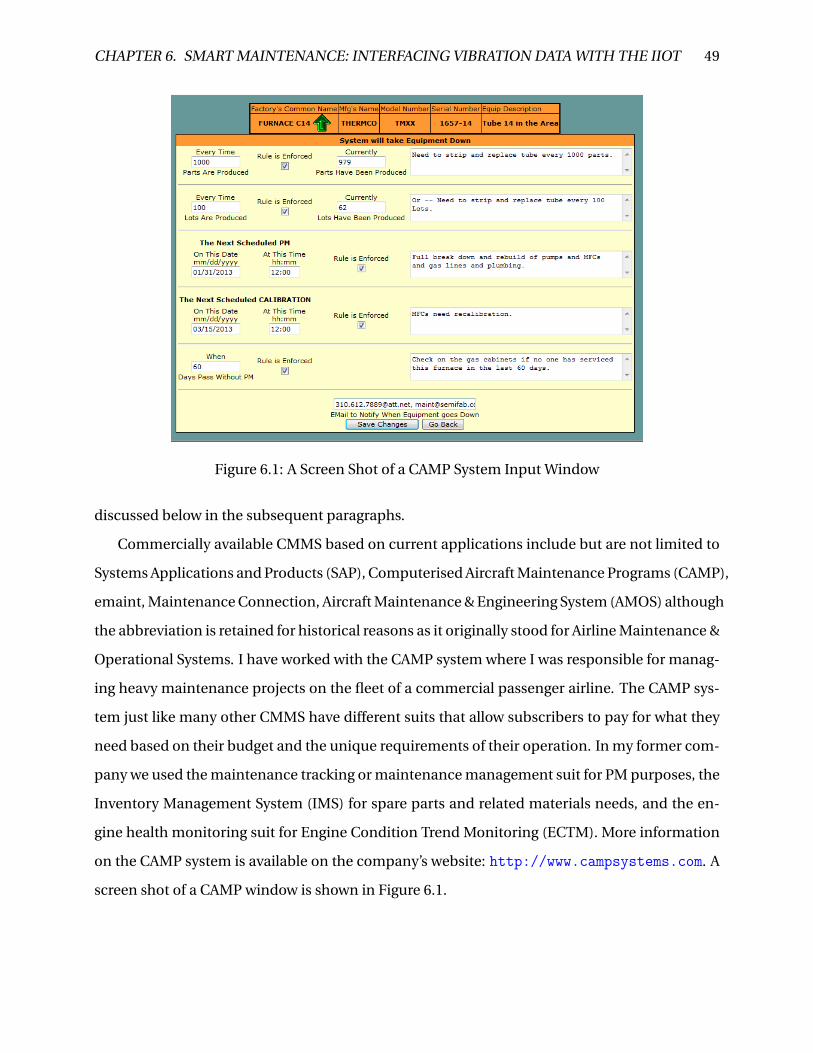
CHAPTER 6. SMART MAINTENANCE: INTERFACING VIBRATION DATA WITH THE IIOT 49
Figure 6.1: A Screen Shot of a CAMP System Input Window
discussed below in the subsequent paragraphs.
Commercially available CMMS based on current applications include but are not limited to
Systems Applications and Products (SAP), Computerised Aircraft Maintenance Programs (CAMP),
emaint, Maintenance Connection, Aircraft Maintenance & Engineering System (AMOS) although
the abbreviation is retained for historical reasons as it originally stood for Airline Maintenance &
Operational Systems. I have worked with the CAMP system where I was responsible for manag-
ing heavy maintenance projects on the fleet of a commercial passenger airline. The CAMP sys-
tem just like many other CMMS have different suits that allow subscribers to pay for what they
need based on their budget and the unique requirements of their operation. In my former com-
pany we used the maintenance tracking or maintenance management suit for PM purposes, the
Inventory Management System (IMS) for spare parts and related materials needs, and the en-
gine health monitoring suit for Engine Condition Trend Monitoring (ECTM). More information
on the CAMP system is available on the company’s website: http://www.campsystems.com. A
screen shot of a CAMP window is shown in Figure 6.1.
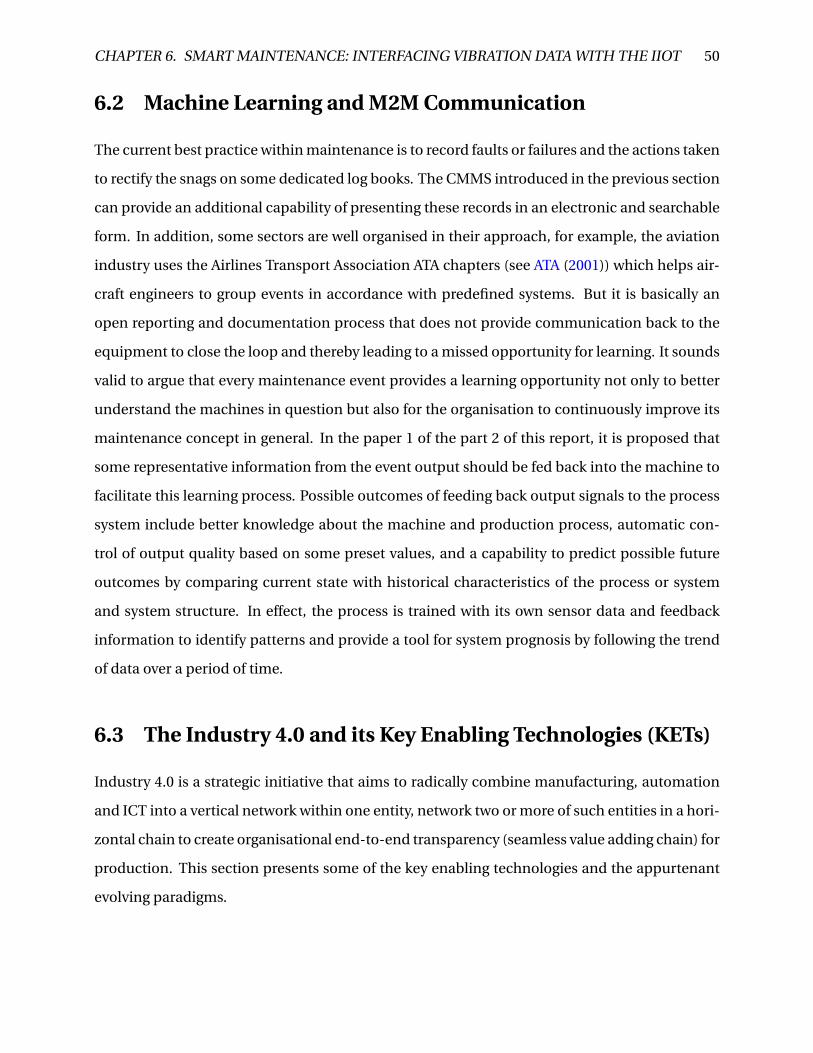
CHAPTER 6. SMART MAINTENANCE: INTERFACING VIBRATION DATA WITH THE IIOT 50
6.2 Machine Learning and M2M Communication
The current best practice within maintenance is to record faults or failures and the actions taken
to rectify the snags on some dedicated log books. The CMMS introduced in the previous section
can provide an additional capability of presenting these records in an electronic and searchable
form. In addition, some sectors are well organised in their approach, for example, the aviation
industry uses the Airlines Transport Association ATA chapters (see ATA (2001)) which helps air-
craft engineers to group events in accordance with predefined systems. But it is basically an
open reporting and documentation process that does not provide communication back to the
equipment to close the loop and thereby leading to a missed opportunity for learning. It sounds
valid to argue that every maintenance event provides a learning opportunity not only to better
understand the machines in question but also for the organisation to continuously improve its
maintenance concept in general. In the paper 1 of the part 2 of this report, it is proposed that
some representative information from the event output should be fed back into the machine to
facilitate this learning process. Possible outcomes of feeding back output signals to the process
system include better knowledge about the machine and production process, automatic con-
trol of output quality based on some preset values, and a capability to predict possible future
outcomes by comparing current state with historical characteristics of the process or system
and system structure. In effect, the process is trained with its own sensor data and feedback
information to identify patterns and provide a tool for system prognosis by following the trend
of data over a period of time.
6.3 The Industry 4.0 and its Key Enabling Technologies (KETs)
Industry 4.0 is a strategic initiative that aims to radically combine manufacturing, automation
and ICT into a vertical network within one entity, network two or more of such entities in a hori-
zontal chain to create organisational end-to-end transparency (seamless value adding chain) for
production. This section presents some of the key enabling technologies and the appurtenant
evolving paradigms.
CHAPTER 6. SMART MAINTENANCE: INTERFACING VIBRATION DATA WITH THE IIOT 51
Figure 6.2: Collaborative Interactions within the Smart Factory (from Kagermann et al. (2013))
Internet of Things (IoT)
The traditional Internet today provides “connection” for over one billion people through plat-
forms such as Facebook, Twitter and Google Hangout. However, the era of advanced and cheap
sensors coupled with the successful derivation of the Internet Protocol IPv6 in 2012 means that
there are now enough IP addresses to assign to every device (sensor, actuator or any object)
configured in a way as to be networked directly with the Internet Kagermann et al. (2013). The
Internet of Things refers to a pervasive, perhaps ubiquitous, network society in which a lot of
objects are “connected” Yan et al. (2008). The concept of the smart factory to have a large net-
work of small, decentralised intelligent embedded devices is driven by the IoT paradigm (see
Figure 6.2).
The Cyber-Physical Systems (CPS)
The cyber-physical systems (CPS) are integrations of computation and physical processes Lee
et al. (2008). Today, several systems are embedded with autonomous chips which are wirelessly
networked with one another and also able to access the Internet thereby providing a tight and
definite link between the cyberspace and the physical world. Such seamless interactions de-
fine the notion of cyber-physical systems (CPS). The benefits of CPS are obvious. Imagine that
you have a smart device built into your mobile phone that continuously monitors/records your
CHAPTER 6. SMART MAINTENANCE: INTERFACING VIBRATION DATA WITH THE IIOT 52
blood pressure and is capable of not only being able to alert you in the event that measure-
ments are not normal but is also able to schedule an appoint for you with a doctor or even call
an ambulance in the event of an emergency; imagine also that this device is intelligent enough
(maybe big data driven) to know that the sudden rise in your blood pressure was because you
were being attacked by some bandits and also calls in the police; imagine as well that this device
detects that you have not had enough sleep and resets your alarm clock two hours ahead and
cancels your earliest appointments for the day. These are all realistic examples. Thus, systems
or system of systems in a CPS scenario are able to communicate and control one another in
a collaborative manner. The CPS has the novel advantage of being able to offer early warnings,
mitigate surprises and is therefore well suited to predictive maintenance applications within the
environments of the industrial Internet.
Big Data
Big data has been the going concern of many companies since the advent of the social media but
the eventual implementation of Industry 4.0 will inadvertently lead to an actual data explosion
resulting from machine generated big data. In that context, big data may be liken to cassava root
or yucca which until it has been processed remains useless or even harmful no matter how suc-
culent it appears to the owner. Big data analytics will become an important field with business
opportunities in the future. Big data will be at the core of the predictive maintenance concept
and the development of prognostic systems within the Industry 4.0 environment but it has to
be processed and analysed. There is no doubt that advanced analytics can greatly enhance the
decision-making quality as managers become armed with more data and are better informed.
Big data is generated from small data obtained from sensors embedded into products such as
subsea valves or automobile wheels to measure some desired physical quantities like tempera-
ture or flow-rate which are in turn analysed to support decision-making including maintenance
decisions. A Boeing 737 NextGen airplane for example will generate about 240 terabytes of data
during a one hour flight between two airports. These sensor data if properly analysed can pro-
vide good insight into the state of health of the airplane, its exposure to risk or its level of perfor-
mance and thereby help the airline operator to prioritise maintenance decisions in a proactive
manner (Manyika et al. (2011)).
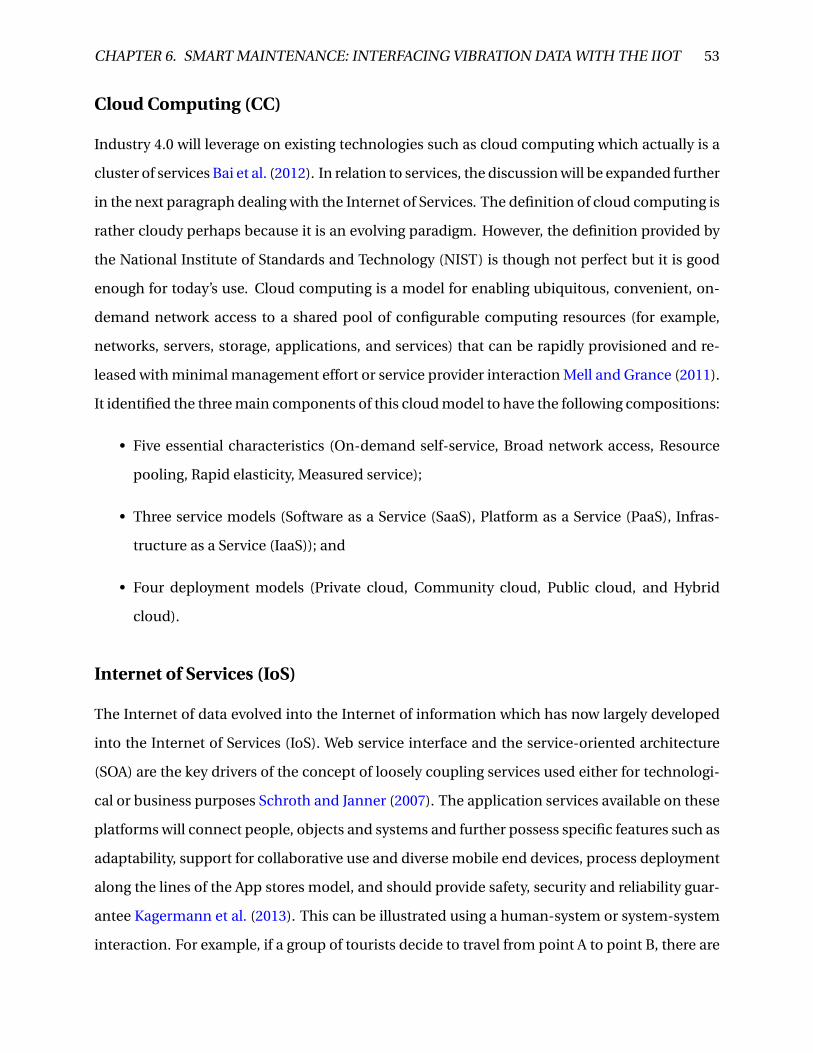
CHAPTER 6. SMART MAINTENANCE: INTERFACING VIBRATION DATA WITH THE IIOT 53
Cloud Computing (CC)
Industry 4.0 will leverage on existing technologies such as cloud computing which actually is a
cluster of services Bai et al. (2012). In relation to services, the discussion will be expanded further
in the next paragraph dealing with the Internet of Services. The definition of cloud computing is
rather cloudy perhaps because it is an evolving paradigm. However, the definition provided by
the National Institute of Standards and Technology (NIST) is though not perfect but it is good
enough for today’s use. Cloud computing is a model for enabling ubiquitous, convenient, on-
demand network access to a shared pool of configurable computing resources (for example,
networks, servers, storage, applications, and services) that can be rapidly provisioned and re-
leased with minimal management effort or service provider interaction Mell and Grance (2011).
It identified the three main components of this cloud model to have the following compositions:
• Five essential characteristics (On-demand self-service, Broad network access, Resource
pooling, Rapid elasticity, Measured service);
• Three service models (Software as a Service (SaaS), Platform as a Service (PaaS), Infras-
tructure as a Service (IaaS)); and
• Four deployment models (Private cloud, Community cloud, Public cloud, and Hybrid
cloud).
Internet of Services (IoS)
The Internet of data evolved into the Internet of information which has now largely developed
into the Internet of Services (IoS). Web service interface and the service-oriented architecture
(SOA) are the key drivers of the concept of loosely coupling services used either for technologi-
cal or business purposes Schroth and Janner (2007). The application services available on these
platforms will connect people, objects and systems and further possess specific features such as
adaptability, support for collaborative use and diverse mobile end devices, process deployment
along the lines of the App stores model, and should provide safety, security and reliability guar-
antee Kagermann et al. (2013). This can be illustrated using a human-system or system-system
interaction. For example, if a group of tourists decide to travel from point A to point B, there are
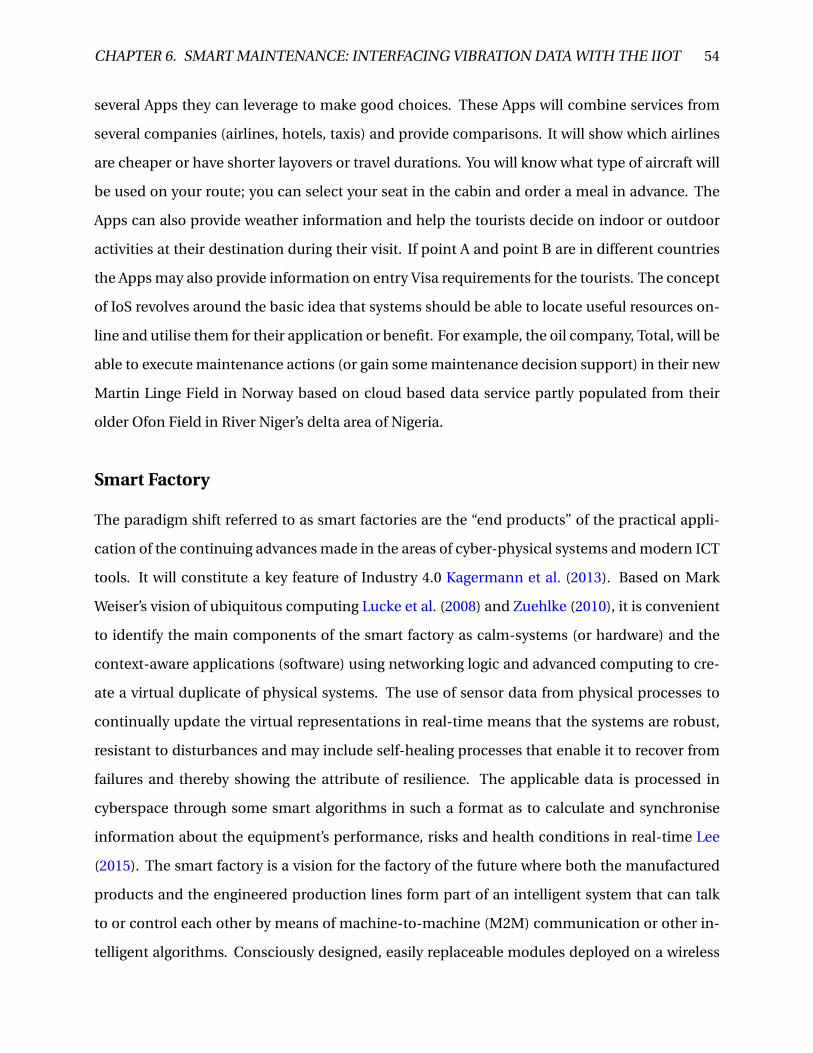
CHAPTER 6. SMART MAINTENANCE: INTERFACING VIBRATION DATA WITH THE IIOT 54
several Apps they can leverage to make good choices. These Apps will combine services from
several companies (airlines, hotels, taxis) and provide comparisons. It will show which airlines
are cheaper or have shorter layovers or travel durations. You will know what type of aircraft will
be used on your route; you can select your seat in the cabin and order a meal in advance. The
Apps can also provide weather information and help the tourists decide on indoor or outdoor
activities at their destination during their visit. If point A and point B are in different countries
the Apps may also provide information on entry Visa requirements for the tourists. The concept
of IoS revolves around the basic idea that systems should be able to locate useful resources on-
line and utilise them for their application or benefit. For example, the oil company, Total, will be
able to execute maintenance actions (or gain some maintenance decision support) in their new
Martin Linge Field in Norway based on cloud based data service partly populated from their
older Ofon Field in River Niger’s delta area of Nigeria.
Smart Factory
The paradigm shift referred to as smart factories are the “end products” of the practical appli-
cation of the continuing advances made in the areas of cyber-physical systems and modern ICT
tools. It will constitute a key feature of Industry 4.0 Kagermann et al. (2013). Based on Mark
Weiser’s vision of ubiquitous computing Lucke et al. (2008) and Zuehlke (2010), it is convenient
to identify the main components of the smart factory as calm-systems (or hardware) and the
context-aware applications (software) using networking logic and advanced computing to cre-
ate a virtual duplicate of physical systems. The use of sensor data from physical processes to
continually update the virtual representations in real-time means that the systems are robust,
resistant to disturbances and may include self-healing processes that enable it to recover from
failures and thereby showing the attribute of resilience. The applicable data is processed in
cyberspace through some smart algorithms in such a format as to calculate and synchronise
information about the equipment’s performance, risks and health conditions in real-time Lee
(2015). The smart factory is a vision for the factory of the future where both the manufactured
products and the engineered production lines form part of an intelligent system that can talk
to or control each other by means of machine-to-machine (M2M) communication or other in-
telligent algorithms. Consciously designed, easily replaceable modules deployed on a wireless
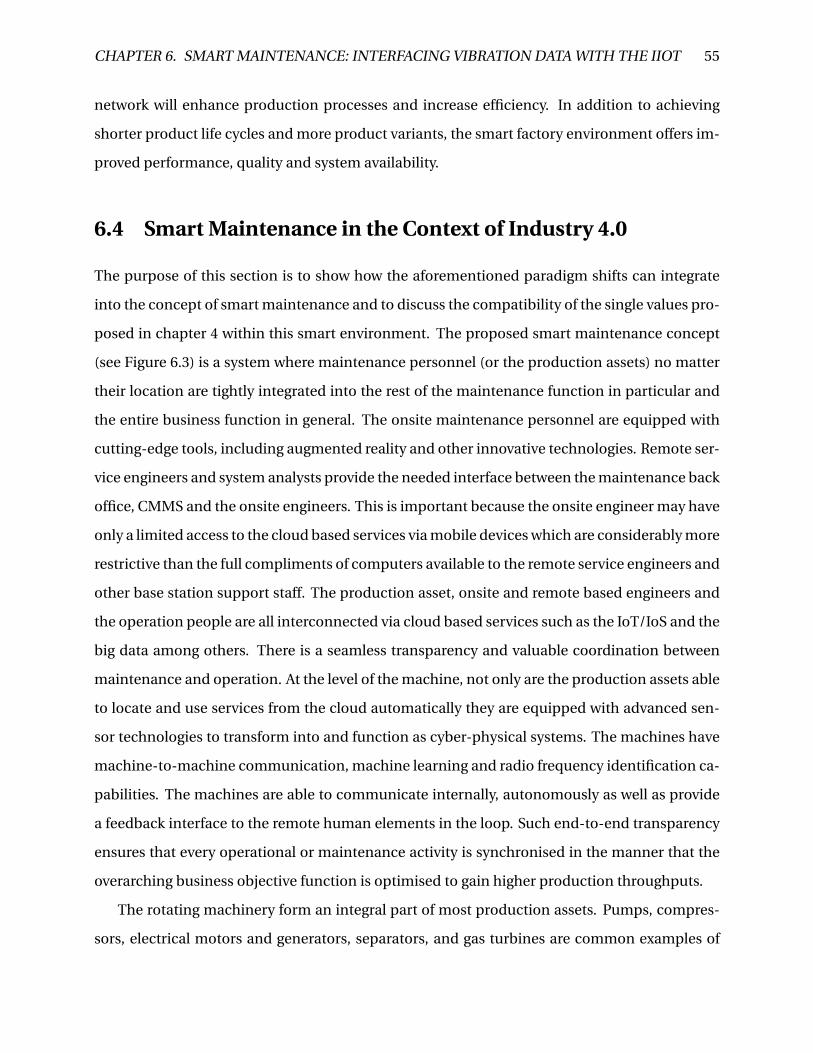
CHAPTER 6. SMART MAINTENANCE: INTERFACING VIBRATION DATA WITH THE IIOT 55
network will enhance production processes and increase efficiency. In addition to achieving
shorter product life cycles and more product variants, the smart factory environment offers im-
proved performance, quality and system availability.
6.4 Smart Maintenance in the Context of Industry 4.0
The purpose of this section is to show how the aforementioned paradigm shifts can integrate
into the concept of smart maintenance and to discuss the compatibility of the single values pro-
posed in chapter 4 within this smart environment. The proposed smart maintenance concept
(see Figure 6.3) is a system where maintenance personnel (or the production assets) no matter
their location are tightly integrated into the rest of the maintenance function in particular and
the entire business function in general. The onsite maintenance personnel are equipped with
cutting-edge tools, including augmented reality and other innovative technologies. Remote ser-
vice engineers and system analysts provide the needed interface between the maintenance back
office, CMMS and the onsite engineers. This is important because the onsite engineer may have
only a limited access to the cloud based services via mobile devices which are considerably more
restrictive than the full compliments of computers available to the remote service engineers and
other base station support staff. The production asset, onsite and remote based engineers and
the operation people are all interconnected via cloud based services such as the IoT/IoS and the
big data among others. There is a seamless transparency and valuable coordination between
maintenance and operation. At the level of the machine, not only are the production assets able
to locate and use services from the cloud automatically they are equipped with advanced sen-
sor technologies to transform into and function as cyber-physical systems. The machines have
machine-to-machine communication, machine learning and radio frequency identification ca-
pabilities. The machines are able to communicate internally, autonomously as well as provide
a feedback interface to the remote human elements in the loop. Such end-to-end transparency
ensures that every operational or maintenance activity is synchronised in the manner that the
overarching business objective function is optimised to gain higher production throughputs.
The rotating machinery form an integral part of most production assets. Pumps, compres-
sors, electrical motors and generators, separators, and gas turbines are common examples of
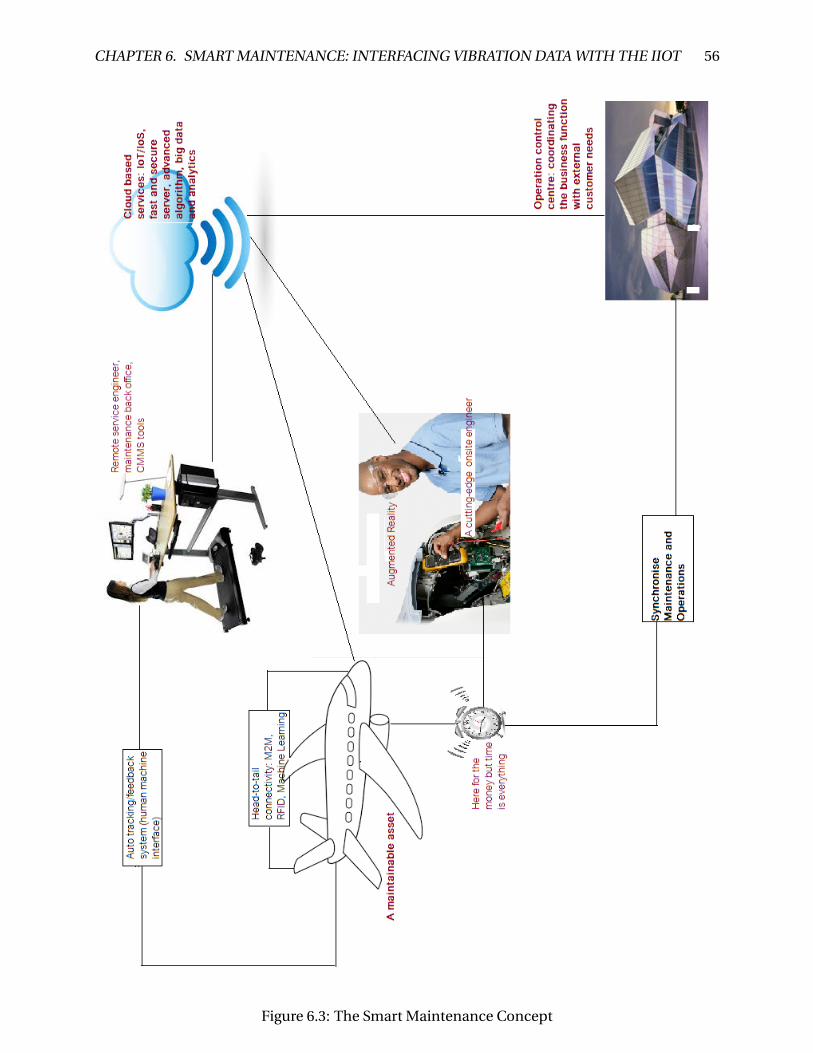
CHAPTER 6. SMART MAINTENANCE: INTERFACING VIBRATION DATA WITH THE IIOT 56
Figure 6.3: The Smart Maintenance Concept

CHAPTER 6. SMART MAINTENANCE: INTERFACING VIBRATION DATA WITH THE IIOT 57
rotating machinery used in industries. The use of vibration analysis for purposes of condition
monitoring and diagnostics has been very successful within standalone systems in conventional
applications. However, the concept of smart maintenance based on Industry 4.0 requires an ex-
tensive use of data. The challenge is to present the data in a format that is compatible with the
design philosophies and the reference architecture for the Industrial Internet of Things (IIoT).
This report has provided an initial proposal for tackling the stated challenge. It further shows a
technique that makes use of structured data to implement systems prognosis based on the fre-
quency spectrum of vibration data. The procedure outlined for implementing predictive main-
tenance was simple but a limited amount of data was used. That limitation makes it difficult
to argue that the results obtained would be valid in all circumstances. The next phase of im-
provement must utilise a more extensive data coverage that would help determine the degree
of accuracy of the results of the prognosis. In addition to expanding the data coverage, there is
a need to calculate and provide the confidence intervals associated with every prediction. The
gradual progression from condition monitoring to condition based maintenance and predictive
maintenance up to prescriptive maintenance is both worthy and realisable within the sphere of
smart maintenance. In order for the idea to reach a proven technology and a regulatory level
of service there has to be a consciously targeted effort by all sectors to improve the techniques
for measuring parameters and running the analysis. A further refinement of the ideas proposed
in this report to a point of filing for a patent is recommended along with the inclusion of those
partner companies who are willing to set up pilot services to validate the proposed ideas.
Chapter 7
Discussion and Conclusion
7.1 Discussion
Condition monitoring is intended to measure the current status of an operational item but it
does not automatically imply that a predictive maintenance policy is in place. There has to be
a system that receives the parameter values measured by the condition monitoring technique
and utilise these values as an input to the predictive maintenance strategy. A condition moni-
toring programme is an irreducible minimum for the predictive maintenance strategy to hold
but a successful predictive maintenance concept is a consciously applied policy. The evolv-
ing paradigms of the Industrial Internet of Things (IIoT) gives credence to the prediction of the
4th industrial revolution which was first identified in Germany as Industry 4.0. The disruptive
nature of an industrial revolution means that there will be a shift in the general ways of do-
ing things and there has been discussions in the maintenance engineering communities as per
the impacts of these shifts in practice. The relevance of this report and the results obtained
from the investigations are grounded in the reach to provide some basic proposals on how to
structure and analyse vibration data for the purpose of predictive maintenance and systems
prognosis. It is expected to be a means to bridge the state-of-the-art in maintenance and the
future maintenance practice which is smart by its perspective and data driven by application. It
was established that the frequency spectrum correctly captures the vibration energy in the ro-
tating machinery when subjected to vibration analysis. The use of frequency peaks in spectral
analysis for trending provided better results than conventional trended overall values. Spectral
58
CHAPTER 7. DISCUSSION AND CONCLUSION 59
analysis provides a means to separate a complex vibration time waveform into its component
frequency spectra which in turn offer the benefit to identify and isolate specific frequencies re-
sulting from each and every component in a complex rotating machine. This was traditionally
used for troubleshooting and diagnosis. The investigations conducted for this thesis revealed
that these frequency peaks can also be used to predict the future behavioural patterns of the ro-
tating machinery and estimate its future vibration severity based on ordinary linear regression.
The case study used was based on data downloaded from the database of the industry part-
ner to this thesis project. The particular data-set used for the case study came from a roller
bearing which formed part of a thruster assembly on a drill ship. The relevant data used for
the regression analysis had a span of eight periods. The interval between two successive peri-
ods was approximately six months. When a first order linear regression analysis was conducted
based on the data from the eight periods (that is only 8 observations), a prediction model was
established. From the regression analysis, the model for predicting the next period’s expected
vibration severity was derived as 1.096117 + 0.795704 * Yt (where Yt is the vibration severity of
the most recent survey period.) The model predicted the vibration severity for period 9 as 4.96
millimetres per second. If this mathematical model is validated to hold true in similar operat-
ing conditions it becomes easy to write an algorithm that is capable of implementing system
prognosis. The derived model has the limitation that it was based only on 8 observations which
is grossly insufficient. The framework nonetheless provides a basis for further investigations as
more data become available. With only a few data points, it was only reasonable to run a linear
regression. However, in another report Chudnovsky et al. (2008) suggested that the quadratic
model offered better results than linear ones. This report lacked sufficient data to either con-
firm or refute the claim that quadratic models are better than linear models. The strength of this
investigation is that it has provided a proposal which can be easily adapted to create models
which can be used for predictive maintenance and prognosis as the sensor technology contin-
ues to revolutionise condition monitoring whilst also driving both the big data and big data
analytics for the smart maintenance applications.

CHAPTER 7. DISCUSSION AND CONCLUSION 60
7.2 Conclusions
The acceptance of two peer-reviewed papers based on this study for presentation at two in-
ternational conferences is a proof of the report’s originality, solidity and informativity. The de-
rived mathematical model for predicting the future vibration severity was based on single values
which are compliant with the proposed Industry 4.0 reference architecture. The vibration data
stored, processed and analysed in the compliant format helps to populate the big data which in
turn is used for the data driven smart maintenance with a great descriptive accuracy, predictive
powers and prescriptive capabilities. Through the use of case studies, the sub-objectives of the
thesis were met. Condition monitoring was shown to be a safe cost cutting mechanism. The
possible approaches that can be used to integrate vibration analysis with the Industrial Internet
of Things were outlined in the context of smart maintenance.
Appendix A
Acronyms
3DP Three Dimensional Printing
5S Sort, Straighten, Shine, Standardise and Sustain
AMOS Aircraft Maintenance and Engineering System
ANN Artificial Neural Network
ARMA Autoregressive Moving Average
ATA Airline Transport Association
BBN Bayesian Belief Network
CAD Computer Aided Design
CAMP Computerised Aircraft Maintenance Program
CBM Condition Based Maintenance
CC Cloud Computing
CCT Continuous on-Condition Task
CI Confidence Interval
CMMS Computerised Maintenance Management System
61
APPENDIX A. ACRONYMS 62
CPM Cycles per minute
CPS Cycles per second
CPS Cyber-Physical Systems
DDPdM Data Driven Predictive Maintenance
DoD Department of Defense
DOM Design-Out-Maintenance
ECTM Engine Condition Trend Monitoring
EFFRA The European Factories of the Future Research Association
EUC Equipment Under Consideration
FFA Functional Failure Analysis
FFT Fast Fourier Transform
FMEA Failure Mode and Effects Analysis
FMECA Failure Mode, Effects and Criticality Analysis
FoF Factories of the Future
FOM Force of Mortality
FRACAS Failure Reporting, Analysis, and Corrective Action System
GTE Gas Turbine Engine
IaaS Infrastructure as a Service
ICT Information & Communications Technology
IMS Inventory Management System
IoS Internet of Services
APPENDIX A. ACRONYMS 63
IoT Internet of Things
IP Internet Protocol
IR infra red
ISO International Standards Organisation
KET Key Enabling Technology
KPI Key Performance Indicator
LCC Life Cycle Cost
LCP Life Cycle Profit
M2M machine-to-machine
MCA Motor Circuit Analysis
MiRA The Mixed Reality Application
MSI Maintenance Significant Item
MTBR Mean Time Between Repair
MTTF Mean Time To Failure
MTTR Mean Time To Repair
NIST National Institute of Standards and Technology
NTNU Norges Teknisk-Naturvitenskapelige Universitet (Norwegian University of Science & Tech-
nology)
OEE Overall Equipment Effectiveness
OEM Original Equipment Manufacturer
PaaS Platform as a Service
APPENDIX A. ACRONYMS 64
PDCA Plan-Do-Check-Adjust
PdM Predictive Maintenance
PM Preventive Maintenance
PPP Public Private Partnership
R & D Research & Development
R & I Research & Innovation
RAC Reliability Analysis Center
RAMS Reliability, Availability, Maintainability and Safety
RCM Reliability Centred Maintenance
rms root mean square
RPM revolutions per minute
RTF Run to Failure
SAP Systems Applications and Products
SCT Scheduled on-Condition Task
SFT Scheduled Function Test
SOA Service-oriented architecture
SOH Scheduled Overhaul
SRP Scheduled Replacement
TPM Total Productive Maintenance
TQM Total Quality Management
TSN Time Since New

APPENDIX A. ACRONYMS 65
US ultra sound
VFD Variable-Frequency Drive
Appendix B
Figures from the ISO 10816-1:1995(E) and
Karsten Moholt
B.1 General form of vibration velocity acceptance criteria
B.2 Comparison of vector change and change in magnitude for
a discrete frequency component
B.3 Vibration analysis flow chart
66
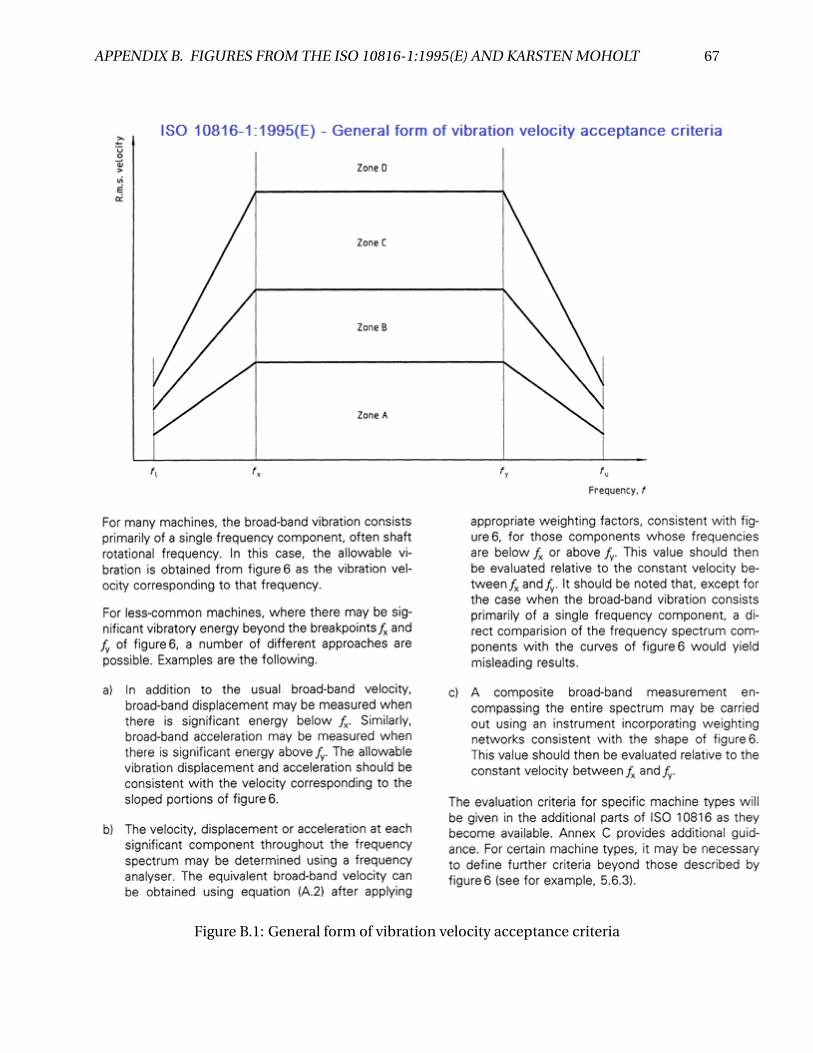
APPENDIX B. FIGURES FROM THE ISO 10816-1:1995(E) AND KARSTEN MOHOLT 67
Figure B.1: General form of vibration velocity acceptance criteria
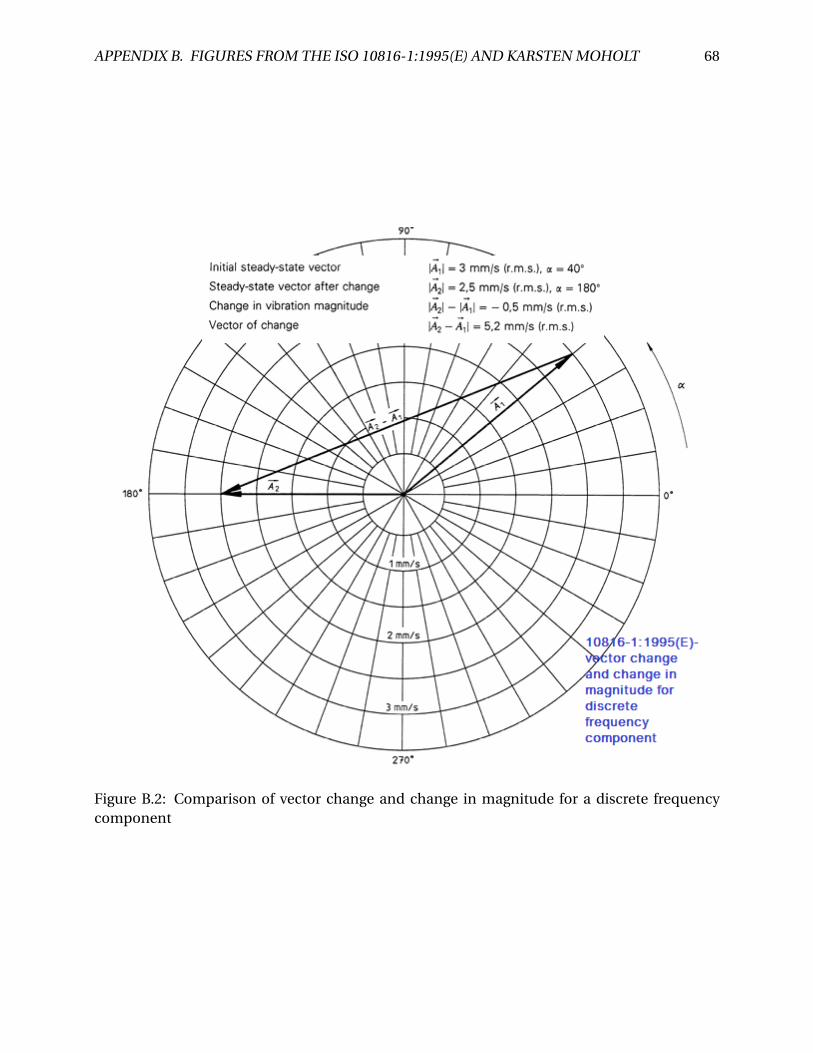
APPENDIX B. FIGURES FROM THE ISO 10816-1:1995(E) AND KARSTEN MOHOLT 68
Figure B.2: Comparison of vector change and change in magnitude for a discrete frequencycomponent
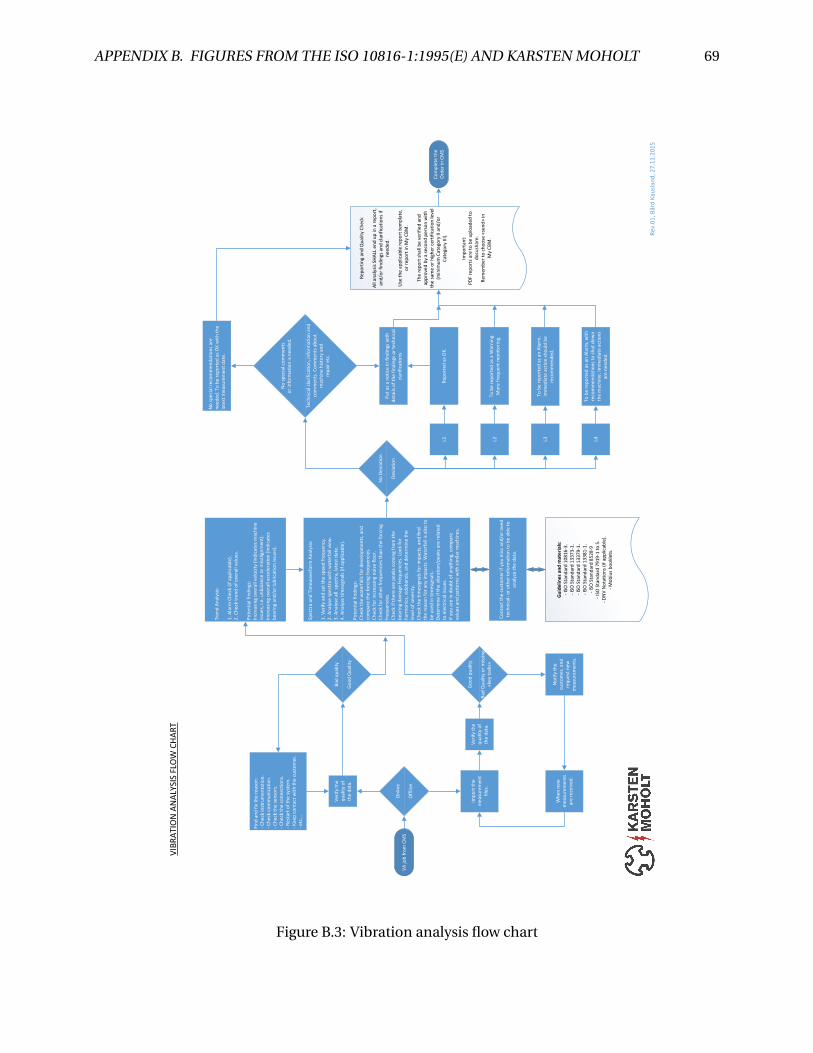
APPENDIX B. FIGURES FROM THE ISO 10816-1:1995(E) AND KARSTEN MOHOLT 69
VA
jo
b f
rom
CM
S
On
lin
e
Off
line
Tre
nd
An
aly
sis:
1.
Ala
rm C
he
ck (
if a
pp
lica
ble
).
2.
Ch
eck
tre
nd
of
ove
rall
va
lue
s.
Po
ten
tia
l fin
din
gs:
Incr
ea
sin
g o
ve
rall
ve
loci
ty (
ind
ica
tes
ma
chin
e
issu
es,
i.e
. u
nb
ala
nce
or
mis
alig
nm
en
t).
Incr
ea
sin
g o
ve
rall
acc
ele
rati
on
(in
dic
ate
s
be
ari
ng
an
d/o
r lu
bri
cati
on
iss
ue
s).
Co
mp
lete
th
e
Ord
er
in C
MS
L2
Imp
ort
th
e
me
asu
rem
en
t
file
s.
L3
No
De
via
tio
n
De
via
tio
n
Re
po
rtin
g a
nd
Qu
alit
y C
he
ck
All
an
aly
sis
SH
ALL
en
d u
p i
n a
re
po
rt,
an
d/o
r fi
nd
ing
s a
nd
cla
rifi
cati
on
s if
ne
ed
ed
.
Use
th
e a
pp
lica
ble
re
po
rt t
em
pla
te,
or
rep
ort
in M
y C
BM
.
Th
e r
ep
ort
sh
all
be
ve
rifi
ed
an
d
ap
pro
ve
d b
y a
se
con
d p
ers
on
wit
h
the
sa
me
or
hig
he
r ce
rtif
ica
tio
n le
ve
l
(min
imu
m C
ate
go
ry I
I a
nd
/or
Ca
teg
ory
III
).
Imp
ort
an
t:
PD
F r
ep
ort
s a
re t
o b
e u
plo
ad
ed
to
do
cush
are
.
Re
me
mb
er
to c
ho
ose
«se
nd
» in
My C
BM
.
VIB
RA
TIO
N A
NA
LYS
IS F
LOW
CH
AR
T
L1
Re
v.0
1,
Bå
rd K
au
sla
nd
, 2
7.1
1.2
01
5
No
sp
eci
al r
eco
mm
en
da
tio
ns
are
ne
ed
ed
. T
o b
e r
ep
ort
ed
as
OK
wit
h t
he
late
st m
ea
sure
me
nt
da
te.
Sp
ect
ra a
nd
Tim
ew
av
efo
rm A
na
lysi
s:
1.
Ve
rify
an
d s
et
the
sp
ee
d f
req
ue
ncy
.
2.
An
aly
se s
pe
ctra
wit
h w
ate
rfa
ll v
iew
.
3.
An
aly
se a
ll sp
ect
ra,
late
st d
ate
.
4.
An
aly
se t
ime
sig
na
ls (
if a
pp
lica
ble
).
Po
ten
tia
l fin
din
gs:
Ch
eck
th
e w
ate
rfa
lls f
or
de
ve
lop
me
nts
, a
nd
com
pa
re t
he
fo
rcin
g f
req
ue
nci
es.
Ch
eck
fo
r in
cre
asi
ng
no
ise
flo
or.
Ch
eck
fo
r o
the
r fr
eq
ue
nci
es
tha
n t
he
fo
rcin
g
fre
qu
en
cie
s.
Ch
eck
if
the
re a
re p
ea
ks
com
ing
fro
m t
he
be
ari
ng
da
ma
ge
fre
qu
en
cie
s. L
oo
k f
or
ha
rmo
nic
s, s
ide
ba
nd
s, a
nd
de
term
ine
th
e
lev
el o
f se
ve
rity
.
Ch
eck
th
e t
ime
sig
na
ls f
or
imp
act
s, a
nd
fin
d
the
re
aso
n f
or
an
y i
mp
act
s. W
ate
rfa
ll is
als
o t
o
be
use
d in
tim
esi
gn
als
.
De
term
ine
if t
he
vib
rati
on
/pe
aks
are
re
late
d
to e
lect
rica
l is
sue
s.
If y
ou
are
in d
ou
bt
of
an
yth
ing
, co
mp
are
va
lue
s a
nd
pa
tte
rns
wit
h s
imil
ar
ma
chin
es.
To
be
re
po
rte
d a
s a
Wa
rnin
g.
Mo
re f
req
ue
nt
mo
nit
ori
ng
.
Re
po
rte
d a
s O
K.
To
be
re
po
rte
d a
s a
n A
larm
.
Imm
ed
iate
act
ion
sh
ou
ld b
e
reco
mm
en
de
d.
Go
od
qu
ali
ty
Ba
d Q
ua
lity
or
mis
sin
g
«ke
y t
ask
s»
Ve
rify
th
e
qu
ali
ty o
f
the
da
ta.
No
tify
th
e
cust
om
er,
an
d
req
ue
st n
ew
me
asu
rem
en
ts.
Wh
en
ne
w
me
asu
rem
en
ts
are
re
ceiv
ed
.
Ve
rify
th
e
qu
ali
ty o
f
the
da
ta.
Ba
d q
ua
lity
Go
od
Qu
ali
ty
L4
To
be
re
po
rte
d a
s a
n A
larm
, w
ith
reco
mm
en
da
tio
ns
to s
hu
t d
ow
n
the
ma
chin
e.
Imm
ed
iate
act
ion
s
are
ne
ed
ed
.
Fin
d a
nd
fix
th
e r
ea
son
:
- C
he
ck i
nst
rum
en
tati
on
.
- C
he
ck c
om
mu
nic
ati
on
.
- C
he
ck t
he
se
nso
rs.
- C
he
ck t
he
co
nn
ect
ion
s.
- R
est
art
of
the
syst
em
.
- K
ee
p c
on
tact
wit
h t
he
cu
sto
me
r.
- e
tc..
.
Gu
ide
lin
es a
nd
ma
teria
ls:
- IS
O S
tan
da
rd 1
08
16
-3.
- IS
O S
tan
da
rd 1
33
73
-1.
- IS
O S
tan
da
rd 1
33
79
-1.
- IS
O S
tan
da
rd 1
33
81
-1.
- IS
O S
tan
da
rd 8
52
8-9
- IS
O S
tan
da
rd 7
91
9-1
to
5.
- D
NV
No
tati
on
s (i
f a
pp
lica
ble
).
- M
ob
ius
bo
okle
ts.
Pu
t a
s a
no
tice
in f
ind
ing
s w
ith
de
tail
s o
f th
e f
ind
ing
s o
r te
chn
ica
l
cla
rifi
cati
on
s.
Co
nta
ct t
he
cu
sto
me
r if
yo
u m
iss
an
d/o
r n
ee
d
tech
nic
al-
or
oth
er
info
rma
tio
n t
o b
e a
ble
to
an
aly
ze t
he
da
ta.
No
sp
eci
al c
om
me
nts
or
info
rma
tio
n is
ne
ed
ed
.
Te
chn
ica
l cl
ari
fica
tio
n,
info
rma
tio
n a
nd
com
me
nts
. C
om
me
nts
ab
ou
t
ma
chin
e h
isto
ry a
nd
rep
air
etc
.
Figure B.3: Vibration analysis flow chart
Bibliography
Abrahart, R. J. and See, L. (2000). Comparing neural network and autoregressive moving average
techniques for the provision of continuous river flow forecasts in two contrasting catchments.
Hydrological processes, 14(11-12):2157–2172.
ATA (2001). The Airline Handbook. Air Transport Association of America.
Attardi, L., Guida, M., and Pulcini, G. (2005). A mixed-weibull regression model for the analysis
of automotive warranty data. Reliability Engineering & System Safety, 87(2):265–273.
Bai, H., Ma, Z., and Zhu, Y. (2012). The application of cloud computing in smart grid status
monitoring. In Internet of Things, pages 460–465. Springer.
Borgan, Ø. (2005). Kaplan–meier estimator. Encyclopedia of biostatistics.
BS-5760-5 (1996). British standard: Reliability of constructed or manufactured products, sys-
tems, equipments and components.
Chudnovsky, B. H., Livshitz, A., and Chudnovsky, B. A. (2008). Thermal model of electrical con-
tacts based on experimental data. In 2008 Proceedings of the 54th IEEE Holm Conference on
Electrical Contacts, pages 205–211. IEEE.
Chukwuekwe, D., Schjølberg, P., Harald, R., and Alex, S. (2016). Reliable, robust and resilient
systems: Towards development of a predictive maintenance concept within the industry 4.0
environment. In 24th Biennial Euro Maintenance Conference, pages 1–11. EFNMS.
EN-13306 (2010). Maintenance terminology standards.
70
BIBLIOGRAPHY 71
Evans, P. C. and Annunziata, M. (2012). Industrial internet: Pushing the boundaries of minds
and machines. General Electric, page 21.
Fessler, J. A. and Sutton, B. P. (2003). Nonuniform fast fourier transforms using min-max inter-
polation. IEEE Transactions on Signal Processing, 51(2):560–574.
Gabbar, H. A., Yamashita, H., Suzuki, K., and Shimada, Y. (2003). Computer-aided rcm-based
plant maintenance management system. Robotics and Computer-Integrated Manufacturing,
19(5):449–458.
IEC-60812 (1985). Analysis techniques for system reliability – procedures for failure mode and
effect analysis (fmea).
ISO10816-1, I. (1995). Iso 10816-1: Mechanical vibration—evaluation of machine vibration by
measurements on non-rotating parts—part 1: General guidelines. ISO, Switzerland.
ISO10816-3, I. (2009). Iso 10816-3: Mechanical vibration—evaluation of machine vibration by
measurements on non-rotating parts—part 3: Industrial machines with nominal power above
15 kw and nominal speeds between 120 r/min and 15,000 r/min when measured in situ iso.
ISO, Switzerland.
ISO7919-1, I. (1996). Mechanical vibration of non-reciprocating machines - measurements on
rotating shafts and evaluation criteria—part 1: General guidelines. ISO, Switzerland.
Kagermann, H. et al. (2013). Recommendations for implementing the strategic initiative indus-
trie 4.0.
Khashei, M., Bijari, M., and Ardali, G. A. R. (2009). Improvement of auto-regressive integrated
moving average models using fuzzy logic and artificial neural networks (anns). Neurocom-
puting, 72(4):956–967.
Kuemmlee, H., Gross, T., and Kolerus, J. (2013). Machine vibrations and diagnostics the world
of iso. In Industry Applications Society 60th Annual Petroleum and Chemical Industry Confer-
ence, pages 1–13. IEEE.
BIBLIOGRAPHY 72
Lee, E. et al. (2008). Cyber physical systems: Design challenges. In Object Oriented Real-Time
Distributed Computing (ISORC), 2008 11th IEEE International Symposium on, pages 363–369.
IEEE.
Lee, J. (2015). Smart factory systems. Informatik-Spektrum, pages 1–6.
Lim, W., Zhang, D., Zhou, J., Belgi, P., and Chan, H. (2010). Vibration-based fault diagnostic plat-
form for rotary machines. In IECON 2010-36th Annual Conference on IEEE Industrial Elec-
tronics Society, pages 1404–1409. IEEE.
Lindqvist, B. H. (2006). On the statistical modeling and analysis of repairable systems. Statistical
science, pages 532–551.
Lindqvist, B. H. and Doksum, K. A. (2003). Mathematical and statistical methods in reliability,
volume 7. World Scientific.
Lindqvist, B. H. and Langseth, H. (2005). Statistical modelling and inference for component
failure times under preventive maintenance and independent censoring. Modern Statistical
and Mathematical Methods in Reliability (Wilson A, Limnios N, Keller-McNulty S, Armijo Y).
World Scientific Publishing, Singapore, pages 323–337.
Lu, B., Li, Y., Wu, X., and Yang, Z. (2009). A review of recent advances in wind turbine condition
monitoring and fault diagnosis. In Power Electronics and Machines in Wind Applications,
2009. PEMWA 2009. IEEE, pages 1–7. IEEE.
Lucke, D., Constantinescu, C., and Westkämper, E. (2008). Smart factory-a step towards the
next generation of manufacturing. In Manufacturing Systems and Technologies for the New
Frontier, pages 115–118. Springer.
Manyika, J., Chui, M., Brown, B., Bughin, J., Dobbs, R., Roxburgh, C., and Byers, A. H. (2011). Big
data: The next frontier for innovation, competition, and productivity.
Márquez, F. P. G., Tobias, A. M., Pérez, J. M. P., and Papaelias, M. (2012). Condition monitoring
of wind turbines: Techniques and methods. Renewable Energy, 46:169–178.
BIBLIOGRAPHY 73
McInerny, S. A. and Dai, Y. (2003). Basic vibration signal processing for bearing fault detection.
IEEE Transactions on education, 46(1):149–156.
Meeker, W. Q. and Escobar, L. A. (2014). Statistical methods for reliability data. John Wiley &
Sons.
Mell, P. and Grance, T. (2011). The nist definition of cloud computing.
MIL-STD-1629A (1980). Procedures for performing a failure mode, effects and criticality analy-
sis.
MIL-STD-2155 (1985). Procedures for performing a failure mode, effects and criticality analysis.
Mobley, R. K. (2002). An introduction to predictive maintenance. Butterworth-Heinemann.
Okoh, P. and Haugen, S. (2013). Maintenance-related major accidents: classification of causes
and case study. Journal of Loss Prevention in the Process Industries, 26(6):1060–1070.
Pascual, F. G. and Montepiedra, G. (2005). Lognormal and weibull accelerated life test plans
under distribution misspecification. IEEE Transactions on Reliability, 54(1):43–52.
Peng, C.-Y. and Tseng, S.-T. (2009). Mis-specification analysis of linear degradation models. IEEE
Transactions on Reliability, 58(3):444–455.
Rao, B. (1996). Handbook of condition monitoring. Elsevier.
Rausand, M. (2014). Reiability of Safety-Critical Systems: Theory and Applications. Wiley, Hobo-
ken, NJ.
Rausand, M. and Høyland, A. (2004). System Reliability Theory: Models, Statistical Methods, and
Applications. Wiley, Hoboken, NJ, 2nd edition.
Rausand, M. and Vatn, J. (2008). Reliability centred maintenance. In Complex system mainte-
nance handbook, pages 79–108. Springer.
Reason, J. T. and Reason, J. T. (1997). Managing the risks of organizational accidents, volume 6.
Ashgate Aldershot.
BIBLIOGRAPHY 74
SAE-ARP-5580 (2001). Recommended failure modes and effects analysis (fmea) practices for
non-automobile applications.
Scheffer, C. and Girdhar, P. (2004). Practical machinery vibration analysis and predictive main-
tenance. Elsevier.
Schroth, C. and Janner, T. (2007). Web 2.0 and soa: Converging concepts enabling the internet
of services. IT professional, 9(3):36–41.
Simeu-Abazi, Z. and Bouredji, Z. (2006). Monitoring and predictive maintenance: Modeling and
analysis of fault latency. Computers in industry, 57(6):504–515.
Vatn, J. (2007). Maintenance optimisation (ntnu lecture compendium).
Wang, W. (2008). Condition-based maintenance modelling. In Complex system maintenance
handbook, pages 111–131. Springer.
Wilson, A. (2002). Asset maintenance management: a guide to developing strategy & improving
performance. Industrial Press Inc.
Wilson, A. (2013). Asset Management: focusing on developing maintenance strategy and improv-
ing performance. Conference Communication.
Yan, L., Zhang, Y., Yang, L. T., and Ning, H. (2008). The Internet of things: from RFID to the
next-generation pervasive networked systems. CRC Press.
Zaal, T. M. and Newton, S. (2011). Profit-driven maintenance for physical assets. Maj Engineering
Publishing.
Zuehlke, D. (2010). Smartfactory—towards a factory-of-things. Annual Reviews in Control,
34(1):129–138.
Resume
Name: Douglas Okafor Chukwuekwe
Gender: Male
Date of birth: March 11, 1979
Address: Hårstadreina 2B, Tiller, 7092 Trondheim, Norway
Home address: Block 60 Flat 2, Ojokoro Estate, Ijaiye–Lagos, Nigeria
Nationality: Nigerian
Email (1): [email protected]
Email (2): [email protected]
Telephone: +47 457 94 884, +234 803 382 8105
Language Skills
English: Full professional proficiency
Igbo: Native or bilingual proficiency
Norwegian: Elementary proficiency
Education
• Norwegian University of Science and Technology (NTNU), Trondheim – MSc in RAMS
• Nigerian College of Aviation Technology, Zaria – Diploma in Aircraft Maintenance
• Nnamdi Azikiwe University, Awka – BEng in Electrical/Electronics Engineering
75
BIBLIOGRAPHY 76
Computer Skills
• Minitab, Latex and Microsoft packages
• Cara Fault Tree and Omnitrend
• Matlab/Simulink
• DIgSILENT Power Factory
Experience
• Research Assistant – 2015 summer job at the NTNU
• Teaching Assistant – NTNU courses (TPK4120, TPK4140 and TPG4200)
• Member of the Reference Group in TPK4140, TPK5160, TPG4200, TPK4126 and TPK5170
• President of International Students’ Union of Norway, ISU – Trondheim Local Chapter
• National Chairman of International Students’ Union of Norway, ISU – Norway
• Member of the Board, Industri Energi NTNU-Trondheim
• Member of the NTNU Students’ Parliament (2014 – 2015)
• Aircraft Maintenance Engineer – Arik Air Limited (2007 – 2014)
• Production & Planning Engineer – Bellview Airlines Limited (2005 – 2007)
Hobbies and Other Activities
• Reading, football, swimming and table tennis


Part 2: Peer-Reviewed Papers

Paper ONE

Reliable, Robust and Resilient Systems: Towards Development of a Predictive Maintenance Concept within the Industry 4.0 Environment
Douglas Okafor Chukwuekwe
Title:
Speaker:
Reliable, Robust and Resilient Systems: Towards Development of a Predictive Maintenance Concept within the Industry 4.0 Environment
Outline:o Industry 4.0: What is it?o Key Enabling Technologies (KETs)o Smart Things Everywhere, Even Smart
Maintenanceo The Maintenance Evolution within an
Industrial Revolutiono Key Benefits and some Challengeso Summary & Conclusions
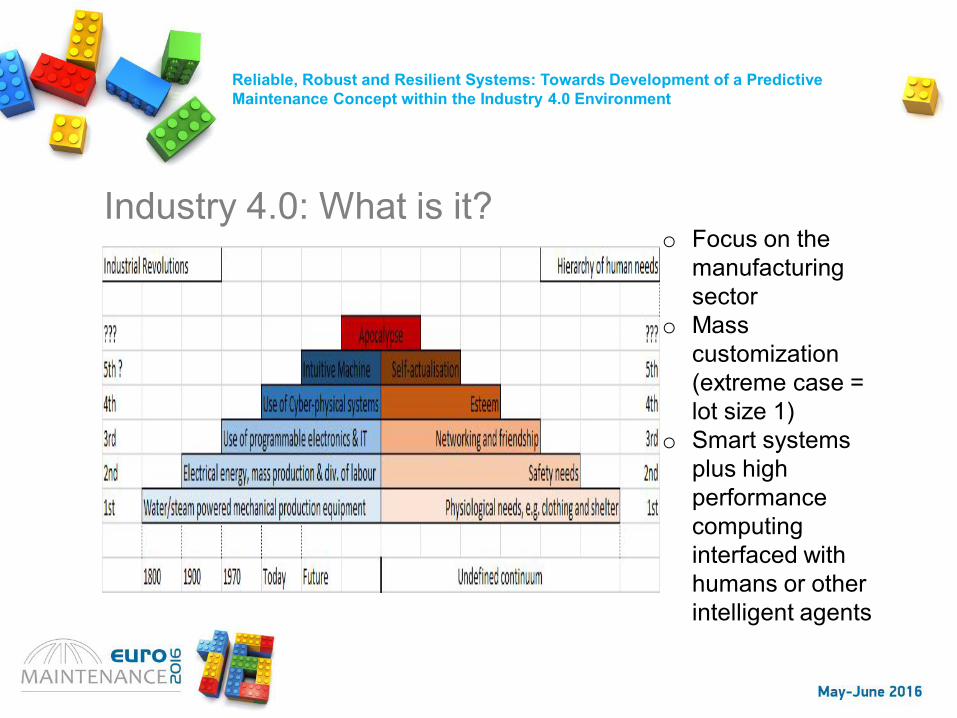
Reliable, Robust and Resilient Systems: Towards Development of a Predictive Maintenance Concept within the Industry 4.0 Environment
Industry 4.0: What is it?o Focus on the
manufacturing sector
o Mass customization (extreme case = lot size 1)
o Smart systems plus high performance computing interfaced with humans or other intelligent agents
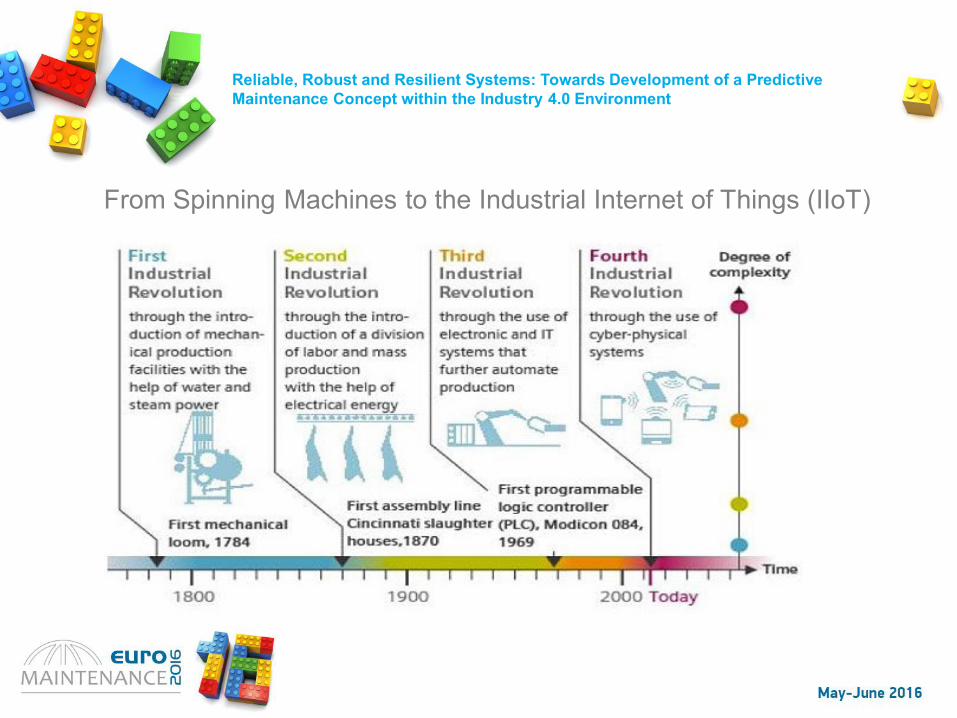
Reliable, Robust and Resilient Systems: Towards Development of a Predictive Maintenance Concept within the Industry 4.0 Environment
From Spinning Machines to the Industrial Internet of Things (IIoT)
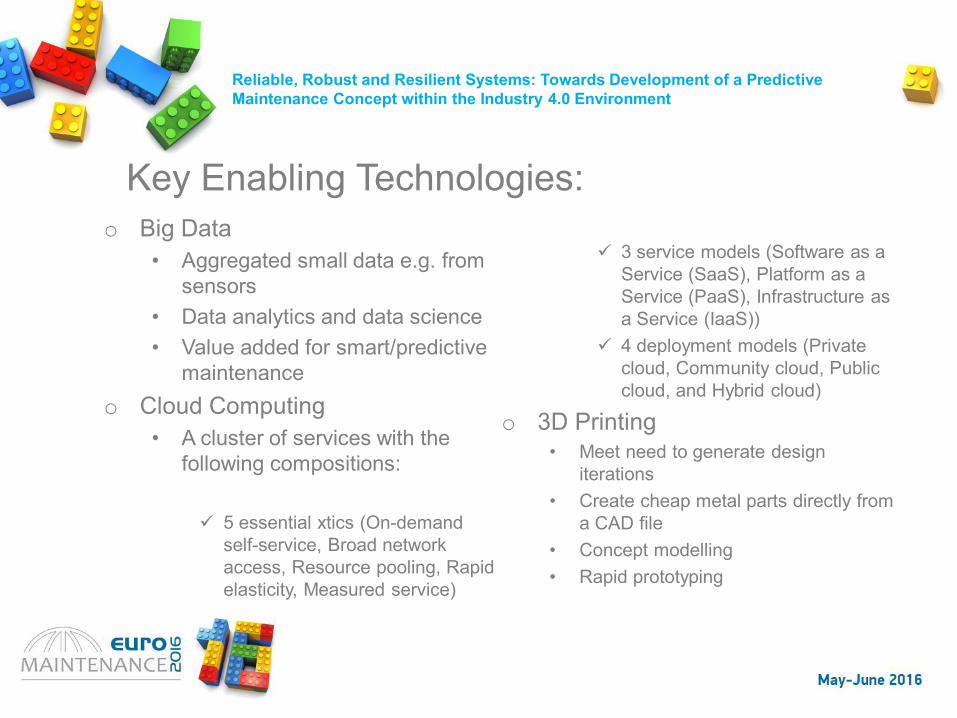
Reliable, Robust and Resilient Systems: Towards Development of a Predictive Maintenance Concept within the Industry 4.0 Environment
o Big Data• Aggregated small data e.g. from
sensors• Data analytics and data science• Value added for smart/predictive
maintenance o Cloud Computing
• A cluster of services with the following compositions:
5 essential xtics (On-demand self-service, Broad network access, Resource pooling, Rapid elasticity, Measured service)
3 service models (Software as a Service (SaaS), Platform as a Service (PaaS), Infrastructure as a Service (IaaS))
4 deployment models (Private cloud, Community cloud, Public cloud, and Hybrid cloud)
o 3D Printing• Meet need to generate design
iterations• Create cheap metal parts directly from
a CAD file• Concept modelling• Rapid prototyping
Key Enabling Technologies:
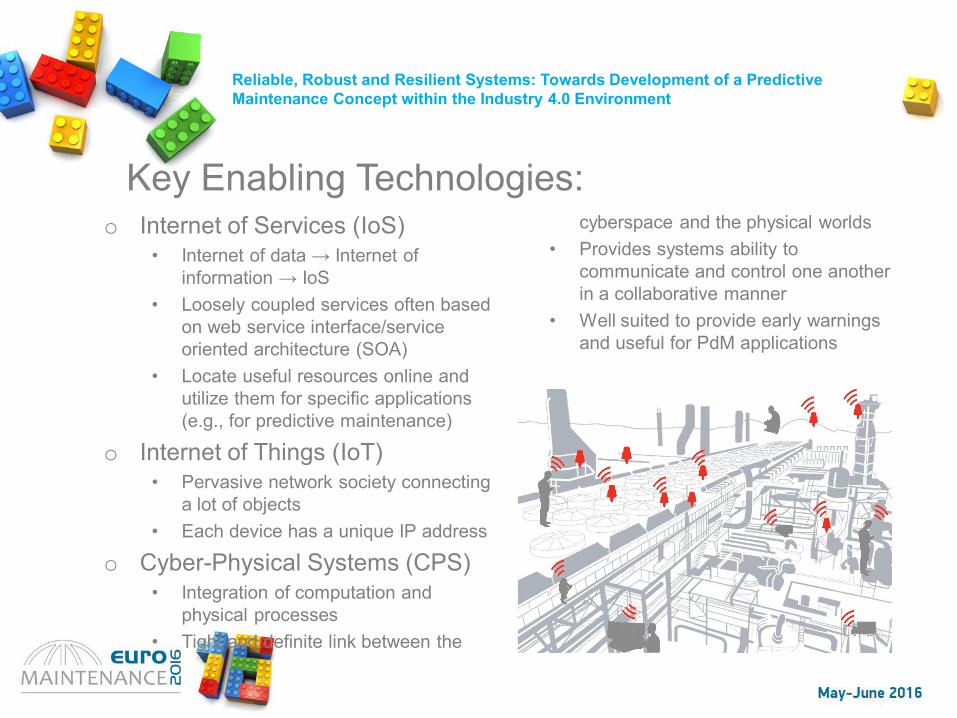
Reliable, Robust and Resilient Systems: Towards Development of a Predictive Maintenance Concept within the Industry 4.0 Environment
o Internet of Services (IoS)• Internet of data → Internet of
information → IoS• Loosely coupled services often based
on web service interface/service oriented architecture (SOA)
• Locate useful resources online and utilize them for specific applications (e.g., for predictive maintenance)
o Internet of Things (IoT)• Pervasive network society connecting
a lot of objects• Each device has a unique IP address
o Cyber-Physical Systems (CPS)• Integration of computation and
physical processes• Tight and definite link between the
cyberspace and the physical worlds• Provides systems ability to
communicate and control one another in a collaborative manner
• Well suited to provide early warnings and useful for PdM applications
Key Enabling Technologies:
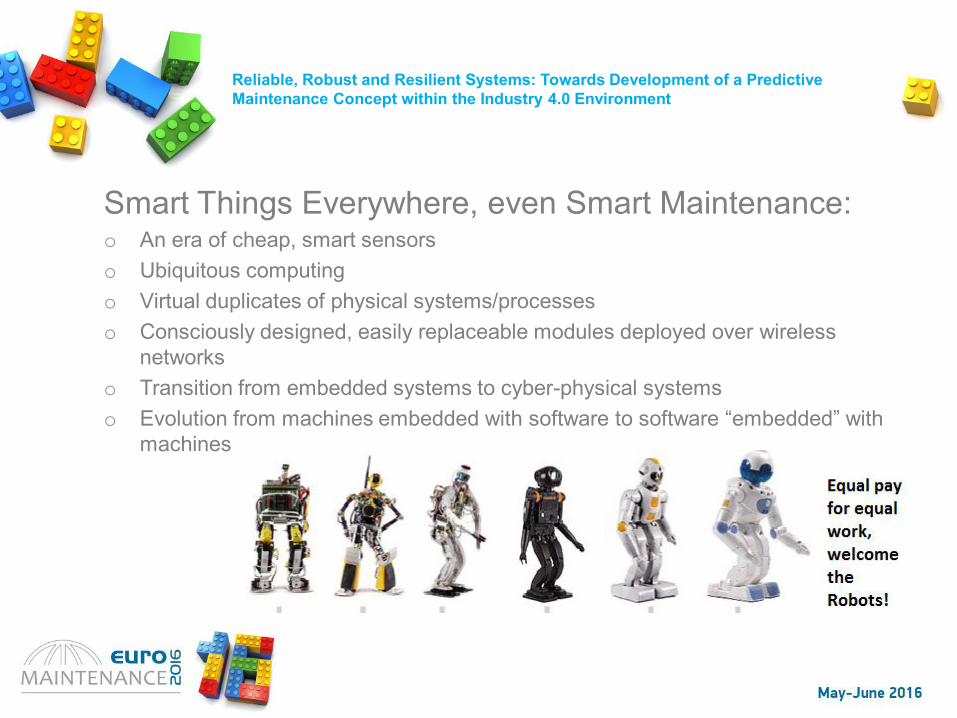
Reliable, Robust and Resilient Systems: Towards Development of a Predictive Maintenance Concept within the Industry 4.0 Environment
Smart Things Everywhere, even Smart Maintenance:o An era of cheap, smart sensorso Ubiquitous computingo Virtual duplicates of physical systems/processeso Consciously designed, easily replaceable modules deployed over wireless
networkso Transition from embedded systems to cyber-physical systemso Evolution from machines embedded with software to software “embedded” with
machines

Reliable, Robust and Resilient Systems: Towards Development of a Predictive Maintenance Concept within the Industry 4.0 Environment
The Maintenance Evolution in an Industrial Revolution:Maintenance Philosophies:o Corrective Maintenance → Run to failureo Preventive Maintenance → Planned maintenance based on the assumption that
every equipment will fail at some points!o Predictive Maintenance → Based on condition monitoring and following some
predefined rules and strategiesFuture Maintenance:o Data driven versus model based (a novel combination of both)o Greatly influenced by value added datao Diagnostics: Industry 3.0 machines featured BITEs but no system to add value
to the measurements or the symptoms detectedo The future is closed loop, feedback system with a prediction capabilityo Improved system knowledge, better work place safety, greater resource and
energy efficiencies.
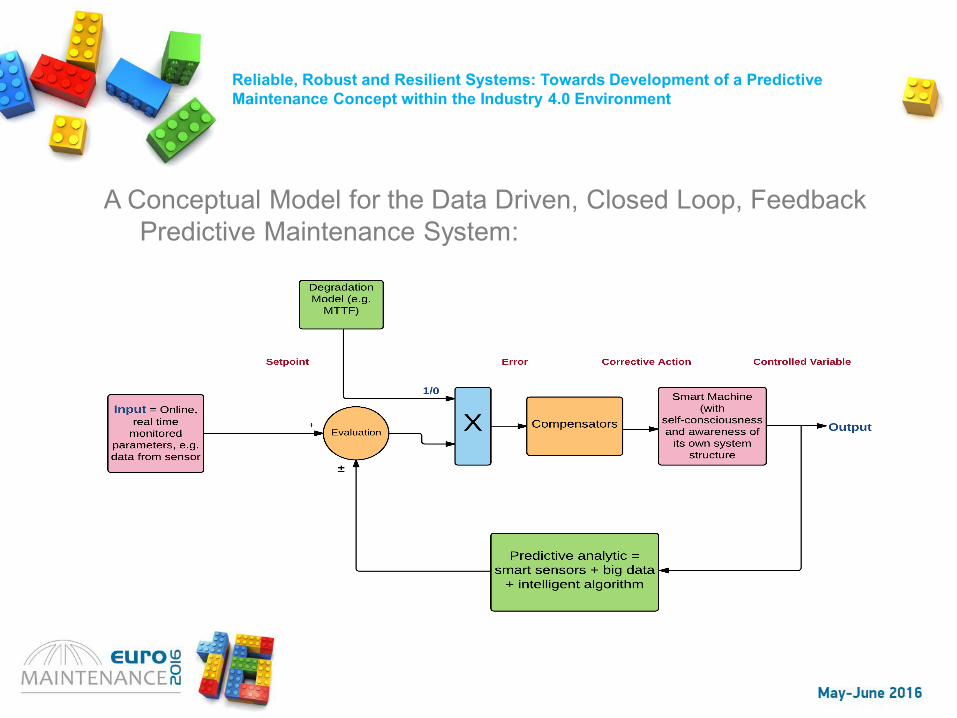
Reliable, Robust and Resilient Systems: Towards Development of a Predictive Maintenance Concept within the Industry 4.0 Environment
A Conceptual Model for the Data Driven, Closed Loop, Feedback Predictive Maintenance System:
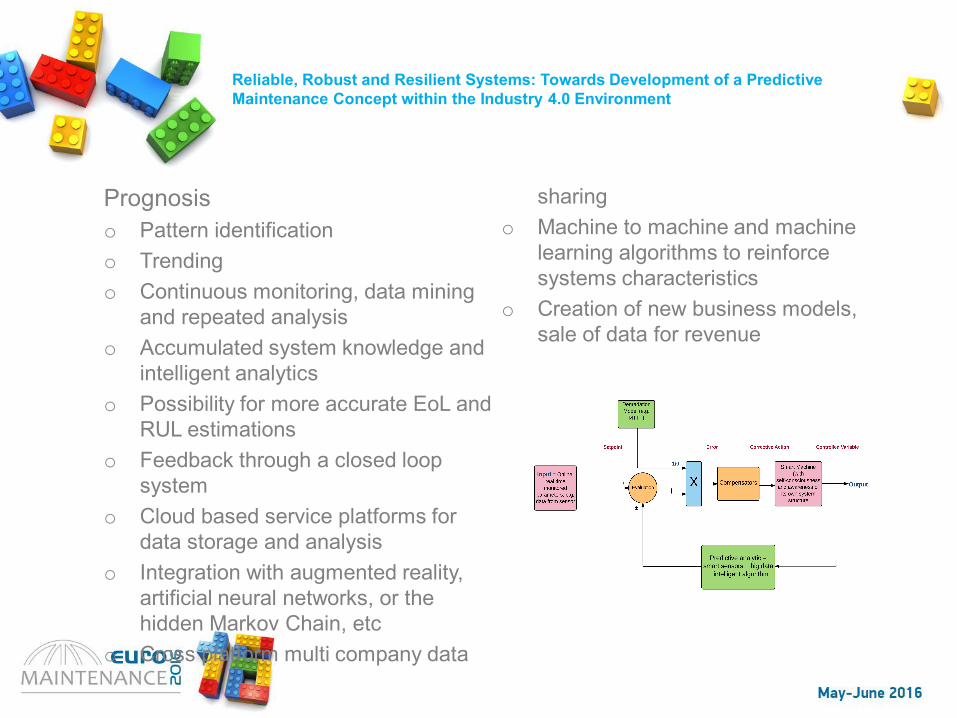
Reliable, Robust and Resilient Systems: Towards Development of a Predictive Maintenance Concept within the Industry 4.0 Environment
Prognosiso Pattern identificationo Trendingo Continuous monitoring, data mining
and repeated analysiso Accumulated system knowledge and
intelligent analyticso Possibility for more accurate EoL and
RUL estimations o Feedback through a closed loop
system o Cloud based service platforms for
data storage and analysiso Integration with augmented reality,
artificial neural networks, or the hidden Markov Chain, etc
o Cross platform multi company data
sharingo Machine to machine and machine
learning algorithms to reinforce systems characteristics
o Creation of new business models, sale of data for revenue
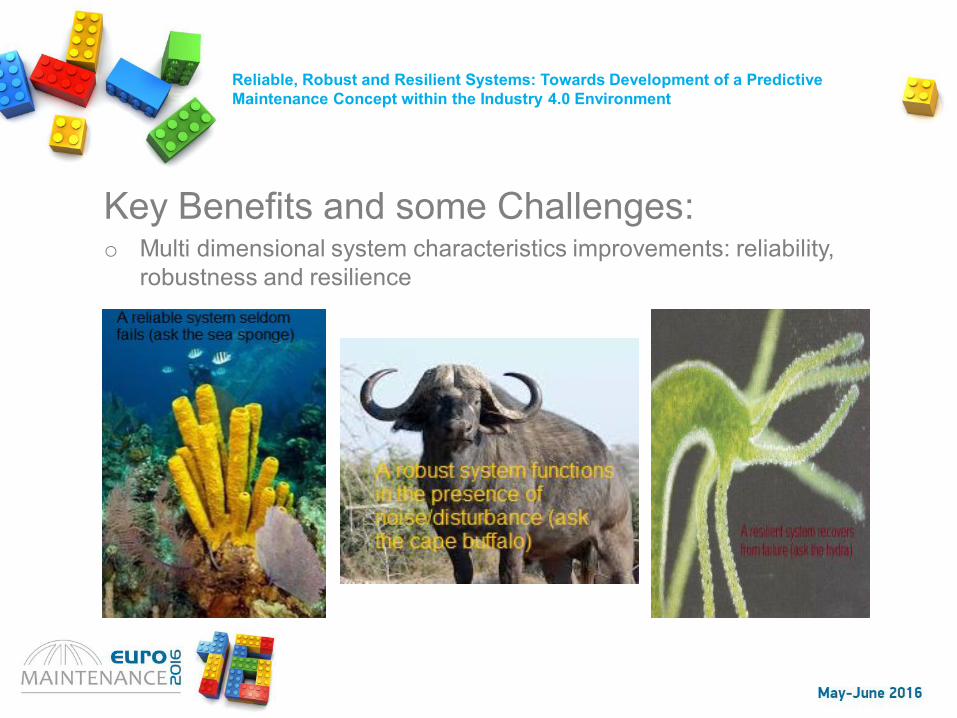
Reliable, Robust and Resilient Systems: Towards Development of a Predictive Maintenance Concept within the Industry 4.0 Environment
Key Benefits and some Challenges:o Multi dimensional system characteristics improvements: reliability,
robustness and resilience
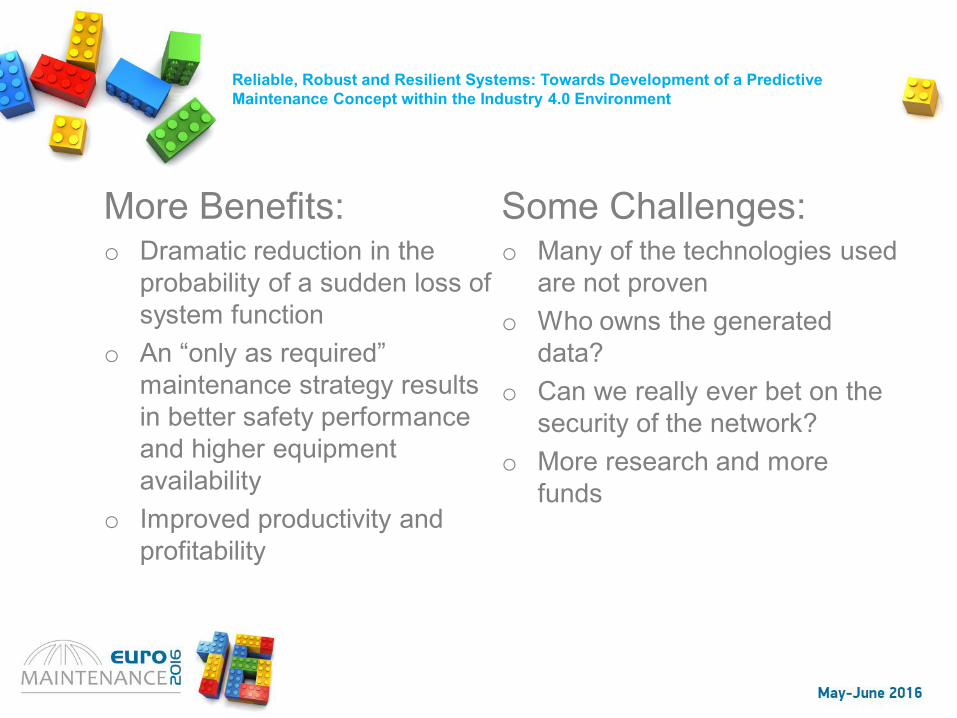
Reliable, Robust and Resilient Systems: Towards Development of a Predictive Maintenance Concept within the Industry 4.0 Environment
More Benefits:o Dramatic reduction in the
probability of a sudden loss of system function
o An “only as required” maintenance strategy results in better safety performance and higher equipment availability
o Improved productivity and profitability
Some Challenges:o Many of the technologies used
are not proveno Who owns the generated
data?o Can we really ever bet on the
security of the network?o More research and more
funds
Reliable, Robust and Resilient Systems: Towards Development of a Predictive Maintenance Concept within the Industry 4.0 Environment
Summary & Conclusionso Presented an overview of Industry 4.0 and its
key driverso Demonstrated how maintenance is expected
to evolve within this shifting paradigmo Proposed a basic structure for a data-driven
predictive maintenance frameworko Argued for some benefits to credit the
proposed framework and highlighted a few challenges.
Reliable, Robust and Resilient Systems: Towards Development of a Predictive Maintenance Concept within the Industry 4.0 Environment
Thank you for listening
Reliable, Robust and Resilient Systems: Towards Development of a Predictive Maintenance Concept within the Industry 4.0 Environment
Douglas Okafor Chukwuekwe1, Per Schjølberg2, Harald Rødseth3, Alex Stuber4
1 Department of Production and Quality Engineering, NTNU, Norway, [email protected] 2 Department of Production and Quality Engineering, NTNU, Norway, [email protected] 3 Department of Production and Quality Engineering, NTNU, Norway, [email protected] 4 Academic Research & Education Network (AREN), Switzerland, [email protected]
Keywords – Big data, CPS, IoT, Prognosis, Smart Factory
Abstract
The world is at the threshold of yet another
industrial revolution. It is the 4th industrial
revolution presently being promoted as “Industry
4.0” in Germany or “Advanced Manufacturing” in
the USA. Both ideas are similar, in essence, they
refer to smart systems and high performance
computing interfaced with people. It was
previously dismissed as science fiction at its best
but there are now a few visible elements of
Industry 4.0 in practice. However the concept is
still in its formative stage and would take an
extensive troubleshooting and fine-tuning to
eventually come of age. The disruptive nature of
an industrial revolution means that it will affect our
general ways of life and means of livelihood. This
paper reviews the major technological drivers
(such as big data, cloud computing, cyber-
physical systems, Internet of Things and Internet
of Services) leading up to Industry 4.0 and
presents Smart Factory as its core beneficiary.
The paradigm shift driven by cheap and powerful
sensors/actuators, enhanced man-machine
interaction and ubiquitous computing will result in
a new approach to the maintenance of physical
assets. The challenge with routine or time-based
maintenance philosophies is that they have
potential to drive the cost of maintenance steeply
upwards. Predictive maintenance can cut
maintenance down only to the level necessary. It
is however not easy to determine this “necessary”
level but in the proposed Industry 4.0 reference
architecture it is important to factor in
maintenance from the early design stages of
equipment fabrication, assembly or integration so
that systems can benefit from predictive analytics.
Thus, the paper further presents a conceptual
framework for the development of a predictive
maintenance technique using big data mining and
smart algorithms. The significance is that
designers will gain some insights to reach the
ultimate goal of reliable, robust and resilient
systems offering equipment operators improved
life cycle benefits.
1. Introduction
The constant evolution of science means that it
continues to break new frontiers and reach new
horizons. The current hype about Industry 4.0
(Industrie 4.0 Working Group, 2013) has led to
some doubts and generated several debates
within the industry as well as the academia. It is
noted that unlike its three predecessors (Figure
1), Industry 4.0, commonly called the fourth
industrial revolution, is different from previous
industrial revolutions because it is orchestrated
through a consciously pursued effort which in
effect ‘forces’ its actual manifestation to speed up.
The orchestration of Industry 4.0 has been a joint
collaboration between government agencies, the
industry, research and academic institutions.
Germany and the USA are clearly in the lead to
bring about this next evolution in technological
applications though the Americans prefer the term
“advanced manufacturing.” There are equally
other terms in common use such as “Industrial
Internet” (Evans & Annunziata, 2012) or intelligent
factories but the basic ideas are in sync with
Industry 4.0, in essence, embodying smart
systems and high performance computing
interfaced with people.
Industry 4.0 is a strategic initiative that aims to
radically combine manufacturing, automation and
information & communications technology (ICT)
into a vertical network within one entity, network
two or more of such entities in a horizontal chain
to create organisational transparency and
seamless production. However novel, Industry 4.0
is not meant to be a tsunami that would sweep
away everything we already know overnight and
replace it with a brand new system instead it
would be an incremental development that would
survive through a period of transition based on
two main approaches. First, design effort aimed at
bridging the gap between Industry 3.0 practices
and Industry 4.0 ideas by adapting, modifying and
retrofitting that would take us initially to the
midpoint Industry 3.5. Second, pursuing a fully
innovative design concept based on the proposed
Industry 4.0 reference architecture. Result from
previous study by Industrie 4.0 Working Group,
2013 identified standardisation, work organisation
and product availability as the three major
challenges facing the implementation of Industry
4.0. Product availability is not only a function of
operation and maintenance it also depends on the
system’s characteristics such as its reliability,
robustness and resilience. In the next phase of
manufacturing evolution, the importance of these
characteristics for equipment effectiveness will
become more evident. Operators will place more
emphasis on their desire that engineered systems
should exhibit certain characteristic properties,
e.g., that they seldom fail (reliability), be able to
perform in the presence of noise and remain
elastic under changing load (robustness); and
autonomously recover from fault or failure
situations (resilience). Through the application of
big data mining techniques and smart algorithms
following the iteration concept proposed in this
paper, designers can achieve such system
characteristics. In the current paper, predictive
maintenance strategies are considered in the
context of Industry 4.0, but the approaches
advanced here will be influenced partly by current
practices. In the general scope, asset integrity
engineering and maintenance management
encompass the development of a maintenance
programme in line with production forecast, asset
utilization and best practices; dealing with
inventory management and logistic issues,
developing action plans to close previous findings
such as may have resulted from routine
inspections, condition monitoring, etc. Today’s
industrial environments aspire to optimize multiple
objectives and apply the computerized
maintenance management systems, CMMS, tools
to their benefit. Successful implementations of the
Intelligent Maintenance System (IMS), Failure
Reporting, Analysis, and Corrective Action
System (FRACAS), production planning
automation and allied advanced maintenance
tools historically depended on the use of the
CMMS. The Industry 4.0 engineered environment
will take the integration to a higher level and
provide a common platform to combine disparate
tools and create transparency across board.
The objective of the paper is to propose concepts
for predictive maintenance and prognosis within
an industry 4.0 environment and review how the
key drivers such as cloud computing, smart
factory, Cyber-physical systems, Internet of
Things, Internet of Services, Big Data, etc can
influence and shape the maintenance
management of the future. This is expected to
improve product availability and guarantee asset
integrity. The paper is structured as follows:
Section 2 presents basic materials on the key
drivers of Industry 4.0 and gives some
backgrounds; Section 3 presents the new
approach within Industry 4.0 referred to as the
smart factories; Section 4 proposes a theoretical
conceptual framework for implementing a data
driven predictive maintenance system within
Industry 4.0 environments; Section 5 states some
credits for the proposed predictive maintenance
structure and highlights key challenges and
recommended actions to overcome current
limitations; Section 6 concludes the paper with
some insights.
2. From Spinning Machines to Industry 4.0: The Trends and Drivers of an Industrial Evolution
The first industrial revolution started in the late
1700s (Figure 1, left hand side) following the
introduction of the spinning machine, conveyor
belt, and other machinery powered by water or
steam used mainly in the textile factories of that
era. It sounds valid to argue that the first industrial
revolution addressed some of man’s physiological
needs, increased food production through
mechanized agriculture and clothing from the
textile industries (Figure 1, right hand side).
Subsequent industrial revolutions equally showed
links with the Abraham Maslow’s hierarchy of
needs (Thielke, et al 2011). The second industrial
revolution which started at the dawn of the 20th
century was characterised by the use of electrical
machines for mass production and the division of
labour. This offered humanity both safety and
security. The third industrial revolution, sometimes
referred to as the digital revolution, began at the
early1970s with the increased automation of
manufacturing processes using advanced
electronics and ICT (information and
communication technology) techniques which led
to a better man-machine interface over process
networks. Technologies however evolve in a
continuous way. Today, the world has reached the
threshold of yet another industrial revolution.
Below we present a brief discussion on the key
technological drivers leading to Industry 4.0.
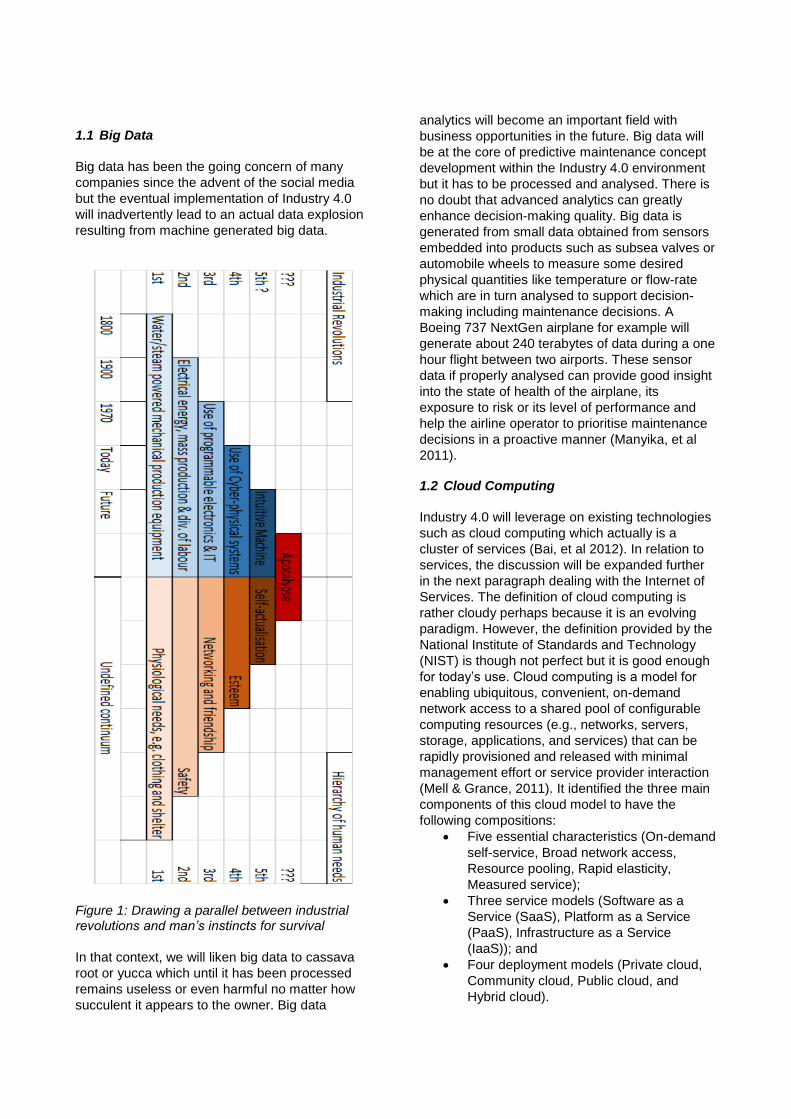
1.1 Big Data
Big data has been the going concern of many
companies since the advent of the social media
but the eventual implementation of Industry 4.0
will inadvertently lead to an actual data explosion
resulting from machine generated big data.
Figure 1: Drawing a parallel between industrial revolutions and man’s instincts for survival
In that context, we will liken big data to cassava
root or yucca which until it has been processed
remains useless or even harmful no matter how
succulent it appears to the owner. Big data
analytics will become an important field with
business opportunities in the future. Big data will
be at the core of predictive maintenance concept
development within the Industry 4.0 environment
but it has to be processed and analysed. There is
no doubt that advanced analytics can greatly
enhance decision-making quality. Big data is
generated from small data obtained from sensors
embedded into products such as subsea valves or
automobile wheels to measure some desired
physical quantities like temperature or flow-rate
which are in turn analysed to support decision-
making including maintenance decisions. A
Boeing 737 NextGen airplane for example will
generate about 240 terabytes of data during a one
hour flight between two airports. These sensor
data if properly analysed can provide good insight
into the state of health of the airplane, its
exposure to risk or its level of performance and
help the airline operator to prioritise maintenance
decisions in a proactive manner (Manyika, et al
2011). 1.2 Cloud Computing
Industry 4.0 will leverage on existing technologies
such as cloud computing which actually is a
cluster of services (Bai, et al 2012). In relation to
services, the discussion will be expanded further
in the next paragraph dealing with the Internet of
Services. The definition of cloud computing is
rather cloudy perhaps because it is an evolving
paradigm. However, the definition provided by the
National Institute of Standards and Technology
(NIST) is though not perfect but it is good enough
for today’s use. Cloud computing is a model for
enabling ubiquitous, convenient, on-demand
network access to a shared pool of configurable
computing resources (e.g., networks, servers,
storage, applications, and services) that can be
rapidly provisioned and released with minimal
management effort or service provider interaction
(Mell & Grance, 2011). It identified the three main
components of this cloud model to have the
following compositions:
Five essential characteristics (On-demand
self-service, Broad network access,
Resource pooling, Rapid elasticity,
Measured service);
Three service models (Software as a
Service (SaaS), Platform as a Service
(PaaS), Infrastructure as a Service
(IaaS)); and
Four deployment models (Private cloud,
Community cloud, Public cloud, and
Hybrid cloud).
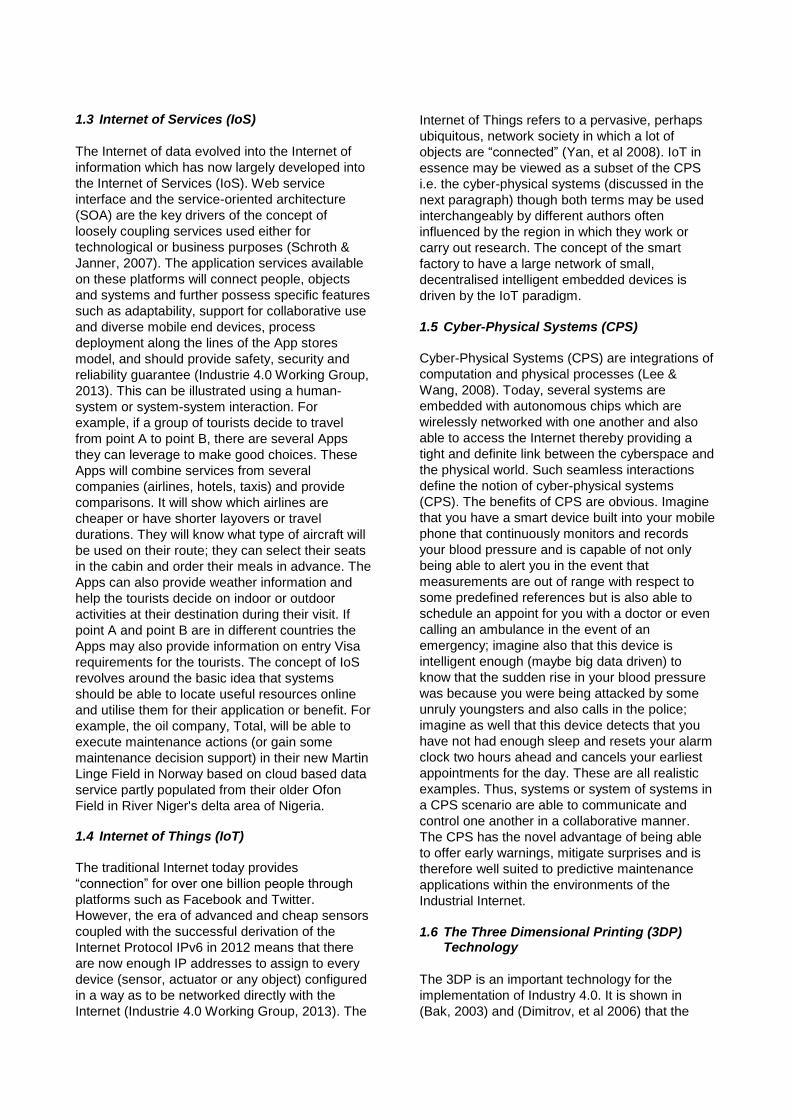
1.3 Internet of Services (IoS)
The Internet of data evolved into the Internet of
information which has now largely developed into
the Internet of Services (IoS). Web service
interface and the service-oriented architecture
(SOA) are the key drivers of the concept of
loosely coupling services used either for
technological or business purposes (Schroth &
Janner, 2007). The application services available
on these platforms will connect people, objects
and systems and further possess specific features
such as adaptability, support for collaborative use
and diverse mobile end devices, process
deployment along the lines of the App stores
model, and should provide safety, security and
reliability guarantee (Industrie 4.0 Working Group,
2013). This can be illustrated using a human-
system or system-system interaction. For
example, if a group of tourists decide to travel
from point A to point B, there are several Apps
they can leverage to make good choices. These
Apps will combine services from several
companies (airlines, hotels, taxis) and provide
comparisons. It will show which airlines are
cheaper or have shorter layovers or travel
durations. They will know what type of aircraft will
be used on their route; they can select their seats
in the cabin and order their meals in advance. The
Apps can also provide weather information and
help the tourists decide on indoor or outdoor
activities at their destination during their visit. If
point A and point B are in different countries the
Apps may also provide information on entry Visa
requirements for the tourists. The concept of IoS
revolves around the basic idea that systems
should be able to locate useful resources online
and utilise them for their application or benefit. For
example, the oil company, Total, will be able to
execute maintenance actions (or gain some
maintenance decision support) in their new Martin
Linge Field in Norway based on cloud based data
service partly populated from their older Ofon
Field in River Niger's delta area of Nigeria. 1.4 Internet of Things (IoT)
The traditional Internet today provides
“connection” for over one billion people through
platforms such as Facebook and Twitter.
However, the era of advanced and cheap sensors
coupled with the successful derivation of the
Internet Protocol IPv6 in 2012 means that there
are now enough IP addresses to assign to every
device (sensor, actuator or any object) configured
in a way as to be networked directly with the
Internet (Industrie 4.0 Working Group, 2013). The
Internet of Things refers to a pervasive, perhaps
ubiquitous, network society in which a lot of
objects are “connected” (Yan, et al 2008). IoT in
essence may be viewed as a subset of the CPS
i.e. the cyber-physical systems (discussed in the
next paragraph) though both terms may be used
interchangeably by different authors often
influenced by the region in which they work or
carry out research. The concept of the smart
factory to have a large network of small,
decentralised intelligent embedded devices is
driven by the IoT paradigm.
1.5 Cyber-Physical Systems (CPS)
Cyber-Physical Systems (CPS) are integrations of
computation and physical processes (Lee &
Wang, 2008). Today, several systems are
embedded with autonomous chips which are
wirelessly networked with one another and also
able to access the Internet thereby providing a
tight and definite link between the cyberspace and
the physical world. Such seamless interactions
define the notion of cyber-physical systems
(CPS). The benefits of CPS are obvious. Imagine
that you have a smart device built into your mobile
phone that continuously monitors and records
your blood pressure and is capable of not only
being able to alert you in the event that
measurements are out of range with respect to
some predefined references but is also able to
schedule an appoint for you with a doctor or even
calling an ambulance in the event of an
emergency; imagine also that this device is
intelligent enough (maybe big data driven) to
know that the sudden rise in your blood pressure
was because you were being attacked by some
unruly youngsters and also calls in the police;
imagine as well that this device detects that you
have not had enough sleep and resets your alarm
clock two hours ahead and cancels your earliest
appointments for the day. These are all realistic
examples. Thus, systems or system of systems in
a CPS scenario are able to communicate and
control one another in a collaborative manner.
The CPS has the novel advantage of being able
to offer early warnings, mitigate surprises and is
therefore well suited to predictive maintenance
applications within the environments of the
Industrial Internet.
1.6 The Three Dimensional Printing (3DP)
Technology
The 3DP is an important technology for the
implementation of Industry 4.0. It is shown in
(Bak, 2003) and (Dimitrov, et al 2006) that the
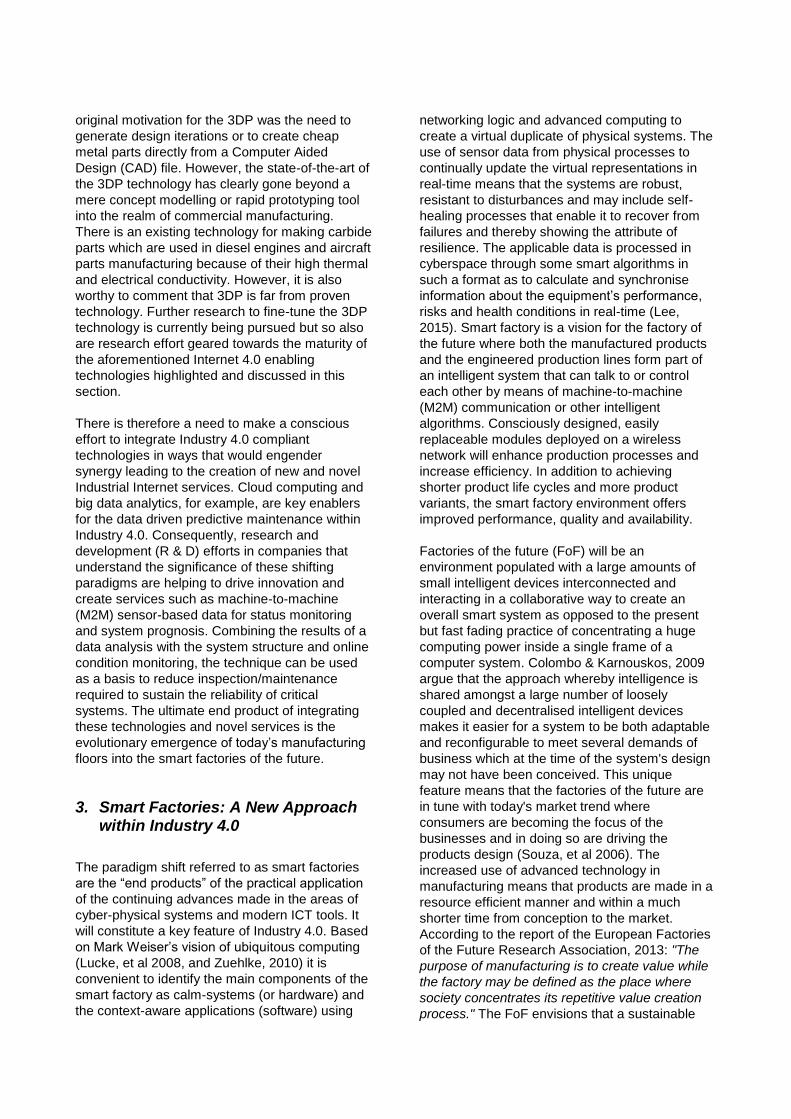
original motivation for the 3DP was the need to
generate design iterations or to create cheap
metal parts directly from a Computer Aided
Design (CAD) file. However, the state-of-the-art of
the 3DP technology has clearly gone beyond a
mere concept modelling or rapid prototyping tool
into the realm of commercial manufacturing.
There is an existing technology for making carbide
parts which are used in diesel engines and aircraft
parts manufacturing because of their high thermal
and electrical conductivity. However, it is also
worthy to comment that 3DP is far from proven
technology. Further research to fine-tune the 3DP
technology is currently being pursued but so also
are research effort geared towards the maturity of
the aforementioned Internet 4.0 enabling
technologies highlighted and discussed in this
section.
There is therefore a need to make a conscious
effort to integrate Industry 4.0 compliant
technologies in ways that would engender
synergy leading to the creation of new and novel
Industrial Internet services. Cloud computing and
big data analytics, for example, are key enablers
for the data driven predictive maintenance within
Industry 4.0. Consequently, research and
development (R & D) efforts in companies that
understand the significance of these shifting
paradigms are helping to drive innovation and
create services such as machine-to-machine
(M2M) sensor-based data for status monitoring
and system prognosis. Combining the results of a
data analysis with the system structure and online
condition monitoring, the technique can be used
as a basis to reduce inspection/maintenance
required to sustain the reliability of critical
systems. The ultimate end product of integrating
these technologies and novel services is the
evolutionary emergence of today’s manufacturing
floors into the smart factories of the future.
3. Smart Factories: A New Approach within Industry 4.0
The paradigm shift referred to as smart factories
are the “end products” of the practical application
of the continuing advances made in the areas of
cyber-physical systems and modern ICT tools. It
will constitute a key feature of Industry 4.0. Based
on Mark Weiser’s vision of ubiquitous computing
(Lucke, et al 2008, and Zuehlke, 2010) it is
convenient to identify the main components of the
smart factory as calm-systems (or hardware) and
the context-aware applications (software) using
networking logic and advanced computing to
create a virtual duplicate of physical systems. The
use of sensor data from physical processes to
continually update the virtual representations in
real-time means that the systems are robust,
resistant to disturbances and may include self-
healing processes that enable it to recover from
failures and thereby showing the attribute of
resilience. The applicable data is processed in
cyberspace through some smart algorithms in
such a format as to calculate and synchronise
information about the equipment’s performance,
risks and health conditions in real-time (Lee,
2015). Smart factory is a vision for the factory of
the future where both the manufactured products
and the engineered production lines form part of
an intelligent system that can talk to or control
each other by means of machine-to-machine
(M2M) communication or other intelligent
algorithms. Consciously designed, easily
replaceable modules deployed on a wireless
network will enhance production processes and
increase efficiency. In addition to achieving
shorter product life cycles and more product
variants, the smart factory environment offers
improved performance, quality and availability.
Factories of the future (FoF) will be an
environment populated with a large amounts of
small intelligent devices interconnected and
interacting in a collaborative way to create an
overall smart system as opposed to the present
but fast fading practice of concentrating a huge
computing power inside a single frame of a
computer system. Colombo & Karnouskos, 2009
argue that the approach whereby intelligence is
shared amongst a large number of loosely
coupled and decentralised intelligent devices
makes it easier for a system to be both adaptable
and reconfigurable to meet several demands of
business which at the time of the system's design
may not have been conceived. This unique
feature means that the factories of the future are
in tune with today's market trend where
consumers are becoming the focus of the
businesses and in doing so are driving the
products design (Souza, et al 2006). The
increased use of advanced technology in
manufacturing means that products are made in a
resource efficient manner and within a much
shorter time from conception to the market.
According to the report of the European Factories
of the Future Research Association, 2013: "The
purpose of manufacturing is to create value while
the factory may be defined as the place where
society concentrates its repetitive value creation
process." The FoF envisions that a sustainable
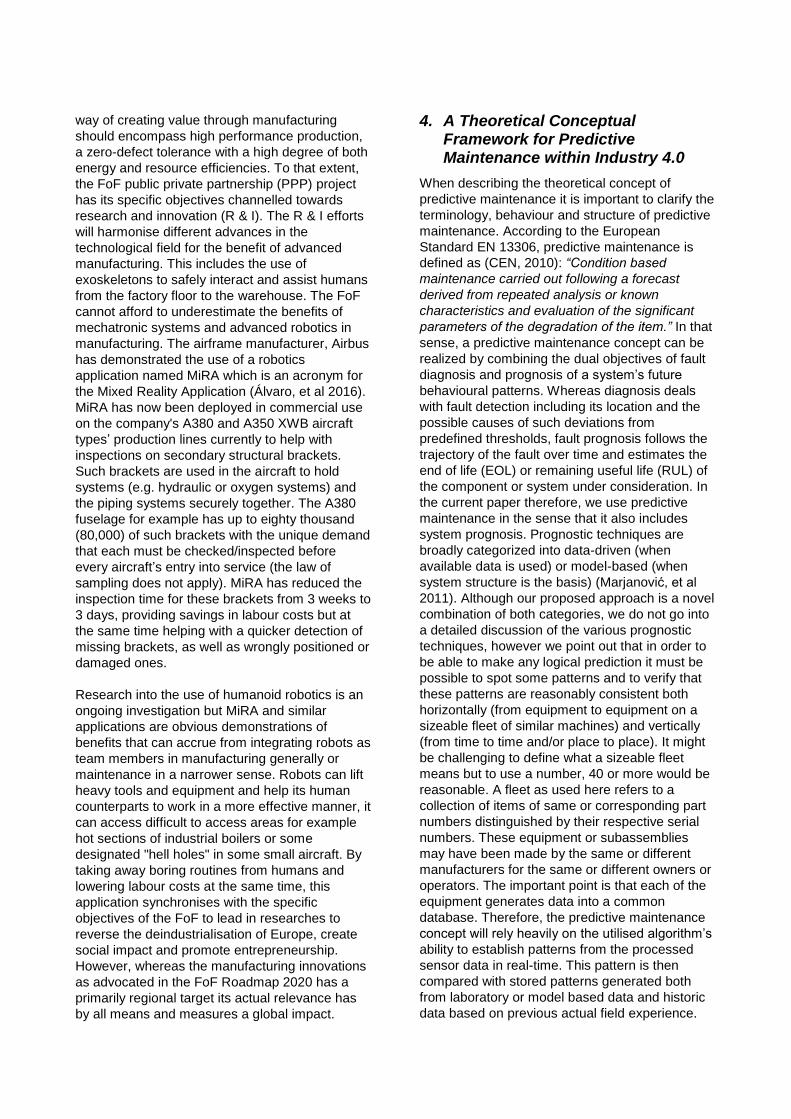
way of creating value through manufacturing
should encompass high performance production,
a zero-defect tolerance with a high degree of both
energy and resource efficiencies. To that extent,
the FoF public private partnership (PPP) project
has its specific objectives channelled towards
research and innovation (R & I). The R & I efforts
will harmonise different advances in the
technological field for the benefit of advanced
manufacturing. This includes the use of
exoskeletons to safely interact and assist humans
from the factory floor to the warehouse. The FoF
cannot afford to underestimate the benefits of
mechatronic systems and advanced robotics in
manufacturing. The airframe manufacturer, Airbus
has demonstrated the use of a robotics
application named MiRA which is an acronym for
the Mixed Reality Application (Álvaro, et al 2016).
MiRA has now been deployed in commercial use
on the company's A380 and A350 XWB aircraft
types’ production lines currently to help with
inspections on secondary structural brackets.
Such brackets are used in the aircraft to hold
systems (e.g. hydraulic or oxygen systems) and
the piping systems securely together. The A380
fuselage for example has up to eighty thousand
(80,000) of such brackets with the unique demand
that each must be checked/inspected before
every aircraft’s entry into service (the law of
sampling does not apply). MiRA has reduced the
inspection time for these brackets from 3 weeks to
3 days, providing savings in labour costs but at
the same time helping with a quicker detection of
missing brackets, as well as wrongly positioned or
damaged ones.
Research into the use of humanoid robotics is an
ongoing investigation but MiRA and similar
applications are obvious demonstrations of
benefits that can accrue from integrating robots as
team members in manufacturing generally or
maintenance in a narrower sense. Robots can lift
heavy tools and equipment and help its human
counterparts to work in a more effective manner, it
can access difficult to access areas for example
hot sections of industrial boilers or some
designated "hell holes" in some small aircraft. By
taking away boring routines from humans and
lowering labour costs at the same time, this
application synchronises with the specific
objectives of the FoF to lead in researches to
reverse the deindustrialisation of Europe, create
social impact and promote entrepreneurship.
However, whereas the manufacturing innovations
as advocated in the FoF Roadmap 2020 has a
primarily regional target its actual relevance has
by all means and measures a global impact.
4. A Theoretical Conceptual Framework for Predictive Maintenance within Industry 4.0
When describing the theoretical concept of
predictive maintenance it is important to clarify the
terminology, behaviour and structure of predictive
maintenance. According to the European
Standard EN 13306, predictive maintenance is
defined as (CEN, 2010): “Condition based
maintenance carried out following a forecast
derived from repeated analysis or known
characteristics and evaluation of the significant
parameters of the degradation of the item.” In that
sense, a predictive maintenance concept can be
realized by combining the dual objectives of fault
diagnosis and prognosis of a system’s future
behavioural patterns. Whereas diagnosis deals
with fault detection including its location and the
possible causes of such deviations from
predefined thresholds, fault prognosis follows the
trajectory of the fault over time and estimates the
end of life (EOL) or remaining useful life (RUL) of
the component or system under consideration. In
the current paper therefore, we use predictive
maintenance in the sense that it also includes
system prognosis. Prognostic techniques are
broadly categorized into data-driven (when
available data is used) or model-based (when
system structure is the basis) (Marjanović, et al
2011). Although our proposed approach is a novel
combination of both categories, we do not go into
a detailed discussion of the various prognostic
techniques, however we point out that in order to
be able to make any logical prediction it must be
possible to spot some patterns and to verify that
these patterns are reasonably consistent both
horizontally (from equipment to equipment on a
sizeable fleet of similar machines) and vertically
(from time to time and/or place to place). It might
be challenging to define what a sizeable fleet
means but to use a number, 40 or more would be
reasonable. A fleet as used here refers to a
collection of items of same or corresponding part
numbers distinguished by their respective serial
numbers. These equipment or subassemblies
may have been made by the same or different
manufacturers for the same or different owners or
operators. The important point is that each of the
equipment generates data into a common
database. Therefore, the predictive maintenance
concept will rely heavily on the utilised algorithm’s
ability to establish patterns from the processed
sensor data in real-time. This pattern is then
compared with stored patterns generated both
from laboratory or model based data and historic
data based on previous actual field experience.
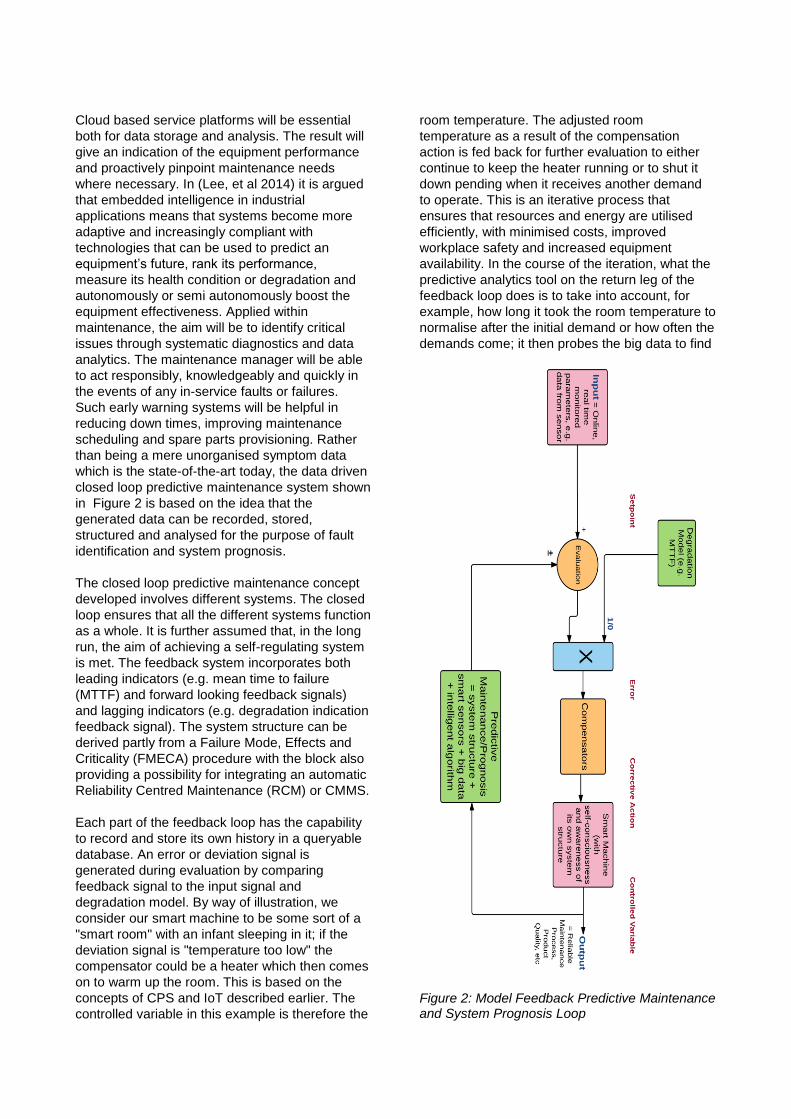
Cloud based service platforms will be essential
both for data storage and analysis. The result will
give an indication of the equipment performance
and proactively pinpoint maintenance needs
where necessary. In (Lee, et al 2014) it is argued
that embedded intelligence in industrial
applications means that systems become more
adaptive and increasingly compliant with
technologies that can be used to predict an
equipment’s future, rank its performance,
measure its health condition or degradation and
autonomously or semi autonomously boost the
equipment effectiveness. Applied within
maintenance, the aim will be to identify critical
issues through systematic diagnostics and data
analytics. The maintenance manager will be able
to act responsibly, knowledgeably and quickly in
the events of any in-service faults or failures.
Such early warning systems will be helpful in
reducing down times, improving maintenance
scheduling and spare parts provisioning. Rather
than being a mere unorganised symptom data
which is the state-of-the-art today, the data driven
closed loop predictive maintenance system shown
in Figure 2 is based on the idea that the
generated data can be recorded, stored,
structured and analysed for the purpose of fault
identification and system prognosis.
The closed loop predictive maintenance concept
developed involves different systems. The closed
loop ensures that all the different systems function
as a whole. It is further assumed that, in the long
run, the aim of achieving a self-regulating system
is met. The feedback system incorporates both
leading indicators (e.g. mean time to failure
(MTTF) and forward looking feedback signals)
and lagging indicators (e.g. degradation indication
feedback signal). The system structure can be
derived partly from a Failure Mode, Effects and
Criticality (FMECA) procedure with the block also
providing a possibility for integrating an automatic
Reliability Centred Maintenance (RCM) or CMMS.
Each part of the feedback loop has the capability
to record and store its own history in a queryable
database. An error or deviation signal is
generated during evaluation by comparing
feedback signal to the input signal and
degradation model. By way of illustration, we
consider our smart machine to be some sort of a
"smart room" with an infant sleeping in it; if the
deviation signal is "temperature too low" the
compensator could be a heater which then comes
on to warm up the room. This is based on the
concepts of CPS and IoT described earlier. The
controlled variable in this example is therefore the
room temperature. The adjusted room
temperature as a result of the compensation
action is fed back for further evaluation to either
continue to keep the heater running or to shut it
down pending when it receives another demand
to operate. This is an iterative process that
ensures that resources and energy are utilised
efficiently, with minimised costs, improved
workplace safety and increased equipment
availability. In the course of the iteration, what the
predictive analytics tool on the return leg of the
feedback loop does is to take into account, for
example, how long it took the room temperature to
normalise after the initial demand or how often the
demands come; it then probes the big data to find
Figure 2: Model Feedback Predictive Maintenance and System Prognosis Loop
out what is "normal" based on previous
experience (pattern recognition), pass it through
the intelligent algorithm which then gives an
indication of system performance level or an
indication of a degraded state and raise a flag to
call for a maintenance action if necessary. The
closed loop maintenance concept is therefore an
on-demand, data-driven maintenance technique
that ensures that maintenance is carried out only
as required and based on actual field data. This
novel system will build upon advances made in
the area of machine learning and machine-to-
machine interaction. The current practice within
maintenance is to record faults or failures and the
actions taken to rectify these snags on some
dedicated log books. The CMMS, Computerized
Maintenance Management System, can provide
an additional capability of presenting these
records in an electronic and searchable form. In
addition, some sectors are well organised in their
approach, for example the aviation industry uses
the Airlines Transport Association ATA chapters
which helps aircraft engineers to group events in
accordance with predefined systems. But these
are all open systems that do not provide
communication back to the equipment to close the
loop. We hope that every maintenance event
provides a learning opportunity not only for the
machines in question but also for the organisation
in general. Therefore, we propose that some
representative information from the process
output should be fed back into the machine to
facilitate this learning or modify the machine’s
software or other attributes in some ways. The
representative output may be the final product
quality or other measurable parameters such as
voltage regularity and temperature for example
which are digitized and fed back through the
machine in either qualitative or quantitative format
depending on the system configuration,
complexity and need.
5. Towards Asset Maintenance Needs of the Future: Expectations and Results
Industry 4.0 will revolutionise manufacturing and
increase productivity. It will lead to the creation of
new business models and present a basis for new
and novel services. A typical example of such
services which are already beginning to emerge in
the industry is the application of distributed cloud
systems in asset maintenance. The current paper
assesses the effect of the integration of some
Industry 4.0 key enabling technologies, intelligent
devices, pervasive computing and of course
classical physics, as a result, a closed loop data
driven predictive maintenance system is
developed. The major contribution of this
feedback system is that the loop is closed at the
machine-to-machine level rather than just at an
organisational level which is today's industry
state-of-the-art. The data driven closed loop
predictive maintenance system developed can be
credited with some important results which we
have summarised as follows:
An increased automation in maintenance
will benefit from machine generated data
as in Industry 4.0 most machines have
extensive capabilities for self-diagnosis
but most times the results of such
diagnosis are used as mere
representations of symptoms and do not
help in any way for predicting or giving an
indication of future failures. The reason
being that, in such open loop systems, the
effect of a diagnosis that has revealed a
fault state is that the snag is simply
cleared and forgotten. In contrast, the
closed loop feedback loop for predictive
maintenance developed here, remembers
each fault or failure event and uses it in
the future not only for the same machine
but also for all similar machines linked to
its network via the distributed cloud
globally or through a small company's
intranet locally, depending on its
functional configuration. The developed
predictive maintenance feedback loop
integrates well into the framework of the
European Union's Factories of the Future
projects and proposals briefly highlighted
in section 3.
Maintenance task execution often
introduces some consequential hazards
through human error or wrong operational
or organisational procedures. Developing
a system such as the feedback predictive
maintenance system that helps to reduce
maintenance needs has an instant effect
on improving the safety performance not
only of the production equipment but also
that of the workplace as well.
The systems developed in this project
leverage on Industry 4.0 key enabling
technologies such as the distributed cloud
system, big data mining and analysis,
Internet of Things, Cyber-Physical
Systems, three dimensional printing
technology, and other innovative
technologies and intelligent devices to
deliver solutions which are not only more
efficient and effective but also have
positive cost benefits. For example, the
cost benefit to a Nigerian oil and gas
company which has an operational base
in Norway will be enormous based on
travel and logistic costs alone if an
Industry 4.0 cloud based asset
maintenance system is implemented
across the value chain of the company
and thereby limiting the need to travel.
As companies continue to focus on novel and
efficient ways of doing business, there will be an
ever increasing appetite for novel technologies
such as the data driven closed loop predictive
maintenance system proposed in this paper. The
proposed maintenance structure can only
succeed if it is undertaken as a multi-disciplinary
project, collaborative effort is required in disparate
fields from robotics engineering to computer
science all the way down to sociology and
psychology. The system hinges on several
innovations most of which are far from being
proven technologies. Further research is therefore
required in the following areas:
Integration effort to harmonise
mechatronic systems and computer
programming to suit the Industry 4.0
production factory
There should be a clearly defined road-
map for the implementation of Industry
4.0 that meets the needs of different
industry sectors. This can be achieved
through publicly available published
guidelines and standards
Development of industry-grade software
and smart algorithms that would meet
demands of Industry 4.0 companies
Address the needs of standardisation,
interoperability, open systems
applications, and adaptability
Adapting today's production floor to suit
the smart factory specifications is an
urgent research challenge that must be
tackled
Integration of predictive maintenance
capabilities from an early design phase in
future products and in future production
lines. Industry 4.0 implementation pays
attention to both products and production
equipment because the product of one
company could be the production
equipment of another company.
By design, robustness and resilience of
products and production assets must
address issues of cyber security, activities
of criminal hackers and unethical
competitors. Advanced encryption
techniques should be investigated and
comprehensive risk assessment must be
carried out to establish the links between
individual risks and the possible
consequences.
6. Conclusions
The basic structures proposed in this paper set
out general frameworks for a data driven closed
loop feedback predictive maintenance system for
implementation within an Industry 4.0
environment. It is sufficient to conclude based on
the results expected from the developed system
that its integration with the system structures and
degradation models of the aggregating
components or assemblies has the potential to
reduce maintenance frequency on critical assets
or increase the interval of offline inspections,
increase safety around production equipment in
the workplace, increase asset availability and
boost both productivity and profitability. The
ultimate end products will be reliable, robust and
resilient systems that offer asset operators the
best life cycle benefits.
7. Acknowledgements
The lead author became motivated to write this
paper while working as a research assistant in the
summer of 2015 at the Production and Quality
Engineering Department of the Norwegian
University of Science and Technology, NTNU
under an umbrella of funding provided through the
European Union’s Green Monitor Project. We are
profoundly grateful to the NTNU, the EU Green
Monitor Project and our families.

8. References
1. Álvaro, F., Favila, R., & Hugo, A. (2016).
Factory of the future – New ways of
manufacturing. Airbus Group.
http://www.airbusgroup.com/int/en/story-
overview/factory-of-the-future.html .
2. Bai, H., Ma, Z., & Zhu, Y. (2012). The
application of cloud computing in smart
grid status monitoring. In Internet of
Things (pp. 460-465). Springer Berlin
Heidelberg.
3. Bak, D. (2003). Rapid prototyping or rapid
production? 3D printing processes move
industry towards the latter. Assembly
Automation, 23(4), 340-345.
4. CEN 2010. NS-EN 13306: Maintenance
Terminology Standard.
5. Colombo, A. W., & Karnouskos, S.
(2009). Towards the factory of the future:
A service-oriented cross-layer
infrastructure. ICT Shaping the World: A
Scientific View. European
Telecommunications Standards Institute
(ETSI), John Wiley and Sons, 65, 81.
6. Dimitrov, D., Schreve, K., & De Beer, N.
(2006). Advances in three dimensional
printing-state of the art and future
perspectives. Rapid Prototyping
Journal, 12(3), 136-147.
7. European Factories of the Future
Research Association. (2013). Multi
Annual Roadmap for the Contractual PPP
under Horizon 2020.
8. Evans, P. C., & Annunziata, M. (2012).
Industrial internet: Pushing the
boundaries of minds and
machines. General Electric.
November, 26.
9. Industrie 4.0 Working Group. (2013).
Recommendations for implementing the
strategic initiative INDUSTRIE 4.0. Final
report, April.
10. Lee, J. (2015). Smart Factory Systems.
Informatik-Spektrum, (pp. 1-6). Springer.
11. Lee, J., & Wang, H. (2008). New
technologies for maintenance. In Complex
System Maintenance Handbook (pp. 49-
78). Springer London.
12. Lee, J., Kao, H. A., & Yang, S. (2014).
Service innovation and smart analytics for
industry 4.0 and big data
environment. Procedia CIRP, 16, 3-8.
13. Lucke, D., Constantinescu, C., &
Westkämper, E. (2008). Smart factory-a
step towards the next generation of
manufacturing. In Manufacturing systems
and technologies for the new frontier (pp.
115-118). Springer London.
14. Manyika, J., Chui, M., Brown, B., Bughin,
J., Dobbs, R., Roxburgh, C., & Byers, A.
H. (2011). Big data: The next frontier for
innovation, competition, and productivity.
15. Marjanović, A., Kvaščev, G., Tadić, P., &
Đurović, Ž. (2011). Applications of
predictive maintenance techniques in
industrial systems. Serbian Journal of
Electrical Engineering, 8(3), 263-279.
16. Mell, P., & Grance, T. (2011). The NIST
definition of cloud computing.
17. Schroth, C., & Janner, T. (2007). Web 2.0
and SOA: Converging concepts enabling
the internet of services. IT
professional, 9(3), 36-41.
18. Souza, M. C. F., Sacco, M., & Porto, A. J.
V. (2006). Virtual manufacturing as a way
for the factory of the future. Journal of
Intelligent Manufacturing,17(6), 725-735.
19. Stuber, A. & Ferreira, L. (2016). Smart
maintenance – A novel platform for
maintenance management within asset
management.
20. Thielke, S., Harniss, M., Thompson, H.,
Patel, S., Demiris, G., & Johnson, K.
(2012). Maslow’s hierarchy of human
needs and the adoption of health-related
technologies for older adults. Ageing
international, 37(4), 470-488.
21. Yan, L., Zhang, Y., Yang, L. T., & Ning, H.
(Eds.). (2008). The Internet of things: from
RFID to the next-generation pervasive
networked systems. CRC Press.
22. Zuehlke, D. (2010). SmartFactory —
Towards a factory-of-things. Annual
Reviews in Control, 34(1), 129-138.


Paper TWO
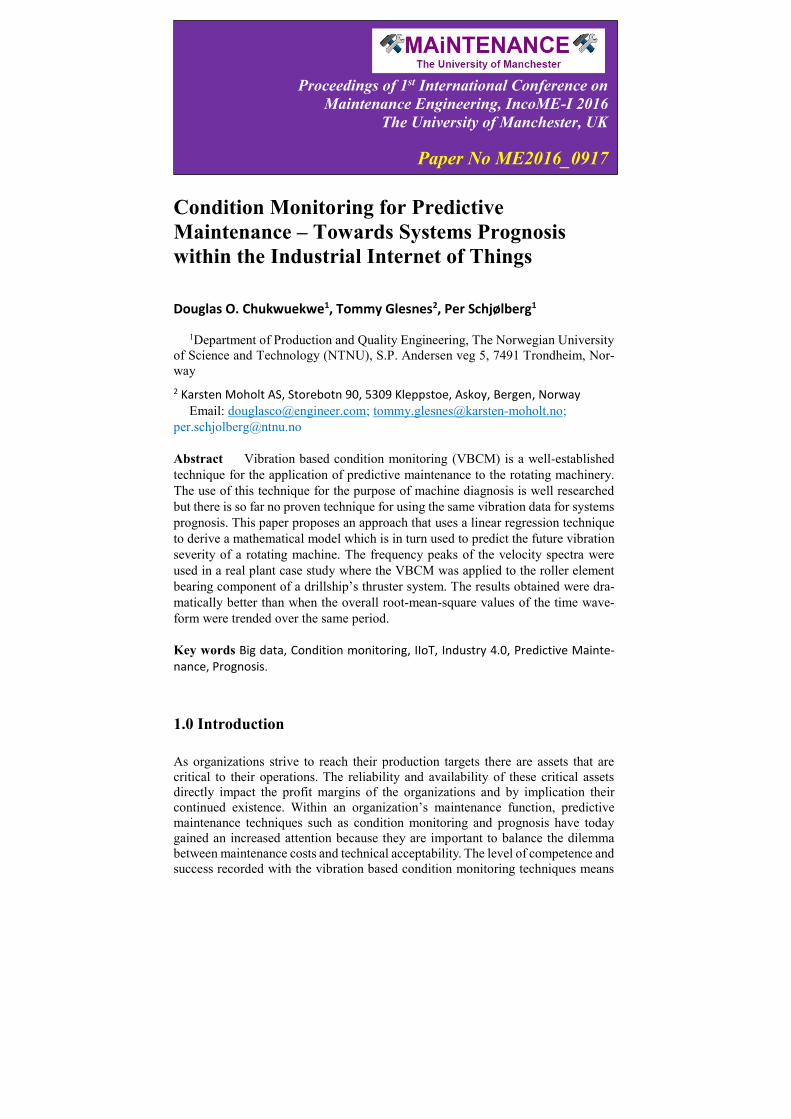
Condition Monitoring for Predictive
Maintenance – Towards Systems Prognosis
within the Industrial Internet of Things
Douglas O. Chukwuekwe1, Tommy Glesnes2, Per Schjølberg1
1Department of Production and Quality Engineering, The Norwegian University
of Science and Technology (NTNU), S.P. Andersen veg 5, 7491 Trondheim, Nor-
way
2 Karsten Moholt AS, Storebotn 90, 5309 Kleppstoe, Askoy, Bergen, Norway
Email: [email protected]; [email protected];
Abstract Vibration based condition monitoring (VBCM) is a well-established
technique for the application of predictive maintenance to the rotating machinery.
The use of this technique for the purpose of machine diagnosis is well researched
but there is so far no proven technique for using the same vibration data for systems
prognosis. This paper proposes an approach that uses a linear regression technique
to derive a mathematical model which is in turn used to predict the future vibration
severity of a rotating machine. The frequency peaks of the velocity spectra were
used in a real plant case study where the VBCM was applied to the roller element
bearing component of a drillship’s thruster system. The results obtained were dra-
matically better than when the overall root-mean-square values of the time wave-
form were trended over the same period.
Key words Big data, Condition monitoring, IIoT, Industry 4.0, Predictive Mainte-nance, Prognosis.
1.0 Introduction
As organizations strive to reach their production targets there are assets that are
critical to their operations. The reliability and availability of these critical assets
directly impact the profit margins of the organizations and by implication their
continued existence. Within an organization’s maintenance function, predictive
maintenance techniques such as condition monitoring and prognosis have today
gained an increased attention because they are important to balance the dilemma
between maintenance costs and technical acceptability. The level of competence and
success recorded with the vibration based condition monitoring techniques means
Proceedings of 1st International Conference on
Maintenance Engineering, IncoME-I 2016
The University of Manchester, UK
Paper No ME2016_0917
2
that they have found useful applications within varied industries from aerospace to
manufacturing as well as the oil and gas industry in recent times.
However, as the transition is made away from traditional manufacturing and
standalone systems, a major concern expressed within the industry is that the current
approach presented within Industry 4.0 (the Industrial Internet of Things (IIoT)) [7]
for implementing predictive maintenance places too much emphasis on low level
data monitoring to a degree that compromises the level of competence already
achieved within the industrial application of vibration based condition monitoring
and there is so far no proven method to overcome the challenge.
The ultimate goal of any condition monitoring system is to gain the capability to
predict the future of the equipment monitored [2]. Such a goal would be hard to
reach by simply monitoring low level data such as temperature and pressure as
currently suggested in the literatures related to Industry 4.0 although there are still
not many publications available in this area. The IIoT is a new and evolving
paradigm, therefore research and implementation are still in their formative stages.
Previous publications are quick to highlight the strategic importance of big data but
fail to demonstrate how it can be organized and analyzed for the purpose of
predictive maintenance and for completing the maintenance decision loop. From the
perspective of maintenance, the obvious weakness in the present big data exists in
the fact that they are collected mainly for operational reasons and only serves
maintenance purposes often “accidentally” or as an afterthought at the best.
In this paper, investigations have been carried out and the results reported can bridge
some of the existing gaps. Using vibration monitoring of rotating equipment as a
case study, it was demonstrated that the next generation of condition monitoring can
integrate well into the Industrial Internet beyond low level data monitoring which
is currently the case. It was shown that the application of a systematically selected
stochastic process to low level data provides the required scaling up of vibration
data to produce a more realistic and more practicable solution compared with any
existing technique for the implementation of predictive maintenance within the
Industry 4.0 environment. Machine generated real data and an industry grade
software were deplored to obtain results which are not only compatible with the
proposed Industry 4.0 reference architecture but also show a higher level of service
when utilizing the proposed condition monitoring technique. Using modern sensors
and instrumentation techniques, vibration data is collected in a structured manner
for the main purpose of predictive maintenance. The collected data is dimensioned
and treated in a form compatible with Industry 4.0 requirement for single value data
while retaining the original properties of vibration data. It was proposed to capture
multiple snapshots of vibration patterns to which a single average value is assigned
to the frequency spikes for every successive and corresponding time horizon. These
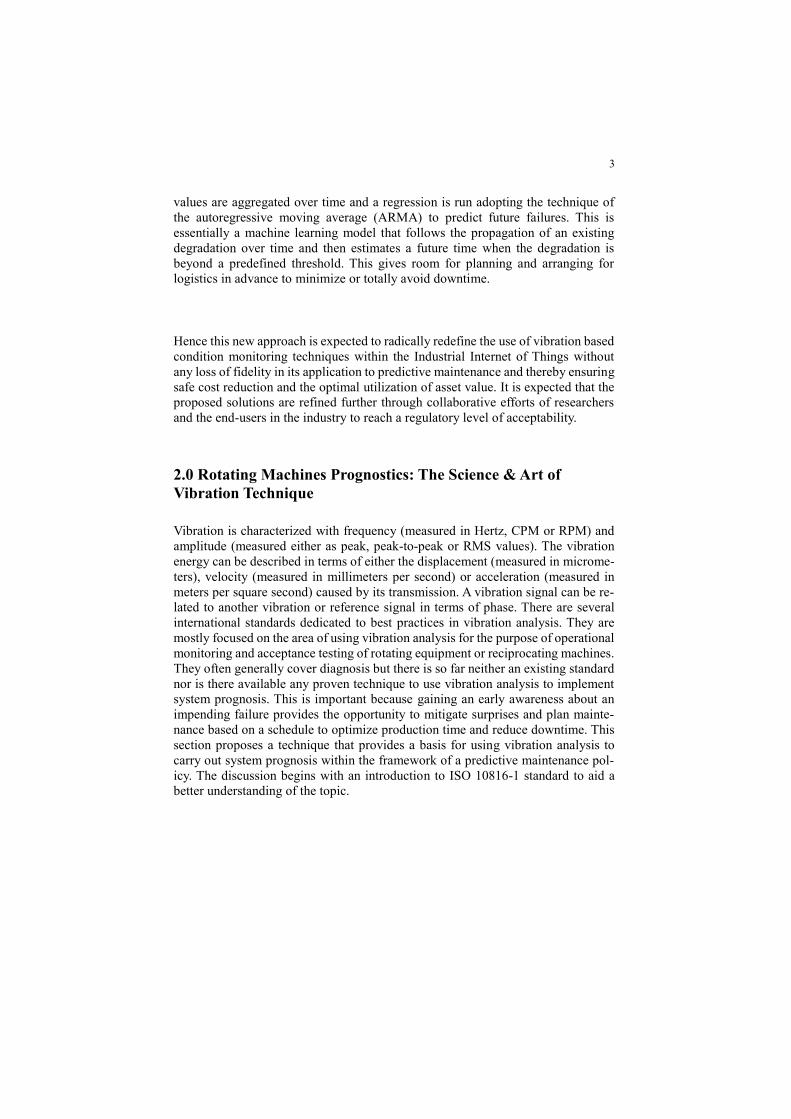
3
values are aggregated over time and a regression is run adopting the technique of
the autoregressive moving average (ARMA) to predict future failures. This is
essentially a machine learning model that follows the propagation of an existing
degradation over time and then estimates a future time when the degradation is
beyond a predefined threshold. This gives room for planning and arranging for
logistics in advance to minimize or totally avoid downtime.
Hence this new approach is expected to radically redefine the use of vibration based
condition monitoring techniques within the Industrial Internet of Things without
any loss of fidelity in its application to predictive maintenance and thereby ensuring
safe cost reduction and the optimal utilization of asset value. It is expected that the
proposed solutions are refined further through collaborative efforts of researchers
and the end-users in the industry to reach a regulatory level of acceptability.
2.0 Rotating Machines Prognostics: The Science & Art of
Vibration Technique
Vibration is characterized with frequency (measured in Hertz, CPM or RPM) and
amplitude (measured either as peak, peak-to-peak or RMS values). The vibration
energy can be described in terms of either the displacement (measured in microme-
ters), velocity (measured in millimeters per second) or acceleration (measured in
meters per square second) caused by its transmission. A vibration signal can be re-
lated to another vibration or reference signal in terms of phase. There are several
international standards dedicated to best practices in vibration analysis. They are
mostly focused on the area of using vibration analysis for the purpose of operational
monitoring and acceptance testing of rotating equipment or reciprocating machines.
They often generally cover diagnosis but there is so far neither an existing standard
nor is there available any proven technique to use vibration analysis to implement
system prognosis. This is important because gaining an early awareness about an
impending failure provides the opportunity to mitigate surprises and plan mainte-
nance based on a schedule to optimize production time and reduce downtime. This
section proposes a technique that provides a basis for using vibration analysis to
carry out system prognosis within the framework of a predictive maintenance pol-
icy. The discussion begins with an introduction to ISO 10816-1 standard to aid a
better understanding of the topic.
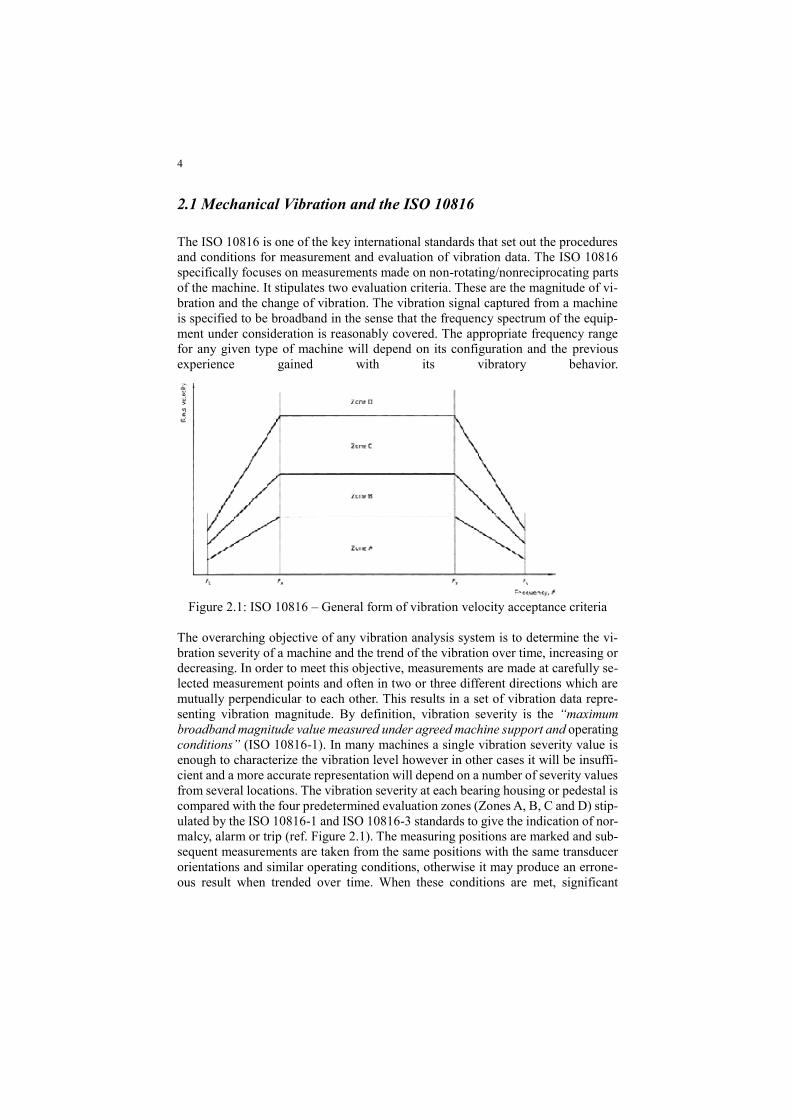
4
2.1 Mechanical Vibration and the ISO 10816
The ISO 10816 is one of the key international standards that set out the procedures
and conditions for measurement and evaluation of vibration data. The ISO 10816
specifically focuses on measurements made on non-rotating/nonreciprocating parts
of the machine. It stipulates two evaluation criteria. These are the magnitude of vi-
bration and the change of vibration. The vibration signal captured from a machine
is specified to be broadband in the sense that the frequency spectrum of the equip-
ment under consideration is reasonably covered. The appropriate frequency range
for any given type of machine will depend on its configuration and the previous
experience gained with its vibratory behavior.
Figure 2.1: ISO 10816 – General form of vibration velocity acceptance criteria
The overarching objective of any vibration analysis system is to determine the vi-
bration severity of a machine and the trend of the vibration over time, increasing or
decreasing. In order to meet this objective, measurements are made at carefully se-
lected measurement points and often in two or three different directions which are
mutually perpendicular to each other. This results in a set of vibration data repre-
senting vibration magnitude. By definition, vibration severity is the “maximum
broadband magnitude value measured under agreed machine support and operating
conditions” (ISO 10816-1). In many machines a single vibration severity value is
enough to characterize the vibration level however in other cases it will be insuffi-
cient and a more accurate representation will depend on a number of severity values
from several locations. The vibration severity at each bearing housing or pedestal is
compared with the four predetermined evaluation zones (Zones A, B, C and D) stip-
ulated by the ISO 10816-1 and ISO 10816-3 standards to give the indication of nor-
malcy, alarm or trip (ref. Figure 2.1). The measuring positions are marked and sub-
sequent measurements are taken from the same positions with the same transducer
orientations and similar operating conditions, otherwise it may produce an errone-
ous result when trended over time. When these conditions are met, significant
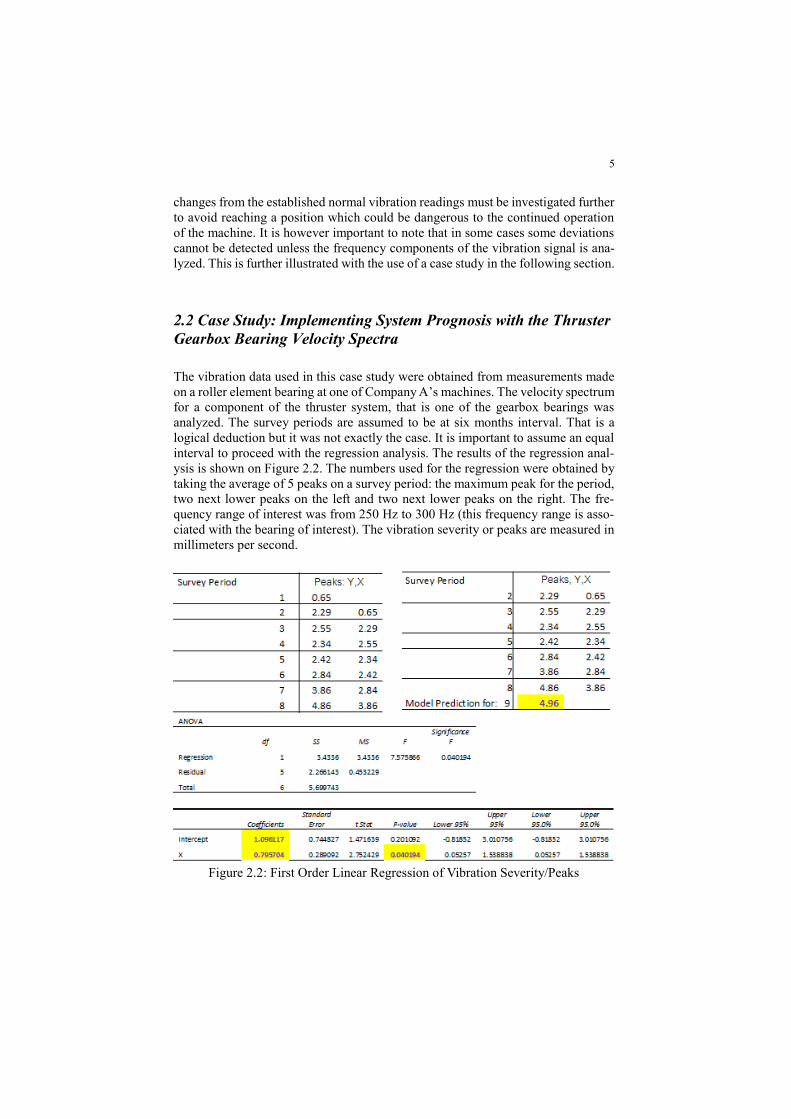
5
changes from the established normal vibration readings must be investigated further
to avoid reaching a position which could be dangerous to the continued operation
of the machine. It is however important to note that in some cases some deviations
cannot be detected unless the frequency components of the vibration signal is ana-
lyzed. This is further illustrated with the use of a case study in the following section.
2.2 Case Study: Implementing System Prognosis with the Thruster
Gearbox Bearing Velocity Spectra
The vibration data used in this case study were obtained from measurements made
on a roller element bearing at one of Company A’s machines. The velocity spectrum
for a component of the thruster system, that is one of the gearbox bearings was
analyzed. The survey periods are assumed to be at six months interval. That is a
logical deduction but it was not exactly the case. It is important to assume an equal
interval to proceed with the regression analysis. The results of the regression anal-
ysis is shown on Figure 2.2. The numbers used for the regression were obtained by
taking the average of 5 peaks on a survey period: the maximum peak for the period,
two next lower peaks on the left and two next lower peaks on the right. The fre-
quency range of interest was from 250 Hz to 300 Hz (this frequency range is asso-
ciated with the bearing of interest). The vibration severity or peaks are measured in
millimeters per second.
Figure 2.2: First Order Linear Regression of Vibration Severity/Peaks
6
From the regression analysis, the model for predicting the next period's expected
vibration severity was derived as 1.096117 + 0.795704 Yt (where Yt is the vibration
severity of the most recent survey period.) The model predicted the vibration sever-
ity for period 9 to be 4.96 millimeters per second. Having a systematic way to carry
out such predictions has many benefits. In the current case study, surveys were re-
peated at six months interval. At the end of each survey, it is possible to predict what
we expect the vibration severity to be six months from the most recent survey cam-
paign. Should the predicted vibration severity be significantly higher than the pre-
determined acceptable levels, the asset managers have the benefit of initiating the
plan to carry out maintenance long before the possible failure of the component.
While working in partnership with the industry for this paper it was observed that
maintenance engineering service providers may have reason to authorize the con-
tinued use of an equipment even when a trend that could lead to failure has been
observed. The main reason for not carrying out maintenance as soon as the first sign
of possible failure is known was found to be predicated upon considerations for
production interruption. In such situations where it was necessary to escalate the
maintenance requirements, the engineering company was observed to have offered
the equipment utilization extension based on "expert judgement and best guesses or
honest estimates." The systematic approach proposed in this paper offers a more
scientific and objective technique for reaching such decisions. Another question that
is necessary to address is what the appropriate survey interval should be. This is a
difficult question as it will generally involve commercial and contractual consider-
ations. The accessibility of the equipment or its known reliability performance and
the cost to personnel or in extreme cases interruption to production flow are among
important factors to consider before the survey interval is selected. Due to random
events, it might sometimes be necessary to embark on vibration data collection at a
time that is off the agreed interval. In such cases, the asset managers have to docu-
ment and implement the additional survey campaigns without distorting the planned
survey periods.
2.2.1 The model has the following limitations:
Only a few data points (7 observations) were used to train the model.
The recorded readings were made at different machine revolutions. It
was only after July 3rd 2013 that measurements were made consistently
at 680 RPM. Between December 12, 2011 and February 01, 2013 the
range of RPM where vibration readings were taken varied from 583 to
710. This is contrary to the recommendations made in [4], [5], [6] and
certainly has an influence on the derived model.
Frequency peaks were measured without linking them with their corre-
sponding phase angles. Treating frequency as a vector quantity rather
than as a scalar produces better results as shown in the standards refer-
enced in the above bullet point.
7
The interval between the survey periods were not equal. In some cases
it was approximately six months but it was not generally true.
The regression analysis has been carried out using the data analysis
function in Microsoft Excel. It was sufficient to demonstrate the result
but a commercial application would require a more advanced software
perhaps application tailored computing.
In order to overcome the aforementioned limitations, the pursuit of predictive
maintenance and prognostic techniques need be a rigorously implemented policy.
Lots of data are now being generated within industrial applications [3], [7] and with
the continued improvements in sensor technology, data mining will witness an up-
ward trend [8], [9]. It is necessary to look into the generated data, structure and
analyze it to help in maintenance decision support as well as other value added ser-
vices. Data scientists will play an increasingly important role in the future of mainte-
nance practice. Analyzing a sufficient amount of data from the same or similar ma-
chines with some statistical techniques such as the lifetime models which have been
rigorously treated in standard statistical literatures will improve asset reliability and
availability. The application of the Nelson-Aalen estimator and the Kaplan-Meier
estimator techniques, for example, to the relevant data sets can aid better under-
standing of components' failure trajectories and a more accurate estimation of the
machine's mean time to failure (MTTF) or other important system structures and
parameters. The big data is important but the systematic analysis of the big data
provides the value adding perspective that would help organizations to realize their
overarching business functions to maximize stakeholders' value.
3.0 Smart Maintenance: The Discussion Continues
Condition monitoring is intended to measure the current status of an operational
item but it does not automatically imply that a predictive maintenance policy is in
place [2]. There has to be a system that receives the parameter values measured by
the condition monitoring technique and utilise these values as an input to the
predictive maintenance strategy. A condition monitoring programme is an
irreducible minimum for the predictive maintenance strategy to hold but a
successful predictive maintenance concept is a consciously applied policy. The
evolving paradigms of the Industrial Internet of Things (IIoT) gives credence to the
prediction of the 4th industrial revolution which was first identified in Germany as
Industry 4.0. The disruptive nature of an industrial revolution means that there will
be a shift in the general ways of doing things and there has been discussions in the
maintenance engineering communities as per the impacts of these shifts in practice.
The relevance of this paper and the results obtained from the investigations are
grounded in the reach to provide some basic proposals on how to structure and
analyse vibration data for the purpose of predictive maintenance and systems
prognosis. It is expected to be a means to bridge the state-of-the-art in maintenance
8
and the future maintenance practice which is smart by its perspective and data
driven by application. It was established that the frequency spectrum correctly
captures the vibration energy in the rotating machinery when subjected to vibration
analysis. The use of frequency peaks in spectral analysis for trending provided better
results than conventional trended overall values. Spectral analysis provides a means
to separate a complex vibration time waveform into its component frequency
spectra which in turn offer the benefit to identify and isolate specific frequencies
resulting from each and every component in a complex rotating machine. This was
traditionally used for troubleshooting and diagnosis. The investigations conducted
for this paper revealed that these frequency peaks can also be used to predict the
future behavioural patterns of the rotating machinery and estimate its future
vibration severity based on ordinary linear regression.
The particular data-set used for the case study came from a roller bearing which
formed part of a thruster assembly on a drill ship. The relevant data used for the
regression analysis had a span of eight periods. The interval between two successive
periods was approximately six months. When a first order linear regression analysis
was conducted based on the data from the eight periods (that is only 8 observations),
a prediction model was established. From the regression analysis, the model for
predicting the next period's expected vibration severity was derived as 1.096117 +
0.795704 Yt (where Yt is the vibration severity of the most recent survey period.)
The model predicted the vibration severity for period 9 as 4.96 millimetres per
second. If this mathematical model is validated to hold true in similar operating
conditions it becomes easy to write an algorithm that is capable of implementing
system prognosis. The derived model has the limitation that it was based only on 8
observations which is grossly insufficient. The framework nonetheless provides a
basis for further investigations as more data become available. With only a few data
points, it was only reasonable to run a linear regression. However, in another report
[1] it was suggested that the quadratic model offered better results than linear ones.
This report lacked sufficient data to either confirm or refute the claim that quadratic
models are better than linear models. The strength of this investigation is that it has
provided a proposal which can be easily adapted to create models which can be used
for predictive maintenance and prognosis as the sensor technology continues to
revolutionise condition monitoring whilst also driving both the big data and big data
analytics for the smart maintenance applications.
The rotating machinery form an integral part of most production assets. Pumps,
compressors, electrical motors and generators, separators, and gas turbines are
common examples of rotating machinery used in industries. The use of vibration
analysis for purposes of condition monitoring and diagnostics has been very
successful within standalone systems in conventional applications. However, the
concept of smart maintenance based on Industry 4.0 requires an extensive use of
data [7]. The challenge is to present the data in a format that is compatible with the
design philosophies and the reference architecture for the Industrial Internet of
Things (IIoT) [3]. This report has provided an initial proposal for tackling the stated
challenge. It further shows a technique that makes use of structured data to
9
implement systems prognosis based on the frequency spectrum of vibration data.
The procedure outlined for implementing predictive maintenance was simple but a
limited amount of data was used. That limitation makes it difficult to argue that the
results obtained would be valid in all circumstances. The next phase of improvement
must utilise a more extensive data coverage that would help determine the degree
of accuracy of the results of the prognosis. In addition to expanding the data
coverage, there is a need to calculate and provide the confidence intervals associated
with every prediction. The gradual progression from condition monitoring to
condition based maintenance and predictive maintenance up to prescriptive
maintenance is both worthy and realisable within the sphere of smart maintenance.
In order for the idea to reach a proven technology and a regulatory level of service
there has to be a consciously targeted effort by all sectors to improve the techniques
for measuring parameters and running the analysis. A further refinement of the ideas
proposed in this paper to a point of commercial viability is recommended along with
the inclusion of those partner companies who are willing to set up pilot services to
validate the proposed ideas.
4.0 Conclusion
The derived mathematical model for predicting the future vibration severity was
based on single values which are compliant with the proposed Industry 4.0 reference
architecture. The vibration data stored, processed and analyzed in the compliant
format helps to populate the big data which in turn is used for the data driven smart
maintenance which has a great descriptive accuracy, predictive powers and
prescriptive capabilities. Condition monitoring was shown to be a safe cost cutting
mechanism to the benefit of operators and asset managers because it provides a
mechanism to avoid or mitigate surprises. Having an advance awareness about the
degraded state of a production asset offers the valuable advantage of synchronizing
maintenance needs and operational demands.
10
References
[1] Chudnovsky, B.H., Livshitz, A. and Chudnovsky, B.A., 2008, October. Thermal model of elec-
trical contacts based on experimental data. In 2008 Proceedings of the 54th IEEE Holm Con-
ference on Electrical Contacts (pp. 205-211). IEEE.
[2] Chukwuekwe, D.O., Schjølberg, P., Rødseth H. and Stuber A., 2016. Reliable, Robust and
Resilient Systems: Towards Development of a Predictive Maintenance Concept within the In-
dustry 4.0 Environment. EFNMS Euro Maintenance Conference 2016, May 30 – June 2. Ath-
ens, Greece.
[3] Evans, P.C. and Annunziata, M., 2012. Industrial internet: Pushing the boundaries of minds
and machines. General Electric. November, 26.
[4] ISO 10816-1: Mechanical vibration—Evaluation of machine vibration by measurements on
non-rotating parts—Part 1: General guidelines. ISO Switzerland, 1995.
[5] ISO 10816-3: Mechanical vibration—Evaluation of machine vibration by measurements on
non-rotating parts—Part 3: Industrial machines with nominal power above 15 kW and nominal
speeds between 120 r/min and 15,000 r/min when measured in situ. ISO Switzerland, 2009.
[6] ISO 7919-1: Mechanical Vibration of non-reciprocating machines - Measurements on rotating
shafts and evaluation criteria—Part 1: General guidelines. ISO Switzerland, 1996.
[7] Industrie 4.0 Working Group, 2013. Recommendations for implementing the strategic initiative
INDUSTRIE 4.0. Final report, April.
[8] Lee, J., Kao, H.A. and Yang, S., 2014. Service innovation and smart analytics for industry 4.0
and big data environment. Procedia CIRP, 16, pp.3-8.
[9] Manyika, J., Chui, M., Brown, B., Bughin, J., Dobbs, R., Roxburgh, C. and Byers, A.H., 2011.
Big data: The next frontier for innovation, competition, and productivity.

11
Authors’ Biography
Douglas O. Chukwuekwe
Engr. Douglas O. Chukwuekwe is an aircraft
and project engineer with over ten years of
experience. He worked as a Teaching and
Research Assistant at the Norwegian
University of Science & Technology,
Trondheim while taking the MSc in Reliability,
Availability, Maintainability and Safety
(RAMS) Engineering, a programme from
which he recently graduated. He is a motivated
and budding researcher with interests in novel
condition monitoring techniques, predictive
maintenance and reliability by design. He was
a speaker at the European Federation of
National Maintenance Societies’ (EFNMS)
24th Biennial Euro Maintenance Conference,
2016 in Athens, Greece.
Tommy Glesnes
Engr. Tommy Glesnes is the Chief Technical
Officer (CTO) of Karsten Moholt AS, a leading
technology provider with specialties in electro-
mechanical machinery, motors and generators.
An approved vibration training instructor and a
Category III vibration analyst with over 25
years of practice, he is certified by the EFNMS
as a European Expert in Maintenance
Management.
Per Schjølberg
Dr Per Schjølberg is an Associate Professor
and the former Head of the Production and
Quality Engineering Department at the
Norwegian University of Science and
Technology, NTNU-Trondheim. He sits on the
Board of several organisations.