Embed Size (px)
Citation preview
ANALYSIS AND TESTING OF A TRAPEZOIDAL BOX GIRDER BRIDGE
Michael Holowka, Ontario Ministry of Transportation and Communications
Bridge construction using open steel box girders and a concrete deck slab acting composite is aesthetically pleasing and ideally suited for grade separations and river crossings for spans varying between 21 m and 110 m (70 ft. and 360 ft.). Current design specifications for this construction, however, are considered to be incomplete and do not provide sufficient guidance during construction. In a number of cases, due to lack of bracings and/or diaphragms, excessive displacements have occurred during construction. To clarify this problem, a typical, single span, 2-lane bridge was extensively instrumented and tested. The purpose of the testing program was to investigate the behaviour of a torsionally stiff bridge during and after construction and to compare the experimental data with analytical results. The concrete deck,which was constructed with 0.3% isotropic reinforcement rather than 1.0% orthotropic reinforcement to comply with the AASHTO Specifications, was also monitored. Test data consisted of structural and reinforcing steel strains, deflections, reactions for construction, and live load and temperature effects. The experimental deck was constructed in two stages. A preliminary review of the data indicated that, for this bridge geometry, construction effects were within the predicted values as no excessive deflections or strains were observed. The concrete deck with the dramatically reduced reinforcement was adequate for modern highway traffic provided sufficient diaphragms were present. The overall structural behaviour can be accurately predicted by analysis and, with diaphragms present, can be analyzed by beam theory and proper load distribution factors.
Ontario's recent use of steel box girders with a concrete deck acting composite has produced several unique problems during and after bridge construction. It was decided that monitoring the structural response of a typical, 2-lane bridge would allow the engineer an opportunity to compare the actual bridge behaviour with the design specifications. The bridge chosen for study was the first deck having 0.3% isotropic reinforcing steel in both directions for the entire bridge length. The deck was constructed in two lifts; the second being a concrete overlay.
The testing of the bridge was multi-fold and included the following:
1. Measurement of reaction forces and structural steel strains due to dead load, temperature and live load.
2. Measurement of reinforcing steel strains due to live load.
3. Measurement of strains in the cross-bracing and intermediate diaphragms due to live load and temperature.
4. Determination of the existence of bond between the two concrete lifts.
5. Measurement of concrete deck displacements due to concentrated wheel loads.
6. Comparison of test data with analytic results whenever feasible.
Temperature and construction cross-bracing effects on overall slab behaviour are not discussed in this report,
Description of Bridge
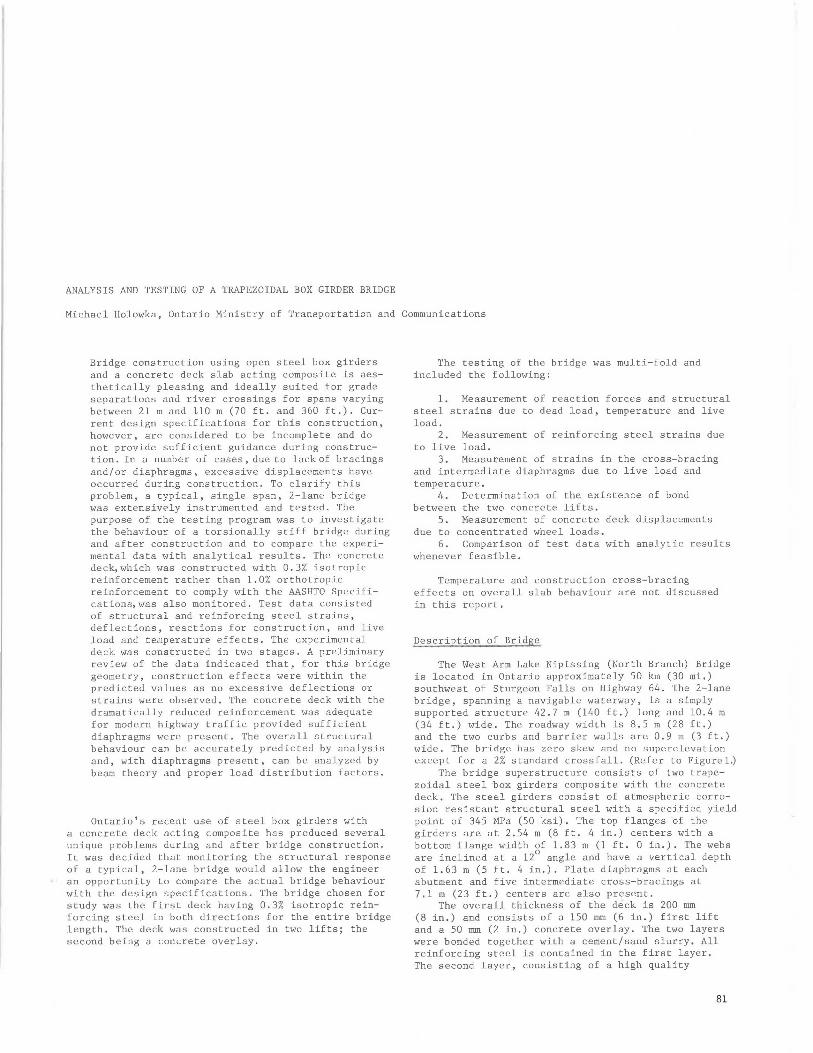
The West Arm Lake Nipissing (North Branch) Bridge is located in Ontario approximately 50 km (30 mi.) southwest of Sturgeon Falls on Highway 64. The 2-lane bridge, spanning a navigable waterway, is a simply supported structure 42.7 m (140 ft.) long and 10.4 m (34 ft.) wide. The roadway width is 8.5 m (28 ft.) and the two curbs and barrier walls are 0.9 m (3 ft.) wide. The bridge has zero skew and no superelevation except for a 2% standard crossfall. (Refer to Figurel.)
The bridge superstructure consists of two trapezoidal steel box girders composite with the concrete deck. The steel girders consist of atmospheric corrosion resistant structural steel with a specified yield point of 345 MPa (50 ksi). The top flanges of the girders are at 2.54 m (8 ft. 4 in.) centers with a bottom flange width of 1.83 m (1 ft. 0 in.). The webs are inclined at a 12° angle and have a vertical depth of 1.63 m (S ft. 4 in.). Plate diaphragms at each abutment and five intermediate cross-bracings at 7.1 m (23 ft.) centers are also present.
The overall thickness of the deck is 200 mm (8 in.) and consists of a 150 mm (6 in.) first lift and a 50 mm (2 in.) concrete overlay. The two layers were bonded together with a cement/sand slurry. All reinforcing steel is contained in the first layer. The second layer, consisting of a high quality
81

82
concrete, is expected to provide protection for the reinforcing steel against corrosion. This deck is part of the Ministry's experimental project on developing self-protecting, durable bridge decks. Corrugated stay-in-place formwork was used inside the steel boxes except for a 6.1 m (20 ft.) section at mid-span of the east box girder. At this section between the two boxes and for the cantilever, normal plywood forms were used. AASHTO (_!) and CSA Cl) design specifications were used for the entire bridge design except for the concrete deck. (Refer to Figure 2.)
The reinforcing steel requirements for the deck were based on the proposed specification of the Ontario Highway Bridge Design Code. The reinforcing consists of lS mm (114) bars at 2S4 mm (10 in.) centers in both longitudinal and transverse directions. This is equivalent to four layers of 0.3% isotropic steel. This percentage is based on an effective depth of 165 mm (6.S in.). The reinforcing steel requirement for the 1.37 m (4 ft. 6 in.) cantilever part of the deck follows the current AASHTO Specifications.
Instrumentation
The bridge was thoroughly instrumented to monitor reactions, strains, detlections and temperatures during various stages of the testing program. Def lection meters, optical levelling equipment, electrical and mechanic strain gauges, load cells and thermocouples were employed.
Load Cells
Load cells were used to temporarily replace the normal bearings for the duration of the test program. These load cells in the form of a barbell were available prior to the start of the project. Appropriate fixing hardware was fabricated to permit their proper installation. The load cells, as shown in Figure 3, provided a positive connection between the superstructure and the bearing plates. Consequently, the uplift forces as well as the normal reaction forces could be monitored, The individual cells had a vertical load capacity c9f 1780 kN (400 kips) in compression and 1110 kN (2SO kips) in tension. The load cells could record both vertical and horizontal forces; however, only vertical forces were measured, The south bearings were fixed while the north bearings were free to move in the longitudinal direction to accommodate ambient temperature changes.
Reinforcing Steel Strain Gauges
The reinforcing steel strains were monitored by two 90° T-rosettes mounted on a ground section of the rebar and wired to form a 4-arm wheatstone bridge. The gauge centerlines were located around the circumference of the bar 180° apart. By this arrangement, only axial forces in the bars were measured.
Grinding to prepare the bars for strain gauging application resulted in a non-uniform reduced cross section. Consequently, each bar had to be individually calibrated. A plot ot load versus strain output was obtained for each bar from which a strain reduction factor was determined to account for the variability of the cross section. This calibration assunted the normal initial sectional area as specified for that particular bar size. The reinforcing steel was strain gauged in the Ministry's laboratory and then properly positioned in the deck. A total of 14 locations were monitored. Four traverse bars, two top bars and two bottom bars were monitored at four locations. The two longitudinal loc..:itions ";.Jere ot
the centerline of the span and 3.8 m (12 ft. 6 in.) south of the centerline of the bridge, respectively. The transverse positions were at the longitudinal centerline of the bridge over both top flanges of the east girder and at the center of the east girder. Four longitudinal bars, two top bars and two bottom bars were also monitored at the mid-span and 3.8 m (12 ft. 6 in.) south of the centerline. The bars were located at the longitudinal centerline of the deck and at the centerline of the east girder. Four cantileyer bars were also monitored.
Bond Indicators
With the two-stage construction technique, there was a need to determine if the bond between the two lifts of concrete was stable when subjected to a heavy concentrated wheel load. Precast concrete cylinders SO mm (2 in.) in diameter were strain gauged and the gauged section was subsequently located at the interface between the base course and the overlay. The SO mm strain g>rnge was oriented along the vertical axis of the core.
After construction of the deck, 50 mm (2 in.) diameter holes were drilled at predetermined locations in the deck. The bond indicator was inserted and then bonded with epoxy to the existing concrete. This indicator shows only if a bond is present or absent between the two concrete layers. Provided the strain gauge is working, the bond exists. If the two layers separate, the cylinder breaks and the strain gauge stops functioning,
The 10 bond indicators placed in the concrete deck were located 4.S7 m (lS ft.) to 21.34 m (70 ft.) from the south abutment and in both the positive and negative transverse moment zones.
Deflections
An Ni-1 Carl Zeiss level was employed to monitor deflections. Special level rods were suspended from the underside of the bridge at the quarter span, three-eighths span and mid-span. The rods were located across the width of the bridge to provide a transverse deflection profile at these locations.
Structural Steel Strain Gauges
A total of 68 uniaxial strain gauges were installed to monitor strains in the structural steel. The gauge configuration was chosen so that only strains in selected directions were measured. A single active arm of an SR4 gauge, type FAE-S0-12S6 (G.F. =
2.06 ± 1%, 120.0 ± 0.2 ohm), was used with a 3-arm bridge completion tab. All gauges were applied at the structural steel fabricators shop prior to erection. Figure 4 shows the location of the gauges.
The trapezoidal box girders were instrumented at mid-span only. The east girder (site lE) was heavily gauged at 12 locations with 34 strain gauges. The inside and outside of each girder were instrumented so that bending and axial forces could be monitored, Longitudinal strains were monitored with 18 gauges, transverse strains with 16 gauges. The west girder site lW was instrumented with 10 gauges on the inside of the girder to check the symmetrical behaviour of the girders.
Cross-bracing strains were monitored at seven locations with 24 strain gauges. Cross-bracings were instrumented inside the girders and between each girder at mid-span and at 7.11 m (23 ft. 4 in.) from the south bearing, as sl1uwu lu F lgure 4. The
't. S.ABUT. BRGS
E_9.ABUT. BR89 ,
Figure 2. Cross section of bridge. ~ I
20 CLEAR COVER
Figure 4. Plan view of location of strain gauges on structural steel.
H,ABUT BRGS.
4.6
¥-"""''
't. N.ABllT. BRGS.
WEST
Wl.1.,.01!0 $THt.. IO~ G1fU:ll:H o11r110:tPHIFl:1C. CO.fUIO'l1Q1t f---_,, ffDll'ilANl" STlllU(IT, :Sf"RL
83
Figure 1. General layout of the West Arm Lake Nipissing Bridge.
EAST
Figure 3. View of installed load cells .
i SYMMETRICAL
ABOUT
NORTH ABUT. I SITE IW
SITE 1 ~ ~
SITE 1- 1 SITE IE
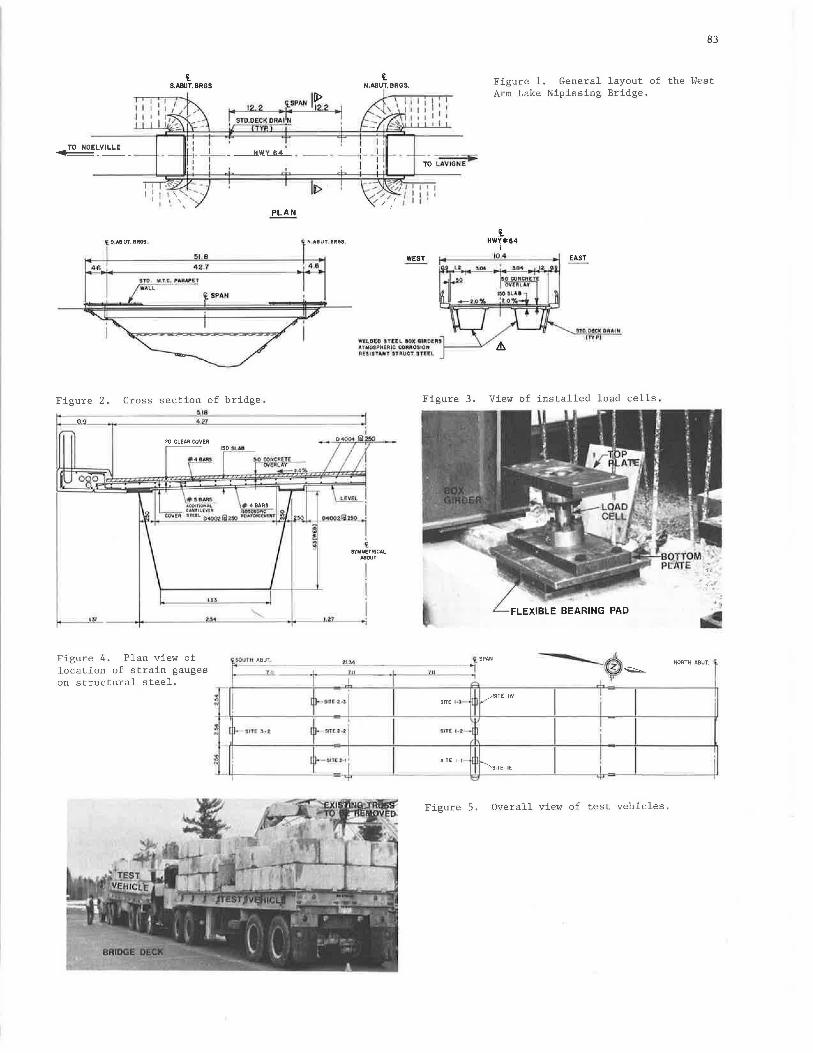
Figure 5. Overall view of test vehicles.

84
diaphragm at the south abutment between the two girders was also monitored with 6 strain gauges . This diaphragm consisted of a wide flange steel b eam plus 3 steel angles. Each angle, both flanges and the web of the beam were instrumented.
Thermocouples
Twenty-three thermocouples were installed to monitor the temperature gradient through the whole cross section of the bridge at the mid-span. Additional thermocouples were employed to measure the ambient air temperature. The thermocouples were located inside the steel box girder and on both the top and bottom faces of th e concrete deck.
Data Acquisition System
The data acquisition equipment used to monitor strain gauges and load cells was a 100-channel system which sequentially scans, measures and stores data in a memory buffer. The system was specially designed for the Ministry by Vidar Autodata Inc. and is Type Autodata 5600. The system is µe rmanent ly housed in a mobile testing van.
During the testing, the information stored in the memory buffer was processed. A hard copy of the data was available for data analysis and reference during testing. Simultaneously, a punched paper tape with the data in binary format was produced which could subsequently be used for computerized data reduction . The PDP-8 mini computer of the system conver ted all strain data to engineering units of stress, load etc., via separate calibration factors for each input channel.
Test Loading
The two test vehicles used were 5-axle tractor semi-trailer combinations (Figure 5). The magnitude of the axle loads could be varied by placing on the trailer concrete ballast blocks each weighing 9.5 kN (2.125 kips). The number and position of blocks controlled the axle weights with a maximum gross vehicle weight of approximately 890 kN (200 kips).
Four load leve ls ranging in gross test vehicle weight from 490 kN (110 kips) to 890 kN (200 kips) were used to monitor the linearity of structural responses to incremental loading. With this setup, test data could be immediately examined at the lower loads to determine if any overloading would occur and to provide a warning signal against unexpected failures. Axle weights are given in Table 1.
Numerous static load tests were carried out with the test vehicle in different longitudinal and transverse positions to cover significant and governing design cases. Figure 6 shows the eight longitudinal line configurations and Figure 7 the six load locations along the length of th e bridge. These were designed to provide concentric and eccentric loads and checks on symmetry by employing one and/or two trucks per lane. Generally, load location 4 gave the maximum overall tlexural ettect. Detlections, strains and reactions were monitored for 48 load positions for each load level.
The concrete deck was tested to measure the response of the concrete slab to a concentrated point load. A concentrated point load of 445 kN (100 kips) was applied to the deck at 14 different locations. The point load was applied by an hydraulic ram through two neoprene pads 250 mm by 250 mm (10 in. by 10 in.) in size, which model the effective footprint of a dual tire ~heel. The load was positioned along a top
flange, the centerline of the bridge and the centerline of the east girder. The r einforcing steel strains, the localized concrete deck deflections and the applied load were simultaneously monitored.
Test Results and Comparison
Static Load and Reactions
The individual reactions at both north and south abutments were monitored for all load locations and load levels. Table 2 gives the total reaction for both the south and north ends for load level 3. This value is the algebraic sum of the four load cells at each end. Table 2 also shows the total reaction at each support by assuming the bridge to be a simplysupported beam. The maximum deviation between theoretical and experimental values was 53.4 kN (12 kips) except for line 5, load location 4. In most cases, the experimental values were less than the theoretical results. On the average, test data were approximately 5% lower than expected. Ther e are a number of possibl e sources of error to explain this variation such as calibration error, vehicle weight and location error, lead wire attenuation error and the transfer of load to abutment through barrier wall, guardrail or deck expansion joint.
The naximum observed reaction at load level 3 due t o one vehicle loading or one vehicle per lane loading was 445 kN (100 kips), and was caused by one lane loaded with the vehicle adjacent to the east curb. This represents 73% of the total end reactions produced by the loading. The current design practice in Ontario is to distribute the load in equal proportions to each bearing; in this case 50%. This practice may seriously underestimate the actual reactions by approximately 50% and consequently ca use overloading in the bearing. By using 75%, the
revised design dead load plus the live load of 868 kN (195 kips) wo uld just overload the bearings originally proposed which had a capacity of 846 kN (190 kips). The Quest program (d_) adequately predicts withLn 10% the maximum reaction for a bearing.
Figure 8 illustrates the distribution of reactions at a girder end for the eccentric load case of line 2 and the concentric load case of line 5 for load level 4. It can be seen that reactions are not uniformly distributed and in fact are governed by one v e hicle positioned adjacent to the curb. This maximum reaction is approximately 20% greater than that due to a uniform distribution of r eactions caused by a single vehicle per lane loading. Figure 8 also shows the analytical reactions from the Quest program (]) for load location 4.
Deflections
Typical deflection data at the centerline of the span are shown in Figure 9 . Due to time and weather limitations, only load levels 1, 2 and 3 at various selected locations were monitored for deflection. A total of 11 readings at each test section were taken. For symmetric loading the deflection was constant across the section; an example is test 3-4-4. For eccentric loading, the deflections were linear; an example is test 1-6-4. This linearity of deflection is believed to be the consequence of the high torsional rigidity of the closed se~tions.
The comparison between experimental and theoretical results indicate a good correlation. In all cases, the analytical deflections were numerically greater than the experimental ones; however, the pattern of deflections WH8 iJe1LLl~al. Tl1is di8crep-

Figure 6. Longitudinal line locations.
BRIDGE
~~ "' Ii.
1~2 0
J.22 ...ill. ..,
4 --1.&..._ 914
F rosri "TRUCK LI~ N
~ t.TRUCK
TRUCK
' TRUCK TRUCK
T11JCI( TillJO<
·TRUC1<S
t 6 10 APART
b JlUCll
j ·TRVCI S
I
I 610 MIR
LONGITUDINAL LINES FOR TEST TRUCK LOCATION
Figure 8. Plot of individual reactions for various loadings.
I
2
3
4
5
6
1
8
0
WEST EAST
z ...
z ... z 0
ti <( UJ a:
\HI TEST No.4-2-1 AND -2- 4
-100 ANALYSIS
0 TEST No.4-2-4
100 TEST No.4-2-1
TEST No.4 -5-1 AND 4-5-4
0
100 ANALYSIS
20 TEST No.4 -5-4
300
400 TEST No.4-5-1
50
Table 1. Axle weights of testing
-100
0
100
200
300
400
500
0
100
200
300
400
500
trucks.
Load Values (Kenworth) kN Load Values (Mack) kN
Load Front Tractor Trailer Front Tractor Level Total Axle Tandem Tandem Total Axle Tandem
500.2 53 .4 223.8 222.9 504.6 64.1 218.9
629.2 51.6 282.1 294.1 655.5 67.6 291.9 3 769.4 54.7 358.2 356.4 778.8 70,3 353.3 4 892.7 57.9 417.4 417.4. 911.8 73,0 420.1
Trailer Tandem
221.2
295.9 355.1 418.7
85
Figure 7. Load location along the length of the bridge.
<i SOUTH I BEARING
1
15.24
19.50
377
28.04
·36.58
NORTH BEARING ct
! I
- FOR SINGLE TRUCK PER LANE, CENTERLINE OF TRACTOR TANDEMS OF TRUCKS ARE USED AS REFERENCE POINT.
- FOR TWO TRUCKS PER LANE, CENTERLINE OF TRAILER TANDEMS OF FIRST TRUCK (MACKI ARE USED AS REFERENCE POINT. CLEAR DISTANCE BETWEEN THE TWO TRUCKS IS 0.6 METRES.
Figure 9. Transverse deflections at centerline of span.
i BRIDGE
EXPERIMENTAL --- I ,., I •~4 I L23 ANALYTICAL ---- I (QUEST)
I I
W£ST I EAST
I I I I
I I O TE~T No. 1-1 -4
IC "-0
I 0
2(---- ----- - , ----t---- 2 • 0.
--------- -.,__ _ 3( -
O TEST No 2- 3-4
I 10
20 - I
30- I--------- - -----... _ --- ·- ·---- _,_ 40-
I O Tl!STNo. 3 - -4 I
! 10
w _ ·- - ---- >-- --- ·- -O TEST No . . 3-2-4
I
- - -------- --1 ~ ....... __ 20 -- - ... ----30
TEST No. 3·~ - 4
10
20
I ~o
•O----- -- - ... -
3 0
0
I 0
2 0
30
0
I 0
0
0
I 0
• e
0 ~ 2
3 0
0
I 0
2 0
3 0
4 0
e e

86
ancy could be eliminated by assuming a modulus of elasticity for the concrete greater than that based on 27 600 kPa (4000 psi) compressive strength or by normalizing the deflections.
Twenty-eight day cylinder results indicated an average compressive strength of approximately 34 450 kPa (5000 psi), thereby confirming the above assumption.
Cross-Bracing Strains
The instrumented cross-bracings were monitored during construction and load testing. The maximum strain observed during construction of the 6-inch base course of the deck was 150 microstrain. This represents a maximum stress of 29 000 kPa (4350 psi). Only the horizontal members showed any strains; strains for the diagonal members were essentially zero. Immediately after placing the concrete, the strains varied between 35 and 150 microstrain. At the end of the monitoring period, 24 h after the finish of the pour, the strains ranged between 0 and 60 microstrain. The bracing at the south abutment showed the largest variation in strain (+150 to -100 microstrain). It can be concluded that only minimal bracing is required for this typical 2-lane bridge.
During the live load testing and with the construction bracing in place, the maximum observed strain was 218 microstrain or a stress of 43 600 kPa (6300 psi) in tension. Maximum compressive stress was 39 600 kPa (5700 psi). With the construction bracing removed, the maximum observed cross-bracing stresses showed no significant change from the observations with the construction bracing in place. This was expected since the construction bracing was required only during the deck placing to compensate for possible eccentric construction loading since the individual boxes would be torsionally weak at this stage.
Structural Steel Strains
The trapezoidal box girders were monitored at mid-span for steel strains in both the longitudinal and transverse directions for all the load positions outlined in Figures 6 and 7. The observed strains were then compared with theoretical results obtained from the Quest program (3). In all cases the correlation between the exp-;rimental and theoretical longitudinal strains was very good. For brevity, only a limited number of results and comparisons are presented in this paper.
The Quest program was developed in England by the Ministry of Environment for the linear elastic analysis of box girder bridges using the finite element method. The box girder bridge was modelled by quadrilateral thin shell finite elements which are capable of simulating membrane and flexural behaviour. The program considers six degrees of freedom at each node of the element mesh. The input consists of the overall geometry of the bridge, the material properties, and the loading and boundary conditions. The output includes nodal displacements, boundary reactions, and element nodal stress resultants and extreme fibre stresses.
A total of 263 nodes and 293 elements were used to model the bridge. The effect of the barrier wall and curbs was also included by approximation of the cross section. The analysis was performed for girders with and without constructing bracing and indicated that there was no significant difference in the strain levels of the trapezoidal girders under live load.
Figure 10 shows typical longitudinal strain results for various load positions. A comparison of results at the centerline of the span with the test vehicles at load location number 4 is available. Only the final load level number 4 results, corresponding to total truck loads of approximately 900 kN (202.5 kips), are shown. Results from load levels 1 to 3 were used to indicate linearity with load. Linearity was excellent and consequently the lower level loading showed the same distribution and comparison of strain except for smaller magnitudes. Strain data is shown in: lOa for one truck concentric; lOb for one truck eccentric; lOc and d for two trucks side by side with one truck per lane; and lOe for two trucks per lane eccentric. In Figures b, c, and e, the truck is adjacent to the curb.
The strain data for both exterior and interior surfaces of the steel box is given. The analytical results are indicated by a solid line. The maximum observed strain due to live load was 385 microstrain or 76.9 MPa (11,200 psi) and occurred when both lanes were 1 mided with one truck each. This represents a symmetric loading and consequently the load is unifor1nly <listribute<l across Lhe width o[ Lhe bridge. With only one truck on the bridge, the maximum observed strain was 237 microstrain or 47.4 MPa (6,900 psi) and corresponded to 62% of the maximum observed strain caused by two trucks.
In most cases the longitudinal strains measured in the web showed good agreement with theoretical predictions. The largest strain discrepancies occurred at the top flange. This was perhaps due to the fact that the corresponding nodal point was at middepth of the concrete deck in the idealization procedure. This change in location for theoretical and experimental points probably caused the strain differences.
Based on the experimental strains, the load distribution factor for this bridge may be considered to be one lane per girder. The corresponding AASHTO distribution factor for the bridge is specified as 2.225 times a wheel load. This is equivalent to 1.113 times a truck or lane loading and consequently overestimates the actual distribution by about 11%.
Further investigation was made to determine the effect of the barrier wall on the longitudinal steel strains. Figure 11 shows the effect of the barrier wall for two load cases. Figure lla shows the barrier wall effect when the bridge is loaded by the critical governing load case, while Figure llb shows the barrier wall effect when the bridge is subjected to an eccentric load. For the critical load cases and with no barrier wall, the strains increased by an average of 11.75% for both box girders. For the eccentric load, the strains increased by 10% for the west girder and by 16% for the east girder. It should be noted that the barrier walls had no significant effect on the pattern of load distribution for the governing load location.
Using the standard Ministry design program and design approach, the maximum stress due to one test vehicle per lane was 95.4 MPa (13.85 ksi). The maximum observed strain and hence stress was 76.9 MPa (11.2 ksi). If the observed values are increased by 10% to account for the barrier wall effect, the maximum observed stress is 11% lower than the stress based on design assumptions. This is acceptable and indicates that simple beam theory, with the correct section idealization plus the correct distribution factor, can be used to accurately design this type of bridge.

Figure 10. Structural steel box girder longitudinal strains.
LOAD LEVEL NO, 4 LONGITUDINAL LINE NO I
} BRIDGE
ONE TRUCK
-ANALYSIS 0 INSIDE STRAIN GAUGES
m c:J OUTSIDE STRAIN GAUGES
a
201
0 192°""-·::'.··=-----195
c
LOAD LEVEL NO. 4 LONGITUDINAL LINE NO. 2
LOAD LEVEL NO 4 LONGITUDINAL LINE NO 4
ONE TRUCK ...
\ WE.$T
0 381
LOAD LEVEL NO. 4
I, )
LONGITUDINAL LINE NO, 5 ONE TRUCK
d
e
0 38-,-----390
LOAD LEVEL NO, 3 LQH(U TUOINAL U"t t'Q. 8
- 56 -69
s 218
228
i92~•93• "'STRAINS x 10-6
0
•STRAINS It 10°6
BRIDGE
L83
ONE Tftlk:K
, ..
BRIDGE ONE TRUCK
I BRIDGE
I l8'J
387_GJ G> 0 fl 390 11
11 STRAIN 1110
6
TWO TRUCKS
up
-77 -83
302~~286. "'STRAIN 1110"6
0
305
87
Figure 11. Effect of barrier walls on longitudinal strains.
a
LOAD LEVEL NO. 4 LONGITI.JOINAL LINE NO. !5 LOCATION: CENTERLINE OF SPAN
a£ TRUCK Ct£ TRUCK
,._~..,._-..... ~+~~·~,~~·~·~·-~ \ EAST
--Witlt~fl''ll'Al.J..5 ----- WlnWT tlAAfhlHWAU..S
UlADLEVEL N0,4
LONGITUDINAL LINE NQ 6
LOCATION , CENTERLINE OF BRIOOE
.. ... tU ..J1u ~L. ---;fl-
-- WITH BARRIER WALLS ----- W!.1..auT 8AffRIEA WAUS
TWO TRUCKS

88
Concrete Deck
The deck was tested to evaluate the bond between the two concrete lifts and to monitor the behaviour under a concentrated load.
Ten locations were tested with the 445 kN (100 kips) concentrated load. The load was applied adjacent to the bond indicator gauges which were continuously monitored during testing. No failure of any gauge occurred thereby indicating the absence of any bond failure. After the completion of the overall load tests, these gauges were again checked and found functioning; thereby, indicating no loss of bond between the two concrete lifts.
Typical load versus deflection plots are given in Figure 12. The load is plotted on the vertical axis with the vertical displacement on the horizontal axis. The vertical displacement at the centerline of the two pads was continuously measured as the load was applied. This vertical displacement was measured with respect to the displacement rig supports which were remote from the concentrated load and generally located directly over the top flanges of the hox girders. The load was cycled between 0 and 445 kN (100 kips) until the load deflection curve was repeatable. As Figure 12 shows, the number of load cycles required was 3 to 4. The initial loading cycle was offset minimally due to initial microcracking of the concrete deck so that internal arching action could be developed.
The load/deflection plot of Panel 1-3 was typical of the concrete deck, with stay-in-place formwork between the top flanges of a box. Panel 1-4 was typical of the concrete deck, without stay-inplace formwork, between the top flanges of a box. The load/deflection curve of the concrete deck between the two boxes was between the two plots given in Figure 12. Table 3 lists the vertical deflection under the concentrated load for six positions along the span for the concrete deck spanning between the boxes and spanning from top flange to top flange of the east box. The deflections ranged from 0.737 mm to 1.88 mm (0.029 in. to 0.074 in_,). This corresponds to a span/deflection ratio of 1350 to 3450. The two panels corresponding to the design assumptions indicated restraint factors, based on deflections, of between 0.75 and 1.0. The design process assumes a minimum restraint factor of 0.50.
The only difference in the bridge between the November 1976 and May 1977 tests was the removal of the construction cross-bracing between the two box girders. The average difference in the vertical deflection under the concentrated load between'the two series of tests was 1.6% (Table 3). Therefore, no significant difference existed between the two tests. Consequently, the construction cross-bracing did not affect the behaviour of the slab with respect to isolated wheel loads.
Approximately 3 months after the load testing of May 1977, a hairline crack appeared in the concrete overlay adjacent to the interior top flange of the west girder. The crack extended 20 m (65 ft.) and from approximately quarter span to quarter span. This crack had not been visible at the time of load testing.
Subsequent analysis of the bridge, with and without the construction cross-bracing, indicated that maximum concrete stresses in the order of 3240 kPa (325 psi) could be developed at the above location once the cross-bracing had been removed (Figure 13). These stresses were caused by a test vehicle at load level 4 adjacent to the east curb and barrier wall. For the same load but with the construction cross-bracing in place, maximum concrete strains of only 1100 kPa (160 psi) could be expecred above rhe inr:erior r:op flange of the
west girder. Stresses at the crack location increased by approximately 100% when the construction crossbracing was removed.
Consequently, the cross-bracing between twin box girders should have been left in place to achieve a crack free concrete deck.
Reinforcing Steel Stresses
Reinforcing steel stresses in both the longitudinal and transverse direction were monitored at 17.56 m (56.5 ft.) and 21.34 m (70 ft.) from the centerline of the south bearings. For the concentrated wheel load testing, significant reinforcing steel stresses occurred only when the load was at the same location as the gauges. Maximum observed transverse reinforcing steel stresses were 128 MPa (18.64 ksi) and longitudinal stresses were 100 MPa (14.5 ksi). Maximum reinforcing steel stress in the top steel over the top flanges was found to be negligible. The above stresses were caused by a 445 kN (100 kips) simulated wheel load~ These reinforcing steel stress levels were less than that permitted by the AASHTO Specl(lcaLlon8 for working stress design even though the load was 4.8 times greater and the reinforcing steel quantity approximately 3 times less. This is another indication that deck slabs do not behave as assumed in design but rather by internal arching action (!:_).
The deck exhibited similar responses to a concentrated wheel load similar to the test panels of the Conestoga River Bridge (5).
Reinforcing steel stresses ;ere also monitored during the load testing portion of the overall program. With the bridge loaded with two 890 kN (200 kips) trucks, the maximum reinforcing steel stresses observed were 68.9 MPa (10 ksi) in tension and 20.7 MPa (3 ksi) in compression. For this bridge, the testing of the slab with the concentrated wheel load was a more severe case than with the overall heavy truck loads.
Conclusions
1. For this type of cross section, no eccentric construction loading was present and consequently no substantial construction cross-bracing strains were observed, indicating that only minimal construction bracing is required.
2. With the two-stage concrete deck construction technique, only a good natural bond between the two layers is required to prevent slip at their interface.
3. The concrete deck with 0.3% isotropic reinforcement is adequate for modern highway loading. However, to prevent longitudinal deck cracking over the top flange, the construction bracing of the type used for this bridge should be left in place.
4. Deflections, reactions and stresses can be adequately predicted by proper analysis (l_). It appears that beam theory and correct distribution factors are adequate for the design of bridges similar to the bridge geometry tested.

References
1. AASHTO. Standard Specifications for Highway Bridges. American Association of State Highway and Transportation Officials, eleventh edition, 1973.
2 . CSA. Design of Highway Bridges. CSA Standard S6 - 1974, Canadian Standards Association.
3 . HECB/B/14 (Quest). Highway Engineering Computer Branch, Department of the Environment, London, England.
4 . B.E. Hewitt and B. deV Batchelor. Punching Shear Strength of Restraint Slabs. Journal of the Structural Division ASCE, No. ST9, September, 1975.
5. R.A. Dorton, M. Holowka and J.P.C. King. The Conestoga River Bridge - Design and Testing. Canadian Journal of Civil Engineering, V4, No. 1, pp. 18-39, 1977.
3000
2'°°
Table
Load Location
4
5
6
Load Location
2
3
4
5 6
Load Location
2
3
4
5
LOAD LEVEL NO. 4 LONGITUDINAL LINE NO. 2 LOCATION: CENTERLINE OF SPAN
WEST
2. Reaction data - test and
Experimental Results
Beam Analysis Line 1 Line 2
Rsouth RNorth Asouth RNorth Rsouth
623 .5* 145.9 596.3 125.5 609.5
546 .5 222.9 520.4 197.1 546.5
469.6 299.8 445.8 271.4 475.7
390.3 379.1 372.2 345,1 402.0
315.7 453 .7 303.8 397 .1 321.5
161.8 607 .6 154,8 578.5 156.5
Beam Analysis Line 4 Line 5
A south RNorth Asouth A North Rsouth
1249.1 299,0 1193.1 269.3 1193.5
1094.3 453.9 1042.0 415.8 1044.7
939 .8 608.3 891.4 566.4 897 ,8
786 .3 761.8 749.4 717.7 896.5
631.0 917.1 598.2 875.5 603.3
320.4 1227.8 301.8 1182.9 303.8
Beam Analysis Line 7 Line 8
Rsouth A North A south A North A south
879.8 311.9 844,2 288.0 840.7
934 .5 435 .7 937.6 401.5 893.8 957.6 590.5 977.4 553.0 924.8
833.9 745.4 833.4 715.4 782.6
648.4 899 .8 689.8 863.9 635.6
1.83m
analysis
Line 3
RNorlh A south
131.4 598.0
205.9 524.5
279.8 447.5
351.5 376 .5
435.8 295 .2
589.1 150.3
Line 6
RNorth Rsouth
271.0 1193.2
429.5 1042.5
574.9 897 .2
653.6 805.4
876.2 619.0
1182.6 301.4
A North
281.1
406.5
554.4
699 .5
853.0
+
A North
130.9
199.5
284.0
346.0
418 .9
575.0
A North
275.3
429.3
570.3
725.2
869.8
1184.1
6 425.4 946.1 419.4 904.9 339 .9 878.3 •All values in kN,
89
Figure 12. Typical load-deflection plots of concrete deck.
DISPLACEMENT (mm) 450~--~--~--~--~~-~
350
3001- - -1--
200I- --+
0,5 1.0 o~~--=-0~5~~~1.~0~~~1.5=--~~2.~0~~~25
ONE TRUCK . l.83m ·l
Figure 13. Effect of construction cross-bracing on transverse concrete negative stresses.
--- NORMAL BRACING - - - - WITH CONSTRUCTION BRACING --·--·- NO BRACING
Table 3. Slab deflections due to concentrated wheel load.
Maximum Slab Maximum Slab Deflection (mm) Deflection (mm)
Panel Location November 1976 May 1977
Centerline of east box girder - 4 .57 m from centerline of south bearings -&tay-in-place forms present. 0.838 0.838 Center I ine of east box girder - 9.14 m from centerline of south bearings -stay-in-place forms present, 0,838 0.838 Centerline of east box girder- 13.72 m from centerline of south bearings -stay-in-place forms present. 0.737 0.787 Centerline of east box girder- 17.56 m from centerline of south bearings. 1.854 1.880 Centerline of east box girder- 21 .34 m from centerline of south bearings. 1.422 1.676 Centerline of east box girder- 25,91 m from centerline of south bearings -stay-in-place forms present. 0.864 0.914
Centerline of bridge - 4.57 m from centerline of south bearings. 0.991 Centerline of bridge - 9.14 m from centerline of south bearings. 1.067 1.041 Centerline of bridge - 13.72 m from centerline of south bearings. 1.143 1.270 Centerline of bridge - 17 .56 m from centerline of south beiarings. 1.219 1.041 Centerline of bridge - 21 .34 m from centerline of south bearings. 1.041 1.143 Centerline of bridge - 25.91 m from centerline of south bearings. 0.914 0.94Q