Embed Size (px)
Citation preview
NUREG-1715, Vol. 3
Component Performance Study- Air-Operated Valves, 1987-1998
Commercial Power Reactors
U.S. Nuclear Regulatory Commission Office of Nuclear Regulatory Research Washington, DC 20555-0001

AVAILABILITY OF REFERENCE MATERIALS IN NRC PUBLICATIONS
NRC Reference Material
As of November 1999, you may electronically access NUREG-series publications and other NRC records at NRC's Public Electronic Reading Room at www.nrc.gov/NRC/ADAMS/index.html. Publicly released records include, to name a few, NUREG-series publications; Federal Register notices; applicant, licensee, and vendor documents and correspondence; NRC correspondence and internal memoranda; bulletins and information notices; inspection and investigative reports; licensee event reports; and Commission papers and their attachments.
NRC publications in the NUREG series, NRC regulations, and Title 10, Energy, in the Code of Federal Regulations may also be purchased from one of these two sources. 1. The Superintendent of Documents
U.S. Government Printing Office Mail Stop SSOP Washington, DC 20402-0001 Internet: bookstore.gpo.gov Telephone: 202-512-1800 Fax: 202-512-2250
2. The National Technical Information Service Springfield, VA 22161-0002 www.ntis.gov 1-800-553-6847 or, locally, 703-605-6000
A single copy of each NRC draft report for comment is available free, to the extent of supply, upon written request as follows: Address: Office of the Chief Information Officer,
Reproduction and Distribution Services Section
U.S. Nuclear Regulatory Commission Washington, DC 20555-0001
E-mail: DISTRIBUTION @nrc.gov Facsimile: 301-415-2289
Some publications in the NUREG series that are posted at NRC's Web site address www.nrc.gov/NRC/NUREGS/indexnum.html are updated periodically and may differ from the last printed version. Although references to material found on a Web site bear the date the material was accessed, the material available on the date cited may subsequently be removed from the site.
INon-NRC Reference Material
Documents available from public and special technical libraries include all open literature items, such as books, journal articles, and transactions, Federal Register notices, Federal and State legislation, and congressional reports. Such documents as theses, dissertations, foreign reports and translations, and non-NRC conference proceedings may be purchased from their sponsoring organization.
Copies of industry codes and standards used in a substantive manner in the NRC regulatory process are maintained at
The NRC Technical Library Two White Flint North 11545 Rockville Pike Rockville, MD 20852-2738
These standards are available in the library for reference use by the public. Codes and standards are usually copyrighted and may be purchased from the originating organization or, if they are American National Standards, from
American National Standards Institute 11 West 42"d Street New York, NY 10036-8002 www.ansi.org 212-642-4900
I
Legally binding regulatory requirements are stated only in laws; NRC regulations; licenses, including technical specifications; or orders, not in NUREG-series publications. The views expressed in contractor-prepared publications in this series are not necessarily those of the NRC.
The NUREG series comprises (1) technical and administrative reports and books prepared by the staff (NUREG-XXXX) or agency contractors (NUREG/CR-XXXX), (2) proceedings of conferences (NUREG/CP-XXXX), (3) reports resulting from international agreements (NUREG/IA-XXXX), (4) brochures (NUREG/BR-XXXX), and (5) compilations of legal decisions and orders of the Commission and Atomic and Safety Licensing Boards and of Directors' decisions under Section 2.206 of NRC's regulations (NUREG-0750).

NUREG-1715, Vol. 3
Component Performance Study-Air-Operated Valves, 1987-1998
Commercial Power Reactors
Manuscript Completed: June 2001 Date Published: July 2001
Prepared by J.R. Houghton
Division of Risk Analysis and Applications Office of Nuclear Regulatory Research U.S. Nuclear Regulatory Commission Washington, DC 20555-0001

ABSTRACT
This report documents an analysis of the performance of safety-related air-operated valve assemblies (valve body and pneumatic operator subcomponents) used in the pressurized water reactor (PWR) and in the boiling water reactor (BWR) riskimportant systems in U.S. commercial power reactor plants.
Both a risk-based analysis of operating data and an engineering analysis of trends and patterns were performed to provide insights into the performance of airoperated valve components on an industry basis and comparison of results with data used by plant-specific probabilistic risk assessments. The data used in this report was from the 1987-1995 period for engineering analysis of selected risk important systems. Failure probability estimates used combined engineered safety features (1987-1998) and surveillance test data (1987-1995).
iii

CONTENTS
ABSTRACT ......................................................... iii EXECUTIVE SUMMARY .............................................. vii FOREW ORD ....................................................... xiii ACKNOWLEDGMENTS ............................................... xv ACRONYMS ........................................................ xvi 1. INTRODUCTION ............................................. 1
1.1 Purpose .................................................. 1 1.2 Background ............................................... 1 1.3 Overall Report Structure ..................................... 2
2. SCOPE OF STUDY .............................................. 3 2.1 Risk-Important Systems and Components ....................... 3 2.2 AOV Assembly Description and Boundaries ...................... 4 2.3 Data Collection ............................................ 4 2.4 Operational Data Analysis .................................... 7
3. Risk-Based Analysis ............................................ 9 3.1 Calculation Results ......................................... 9 3,2 Common-Cause Failure Events .............................. 11 3.3 Comparison With IPEs and Other Sources ...................... 12
4. ENGINEERING ANALYSES ...................................... 14 4.1 Failure Trend Analysis ..................................... 14 4.2 Component Trends in Time .................................. 16 4.3 Failure Characteristics and Their Causes ....................... 20 4.4 Related Issues ........................................... 23
5. SUMMARY OF RESULTS ........................................ 25 5.1 Failure Probabilities ........................................ 25 5.2 Engineering Insights ....................................... 26
6. REFERENCES ................................................ 27
V

CONTENTS (CONTINUED)
FIGURES
ES-1 PWR AFW System AOV Probability of Failure on Demand Comparison W ith IPE Values ..................................... viii
ES-2 PWR RHR System AOV Probability of Failure on Demand Comparison With IPE Values ...................................... ix
ES-3 PWR CVCS System AOV Probability of Failure on Demand Comparison With IPE Values ...................................... ix
ES-4 PWR AOV Failure Trend........................................x ES-5 PWR AOV Subcomponent Failure Apportionment ...................... xi ES-6 PWR AOV Assembly Failure Causes ................................ xi 1 NPRDS Database AOV Failures..................................5 2 SCSS Database AOV Failures ..................................... 5 3 PWR AFW System AOV Probability of Failure on Demand
Comparison With Values Used in IPEs .............................. 13 4 PWR RHR System AOV Probability of Failure on Demand
Comparison With Values Used in IPEs .............................. 13 5 PWR CVCS System AOV Probability of Failure on Demand
Comparison With Values Used in IPEs .............................. 14 6 PW R AOV Failure Trend ......................................... 15 7 PWR AOV Component Trends in Time ............................. 19 8 PWR AOV Subcomponent and Subcomponent Parts Failure Apportionment. 21 9 PW R AOV Failure Causes ........................................ 22
TABLES
ES-A AOV Probability of Failure on Demand .............................. vii ES-B AOV Standby Failure Rate..................................... viii F-1 Summary of Risk-Important Information and Engineering Analysis for AOVs . xiv A AOV Probability of Failure on Demand (1987-1998) .................... 10 B AOV Standby Failure Rate (1987-1998) ............................. 11 C AOV Failures in the CCF Database (1987-1995) ...................... 12 D NRC Generic Letters (GLs) and Information Notices (INs) Concerning AOV
Assemblies (1987-1998) ......................................... 23
APPENDICES
I AOV Assembly - Failure Probabilities II AOV Assembly - Component Trends in Time III AOV Assembly - Engineering Insights IV AOV Assemblies - Data Source Inputs for Reported Failures and Estimated
Demands
vi

EXECUTIVE SUMMARY
This report provides the performance evaluation based on industry experience during the 1987 through 1998 period for air-operated valves (AOVs) in the pressurized water reactor (PWR) and in the boiling water reactor (BWR) riskimportant (RI) systems. The main steam isolation valves (MSIVs) and poweroperated relief valves (PORVs) are excluded from this study because their design and operational features are different than the typical piston/diaphragm AOVs in this study. The objectives of component performance are (1) to determine the reliability of risk important components and compare the results with estimates in probabilistic risk assessments (PRAs) and individual plant examinations (IPEs) and (2) to review the operational data from an engineering perspective to determine trends and patterns and gain insights into component performance.
AOV failure and estimated demand data was obtained from two databases. The Nuclear Plant Reliability Data System (NPRDS) provided component failures and surveillance test frequencies for the 1987-1995 period. The Sequence Coding and Search System (SCSS) provided Engineered Safety Features (ESF) failure and demand data for the 1987-1998 period and some surveillance test failure data for the 1987-1995 period reported in Licensee Event Reports (LERs).
For the PWR and BWR RI systems, the AOV estimated probability of failure on demand distributions were consistent with the generic value range from NUREG/CR-4550 (used as an input to NUREG-1 150), although the PWR RHR system mean value (5.2E-4) is about a factor of 4 lower than the generic mean value (2E-3). Table ES-A lists the probability of failure on demand estimates developed for the RI systems selected for this study and the NUREG/CR-4550 values. For AOVs risk important systems, there was no statistically significant yearly trend for probability of failure on demand. Table ES-B gives the standby failure rates for each system.
TABLE ES-A AOV PROBABILITY OF FAILURE ON DEMAND
LOWER UPPER BOUND MEAN BOUND
NUREG/CR-4550 5.4E-4 2E-3 4.8E-3 PWR RI SYSTEMS auxiliary feedwater (AFW) 4.6E-6 1.8E-3 6.9E-3 high pressure injection (HPI) 4.8E-6 1.2E-3 4.7E-3 residual heat removal (RHR) 6.1 E-5 5.2E-4 1.3E-3 chemical and volume control system (CVCS) 3.5E-7 3.4E-3 1.5E-2 component cooling water (CCW) 6.7E-5 5.8E-3 2.1 E-2 BWR RI SYSTEMS reactor core isolation cooling (RCIC) 3.5E-4 3.OE-3 7.7E-3 high pressure coolant injection (HPCI) 4.3E-4 3.6E-3 9.5E-3 low pressure core spray (LPCS) 2.9E-15 2.1 E-3 1.2E-2
vii

TABLE ES-B AOV STANDBY FAILURE RATE
LOWER UPPER BOUND(A, MEAN(A) BOUND(AJu)
PWR RI SYSTEMS AFW 4.8E-7/hour 8.2E-7/hour 1.3E-6/hour RHR 6.9E-9/hour 1.3E-7/hour 6.4E-7/hour CVCS 4.OE-7/hour 6.OE-7/hour 8.5E-7/hour CCW 1.3E-7/hour 3.8E-7/hour 8.8E-7/hour
BWR RI SYSTEMS RCIC 4.1 E-8/hour 7.9E-7/hour 3.8E-6/hour HPCI 3.6E-8/hour 7.OE-7/hour 3.3E-6/hour LPCS 2.5E-7/hour 7.4E-7/hour 1.7E-6/hour
The AOV mean probabilities of failure on demand used in plant-specific IPE studies were compared with the results of this study. The PWR IPE mean values were generally consistent with the results of this study and the NUREG/CR-4550 generic values. Figures ES-1, ES-2, and ES-3 show RI systems for the PWR AFW, RHR, and CVCS systems, respectively. No comparison was made with BWR IPE mean values, since few BWR plant IPEs gave AOV failure probabilities on demand.
PROBABILITY OF FAILURE ON DEMAND 1.000E-01 . ................. .............
1 .OOOE-04
1 .0 0 E - 2 ,, .- .. ,• .- . . ... ... .. ......... ............................... 1.OOOE-0 ............. ..
1.OOOE-0. , .. ........
1.000E-07o c 1.-E0 0- z ( ILU UJ )P
LO 0 F WzL WU w LU , , 0 cc < oU) cc LU "- • O) O) n + U < L_ I
LL +L 0U I > zL
< O
REPORT/PLANT
FIGURE ES-1 PWR AFW SYSTEM AOV PROBABILITY OF FAILURE ON DEMAND
COMPARISON WITH VALUES USED IN IPEs
viii

Xi
SUdI NI u~sfl snlVA HJIM NOSIUVdflO3 GNVWV(Q NO 3uflhiv~i 1 A.LllI8VgOId AOV W31.SAS SOA3 U~d
iNV~d/lHOd3H
Sz Z m Im ~ ) -n
m n >, , > z C) m U
mV C/) 0 0 m
m l m 0l > cn < O~QO
..;: w........ ... OO GNVV ~ ...... NO ...hi~ ..O ...iV2~
UN ~ .~ NO.......0...1SV O~ AO .... .... HU W~ ~~tS0 30fl'L
i im I i N idI h i i C)300'
. . . .. .0... .. ZO300' .... ... ...
-u Z Z m
SUI -NI m~s s~lAHMNSUd
~~~0 z Z :0 >j > m rni-n> 0
~~ Cl) G)i -n Q-00
m7~O L
mQ3O
> O--OOO) -nIA~ NOCfh:dd I1IVOl
> > B0E

For the PWR RI systems during the 1987-1995 period, there was a statistically significant decreasing failure trend (see Figure ES-4, below). For BWR RI systems, no statistically significant trend was identified. Both the maintenance rule and voluntary industry joint owners group initiatives were begun during this period. While there was insufficient information available to conclude whether these initiatives caused the trend, an improvement in performance had occurred.
NO. OF FAILURES
87 88 89 90 91 92 93 94 95 CALENDAR YEARS
Ml VALVE BODY
El VALVE OPERATOR
No. PWR AOV fail.: 49
FIGURE ES-4 PWR AOV FAILURE TREND
Analysis of failure rates, as a function of component-years, showed no significant variance among the PWR plant age groups (three groups of approximately equal size, from older to newer plants by commercial operations date). The review of plant age groups did not show evidence of an increase in failure rates for any plant age groups due to aging mechanisms. For BWRs, failure data was too sparse for trending failure rates by plant age group.
X

The number of complete AOV common-cause failures (CCF) identified in this study was consistent with the expected number based on the CCF database parameters for the combined PWR and BWR complete failure population used in this study.
The AOVs have two subcomponents (valve body and valve operator). The valve operator was the biggest contributor to AOV failures (76%). Although valve operators were also the biggest contributors to BWR AOV failures, the number of failures (6) was too sparse to use. Figure ES-5 shows the PWR AOV failure apportionment.
Valve Bodies 24%
Valve Operators
No. AOV Assy failures: 49
FIGURE ES-5 PWR AOV SUBCOMPONENT FAILURE APPORTIONMENT
Failures of AOV assemblies in PWR RI systems were mainly due to age/wear (47%). Figure ES-6 shows the PWR AOV assembly failure causes.
Age/Wear 47%
Other 8%
Unknown 27%
"Des Defic 6%
Maint/Proced 12%
FIGURE ES-6 PWR AOV ASSEMBLY FAILURE CAUSES
xi

FOREWORD
This report provides information relevant to the performance of air-operated valves (AOVs). It summarizes the failure and event data used in the analysis and evaluation. The results, including failure probabilities and engineering insights, are intended to support several risk-informed regulatory activities. This includes providing information to enhance plant inspections of risk-important systems and information used to support staff technical reviews.
Findings and conclusions from the analysis of AOVs, which are based on 1987-1998 operating experience, are presented in the Executive Summary and Section 5. The results of risk-based analysis and engineering analysis are presented in Sections 3 and 4, respectively. Information to support risk-informed regulatory activities and engineering analysis related to AOVs is summarized in Table F-1. This table provides a condensed index of risk-important data and data for engineering insights in the text discussions, tables, figures, and appendices.
The application of results is intended on an industry-wide basis for AOVs. Plantspecific application may require a more detailed review of the relevant Licensee Event Reports (LERs) and in-plant validation of plant-specific Nuclear Plant Reliability Data System (NPRDS) failure history data cited in this report. Factors such as design and application of specific AOVs, test and maintenance practices, availability, and response to regulatory initiatives would need to be considered in light of specific information provided in LER and NPRDS failure records. Other documents such as plant specifications, logs, reports, and inspection reports should be reviewed during plant inspections to supplement the information contained in this report.
In addition, a review of recent LERs and plant-specific information in NPRDS or the Equipment Information Exchange (EPIX) may yield indications of whether performance has undergone a significant change since the last year of this report. A search of the LER database can be conducted through the NRC's Sequence Coding and Search System (SCSS) to identify the AOV events that occurred after the period covered by this report. SCSS is accessible by NRC staff from the SCSS home page (http://scss.oml.gov/) or in the Public Document Room (PDR). Nuclear industry organizations and the general public can obtain information from the SCSS on a cost recovery basis by contacting the Oak Ridge National Laboratory directly. NPRDS archival data (through 1996) and EPIX failure data is proprietary information that is maintained by the Institute of Nuclear Power Operations (INPO). NRC staff and contractors can access that information through the EPIX database.
Common-cause failures used in this study were obtained from the Common Cause Failure (CCF) Database. NRC staff and contractors can access the plant-specific CCF information through the CCF database which is available on CD-ROM and has been provided to the NRC Regions and NRC Office of Nuclear Reactor Regulation (NRR).
xiii
1.
2.
3.
4.
5.
6.
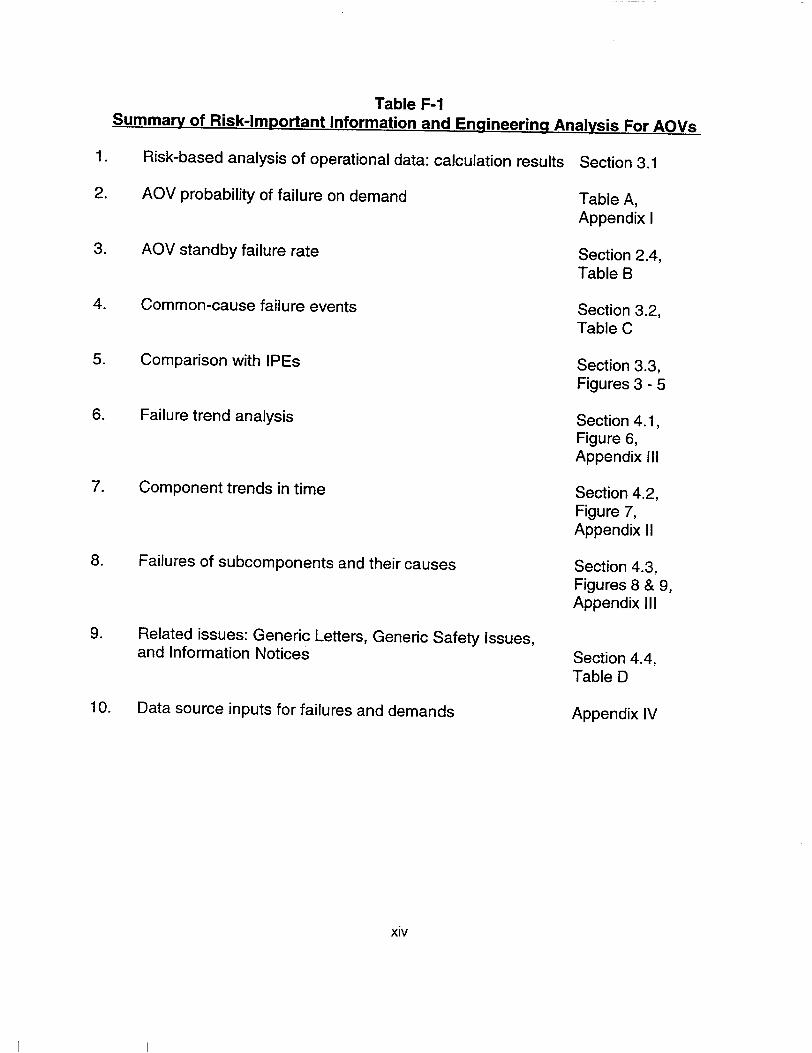
9. Related issues: Generic Letters, Generic Safety Issues, and Information Notices
10. Data source inputs for failures and demands
Section 4.4, Table D
Appendix IV
xiv
Table F-1 Summary of Risk-Important Information and Engineering Analysis For AOVs
Risk-based analysis of operational data: calculation results Section 3.1
AOV probability of failure on demand Table A, Appendix I
AOV standby failure rate Section 2.4, Table B
Common-cause failure events Section 3.2, Table C
Comparison with IPEs Section 3.3, Figures 3 - 5
Failure trend analysis Section 4.1, Figure 6, Appendix III
Component trends in time Section 4.2, Figure 7, Appendix II
Failures of subcomponents and their causes Section 4.3, Figures 8 & 9, Appendix III
7.
8.
ACKNOWLEDGMENTS
We thank our colleague Dr. Dale M. Rasmuson for his technical assistance in reviewing and presenting the statistical data. We also thank our colleague Erul Chelliah for his assistance in reviewing and verifying technical data and results.
xv

ACRONYMS
AFW auxiliary feedwater system AOV air-operated valve ASME American Society of Mechanical Engineers BWR boiling water reactor CCF common-cause failure CCW component cooling water system CVCS chemical and volume control system EPIX Equipment Performance and Information Exchange ESF engineered safety features HPCI high pressure coolant injection system HPI high pressure safety injection system INEEL Idaho National Engineering and Environmental Laboratory INPO The Institute of Nuclear Power Operations IPE individual plant examination IST inservice testing JOG joint owners group LER Licensee Event Report LPCS low pressure core spray system MSIV main steam isolation valve NPRDS Nuclear Plant Reliability Data System NRC U.S. Nuclear Regulatory Commission NRR Office of Nuclear Reactor Regulation ORNL Oak Ridge National Laboratory PORV power-operated relief valve PRA probabilistic risk assessment PWR pressurized water reactor RCIC reactor core isolation cooling system RHR residual heat removal system RI risk-important SCSS Sequence Coding and Search System
xvi
COMPONENT PERFORMANCE STUDY AIR-OPERATED VALVES, 1987-1998
1. INTRODUCTION
1.1 Purpose
This report provides the performance evaluation of air-operated valve (AOV) assemblies in the pressurized water reactors (PWR) and in the boiling water reactors (BWR) risk-important (RI) systems during the period 1987 through 1998. The objectives of this study are: (1) to determine the reliability of AOV assemblies and compare the results with estimates in probabilistic risk assessments (PRAs) and individual plant examinations (IPEs) and (2) to review the operational data from an engineering perspective to determine trends and patterns and gain insights into component performance.
This study provides an engineering analysis of the factors affecting component reliability and determined whether trends and patterns were present in the AOV operating data for the 1987-1995 period. This study was based on the actual operating history of AOVs for these safety-related, RI systems. The reliability parameters calculated in this study are the probability of failure on demand and standby failure rate. Supplemental failure and demand data for 1996-1998 from operational events (Engineered Safety Features actuations reported in Licensee Event Reports) was added to the 1987-1995 data for estimating the AOV probabilities of failure on demand when the data populations were the same.
1.2 Background
The U.S. Nuclear Regulatory Commission (NRC) PRA Policy Statement directs the staff to increase the use of PRA technology in all regulatory matters. Accordingly, the Office of Nuclear Regulatory Research (RES) Division of Risk Analysis and Application (DRAA) monitors and reports on the functional reliability of risk-important systems in commercial nuclear power plants.
Over the past decade, the NRC has issued studies applicable to AOV riskimportant systems, AOV components or their subcomponent failures, failure on demand probabilities, and trends and patterns. The following provides a listing of these studies:
1. AEOD/C701, "Air System Problems at U.S. Light Water Reactors," March 1987 (Ref. 1)
1
2. AEOD/E706, "Inadequate Mechanical Blocking of Valves," March 31, 1987 (Ref. 2)
3. NUREG-1 275, Vol. 2, "Operating Experience Feedback Report-Air Systems Problems," December 1987 (Ref. 3)
4. NUREG-1275, Vol. 6, "Operating Experience Feedback Report Solenoid Valve Problems," February 1991 (Ref. 4)
5. NUREG/CR-5497 (INEEL/EXT-97-01328), "Common Cause Failure Parameter Estimations," October 1998 (Ref. 5)
6. NUREG/CR-5500, Vol. 1, "Reliability Study: Auxiliary/Emergency Feedwater System, 1987-1995," August 1998 (Ref. 6)
7. NUREG/CR-5500, Vol. 9 (INEEL/EXT-99-00373), "High Pressure Safety Injection System Reliability, 1987-1997," October 2000 (Ref. 7)
8. NUREG-1275, Vol. 13, "Evaluation of Air-Operated Valves at U.S. Light Water Reactors," February 2000 (Ref. 8)
9. NUREG/CR-6644(INEL-95/0550), "Generic Issue 158: Performance of Safety-Related Power Operated Valves Under Operating Conditions September 1999 (Ref. 9)
1.3 Overall Report Structure
This report is arranged in six sections. Section 1 provides the introduction. Section 2 describes the scope of the study, risk-important systems, the AOV assembly and its subcomponent boundaries, and the methodology used for operational data collection and analysis. Section 3 provides the risk-based analysis of operational data, the calculation results for estimating AOV probabilities of failure on demand and standby failure rate, the contingency test for the data population, the comparison of AOV probability values with those in IPEs and other sources, and the regulatory implications of this component performance study. Section 4 provides the engineering analyses including failure trend analysis, component trends in time, the failure characteristics and their causes, a brief discussion and listing of NRC regulatory initiatives related to AOVs, and engineering insights resulting from the various analyses. Section 5 provides a summary of results, including AOV failure probabilities and engineering insights. Section 6 lists references used in the report.
The appendices provide related data used in this report and evaluation results. Appendix I provides the estimated probabilities of failure on demand
2
and calculated standby failure rates. Appendix II provides tables of data for each plant age group used to plot the component trends in time and evaluation of aging effects on AOVs. Appendix III provides data used for engineering analysis and insights for failure trends and patterns. Appendix IV provides operational data inputs for reported failures and estimated demands from the NPRDS database and LERs (SCSS database).
2. SCOPE OF STUDY
2.1 Risk-Important Systems and Components
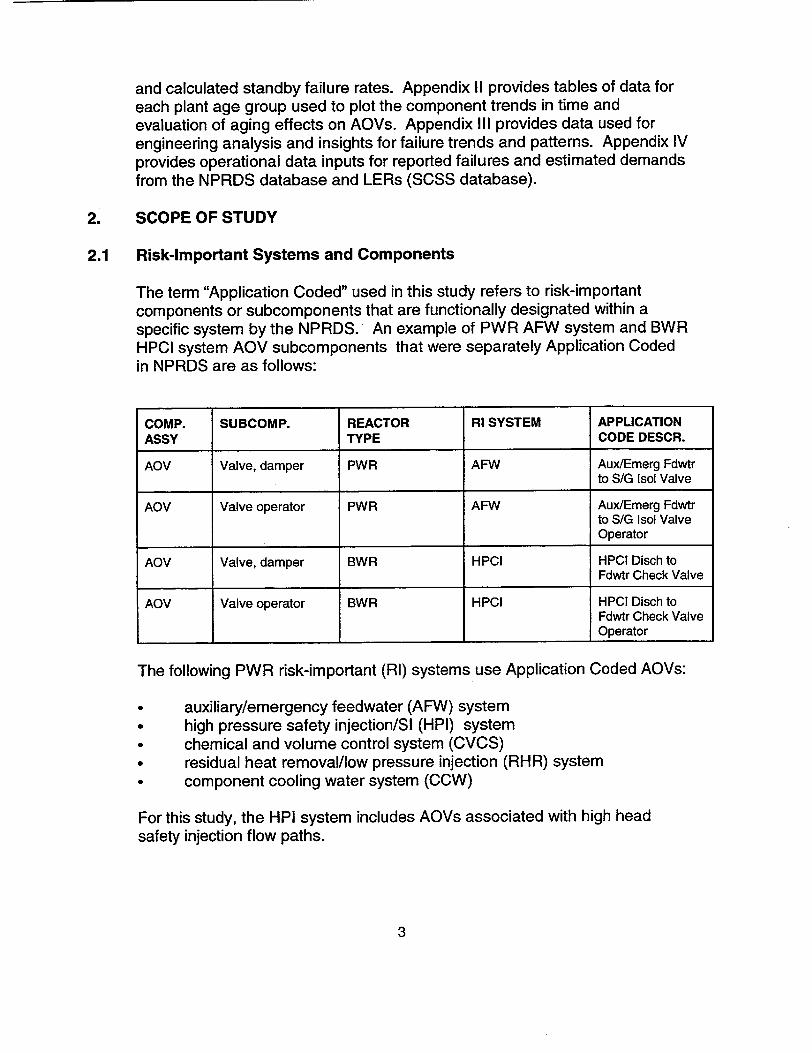
The term "Application Coded" used in this study refers to risk-important components or subcomponents that are functionally designated within a specific system by the NPRDS. An example of PWR AFW system and BWR HPCI system AOV subcomponents that were separately Application Coded in NPRDS are as follows:
COMP. SUBCOMP. REACTOR RI SYSTEM APPLICATION ASSY TYPE CODE DESCR.
AOV Valve, damper PWR AFW Aux/Emerg Fdwtr to S/G Isol Valve
AOV Valve operator PWR AFW Aux/Emerg Fdwtr to S/G Isol Valve Operator
AOV Valve, damper BWR HPCI HPCI Disch to Fdwtr Check Valve
AOV Valve operator BWR HPCI HPCI Disch to Fdwtr Check Valve Operator
The following PWR risk-important (RI) systems use Application Coded AOVs:
* auxiliary/emergency feedwater (AFW) system * high pressure safety injection/SI (HPI) system * chemical and volume control system (CVCS) * residual heat removal/low pressure injection (RHR) system * component cooling water system (CCW)
For this study, the HPI system includes AOVs associated with high head safety injection flow paths.
3

The following BWR risk-important systems use Application Coded AOVs:
* reactor core isolation cooling (RCIC) system * high pressure coolant injection (HPCI) system * low pressure core spray (LPCS) system
2.2 AOV Assembly Description and Boundaries
For this study, an AOV assembly consists of valve body and pneumatic operator subcomponents. The valve body is generally a globe or butterfly type. The pneumatic operator is generally a piston or diaphragm type actuator, designed to accommodate the system pressure/temperature requirements and the thrust requirements necessary for the valve's functional operation. Main steam isolation valves (MSIVs) and power-operated relief valves (PORVs) are excluded from this study as these are valves with different design and operating features.
The component boundaries are the AOV assembly, its subcomponents described above, and the piece parts of the subcomponents. The piece parts of the valve body are the stem, packing, and internals. The pneumatic operator piece parts may include piston internals/seals or diaphragm, positioner, mechanical linkage, volume booster, pilot valve, bolting, air regulator, air line, and wiring/contacts. Failures associated with instrument air systems (e.g., valves, regulators, backup accumulators, etc.) that are not integral to the AOV assembly are excluded in this analysis.
2.3 DATA COLLECTION
Data collection and reporting for the Nuclear Plant Reliability Data System (NPRDS) were terminated at the end of 1996. Therefore, the NPRDS does not have any failure information for the period 1997 and later. Furthermore, the 1996 failure data reported in NPRDS was not as consistent as for the 1987-1995 period (the industry was transitioning for the termination of NPRDS). The Institute for Nuclear Power Operations (INPO) has recently implemented a new component database called the Equipment Performance and Information Exchange (EPIX) system. This system is intended to replace the NPRDS system and yields additional information, such as demands and unavailability. At the time of this analysis, the EPIX system was not considered to be sufficiently mature to provide a complete data source for the 1996-1998 period for this study. Where applicable in the development of probability of failure on demand estimates for this study, the SCSS database of ESF failure and demand data (reported in LERs) were used for the 1996-1998 period.
4

The NPRDS database was used to obtain the number of Application Coded AOV assembly subcomponents. This was done for each selected RI system in PWRs and BWRs for each plant. The values developed in Appendix IV were also used in the development of all other appendices.
A detailed review and evaluation was performed of the licensee event reports (LERs) and the NPRDS failure histories to determine the total number of AOV failures used in this study. Only "complete" (i.e., catastrophic) failures were included in the failure count. For AOV valve body and valve operator subcomponents, the NPRDS "failure to close" (FC), "failure to open" (FO), and "failure to operate as required" (OR) failure modes were used for estimating probability of failure on demand. The OR failure mode included both failure to open and failure to close failure modes. Figure 1 illustrates the relationship between various NPRDS database failure data subsets.
Al All AOV assembly subcomponent failures as "complete"/catastrophic failure category (1987-1995).
Bi Subset - AOV Application Coded Bi subcomponent failures for risk
important systems. C, Ci Subset - AOV Application Coded
subcomponent failures occurring
during surveillance tests. FIGURE 1
NPRDS DATABASE AOV FAILURES
The SCSS database was used to determine the number of AOV failures, reported in LERs, that occurred during surveillance tests or that were associated with an Engineered Safety Features (ESF) actuation. The NPRDS database was used to obtain the number of surveillance test failures for each AOV subcomponent. Surveillance test failures that were reported in LERs were excluded from the NPRDS failure counts, but included in the LER failure counts. This was done to prevent "double count" of failures. Figure 2 illustrates the relationship between various SCSS database (LERs) failure data subsets.
At A2 All AOV assembly failures (1 987-1 998).
B2 Subset - AOV failures for riskBa important systems.
C2 Subset - AOV failures associated with ESFs or occurring during surveillance tests.
FIGURE 2 SCSS DATABASE AOV FAILURES
5

AOV failures that occurred during surveillance testing were directly linked with surveillance test demands to assure that surveillance test probability of failure on demand estimates were valid. Similarly, ESF failures were linked with ESF demands to estimate ESF probability of failure on demand. For most plant RI systems there are multiple trains, each train with several AOVs. Those other train AOVs that might have been actuated during pre-test or post-test system train alignment were not included in the surveillance test failure counts used in this study.
When it was determined by statistical means that the ESF failures and demands were in the same population as the surveillance test failures and demands, the total number of demands was the sum of the ESF demands and the surveillance test demands. Otherwise, the larger population surveillance test demands (and associated failures) were used to calculate the AOV unreliability.
The first step for estimating ESF demands was to determine ESF actuations, and then to determine which component type and how many components of each type were actuated by this type of demand. Other demands that may have occurred during plant operation, startup or shutdown that did not result in ESF actuations were not included in the ESF demand determination, nor were any associated failures included. However, inadvertent and spurious demands and manual actuations associated with an ESF (e.g., a reactor trip) were considered ESF demands. The SCSS LER database was used for the PWR and BWR RI systems LERs that were coded with "ESF Actuations" and those coded as "SCRAMS and Shutdowns." Each LER full text was reviewed to determine whether the selected systems were actuated, the number of trains actuated by the ESF; and the best estimate of the number of each Application Coded AOV actuated based on the plant-specific train configuration.
The second step in estimating the total number of demands was the use of NPRDS testing frequencies as the basis for surveillance test demands. This was done for the NPRDS Application Coded, functionally designated AOV assembly subcomponents in the RI systems (see Section 2.1 for the description of the AOV assembly). An estimate was made for the AOV assembly testing frequency that used the American Society of Mechanical Engineers (ASME) Boiler and Pressure Vessel Code, Section XI Inservice Testing (IST) interval requirements (as required by the Technical Specifications), the system, and the subcomponent function in the AOV assembly. Demands associated with a surveillance test that occurred during train alignment and return to the "as found" condition of a system/train were not included in the total number of demands, nor were corollary failures included in the failure count. Although the Technical Specifications generally require a system test once per refueling cycle, no additional demands were
6

included because the surveillance test frequencies used in this study (e.g., monthly, quarterly, and once per refueling outage) were assumed to envelope these refueling cycle demands.
The total number of demands for the AOVs in a specific system was the sum of AOV ESF demands and surveillance test demands, where the latter is the sum of the products of the AOVs and their estimated testing frequencies over the 9-year period (1987-1995) and the former (ESFs) is extended to the 12year period (1987-1998). However, this method is applicable when the ESF data and surveillance test data determined by statistical methods to be in the same population (see Section 3.1 for contingency tests). Otherwise, the surveillance test demands (and associated failures) were used to calculate the AOVs unreliability.
The probability of failure on demand for AOVs was estimated by dividing total AOV failures by total AOV demands (i.e, ESF failures + surveillance test failures divided by ESF demands + surveillance test demands) when the ESF data and surveillance test data were statistically shown to be in the same population. This represents an unbiased sample of the AOV performance data for calculating the reliability of AOVs because:
- The ESF demands and surveillance tests reasonably reflect the ability of the AOVs to perform their risk-significant function.
- It is possible to count both the demands and the failures for these groups.
- It is possible to determine statistically if data from ESF demands and surveillance tests can be pooled.
AOV surveillance tests and ESF actuations do not typically reflect designbasis conditions. Therefore, they do not characterize the ability of the AOVs to perform under design-basis conditions which are generally more severe and occur less frequently than the risk-significant safety function conditions.
2.4 Operational Data Analysis
A contingency test was performed to not reject or to reject the hypothesis that failure and demand data from surveillance testing of Application Coded AOVs were in the same population as ESF failure and demand data. The analysis was performed using data for the AOVs in the PWR and BWR RI systems during the 1987-1995 period. A subsequent contingency test is performed to determine whether ESF data from the 1996-1998 period is in the same population as the combined ESF + surveillance test data from the 1987-1995 period.
7

The approximate method for contingency tables (chi-square, one degree of freedom, 0.95 quantile), was used for the not reject hypothesis that the ESF and surveillance test data are from the same population (X2 < 3.84). The contingency table provides a short-cut method of computing chi-square using the following 2X2 table and formula:
X' = n (ad - bc)2 ; where: n = a + b+ c+ d and k = (a+b)(c+d)a+c)(b+d) k
ESFs SURVEILLANCE TEST TOTAL
NO. of a b (a + b) FAILURES
NO. of c d (c + d) SUCCESSES
TOTAL (a + c) (b + d) n (DEMANDS)
Alternate Method (to correct for continuity), formula:
X 2=• n (I ad-bcl - n12) 2
k
Bayes Method
The Bayes method (Ref. 11), as applied to this study for AOVs by plant system, assumes that the probability of failure on demand varies from plant to plant according to a beta distribution. The parameters for this distribution were estimated from the pooled data by maximum likelihood. For each plant, this distribution was used as a Bayes prior distribution, and updated with the plant-specific failure data. This method was used in this study for the PWR and BWR Rf systems.
Standby Failure Rate
The average standby failure rate (A) for AOVs in each system is based on the data for the 9-year period (1987-1995), using the following equation:
A = f , failures per component-hour (nc)(coy)(8760)
where: f= the number of failures during the period nc the number of AOVs in each plant for the system coy = the actual number of calendar operating years during the 9-year period 8760 = the number of hours in a calendar year
8

The 90% confidence interval was also calculated for A in each system.
3. RISK-BASED ANALYSIS
This section provides the risk-based analysis of operational data, the calculation results for estimating AOV probabilities of failure on demand and standby failure rate, the contingency test for the data population, the comparison of AOV probability values with those in IPEs and other sources, and the regulatory implications of this component performance study.
3.1 Calculation Results
Appendix I provides tables applicable to the AOV probability of failure on demand by the selected systems in the PWR and BWR plants. The summary of results of the contingency tests for the hypothesis that ESFs and surveillance test data are in the same population is as follows:
PWR RI SYSTEM HYPOTHESIS BWR RI SYSTEM HYPOTHESIS
HPI Not Determinable RCIC Not Rejected AFW Not Rejected HPCl Not Rejected RHR Not Rejected LPCS Not Rejected CVCS Not Rejected CCW No ESF Data
For PWR HPI system AOVs, during the 1987-1995 period, the contingency test rejected the hypothesis that the ESF failures and demands were in the same population as the surveillance test failures and demands. For the PWR HPI system AOVs (1987-1995 data), there were no surveillance test or ESF failures. With no failures, the contingency test could not be performed. In addition, the HPI system has few plants (3) with one Application Coded AOV in each plant that are subject to an ESF actuation, resulting in sparse ESF demand data. For the PWR CCW system, there were no ESF failures or ESF demands. Therefore, the more extensive surveillance test data (1987-1995) was used for probability of failure on demand estimates for the PWR HPI and CCW systems.
For the balance of PWR and BWR RI systems, the contingency tests did not reject the hypothesis that the ESF failures and demands were in the same population as the surveillance test failures and demands. Therefore, the Bayes 90% intervals for ESF + Surveillance Test (1987-1995) + ESF (1996-1998) probability of failure on demand was used for these systems.
The generic failure probabilities used in PRAs are presently provided in terms of probability of failure on demand and probability of failure per operating hour. In this study, probability of failure on demand was used because data was available
9
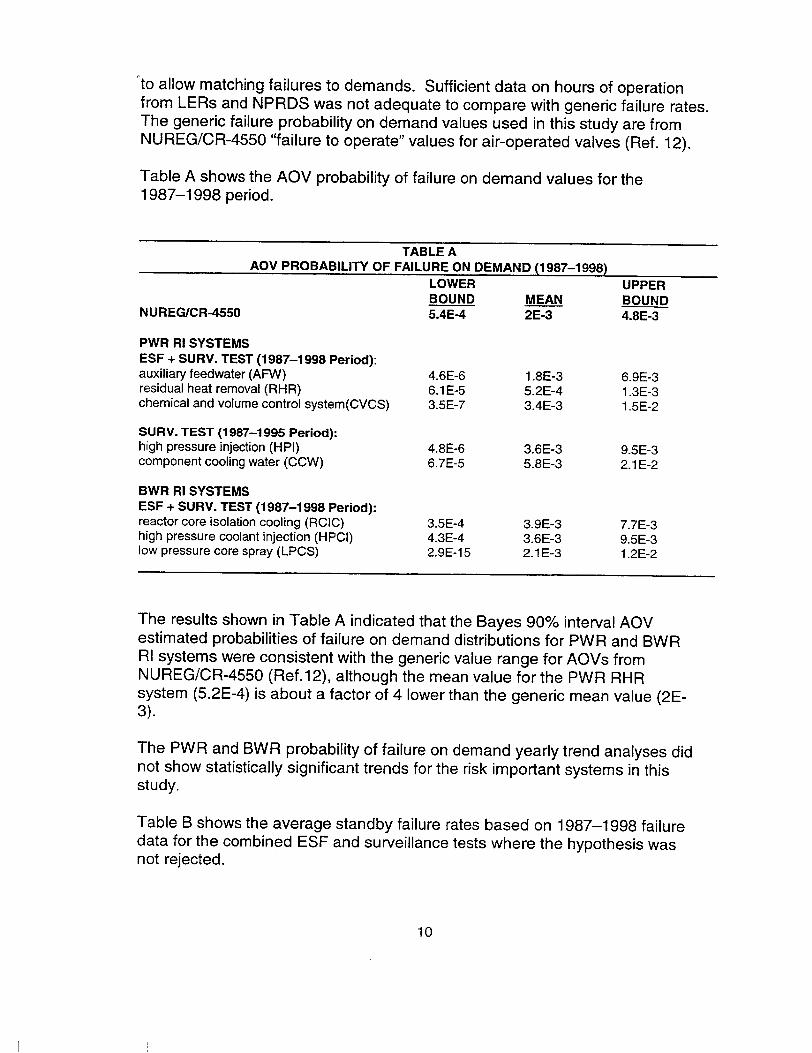
to allow matching failures to demands. Sufficient data on hours of operation from LERs and NPRDS was not adequate to compare with generic failure rates. The generic failure probability on demand values used in this study are from NUREG/CR-4550 "failure to operate" values for air-operated valves (Ref. 12).
Table A shows the AOV probability of failure on demand values for the 1987-1998 period.
TABLE A AOV PROBABILITY OF FAILURE ON DEMAND (1987-1998)
LOWER UPPER BOUND MEAN BOUND
NUREGICR-4550 5.4E-4 2E-3 4.8E-3
PWR RI SYSTEMS ESF + SURV. TEST (11987-1998 Period): auxiliary feedwater (AFW) 4.6E-6 1.8E-3 6.9E-3 residual heat removal (RHR) 6.1 E-5 5.2E-4 1.3E-3 chemical and volume control system(CVCS) 3.5E-7 3.4E-3 1.5E-2
SURV. TEST (1987-1995 Period): high pressure injection (HPI) 4.8E-6 3.6E-3 9.5E-3 component cooling water (CCW) 6.7E-5 5.8E-3 2.1 E-2
BWR RI SYSTEMS ESF + SURV. TEST (1987-1998 Period): reactor core isolation cooling (RCIC) 3.5E-4 3.9E-3 7.7E-3 high pressure coolant injection (HPCI) 4.3E-4 3.6E-3 9.5E-3 low pressure core spray (LPCS) 2.9E-15 2.1E-3 1.2E-2
The results shown in Table A indicated that the Bayes 90% interval AOV estimated probabilities of failure on demand distributions for PWR and BWR RI systems were consistent with the generic value range for AOVs from NUREG/CR-4550 (Ref.12), although the mean value for the PWR RHR system (5.2E-4) is about a factor of 4 lower than the generic mean value (2E3).
The PWR and BWR probability of failure on demand yearly trend analyses did not show statistically significant trends for the risk important systems in this study.
Table B shows the average standby failure rates based on 1987-1998 failure data for the combined ESF and surveillance tests where the hypothesis was not rejected.
10

TABLE B AOV STANDBY FAILURE RATE (1987-1998)
PWR RI SYSTEMS auxiliary feedwater (AFW) high pressure injection (HPI) residual heat removal (RHR) chemical and volume control sys(CVCS) component cooling water (CCW)
BWR RI SYSTEMS reactor core isolation cooling (RCIC) high pressure coolant injection (HPCI) low pressure core spray (LPCS)
LOWER BOUND(A,)
4.8E-7/hour 4.4E-10/hour 6.9E-9/hour 4.OE-7/hour 1.3E-7/hour
4.1 E-8hour 3.6E-8/hour 2.5E-7/hour
Note: There were no HPI failures during the 1987-1998 period. A Jeffreys non-informative prior was used to determine the standby failure rate.
3.2 Common-Cause Failure Events
A review of the common-cause failure (CCF) database for the 1987-1995 period found one AOV complete failure (listed in bold in table below) in the selected risk-important systems with the scope of this study's criteria [e.g., complete failures and Application Coded AOVs and ESF or surveillance testing and with fail-to-open (FO), fail-to-close (FC) or fail-to-operate as required (OR) failure modes]. This is consistent with the expected number of failures, based on the CCF database parameters, for the combined PWR and BWR complete failure population (55) used in this study. Table C lists all AOV failures in the CCF database for 1987-1995. CCF numbers that include XXX denote proprietary NPRDS source failures. For these CCFs, the plant Identification (PLT ID) column gives the coded identifier for the plant whose docket number is listed in the CCF database for the XXX. The detailed CCF failure descriptions are available to NRC staff and inspectors in the CCF database (See Foreword).
11
MEAN(A)
8.2E-7/hour 1.1 E-7/hour 1.3E-7/hour 6.OE-7/hour 3.8E-7/hour
7.9E-7/hour 7.OE-7/hour 7.4E-7/hour
UPPER BOUND(Au)
1.3E-6/hour 4.3E-7/hour 6.4E-7/hour 8.5E-7/hour 8.8E-7/hour
3.8E-6/hour 3.3E-6/hour 1.7E-6/hour

TABLE C AOV FAILURES IN THE CCF DATABASE (11987-1995)
COMPLETE/ APPLIC. ESF/ FAIL. PLT ID/ SYS DEGRADED CODED SURV. MODE CCF NUMBER DKT
AFW Degraded NO NO FC L-528-87-2682-CC 528 AFW Degraded YES SURV OR N-XXX-88-0849-VR 55 AFW Degraded YES NO OR N-XXX-88-0850-00 55 AFW Degraded YES NO OR N-XXX-88-0851-00 55 AFW Complete YES NO OR N-XXX-88-0852-CC 55 AFW Complete YES SURV FC N-XXX-90-0844-CC 55 HPCI Degraded YES NO FO N-XXX-91-0875-CC 37 AFW Degraded YES NO OR N-XXX-91-0855-00 58 AFW Degraded YES NO OR N-XXX-92-0839-00 30 AFW Degraded YES ESF OR L-316-93-0763-CC 316 AFW Degraded NO NO OR L-286-93-0864-SA 286 AFW Degraded NO NO OR N-XXX-94-2442-CC 31 AFW Degraded YES SURV FC L-309-95-2441 -LI 309 AFW Degraded YES SURV OR N-XXX-95-2443-CC 99
3.3 Comparison With IPEs and Other Sources
The AOV failure probabilities on demand developed for the PWR RI systems were compared with a selected group of plant-specific Individual Plant Examinations (IPEs) as shown in Figures 3 through 5. The PWR plants IPE mean values were generally consistent with the results of this study and the NUREG/CR-4550 generic values. No comparison was made with BWR IPE values, as few BWR plants IPEs provided AOV failure probabilities on demand.
This comparison reflects readily available (docketed) IPE/PRA information. Licensees which have updated their IPE/PRAs without providing docketed information relating to AOVs are not reflected in this comparison.
12

SUdI NI a~sfl s~f1vA HIM NOSIUVdflO3 - NVV3G NO 3uflhivI :iO AIJlIflYBOUd AOV WJ3ISAS HHU UMd
INV~d/l8JOd38
0 z >> mJ
-4 5g C) ) + n > > > C- mi +
o - m m0 4- C m 0 > C
S Cl) m Cl) ;K 7q 0 90-3000'L
~......... ........... o~o o.
:'O-30OOOL
:ZO-3000 L
CQNVVN30 NO 3uflivA -Ao AI!1ISVSO~d
SUdI Ni a~sfl s~f1vA HuJM NOSIHVdWtO3 - NVW3(G NO auflIii ziJO AIflISBYOUd AOV W3~1SAS titV HMd
C)> 0 z
-u z z 2m -4> m (f)
m E: 0 + Mx Cl) ( I m xu U
n > 0 _ -P. c~c m m m 0 > 031 <
~ l) n C)7M7 0 2L0-3000'L
-- :90-30OO L
....... 90-30OOOL
VO-30OOOL .......... N O.. ..... ..... O.. ..........
..........

PROBABILITY OF FAILURE ON DEMAND I"O00E+O0 "'." .... .•.....
1.OOOE-03 .. ..... ...
.................
.OE02.......... ....... .......
1.OOOE-07 3; ; Ct) W Cl)
In < 0 u ,, UJ r 4- t -J 0
............
LL _J LL i
W L z C<L > O
U L)
REPORT/PLANT
PWR CVCS AOV PROBABILITY OF FAILURE ON DEMAND COMPARISON WITH VALUES USED IN IPEs
FIGURE 5
4. ENGINEERING ANALYSIS
This section provides the engineering analyses including failure trend analysis, component trends in time, the failure characteristics and their causes, a brief discussion and listing of NRC regulatory initiatives related to AOVs, and engineering insights resulting from the various analyses.
4.1 Failure Trend Analysis
Appendix III provides applicable data for trending of AOV failures. Failure trends of AOVs, shown for failures and failure fractions during the 1987-1995 period.
As indicated in Section 2.3, NPRDS failure data for 1996 was reported inconsistently by licensees and, therefore, was determined to be insufficient for trending purposes. Without NPRDS data, LER data from 1996 through 1998 was insufficient for trending purposes. Therefore, failure data for trending in this study used NPRDS and LER failure data for the 1987-1995 period.
For the PWR RI systems during the 1987-1995 period there was a statistically significant decreasing trend in the number of failures. Both the maintenance rule and voluntary industry joint owners group (JOG) initiatives were begun during this period. While there was not sufficient information to conclude whether these
14

initiatives caused the trend, it is noted that an improvement in performance has occurred. For BWR RI systems no statistically significant trend was identified. Figure 6 shows the PWR AOV failure trends for the 1987-1995.
NO. OF FAILURES
1010
8
6
4
21
0
9
7 -x
7
K
9
6
3
1
87 88 89 90 91 92 93 94 95
CALENDAR YEARS
LI VALVE BODY
LI VALVE OPERATOR
No. PWR AOV fail.: 49
PWR AOV FAILURE TREND FIGURE 6
15
121
r-.. o

4.2 Component Trends in Time
Methodology
The initial assumption made in this study, relative to aging effects on component assemblies, is that the rate of failure events over time (A) is constant. Several evaluation methods were used to check this assumption. The reason for checking was to determine if any significant age-related increase in A occurred among older plants. In order to conclude that an increase due to "aging" occurred, it would be necessary for all three of the following conditions to be present:
1. There was an increase in A over time (a nonconstant failure rate that was increasing).
2. A was higher for older plants.
3. The dominant contributor to failure was due to age/wear mechanisms.
When individual failure events are arranged in chronological order, a cumulative plot helps to show whether A is constant throughout the period.
This study used an average failure rate, AAVE., equal to the total number of AOV failures for the 1987-1995 period, divided by the cumulative number of AOV component- years of standby operation during the period. Failure data from the 1996-1998 period was not included as it was for ESF failure and limited surveillance test failure data only.
The cumulative number of failures was plotted against the number of AOV component- years since the beginning of the study period (1987) for comparison with AAvE. This was done for plant age groups A, B, and C. The following table gives the definition of each plant age group and its apportionment, with the 109-plant total used for this study:
PLT AGE COMMERCIAL TOTAL NUMBER OF NUMBER OF PWR NUMBER OF BWR GROUP OPERATION DATE PLANTS PLANTS PLANTS
A 12/31174 and Earlier 36 24 12
B 01101/75 through 37 25 12 03/31/84
C 04/0184 and later 36 24 12
16

The assumption (i.e., null hypothesis) that AAVE. is constant during the study period for each plant age group and for the combined plant age groups was evaluated. The failure rates (AAVE.) are the slope of the plots for each plant age group. Comparison between plant age groups were made to determine whether there was any indication of plant aging (e.g., higher slope for the older plant age groups than for the newer plant age groups). Another test for the null hypothesis that the failure rate is constant is the Laplace test. For this test, L/2 is defined as the midpoint of the cumulative number of componentyears during the 1987-1995 period. If A is constant, about half of the events should occur before L12 and half afterwards. The criteria for not rejecting the null hypothesis is that the statistic U is approximately normal for a number of failures > 3 (U is within + 1.645 for the 0.95th and 0.05th quantiles, respectively, of the standard distribution). For a nonconstant failure rate (rejected null hypothesis) that is increasing (U >+1.645), possible aging exists. The formula for the U statistic is :
U= T - L/2 where: n = no. of failures, Ti = interval between failures in component-years, LV 1/12n T= ETi/n
The mean time between failures was provided for information, using the reciprocal of the AAVE. applicable to each PWR and BWR plant age group and the combined plant age groups.
Results
Appendix I! provides tables applicable to component trends in time evaluations for AOVs. These analyses were performed to determine whether the failure rates were constant over time and whether the failure rates between older and newer plant age groups increased as an indication of possible aging. A comparison of plots of cumulative AOV failures over time to the applicable average failure rate (AAVE.) plots and analyses indicated the following:
PWRs (see Figure 7) - For the PWR RI systems, an analysis of plant age groups did not show evidence of an increase in failure rates for any of the plant age groups due to aging mechanisms. Therefore, either aging impacts are not affecting reliability or replacement/repair restored equipment to normal performance regardless of plant age.
For plant age group A, the assumed hypothesis that the failure rate was constant was not rejected. The value of U at the 10-percent significance level was -0.616 (>-1.645) and did not show any evidence of a nonconstant failure rate.
For plant age group B, the hypothesis of a constant failure rate was rejected (decreasing). The value of U at the 10-percent significance level
17

was -1.999 (<-1.645). Since the nonconstant failure rate is decreasing, there is no evidence to support component aging.
For plant age group C, the hypothesis of a constant failure rate was not rejected. The value of U at the 10-percent significance level was -0.308 (>-1.645) and did not show any evidence of a nonconstant
failure rate.
When the average failure rates were compared among the plant age groups, plant age effects were assumed to be reflected by highest average failure rates for the older plant age group A, ranging to the lowest average failure rate for plant age group C. This assumption did not occur, where AAVE. for A (0.005), B (0.004) and C (0.006) were very close together and did not provide evidence of plant age effects among the plant age groups.
When the failure causes for PWR AOV assemblies were reviewed, age/wear causes (47%), and unknown causes (27%) were the more significant causes (see Figure 15). Therefore, age/wear mechanisms were the predominant cause of failure.
BWRs - For the BWR RI systems AOVs, the data was determined to be too sparse (6 failures during the 1987-1995 period) for trending analysis by plant age groups.
The analysis indicates no evidence to conclude that "aging" is adversely affecting the failure rate of the AOVs in this report because failure rates were not increasing over time and older plants did not exhibit a higher failure rate compared to newer plants. As noted in Section 4.3, age/wear is the dominant contributor to PWR AOV failures (BWR data is too sparse for analysis). However, the evidence does not indicate that failure rates are increasing or that older plants' AOVs fail more often. It is not clear whether this is due to a lack of "aging" impacts or whether replacementlrefurbishment of AOVs is responsible for the lack of an "aging" trend. Since specific component age information is not available, no additional assessments of causes for the lack of trends was possible.
18

AOVs - PLANT AGE GRP A PWR RI SYSTEMS
CUMULATIVE NO. FAILURES
16
14
12
10
8
6
4
2
0 2 4 6 8 10121416182022242628
AOV COMPONENT-YEARS x 100
PERIOD: 1987-1995 No. fail.: 15
AOVs - PLANT AGE GRP B AOVs - PLANT AGE GRP C PWR RI SYSTEMS PWR RI SYSTEMS
CUMULATIVE NO. FAILURES CUMULATIVE NO. FAILURES
9',
15F - - -
10 " - -
LIZ. • 1.9 "
/ /
/
/ / h
.9
.9
11 f I I I I
0 5 10 15 20 25 30 35
AOV COMPONENT-YEARS x 100
40
PERIOD: 1987-1995 No. fail.: 18
7n,
1
IE. 1
0 2 4 6 8 10 12 14 16 18 20 22 24 26
AOV COMPONENT-YEARS x 100
PERIOD: 1987-1995 No. fail.: 16
PWR AOV COMPONENT TRENDS IN TIME FIGURE 7
19
S. . . . . . . •. .. . . . .
4
.............. //
- - - - - - - - -
.. . . . . ../.
I/
/
/
/
/
/ . . .
-- - - - - - -
5
5 - -------------------------- /.
0 -- - - - - - - - - - - -- A V
5
.9/
r1 / I l l I I I I I I

FIGURE 7
4.3 Failure Characteristics and Their Causes
Methodology
The AOV assembly failures and causes were identified on a subcomponent level in the NPRDS database. For LER reported failures (SCSS database), sufficient information was provided to identify failed subcomponents and causes within the LER narrative and group these failures using the NPRDS categories. The apportionments were determined to provide insights into the predominant subcomponent failures and their causes by reactor type (i.e., PWR and BWR). For BWRs, however, the number of failures (6) was too sparse to provide insights.
The failure cause categories used in this study were as follows:
Age/Wear (AW) Dirt/Contamination/Corrosion (DC) Design Deficiency (DD) Manufacturing Defect (MF) Unknown (UK) Debris/Foreign Material (DF) Other Devices (OD) Maintenance/Procedural Deficiencies
(MP)
Results
Figure 8 shows the PWR AOV subcomponent and subcomponent parts failure apportionment. For PWRs, the evaluation of AOV subcomponent failure patterns determined that pneumatic operator failures accounted for greater than three-fourths of all AOV subcomponent failures.
Failure causes for PWR AOV assemblies are illustrated in Figure 9. For the PWR RI systems, the causes were mainly due to age/wear (47%) and unknown (27%).
20

PWR RI SYSTEM AOVs
Valve Bodies 24%
Valve
No. AOV Assy failures: 49
PWR RI SYSTEM AOVs VALVE BODY SUBCOMPONENT PARTS FAILURES
Stem 33%
Packing 17%
PWR RI SYSTEM AOVs VALVE OPER. SUBCOMPONENT PARTS FAILURES
Diaphragm 8%
Solenoid Valve 24%
Other 116%
Air Regulator Air Line 16% 8%
No. AOV Valve Body failures: 12 No. AOV Valve Oper. failures: 37
PWR AOV SUBCOMPONENT AND SUBCOMPONENT PARTS FAILURE APPORTIONMENT FIGURE 8
21
Internals 50%
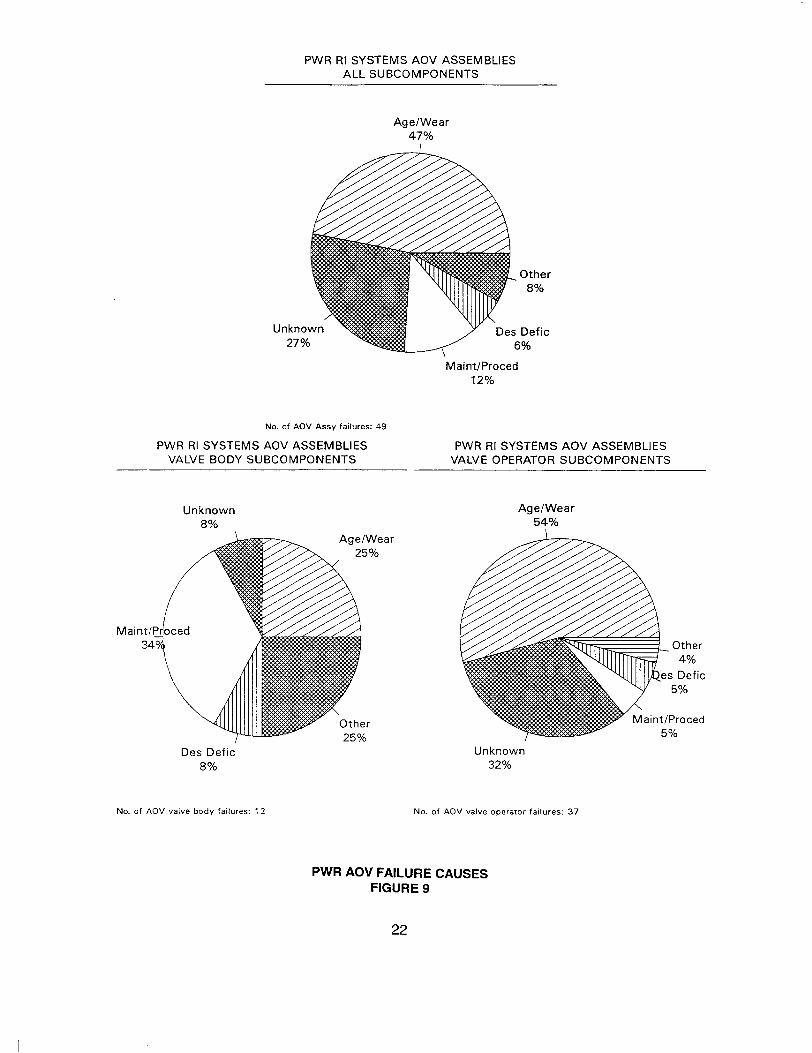
PWR RI SYSTEMS AOV ASSEMBLIES ALL SUBCOMPONENTS
Age/Wear 47%
Other 8%
Des Defic 6%
Maint/Proced 12%
No. of AOV Assy failures: 49
PWR RI SYSTEMS AOV ASSEMBLIES VALVE BODY SUBCOMPONENTS
PWR RI SYSTEMS AOV ASSEMBLIES VALVE OPERATOR SUBCOMPONENTS
Age/WearUnknown 8%
Des Defic 8%
Age/Wear 25%
Unknown 32%
No. of AOV valve body failures: 12 No. of AOV valve operator failures: 37
PWR AOV FAILURE CAUSES FIGURE 9
22
Unknown 27%
4.4 Related Issues
Generic Letters, Generic Safety Issues, and Information Notices
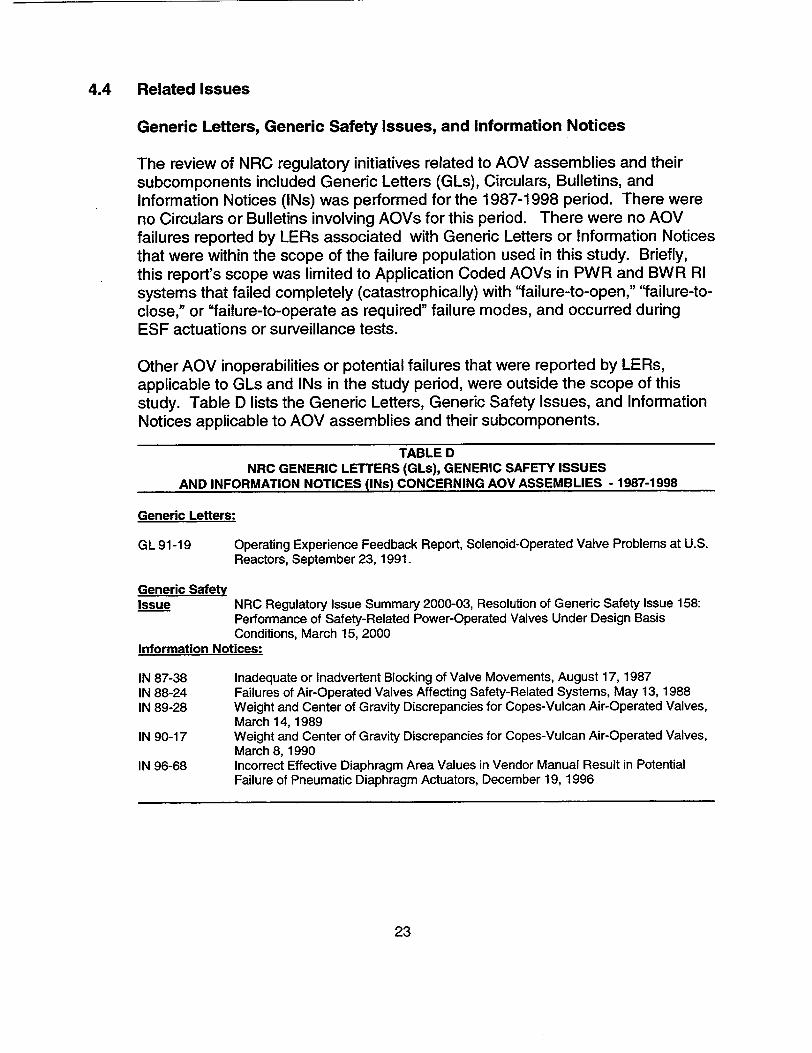
The review of NRC regulatory initiatives related to AOV assemblies and their subcomponents included Generic Letters (GLs), Circulars, Bulletins, and Information Notices (INs) was performed for the 1987-1998 period. There were no Circulars or Bulletins involving AOVs for this period. There were no AOV failures reported by LERs associated with Generic Letters or Information Notices that were within the scope of the failure population used in this study. Briefly, this report's scope was limited to Application Coded AOVs in PWR and BWR RI systems that failed completely (catastrophically) with "failure-to-open," 'failure-toclose," or "failure-to-operate as required" failure modes, and occurred during ESF actuations or surveillance tests.
Other AOV inoperabilities or potential failures that were reported by LERs, applicable to GLs and INs in the study period, were outside the scope of this study. Table D lists the Generic Letters, Generic Safety Issues, and Information Notices applicable to AOV assemblies and their subcomponents.
TABLE D NRC GENERIC LETTERS (GLs), GENERIC SAFETY ISSUES
AND INFORMATION NOTICES (INs) CONCERNING AOV ASSEMBLIES - 1987-1998
Generic Letters:
GL 91-19 Operating Experience Feedback Report, Solenoid-Operated Valve Problems at U.S. Reactors, September 23, 1991.
Generic Safety Issue NRC Regulatory Issue Summary 2000-03, Resolution of Generic Safety Issue 158:
Performance of Safety-Related Power-Operated Valves Under Design Basis Conditions, March 15, 2000
Information Notices:
IN 87-38 Inadequate or Inadvertent Blocking of Valve Movements, August 17, 1987 IN 88-24 Failures of Air-Operated Valves Affecting Safety-Related Systems, May 13, 1988 IN 89-28 Weight and Center of Gravity Discrepancies for Copes-Vulcan Air-Operated Valves,
March 14, 1989 IN 90-17 Weight and Center of Gravity Discrepancies for Copes-Vulcan Air-Operated Valves,
March 8, 1990 IN 96-68 Incorrect Effective Diaphragm Area Values in Vendor Manual Result in Potential
Failure of Pneumatic Diaphragm Actuators, December 19, 1996
23

NUREG-1275, VoL. 13 Comparison
In February 2000, NUREG-1275, Vol. 13, "Evaluation of Air-Operated Valves at U.S. Light-Water Reactors" (Ref. 8) was issued. That report raised concerns about the potential occurrence of AOV common cause failures that could disable redundant trains of a safety system. In particular, the possibility of AOV failures from accident or transient conditions (pressure, temperature, flow), air system contamination, or from fabrication and maintenance activities was identified.
There are differences in the evaluation methods between this study and the previously published NUREG-1275, Vol. 13. These differences are in scope, data sources, AOV boundaries, single failure and common cause failure (CCF) definitions, and results from feedback of operating experience. The AOV scope in this study excludes main steam isolation valves (MSIVs), pressurizer poweroperated relief valves (PORVs), and the instrument air system and its components (such as air regulators, valves, airlines, and backup accumulators). The failures counted in this report are actual and complete. This report's data set did not include degradations where the AOVs were still functional, nor the potential for failure where additional adverse conditions and/or personnel errors outside the component boundary were identified as a possibility, but did not actually occur.
A review of common cause failure (CCF) database (See Section 3.2) was also performed. This database uses the four criteria in NUREG/CR-6268, Vol. 3, "Common-Cause Failure Database and Analysis System: Data Collection and Event Coding" (June 1998)(Ref. 10). It includes actual complete multiple failures or observed degradations affecting multiple components. Potential failures and degraded conditions in single failures are excluded from this database because of their lower safety significance. NUREG/CR-6268 is widely accepted as the definitive approach to assessing which failures constitute the risk-significant CCF events among all the component failures that occur.
A broader definition of "CCF conditions" was used in NUREG-1275, Vol. 13 wherein the possibility for CCF was identified. For example, it identified AOV air quality as a possible failure mechanism, but only single valve failures were identified. The likelihood and risk significance of these possible conditions was not estimated. The likelihood and the risk significance of such possible failure mechanisms is clearly less than that associated with events where multiple AOVs have actually failed. No events were identified in this NUREG-1715, Vol. 3 report where multiple AOVs failed due to these actual or potential adverse external factors. Thus, the NUREG-1275, Vol. 13 definitions incorporate many events that are of lesser risk significance and are not typically included in the component reliability estimates used in risk analyses. In this NUREG-1715, Vol. 3 report the number of CCF events was consistent with expectations based on NUREG/CR-6268 parameters.
24

Using a more risk-based approach, and considering actual AOV failures resulting from surveillance testing and engineered safety features (ESF) actuation, this study found consistency with NUREG/CR-4550 generic values for probability of
failure on demand and with plant IPE mean values for AOVs. No indications of
increased failure rates due to "aging" concerns were found. No evidence of
increased CCF susceptibility was found. An earlier report, NUREG/CR-6644, "Generic Issue 158: Performance of Safety-Related Power-Operated Valves
Under Operating Conditions" (September 1999)(Ref. 9), also identified that the
total number of AOV failure events (with failure modes: failure-to-open, failureto-close, and failure-to-operate as required) was decreasing with time. A specific
review of the 5 AOV events from the NUREG-1 275, Vol.13 report that identified
differential pressure design inadequacies found that they did not meet the criteria
for being Accident Sequence Precursors.
Therefore, all risk-significant AOV events and issues from NUREG/CR-1275, Vol. 13 that were within the scope of this study have been analyzed.
Industry and Other NRC Initiatives
During the time period of this report, one major NRC initiative was undertaken, the Maintenance Rule (implemented in 1995 in most nuclear power plants). Industry initiatives were the AOV Users Group efforts starting in the mid-1 990s,
that eventually developed into the AOV joint owners group (JOG) program in 1999. While this report shows a decrease in the number of failures per year for AOVs in PWR RI systems, it is not possible to directly attribute improved performance to these initiatives. This is due in part, to the fact that these initiatives were begun near the end of the period. These initiatives also address design-basis capability and other issues in addition to the risk-significant function
reliability, estimated in this report. Therefore, it is difficult to establish a cause
and effect relationship between the specific activities and the improved AOV performance.
5. SUMMARY OF RESULTS
5.1 Failure Probabilities
For the PWR and BWR RI systems, the AOV estimated probability of failure
on demand distributions were consistent with the generic value range from
NUREG/CR-4550 (used as an input to NUREG-1 150, although the PWR RHR system mean value (5.2E-4) is about a factor of 4 lower than the generic mean value (2E-3).
The AOV mean probabilities of failure on demand used in plant-specific IPE
studies were compared with the results of this study. The PWR IPE mean
25
values were generally consistent with the results of this study and the NUREG/CR-4550 generic values. No comparison was made with BWR IPE values, as few BWR plants IPEs provided failure probabilities on demand.
5.2 Engineering Insights
The engineering insights gained from this study are summarized as follows:
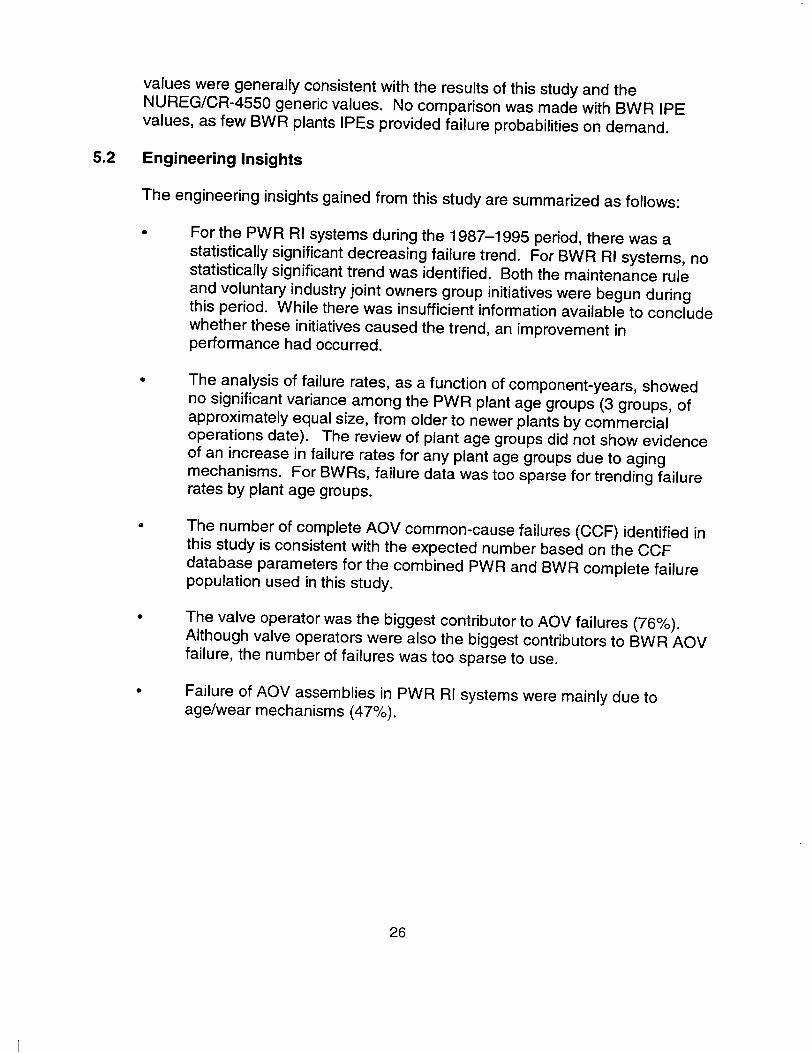
For the PWR RI systems during the 1987-1995 period, there was a statistically significant decreasing failure trend. For BWR RI systems, no statistically significant trend was identified. Both the maintenance rule and voluntary industry joint owners group initiatives were begun during this period. While there was insufficient information available to conclude whether these initiatives caused the trend, an improvement in performance had occurred.
The analysis of failure rates, as a function of component-years, showed no significant variance among the PWR plant age groups (3 groups, of approximately equal size, from older to newer plants by commercial operations date). The review of plant age groups did not show evidence of an increase in failure rates for any plant age groups due to aging mechanisms. For BWRs, failure data was too sparse for trending failure rates by plant age groups.
The number of complete AOV common-cause failures (CCF) identified in this study is consistent with the expected number based on the CCF database parameters for the combined PWR and BWR complete failure population used in this study.
The valve operator was the biggest contributor to AOV failures (76%). Although valve operators were also the biggest contributors to BWR AOV failure, the number of failures was too sparse to use.
Failure of AOV assemblies in PWR RI systems were mainly due to age/wear mechanisms (47%).
26

6. REFERENCES
1. AEOD/C701, "Air System Problems at U.S. Light Water Reactors," March 1987
2. AEOD/E706, "Inadequate Mechanical Blocking of Valves," March 31, 1987
3. NUREG- 1275, Vol. 2, "Operating Experience Feedback Report - Air Systems Problems," December 1987
4. NUREG-1 275, Vol. 6, "Operating Experience Feedback Report Solenoid Valve Problems," February 1991
5. NUREG/CR-5497 (INEEL/EXT-97-01328), "Common Cause Failure Parameter Estimates," October 1998
6. NUREG/CR-5500, Vol. 1, "Reliability Study: Auxiliary/Emergency Feedwater System, 1987-1995," August 1998
7. NUREG/CR-5500, Vol. 9 (INEEL/EXT-99-00373), "High Pressure Safety Injection System Reliability, 1987-1997," October 2000
8. NUREG-1275, Vol. 13, "Evaluation of Air-Operated Valves at U.S. Light Water Reactors," February 2000
9. NUREG/CR-6644 (INEL - 95/0550), "Generic Issue 158: Performance of Safety-Related Power-Operated Valves Under Operating Conditions," September 1999
10. NUREG/CR-6268, Vol. 3 (INEEL/EXT-97-00696), "Common-Cause Failure Database and Analysis System: Data Collection and Event Coding," June 1998
11. Harry F.Martz and Ray A. Waller, Bayesian Reliability Analysis, Krieger, Section 7.6, Malabar, FL, 1991.
12. NUREG/CR-4550, SAND86-2084, "Analysis of Core Damage Frequency Internal Events Methodology," Vol. 1, Rev. 1, January 1990
27

APPENDIX I
AOV ASSEMBLY
FAILURE PROBABILITIES

TABLE NO.
II
APPENDIX I - AOV ASSEMBLY FAILURE PROBABILITIES
DESCRIPTION PAGE
PWR RI Systems AOV Assemblies Probability of
Failure on Demand ........................................ 1-2
BWR RI Systems AOV Assemblies Probability of
Failure on Demand ........................................ 1-3
I-1

APPENDIX I - TABLE I PWR RI SYSTEM AOV ASSEMBLIES
PROBABILITY OF FAILURE ON DEMANDPROBABILITY OF FAILURE ON DEMAND
NO. NO. 90% CONFID. INTERVALS BAYES 90% INTERVALS PRIOR FAIL. DEMD PLCB PHAT PUCB PLO MEAN PUP A B
AFW 13 8547 9.1E-4 1.5E-3 2.4E-3 4.6E-6 1.8E-3 6.9E-3 0.4646 263.37 HPI 0 409 - 4.8E-6 1.2E-3 4.7E-3 Noninformative
Prior RHR 1 2889 1.8E-5 3.5E-4 1.6E-3 6.1 E-5 5.2E-4 1.3E-3 Noninformative
Prior CVCS 22 7735 1.9E-3 2.8E-3 4.1 E-3 3.5E-7 3.4E-3 1.5E-2 0.2991 88.19 CCW 4 821 1.6E-3 4.9E-3 1.1E-2 6.7E-5 5.8E-3 2.1E-2 0.6281 107.06
NOTES:
1 For the 1987-1995 period, the contingency test accepted the hypothesis that the ESF failures and demands were in the same population as the surveillance test failures and demands for the AFW, CVCS, and RHR systems. Since the contingency test for the 1996-1998 ESF data was also accepted for the AFW, CVCS, and RHR systems, the probability of failure on demand data combined the surveillance test data for 1987-1995 with ESF data for 1987-1998.
2. For the 1987-1995 period, the contingency test rejected the hypothesis that the ESF failures and demands were in the same population as the surveillance test failures and demands for the HPI and CCW systems. There was no ESF data (failures or demands) for the CCW system. The surveillance test data (1987-1995) was used for estimating the probability of failure on demand for these two systems.
3. The 90% confidence intervals (chi-square) are provided for information. The Bayes 90% intervals are used in this study for RI system estimated probability of failure on demand.
1-2

APPENDIX I - TABLE II BWR RI SYSTEMS AOV ASSEMBLIES
PROBABILITY OF FAILURE ON DEMAND
PROBABILITY OF FAILURE ON DEMAND NO. NO. 90% CONFID. INTERVALS BAYES 90% INTERVALS PRIOR FAIL. DEMD PLCB PHAT PUCB PLO MEAN PUP A B
RCIC 1 507 1.OE-4 2.OE-3 9.3E-3 3.5E-4 3.OE-4 7.7E-3 Noninformative Prior
HPCI 1 409 1.2E-4 2.4E-3 1.1E-2 4.3E-4 3.6E-3 9.5E-3 Noninformative Prior
LPCS 4 1758 7.8E-4 2.3E-3 5.2E-3 2.9E-152.1E-3 1.2E-2 0.1031 50.02
NOTES:
1 For the 1987-1995 period, the contingency test accepted the hypothesis that the ESF failures and demands were in the same population as the surveillance test failures and demands for the listed systems. Since the contingency test for the 1996-1998 ESF data was also accepted, the probability of failure on demand data combined the surveillance test data for 1987-1995 with ESF data for 1987-1998.
2 The 90% confidence intervals (chi-square) are provided for information. The Bayes 90% intervals are used in this study for RI system estimated probability of failure on demand.
1-3

APPENDIX II
AOV ASSEMBLY
COMPONENT TRENDS IN TIME

APPENDIX II AOV ASSEMBLY COMPONENT TRENDS IN TIME
TABLE NO. DESCRIPTION PAGE
I PWR RI Systems AOV Assembly Failures Versus ComponentYears - Plant Age Group A- ESF and Surveillance Test Failures - 1987-1995 ...................................... 11-2
II PWR RI Systems AOV Assembly Failures Versus ComponentYears - Plant Age Group B - ESF and Surveillance Test
Failures- 1987-1995 ...................................... 11-3
III PWR RI Systems AOV Assembly Failures Versus ComponentYears - Plant Age Group C - ESF and Surveillance Test
Failures - 1987-1995 ...................................... 11-4
I1-1

APPENDIX II - TABLE I PWR RI SYSTEMS AOV ASSEMBLY FAILURES VERSUS COMPONENT-YEARS
PLANT AGE GROUP A ESF AND SURVEILLANCE TEST FAILURES - 1987-1995
EVENT NO. DATE FAIL
1/87 2/87 3/87 4/87 5/87 6/87 7/87 8/87 9/87 10/87 11/87 12/87
1/88 2/88 3/88 4/88 5/88 6/88 7/88 8/88 9/88 10/88 11/88 12/88
1/89 2/89 3/89 4/89 5/89 6/89 7/89 8/89 9/89 10/89 11/89 12/89 Totals:
1 0 0 0 0 0 0 0 0 0
2 0
CUMULATIVE AOV-YEARS
27 54 82 109 136 164 191 218 245 272 300 327
354 382 409 436 463 491 518 545 572 600 627 654
681 708 736 763 790 818 845 872 899 926 954 981
EVENT NO. CUMULATIVE DATE FAIL. AOV-YEARS
1/90 2/90 3/90 4/90 5/90 6/90 7/90 8/90 9/90 10/90 11/90 12/90
1/91 2/91 3/91 4/91 5/91 6/91 7/91 8/91 9/91 10/91 11/91 12/91
1/92 2/92 3/92 4/92 5/92 6/92 7/92 8/92 9/92 10/92 11/92 12/92
1008 1036 1063 1090 1117 1145 1172 1199 1226 1254 1281 1308
1335 1362 1390 1417 1444 1472- L12 1499 1526 1553 1581 1608 1635
1662 1690 1717 1744 1771 1798 1826 1853 1880 1908 1935 1962
EVENT NO. CUMULATIVE DATE FAIL. AOV-YEARS
1/93 2/93 3/93 4/93 5/93 6/93 7/93 8/93 9/93 10/93 11/93 12/93
1/94 2/94 3/94 4/94 5/94 6/94 7/94 8/94 9/94 10/94 11/94 12/94
1/95 2/95 3/95 4/95 5/95 6/95 7/95 8/95 9/95 10/95 11/95 12/95
1989 2016 2044 2071 2098 2126 2153 2180 2207 2234 2262 2289
2316 2344 2371 2398 2425 2452 2480 2507 2534 2562 2589 2616
2644 2671 2698 2725 2752 2780 2807 2834 2861 2889 2916 2943
NOTES: 1. kAVE. = 15 = 0.005 failures per commponent-year (1987-1995).
2943 2. The mean time between failures = 1/0.005 = 200 component-years. 3. Failures are for the PWR RI systems in plant age group A. 4. U2 indicates the midpoint of the cumulative AOV-years for the 1987-1995 period, for use in the Laplace test
(see Section 4.2 in the text). 5. See Figure 7 in the text.
11-2
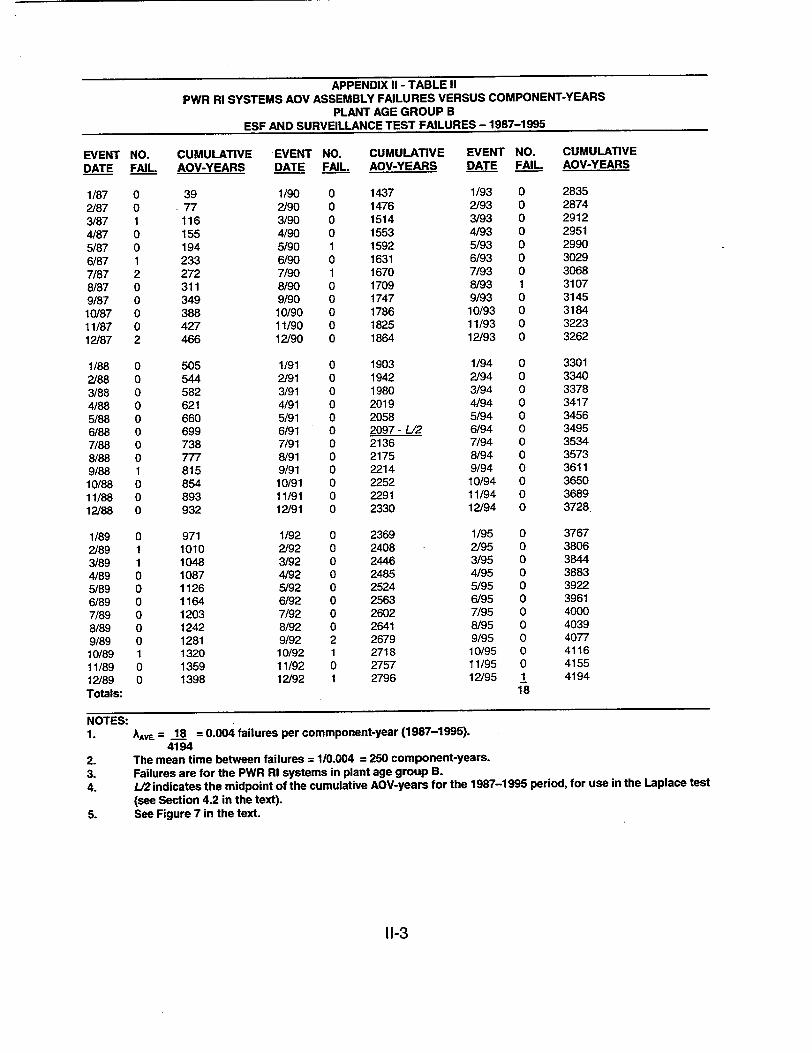
APPENDIX II - TABLE II PWR RI SYSTEMS AOV ASSEMBLY FAILURES VERSUS COMPONENT-YEARS
PLANT AGE GROUP B ESF AND SURVEILLANCE TEST FAILURES - 1987-1995
EVENT NO. DATE FAIL.
1/87 2/87 3/87 4/87 5/87 6/87 7/87 8/87 9/87 10/87 11/87 12/87
1/88 2/88 3/88 4/88 5/88 6/88 7/88 8/88 9/88 10/88 11/88 12/88
1/89 2/89 3/89 4/89 5/89 6/89 7/89 8/89 9/89 10/89 11/89 12/89 Totals:
CUMULATIVE EVENT NO. AOV-YEARS DATE FAIL.
39 .77
116 155 194 233 272 311 349 388 427 466
505 544 582 621 660 699 738 777 815 854 893 932
971 1010 1048 1087 1126 1164 1203 1242 1281 1320 1359 1398
0 1 1
0 0 0 0 0 0 1 0 0
1/90 2/90 3/90 4/90 5/90 6/90 7/90 8/90 9/90 10/90 11/90 12/90
1/91 2/91 3/91 4/91 5/91 6/91 7/91 8/91 9/91 10/91 11/91 12/91
1/92 2/92 3/92 4/92 5/92 6/92 7/92 8/92 9/92 10/92 11/92 12/92
CUMULATIVE EVENT NO. AOV-YEARS DATE FAIL
1437 1476 1514 1553 1592 1631 1670 1709 1747 1786 1825 1864
1903 1942 1980 2019 2058 2097 - L2 2136 2175 2214 2252 2291 2330
2369 2408 2446 2485 2524 2563 2602 2641 2679 2718 2757 2796
1/93 2/93 3/93 4/93 5/93 6/93 7/93 8/93 9/93 10/93 11/93 12/93
1/94 2/94 3/94 4/94 5/94 6/94 7/94 8/94 9/94 10/94 11/94 12/94
1/95 2/95 3/95 4/95 5/95 6/95 7/95 8/95 9/95 10/95 11/95 12/95
0 0 0 0 0 0 0 1 0 0 0 0
0 0 0 0 0 0 0 0 0 0 0 0
0 0 0 0 0 0 0 0 0 0 0 1
18
CUMULATIVE AOV-YEARS
2835 2874 2912 2951 2990 3029 3068 3107 3145 3184 3223 3262
3301 3340 3378 3417 3456 3495 3534 3573 3611 3650 3689 3728
3767 3806 3844 3883 3922 3961 4000 4039 4077 4116 4155 4194
NOTES: 1. AAvF = 18 = 0.004 failures per commponent-year (1987-1995).
4194 2. The mean time between failures = 110.004 = 250 component-years. 3. Failures are for the PWR RI systems in plant age group B.
4. L./2 indicates the midpoint of the cumulative AOV-years for the 1987-1995 period, for use in the Laplace test
(see Section 4.2 in the text). 5. See Figure 7 in the text.
11-3

APPENDIX II - TABLE III PWR RI SYSTEMS AOV ASSEMBLY FAILURES VERSUS COMPONENT-YEARS
PLANT AGE GROUP C ESF AND SURVEILLANCE TEST FAILURES - 1987-1995
EVENT NO. CUMULATIVE EVENT NO. DATE FAIL. AOV-YEARS DATE FAIL.
1/87 2/87 3/87 4/87 5/87 6/87 7/87 8/87 9/87
10/87 11/87 12/87
1/88 2/88 3/88 4/88 5/88 6/88 7/88 8/88 9/88 10/88 11/88 12/88
1/89 2/89 3/89 4/89 5/89 6/89 7/89 8/89 9/89 10/89 11/89 12/89 Totals:
15 31 46 61 77 92 107 123 138 153 169 184
204 224 244 264 284 304 323 343 363 383 403 423
445 466 488 510 531 553 575 596 618 640 661 683
0 0 0 0 0
1 0 0 0 0 1 0
1/90 2/90 3/90 4/90 5/90 6/90 7/90 8/90 9/90 10/90 11/90 12/90
1/91 2/91 3/91 4/91 5/91 6/91 7/91 8/91 9/91 10/91 11/91 12/91
1/92 2/92 3/92 4/92 5/92 6/92 7/92 8/92 9/92 10/92 11/92 12/92
CUMULATIVE EVENT NO. AOV-YEARS DATE FAIL
707 731 754 778 802 826 850 874 897 921 945 969
1/93 2/93 3/93 4/93 5/93 6/93 7/93 8/93 9/93 10/93 11/93 12/93
1/94 2/94 3/94 4/94 5/94 6/94 7/94 8/94 9/94 10/94 11/94 12/94
1/95 2/95 3/95 4/95 5/95 6/95 7/95 8/95 9/95 10/95 11/95 12/95
996 1024 1051 1078 1105 1132 1160 1187 1214 1242 1269 1296
-L1/2 1323 1351 1378 1405 1432 1459 1487 1514 1541 1568 1596 1623
0 0 0 0 0 0 0 0 0 0 0 1
0 0 0 0 0
1 0 0 0 0 0 0
0 0 0 0 0 0 0 0
0 0 16
CUMULATIVE AOV-YEARS
1650 1678 1705 1732 1759 1786 1814 1841 1868 1896 1923 1950
1977 2004 2032 2059 2086 2114 2141 2168 2195 2223 2250 2277
2304 2332 2359 2386 2413 2441 2468 2495 2522 2550 2577 2604
NOTES: 1. AAVF = 16 = 0.006 failures per commponent-year 1987-1995).
2604 2. The mean time between failures = 1/0.006 = 167 component-years. 3. Failures are for the PWR RI systems in plant age group C. 4. L/2 indicates the midpoint of the cumulative AOV-years for the 1987-1995 period, for use in the Laplace test
(see Section 4.2 in the text). 5. See Figure 7 in the text.
11-4

APPENDIX III
AOV ASSEMBLY
ENGINEERING INSIGHTS ON REPORTED FAILURES

APPENDIX III
AOV ASSEMBLY - ENGINEEERING INSIGHTS ON REPORTED FAILURES
TABLE NO.
IV III
IV
DESCRIPTION PAGE
Selected PWR RI Systems - Failures Per Component For Application Coded AOV Subcomponents and Assemblies ......... 111-2
Selected BWR RI Systems - Failures Per Component For Application Coded AOV Subcomponents and Assemblies ......... 111-3
Selected PWR and BWR RI Systems - Subcomponent Parts Failure Apportionm ent ..................................... 111-4
Selected PWR and BWR RI Systems - Subcomponent Parts Failure Causes Apportionment .............................. 111-5
I1-1

APPENDIX III - TABLE I SELECTED PWR RI SYSTEMS - FAILURES PER COMPONENT FOR APPLICATION CODED AOV
SUBCOMPONENTS AND ASSEMBLIES
VALVE BODIES
No. Surv. Test Fail.
No. ESF Failures
Total No. Failures
No. Valve Bodies
Failures Per Comp-Yr
Ave. Fail. Per Comp.
VALVE OPERATORS
No. Surv. Test Fail:
No. ESF Failures
Total No. Failures
No. Valve Oper.
Failures Per Comp-Yr
Ave. Fail. Per Comp.
AOV ASSY
Total No. Failures
No. AOV Assys
Failures Per Comp-Yr
1987
0
3
3
977
.003
1988
1
0
1
1032
.001
1989
1
0
1
1053
.001
1990
1
0
1
1053
.001
1991
0
0
0
1120
0
1992 1993
2 1
0 0
2 1
1120 1120
.002 .001
1994 1995
0 3
0 0
0 3
1120 1120
0 .003
------------------------------ --------.. . .---. 001 -------------------------------------------
1987 1988 1989 1990 1991 1992 1993 1994 1995
5 0 8 6 0 7 2 1 3
2 1 0 0 2 0 0 0 0
7 1 8 6 2 7 2 1 3
977 1032 1053 1053 1120 1120 1120 1120 1120
.007 .001 .008 .006 .002 .006 .002 .001 .003
1987
10
977
1988
2
1032
1989
9
1053
1990
7
1053
.0 0 4 -------------------------------------------
991 1992 1993 1994 1995
2 9 3 1 6
120 1120 1120 1120 1120
.010 .002 .008 .007 .002 .008 .003 .001 .005
Ave. Failures Per Comp. - -----
Note 1. See Figure 6 in text.
00 -----------------------------------
111-2
TOTAL
9
3
12
TOTAL
32
5
37
TOTAL
49
----------------------------------------------
--------------------------------------

APPENDIX III - TABLE II SELECTED BWR RI SYSTEMS - FAILURES PER COMPONENT FOR APPLICATION CODED AOV
SUBCOMPONENTS AND ASSEMBLIES
VALVE BODIES 1987
No. Surv. Test Fail.: 0
No. ESF Failures: 0
Total No. Failures: 0
No. Valve Bodies: 102
Failures Per Comp-Yr 0
Ave. Fail. Per Comp.
VALVE OPERATORS 1987
No. Surv. Test Fail.: 0
No. ESF Failures: 0
Total No. Failures: 0
No. Valve Oper. 102
Failures Per Comp-Yr 0
Ave. Fail. Per Comp.
AOV ASSY 1987
Total No. Failures: 0
No. AOV Assys: 102
Failures Per Comp-Yr 0
Ave. Failures Per Comp.
1988
0
0
0
107
0
1988
1
0
1
107
.009
1989
0
0
0
107
0
1989
0
0
0
107
0
1990
0
0
0
109
0
1990
2
0
2
109
.018
1988 1989 1990
1 0 2
107 107 109
.009 0 .018
1991
2
0
2
109
.018
AAlo
1992 1993
0 0
0 0
0 0
109 109
0 .0
1991 1992 1993
0 1 0
0 0 0
0 1 0
109 109 109
0 .009 0
-.004---
1991 1992 1993
2 1 0
109 109 109
.018 .009 0
1994
0
0
0
109
0
1994
0
0
0
109
0
1994
0
109
0
1995 TOTAL
0 2
0 0
0 2
109
0
1995 TOTAL
0 4
0 0
0 4
109
0
1995 TOTAL
0 6
109
0
Notes:
1. No figure is provided in the text, as failure data is too sparse.
111-3
- nno_.uur....--
- - - - - - - - - - - - -.. . . . . . . . . . . . . . . .•U U . . . . . . . . . . . . . .|

APPENDIX III - TABLE III SELECTED PWR AND BWR RI SYSTEMS - SUBCOMPONENT PARTS
FAILURE APPORTIONMENT
A. Valve Bodies
PWR
Subcomp. Part No. Fail.
Valve Internals 6
Valve Stem 4
Packing 2
Totals: 12
B. Valve Operators
.PWR
Subcomp. Part No. Fail.
Solenoid Valve 9
Diaphragm 3
Internals 5
Positioner 5
Air Regulator 6
Air Line 3
Other 6
Totals: 37
Percent
50
33
17
100
Percent
24
8
14
14
16
8
16
100
BWR Subcomp. Part
Valve Internals
Valve Stem
Packing
Totals:
BWR
Subcomp. Part
Solenoid Valves
Diaphragms
Internals
Positioner
Air Regulator
Air Line
Other
Totals:
See Figure 8 in text for PWRs. No figure is provided in text for BWRs, as data is too sparse.
111-4
No. Fail.
1
0
1
2
No. Fail.
4
0
0
0
0
0
0
4
Percent
50
0
50
100
Percent
100
0
0
0
0
0
0
100
Notes:
1. 2.

APPENDIX III - TABLE IV SELECTED PWR AND BWR RI SYSTEMS - SUBCOMPONENT PARTS
FAILURE CAUSES APPORTIONMENT
A. Valve Bodies
Fail. Cause
Age/Wear
Unknown
Dirt/Contam./ Corrosion
MaintJProced. Deficiencies
Debris/Foreign Material
Design Defic.
Totals:
PWR No. Fail.
3
1
1
4
2
1
12
Percent
25
8
8
34
17
a
100
Failure Cause
Age/Wear
Unknown
DirtVContam/ Corrosion
Maint./Proced. Deficiencies
Debris/Foreign Material
Design Defic.
Totals:
BWR No. Fail.
1
0
0
1
0
-0
2
B. Valve Operators
PWR Fail. Cause No. Fail.
Age/Wear 20
Unknown 12
Dirt/Contam./ 0Corrosion
Maint./Proced. Deficiencies
Design Defic.
Other
Totals:
2
2
1
37
Percent
54
33
0
5
5
3
100
Failure Cause
Age/Wear.
Unknown
Dirt/Contam./ Corrosion
Maint./Proced. Deficiencies
Design Defic.
Other
Totals:
BWR No. Fail.
4
0
0
0
0
0
4
See Figure 9 in text for PWRs. No figure is provided in text for BWRs, as failure data is too sparse.
111-5
Percent
50
0
0
50
0
0
100
Percent
100
0
0
0
0
0
100
Notes:
1. 2.

APPENDIX IV
AOV ASSEMBLY
DATA SOURCE INPUT FOR REPORTED FAILURES AND ESTIMATED DEMANDS

ABBREVIATIONS USED IN APPENDIX IV - TABLES I THROUGH IV
Column Headings: ESFISURV
PLT ID NO.
DATA SRC
PLT AGE -
ESF or surveillance test failure
Numerical identifier assigned to each selected plant used with NPRDS failure histories. When source is from LERs, a 3-digit docket number is used.
Data Source, either as NPRDS failure history (FHIS) or as a 5-digit LER number, as applicable.
Plant Age Group (A, B, or C) that indicates the plant commercial licsense date.as follows:
A- 12131/74 and earlier. B - 111/75 through 3131/86
PLT SYS
NO. FAIL
DISC DATE
SUB COMP
COMP PART
FAIL MODE -
C - 4/1/86 and later
The selected risk important (RI) system in which the component failed (see text list of acronyms for system abbreviations).
Number of same subcomponents failed.with same failure mode, system, date, etc.
For NPRDS failures, this is the discovery date and for LERs, this is the event date, shown by month and year only (i.e., 0189 is January 1989, etc.).
Subcomponent of the AOV assembly (VB - Valve Body and VO Valve Operator).
Subcomponent part. These are as follows: Valve Bodies (VB) Valve Operators (VO) Internals (INT) Internals/seals (INT) Solenoid valve (SOV) Packing (PKG) Diaphragm (DIA) Air line (AL)
Stem (STM) Air Regulator (AR) Pilot Valve (PV) Volume Booster (VOL) Positioner (POS) Wiring/Contacts (WC) Bolting (BLT) Mechanical Linkage (ML)
Failure Mode as follows: Failure to close (FC) Failure to open (FO) Failure to operate as required (both fail to open and fail to close - OR)
FAIL CAUS - Failure cause as follows: Age/Wear (AW) Dirt/Contamination (DC) Design Deficiency (DD) Manufacturing Defect (MF) Unknown (UK) Debris/Foreign Material (DF) Maintenance/Procedural Deficiency (MP)
Other Devices (OD)
IV-1

APPENDIX IV DATA SOURCE INPUT FOR REPORTED FAILURES AND ESTIMATED DEMANDS
LIST OF TABLES
TABLE NO. DESCRIPTION PAGE
I PWR AOV Assemblies - Selected RI Systems Data Source Inputs Surveillance Test and ESF Failures - 1987-1995 .................... IV-3
I1 BWR AOV Assemblies - Selected RI Systems Data Source Inputs Surveillance Test and ESF Failures - 1987-1995 .................... IV-5
III PWR Application Coded AOV Assemblies - Selected RI System Data Source Inputs - ESF Demands - 1987-1995 ....................... IV-6
IliA PWR Application Coded AOV Assemblies - Selected RI System Data Source Inputs - ESF Demands - 1996-1998 ....................... IV-15
IV BWR Application Coded AOV Assemblies - Selected RI System Data Source Inputs - ESF Demands - 1987-1995 ...................... IV-16
IVA BWR Application Coded AOV Assemblies - Selected RI System Data Source Inputs - ESF Demands - 1996-1998 ...................... IV-17
V PWR Application Coded AOV Assemblies - Selected RI System Data Source Inputs - Estimated Surveillance Test Demands - 1987-1995 .... IV-18
VI BWR Application Coded AOV Assemblies - Selected RI System Data Source Inputs - Estimated Surveillance Test Demands - 1987-1995 .... IV-29
IV-2

APPENDIX IV - TABLE I PWR AOV ASSEMBLIES - SELECTED RI SYSTEMS DATA SOURCE INPUTS
SURVEILLANCE TEST AND ESF FAILURES 1987-1995
ITEM ESFI PLT DATA PLT PLT NO. DISC SUB COMP FAIL FAIL
NO. SURV ID SRC. AGE SYS FAIL DATE COMP PART MODE CAUS
NO.
1 SURV 11 FHIS A AFW 1 0287 VO AR OR UK
2 SURV 46 FHIS B AFW 1 0387 VO WC FC UK
3 ESF 13 FHIS A RCS 1 0587 VB STM FC MP
4 SURV 83 FHIS B CVCS 1 0687 VO AR FO AW
5 ESF 336 87011 B RCS 2 0787 VB PKG FC AW
6 ESF 266 87005 A RCS 1 1187 VO POS FC AW
7 SURV 11 FHIS A AFW 1 1187 VO POS FO UK
8 ESF 65 FHIS B CVCS 1 1287 VO SOV OR AW
9 SURV 72 FHIS B AIW 1 1287 VO SOV FO UK
10 ESF 334 88014 B AFW 1 0988 VO DIA FC AW
11 SURV 79 FHIS C CVCS 1 1088 VB INT FC DD
12 SURV 40 FHIS A cow 1 0189 VO ART FO AW
13 SURV 88 FHIS C CVCS 1 0189 VO SOV FO UK
14 SURV 83 FHIS B CVCS 1 0289 VB INT FO UK
15 SURV 83 FHIS B CVCS 1 0389 VO SOV FC AW
16 SURV 89 FHIS C AFW 1 0689 VO POS FC UK
17 SURV 44 FHIS B RCS 1 1089 VO AR FO AW
18 SURV 27 FHIS A CVCS 1 1189 VO AL FO UK
19 SURV 38 FHIS A CVCS 1 1189 VO SOV OR AW
20 SURV 85 FHIS C CVCS 1 1189 VO SOV FO UK
21 SURV 88 FHIS C CVCS 1 0190 VO INT FO AW
22 SURV 88 FHIS C CVCS 1 0390 VO INT FO AW
23 SURV 28 FHIS A CCW 1 0490 VO BLT FO MP
24 SURV 103 FHIS C CVCS 1 0490 VO SOV FO AW
25 SURV 54 FHIS B AFW 1 0590 VB STM FC MP
26 SURV 23 FHIS B CVCS 1 0790 VO DIA FO AW
27 SURV 85 FHIS C CVCS 1 1190 VO BLT FO UK
28 ESF 414 91011 C RCS 1 0991 VO POS FC DD
29 ESF 499 91010 C RCS 1 1291 VO POS OR MP
1V-3

APPENDIX IV - TABLE I (CONTINUED) PWR AOV ASSEMBLIES - SELECTED RI SYSTEMS DATA SOURCE INPUTS
SURVEILLANCE TEST AND ESF FAILURES 1987-1995
ITEM APPL PLT DATA PLT PLT NO. DISC SUB COMP FAIL FAIL NO. CODE ID SRC. AGE SYS FAIL DATE COMP PART MODE CAUS
NO.
30 SURV 269 92005 A AFW 1 0592 VO SOV OR DD
31 SURV 20 FHIS A AFW 1 0592 VO SOV FC OD
32 SURV 8 FHIS A AFW 1 0692 VB STM OR DC
33 SURV 88 FHIS C CVCS 2 0892 VO INT FO AW
34 SURV 59 FHIS B CVCS 1 0992 VO AR FO AW
35 SURV 65 FHIS B RHR 1 0992 VO AL OR UK
36 SURV 44 FHIS B RCS 1 1092 VO AR FO AW
37 SURV 54 FHIS B CVCS 1 1292 VB STM FC MP
38 SURV 247 93003 A CCW 1 0293 VB INT FC AW
39 SURV 55 FHIS B AFW 1 0893 VO DIA FC AW
40 SURV 88 FHIS C CVCS 1 1293 VO INT FO AW
41 SURV 103 FHIS C CVCS 1 0694 VO ML FO UK
42 SURV 2 FHIS A CCW 1 0295 VB INT FC DF
43 SURV 28 FHIS A CVCS 1 0295 VB INT FC MP
44 SURV 85 FHIS C CVCS 1 0995 VO AL FO AW
45 SURV 8 FHIS A AFW 1 1095 VB INT FO DF
46 SURV 24 FHIS C RCS 1 1095 VO VOL OR UK
47 SURV 54 FHIS B AFW 1 1295 VO PV OR AW
Total number of PWR AOV failures: 49
Note: There were no PWR AOV ESF failures for the 1996-1998 period.
IV-4
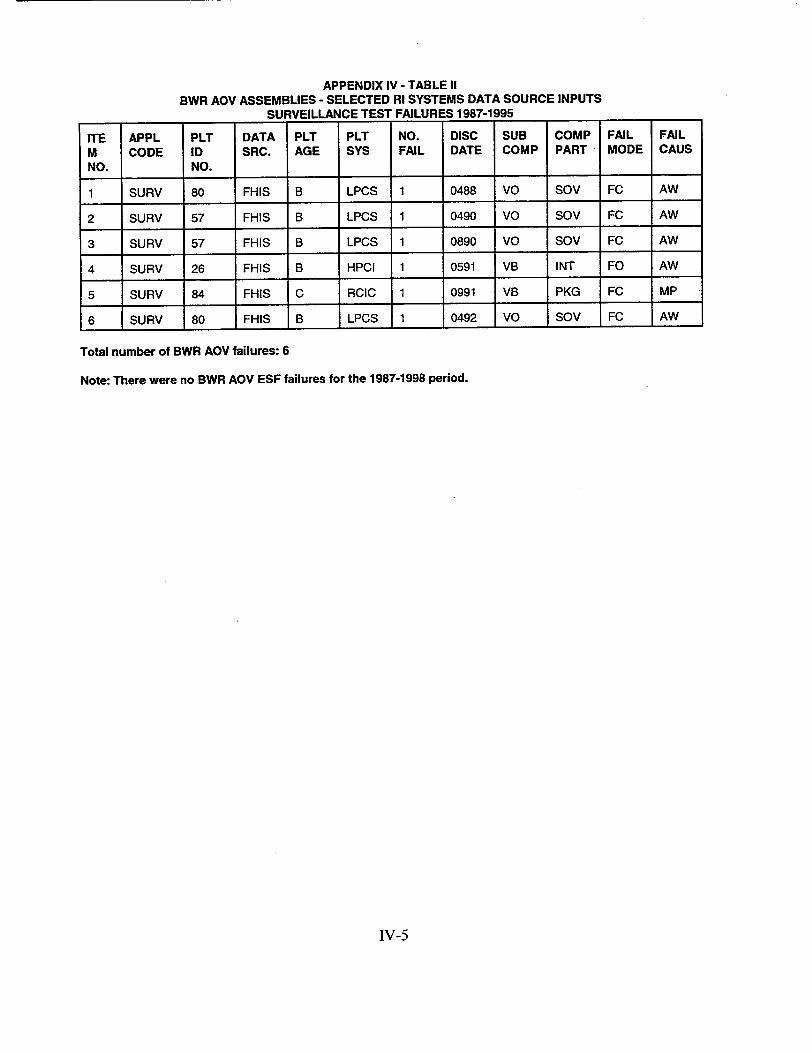
APPENDIX IV - TABLE II BWR AOV ASSEMBLIES - SELECTED RI SYSTEMS DATA SOURCE INPUTS
SURVEILLANCE TEST FAILURES 1987-1995
ITE APPL PLT DATA PLT PLT NO. DISC SUB COMP FAIL FAIL
M CODE ID SRC. AGE SYS FAIL DATE COMP PART MODE CAUS
NO. NO.
1 SURV 80 FHIS B LPCS 1 0488 VO SOV FC AW
2 SURV 57 FHIS B LPCS 1 0490 VO SOV FC AW
3 SURV 57 FHIS B LPCS 1 0890 VO SOV FC AW
4 SURV 26 FHIS B HPCI 1 0591 VB INT FO AW
5 SURV 84 FHIS C RCIC 1 0991 VB PKG FC MP
6 SURV 80 FHIS B LPCS 1 0492 VO SOV FC AW
Total number of BWR AOV failures: 6
Note: There were no BWR AOV ESF failures for the 1987-1998 period.
IV-5
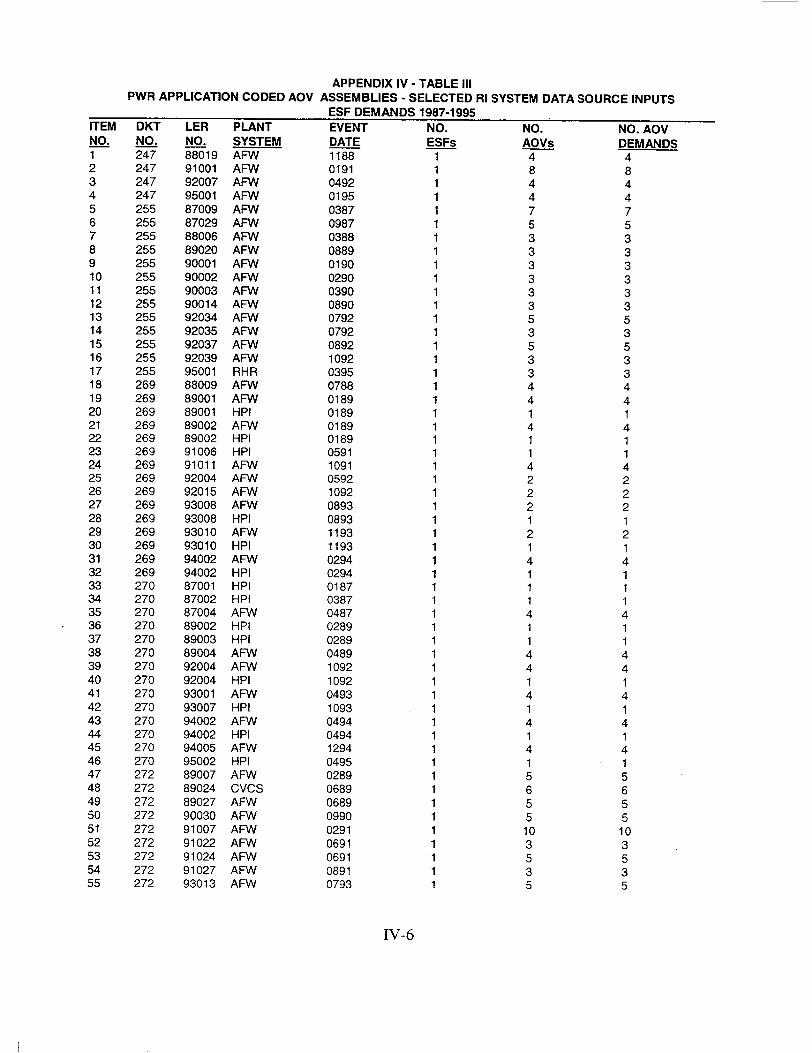
APPENDIX IV - TABLE III PWR APPLICATION CODED AOV ASSEMBLIES - SELECTED RI SYSTEM DATA SOURCE INPUTS
ESF DEMANDS 1987-1995 ITEM DKT LER PLANT EVENT NO. NO. NO. AOV NO. NO. NO. SYSTEM DATE ESFs AOVs DEMANDS 1 247 88019 AFW 1188 1 4 4 2 247 91001 AFW 0191 1 8 8 3 247 92007 AFW 0492 1 4 4 4 247 95001 AFW 0195 1 4 4 5 255 87009 AFW 0387 1 7 7 6 255 87029 AFW 0987 1 5 5 7 255 88006 AFW 0388 1 3 3 8 255 89020 AFW 0889 1 3 3 9 255 90001 AFW 0190 1 3 3 10 255 90002 AFW 0290 1 3 3 11 255 90003 AFW 0390 1 3 3 12 255 90014 AFW 0890 1 3 3 13 255 92034 AFW 0792 1 5 5 14 255 92035 AFW 0792 1 3 3 15 255 92037 AFW 0892 1 5 5 16 255 92039 AFW 1092 1 3 3 17 255 95001 RHR 0395 1 3 3 18 269 88009 AFW 0788 1 4 4 19 269 89001 AFW 0189 1 4 4 20 269 89001 HPI 0189 1 1 1 21 269 89002 AFW 0189 1 4 4 22 269 89002 HPI 0189 1 1 1 23 269 91006 HPI 0591 1 1 1 24 269 91011 AFW 1091 1 4 4 25 269 92004 AFW 0592 1 2 2 26 269 92015 AFW 1092 1 2 2 27 269 93008 AFW 0893 1 2 2 28 269 93008 HPI 0893 1 1 1 29 269 93010 AFW 1193 1 2 2 30 269 93010 HPI 1193 1 1 1 31 269 94002 AFW 0294 1 4 4 32 269 94002 HPI 0294 1 1 1 33 270 87001 HPI 0187 1 1 1 34 270 87002 HPI 0387 1 1 1 35 270 87004 AFW 0487 1 4 4 36 270 89002 HPI 0289 1 1 1 37 270 89003 HPI 0289 1 1 1 38 270 89004 AFW 0489 1 4 4 39 270 92004 AFW 1092 1 4 4 40 270 92004 HPI 1092 1 1 1 41 270 93001 AFW 0493 1 4 4 42 270 93007 HPI 1093 1 1 1 43 270 94002 AFW 0494 1 4 4 44 270 94002 HPI 0494 1 1 1 45 270 94005 AFW 1294 1 4 4 46 270 95002 HPI 0495 1 1 1 47 272 89007 AFW 0289 1 5 5 48 272 89024 CVCS 0689 1 6 6 49 272 89027 AFW 0689 1 5 5 50 272 90030 AFW 0990 1 5 5 51 272 91007 AFW 0291 1 10 10 52 272 91022 AFW 0691 1 3 3 53 272 91024 AFW 0691 1 5 5 54 272 91027 AFW 0891 1 3 3 55 272 93013 AFW 0793 1 5 5
W-6

APPENDIX IV - TABLE III (CONTINUED) PWR APPLICATION CODED AOV ASSEMBLIES - SELECTED RI SYSTEM DATA SOURCE INPUTS
ESF DEMANDS 1987-1995
ITEM DKT LER PLANT EVENT NO. NO. NO. AOV
NO. NO. NO. SYSTEM DATE ESFs AOVs DEMANDS 56 272 94007 CVCS 0494 2 6 12
57 272 94011 AFW 0794 1 10 10
58 280 92001 AFW 0192 1 1 1
59 280 93001 AFW 0193 1 1 1
60 280 93002 AFW 0293 1 1 1
61 280 94006 AFW 0594 1 1 1
62 280 95001 AFW 0195 1 1 1
63 280 95003 AFW 0495 1 1 1
64 281 88010 AFW 0190 1 1 1
65 281 89010 AFW 0989 1 1 1
66 281 92010 AFW 0992 1 1 1
67 281 93003 AFW 0893 1 1 1
68 281 93004 AFW 0893 1 1 1
69 281 93005 AFW 0893 1 1 1
70 281 95004 AFW 0595 1 1 1
71 281 95005 AFW 0595 1 1 1
72 285 87036 AFW 1187 1 4 4
73 285 90026 AFW 1190 1 2 2 74 285 92023 AFW 0792 1 4 4 75 285 93011 AFW 0693 1 2 2 76 285 93018 AFW 1293 1 2 2
77 285 94001 AFW 0294 1 4 4
78 286 87001 AFW 0187 1 4 4
79 286 88006 AFW 1088 1 8 8
80 286 89015 AFW 1089 1 9 8
81 286 90002 AFW 0290 1 4 4
82 286 90004 AFW 0690 1 8 8
83 286 91004 AFW 0391 1 8 8 84 286 92013 AFW 0992 1 4 4
85 286 92015 AFW 0992 1 4 4
86 286 95012 AFW 0695 1 4 4
87 287 91007 AFW 0791 1 4 4
88 287 92001 AFW 0192 1 4 4
89 287 92003 AFW 0692 1 4 4
90 287 93001 AFW 0193 1 4 4
91 287 94002 AFW 0894 1 4 4
92 287 94003 AFW 0894 1 4 4 93 289 88004 AFW 0888 1 4 4
94 289 89004 AFW 0889 1 1 1
95 289 91003 AFW 0991 1 1 1
96 289 91007 AFW 1191 1 4 4
97 289 92001 AFW 0192 1 1 1
98 295 87009 CVCS 0487 1 3 3
99 295 91008 AFW 0591 1 3 3
100 295 91016 CVCS 1191 1 3 3
101 295 92019 CVCS 1192 1 3 3
102 295 95022 CVCS 1195 1 3 3
103 305 87005 AFW 0487 1 2 2
104 305 87008 AFW 0687 1 2 2
105 305 87009 AFW 0787 1 2 2
106 305 88001 AFW 0388 1 2 2
107 305 88004 AFW 0488 1 2 2
108 305 88006 AFW 0588 1 2 2
109 305 88012 AFW 0988 1 2 2
110 305 89016 AFW 1289 1 2 2
IV-7

APPENDIX IV - TABLE III (CONTINUED) PWR APPLICATION CODED AOV ASSEMBLIES - SELECTED RI SYSTEM DATA SOURCE INPUTS
ESF DEMANDS 1987-1995 ITEM DKT LER PLANT EVENT NO. NO. NO. AOV NO. NO. NO. SYSTEM DATE ESFs AOVs DEMANDS 111 305 91010 AFW 1091 1 2 2 112 305 92017 AFW 0992 1 2 2 113 305 93001 AFW 0193 1 2 2 114 305 93013 AFW 0693 1 2 2 115 309 89001 AFW 0189 1 9 9 116 309 94008 AFW 0594 1 9 9 117 311 88014 CVCS 0688 1 4 4 118 311 88024 AFW 1188 1 6 6 119 311 89005 CVCS 0389 1 4 4 120 311 90017 AFW 0590 1 1 1 121 311 90029 AFW 0690 1 10 10 122 311 90037 CVCS 0990 1 4 4 123 311 91009 AFW 0691 1 1 1 124 311 91012 AFW 0891 1 1 1 125 311 92001 AFW 0192 1 1 1 126 311 92014 AFW 0992 1 6 6 127 311 93002 AFW 0193 1 10 10 128 311 93005 AFW 0393 1 10 10 129 311 93009 AFW 0693 1 6 6 130 311 94008 AFW 0694 1 10 10 131 313 90017 RHR 1290 1 2 2 132 315 87008 AFW 0687 1 3 3 133 315 87021 AFW 1087 1 3 3 134 315 88001 AFW 0188 1 3 3 135 315 88011 AFW 1088 1 2 2 136 315 88013 AFW 1188 1 2 2 137 315 89001 AFW 0189 1 3 3 138 315 89003 AFW 0389 1 2 2 139 315 91004 AFW 0591 1 3 3 140 315 95003 AFW 0795 1 2 2 141 315 95005 AFW 0795 1 2 2 142 316 87004 AFW 0687 1 3 3 143 316 87005 AFW 0687 1 2 2 144 316 87007 AFW 0787 1 3 3 145 316 87008 AFW 0787 1 3 3 146 316 89014 AFW 0889 1 2 2 147 316 90004 AFW 0690 1 2 2 148 316 90012 AFW 1290 1 3 3 149 316 90013 AFW 1290 1 3 3 150 316 91004 AFW 0391 1 3 3 151 316 91006 AFW 0891 1 3 3 152 316 91010 AFW 1191 1 3 3 153 316 93007 AFW 0893 1 2 2 154 316 94001 AFW 0294 1 2 2 155 316 94005 AFW 0894 1 2 2 156 316 94008 AFW 1294 1 2 2 157 316 95005 AFW 0895 1 3 3 158 317 91003 AFW 1091 1 9 9 159 317 91008 AFW 1291 1 9 9 160 317 94001 AFW 0194 1 6 6 161 317 94006 AFW 0694 1 6 6 162 317 94007 AFW 0794 1 6 6 163 317 95002 AFW 0695 1 9 9 164 317 95005 AFW 1195 1 9 9 165 317 95006 AFW 1195 1 9 9
IV-8

APPENDIX IV - TABLE III (CONTINUED) PWR APPLICATION CODED AOV ASSEMBLIES - SELECTED RI SYSTEM DATA SOURCE INPUTS
ESF DEMANDS 1987-1995
ITEM DKT LER PLANT EVENT NO. NO. NO. AOV
NO. NO. NO. SYSTEM DATE ESFs AOVs DEMANDS 166 318 87006 AFW 0987 1 6 6
167 318 87007 AFW 1087 1 6 6 168 318 87008 AFW 1187 1 9 9 169 318 88002 AFW 0188 1 12 12 170 318 88004 AFW 0488 1 12 12 171 318 93002 AFW 0693 1 6 6 172 318 94001 AFW 0194 1 9 9 173 318 95002 AFW 0195 1 9 9 174 327 88045 AFW 1188 1 5 5 175 327 88047 AFW 1288 1 5 5 176 327 89005 AFW 0289 1 5 5 177 327 89035 AFW 1289 1 4 4 178 327 90009 AFW 0590 1 5 5 179 327 90021 AFW 0990 1 4 4 180 327 90030 AFW 1190 1 5 5 181 327 92018 AFW 1092 1 4 4 182 327. 92027 AFW 1292 1 5 5 183 327 94011 AFW 0794 1 5 5 184 327 94014 AFW 1194 1 5 5 185 327 95008 AFW 0695 1 5 5
186 328 88023 AFW 0588 1 9 9 187 328 88024 AFW 0588 1 12 12 188 328 88027 AFW 0688 1 12 12 189 328 88028 AFW 0688 1 12 12 190 328 89008 AFW 0789 1 12 12 191 328 90008 AFW 0490 1 6 6 192 328 91001 AFW 0191 1 12 12 193 328 81006 AFW 1191 1 12 12 194 328 95007 AFW 1295 1 6 6 195 334 88007 HPI 0688 1 1 1 196 334 98007 HPI 0589 1 1 1 197 334 93013 HPI 1093 1 1 1
198 334 94005 HPI 0691 1 1 1
199 334 95003 HPI 0295 1 1 1 200 348 87002 AFW 0187 1 3 3 201 348 87003 AFW 0187 1 3 3 202 348 87004 AFW 0187 1 3 3 203 348 87010 AFW 0587 1 3 3
204 348 88021 AFW 1088 1 3 3 205 348 89006 AFW 1189 1 3 3 206 348 90005 AFW 0790 1 3 3
207 348 91006 AFW 0591 1 3 3 208 348 91007 AFW 0691 1 3 3 209 348 91008 AFW 0891 1 3 3
210 348 91009 AFW 0891 1 3 3
211 348 91010 AFW 1091 1 3 3
212 348 92008 AFW 1292 1 3 3
213 348 95010 AFW 1195 1 3 3 214 364 87001 AFW 0287 1 4 4 215 364 89007 AFW 0589 1 4 4
216 364 89008 AFW 0589 1 4 4 217 364 89010 AFW 0989 1 4 4 218 364 89012 AFW 1089 1 4 4
219 364 89015 AFW 1189 1 4 4
220 364 91001 AFW 0491 1 4 4
IV-9

APPENDIX IV - TABLE III (CONTINUED) PWR APPLICATION CODED AOV ASSEMBLIES - SELECTED RI SYSTEM DATA SOURCE INPUTS
ESF DEMANDS 1987-1995 ITEM DKT LER PLANT EVENT NO. NO. NO. AOV NO. NO. NO. SYSTEM DATE ESFs AOVs DEMANDS 221 364 91002 AFW 0491 1 4 4 222 364 91004 AFW 0491 1 4 4 223 364 91005 AFW 0891 1 4 4 224 364 92001 AFW 0192 1 4 4 225 364 92002 AFW 0392 1 4 4 226 364 92003 AFW 0592 1 4 4 227 364 92005 AFW 0592 1 4 4 228 364 92006 AFW 0592 1 4 4 229 364 92007 AFW 0592 1 4 4 230 364 92008 AFW 1592 1 4 4 231 364 92010 AFW 1092 1 4 4 232 369 87017 CVCS 0887 1 5 5 233 369 88005 CVCS 0388 1 5 5 234 369 89004 CVCS 0389 1 5 5 235 369 91001 CVCS 0291 1 5 5 236 382 87008 AFW 0387 1 8 8 237 382 87012 AFW 0487 1 8 8 238 382 87016 AFW 0587 1 8 8 239 382 87029 AFW 0787 1 4 4 240 382 87028 AFW 1287 1 4 4 241 382 88016 AFW 0688 1 8 8 242 382 88033 AFW 1288 1 8 8 243 382 89013 AFW 0789 1 8 8 244 382 89024 AFW 1289 1 8 8 245 382 90002 AFW 0390 1 8 8 246 382 90003 AFW 0390 1 4 4 247 382 91013 AFW 0691 1 4 4 248 382 91019 AFW 0891 1 6 6 249 382 91022 AFW 1191 1 8 8 250 382 93001 AFW 0393 1 8 8 251 382 95002 AFW 0695 1 4 4 252 395 87015 AFW 0687 1 6 6 253 395 87021 AFW 0987 1 4 4 254 395 87027 AFW 1087 1 6 6 255 395 88002 AFW 0588 1 6 6 256 395 88006 AFW 0588 1 4 4 257 395 88007 AFW 0688 1 4 4 258 395 88009 AFW 0788 1 6 6 259 395 89020 AFW 1289 1 6 6 260 395 93001 AFW 0193 1 4 4 261 400 87008 AFW 0287 1 2 2 262 400 87012 AFW 0387 1 2 2 263 400 87013 AFW 0387 1 2 2 264 400 87014 AFW 0387 1 2 2 265 400 87017 AFW 0387 1 3 3 266 400 87018 AFW 0487 1 2 2 267 400 87019 AFW 0487 1 2 2 268 400 87024 AFW 0487 1 2 2 269 400 87025 AFW 0487 1 2 2 270 400 87026 AFW 0487 1 2 2 271 400 87028 AFW 0587 1 2 2 272 400 87031 AFW 0587 1 2 2 273 400 87035 AFW 0687 1 3 3 274 400 87029 AFW 0687 1 2 2 275 400 87037 AFW 0687 1 2 2
IV-10

Iv-11
APPENDIX IV - TABLE III (CONTINUED) PWR APPLICATION CODED AOV ASSEMBLIES - SELECTED RI SYSTEM DATA SOURCE INPUTS
ESF DEMANDS 1987-1995
ITEM DKT LER PLANT EVENT NO. NO. NO. AOV NO. NO. NO. SYSTEM DATE ESFs AOVs DEMANDS 276 400 87041 AFW 0887 1 2 2 277 400 87042 AFW 0787 1 3 3 278 400 87046 AFW 0787 1 2 2 279 400 87047 AFW 0887 1 2 2 280 400 87048 AFW 0987 1 2 2 281 400 87049 AFW 0987 1 2 2 282 400 87051 AFW 0887 1 2 2 283 400 87062 AFW 1187 1 3 3 284 400 87063 AFW 1187 1 2 2 285 400 88007 AFW 0388 1 2 2 286 400 88018 AFW 0788 1 2 2 287 400 88021 AFW 0888 1 2 2 288 400 88028 AFW 1088 1 2 2 289 400 89001 AFW 0189 1 3 3 290 400 89003 AFW 0289 1 3 3 291 400 89004 AFW 0289 1 2 2 292 400 89005 AFW 0289 1 3 3 293 400 89006 AFW 0389 1 2 2 294 400 89019 AFW 1289 1 3 3 295 400 89021 AFW 1289 1 3 3 296 400 91009 AFW 0591 1 2 2 297 400 91010 AFW 0691 1 3 3 298 400 91015 AFW 0591 1 2 2 299 400 92007 AFW 0792 1 2 2 300 400 92008 AFW 0792 1 2 2 301 400 92009 AFW 0792 1 3 3 302 400 92010 AFW 0792 1 2 2 303 400 93007 AFW 0593 1 3 3 304 400 95010 AFW 1095 1 2 2 305 412 87005 AFW 0787 1 8 8 306 412 87017 AFW 0887 1 3 3 307 412 87020 AFW 0987 1 8 8 308 412 87023 AFW 0987 1 8 8 309 412 87024 AFW 0987 1 3 3 310 412 87025 AFW 0987 1 3 3 311 412 87026 AFW 1087 1 8 8 312 412 87028 AFW 1087 1 8 8 313 412 87030 AFW 1987 1 3 3 314 412 87032 AFW 1087 1 8 8 315 412 87034 AFW 1987 1 3 3 316 412 87035 AFW 1187 1 8 8 317 412 88011 AFW 0888 1 3 3 318 412 89003 AFW 0189 1 8 8 319 412 89015 AFW 0589 1 3 3 320 412 89019 AFW 0689 1 8 8 321 412 89020 AFW 0689 1 3 3 322 412 90008 AFW 0790 1 8 8 323 412 91005 AFW 1191 1 8 8 324 412 92006 AFW 0592 1 3 3 325 412 92007 AFW 0592 1 3 3 326 412 92009 AFW 0692 1 3 3 327 412 93002 AFW 0193 1 8 8 328 412 94006 AFW 0694 1 2 2 329 412 95006 AFW 0895 1 8 8 330 413 87006 AFW 0187 1 2 2

APPENDIX IV - TABLE III (CONTINUED) PWR APPLICATION CODED AOV ASSEMBLIES - SELECTED RI SYSTEM DATA SOURCE INPUTS
ESF DEMANDS 1987-1995 ITEM DKT LER PLANT EVENT NO. NO. NO. AOV NO. NO. NO. SYSTEM DATE ESFs AOVs DEMANDS 331 413 87013 AFW 0387 1 2 2 332 413 87015 AFW 0487 1 2 2 333 413 87026 AFW 0787 1 2 2 334 413 87027 AFW 0787 1 2 2 335 413 87028 AFW 0787 1 2 2 336 413 87029 AFW 0787 1 2 2 337 413 88007 AFW 0188 1 2 2 338 413 88007 CVCS 0188 1 7 7 339 413 89008 AFW 0389 1 2 2 340 413 89008 CVCS 0389 1 7 7 341 413 89017 AFW 0689 1 2 2 342 413 89022 AFW 0889 1 2 2 343 413 91013 AFW 0691 1 2 2 344 413 91015 AFW 0791 1 2 2 345 413 91018 AFW 0991 1 2 2 346 413 91019 AFW 0991 1 2 2 347 413 92008 AFW 0792 1 2 2 348 413 93006 AFW 0693 1 2 2 349 413 93007 AFW 0393 1 2 2 350 413 93008 AFW 0793 1 2 2 351 413 94001 AFW 0194 1 2 2 352 414 87002 AFW 0187 1 4 4 353 414 87003 AFW 0187 1 4 4 354 414 87007 AFW 0287 1 4 4 355 414 87010 AFW 0387 1 4 4 356 414 87013 AFW 0387 1 2 2 357 414 87018 AFW 0587 1 4 4 358 414 87019 AFW 0587 1 4 4 359 414 87021 AFW 0787 1 2 2 360 414 87025 AFW 0987 1 4 4 361 414 87027 AFW 0987 1 4 4 362 414 87029 AFW 1187 1 2 2 363 414 88003 CVCS 0288 1 7 7 364 414 88005 AFW 0288 1 2 2 365 414 88007 AFW 0288 1 2 2 366 414 88012 AFW 0388 1 4 4 367 414 88014 AFW 0388 1 2 2 368 414 88019 AFW 0588 1 4 4 369 414 88020 AFW 0588 1 2 2 370 414 88021 AFW 0688 1 4 4 371 414 88023 AFW 0688 1 4 4 372 414 88025 AFW 0688 1 4 4 373 414 88028 AFW 0988 1 2 2 374 414 88031 AFW 1188 1 4 4 375 414 89001 AFW 0189 1 4 4 376 414 89002 AFW 0189 1 4 4 377 414 89003 AFW 0289 1 4 4 378 414 89003 CVCS 0289 1 7 7 379 414 89004 CVCS 0289 1 7 7 380 414 89015 AFW 0689 1 2 2 381 414 90013 AFW 1090 1 4 4 382 414 91006 AFW 0491 1 2 2 383 414 91008 AFW 0591 1 4 4 384 414 92001 AFW 0192 1 4 4 385 414 93003 AFW 0993 1 4 4
fV- 12

APPENDIX IV - TABLE III (CONTINUED)
PWR APPLICATION CODED AOV ASSEMBLIES - SELECTED RI SYSTEM DATA SOURCE INPUTS
ESF DEMANDS 1987-1995
ITEM DKT LER PLANT EVENT NO. NO. NO. AOV
NO. NO. NO. SYSTEM DATE ESFs AOVs DEMANDS
386 414 94003 AFW 0794 1 2 2
387 414 94006 AFW 0994 1 4 4
388 414 94007 AFW 1094 1 4 4
389 414 95001 AFW 0295 1 4 4
390 414 95004 AFW 0495 1 4 4
391 414 95005 AFW 0595 1 2 2
392 424 88028 CVCS 1088 1 5 5
393 424 93006 CVCS 0493 1 5 5
394 424 94001 CVCS 0294 1 5 5
395 425 89006 CVCS 0389 1 5 5
396 443 87009 CVCS 0387 1 5 5
397 443 87012 CVCS 0487 1 5 5
398 443 87015 CVCS 0887 1 5 5
399 443 94001 CVCS 0194 1 5 5
400 445 90004 CVCS 0390 1 7 7
401 445 90017 AFW 0590 1 4 4
402 445 90020 AFW 0790 1 4 4
403 445 90020 CVCS 0790 1 7 7
404 445 90021 AFW 0790 1 4 4
405 445 90021 CVCS 0790 1 7 7
406 445 90025 AFW 0890 1 4 4
407 445 90027 AFW 0990 1 4 4
408 445 90029 AFW 0990 1 4 4
409 445 90030 AFW 0990 1 4 4
410 445 90037 CVCS 1190 1 7 7
411 445 91002 AFW 0191 1 4 4
412 445 91004 AFW 0291 1 4 4
413 445 91008 AFW 0391 1 4 4
414 445 91019 AFW 0691 1 4 4
415 445 91020 AFW 0791 1 4 4
416 445 91021 AFW 0791 1 4 4
417 445 91022 CVCS 0991 1 7 7
418 445 91023 AFW 1091 1 4 4
419 445 92001 AFW 0192 1 4 4
420 445 92009 AFW 0592 1 4 4
421 445 92014 AFW 0692 1 8 8
422 445 92016 AFW 0692 1 4 4
423 445 92016 CVCS 0692 1 7 7
424 445 92019 AFW 0792 1 4 4
425 445 92022 AFW 1092 1 4 4
426 445 95002 AFW 0595 1 4 4
427 445 95003 AFW 0695 1 8 8
428 445 95004 AFW 0695 1 8 8
429 445 95007 AFW 1195 1 4 4
430 482 87002 AFW 0187 1 3 3
431 482 87002 CVCS 0187 1 7 7
432 482 87004 AFW 0187 1 3 3
433 482 87005 AFW 0187 1 3 3
434 482 87017 AFW 0487 1 3 3
435 482 87022 AFW 0587 1 4 4
436 482 87027 AFW 0687 1 4 4
437 482 87030 AFW 0787 1 2 2
438 482 87037 AFW 0987 1 4 4
439 482 87041 AFW 0987 1 3 3
440 482 89002 AFW 0189 1 3 3
IV-13

APPENDIX IV - TABLE III (CONTINUED) PWR APPLICATION CODED AOV ASSEMBLIES - SELECTED RI SYSTEM DATA SOURCE INPUTS
ESF DEMANDS 1987-1995 ITEM DKT LER PLANT EVENT NO. NO. NO. AOV NO. NO. NO. SYSTEM DATE ESFs AOVs DEMANDS 441 482 89004 AFW 0289 1 3 3 442 482 90001 AFW 0290 1 3 3 443 482 90007 AFW 0590 1 3 3 444 482 90011 AFW 0590 1 3 3 445 482 90012 AFW 0590 1 3 3 446 482 90013 AFW 0590 1 3 3 447 482 90023 AFW 1090 1 4 4 448 482 90023 CVCS 1090 1 7 7 449 482 91006 AFW 0591 1 4 4 450 482 92002 AFW 0292 1 3 3 451 482 92016 AFW 1192 1 4 4 452 482 93009 CVCS 0593 1 7 7 453 482 94002 AFW 0194 1 3 3 454 482 95006 AFW 1195 1 3 3 455 483 87003 AFW 0487 1 3 3 456 483 87032 AFW 1187 1 3 3 457 483 88004 AFW 0288 1 3 3 458 483 88005 AFW 0488 1 3 3 459 483 88006 AFW 0488 1 3 3 460 483 88007 AFW 0588 1 3 3 461 483 88010 AFW 0988 1 3 3 462 483 89003 AFW 0389 1 3 3 463 483 89005 AFW 0589 1 3 3 464 483 89006 AFW 0589 1 3 3 465 483 90005 AFW 0590 1 3 3 466 483 90007 AFW 0690 1 3 3 467 483 90015 AFW 1190 1 4 4 468 483 90016 AFW 1190 1 3 3 470 483 90017 AFW 1290 1 3 3 471 483 91006 AFW 1191 1 3 .3 472 483 92002 AFW 0192 1 3 3 473 483 92003 AFW 0192 1 3 3 474 483 92004 AFW 0392 1 3 3 475 483 92006 AFW 0592 1 3 3 476 483 92010 AFW 0992 1 3 3 477 483 95005 AFW 0895 1 3 3 478 483 95006 AFW 1095 1 3 3
IV- 14

IV-15
v ....
APPENDIX IV - TABLE lilA PWR APPLICATION CODED AOV ASSEMBLIES - SELECTED RI SYSTEM DATA SOURCE INPUTS
ESF DEMANDS 1996-1998
ITEM DKT LER PLANT EVENT NO. NO. NO. AOV
NO. NO. NO. SYSTEM DATE ESFs AOVs DEMANDS
1 247 96003 AFW 0396 1 8 8 2 247 97001 AFW 0197 1 4 4
3 247 97018 AFW 0797 1 6 6 4 255 98010 AFW 0798 1 3 3
5 269 96004 AFW 0296 1 4 4
6 269 97008 AFW 0797 1 4 4
7 270 98003 HPI 0698 1 1 1
8 270 98007 AFW 1198 1 4 4
9 272 98006 AFW 0298 1 6 6
10 280 98014 AFW 1198 1 2 2 11 281 97001 AFW 0297 1 2 2 12 286 97023 AFW 0997 1 8 8 13 286 97025 AFW 0997 1 8 8 14 286 98006 AFW 0898 1 8 8 15 287 96001 AFW 0396 1 4 4
16 289 97007 AFW 0697 1 5 5 17 305 96003 AFW 0496 1 2 2 18 305 98005 AFW 0298 1 2 2 19 311 97014 AFW 1097 1 6 6
20 315 96002 AFW 0396 1 3 3
21 315 98040 RHR 0898 1 1 1 22 316 96005 AFW 0596 1 2 2
23 316 97001 AFW 0397 1 3 3 24 317 97009 AFW 0996 1 6 6 25 318 96005 AFW 1196 1 8 8 26 327 96010 AFW 1196 1 5 5 27 327 97012 AFW 0897 1 5 5
28 327 98001 AFW 0598 1 5 5 29 327 98003 AFW 1198 1 4 4
30 328 96005 AFW 1096 1 8 8 31 328 96006 AFW 1296 1 8 8
32 328 98001 AFW 0898 1 8 8 33 328 98002 AFW 1098 1 8 8 34 370 97001 CVCS 0597 1 5 5
35 382 96006 AFW 0596 1 8 8 36 382 98014 AFW 0798 1 8 8
37 395 97002 AFW 0497 1 6 6 38 400 96008 AFW 0496 1 3 3 39 400 96018 AFW 0996 1 3 3
40 400 97001 AFW 0197 1 3 3
41 400 97014 RHR 0597 1 2 2
42 400 97016 AFW 0697 1 2 2 43 400 97019 AFW 0797 1 3 3 44 400 98007 AFW 1098 1 3 3 45 413 96005 AFW 0696 1 4 4
46 413 97011 CVCS 1297 1 7 7 47 414 96001 AFW 0296 1 4 4
48 414 96001 CVCS 0296 1 7 7
49 414 97006 AFW 0797 1 4 4
50 445 96001 CVCS 0196 1 7 7
51 482 96006 AFW 0696 1 4 4
52 483 96003 AFW 1096 1 4 4
53 483 96005 AFW 1196 1 4 4 54 483 96006 AFW 1296 1 4 4

APPENDIX IV - TABLE IV BWR APPLICATION CODED AOV ASSEMBLIES - SELECTED RI SYSTEM DATA SOURCE INPUTS
ESF DEMANDS 1987-1995 ITEM DKT LER PLANT EVENT NO. NO. NO. AOV NO. NO. NO. SYSTEM DATE ESFs AOVs DEMANDS 1 219 88002 LPCS 1088 1 4 4 2 219 91005 LPCS 0491 1 4 4 3 219 93008 LPCS 1293 1 4 4 4 237 89005 LPCS 0289 1 2 2 5 237 94012 LPCS 0494 1 2 2 6 260 88017 LPCS 1288 1 6 6 7 260 90005 HPCI 0590 1 2 2 8 260 94004 HPCI 0494 1 2 2 9 263 87003 RCIC 0487 1 2 2 10 263 87009 HPCI 0487 1 1 1 11 263 91009 HPCI 0491 1 1 1 12 263 91019 RCIC 0891 1 1 1 13 265 87013 HPCI 1087 1 1 1 14 265 87017 HPCI 1187 1 1 1 15 265 88027 HPCI 1188 1 1 1 16 277 89012 RCIC 0589 1 1 1 17 277 89033 RCIC 1289 1 1 1 18 277 92010 RCIC 0792 1 1 1 19 277 93004 RCIC 0393 1 1 1 20 293 91024 RCIC 1091 1 1 1 21 293 93004 RCIC 0893 1 1 1 22 293 93022 RCIC 0993 1 1 1 23 298 87003 HPCI 0187 1 1 1 24 298 87009 HPCI 0287 1 1 1 25 298 88021 HPCI 0888 1 1 1 26 298 89026 HPCI 1189 1 1 1 27 298 90011 HPCI 1090 1 1 1 28 298 93038 HPCI 1293 1 1 1 29 298 94004 HPCI 0394 1 1 1 30 321 94002 LPCS 0394 1 2 2 31 341 88004 HPCI 0188 1 1 1 32 341 88022 LPCS 0688 1 2 2 33 341 92012 HPCI 1192 1 1 1 34 341 93010 HPCI 0893 1 1 1 35 341 95004 HPCI 0495 1 1 1 36 352 87019 LPCS 0587 1 2 2 37 352 90025 LPCS 1190 1 2 2 38 353 93003 LPCS 0293 1 2 2 39 353 95006 LPCS 0395 1 2 2 40 353 95010 LPCS 0895 1 2 2 41 354 92004 LPCS 0392 1 6 6 42 366 92023 LPCS 1192 1 2 2 43 373 92003 RCIC 0392 1 1 1 44 373 92008 RCIC 0692 1 1 1 45 373 93015 RCIC 0993 1 1 1 46 373 93015 LPCS 0993 1 1 1 47 374 92005 RCIC 0392 1 2 2 48 374 92012 RCIC 0892 1 2 2 49 374 92013 RCIC 0992 1 2 2 50 374 92016 RCIC 1192 1 2 2 51 374 94008 RCIC 1094 1 2 2 52 374 94010 RCIC 1294 1 2 2 53 374 95001 RCIC 0195 1 2 2 54 374 95001 LPCS 0195 1 1 1 55 387 87013 RCIC 0487 1 1 1
IV- 16
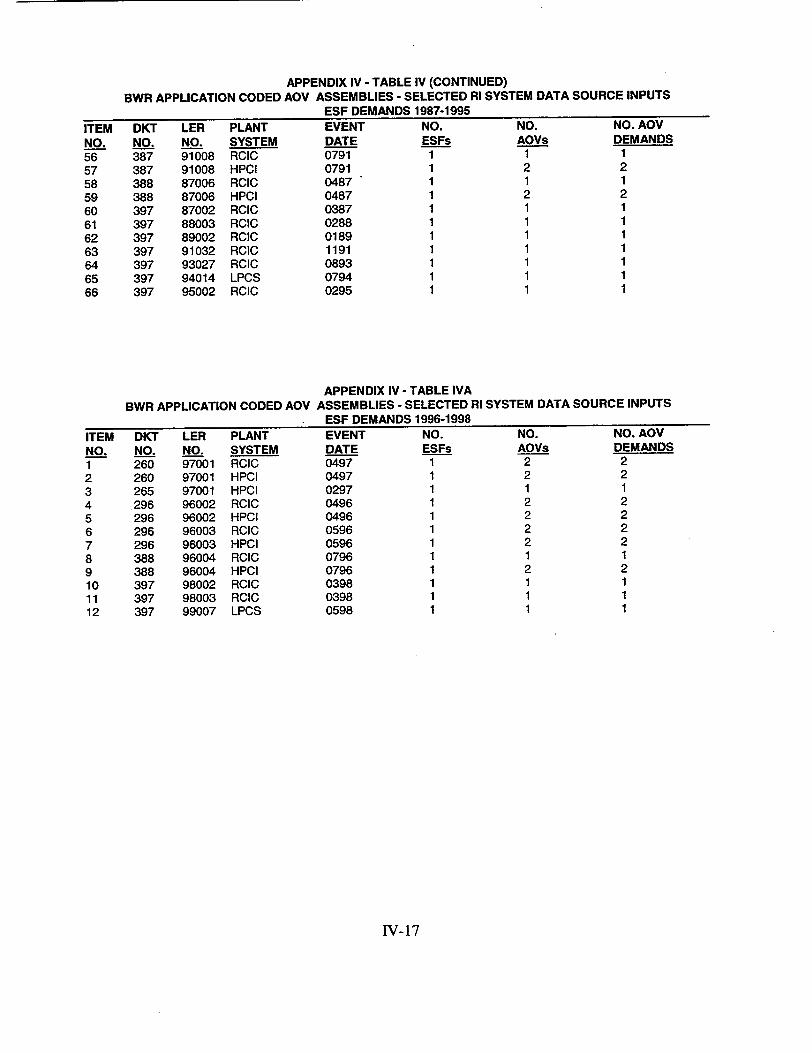
APPENDIX IV - TABLE IV (CONTINUED)
BWR APPLICATION CODED AOV ASSEMBLIES - SELECTED RI SYSTEM DATA SOURCE INPUTS ESF DEMANDS 1987-1995
ITEM DKT LER PLANT EVENT NO. NO. NO. AOV
NO. NO. NO. SYSTEM DATE ESFs AOVs DEMANDS
56 387 91008 RCIC 0791 1 1 1
57 387 91008 HPCI 0791 1 2 2
58 388 87006 RCIC 0487 1 1 1
59 388 87006 HPCI 0487 1 2 2
60 397 87002 RCIC 0387 1 1 1
61 397 88003 RCIC 0288 1 1 1
62 397 89002 RCIC 0189 1 1 1
63 397 91032 RCIC 1191 1 1 1
64 397 93027 RCIC 0893 1 1 1
65 397 94014 LPCS 0794 1 1 1
66 397 95002 RCIC 0295 1 1 1
APPENDIX IV - TABLE IVA
BWR APPLICATION CODED AOV ASSEMBLIES - SELECTED RI SYSTEM DATA SOURCE INPUTS ESF DEMANDS 1996-1998
ITEM DKT LER PLANT EVENT NO. NO. NO. AOV
NO. NO. NO. SYSTEM DATE ESFs AOVs DEMANDS
1 260 97001 RCIC 0497 1 2 2
2 260 97001 HPCI 0497 1 2 2
3 265 97001 HPCI 0297 1 1 1
4 296 96002 RCIC 0496 1 2 2
5 296 96002 HPCI 0496 1 2 2
6 296 96003 RCIC 0596 1 2 2
7 296 96003 HPCI 0596 1 2 2
8 388 96004 RCIC 0796 1 1 1
9 388 96004 HPCI 0796 1 2 2
10 397 98002 RCIC 0398 1 1 1
11 397 98003 RCIC 0398 1 1 1
12 397 99007 LPCS 0598 1 1 1
IV-17
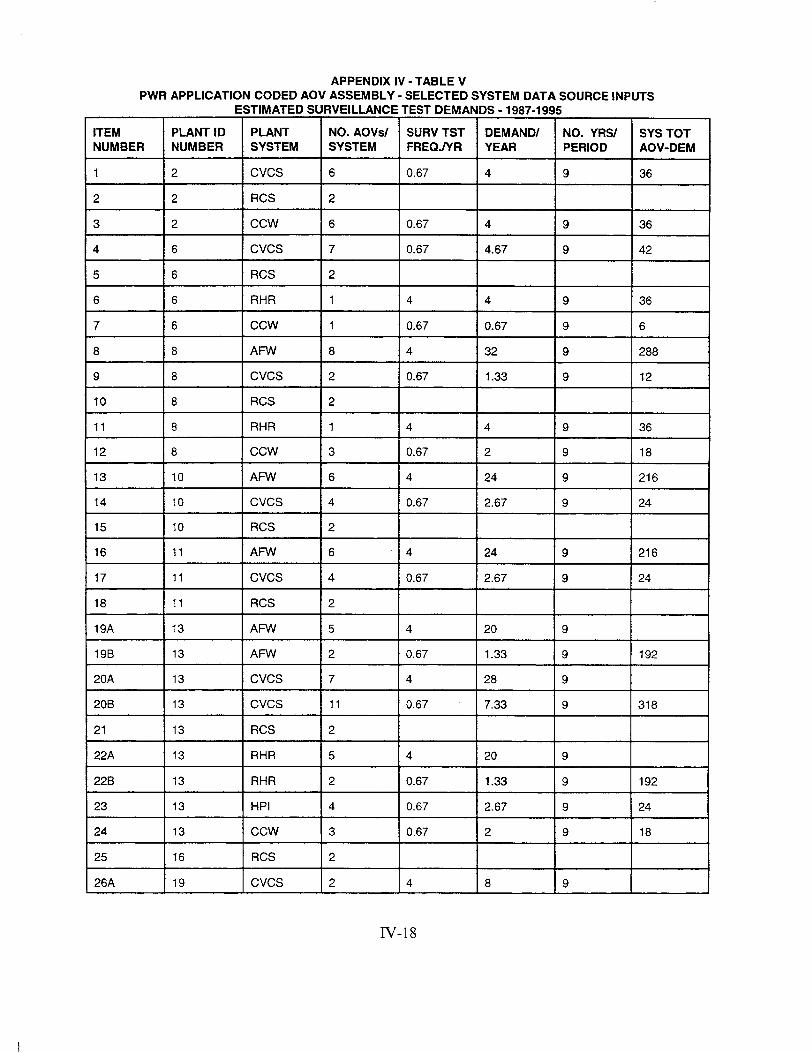
APPENDIX IV - TABLE V PWR APPLICATION CODED AOV ASSEMBLY- SELECTED SYSTEM DATA SOURCE INPUTS
ESTIMATED SURVEILLANCE TEST DEMANDS - 1987-1995
ITEM PLANT ID PLANT NO. AOVsI SURV TST DEMAND/ NO. YRS/ SYS TOT NUMBER NUMBER SYSTEM SYSTEM FREQJYR YEAR PERIOD AOV-DEM
1 2 CVCS 6 0.67 4 9 36
2 2 RCS 2
3 2 CCW 6 0.67 4 9 36
4 6 CVCS 7 0.67 4.67 9 42
5 6 RCS 2
6 6 RHR 1 4 4 9 36
7 6 CCW 1 0.67 0.67 9 6
8 8 AFW 8 4 32 9 288
9 8 CVCS 2 0.67 1.33 9 12
10 8 RCS 2
11 8 RHR 1 4 4 9 36
12 8 CCW 3 0.67 2 9 18
13 10 AFW 6 4 24 9 216
14 10 CVCS 4 0.67 2.67 9 24
15 10 RCS 2
16 11 AFW 6 4 24 9 216
17 11 CVCS 4 0.67 2.67 9 24
18 11 RCS 2
19A 13 AFW 5 4 20 9
19B 13 AFW 2 0.67 1.33 9 192
20A 13 CVCS 7 4 28 9
20B 13 CVCS 11 0.67 7.33 9 318
21 13 RCS 2
22A 13 RHR 5 4 20 9
22B 13 RHR 2 0.67 1.33 9 192
23 13 HPI 4 0.67 2.67 9 24
24 13 CCW 3 0.67 2 9 18
25 16 RCS 2
26A 19 CVCS 2 4 8 9
IV-18

APPENDIX IV - TABLE V (CONTINUED)
PWR APPLICATION CODED AOV ASSEMBLY - SELECTED SYSTEM DATA SOURCE INPUTS
ESTIMATED SURVEILLANCE TEST DEMANDS - 1987-1995
ITEM PLANT ID PLANT NO. AOVsI SURV TST DEMAND/ NO. YRS/ SYS TOT
NUMBER NUMBER SYSTEM SYSTEM FREQJYR YEAR PERIOD AOV-DEM
26B 19 CVCS 7 0.67 4.67 9 114
27 19 RCS 2
28 19 HPI 4 0.67 2.67 9 24
29 19 CCW 1 0.67 0.67 9 6
30A 20 AFW 2 4 8 9
30B 20 AFW 2 0.67 1.33 9 84
31A 20 CVCS 2 4 8 9
31B 20 CVCS 3 0.67 2 9 90
32 20 HPI 1 4 4 9 36
33 20 cow 1 0.67 0.67 9 6
34A 21 AFW 2 4 8 9
34B 21 AFW 2 0.67 1.33 9 84
35A 21 CVCS 2 4 8 9
35B 21 CVCS 3 0.67 2 9 90
36 21 HPI 1 4 4 9 36
37 21 CCW 1 0.67 0.67 9 6
38A 23 AFW 8 4 32 9
38B 23 AFW 5 0.67 3.33 9 318
39A 23 CVCS 6 4 24 9
39B 23 CVCS 12 0.67 8 9 288
40 23 RCS 2
41 23 RHR 2 4 8 9" 72
42 23 HPI 3 0.67 2 9 19
43 23 cCw 2 0.67 1.33 9 12
44 24 RCS 2
45 27 AFW 6 4 24 9
46 27 AFW 2 0.67 1.33 9 228
47A 27 CVCS 7 4 28 9
47B 27 CVCS 6 0.67 4 9 288
IV-19

APPENDIX IV - TABLE V (CONTINUED) PWR APPLICATION CODED AOV ASSEMBLY - SELECTED SYSTEM DATA SOURCE INPUTS
ESTIMATED SURVEILLANCE TEST DEMANDS - 1987-1995
ITEM PLANT ID PLANT NO. AOVS/ SURV TST DEMAND/ NO. YRS/ SYS TOT NUMBER NUMBER SYSTEM SYSTEM FREQJYR YEAR PERIOD AOV-DEM
48 27 RCS 2
49 27 RHR 3, 0.67 2 9 18
50 28 AFW 1 4 4 9 36
51A 28 CVCS 7 4 28 9
51B 28 CVCS 2 0.67 1.33 9 264
52 28 RCS 2
53 28 RHR 3 0.67 2 9 18
54 28 CCW 4 0.67 2.67 9 24
55 29 CVCS 3 0.67 2 9 18
56 29 RCS 2
57 29 RHR 1 4 4 9 36
58 30 AFW 4 4 16 9 144
59 30 RCS 2
60 30 CCW 4 0.67 2.67 9 24
61 31 AFW 8 4 32 9 288
62 31 CVCS 2 0.67 1.33 9 12
63 31 RCS 2
64 31 RHR 1 4 4 9 36
65 31 CCW 1 0.67 0.67 9 6
66A 32 AFW 2 4 8 9
66B 32 AFW 2 0.67 1.33 9 84
67A 32 CVCS 2 4 8 9
67B 32 CVCS 3 0.67 2 9 90
68 32 RHR 2 4 8 9 72
69 32 CCW 1 0.67 0.67 9 6
70A 33 AFW 4 4 16 9
70B 33 AFW 1 0.67 0.67 9 150
71A 33 CVCS 4 4 16 9
71 B 33 CVCS 3 0.67 2 9 162
IV-20

APPENDIX IV - TABLE V (CONTINUED)
PWR APPLICATION CODED AOV ASSEMBLY - SELECTED SYSTEM DATA SOURCE INPUTS
ESTIMATED SURVEILLANCE TEST DEMANDS - 1987-1995
ITEM PLANT ID PLANT NO0. AOVsI SURV TST DEMANDI NO. YRS/ SYS TOT
NUMBER NUMBER SYSTEM SYSTEM FREQJYR YEAR PERIOD AOV-DEM
72 33 CCW 1 0.67 0.67 9 6
73 35 AFW 1 4 4 9 36
74A 35 CVCS 3 4 12 9
74B 35 CVCS 5 0.67 3.33 9 138
75 35 RCS 2
76 35 CCW 1 0.67 0.67 9 6
77A 38 CVCS 3 4 12 9
77B 38 CVCS 8 0.67 5.33 9 156
78 38 RCS 2
79 38 HPI 4 0.67 2.67 9 24
80 38 CCW 1 0.67 0.67 9 6
81A 39 CVCS 2 4 8 9
81B 39 CVCS 4 0.67 2.67 9 96
82 39 RHR 1 4 4 9 36
83 39 HPI 4 0.67 2.67 9 24
84 39 CCW 18 0.67 12 9 108
85 40 AFW 1 4 4 9 36
86A 40 CVCS 5 4 20 9
86B 40 CVCS 6 0.67 4 9 216
87 40 RCS 3
88 40 HPI 1 0.67 0.67 9 6
89 40 CCW 1 0.67 0.67 9 6
90 41 AFW 2 4 8 9 72
91 41 RCS 2
92 42 CVCS 1 0.67 0.67 9 6
93 42 RCS 2
94 43 AFW 9 4 36 9 324
95A 43 CVCS 2 4 8 9
95B 43 CVCS 11 0.67 7.33 9 138
WV-21

APPENDIX IV - TABLE V (CONTINUED) PWR APPLICATION CODED AOV ASSEMBLY - SELECTED SYSTEM DATA SOURCE INPUTS
ESTIMATED SURVEILLANCE TEST DEMANDS - 1987-1995
ITEM PLANT ID PLANT NO. AOVs/ SURV TST DEMAND/ NO. YRS/ SYS TOT NUMBER NUMBER SYSTEM SYSTEM FREQJYR YEAR PERIOD AOV-DEM
96 43 RCS 2
97 43 RHR 2 4 8 9 72
98 43 CCW 8 0.67 5.33 9 48
99A 44 AFW 8 4 32 9
99B 44 AFW 5 0.67 3.33 9 318
100A 44 CVCS 6 4 24 9
100B 44 CVCS 12 0.67 8 9 288
101 44 RCS 2
102 44 RHR 2 4 8 9 72
103 44 HPI 3 0.67 2 9 18
104 44 CCW 2 0.67 1.33 9 12
105 45 CVCS 2 0.67 1.33 9 12
106 45 RHR 2 4 8 9 72
107 45 CCW 3 0.67 2 9 18
108 46 AFW 3 0.67 2 9 18
109A 46 CVCS 7 4 28 9
1098 46 CVCS 10 0.67 6.67 9 317
110 46 RCS 2
111 46 RHR 1 4 4 9 36
112 46 CCW 5 0.67 3.33 9 30
113 47 AFW 3 0.67 2 9 18
114A 47 CVCS 7 4 28 9
114B 47 CVCS 10 0.67 6.67 9 312
115 47 RCS 2
116 47 RHR 1 4 4 9 36
117 47 CCW 7 0.67 4.67 9 42
118 48 AFW 12 4 48 9 432
119A 48 CVCS 5 4 20 9
119B 48 CVCS 11 0.67 7.33 9 246
IV-22

APPENDIX IV - TABLE V (CONTINUED)
PWR APPLICATION CODED AOV ASSEMBLY - SELECTED SYSTEM DATA SOURCE INPUTS
ESTIMATED SURVEILLANCE TEST DEMANDS - 1987-1995
ITEM PLANT ID PLANT NO. AOVsI SURV TST DEMAND/ NO. YRSI SYS TOT
NUMBER NUMBER SYSTEM SYSTEM FREQJYR YEAR PERIOD AOV-DEM
120 48 RCS 2
121 48 RHR 1 4 4 9 36
122 48 cCw 4 0.67 2.67 9 24
123 49 AFW 12 4 48 9 432
124A 49 CVCS 5 4 20 9
124B 49 CVCS 11 0.67 7.33 9 246
125 49 RCS 2
126 49 RHR 1 4 4 9 36
127 49 CCW 4 0.67 2.67 9 24
128 51 RCS 2
129 54 AFW 5 4 20 9 180
130 54 CVCS 4 0.67 2.67 9 24
131 54 RCS 2
132 54 RHR 1 4 4 9 36
133 54 HPI 3 0.67 2 9 18
134 54 CCW 1 0.67 0.67 9 6
135 55 AFW 8 4 32 9 288
136 55 CVCS 4 0.67 2.67 9 24
137 55 RCS 2
138 55 RHR 1 4 4 9 36
139 55 HPI 3 0.67 2 9 18
140 55 CCW 1 0.67 0.67 9 6
141 58 RCS 2
142 58 HPI 1 4 4 9 36
143 59 CVCS 2 4 8 9 72
144 59 RCS 2
145 59 CCW 2 0.67 1.33 9 12
146 60 AFW 2 4 8 9 72
147 60 RCS 2
IV-23

APPENDIX IV - TABLE V (CONTINUED) PWR APPLICATION CODED AOV ASSEMBLY - SELECTED SYSTEM DATA SOURCE INPUTS
ESTIMATED SURVEILLANCE TEST DEMANDS - 1987-1995
ITEM PLANT ID PLANT NO. AOVs/ SURV TST DEMANDI NO. YRS/ SYS TOT NUMBER NUMBER SYSTEM SYSTEM FREQJYR YEAR PERIOD AOV-DEM
148 61 CVCS 3 0.67 2 9 18
149 61 RCS 2
150 61 RHR 3 0.67 2 9 18
151 61 CCW 19 0.67 12.67 9 114
152 62 CVCS 2 0.67 1.33 9 12
153 62 RCS 2
154 62 RHR 3 0.67 2 9 18
155 62 CCW 13 0.67 8.67 9 78
156A 65 CVCS 6 4 24 9
156B 65 CVCS 8 0.67 5.33 9 264
157 65 RHR 2 4 8 9 72
158 66 AFW 3 4 12 9 108
159 66 CVCS 3 0.67 2 9 18
160 66 RCS 2
161 70 RCS 2
162 71 RCS 2
163 72 AFW 4 4 16 9 144
164 72 CVCS 4 0.67 2.67 9 24
165 72 RCS 2
166 74 CVCS 6 0.67 4 9 36
167 74 RHR 1 0.67 0.67 9 6
168A 75 CVCS 5 4 20 9
168B 75 CVCS 9 0.67 6 9 234
169 75 RPS 2
170 75 RHR 3 4 12 9 108
171 75 HPI 2 0.67 1.33 9 12
172A 76 CVCS 3 4 12 9
172B 76 CVCS 11 0.67 7.33 9 174
173 76 RCS 2
IV-24

APPENDIX IV - TABLE V (CONTINUED)
PWR APPLICATION CODED AOV ASSEMBLY - SELECTED SYSTEM DATA SOURCE INPUTS
ESTIMATED SURVEILLANCE TEST DEMANDS - 1987-1995
ITEM PLANT ID PLANT NO. AOVsI SURV TST DEMAND/ NO. YRS/ SYS TOT
NUMBER NUMBER SYSTEM SYSTEM FREQJYR YEAR PERIOD AOV-DEM
174 76 RHR 3 4 12 9 108
175 76 HPI 3 0.67 2 9 18
176 79 AFW 8 4 32 9 288
177 79 CVCS 2 4 8 9 72
178 79 RCS 2
179 79 RHR 2 4 8 9 72
180 79 CCW 3 0.67 2 9 18
181 82 RCS 2
182 82 CCW 4 0.67 2.67 9 24
183 83 AFW 6 4 24 9 216
184 83 CVCS 10 0.67 6.67 9 60
185 83 RCS 2
186 83 RHR 8 4 32 9 288
187 85 AFW 3 4 12 8.7 104
188A 85 CVCS 8 4 32 8.7
188B 85 CVCS 9 0.67 6 8.7 331
189 85 RCS 2
190 85 RHR 6 4 24 8.7 209
191A 87 AFW 6 4 24 8.2
191B 87 AFW 2 0.67 1.33 8.2 208
192 87 RCS 2
193 88 AFW 4 4 16 9 144
194A 88 CVCS 7 4 28 9
194B 88 CVCS 6 0.67 4 9 288
195 88 RCS 2
196 88 RHR 2 4 8 9 72
197 89 AFW 4 4 16 9 144
198A 89 CVCS 7 4 28 9
198B 89 CVCS 6 0.67 4 9 288
IV-25
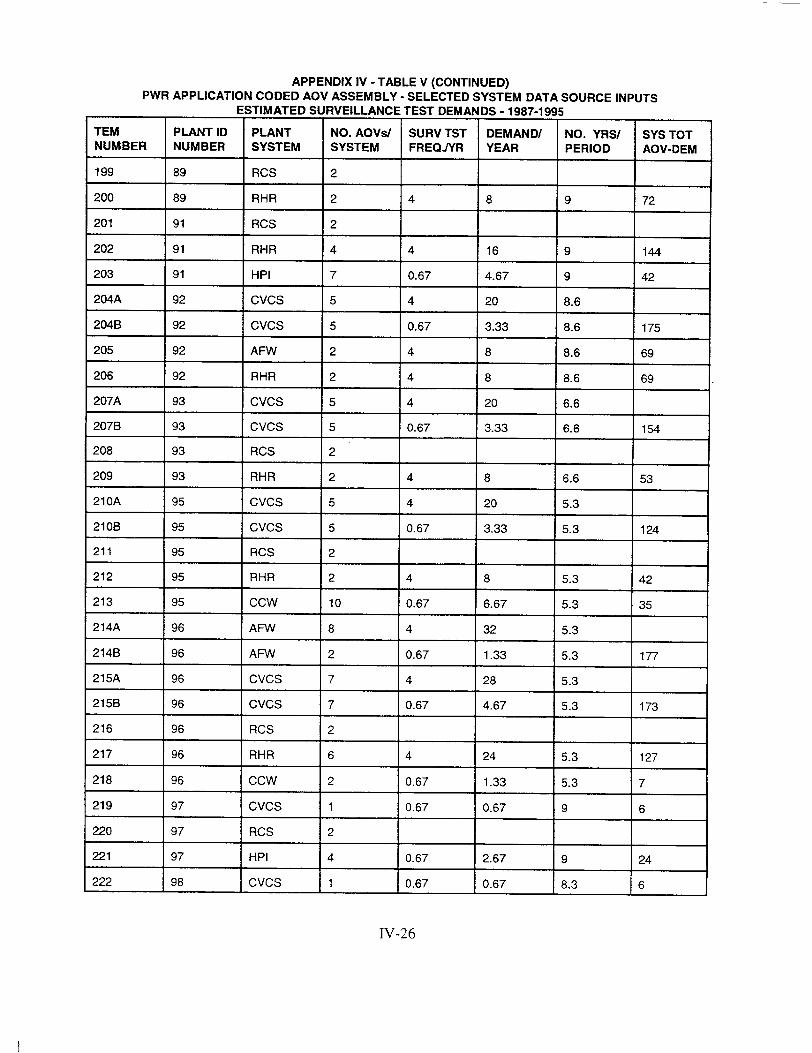
APPENDIX IV - TABLE V (CONTINUED) PWR APPLICATION CODED AOV ASSEMBLY - SELECTED SYSTEM DATA SOURCE INPUTS
ESTIMATED SURVEILLANCE TEST DEMANDS - 1987-1995
TEM PLANT ID PLANT NO. AOVs/ SURV TST DEMAND/ NO. YRS/ SYS TOT NUMBER NUMBER SYSTEM SYSTEM FREQ./YR YEAR PERIOD AOV-DEM
199 89 RCS 2
200 89 RHR 2 4 8 9 72
201 91 RCS 2
202 91 RHR 4 4 16 9 144
203 91 HPI 7 0.67 4.67 9 42
204A 92 CVCS 5 4 20 8.6
204B 92 CVCS 5 0.67 3.33 8.6 175
205 92 AFW 2 4 8 8.6 69
206 92 RHR 2 4 8 8.6 69
207A 93 CVCS 5 4 20 6.6
207B 93 CVCS 5 0.67 3.33 6.6 154
208 93 RCS 2
209 93 RHR 2 4 8 6.6 53
210A 95 CVCS 5 4 20 5.3
210B 95 CVCS 5 0.67 3.33 5.3 124
211 95 RCS 2
212 95 RHR 2 4 8 5.3 42
213 95 CCW 10 0.67 6.67 5.3 35
214A 96 AFW 8 4 32 5.3
214B 96 AFW 2 0.67 1.33 5.3 177
215A 96 CVCS 7 4 28 5.3
215B 96 CVCS 7 0.67 4.67 5.3 173
216 96 RCS 2
217 96 RHR 6 4 24 5.3 127
218 96 CCW 2 0.67 1.33 5.3 7
219 97 CVCS 1 0.67 0.67 9 6
220 97 RCS 2
221 97 HPI 4 0.67 2.67 9 24
222 98 CVCS 1 0.67 0.67 8.3 6
-V-26

APPENDIX IV - TABLE V (CONTINUED)
PWR APPLICATION CODED AOV ASSEMBLY - SELECTED SYSTEM DATA SOURCE INPUTS
ESTIMATED SURVEILLANCE TEST DEMANDS - 1987-1995
ITEM PLANT ID PLANT NO. AOVs/ SURV TST DEMAND/ NO. YRSI SYS TOT
NUMBER NUMBER SYSTEM SYSTEM FREQJYR YEAR PERIOD AOV-DEM
223 98 RCS 2
224 98 HPI 4 0.67 2.67 8.3 22
225 99 CVCS 1 0.67 0.67 7.7 5
226 99 RCS 2
227 99 HPI 2 0.67 1.33 7.7 10
228 99 CCW 2 0.67 1.33 7.7 10
229 100 CVCS 1 0.67 0.67 7.2 5
230 100 RCS 2
223 100 HPI 2 0.67 1.33 7.2 10
224 100 cow 2 0.67 1.33 7.2 10
225 103 AFW 4 4 16 9 144
226A 103 CVCS 9 4 36 9
226B 103 CVCS 10 0.67 6.67 9 384
227 103 RCS 2
228 103 RHR 2 4 8 9 72
229 103 CCW 2 0.67 1.33 9 12
230 104 AFW 4 4 16 9 144
231 104 CVCS 1 0.67 0.67 9 12
232 104 RCS 2
233 104 RHR 2 4 8 9 72
234 104 HPI 2 0.67 1.33 9 12
235 105 RCS 2
236 105 RHR 3 4 12 6.5 78
237 105 CCW 1 0.67 0.67 6.5 4
238 106 RCS 2
239 106 RHR 3 4 12 7.7 92
240 106 CCW 1 0.67 0.67 7.7 5
241A 107 CVCS 4 4 16 9
241B 107 CVCS 10 0.67 6.67 9 204
IV-27
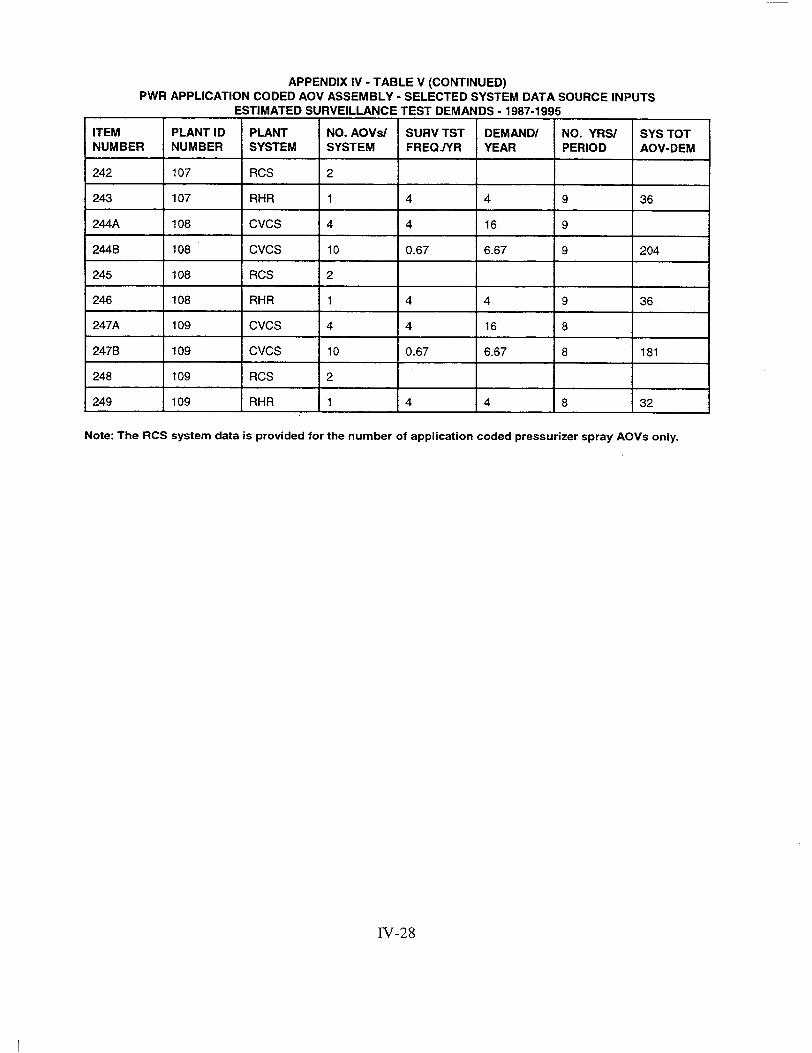
APPENDIX IV - TABLE V (CONTINUED) PWR APPLICATION CODED AOV ASSEMBLY - SELECTED SYSTEM DATA SOURCE INPUTS
ESTIMATED SURVEILLANCE TEST DEMANDS - 1987-1995
ITEM PLANT ID PLANT NO. AOVs/ SURV TST DEMAND/ NO. YRS/ SYS TOT NUMBER NUMBER SYSTEM SYSTEM FREQ./YR YEAR PERIOD AOV-DEM
242 107 RCS 2
243 107 RHR 1 4 4 9 36
244A 108 CVCS 4 4 16 9
244B 108 CVCS 10 0.67 6.67 9 204
245 108 RCS 2
246 108 RHR 1 4 4 9 36
247A 109 CVCS 4 4 16 8
247B 109 CVCS 10 0.67 6.67 8 181
248 109 RCS 2
249 109 RHR 1 4 4 8 32
Note: The RCS system data is provided for the number of application coded pressurizer spray AOVs only.
IV-28

APPENDIX IV - TABLE VI
BWR APPLICATION CODED AOV ASSEMBLY - SELECTED SYSTEM DATA SOURCE INPUTS
ESTIMATED SURVEILLANCE TEST DEMANDS - 1987-1995
ITEM PLANT ID PLANT NO. AOVsI SURV TST DEMAND/ NO. YRS/ SYS TOT
NUMBER NUMBER SYSTEM SYSTEM FREQJYR YEAR PERIOD AOV-DEM
1 3 LPCS 4 4 16 9 144
2 4 LPCS 2 0.67 1.33 9 12
3 5 LPCS 2 4 8 9 72
4 9 LPCS 2 4 8 9 72
5 12 HPCI 1 4 4 9 36
6 12 LPCS 2 4 8 9 72
7A 14 RCIC 1 4 4 9
7B 14 RCIC 1 0.67 0.67 9 42
8A 14 HPCI 1 4 4 9
8B 14 HPCI 1 0.67 0.67 9 42
9A 14 LPCS 2 4 8 9
98 14 LPCS 4 0.67 2.67 9 96
10A 15 RCIC 1 4 4 9
10B 15 RCIC 1 0.67 0.67 9 42
11A 15 HPCI 1 4 4 9
11B 15 HPCI 1 0.67 0.67 9 42
12A 15 LPCS 2 4 8 9
12B 15 LPCS 4 0.67 2.67 9 96
13A 17 RCIC 1 4 4 9
13B 17 RCIC 1 0.67 0.67 9 42
14A 17 HPCI 1 4 4 9
14B 17 HPCI 1 0.67 0.67 9 42
15 17 LPCS 2 4 8 9 72
16 18 HPCI 1 4 4 9 36
17 18 LPCS 2 4 8 9 72
18 25 RCIC 1 4 4 9 36
19 25 HPCI 1 4 4 9 36
20 26 RCIC 1 4 4 9 36
21 26 HPCI 1 4 4 9 36
IV-29

APPENDIX IV - TABLE VI (CONTINUED) BWR APPLICATION CODED AOV ASSEMBLY - SELECTED SYSTEM DATA SOURCE INPUTS
ESTIMATED SURVEILLANCE TEST DEMANDS - 1987-1995
ITEM PLANT ID PLANT NO. AOVsI SURV TST DEMAND/ NO. YRS/ SYS TOT NUMBER NUMBER SYSTEM SYSTEM FREQ./YR YEAR PERIOD AOV-DEM
22 34 RCIC 1 4 4 9 36
23A 36 RCIC 1 4 4 9
23B 36 RCIC 1 0.67 0.67 9 42
24A 36 HPCI 1 4 4 9
24B 36 HPCI 1 0.67 0.67 9 42
25A 36 LPCS 2 4 8 9
25B 36 LPCS 4 0.67 2.67 9 96
27 37 HPCI 1 0.67 0.67 9 6
28 50 LPCS 2 4 8 9 72
29A 57 LPCS 2 4 8 9
29B 57 LPCS 2 0.67 1.33 9 84
30 63 HPCI 1 4 4 8 32
31 63 LPCS 2 4 8 8 64
32 67 LPCS 2 4 8 9 72
33 68 LPCS 2 4 8 5.9 47
34A 69 LPCS 2 4 8 9
35B 69 LPCS 4 0.67 2.67 9 96
36 73 LPCS 2 4 8 9 72
37 77 RCIC 1 4 4 9 36
38 77 LPCS 1 4 4 9 36
39 78 RCIC 2 4 8 9 72
40 78 LPCS 1 4 4 9 36
41 80 RCIC 1 0.67 0.67 9 6
42 80 HPCI 2 0.67 1-33 9 12
43A 80 LPCS 2 4 8 9
43B 80 LPCS 4 0.67 2.67 9 96
44 81 RCIC 1 4 4 9 36
45 81 HPCI 2 0.67 1.33 9 12
46A 81 LPCS 2 4 8 9
IV-30

APPENDIX IV - TABLE VI (CONTINUED)
BWR APPLICATION CODED AOV ASSEMBLY - SELECTED SYSTEM DATA SOURCE INPUTS
ESTIMATED SURVEILLANCE TEST DEMANDS - 1987-1995
ITEM PLANT ID PLANT NO. AOVs/ SURV TST DEMAND/ NO. YRS/ SYS TOT
NUMBER NUMBER SYSTEM SYSTEM FREQJYR YEAR PERIOD AOV-DEM
46B 81 LPCS 4 0.67 2.67 9 96
47 84 RCIC 1 4 4 9 36
48 84 LPCS 1 4 4 9 36
49 86 LPCS 1 4 4 7.7 31
50 90 LPCS 1 4 4 9 36
51 102 LPCS 1 4 4 8.1 32
IV-31

NRC FORM 335 U.S. NUCLEAR REGULATORY COMMISSION 1. REPORT NUMBER
(2-89) (Assigned by NRC, Add VoL, Supp., Rev.,
NRCM 1102, and Addendum Numbers, if any.)
3201.3202 BIBLIOGRAPHIC DATA SHEET (See instructions on the reverse)
2. TITLE AND SUBTITLE NUREG-1715, Vol. 3
Component Performance Study - Air-Operated Valves, 1987-1998 3. DATE REPORT PUBLISHED
Commercial Power Reactors MONTH j YEAR
July 2001 4. FIN OR GRANT NUMBER
5. AUTHOR(S) 6. TYPE OF REPORT
J.R. Houghton Technical
7. PERIOD COVERED (Inclusive Dates)
January 1987-December 1998
8. PERFORMING ORGANIZATION - NAME AND ADDRESS (If NRC, provide Division, Office or Region, U.S. Nuclear Regulatory Commission, and mailing address; if contractor,
provide name and mailing address.)
Division of Risk Analysis and Applications
Office of Nuclear Regulatory Research
U.S. Nuclear Regulatory Commission
Washington, DC 20555-0001
9. SPONSORING ORGANIZATION - NAME AND ADDRESS (If NRC, type 'Same as above;" if contractor, provide NRC Division, Office or Region, U.S. Nuclear Regulatory Comnmssion, and mailing address.)
Same as above.
10. SUPPLEMENTARY NOTES
11. ABSTRACT (200 words or less)
This report documents an analysis of the performance of safety-related air-operated valve assemblies (valve body and
pneumatic operator subcomponents) used in pressurized water reactors (PWRs) and boiling water reactors (BWRs) in U.S.
commercial power reactor plants.
A risk-based analysis of operating data and an engineering analysis of trends and patterns was performed to provide insights
into the performance of air-operated valve components on an industry basis and comparison of results with data used by
plant-specific probabilistic risk assessments. The data used in this report was from the 1992-1995 period for engineering
analysis of risk-important systems. Failure probability estimates used combined engineering safety features data (1987-1998)
and surveillance test data (1987-1995).
12. KEY WORDS/DESCRIPTORS (List words or phrases that will assist researchers in locating the report.) 13. AVAILABILITY STATEMENT
Air-Operated Valve unlimited
Probability of Failure 14. SECURITY CLASSIFICATION
Failure (This Page)
Demand unclassified
Surveillance Test (This Report)
Licensee Event Report/LER unclassified
15. NUMBER OF PAGES
16. PRICE
NRC FORM 335 (2-89)
Federal Recycling Program

UNITED STATES NUCLEAR REGULATORY COMMISSION
WASHINGTON, DC 20555-0001
OFFICIAL BUSINESS PENALTY FOR PRIVATE USE, $300


![Angle Seat Valve New Air Operated Type Steam - … · Pilot pressure Long service life [MPa] 3 ... Angle Seat Valve Air Operated Type Series VXB. b. Mounting screw M5 hexagon socket](https://img.dokumen.tips/doc/110x75/5b9306e509d3f23a718cfcea/angle-seat-valve-new-air-operated-type-steam-pilot-pressure-long-service-life.jpg)