Embed Size (px)
Citation preview

1 Copyright 2009 © Professor Michael E. Porter20091006 – Monterray Mexico.ppt
Professor Michael E. PorterHarvard Business School
CEO Agenda ForumMonterrey, Mexico
October 6, 2009This presentation draws on ideas from Professor Porter’s books and articles, in particular, Competitive Strategy (The Free Press, 1980); Competitive Advantage (The Free Press, 1985); “What is Strategy?” (Harvard Business Review, Nov/Dec 1996); “Strategy and the Internet” (Harvard Business Review, March 2001); and a forthcoming book. No part of this publication may be reproduced, stored in a retrieval system, or transmitted in any form or by any means—electronic, mechanical, photocopying, recording, or otherwise—without the permission of Michael E. Porter. Additional information may be found at the website of the Institute for Strategy and Competitiveness, www.isc.hbs.edu. Version: October 5, 2009, 4pm
Competitiveness for the Third Millennium: Implications for Mexico
2 Copyright 2009 © Professor Michael E. Porter20091006 – Monterray Mexico.ppt
$0
$5,000
$10,000
$15,000
$20,000
$25,000
$30,000
2% 4% 6% 8% 10% 12%
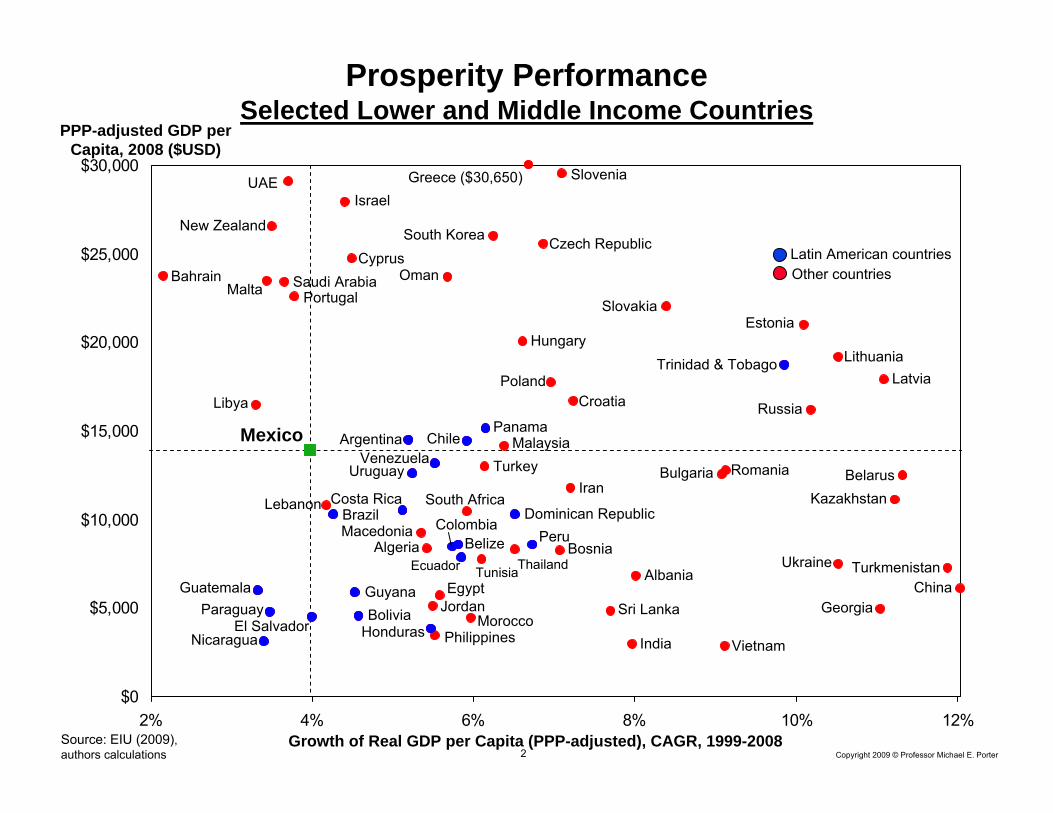
PPP-adjusted GDP per Capita, 2008 ($USD)
Growth of Real GDP per Capita (PPP-adjusted), CAGR, 1999-2008Source: EIU (2009), authors calculations
Bahrain
China
Vietnam
South Africa
Latvia
Oman
Croatia
Czech Republic
Saudi Arabia
Thailand
Estonia
Russia
Costa RicaBrazil
HondurasIndia
Turkey
Egypt
Lithuania
Israel
Slovakia
Hungary
Mexico
Slovenia
Belize
Chile
Other countriesLatin American countries
Prosperity PerformanceSelected Lower and Middle Income Countries
Argentina
South Korea
Poland
Malaysia
Philippines
Sri Lanka
New Zealand
Bulgaria
Dominican RepublicColombia
RomaniaUruguay
Ukraine
GuatemalaGeorgia
Bosnia
Jordan
Peru
Paraguay
Nicaragua
Guyana
Panama
BoliviaEl Salvador
Venezuela
Turkmenistan
KazakhstanBelarus
UAE Greece ($30,650)
Cyprus
PortugalMalta
Libya
Lebanon
Albania
Trinidad & Tobago
Ecuador Tunisia
MacedoniaAlgeria
Morocco
Iran

3 Copyright 2009 © Professor Michael E. Porter20091006 – Monterray Mexico.ppt
Mexico’s Exports By Type of IndustryExcluding Oil and Gas Cluster
0.00%
0.50%
1.00%
1.50%
2.00%
2.50%
3.00%
3.50%
1997 1998 1999 2000 2001 2002 2003 2004 2005 2006 2007
Processed GoodsSemi-processed GoodsUnprocessed GoodsServicesTOTAL
Source: UNComTrade, WTO (2008)
World Export Market Share (current USD)

4 Copyright 2009 © Professor Michael E. Porter20091006 – Monterray Mexico.ppt
Inbound Foreign Investment PerformanceFlows, Selected Countries
Inward FDI Flows, % of GDP
0%
1%
2%
3%
4%
5%
6%
1991 1993 1995 1997 1999 2001 2003 2005 2007
Russia
Mexico
Brazil
China
India
Ranked by Inward FDI Flows (% of
GDP), 2007
Source: UNCTAD, World Investment Report (2009)

5 Copyright 2009 © Professor Michael E. Porter20091006 – Monterray Mexico.ppt
0
1
2
3
4
5
-20% -10% 0% 10% 20% 30% 40% 50% 60%
Source: USPTO (2008), EIU (2008)
Average U.S. patents per 1 million population, 2004-2008
CAGR of US-registered patents, 2004 – 2008
Innovative CapacityInnovation Output of Selected Countries
Saudi ArabiaRussiaPortugal
Turkey
India
Poland
Kuwait
Czech Republic
China
South Africa
UAE
Greece
Hungary
Cyprus
120 patents =
ArgentinaBrazil
Croatia
Malaysia
Bulgaria
PhilippinesEcuador
ChileThailand
RomaniaMexico
Venezuela

6 Copyright 2009 © Professor Michael E. Porter20091006 – Monterray Mexico.ppt
The Mexican Economy in 2009
• Despite significant reforms, Mexico has experienced slow prosperitygrowth over the last several years
• The global economic crisis is exposing underlying weaknesses
• Mexico must aggressively address its serious competitiveness challenges to realize its full growth potential
– Waiting for a United States recovery is insufficient
• Mexico must reinvent itself – Adopt and implement an ambitious economic strategy which builds on
the country’s unique competitive advantages

7 Copyright 2009 © Professor Michael E. Porter20091006 – Monterray Mexico.ppt
What is Competitiveness?
• Only competitive businesses can create wealth and jobs
• Nations compete to offer the most productive environment for business
• The public and private sectors play different but interrelated roles in creating a productive economy
• Competitiveness depends on the productivity with which a nation uses its human, capital, and natural resources.
– Productivity sets the sustainable standard of living (wages, returns on capital, returns on natural resources)
– It is not what industries a nation competes in that matters for prosperity, but how productively it competes in those industries
– Productivity in a national economy arises from a combination of domestic and foreign firms
– The productivity of “local” or domestic industries is fundamental to competitiveness, not just that of export industries

8 Copyright 2009 © Professor Michael E. Porter20091006 – Monterray Mexico.ppt
Macroeconomic Competitiveness
Microeconomic Competitiveness
Sophisticationof Company
Operations andStrategy
Quality of the NationalBusiness
Environment
MacroeconomicPolicies
SocialInfrastructure and PoliticalInstitutions
State of Cluster Development
• Macroeconomic competitiveness creates the potential for high productivity, but is not sufficient
• Productivity ultimately depends on improving the microeconomic capability of the economy and the sophistication of local competition
Determinants of Competitiveness
Natural Endowments
9 Copyright 2009 © Professor Michael E. Porter20091006 – Monterray Mexico.ppt
Mexico’s Macroeconomic Competitiveness
• Some progress has been made in implementing important reforms during the past twenty years, such as political and economic liberalization, opening of the economy, and economic diversification
• Mexico’s macroeconomic policy has been successful in some areas, such as low inflation and low interest rates
– However, fiscal resources are overly dependent on oil revenues and there is a narrow tax-base
– Distortive system of taxes and subsidies is limiting competitiveness
• Mexico lags behind OECD countries on human development indicators in education and health
• Mexico’s political and governmental institutions have improved, but remain a significant weakness
• There is a serious lack of trust in politicians and the effectiveness in legislative bodies
• Fighting organized crime is major government challenge and priority
• While better than regional peers, corruption is limiting Mexico’s economic development

10 Copyright 2009 © Professor Michael E. Porter20091006 – Monterray Mexico.ppt
Canad
aUnit
ed Stat
esChil
eUrug
uay
Costa
RicaPan
ama
Brazil
El Salv
ador
Mexico
Argenti
na
Domini
can R
epub
licPeru
Colombia
Hondu
rasGua
temala
Nicarag
uaPara
guay
Ecuad
orVen
ezue
la
Voice and AccountabilityPolitical StabilityGovernment EffectivenessRegulatory QualityRule of LawControl of Corruption
Governance IndicatorsSelected Countries
Note: Sorted left to right by decreasing average value across all indicators. The ‘zero’ horizontal line corresponds to the median country’s average value across all indicators.Source: World Bank (2009)
Worstcountry in the world
Index of Governance
Quality,2008
Best country in the world

11 Copyright 2009 © Professor Michael E. Porter20091006 – Monterray Mexico.ppt
-20 -15 -10 -5 0 5 10 15 20
Corruption Perception Index, 2007
Note: Ranks only countries available in both years (91 countries total)Source: Global Corruption Report, 2007
Change in Rank, Global Corruption Report, 2007 versus 2001
Rank in Global
CorruptionIndex,2007
91
1ImprovingDeteriorating
Highcorruption
Lowcorruption
Finland
Canada
Bangladesh
Indonesia
Ireland
Portugal
Egypt
Iceland
Czech Republic
SlovakiaSouth Korea
Latvia
India
Slovenia
Thailand
Switzerland
France
Romania
Turkey
Estonia
Austria GermanyJapan
Vietnam
China
NorwayUK
MalaysiaLithuania
Colombia
HungaryTaiwan
Spain
Hong Kong
ChileUnited States
South Africa
Mexico
Croatia
Italy
Poland
Brazil
Argentina
Israel
Venezuela
Russia
Uruguay
New ZealandSweden
Tunisia
Peru
Tanzania
Uganda
Senegal
Philippines
Zimbabwe Cote d’Ivoire NigeriaPakistan
GreeceJordan
Ukraine
Panama
Honduras
Ecuador
Nicaragua
GuatemalaBolivia
El Salvador
12 Copyright 2009 © Professor Michael E. Porter20091006 – Monterray Mexico.ppt
Mexico’s Macroeconomic CompetitivenessAction Priorities
• Build public support to continue the fight against organized crime– A safe environment for business is a necessary condition for
competitiveness
• Intensify the fight against corruption
• Broaden the tax base and improve tax-collection capacity
• Tackle the system of state subsidies
• Upgrade the quality of basic education and health
• Reduce reliance on the U.S. through diversification of tradingpartners
• Reform political and governmental institutions to allow more effective policy
13 Copyright 2009 © Professor Michael E. Porter20091006 – Monterray Mexico.ppt
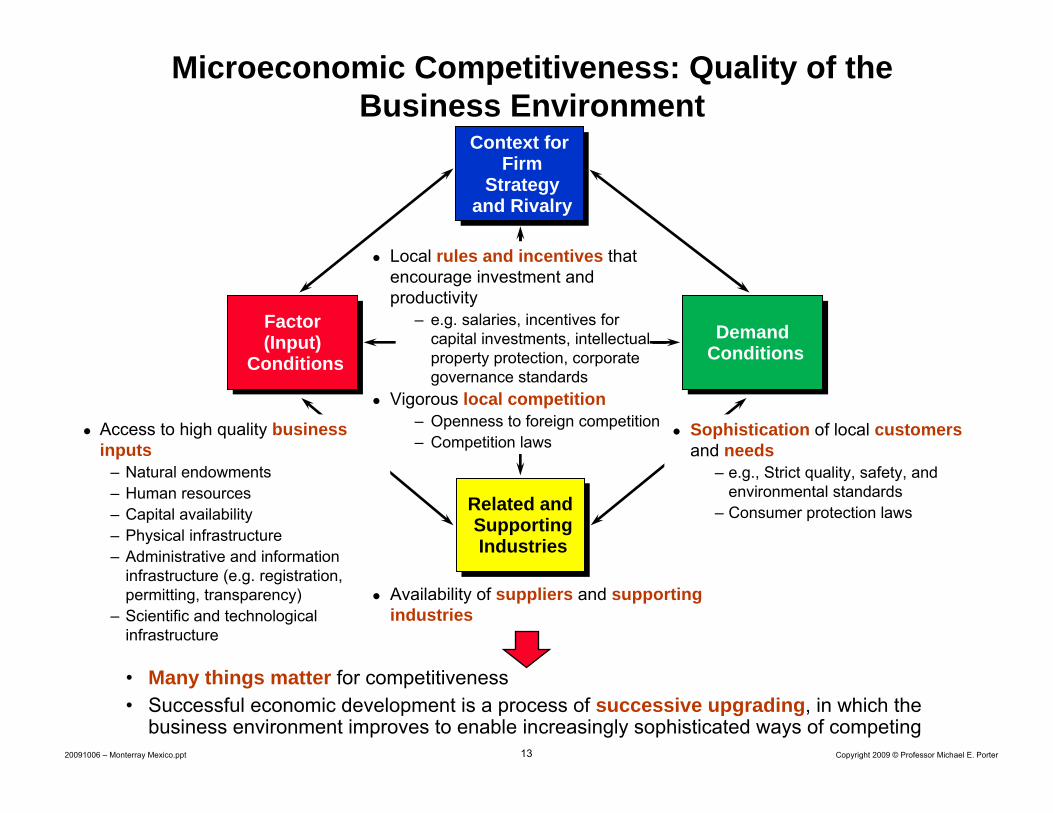
Microeconomic Competitiveness: Quality of the Business Environment
Context for Firm
Strategy and Rivalry
Context for Firm
Strategy and Rivalry
Related and Supporting Industries
Related and Supporting Industries
Factor(Input)
Conditions
Factor(Input)
ConditionsDemand
ConditionsDemand
Conditions
Sophistication of local customers and needs
– e.g., Strict quality, safety, and environmental standards
– Consumer protection laws
• Many things matter for competitiveness• Successful economic development is a process of successive upgrading, in which the
business environment improves to enable increasingly sophisticated ways of competing
Local rules and incentives that encourage investment and productivity
– e.g. salaries, incentives for capital investments, intellectual property protection, corporate governance standards
Vigorous local competition– Openness to foreign competition– Competition laws
Access to high quality business inputs
– Natural endowments– Human resources– Capital availability– Physical infrastructure– Administrative and information
infrastructure (e.g. registration, permitting, transparency)
– Scientific and technological infrastructure
Availability of suppliers and supporting industries
14 Copyright 2009 © Professor Michael E. Porter20091006 – Monterray Mexico.ppt
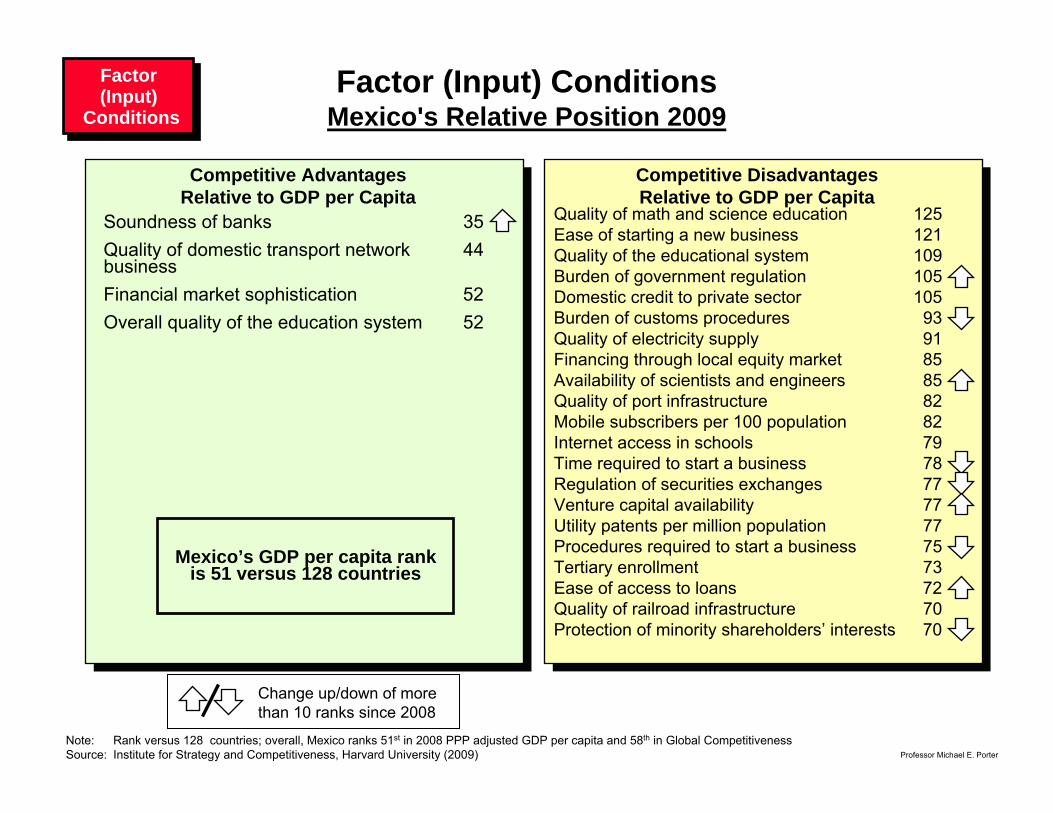
Soundness of banks 35Quality of domestic transport network 44 businessFinancial market sophistication 52Overall quality of the education system 52
Competitive Disadvantages Relative to GDP per Capita
Competitive Advantages Relative to GDP per Capita
Quality of math and science education 125Ease of starting a new business 121Quality of the educational system 109Burden of government regulation 105Domestic credit to private sector 105Burden of customs procedures 93Quality of electricity supply 91Financing through local equity market 85Availability of scientists and engineers 85Quality of port infrastructure 82Mobile subscribers per 100 population 82Internet access in schools 79Time required to start a business 78Regulation of securities exchanges 77Venture capital availability 77Utility patents per million population 77Procedures required to start a business 75Tertiary enrollment 73Ease of access to loans 72Quality of railroad infrastructure 70Protection of minority shareholders’ interests 70
Factor (Input) ConditionsMexico's Relative Position 2009
Factor(Input)
Conditions
Factor(Input)
Conditions
Note: Rank versus 128 countries; overall, Mexico ranks 51st in 2008 PPP adjusted GDP per capita and 58th in Global CompetitivenessSource: Institute for Strategy and Competitiveness, Harvard University (2009)
Change up/down of more than 10 ranks since 2008
Mexico’s GDP per capita rank is 51 versus 128 countries
15 Copyright 2009 © Professor Michael E. Porter20091006 – Monterray Mexico.ppt
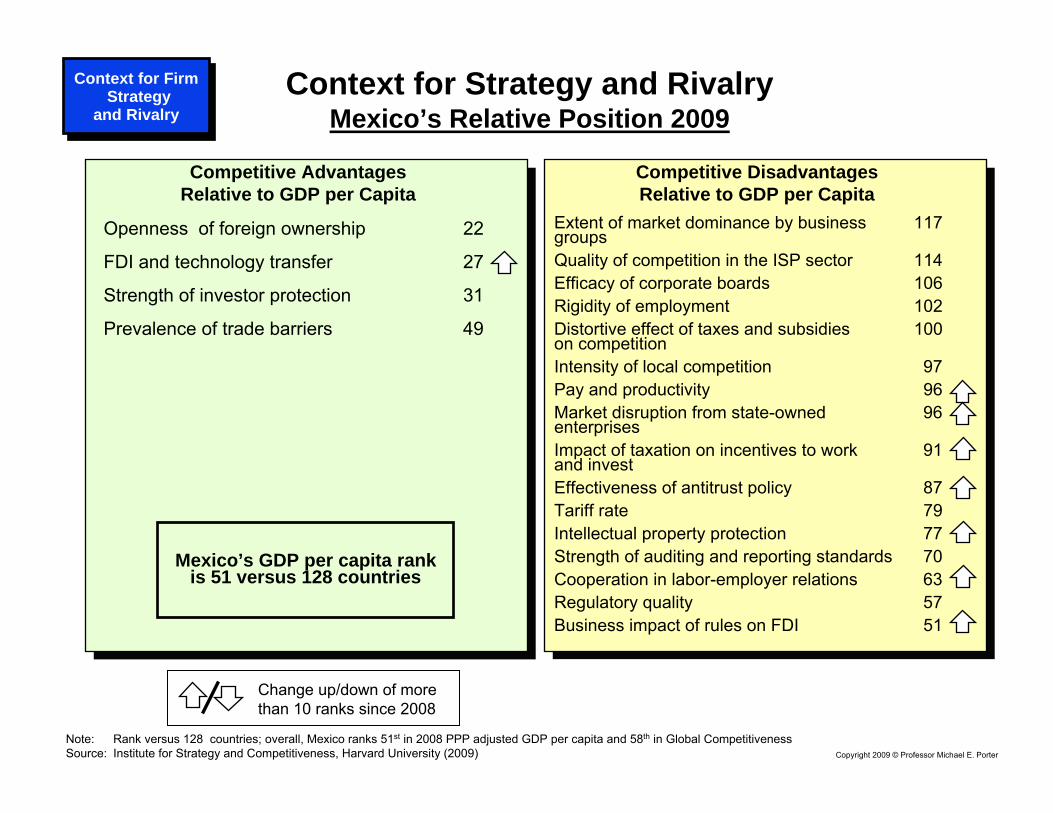
Context for Strategy and RivalryMexico’s Relative Position 2009
Openness of foreign ownership 22
FDI and technology transfer 27
Strength of investor protection 31
Prevalence of trade barriers 49
Competitive Disadvantages Relative to GDP per Capita
Competitive Advantages Relative to GDP per Capita
Extent of market dominance by business 117 groupsQuality of competition in the ISP sector 114Efficacy of corporate boards 106Rigidity of employment 102Distortive effect of taxes and subsidies 100 on competitionIntensity of local competition 97Pay and productivity 96Market disruption from state-owned 96 enterprisesImpact of taxation on incentives to work 91 and investEffectiveness of antitrust policy 87Tariff rate 79Intellectual property protection 77Strength of auditing and reporting standards 70Cooperation in labor-employer relations 63Regulatory quality 57Business impact of rules on FDI 51
Context for Firm Strategy
and Rivalry
Context for Firm Strategy
and Rivalry
Note: Rank versus 128 countries; overall, Mexico ranks 51st in 2008 PPP adjusted GDP per capita and 58th in Global CompetitivenessSource: Institute for Strategy and Competitiveness, Harvard University (2009)
Change up/down of more than 10 ranks since 2008
Mexico’s GDP per capita rank is 51 versus 128 countries

16 Copyright 2009 © Professor Michael E. Porter20091006 – Monterray Mexico.ppt
WEAKNESSESSTRENGTHS
Mexico’s Business Environment Overall Strengths and Weaknesses
• Openness to FDI and technology transfer
• Solid basic skills and a large, young, available workforce
• Entrepreneurial population• Good quality of roads and domestic
transport network• Sound banks• High level of sophistication in leading
Mexican companies
• Impact of crime and violence on business• High burden of government regulations • Distortive tax and subsidy system • Large informal market• Weak primary and secondary education• Poor higher education and training
system• Insufficient graduates in science and
engineering• Labor market inefficiencies• Small pool of domestic credit• Limited competition, including inefficient
(public and private) monopolies and oligopolies
• Dominance of large business groups and state-owned enterprises
• Lack of innovation infrastructure• Weak IP protection
17 Copyright 2009 © Professor Michael E. Porter20091006 – Monterray Mexico.ppt
0
20
40
60
80
100
120
140
Ease ofDoing
Business
Closing aBusiness
Dealingwith
Licenses
ProtectingInvestors
GettingCredit
TradingAcrossBorders
EnforcingContracts
Starting aBusiness
RegisteringProperty
PayingTaxes
EmployingWorkers
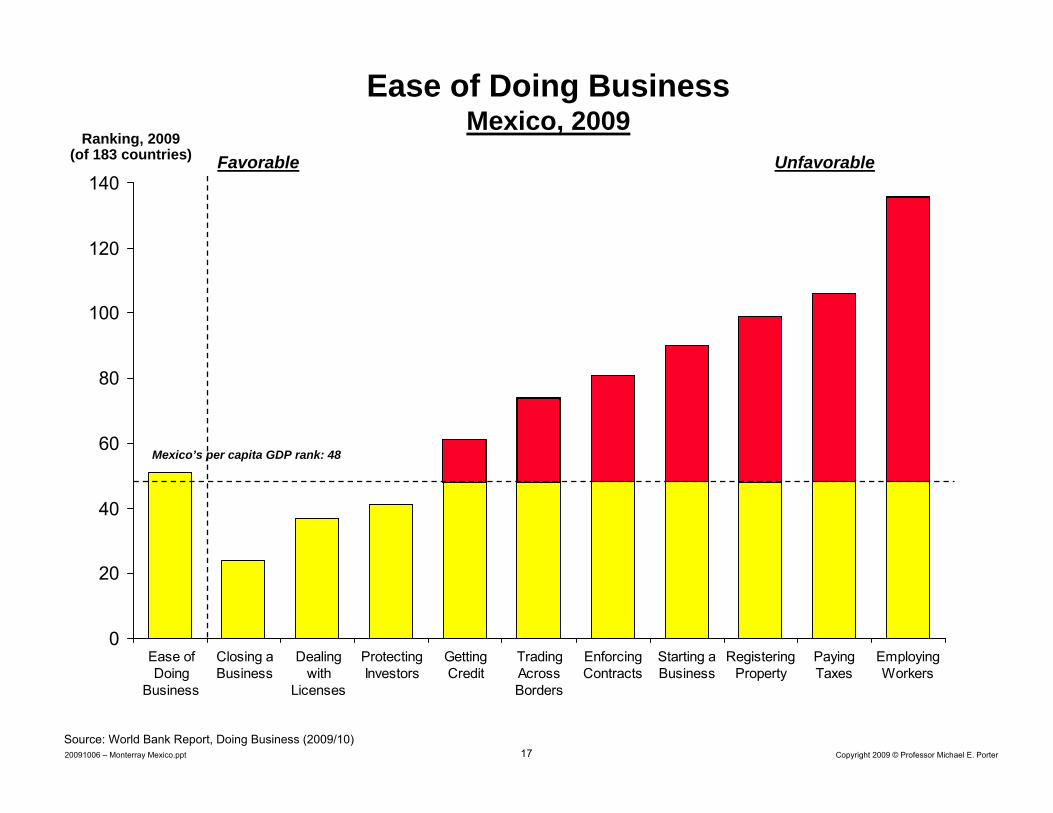
Ease of Doing BusinessMexico, 2009
Ranking, 2009 (of 183 countries)
Source: World Bank Report, Doing Business (2009/10)
Favorable Unfavorable
Mexico’s per capita GDP rank: 48
18 Copyright 2009 © Professor Michael E. Porter20091006 – Monterray Mexico.ppt
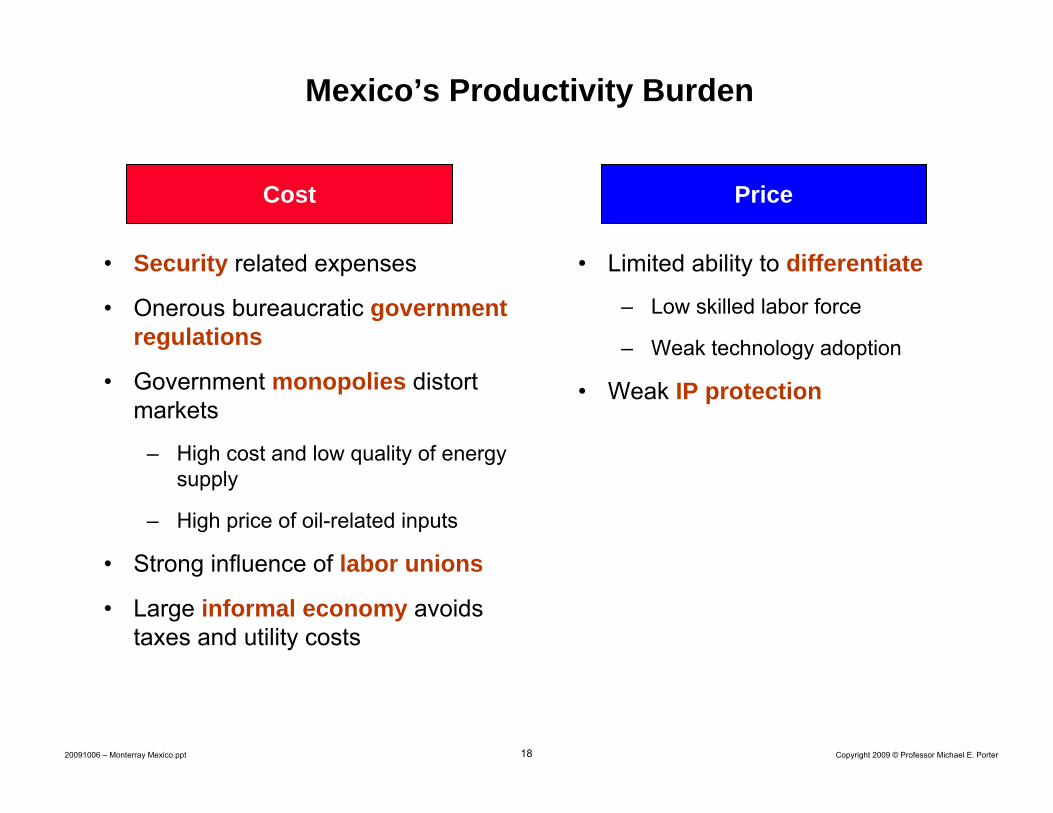
Mexico’s Productivity Burden
• Security related expenses
• Onerous bureaucratic government regulations
• Government monopolies distort markets
– High cost and low quality of energy supply
– High price of oil-related inputs
• Strong influence of labor unions
• Large informal economy avoids taxes and utility costs
• Limited ability to differentiate
– Low skilled labor force
– Weak technology adoption
• Weak IP protection
Cost Price

19 Copyright 2009 © Professor Michael E. Porter20091006 – Monterray Mexico.ppt
Mexico’s Business EnvironmentAction Priorities
• Open up competition, particularly in areas with dominant firms
– Also reduce distortive effects of subsidies
• Reform rules and regulations to ease the burden of doing business
• Reduce labor market rigidities
• Address other causes of informality
• Relax infrastructure bottlenecks
• Improve the quality of higher education and training
• Build technological and innovation infrastructure
• Enhance incentives for innovation and entrepreneurship
– e.g., IP protection, venture capital

20 Copyright 2009 © Professor Michael E. Porter20091006 – Monterray Mexico.ppt
Sources: HBS student team research (2003) - Peter Tynan, Chai McConnell, Alexandra West, Jean Hayden
HotelsHotels
Attractions andActivities
e.g., theme parks, casinos, sports
Attractions andActivities
e.g., theme parks, casinos, sports
Airlines, Cruise Ships
Airlines, Cruise Ships
Travel agentsTravel agents Tour operatorsTour operators
RestaurantsRestaurants
PropertyServicesPropertyServices
MaintenanceServices
MaintenanceServices
Government agenciese.g. Australian Tourism Commission,
Great Barrier Reef Authority
Government agenciese.g. Australian Tourism Commission,
Great Barrier Reef Authority
Educational Institutionse.g. James Cook University,
Cairns College of TAFE
Educational Institutionse.g. James Cook University,
Cairns College of TAFE
Industry Groupse.g. Queensland Tourism
Industry Council
Industry Groupse.g. Queensland Tourism
Industry Council
FoodSuppliers
FoodSuppliers
Public Relations & Market Research
Services
Public Relations & Market Research
Services
Local retail, health care, andother services
Local retail, health care, andother services
Souvenirs, Duty Free
Souvenirs, Duty Free
Banks,Foreign
Exchange
Banks,Foreign
Exchange
Local Transportation
Local Transportation
Microeconomic Competitiveness: Cluster DevelopmentTourism Cluster in Cairns, Australia

21 Copyright 2009 © Professor Michael E. Porter20091006 – Monterray Mexico.ppt
Equipment Suppliers
(e.g. Oil Field Chemicals,Drilling Rigs, Drill Tools)
SpecializedTechnology
Services
(e.g. Drilling Consultants,
Reservoir Services, Laboratory Analysis)
Subcontractors
(e.g. Surveying,Mud Logging,Maintenance
Services)
BusinessServices
(e.g. MIS Services,Technology Licenses,
Risk Management)
Specialized Institutions(e.g. Academic Institutions, Training Centers, Industry Associations)
The Houston Oil and Gas Cluster
Oil & Natural Gas Completion &
Production
Oil & Natural GasExploration & Development
OilTrans-
portationOil
TradingOil
Refining
Oil Retail
Marketing
OilWholesaleMarketing
OilDistribution
GasGathering
GasProcessing
GasTrading
GasTransmis-
sion
GasDistribution
GasMarketing
Upstream Downstream
Oilfield Services/Engineering & Contracting Firms
22 Copyright 2009 © Professor Michael E. Porter20091006 – Monterray Mexico.ppt
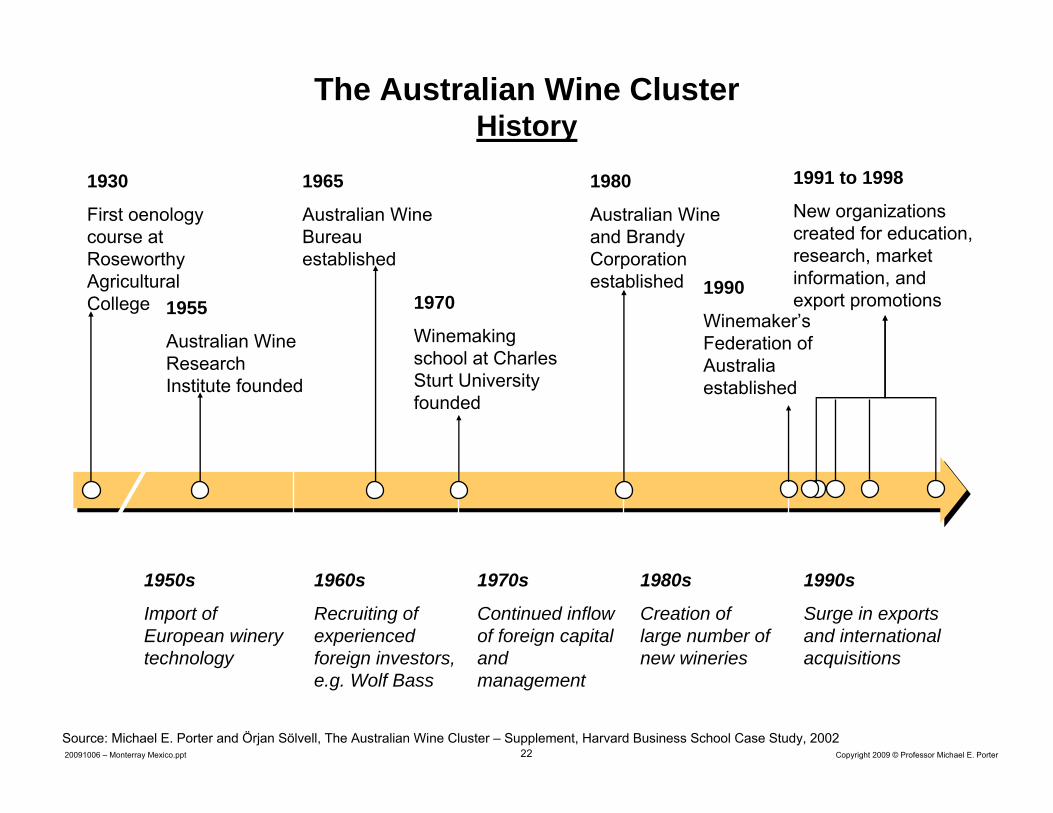
The Australian Wine ClusterHistory
1955
Australian Wine Research Institute founded
1970
Winemaking school at Charles Sturt University founded
1980
Australian Wine and Brandy Corporation established
1965
Australian Wine Bureau established
1930
First oenology course at RoseworthyAgricultural College
1950s
Import of European winery technology
1960s
Recruiting of experienced foreign investors, e.g. Wolf Bass
1990s
Surge in exports and international acquisitions
1980s
Creation of large number of new wineries
1970s
Continued inflow of foreign capital and management
1990
Winemaker’s Federation of Australia established
1991 to 1998
New organizations created for education, research, market information, and export promotions
Source: Michael E. Porter and Örjan Sölvell, The Australian Wine Cluster – Supplement, Harvard Business School Case Study, 2002

23 Copyright 2009 © Professor Michael E. Porter20091006 – Monterray Mexico.ppt
Clusters as a Tool For Economic Policy
• A forum for collaboration between government, the private sector, trade associations, educational institutions, and research institutions
• Brings together firms of all sizes, including SME’s
• Creates a mechanism for constructive business-government dialogue
• A tool to identify problems and concrete action recommendations
• A vehicle for identifying investments that strengthen multiple firms/institutions simultaneously
• Foster more sophisticated competition rather than distorting the market

24 Copyright 2009 © Professor Michael E. Porter20091006 – Monterray Mexico.ppt
ClustersClusters
Physical Infrastructure
Natural Resource Protection
Environmental Stewardship
Science and TechnologyInvestments (e.g., centers, university departments, technology transfer)
Education and Workforce Training
Business Attraction
Export Promotion
• Clusters provide a framework for implementing public policy and organizing public-private collaboration to enhance competitiveness
Standard setting and quality initiatives
Market Information and Disclosure
Management Training
Cluster-Based Policy Implementation

25 Copyright 2009 © Professor Michael E. Porter20091006 – Monterray Mexico.ppt
0.0%
1.0%
2.0%
3.0%
4.0%
5.0%
-2.5% -2.0% -1.5% -1.0% -0.5% 0.0% 0.5% 1.0% 1.5%
National Export PortfolioMexico, 1997 to 2007
Change in Mexico’s world export market share, 1997 to 2007Source: Prof. Michael E. Porter, International Cluster Competitiveness Project, Institute for Strategy and Competitiveness, Harvard Business School; Richard Bryden, Project Director. Underlying data drawn from the UN Commodity Trade Statistics Database and the IMF BOP statistics.
Mex
ico’
s w
orld
exp
ort m
arke
t sha
re, 2
007
Change In Mexico’s Overall World Export Share: -0.11%
Mexico’s Average World Export Share: 1.82%
Exports of US$1.5 Billion =
Hospitality and Tourism
Automotive
Processed Foods
Sporting Products
Transportation and Logistics
Biopharmaceuticals
Production Technology
Chemical Products
Oil and Gas
Entertainment (5.17% ,10.32%)
Fishing
Information Technology
Medical Devices
Prefabricated Enclosures and Structures
Power and Power Generation Equipment
Agriculture
Communication Services
Construction Materials
Financial Services
Light and Elec. Equipment
Heavy Machinery
Analytical InstrumentsPublishing and Printing
Motor Driven Products
Jewelry, Precious Metals and Collectibles
Communications Equipment
Metal, Mining and Manufacturing
Apparel
Furniture
Footwear
Leather and Related Products
Forest Products
Building Fixtures and Equipment
Tobacco
Marine Equipment
Plastics
Aerospace Engines
Textiles
Aerospace Vehicles and Defense

26 Copyright 2009 © Professor Michael E. Porter20091006 – Monterray Mexico.ppt
FurnitureBuilding Fixtures,
Equipment & Services
Fishing & Fishing Products Hospitality
& TourismAgricultural
ProductsTransportation
& Logistics
Share of World Exports by ClusterMexico, 2007
Plastics
Oil & Gas
Chemical Products
Biopharma-ceuticals
Power Generation
Aerospace Vehicles &
Defense
Lightning & ElectricalEquipment
Financial Services Publishing
& Printing
Information Tech.
Communi-cations
Equipment
Business Services
DistributionServices
Forest Products
Heavy Construction
Services
ConstructionMaterials
Prefabricated Enclosures
Apparel
Leather & Related Products
Jewelry & Precious Metals
Textiles
Footwear
Processed Food
Tobacco
Medical Devices
Analytical InstrumentsEducation &
Knowledge Creation
Note: Clusters with overlapping borders have at least 20% overlap (by number of industries) in both directions.
Marine Equipment
Aerospace Engines
Heavy Machinery
Sporting & Recreation
Goods
Automotive
Production Technology
Motor Driven Products
Mining & Metal Manufacturing
Strong
Stronger
Strongest
Enter-tainment

27 Copyright 2009 © Professor Michael E. Porter20091006 – Monterray Mexico.ppt
Cluster Development in Mexico
• Mexico has some well developed clusters, including automotive, petrochemicals, entertainment equipment, and communications equipment
– FDI has helped trigger cluster formation
• Cluster development has taken place organically
• Mexico has a strong network of labor cost sensitive suppliers due to NAFTA, but most clusters rely heavily on intermediate good imports
• Existing cluster development efforts suffer from weak coordinationbetween the private and public sectors

28 Copyright 2009 © Professor Michael E. Porter20091006 – Monterray Mexico.ppt
Cluster Development in MexicoAction Priorities
• Adopt cluster development as a central tool for organizing business development and policy implementation
• Utilize cluster initiatives as a tool to engage the private sector in more effective collaboration with government at the national and regional levels
• Use clusters to organize efforts to promote higher value exports andFDI attraction
• Cluster development is an effective approach to enable the transition to an innovation-driven development model

29 Copyright 2009 © Professor Michael E. Porter20091006 – Monterray Mexico.ppt
Successful Mexican ClustersBaja California Sur Tourism
Core Services
Restaurants(419 restaurants)
Hotels & Lodges(290 hotels)
Natural Attractions & Activities
Airlines, Airports & Cruise ships
(4 airports, 8 airlines; 5 charter)
Enablers & IFC’s
Government Agencies
(SECTUR)
Educational Institutions
(24 tourism focus institutions nationwide)
Industry Groups
(Tourism Promotion Council)
Adjacent & Supporting Clusters
Food Supply Construction & Developers
Maintenance Services
Maritime ServicesEnergyFinancial
Services
Retail &
Transportation Services
Travel Agencies(60 agencies)
Docs and Marinas
(6 tourism marinas)
Airport Support Services
Taxi & Bus Services
(39 companies)
Car Rental Agencies
(36 branches)
Ente
rtai
nmen
t Ser
vice
s
Souvenirs & Handicrafts
Stores
Whale Watching & Tour Guides
(62 agencies)
Sports Fishing(29 agencies)
Golf Courses(8 courses; 3 Jack
Nicklaus )
Clubs & Bars(59 nightlife spots)
Ecotourism Operators(56 operators)
Maritime Transport
(43 companies)
Scuba diving & Snorkeling
(38 rental & guides)
Telecom, Internet
Hospitals & Clinics
Convention Centers
(344 centers)
Sources: Harvard Microeconomics of Competitiveness student team research (2008) - Daniel Acevedo, Nicho Garza Sada, Jose Luis Romo, and Bernardo Vogel

30 Copyright 2009 © Professor Michael E. Porter20091006 – Monterray Mexico.ppt
Successful Mexican ClustersJalisco’s Electronics
Sources: Harvard Microeconomics of Competitiveness student team research (2009) - Julian Arber Alison Chick, Gustavo De Loyola, Ina Mogollon, and Bernardo Novick
Core Manufacturers
Core Manufacturers
Original Equipment Manufacturers
(OEM)(12 players)
Original Equipment Manufacturers
(OEM)(12 players)
Contract Manufacturers
(CM)(13 players)
Contract Manufacturers
(CM)(13 players)
Parts and Component
Manufacturers(389 players)
Parts and Component
Manufacturers(389 players)
Economic Promotion Agency
(SEPROE)
Economic Promotion Agency
(SEPROE)
Universities(15)
Universities(15)
Jalisco Trade Institution
(JALTRADE)
Jalisco Trade Institution
(JALTRADE)
Private Security
Companies
National Electronics and
IT Chamber (CANIETI)
Electronic Supply Chain
Chamber (CADELEC)
Testing Equipment
Jalisco IT Institute (IJALTI)
Institutes For Collaboration
Government Institutions
Advanced Research Center
(CINVESTAV)
Advanced Research Center
(CINVESTAV)
Systems Research
Center
Systems Research
Center
Communications Research
Center
Communications Research
Center
Freight Consolidators
Insurance Companies
Logistics
Customs Agents
Quality Assurance Consulting
HR Subcontractin
g Agencies
Plastic Molding
Companies
Packaging and Printing Companies
Universities and R &D Centers

31 Copyright 2009 © Professor Michael E. Porter20091006 – Monterray Mexico.ppt
Geographic Influences on Competitiveness
Neighboring CountriesNeighboring Countries
Regions and CitiesRegions and Cities
NationNation
32 Copyright 2009 © Professor Michael E. Porter20091006 – Monterray Mexico.ppt
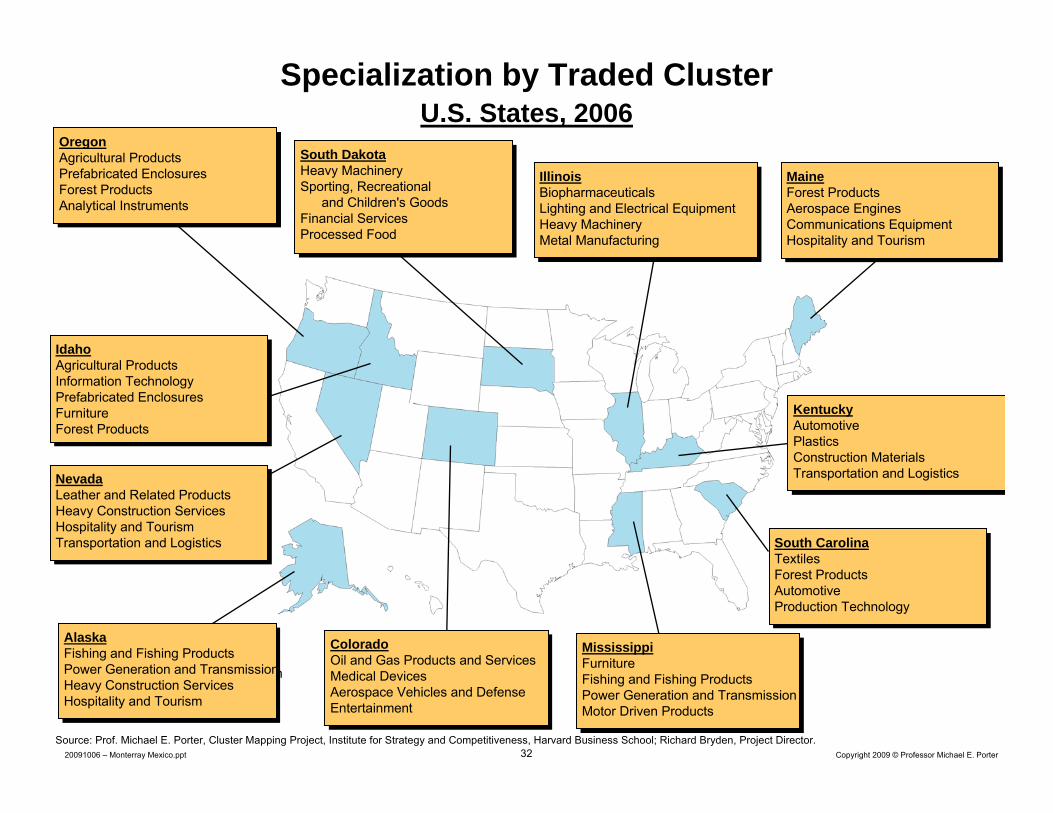
Specialization by Traded ClusterU.S. States, 2006
MaineForest ProductsAerospace EnginesCommunications EquipmentHospitality and Tourism
MaineForest ProductsAerospace EnginesCommunications EquipmentHospitality and Tourism
OregonAgricultural ProductsPrefabricated EnclosuresForest ProductsAnalytical Instruments
OregonAgricultural ProductsPrefabricated EnclosuresForest ProductsAnalytical Instruments
KentuckyAutomotivePlasticsConstruction MaterialsTransportation and Logistics
KentuckyAutomotivePlasticsConstruction MaterialsTransportation and Logistics
South CarolinaTextilesForest ProductsAutomotiveProduction Technology
South CarolinaTextilesForest ProductsAutomotiveProduction Technology
South DakotaHeavy MachinerySporting, Recreational
and Children's GoodsFinancial ServicesProcessed Food
South DakotaHeavy MachinerySporting, Recreational
and Children's GoodsFinancial ServicesProcessed Food
Source: Prof. Michael E. Porter, Cluster Mapping Project, Institute for Strategy and Competitiveness, Harvard Business School; Richard Bryden, Project Director.
AlaskaFishing and Fishing ProductsPower Generation and TransmissionHeavy Construction ServicesHospitality and Tourism
AlaskaFishing and Fishing ProductsPower Generation and TransmissionHeavy Construction ServicesHospitality and Tourism
NevadaLeather and Related ProductsHeavy Construction ServicesHospitality and TourismTransportation and Logistics
NevadaLeather and Related ProductsHeavy Construction ServicesHospitality and TourismTransportation and Logistics
IdahoAgricultural ProductsInformation TechnologyPrefabricated EnclosuresFurnitureForest Products
IdahoAgricultural ProductsInformation TechnologyPrefabricated EnclosuresFurnitureForest Products
MississippiFurnitureFishing and Fishing ProductsPower Generation and TransmissionMotor Driven Products
MississippiFurnitureFishing and Fishing ProductsPower Generation and TransmissionMotor Driven Products
ColoradoOil and Gas Products and ServicesMedical DevicesAerospace Vehicles and DefenseEntertainment
ColoradoOil and Gas Products and ServicesMedical DevicesAerospace Vehicles and DefenseEntertainment
IllinoisBiopharmaceuticalsLighting and Electrical EquipmentHeavy MachineryMetal Manufacturing
IllinoisBiopharmaceuticalsLighting and Electrical EquipmentHeavy MachineryMetal Manufacturing

33 Copyright 2009 © Professor Michael E. Porter20091006 – Monterray Mexico.ppt
Competitiveness of Mexican States
Source: Map from Mexico.org
• Strong disparities exist across Mexican states in business environment, innovative capacity, and economic performance
– Greater specialization since NAFTA, especially in Northern border states– Growth potential in Southern states depressed by poverty and failure to capitalize on
NAFTA• Decentralization of economic policy is essential to success in large countries
such as Mexico
34 Copyright 2009 © Professor Michael E. Porter20091006 – Monterray Mexico.ppt
0
25,000
50,000
75,000
100,000
125,000
150,000
175,000
200,000
225,000
4% 5% 6% 7% 8% 9% 10% 11% 12%
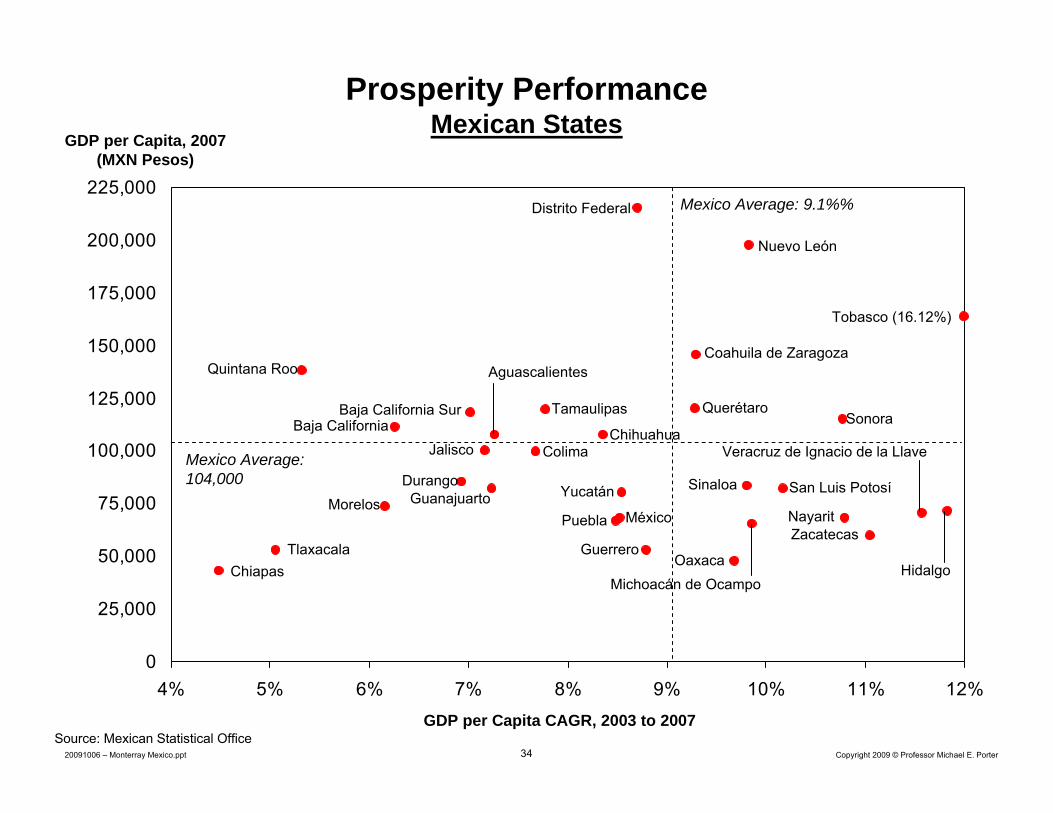
Prosperity PerformanceMexican States
GDP per Capita, 2007 (MXN Pesos)
GDP per Capita CAGR, 2003 to 2007
Mexico Average: 9.1%%
Source: Mexican Statistical Office
Mexico Average: 104,000
Aguascalientes
Baja California
Coahuila de Zaragoza
Yucatán
ColimaJalisco
Baja California Sur
Chiapas
Chihuahua
Distrito Federal
DurangoGuanajuarto
GuerreroHidalgo
Morelos
Michoacán de Ocampo
México Nayarit
Oaxaca
Nuevo León
Puebla
Quintana Roo
Sinaloa
Sonora
Tobasco (16.12%)
Tamaulipas
TlaxacalaZacatecas
Querétaro
San Luis Potosí
Veracruz de Ignacio de la Llave

35 Copyright 2009 © Professor Michael E. Porter20091006 – Monterray Mexico.ppt
Mexican StatesAction Priorities
• Close the productivity gap between Northern and Southern states
• Utilize better infrastructure to integrate other states into the national and global economy
• Encourage internal trade and investment to facilitate economic specialization and increase domestic competition
• Develop state government capacity to improve policy formulationand implementation
• Support states in creating distinctive state economic strategies
• Step up efforts to reduce corruption at the state level

36 Copyright 2009 © Professor Michael E. Porter20091006 – Monterray Mexico.ppt
Geographic Influences on Competitiveness
Neighboring CountriesNeighboring Countries
Regions and CitiesRegions and Cities
NationNation

37 Copyright 2009 © Professor Michael E. Porter20091006 – Monterray Mexico.ppt
Economic Coordination with Neighboring Countries
• Economic coordination among neighboring countries can significantly enhance competitiveness

38 Copyright 2009 © Professor Michael E. Porter20091006 – Monterray Mexico.ppt
Mexico and NAFTA• The Mexican economy has benefited greatly from NAFTA, which has
driven growth, brought in FDI, and transformed Mexico into a more open economy
HOWEVER
• The existing NAFTA model is insufficient to drive future growth– Maquiladora model has exhausted its capacity to generate important
benefits– Since 1994, bilateral trade in goods and services has outstripped GDP
growth• Mexico needs to diversify its export and integration focus beyond the
U.S.
• A shift toward a higher productivity/innovation-based economic model will be necessary to take NAFTA to the next level
39 Copyright 2009 © Professor Michael E. Porter20091006 – Monterray Mexico.ppt
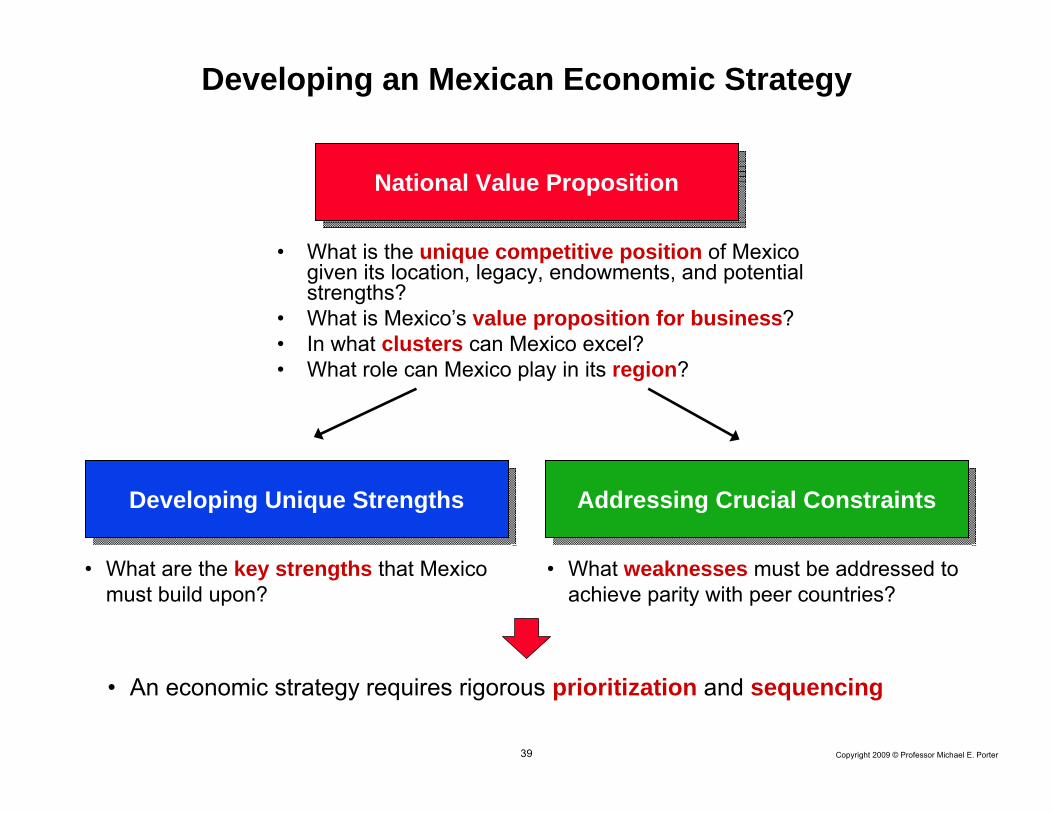
National Value PropositionNational Value Proposition
Developing an Mexican Economic Strategy
Developing Unique StrengthsDeveloping Unique Strengths Addressing Crucial ConstraintsAddressing Crucial Constraints
• What are the key strengths that Mexico must build upon?
• What weaknesses must be addressed to achieve parity with peer countries?
• What is the unique competitive position of Mexico given its location, legacy, endowments, and potential strengths?
• What is Mexico’s value proposition for business?• In what clusters can Mexico excel?• What role can Mexico play in its region?
• An economic strategy requires rigorous prioritization and sequencing

40 Copyright 2009 © Professor Michael E. Porter20091006 – Monterray Mexico.ppt
Toward a Mexican Economic Strategy
Implications
Fight Organized Crime and Corruption
Open Competition
Next Stage Regulatory Reforms (labor, unions, energy, formalization, education, public administration)
Building Innovation Infrastructure
Better Quality Higher Education and Training
Unique Strengths
• Located between two oceans • Privileged access to the
United States’ market, which includes large Mexican diaspora (30 million)
• Proximity to Central and South American markets
• Largest Spanish speaking market
• Young hard working population
• High level of entrepreneurship
• Large geographic areaFoster Cluster Development
Excellent Infrastructure Linking the Country Together and Enabling Southern Trade
Unleash Entrepreneurship and SME Development

41 Copyright 2009 © Professor Michael E. Porter20091006 – Monterray Mexico.ppt
The Process of Economic DevelopmentShifting Roles and Responsibilities
Old ModelOld Model
• Government drives economic development through policy decisions and incentives
• Government drives economic development through policy decisions and incentives
New ModelNew Model
• Economic development is a collaborative process involving the private sector, government at multiple levels, universities, labor, and civil society
• Economic development is a collaborative process involving the private sector, government at multiple levels, universities, labor, and civil society
• Competitiveness must become a bottoms-up process in which many individuals, companies, and institutions take responsibilities
• Every community and cluster can take steps to enhance competitiveness• The private sector must become more engaged in competitiveness to
improve rapidly

42 Copyright 2009 © Professor Michael E. Porter20091006 – Monterray Mexico.ppt
Organizing for Competitiveness
• Sustained improvements in competitiveness require coordination among many parts of government
– Across different ministries to align policies– Across geographic levels of government
• Improving competitiveness requires collaboration with the private sector
– Public-private dialogue to identify competitiveness priorities and implement solutions
• Mexico has created some organizations for competitiveness, but policy coordination between government and the private sector remains a challenge
– Mexican Competitiveness Institute (IMCO) advances new competitiveness proposals but is positioned primarily as a think tank
– Legislative competitiveness committees are present, but coordinate principally with the executive branch
– Many states do not have an effective strategic plan nor engage in effective public-private dialogue

43 Copyright 2009 © Professor Michael E. Porter20091006 – Monterray Mexico.ppt
Mexico: Moving from Diagnosis to ActionOrganizing for Competitiveness Priorities
• Strong private sector leadership is needed to address the well documented competitiveness challenges facing Mexico
• Create a private-sector led National Council on Competitiveness to build consensus on an overall economic strategy and track implementation
– Public sector and academia participation is critical in order to develop effective national policy and coordinate implementation
• Encourage creation of State Competitiveness Councils to drive consensus on state plans and monitor implementation
– Involve representatives from the public, private and academic sectors as well as federal government participation

44 Copyright 2009 © Professor Michael E. Porter20091006 – Monterray Mexico.ppt
The Role of the Private Sector in Economic Development
• A company’s competitive advantage depends heavily on the quality of the business environment
• A company gains advantages from being part of a cluster• Companies have a strong role to play in upgrading their business
environment
• Take an active role in upgrading the local infrastructure• Nurture local suppliers and attract foreign suppliers • Work closely with local educational and research institutions, to upgrade
their quality and create specialized programs addressing the cluster’s needs
• Inform government on regulatory issues and constraints bearing on cluster development
• Focus corporate philanthropy on enhancing the local business environment
• An important role for trade associations– Greater influence if many companies are united– Cost sharing between members
45 Copyright 2009 © Professor Michael E. Porter20091006 – Monterray Mexico.ppt
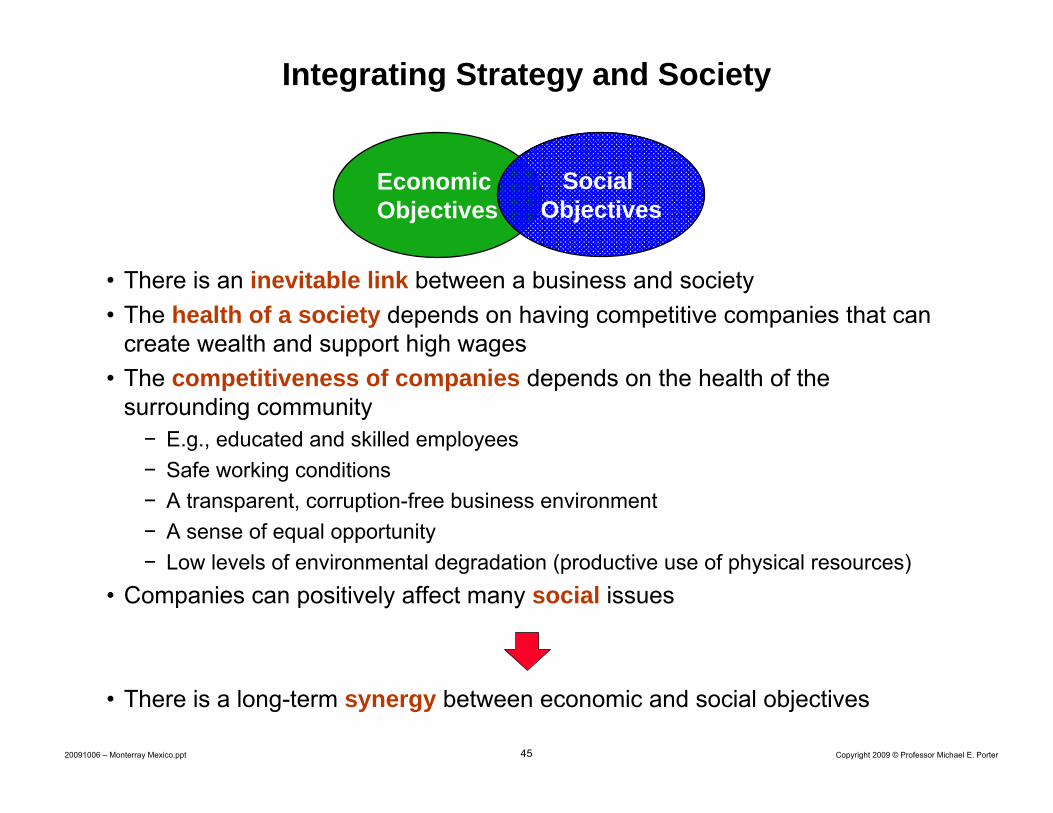
• There is an inevitable link between a business and society• The health of a society depends on having competitive companies that can
create wealth and support high wages• The competitiveness of companies depends on the health of the
surrounding community− E.g., educated and skilled employees− Safe working conditions − A transparent, corruption-free business environment− A sense of equal opportunity− Low levels of environmental degradation (productive use of physical resources)
• Companies can positively affect many social issues
• There is a long-term synergy between economic and social objectives
Integrating Strategy and Society
Economic Objectives
Social Objectives
46 Copyright 2009 © Professor Michael E. Porter20091006 – Monterray Mexico.ppt
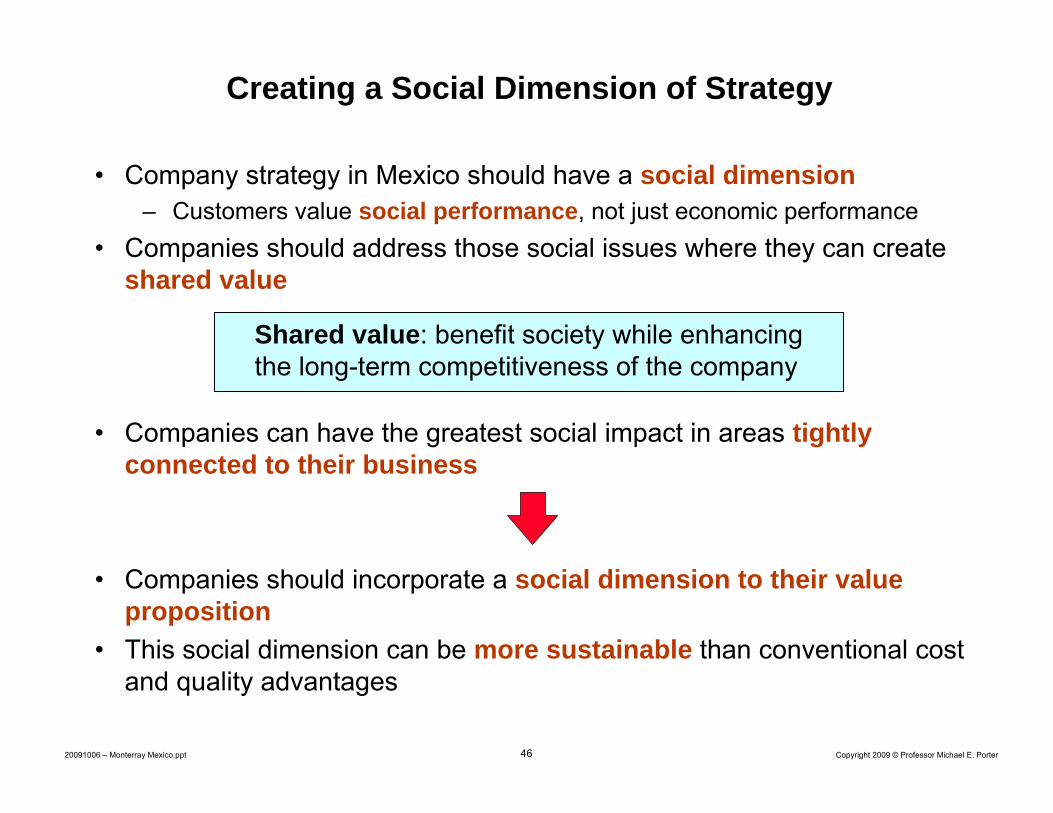
Creating a Social Dimension of Strategy
• Company strategy in Mexico should have a social dimension– Customers value social performance, not just economic performance
• Companies should address those social issues where they can create shared value
• Companies can have the greatest social impact in areas tightly connected to their business
• Companies should incorporate a social dimension to their value proposition
• This social dimension can be more sustainable than conventional cost and quality advantages
Shared value: benefit society while enhancing the long-term competitiveness of the company
47 Copyright 2009 © Professor Michael E. Porter20091006 – Monterray Mexico.ppt
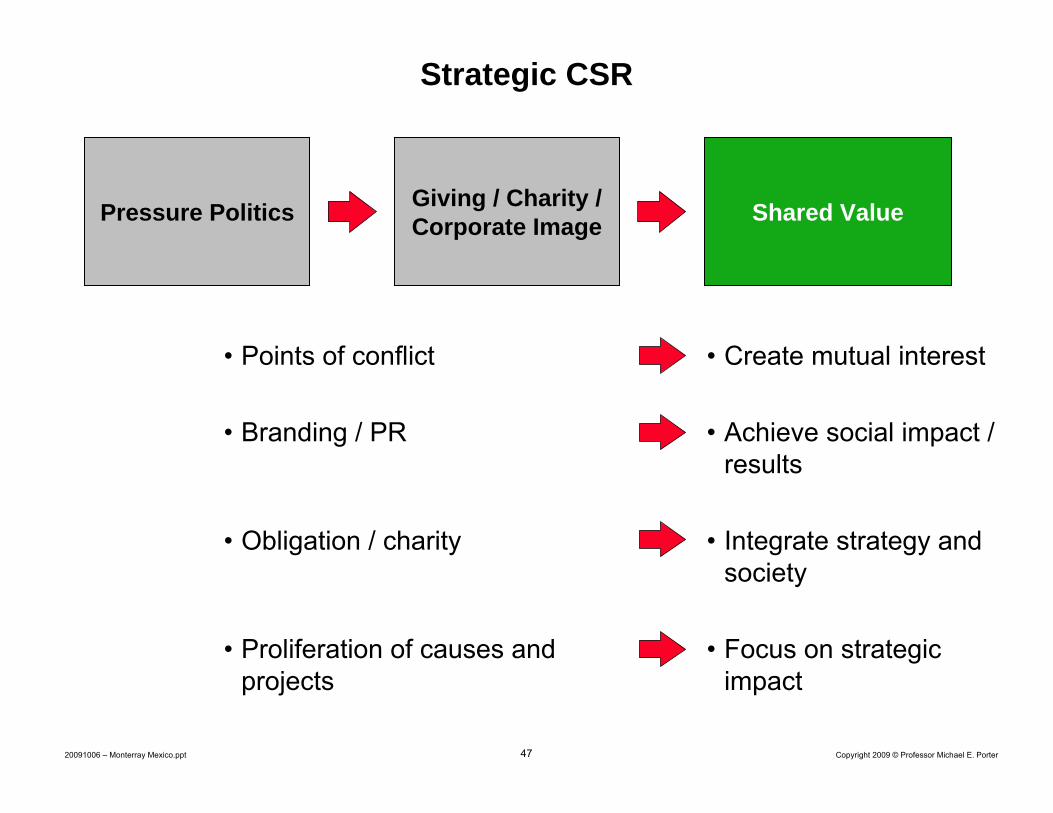
• Points of conflict
• Branding / PR
• Obligation / charity
• Proliferation of causes and projects
Strategic CSR
• Create mutual interest
• Achieve social impact / results
• Integrate strategy and society
• Focus on strategic impact
Pressure Politics Giving / Charity / Corporate Image Shared Value
48 Copyright 2009 © Professor Michael E. Porter20091006 – Monterray Mexico.ppt
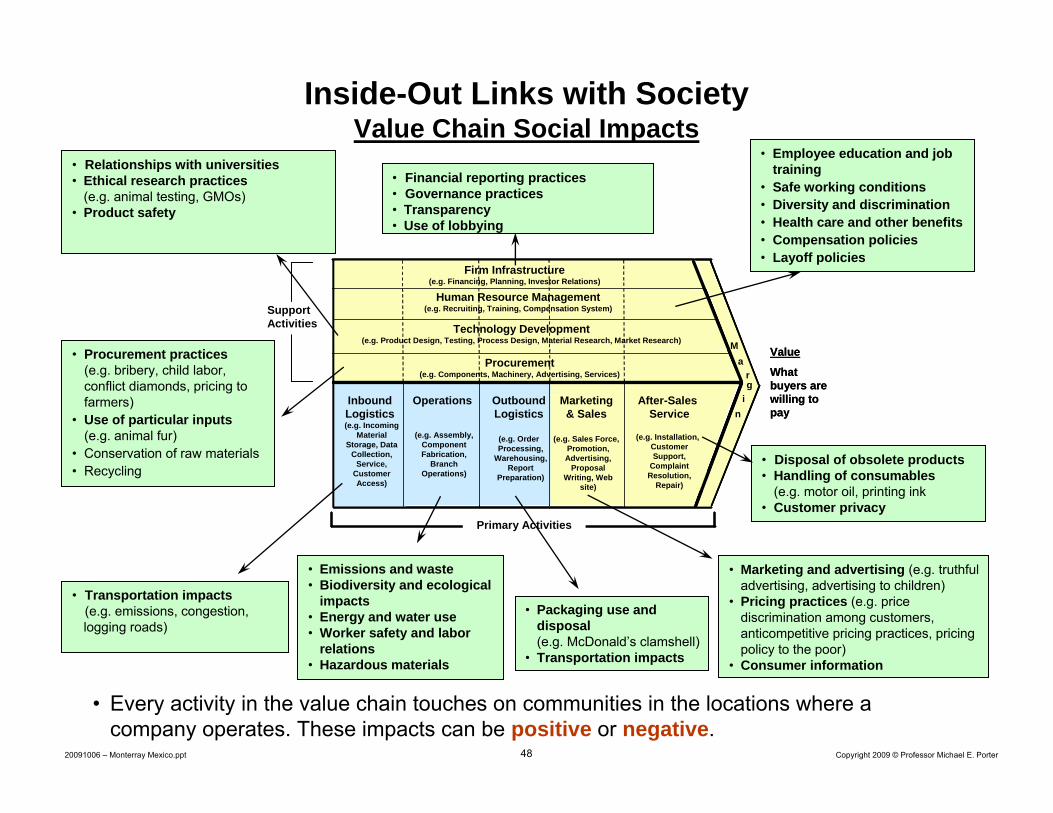
Inside-Out Links with SocietyValue Chain Social Impacts
InboundLogistics(e.g. Incoming
Material Storage, Data
Collection, Service,
Customer Access)
Operations
(e.g. Assembly, Component Fabrication,
Branch Operations)
OutboundLogistics
(e.g. Order Processing,
Warehousing, Report
Preparation)
Marketing& Sales
(e.g. Sales Force, Promotion, Advertising,
Proposal Writing, Web
site)
After-Sales Service
(e.g. Installation, Customer Support,
Complaint Resolution,
Repair)
Ma
rg
in
Primary Activities
SupportActivities
Firm Infrastructure(e.g. Financing, Planning, Investor Relations)
Procurement(e.g. Components, Machinery, Advertising, Services)
Technology Development(e.g. Product Design, Testing, Process Design, Material Research, Market Research)
Human Resource Management(e.g. Recruiting, Training, Compensation System)
Value
What buyers are willing to pay
InboundLogistics(e.g. Incoming
Material Storage, Data
Collection, Service,
Customer Access)
Operations
(e.g. Assembly, Component Fabrication,
Branch Operations)
OutboundLogistics
(e.g. Order Processing,
Warehousing, Report
Preparation)
Marketing& Sales
(e.g. Sales Force, Promotion, Advertising,
Proposal Writing, Web
site)
After-Sales Service
(e.g. Installation, Customer Support,
Complaint Resolution,
Repair)
Ma
rg
in
Primary Activities
SupportActivities
Firm Infrastructure(e.g. Financing, Planning, Investor Relations)
Procurement(e.g. Components, Machinery, Advertising, Services)
Technology Development(e.g. Product Design, Testing, Process Design, Material Research, Market Research)
Human Resource Management(e.g. Recruiting, Training, Compensation System)
InboundLogistics(e.g. Incoming
Material Storage, Data
Collection, Service,
Customer Access)
Operations
(e.g. Assembly, Component Fabrication,
Branch Operations)
OutboundLogistics
(e.g. Order Processing,
Warehousing, Report
Preparation)
Marketing& Sales
(e.g. Sales Force, Promotion, Advertising,
Proposal Writing, Web
site)
After-Sales Service
(e.g. Installation, Customer Support,
Complaint Resolution,
Repair)
Ma
rg
in
Primary Activities
SupportActivitiesSupportActivities
Firm Infrastructure(e.g. Financing, Planning, Investor Relations)
Procurement(e.g. Components, Machinery, Advertising, Services)
Technology Development(e.g. Product Design, Testing, Process Design, Material Research, Market Research)
Human Resource Management(e.g. Recruiting, Training, Compensation System)
Value
What buyers are willing to pay
• Financial reporting practices• Governance practices• Transparency• Use of lobbying
• Relationships with universities• Ethical research practices
(e.g. animal testing, GMOs)• Product safety
• Procurement practices (e.g. bribery, child labor, conflict diamonds, pricing to farmers)
• Use of particular inputs (e.g. animal fur)
• Conservation of raw materials• Recycling
• Transportation impacts(e.g. emissions, congestion, logging roads)
• Emissions and waste• Biodiversity and ecological
impacts• Energy and water use• Worker safety and labor
relations• Hazardous materials
• Packaging use and disposal (e.g. McDonald’s clamshell)
• Transportation impacts
• Employee education and job training
• Safe working conditions• Diversity and discrimination• Health care and other benefits• Compensation policies• Layoff policies
• Disposal of obsolete products• Handling of consumables
(e.g. motor oil, printing ink• Customer privacy
• Marketing and advertising (e.g. truthful advertising, advertising to children)
• Pricing practices (e.g. price discrimination among customers, anticompetitive pricing practices, pricing policy to the poor)
• Consumer information
• Every activity in the value chain touches on communities in the locations where a company operates. These impacts can be positive or negative.

49 Copyright 2009 © Professor Michael E. Porter20091006 – Monterray Mexico.ppt
Identifying Shared ValueOutside-In Social Impact on the Company
Source: Michael Porter, The Competitive Advantage of Nations, 1990
• Competitive context is often influenced by or inextricably linked with social conditions
• Availability of qualified human resources(Marriott’s job training)
• Access to specialized training programs• Efficient physical infrastructure• Efficient permitting and regulatory practices• Availability of scientific and technological
institutions (Microsoft’s Working Connections; Nestlé’s knowledge transfer to farmers)
• Sustainable access to natural resources(GrupoNueva’s water conservation)
• Efficient access to capital
• Fair and open local competition (e.g., the absence of trade barriers, fair regulations)
• Intellectual property protection• Transparency (e.g., financial reporting,
corruption: Extractive Industries Transparency Initiative)
• Rule of law (e.g., security, protection of property, legal system)
• Meritocratic incentive systems (e.g., antidiscrimination)
• Nature of local demand (e.g. appeal of social value propositions: Whole Foods’customers)
• Fair and demanding regulatory standards (California auto emissions & mileage standards)
• Local needs that can be served nationally and globally (Urbi’s housing financing, Unilever’s “bottom of the pyramid” strategy)
• Availability of local suppliers and support services (Sysco’s locally grown produce; Nestlé’s milk collection dairies)
• Access to partner firms in related fields• Access to a cluster instead of isolated
firms and industries
Context for Firm Strategy and Rivalry
Context for Firm Strategy and Rivalry
Related and Supporting Industries
Related and Supporting Industries
Factor(Input)
Conditions
Factor(Input)
ConditionsDemand
ConditionsDemand
Conditions
50 Copyright 2009 © Professor Michael E. Porter20091006 – Monterray Mexico.ppt
Mitigating Negative Value Chain Impacts
• Measure social impacts whenever possible
• Identify best practices in limiting harm across the value chain
• Make performance in social impacts of activities a responsibility of operating units

51 Copyright 2009 © Professor Michael E. Porter20091006 – Monterray Mexico.ppt
Creating Shared ValueNestlé
Nutrition
Water Rural Development
52 Copyright 2009 © Professor Michael E. Porter20091006 – Monterray Mexico.ppt
Corporate Role in Economic DevelopmentNestlé in India
• Nestlé’s history in the Moga region of India begins in 1962, when the region was in severe poverty
• Local milk supply was hampered by small parcels of land, poor soil, periodic droughts, animal disease, and lack of a commercial market
• Nestlé established local milk purchasing organizations in each town• Nestlé invested in improving competitive context
– Collection infrastructure such as refrigerated dairies was accompanied by veterinarians, nutritionists, agronomists, and quality assurance experts to assist small farmers
– Medicines and nutritional supplements were provided to improve animal health– Monthly training sessions were held for local farmers– Wells to secure water supply for animals were dug with financing and technical
assistance from Nestlé• Nestlé has built a productive milk cluster in Moga, and buys milk from more
than 75,000 farmers in the region through 650 dairies in local villages
• Moga has advanced its economic development versus other nearby regions• Nestlé has developed a long-term competitive advantage in the milk cluster
in numerous developing countries

53 Copyright 2009 © Professor Michael E. Porter20091006 – Monterray Mexico.ppt
Strategy in Economic Downturns
• Create a positive agenda
• Refocus on strategy
• Return to economic fundamentals
• Downsize to a strategy, not across the board
• Do not overreact to distressed industry conditions
• Use the downturn to get things done that would be more difficult in normal times
• Position for long term economic performance, not near term stock price
• Seize opportunities for discontinuities which are more likely to emerge
• Strategy is more important in downturns, not less