Embed Size (px)
Citation preview

i
Comparison of two Fluoroscopic Systems used for
EVAR Procedures
- an Approach to Analyze
X-ray Image Quality
Limited to Tube Output
ELL INOR WEMMERT
Master of Science Thesis in Medical Engineering Stockholm 2014

ii

iii
This master thesis project was performed in collaboration with
Region Skåne
First Supervisor at Region Skåne: Per-Anders Larsson
Co Supervisor at Region Skåne: Magnus Olsson
Comparison of two Fluoroscopic Systems used for EVAR Procedures
- an Approach to Analyze X-ray Image Quality Limited to Tube Output
Jämförelse av två fluoroskopisystem som
används för EVAR-ingrepp - ett tillvägagångssätt för att analysera
bildkvalitet begränsat till röntgenstrålningens egenskaper
E L L I N O R W E M M E R T
Master of Science Thesis in Medical Engineering
Advanced level (second cycle), 30 credits
Supervisor at KTH: Massimiliano Colarieti-Tosti
Examiner: Mats Nilsson
School of Technology and Health
TRITA-STH. EX 2014:62
Royal Institute of Technology
KTH STH
SE-141 86 Flemingsberg, Sweden
http://www.kth.se/sth

iv

v
Abstract
Image quality in medical x-ray imaging is dependent on the characteristics of the x-ray photons
produced by the x-ray tube, the detection of the x-ray photons in the detector and the image
processing. X-ray image guidance during endovascular interventions is usually performed with C-
arm fluoroscopy. It is of major importance that the image quality is sufficient for the procedure. The
understanding of what affects the image quality could be made easier if the performance of the
different parts of the system were to be judged separately, rather than considering the system as a
whole.
The term Image QualityTube Output that is used throughout this thesis describes the image quality that
only depends on the characteristics of the x-ray beam, such as spectral distribution and fluence,
without the consideration of detector characteristics or image processing. The aim of this thesis was
to propose a method to evaluate the Image QualityTube Output and then compare two different
fluoroscopy systems used for endovascular interventions with respect to Image QualityTube Output,
patient dose and personnel exposure, all as a function of patient thickness.
To limit to the x-ray tube output a third x-ray system was used. In that way detector and image
processing would be the same and the differences in image quality would only be due to the tube
output. The imaging parameters set by the Automatic Dose Rate Control, ADRC, for various patient
thicknesses, was found by using Polymethyl-methacrylate, PMMA, as patient. A test object was
introduced and exposed together with the PMMA of varying thickness, using the parameters set by
the ADRC. The images were evaluated with respect to low contrast sensitivity and contrast to noise
ratio, CNR. The effective dose rate to the patient was calculated using Monte Carlo simulation.
Finally, the personnel exposure was measured using active dosimeters.
The results showed differences in the systems performance and Image QualityTube Output. Also
interesting differences in the effective dose rate to the patient was found. Altogether the results
indicate that the proposed method is a feasible way to compare the Image QualityTube Output of two
fluoroscopic systems.

vi

vii
Sammanfattning
Bildkvalitet i medicinsk röntgenavbildning beror på karakteristiken hos röntgenfotonerna som
produceras i röntgenröret, detektionen av röntgenfotonerna i detektorn och bildprocessningen.
Röntgenvägledning under endovaskulära interventioner fås vanligtvis med ett fluoroskopisystem, en
så kallad C-båge. Det är av stor vikt att bildkvaliteten är tillräckligt för ingreppet. Förståelsen för
vad som påverkar bildkvalitet skulle kunna göras lättare om prestandan för de olika delarna skulle
bedömmas var för sig, istället för att se till systemet som helhet.
Begreppet Image QualityTube Output används för att beskriva bildkvaliteten som endast beror på
röntgenstrålens karakteristik, såsom spektralfördelning och fluens, utan hänsyn tagen till detektorns
karakteristik eller bildprocessning. Syftet med detta examensarbete har varit att föreslå en metod för
att uppskatta Image QualityTube Output och sedan även jämföra två fluoroskopisystem som används för
endovaskulära interventioner med avseende på Image QualityTube Output, patientstråldos och
personalstråldos, allt som funktion av patienttjocklek.
För att begränsa till röntgenstrålningens egenskaper användes ett tredje röntgensystem. På så sätt
blev detektor och bildprocessning samma och skillnaden i bildkvalitet berodde bara på
röntgenstrålningens egenskaper. Bildparametrarna som bestäms av dosautomatiken för varierande
patienttjocklek hittades genom att använda Polymethyl-methacrylate, PMMA, som patient. Ett
testobjekt introducerades och exponerades tillsammans med PMMA av varierande tjocklek, med
parametrarna som dosautomatiken gav. Bilderna utvärderades sedan med avseende på
lågkontrastupplösning och kontrast till brusförhållande, CNR. Den effektiva dosen till patienten
beräknades med hjälp av Monte Carlo simulering. Slutligen mättes personalstråldoserna med aktiva
dosimetrar.
Resultaten visade på skillnader i prestanda och Image QualityTube Output. Även intressanta skillnader i
den effektiva dosraten till patienten hittades. Sammantaget indikerar resultaten att den föreslagna
metoden är en tänkbar väg för att jämföra Image QualityTube Output för två fluoroskopisystem.

viii

ix
Acknowledgements
This Master thesis is written within the Medical Engineering program at the Royal Institute of
Technology (KTH). It has been performed in collaboration with Region Skåne and was carried out
at the hospital of Helsingborg.
I would like to start by sincerely thanking Per-Anders Larsson for making it possible for me to write
my Master thesis at the hospital of Helsingborg. Further, I would like to express my gratitude to
Magnus Olsson for his invaluable support during this project.
I would also like to thank Massimiliano Colarieti-Tosti for his comments along this project that
have contributed to the final result.
Finally, I would like to thank my family and friends for their support throughout this project.

x

xi
Abbreviations
AAA Abdominal Aortic Aneurysm
AAPM American Association of Physicists in Medicine
ADRC Automatic Dose Rate Control
AK Air Kerma - kinetic energy released per unit mass of air
Al Aluminum
ALARA As Low As Reasonably Achievable
AP Anterior-Posterior
CR Computed Radiography
CT Computed Tomography
Cu Copper
DAP Dose Area Product
DICOM Digital Imaging and Communications in Medicine
DSA Digital Subtraction Angiography
EVAR Endovascular Aortic Repair
Hp(d) Personal dose equivalent at depth d mm
ICRP International Commission on Radiological Protection
IEC International Electrotechnical Commission
ISO International Organization for Standardization
mAs Product of tube current, mA, and exposure time, s
NR Number of Recursions
PACS Picture Archiving and Communication System
PMMA Polymethyl-methacrylate
PW Pulse Width
ROI Region of Interest
SID Source to Image receptor Distance

xii
SNR Signal to Noise Ratio
STUK Radiation and Nuclear Safety Authority in Finland
wR Radiation weighting factor
wT Tissue weighting factor

xiii
Table of contents
1 Introduction ................................................................................................................................ 1
2 Background ................................................................................................................................. 3
2.1 C-arm Fluoroscope ................................................................................................................ 3
2.2 Generation of an X-ray Image ............................................................................................... 3
2.3 Image Quality ........................................................................................................................ 5
2.3.1 Contrast .......................................................................................................................... 5
2.3.2 Noise ............................................................................................................................... 6
2.4 Automatic Dose Rate Control................................................................................................ 7
2.5 Radiation Exposure................................................................................................................ 8
2.5.1 Effect of Ionizing Radiation on Biological Tissue ......................................................... 9
2.5.2 Patient Radiation Exposure .......................................................................................... 10
2.5.3 Personnel Exposure ...................................................................................................... 10
3 Method ....................................................................................................................................... 13
3.1 C-arm Fluoroscope Equipment ............................................................................................ 13
3.2 Investigation of the Automatic Dose Rate Control .............................................................. 13
3.3 Image QualityTube Output ......................................................................................................... 14
3.3.1 Reproduction on a Conventional X-ray System ........................................................... 15
3.3.2 Low Contrast Sensitivity .............................................................................................. 16
3.3.3 Contrast to Noise Ratio ................................................................................................ 17
3.4 Patient Radiation Exposure ................................................................................................. 17
3.5 Personnel Exposure ............................................................................................................. 19
3.5.1 Philips DoseAware ....................................................................................................... 19
3.5.2 Analysis of the Irradiation Situation ............................................................................ 23
3.5.3 Size and Location of the Radiation Field ..................................................................... 23
4 Results ....................................................................................................................................... 25
4.1 Fluoroscopy Mode ............................................................................................................... 25
4.2 Image Acquisition Mode ..................................................................................................... 27
4.3 Image QualityTube Output ......................................................................................................... 28
4.3.1 Compare Fluoroscopy .................................................................................................. 28
4.3.2 Compare Image Acquisition ......................................................................................... 29
4.4 Patient Radiation Exposure ................................................................................................. 30

xiv
4.5 Personnel Exposure ............................................................................................................. 32
4.5.1 Correction Factors for Dosimeters ............................................................................... 32
4.5.2 Analysis of the Irradiation Situation ............................................................................ 33
4.5.3 Size and Location of the Radiation Field ..................................................................... 33
4.5.4 Measured Personnel Exposure ..................................................................................... 35
5 Discussion .................................................................................................................................. 37
5.1 Fluoroscopy Mode ............................................................................................................... 37
5.2 Image Acquisition Mode ..................................................................................................... 38
5.3 Proposed Method for Comparing Image QualityTube Output of Fluoroscopic Systems .......... 38
5.3.1 Fluoroscopy Mode ........................................................................................................ 38
5.3.2 Image Acquisition Mode .............................................................................................. 39
5.4 Reasons for Errors ............................................................................................................... 39
5.5 Future Studies ...................................................................................................................... 41
6 Conclusion ................................................................................................................................. 43
References ......................................................................................................................................... 45
Appendix ...............................................................................................................................................
Appendix A – Abdominal Aortic Aneurysm and Endovascular Aortic Repair ..................................
Appendix B – Weighting Factors .......................................................................................................
Appendix C – C-arm Facts .................................................................................................................
Appendix D – PMMA Thicknesses ....................................................................................................
Appendix E – Recursion of Ziehm Vision RFD Image Acquisition Mode ........................................
Appendix F – Contrast Discs .............................................................................................................
Appendix G – Technical Data for Dosimeters ...................................................................................
Appendix H – Measurement Results Personnel Exposure .................................................................

1
1 Introduction
The development of stents and stent grafts that have taken place in recent years has allowed for
several vascular medical conditions to be treated using minimally invasive endovascular technique
as an alternative to open surgery [1]. During an endovascular intervention the surgeon gets access to
the vascular tree through percutaneous catheterization and in combination with x-ray image
guidance, usually given by a C-arm fluoroscope, it is possible to, for example, locate and dilate
constricted vessels and repair aneurysms.
The C-arm system provides the surgeon with real time images which makes it possible to steer
guide wires and catheters in the right direction. Also better images of the vessels can be obtained
through the injection of contrast agents. With that said, the C-arm is crucial to perform a successful
endovascular intervention, and it is of major importance that the image quality is sufficient for the
procedure.
The image quality is dependent on the characteristics of the x-ray photons produced by the x-ray
tube, the detection of the x-ray photons in the detector and the image processing. The term Image
QualityTube Output that is used throughout this thesis describes the image quality that only depends on
the characteristics of the x-ray beam, such as spectral distribution and fluence, without the
consideration of detector characteristics or image processing. The aim of this thesis was to propose
a method to evaluate the Image QualityTube Output and then compare two different fluoroscopy
systems used for endovascular interventions with respect to Image QualityTube Output, patient dose
and personnel exposure, all as a function of patient thickness.

2

3
2 Background
C-arms and the production and characteristics of x-ray photons are central parts of this thesis. This
background section will therefore provide basic knowledge on C-arms as well as the production of
x-ray photons and their characteristics. Further, x-ray photons are ionizing radiation and the persons
who are exposed to it are put at risk. Therefore, patient and personnel exposure will also be covered.
2.1 C-arm Fluoroscope
The image guidance during endovascular interventions is usually given by a C-arm fluoroscope. A
C-arm consists of a semi-circular bow, a C, with an x-ray tube attached at one end and a detector at
the other, see figure 1. It can be rotated in different directions to get various projections of the
imaged volume.
The C-arm offer several modes of operation, however this thesis is limited to fluoroscopy and the
image acquisition mode Digital Subtraction Angiography, DSA. In the fluoroscopy mode several
images are taken every second and they are presented in real time on a monitor so the surgeon can
follow the guide wires and catheters as they are inserted. The fluoroscopy mode must offer at least
two different dose modes [2] for the operator to choose between. The high dose mode gives better
image quality but at the cost of more radiation dose to the patient, compared to the low dose mode.
The image acquisition mode is used when better images of the vessels are needed.
The C-arms studied in this thesis are used for Endovascular Aortic Repair, EVAR, to repair
Abdominal Aortic Aneurysm, AAA. More information on EVAR and AAA can be found in
appendix A.
2.2 Generation of an X-ray Image
X-rays are produced in the x-ray tube when the operator activates the footswitch or the hand held
control. Electrons are then emitted from the cathode and accelerated towards the anode by the
potential difference, the tube potential. When the electrons strike the anode they are deaccelerated
Detector
X-ray tube
Figure 1 – Schematic figure of a C-arm fluoroscope.

4
by coulombic forces and an x-ray photon of energy equal to the loss in kinetic energy is produced.
However, most of the energy is converted into heat and approximately 1 % is transferred into x-ray
photons. [3]
The x-ray photons that are produced are not monoenergetic but rather a broad spectrum of photon
energies beneath the tube potential is represented. The maximum energy of the x-ray photons is
determined by the tube potential, and for a fixed tube potential the amount of x-ray photons
produced per time unit are determined by the tube current. [3]
As the x-ray photons leave the x-ray tube the x-ray spectrum is affected by the inherent filtering of
the x-ray tube and the shape of the spectrum can be further modified by inserting spectral shaping
filter into the beam, see figure 2. As the beam passes through the spectral filtering material, for
example aluminum or copper, the low energetic photons are absorbed more causing a raise in
average beam energy and in the same time a decrease in photon fluence. [4]
Figure 2 – Schematic figure of the energy distribution of the x-ray beam photons with and without spectral filtration. [4]
There are two reasons for inserting spectral filter into the beam. First, low energetic x-ray photons
are less likely to be transmitted through the patient and contribute to the detected image. Hence, low
energetic photons will only contribute to dose to the patient. To reduce the dose, low energetic x-ray
photons can be filtered out of the beam using spectral shaping filter. [4]
The second reason for using spectral filtration is technical. The x-ray tube has a lower limit for the
tube current possible to produce. In cases where a lower tube current than possible is desired,
spectral filter can be used to make sure the radiation that passes through the filter is as low as it
would have been for the desired tube current. [5]
The x-ray photons that are transmitted through the patient and reach the detector can be divided into
primary and scattered radiation. The transmitted primary radiation has passed through the patient
without interaction and, hence, without a change in direction. The scattered radiation, however, has
interacted with the patient with loss in energy and changed direction as a result. The primary
radiation makes up the image whereas the scattered radiation will only reduce image quality by
lowering the contrast. The amount of scattered radiation depends on the volume of the patient, and
increases with increasing patient volume. [6]

5
2.3 Image Quality
In medical x-ray imaging the question about good image quality is not whether the image looks
subjectively good but rather its usefulness in determining an accurate diagnosis [3]. Image quality
in this thesis is defined as low contrast sensitivity and contrast to noise ratio, CNR.
2.3.1 Contrast
In medical x-ray imaging contrast is what makes it possible to separate different objects or an object
from its background. If a volume that contains a contrast detail is irradiated with N x-ray photons,
then the photons that have been transmitted through the volume where the contrast object is not
present forms the background, and the signal is formed by the photons that have been transmitted
through the contrast object, see figure 3.
Figure 3 – The formation of background and signal in an x-ray image.
The number of x-ray photons that are transmitted through the volume depends on the linear
attenuation coefficient, µ, and the thickness, x, of the interacting material, as given by equation (1)
and (2).
𝑏𝑎𝑐𝑘𝑔𝑟𝑜𝑢𝑛𝑑 = 𝑁𝑒−𝜇𝑏𝑥𝑏 (1)
𝑠𝑖𝑔𝑛𝑎𝑙 = 𝑁𝑒−(𝜇𝑏(𝑥𝑏−𝑥𝑑)+𝜇𝑑𝑥𝑑) (2)
where xb is the thickness of the background volume and xd is the thickness of the contrast detail. [3]
Hence, the contrast can be described by equation (3).
𝐶 =
𝑏𝑎𝑐𝑘𝑔𝑟𝑜𝑢𝑛𝑑 − 𝑠𝑖𝑔𝑛𝑎𝑙
𝑏𝑎𝑐𝑘𝑔𝑟𝑜𝑢𝑛𝑑
(3)
Different materials have different linear attenuation coefficients and, hence, attenuate the x-ray
photons to a different extent. A high linear attenuation coefficient attenuates x-ray photons to a
greater extent than a lower linear attenuation coefficient. Further, the linear attenuation coefficient is
photon energy dependent. With an increase in energy the linear attenuation coefficient decreases,
see figure 4, and more x-ray photons are transmitted. High difference in linear attenuation
coefficients between imaged objects gives high contrast. The difference in linear attenuation
N photons
background signal

6
coefficient normally increase at low energies, therefore, low photon energies will give a better
image contrast. However, the photon energy has to be high enough for a sufficient amount of x-ray
photons to be transmitted through the imaged volume and, hence, reach the detector.
Figure 4 – Attenuation coefficient vs. photon energy. [4]
For human soft tissue the linear attenuation coefficients are close to each other, for example that of
vessels/blood are close to that of the surrounding soft tissue, causing the contrast to be low.
However, the contrast can be enhanced through the injection of contrast agents into the vessels. In
angiography, agents containing iodine are commonly used since the linear attenuation coefficient of
iodine is quite different from soft tissue, see figure 4.
2.3.2 Noise
Noise in medical x-ray images refers to the variations in the level of gray that is not caused by the
structures being imaged [6]. It can be described as a variation of the pixel content in the background
as given by equation (4). [5]
𝑁𝑜𝑖𝑠𝑒 =
𝜎(𝑏𝑎𝑐𝑘𝑔𝑟𝑜𝑢𝑛𝑑)
𝑏𝑎𝑐𝑘𝑔𝑟𝑜𝑢𝑛𝑑
(4)
where background is, as in figure 3, the part of the image where the x-ray photons have not been
transmitted through the contrast object, and 𝜎 is the standard deviation of the pixel content in the
background. Dividing by the background gives a normalized value.
The use of fluoroscopic x-ray image guidance during endovascular interventions exposes the patient
to radiation. In order to keep the patient dose reasonably low throughout the procedure, the
fluoroscopy system should be set to the lowest possible dose giving acceptable image quality. With
low number of x-ray photons used the signal to noise ratio, given by equation (5), will be low.

7
𝑆𝑁𝑅 = √𝑁
(5)
where N is the number of x-ray photons per detector element. [3]
When the signal decrease the noise will increase with respect to the signal which will result in a
decrease in contrast. Further, there are additional sources of noise, such as anatomical noise, that
also acts to reduce the contrast. The Contrast to Noise Ratio, CNR, given by equation (6) provides
an overall measure of the noise in relation to the contrast.
𝐶𝑁𝑅 =
|𝑏𝑎𝑐𝑘𝑔𝑟𝑜𝑢𝑛𝑑 − 𝑠𝑖𝑔𝑛𝑎𝑙|
𝜎(𝑏𝑎𝑐𝑘𝑔𝑟𝑜𝑢𝑛𝑑)
(6)
where background and signal is as in figure 3, and 𝜎 is the standard deviation of the pixel content in
the background. [5]
2.4 Automatic Dose Rate Control
C-arms used during image guided interventional procedures make use of Automatic Dose Rate
Control, ADRC, that controls the x-ray tube output through automatically varying imaging
parameters like tube potential, tube current and spectral filtration to get a desired detector dose. The
dose to the detector, defined as air kerma, AK, at the entrance surface of the detector, is supposed to
be kept at a constant level to maintain an application-dependent balance of image quality and
patient dose. [5] The surgeon can chose between different dose modes that affect both patient dose
and image quality. For a chosen dose mode the image quality and patient dose depends on the size
of the patient.
During a fluoroscopy run the difference between the measured and predefined detector output is
continuously calculated and to maintain the predefined dose to the detector the ADRC needs to
increase or decrease the x-ray tube output through adjusting the imaging parameters. The tube
potential and the tube current increase/decrease together after certain predefined control curves, see
figure 5. Tube potential and tube current can increase until a certain point at which the maximum
power output of the x-ray tube is reached. After the maximum power has been reached the tube
potential can only continue to increase if there is a simultaneous decrease in the tube current so that
the power is kept at its maximum. [5] How the curves are defined differs between different
manufacturers and it is a tradeoff between image quality and patient dose.

8
Figure 5 – Example of x-ray generator control curves for fluoroscopy. [7]
Modern C-arms offer a number of different applications for the user to choose between and the
application most suitable for the procedure is chosen. Each application has its specially defined
detector output, hence, dose and image quality is application dependent. [5]
2.5 Radiation Exposure
The use of x-ray image guiding equipment during interventional procedures directly exposes
patients to ionizing radiation and indirectly exposes the personnel to ionizing radiation through
scattered radiation from the patient. The intensity of the x-rays is dependent on the distance from
the source and decreases rapidly with an increase in distance. The intensity can be expressed by the
inverse square law, see equation (7).
𝐼2
𝐼1=
𝑑22
𝑑12
(7)
where I1 is the intensity at distance d1 from the source and I2 is the intensity at distance d2 from the
source [8]. Hence, if the distance to the source is doubled the x-ray intensity decreases to a quarter,
see figure 6.
Figure 6 – The intensity of the x-rays is dependent on the distance from the source. The intensity follows the inverse square
law.
9
2.5.1 Effect of Ionizing Radiation on Biological Tissue
The effect of the ionizing radiation on biological tissue can be divided into two parts, stochastic and
deterministic. Deterministic effects occur above a certain threshold and results in an acute damage
to a tissue or organ. There is no threshold value for the stochastic effect of radiation induced cancer,
even small amounts of radiation presents a risk. [9]
The risk of inducing cancer depends both on the tissue being irradiated and the type of radiation
used. Different tissues have different sensitivity to ionizing radiation and this is described by the
tissue weighting factor, wT. The more sensitive a specific tissue is to ionizing radiation, the higher
the wT. WT for different tissues can be found in appendix B. Different types of radiation affect
biological tissues to a different extent and the radiation weighting factor, wR is used to describe this,
however the wR for photons are 1. [9]
The radiation exposure dose can be described in three different ways: absorbed dose, equivalent
dose and effective dose, see below and table 1. Equivalent and effective doses are used to relate
radiation dose to risk. [9]
International Commission on Radiological Protection, ICRP, [9] defines absorbed dose, D, as the
energy absorbed per unit mass, see equation (8).
𝐷 =
𝑑𝜀̅
𝑑𝑚
(8)
where dε is the mean energy imparted (energy going in – energy going out) by ionizing radiation to
the matter in a volume element and dm is the mass of the matter in this volume element. The unit
for absorbed dose is Gray (Gy).
Further, ICRP [9] defines equivalent dose, HT, as the absorbed dose in tissue or organ T weighted
for the type of radiation R, see equation (9).
𝐻𝑇 = ∑ 𝑤𝑅𝐷𝑇,𝑅
𝑅
(9)
where DT,R is the absorbed dose averaged over tissue or organ T, due to radiation R and wR is the
radiation weighting factor. The unit for equivalent dose is Sievert (Sv).
Finally, ICRP [9] defines effective dose, E, as the sum of the weighted equivalent doses in all the
tissues and organs of the body from internal and external exposure, see equation (10).
𝐸 = ∑ 𝑤𝑇𝐻𝑇 = ∑ 𝑤𝑇 ∑ 𝑤𝑅𝐷𝑇,𝑅
𝑅𝑇𝑇
(10)
where HT is the equivalent dose to the tissue or organ T, DTR is the absorbed dose averaged over
tissue or organ T due to radiation R, wR is the radiation weighting factor and wT is the tissue
weighting factor. The unit for effective dose is Sievert (Sv).

10
Table 1 – Definition of absorbed dose, equivalent dose and effective dose
Type of dose Definition
Absorbed dose Energy absorbed per unit mass
Equivalent dose Absorbed dose in tissue or organ T weighted for the type of radiation R
Effective dose The sum of the weighted equivalent doses in all tissues and organs of the body
2.5.2 Patient Radiation Exposure
During image guided interventional procedures patients are exposed to higher doses of radiation
than during conventional x-ray examinations. The relatively high radiation dose is delivered to a
small area and, therefore, there is a risk of inducing deterministic injury in terms of damage to the
skin. Depending on severity a skin transplant might be necessary. Also the risk of stochastic effects,
like cancer, is higher for image guided interventional procedures compared to regular angiography,
used for diagnostic purposes. [2]
To put the patient at as little risk as possible the dose to the patient should be kept as low as
possible. The As Low As Reasonably Achievable, ALARA, principle applies to C-arms and the
surgeon use the lowest dose mode possibly to still get an adequate image. Also, irradiation does not
take place during the entire procedure, just when needed.
The effective dose to the patient can be calculated using suitable computer software. [9]
2.5.3 Personnel Exposure
2.5.3.1 Scattered Radiation
The main source to scattered radiation that reaches the personnel is the patient since the patient
functions as a scattering volume. The larger the patient the larger the scattering volume and also the
x-ray output will be higher due the ADRC, hence, the amount of scattered radiation increases
rapidly with increased patient volume. Further, most of the scattered radiation is scattered in the
direction back towards the x-ray tube. For that reason the x-ray tube is normally placed below the
patient and the detector above. [8]
During x-ray image guided interventional procedures the scattered radiation is within an energy
interval of 20-100keV. The energy spectrum of the scattered radiation is displaced approximately 10
keV towards the low energy region compared to the spectrum of the primary radiation. The fluence
of the scattered radiation reaching the personnel is less than 1 % compared to the fluence of the
primary spectrum that reach the patient. [10]
Even though the fluence of scattered radiation is low, the personnel should be protected by radiation
protection aprons, thyroid radiation protection collar, and radiation protective eyewear in
combination with a reasonable large distance to the patient. Further there are mobile and overhead
x-ray protection screens for the personnel to work with.
2.5.3.2 Dose Limits
Personnel working in environments where there is a risk of exposure to ionizing radiation are only
allowed to be exposed to certain doses. The doses are restricted by recommendations from ICRP

11
Table 2 - Equivalent and effective doses can be estimated using
personal dose equivalent Hp(d), where d is the dose equivalent in
soft tissue at a point in the depth d mm in the human body.
and in the latest publication [9], it was recommended that the effective dose to the personnel should
not exceed 20 mSv per year over a period of 5 years, giving a total effective dose of 100 mSv in 5
years. Also the effective dose is recommended not exceed 50 mSv in a single year. [9]
Equivalent and effective doses can be
estimated using personal dose equivalent
Hp(d), see table 2. Hp(d) is the dose
equivalent in soft tissue at a point in the
depth d mm in the human body.
Hp(0.07) is used to estimate the
equivalent dose to the skin and to the
hands and feet, and Hp(3) can be used
for estimating the equivalent dose to the
lens of the eye. Hp(10) is used to estimate the effective dose. [9]
2.5.3.3 Dosimetry Systems
There are two different types of dosimetry systems: passive and active. Personnel working in
environments where there is a risk of exposure to ionizing radiation wears passive dosimeters, that
measures Hp(10), to estimate the effective dose. The dosimeter is read out after the end of the
measuring period, approximately one month. [10] The effective dose to the surgeons working with
interventional procedures at the hospital of Helsingborg is in the order of 1-2 mSv per year [11].
Unlike passive dosimeters, active dosimeters display radiation exposure in real time. They are used
for educational purposes to make the personnel aware of how their actions affect the received dose.
Active dosimeters are associated with larger uncertainties than passive dosimeters and for that
reason they are only used for educational purposes, alternatively for rougher estimates of doses.
[10]
Both passive and active dosimeters are calibrated to specific energies according to ISO 4037
standards and are calibrated to measure a specific Hp(d). The calibration of both energy and depth
need to be appropriate to the irradiation situation in which it is intended to be used. [10]
d (mm) Estimates
0.07 Equivalent dose to the skin, hands and feet
3 Equivalent dose to the lens of the eye
10 Effective dose

12

13
3 Method
The aim of this thesis was to propose a method to evaluate the Image QualityTube Output and then
compare the Image QualityTube Output, patient dose, and personnel exposure of two C-arm systems, all
as a function of patient thickness. The term Image QualityTube Output that is used throughout this
thesis describes the image quality that only depends on the characteristics of the x-ray beam, such
as spectral distribution and fluence, without consideration of detector characteristics and image
processing.
In order to make a proper comparison of the Image QualityTube Output, the performance of both C-arm
systems need to be investigated using the same detector and also using the same image processing.
Literature studies were performed to find a method for how to compare the Image QualityTube Output
of two x-ray systems, but no such method was found.
Since the detector and image processing needed to be the same in both cases, the solution proposed
in this thesis was to produce images on a third x-ray system. Using a third x-ray system the same
detector and image processing were used and the only differences in the images would be due to the
difference in tube output. The imaging parameters set by the ADRC of the two C-arm systems for
different thickness of polymethyl-methacrylate, PMMA, were used, with necessary adaption, on the
third x-ray system. The images produced could then be used to evaluate and compare the Image
QualityTube Output. The third x-ray system used was not a fluoroscopic system but a conventional one.
3.1 C-arm Fluoroscope Equipment
In this report two different types of C-arm systems, one stationary and one mobile, were used. Both
C-arms studied are used for EVAR procedures at the hospital of Helsingborg. The stationary C-arm
is Philips Allura Xper FD20, and the mobile C-arm is Ziehm Vision RFD Hybrid. Information about
the C-arms can be found in appendix C.
3.2 Investigation of the Automatic Dose Rate Control
To be able to compare the Image QualityTube Output of the two C-arms the imaging parameters, tube
potential, tube current, and spectral filtration were to be reproduced on the conventional x-ray
system. The parameters were found by noting the imaging parameter settings of the Automatic Dose
Rate Control, ADRC, of the two C-arm systems as a function of PMMA thickness.
A PMMA phantom consisting of multiple quadratic plates with sides equal to 30 cm was used to
simulate a patient. The thickness of the PMMA phantom was varied from 11 cm to 36 cm in steps
of approximately 2 cm. The various PMMA thicknesses used can be found in appendix D. 11 cm
PMMA is assumed to represent a very small patient and 36 cm PMMA a very large patient. The
function of the ADRC depends on the application chosen. This thesis focuses on the applications
used for EVAR procedures.
The imaging parameter settings of the ADRC for Philips Allura Xper were investigated for all
fluoroscopy dose modes: low, normal and high for the application Buk frontal 3b/s. The values of

14
tube potential, tube current and beam spectral filtration were noted. Also the tube potential and mAs
values for the image acquisition mode were noted. All values were noted as a function of PMMA
thickness.
The imaging parameter settings of the ADRC for Ziehm Vision RFD were investigated for the one
and only dose mode used for EVAR procedures for the application Vaskulär central. The values for
tube potential, tube current, pulse width, and pulse rate were noted. Also the image acquisition
mode was investigated and the same parameters as for the fluoroscopy mode were noted. All values
were noted as a function of PMMA thickness.
Since Ziehm Vision RFD is a mobile C-arm it was moved into the room where the Philips Allura
Xper C-arm is situated, allowing for the same tabletop to be used during both investigations. The
mattress was removed from the table, and the PMMA phantom was built upwards with the height of
the tabletop left unchanged with respect to the floor. The distance between the focal spot and the
tabletop was set to 67.2 cm. The experimental set up can be seen in figure 7.
Figure 7 – Schematic figure of the experimental set up for the investigation of ADRC settings as a function of PMMA
thickness.
For both C-arm systems the assumption was made that the values, of the above mentioned
parameters, shown on the monitors were the true values. Further, the assumption was made that the
value of the tube potential was the average value during the pulse. However, there was a need to
investigate the displayed value of the tube current. Since the fluoroscopy is pulsed, the tube current
can be presented as either the tube current during the pulse or continuous equivalent tube current.
The tube current of Ziehm Vision RFD was investigated by observing how a change in pulse length
affected the Dose Area Product, DAP, when tube current and tube potential was left unchanged. For
Philips the ratio mAs/AK was decided for fluoroscopy mode and a single exposure and the values
were then compared.
3.3 Image QualityTube Output
In this thesis the image quality is defined as low contrast sensitivity and contrast to noise ratio,

15
CNR, and these parameters were used to evaluate the Image QualityTube Output. The evaluation of the
Image QualityTube Output was only performed for those PMMA thicknesses that were found to
correspond to a mass of a patient exceeding 50 kg since it is not a problem to get x-ray images of
sufficient quality for thin patients.
3.3.1 Reproduction on a Conventional X-ray System
The imaging parameters found during the investigation of the ADRC was reproduced on a Mediel
x-ray system with a CXDI 31 portable detector. The investigation was performed using the same
PMMA phantom that was used to investigate the ADRC. However, since the x-ray tube would now
be positioned above the PMMA phantom and the detector below, the pile of PMMA plates had to be
inverted, compared to the investigation of the ADRC, to create the same irradiation situation, see
figure 8.
Figure 8 – Schematic figure of the experimental set up during the simulation on the conventional x-ray system.
To adapt the settings of the ADRC of the C-arm systems to the conventional x-ray system slightly
different approaches had to be used for fluoroscopy mode and image acquisition mode. To produce
an image on the conventional x-ray system the operator sets the tube potential and the number of
photons emitted by the tube, known as the mAs value.
In fluoroscopy mode the continuous equivalent tube current were determined for both C-arm
systems and the different dose modes. The continuous equivalent tube currents were transformed to
mAs values by the use of a suitable factor, found experimentally. The suitable factor is the one that
was found to give image quality matching the contrast differences between the contrast objects in
the Leeds test object.
In image acquisition mode the number of photons, again determined by the mAs value, used to
create the images were determined. For Philips Allura Xper this was easy as the mAs value was
shown on the monitor. For Ziehm Vision RFD, effective mAs values were calculated by using the
shown information of the tube current, pulse width, pulse rate and image recursion factor. The
function of the recursion is described in appendix E. The found mAs values were adapted to mAs
values for the conventional system by the use of a new suitable factor, found experimentally.
Detector
X-ray tube
PMMA phantom
Leeds test object
Additional filter

16
On the conventional x-ray system the tube potential can be set in steps of 1 kV and, hence, it was
possible to directly use the values of the tube potentials that were found during the investigation of
the ADRC. However, the conventional x-ray system does not allow the user to set arbitrary mAs
values but offers certain fixed values and the steps in which it can be changed are rather large, three
steps doubles/halves the mAs value. To get around this problem and to be able to get the desired
mAs value, in other words the desired number of photons, the distance between the x-ray source
and the image detector was slightly varied according to the square law equation, see equation (11).
𝑚𝐴𝑠1
𝑚𝐴𝑠2=
𝑆𝐼𝐷12
𝑆𝐼𝐷22
(11)
where mAs1 is the mAs value at Source Image Distance, SID1, and mAs2 is the mAs value at SID2.
[8]
Also the spectral filtration of the third x-ray system had to be adjusted, using pieces of aluminum
and copper, to match the filtration of the C-arms.
3.3.2 Low Contrast Sensitivity
The low contrast sensitivity as a function of PMMA thickness was studied using a Leeds test object
TOR (TVF), see figure 9. During EVAR procedures the interesting volume is the abdominal aorta,
and in this thesis the assumption was made that the abdominal aorta is located at the same distance
from the back of the patient regardless of patient mass. The position of the Leeds test object within
the PMMA phantom would be where the abdominal aorta is assumed to be located. In this thesis
that is assumed to be 11 cm from the back of the patient. Hence, the x-ray photons will first
penetrate 11 cm PMMA before reaching the Leeds test object and then continue through the rest of
the PMMA. Since the distance between the Leeds test object and the detector varies between the
different PMMA thicknesses the magnification factor will be different in the different images.
However, the difference in magnification factor was kept as low as possible due to the large
distance, 175-200 cm, between the focal spot and the detector.
Figure 9 – Image of the Leeds test object TOR (TVF) containing 14 circular discs of gradually decreasing contrasts.
All images that were taken of the Leeds test object were presented like fluoroscopy images, where
strong attenuation is dark and low attenuation is light. The images were cropped in Photoshop to

17
reduce the effect of the different magnification factors in the images. The images were then given
random numbers generated by Excel, and the Excel random number generator was also used to
choose duplicates among the original images. The images were then presented to the observer as
JPEG on a regular computer screen. A regular computer screen was used since the monitors of the
C-arms are of a quality more equal to a regular computer screen than the screens at the radiologists’
normal workstations.
To evaluate the contrast threshold of visibility in the different images, 4 observers individually
judged the images without knowing which image corresponded to which C-arm, dose mode and
PMMA thickness. The observers were given the criteria that for a disc to be judged as visible it
should be well defined and it should be possible to follow the circular shape all the way around the
disk. The observations were not limited in time and the observers used their normal eye sight
correction. No zooming or windowing tools were allowed. A total of 50 images, 37 original and 13
duplicates, were presented to the observer for the fluoroscopy mode and a total of 25 images, 18
original and 7 duplicates, were presented to the observer for the image acquisition mode.
3.3.3 Contrast to Noise Ratio
Using the image viewer in Sectra Picture Archiving and Communication System, PACS, the images
were also evaluated with respect to CNR according to equation (6), where background is the value
of the pixel content in the background, and signal is the value of the pixel content in the region of
interest, ROI. Low-contrast circle number 1 was chosen as ROI and the background was chosen
between low-contrast circle number 1 and 2, as seen in figure 10. Information about the contrast
discs can be found in appendix F.
Figure 10 – Low-contrast circle 1 was chosen as ROI and background was chosen between low-contrast circle 1 and 2.
3.4 Patient Radiation Exposure
The effective dose rate to the patient was calculated using the Monte Carlo based software PCXMC
version 2.0, developed by the Radiation and Nuclear Safety Authority in Finland, STUK.
The parameters set by the ADRC for different thicknesses of PMMA were used for input to
PCXMC and to be able to calculate the effective dose to the patient the mass of the patient must
also be known. Hence, there was a need to translate the thickness of the PMMA phantom into the
mass of a patient. To do that one must first find a way to translate x-ray absorption in PMMA to
absorption in tissue.

18
An anthropomorphous PH-4 CT Torso Phantom CTU41 was placed in Philips Allura Xper and the
radiation field was positioned as if an EVAR procedure was performed, see figure 11. The torso
phantom was exposed at the normal dose mode, and the imaging parameters set by the ADRC were
noted. Then the torso phantom was replaced with a PMMA phantom and the thickness of the
PMMA was varied until the same imaging parameters were obtained.
Figure 11 – The PH-4 CT Torso Phantom CTU41.
The thickness of the PMMA phantom represents the thickness of a patient in the anterior-posterior,
AP, direction. The AP thickness of the torso phantom in the interesting region was determined from
CT images. A translation factor between the PMMA and tissue in the interesting region was then
calculated according to equation (12).
𝑡𝑟𝑎𝑛𝑠𝑙𝑎𝑡𝑖𝑜𝑛 𝑓𝑎𝑐𝑡𝑜𝑟 =
𝑡𝑡𝑜𝑟𝑠𝑜 𝑝ℎ𝑎𝑛𝑡𝑜𝑚
𝑡𝑃𝑀𝑀𝐴 𝑝ℎ𝑎𝑛𝑡𝑜𝑚
(12)
where ttorso phantom is the thickness in the AP direction of the torso phantom and tPMMA phantom is the
thickness of the PMMA phantom. In this thesis the assumption was made that only one translation
factor was needed that could be applied to all tube potentials.
By the use of an effective diameter of the patient, the AP thickness could be translated into mass of
the patient using the defined relationship between a patient with a given mass m in kg and a cylinder
with given radius r in mm [12], see equation (13).
𝑟 = 63.3 + 1.12𝑚 − 0.000635𝑚2
(13)
To make use of the above relationship there was consequently a need to translate AP thickness of a
patient, into effective diameter of a circle of equal area, see figure 12. This translation was done
using conversion factors presented in a report from the American Association of Physicists in
Medicine [13].

19
Figure 12 – Translation of AP thickness of a patient into effective diameter of a circle of equal area. [13]
3.5 Personnel Exposure
3.5.1 Philips DoseAware
In this thesis five active dosimeters was used to measure the personnel exposure. Active dosimeters
were chosen due to the relatively simple data read out process. The dosimeters used were Philips
DoseAware manufactured by Unfors RaySafe, also marketed by Unfors RaySafe as RaySafe i2.
The dosimeters were calibrated to N-80 series according to the ISO 4037 standard and measures
Hp(10). The dosimeter is intended to be used by personnel working with image guided
interventions and is supposed to be worn on the outside of the radiation protection apron at chest
level. The x-ray exposure is measured and recorded in intervals of one second and the data is
wirelessly transferred to a real time display that presents the Hp(10) to the personnel through staples
in different colors indicating the level of risk. [10] Information about registered doses and dose rates
can also be evaluated after the exposure. This can be done by connecting the dosimeter to a
computer and evaluate the recorded data in the software DoseView, see figure 13. Since the dose
rate and accumulated dose is recorded in intervals of one second, together with a time mark, it is
possible to determine which doses that where registered at specific times. Technical data for the
dosimeters can be found in appendix G.

20
Figure 13 – The DoseView software was used to evaluate the dose rate and accumulated dose.
3.5.1.1 Intercalibration of Dosimeters
The sensitivity between the different dosimeters might vary, hence, two different dosimeters might
show different results even though they have been exposed to the same amount of radiation. A
slightly difference in sensitivity was found and hence an intercalibration was performed.
A PMMA phantom consisting of quadratic plates with sides equal to 30 cm and a thickness of 22
cm was used as a scattering object. The PMMA phantom was placed on top of the table, mattress
removed, and the tabletop was positioned 95 cm above the floor. The dosimeters were placed in the
dosimeter rack belonging to the DoseAware package, and it was placed at right angles to the PMMA
phantom. The dosimeter rack was placed such that the centers of the dosimeters were located 105
cm above the floor and the distance from the center of the PMMA phantom to the center of the
middle dosimeter was 100 cm, see figure 14 and 15. The dosimeter rack gave a well-defined
position with the possibility of good reproducibility. The intercalibration was performed with
Philips Allura Xper.
21
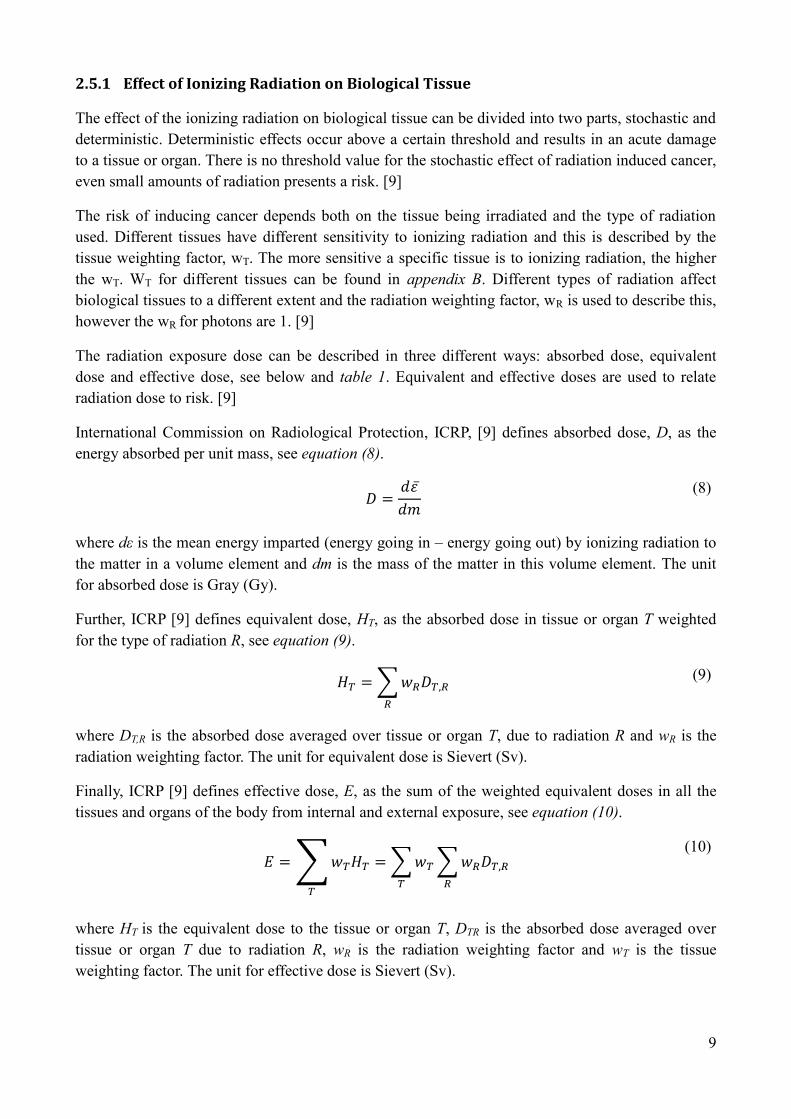
Figure 14 – Schematic image of the experimental set up during the intercalibration of the dosimeters.
The PMMA phantom was irradiated and the dosimeters were thereby exposed to scattered radiation.
For the low and medium dose modes the irradiation took place for 60 seconds and for the high dose
mode 30 seconds. The reason for irradiating just 30 seconds at the high dose mode was that the C-
arm was programed not to allow for more than 30 seconds of irradiation. When the dosimeters had
been exposed to all three dose modes they were rotated one step and the procedure was repeated
until all dosimeters had been exposed to all dose modes in all positions, giving a total of 15
irradiations. The radiation field was set to be as large as possible to get as much scatter as possible
to lower the uncertainties in the recorded doses.
Figure 15 – Intercalibration set up of the five dosimeters.
3.5.1.2 Control if the Material behind the Dosimeters Affect the Detected Dose
Usually the dosimeter is worn on the outside of a radiation protection apron, but for the
measurements of the dose to the personnel the dosimeters would be placed on joist hangers made of
steel. Since it was unclear if the dosimeters register backscattered radiation it was necessary to
Detector
PMMA phantom
Tabletop
X-ray Tube
100 cm
105 cm
95 cm
Dosimeters
22
control if the material behind the dosimeter affected the registered dose.
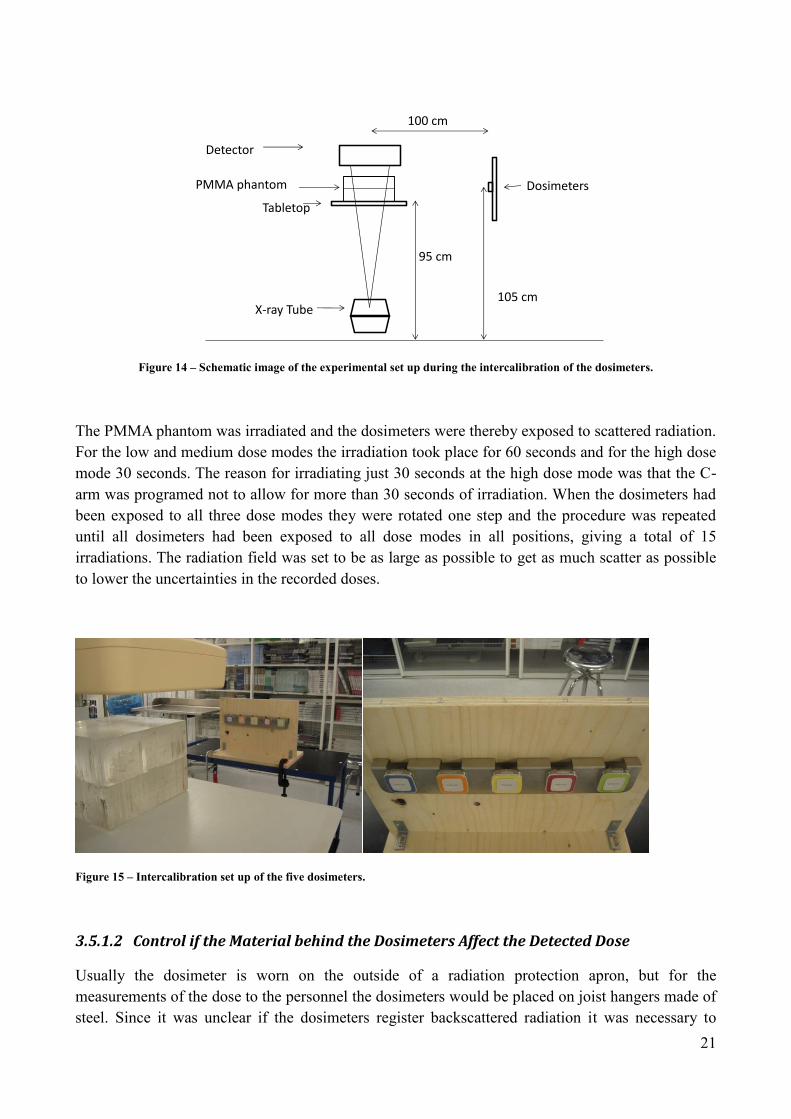
A PMMA phantom consisting of quadratic plates with sides equal to 30 cm and a thickness of total
22 cm was used as a scattering object. The PMMA phantom was placed on top of the table, mattress
removed, and the tabletop was positioned 90 cm above the floor. Four dosimeters were placed in a
row at a distance of 75 cm from the center of the PMMA phantom, see figure 16. The PMMA
phantom was irradiated for 60 seconds at the normal dose mode and, thereby, the dosimeters were
exposed to scattered radiation.
Figure 16 – Schematic image of the set up to control if the material behind the dosimeters affect the registered dose.
During the first exposure two dosimeters were placed in front of steel and two dosimeters were
placed in front of a piece of radiation protection apron, see figure 17. The impact on the registered
dose by the material behind the dosimeters was calculated by the equation (14).
𝑖𝑚𝑝𝑎𝑐𝑡 𝑜𝑛 𝑟𝑒𝑔𝑖𝑠𝑡𝑒𝑟𝑒𝑑 𝑑𝑜𝑠𝑒 =
(𝐴 + 𝐵)
(𝐶 + 𝐷)
(14)
where A,B, C and D represents the measured radiation doses at the four dosimeter positions.
The steel and piece of radiation protection apron switched place, the dosimeters remaining theirs,
and a second exposure took place for another 60 seconds. The impact on the registered doses could
now be compared to determine if the material behind the dosimeter affected the measurement.
Detector
PMMA phantom
Tabletop
X-ray Tube
75 cm
105 cm
90 cm
Dosimeter rack

23
Figure 17 – Image of the four dosimeter positions.
3.5.2 Analysis of the Irradiation Situation
In order to decide at which distance from the PMMA phantom it would be interesting to meassure
the personnel exposure the irradiation situation needed to be analyzed. This was done by observing
the personnel during four x-ray image guided interventions. Further, it was necessary to decide at
which five heights the personnel exposure should be measured. The lowest measuring point was
decided to represent the height above the floor where, on average, the radiation protection apron
ends. This was determined by 11 random samples of personnel wearing radiation protection apron.
The highest measuring point was to be at a representative height of the eye. The remaining three
measuring points were placed at equal distances between the highest and lowest measuring point.
Due to the angular dependency of the dosimeters they needed to face a specific point in the PMMA
phantom. This point needed to be decided and the angles, by which the dosimeters should be
positioned, calculated. The calculated angles were then set before the measurement started.
3.5.3 Size and Location of the Radiation Field
In order to perform a proper comparison of the scattered radiation, the scattering volume needed to
be the same in both cases. Also the size and location of the radiation field within a specific plane of
the PMMA phantom needed to be the same, or as close to the same as possible. The area of the
radiation field used was smaller than the area of the PMMA phantom and the amount of scattered
radiation was therefore dependent on the thickness of PMMA it had to pass through before it
reached the dosimeters. Therefore, it was important that the radiation filed was located at the same
distance from the side of the PMMA phantom the dosimeters were facing.

24
The same scattering volume was achieved by having the same distance between the focal spot and
the entering surface of the PMMA phantom. The size and location of the radiation field could not be
decided from the images presented on the monitors of the C-arms since they are processed and the
edges are masked to make them appear sharp. The size and location of the radiation field was
instead determined by positioning two radiopaque rulers on top of 11 cm PMMA and exposing a
computed radiography, CR, imaging plate. The CR imaging plate was then read out and the image
was sent to PACS where it was possible to determine the true size and location of the radiation field,
see figure 18. Size and location was then adjusted until it was the same, within 1 mm, for both C-
arms.
Figure 18 – The process to find the true size and location of the radiation field. Two radiopaque rulers were placed on top of
11 cm PMMA and a CR imaging plate was exposed. The CR imaging plate was read out and the true size and location of the
radiation field could be determined.
When the personnel exposure were to be measured the PMMA phantom was irradiated for 60
seconds for Philips Allura Xper low and normal dose mode and Ziehm Vision RFD, and 30 seconds
for Philips Allura Xper high dose mode. The procedure was performed for PMMA thicknesses of
11-36 cm in steps of approximately 2 cm. The values of Dose Area Product, DAP, and Air Kerma,
AK, were also noted as these values are needed in the calculation of patient effective dose.

25
4 Results
The measurement data presented in the graphs have been connected by a line as a guide to the eye.
Graphs and measurement data will only be commented shortly in this section.
4.1 Fluoroscopy Mode
It was found that Philips Allura Xper displays the continuous equivalent tube current. Ziehm Vision
RFD on the other hand displays the tube current during the pulse. To be able to make a proper
comparison of the tube current, and to be able to apply Ohm’s law for power calculations, this tube
current was calculated into continuous equivalent tube current.
For Ziehm Vision RFD the pulse length can be anything up to 40 ms, giving a maximum of 25
pulses per second. For fluoroscopy mode the pulse width, PW, is normally 57 %, hence, 22.8 ms,
but when the PMMA was at its maximum the PW increased to 100 %, which meant that the
fluoroscopy mode could then be considered to be continuous.

26
The tube potential, continuous equivalent tube current, and power during fluoroscopy mode was
investigated as a function of PMMA thickness. The results are presented in figure 19.
Figure 19 – Tube potential, continuous equivalent tube current, and power as a function of PMMA thickness during
fluoroscopy mode.
50
60
70
80
90
100
110
120
130
10 15 20 25 30 35
Tub
e P
ote
nti
al (
kV)
PMMA Thickness (cm)
Tube Potential vs. PMMA Thickness
Philips Low
Philips Medium
Philips High
Ziehm 57 % PW
Ziehm 100 % PW
0
2
4
6
8
10
12
14
16
18
20
10 15 20 25 30 35
Tub
e C
urr
en
t (m
A)
PMMA Thickness (cm)
Tube Current vs. PMMA Thickness
Philips Low
Philips Medium
Philips High
Ziehm PW 57 %
Ziehm PW 100 %
0
200
400
600
800
1000
1200
1400
1600
1800
10 15 20 25 30 35
Po
we
r (W
)
PMMA Thickness (cm)
Power vs. PMMA Thickness
Philips Low
Philips Medium
Philips High
Ziehm PW 57 %
Ziehm PW 100 %

27
The maximum tube potential, 120 kV, for all dose modes for Philips Allura Xper is reached at 36
cm PMMA. Ziehm Vision RFD reaches a plateau of 100 kV at 26 cm PMMA. When the maximum
power is reached the tube current starts to decrease to allow for a further increase in tube potential.
For Philips Allura Xper low and medium dose mode this occurs at around 25 cm PMMA. For
Philips high mode it occurs at around 28 cm PMMA.
4.2 Image Acquisition Mode
The tube potential, mAs value and power was investigated as a function of PMMA thickness. The
results are presented in figure 20.
Figure 20 – Tube potential, mAs value, and power as a function of PMMA thickness during image acquisition.
50
60
70
80
90
100
110
120
130
10 15 20 25 30 35
Tub
e P
ote
nti
al (
kV)
PMMA Thickness (cm)
Tube Potential vs. PMMA Thickness
Philips
Ziehm
0
20
40
60
80
100
120
10 15 20 25 30 35
mA
s V
alu
e (
mA
s)
PMMA Thickness (cm)
Corresponding mAs Value Used to Create One Image vs. PMMA Thickness
Philips
Ziehm
0
5000
10000
15000
20000
25000
10 15 20 25 30 35
Po
we
r (W
)
PMMA Thickness (cm)
Mean Power During Imaging Sequence vs. PMMA Thickness
Philips
Ziehm

28
4.3 Image QualityTube Output
The Image QualityTube Output was evaluated from 19 cm PMMA and upwards. As can be seen in
section 4.4, 19 cm PMMA equals to a patient of approximately 54 kg and Image QualityTube Output
was not to be evaluated for patients with a mass less than 50 kg.
4.3.1 Compare Fluoroscopy
The constant, as was described in section 3.3.1, was found to be 4 seconds, hence, multiplication of
the continuous equivalent tube current by 4 seconds gave useful images of the Leeds test object.
The results of the observers’ judgments of the number of visible discs, and the result of the CNR
investigation can be seen in figure 21.
Figure 21 – The number of visible discs and CNR as a function of PMMA thickness for fluoroscopy mode.
Both the number of visible discs and the CNR decrease for increasing PMMA thickness. The
relationships between the different curves of the two graphs are quite similar.
The observers most often judged the number of visible discs in the duplicate images equal to that of
the original images, see figure 22.
0
2
4
6
8
10
12
10 15 20 25 30 35
Nu
mb
er
of
Vis
ible
Dis
cs
PMMA Thickness (cm)
Number of Visible Discs vs. PMMA Thickness
Philips Low
Philips Medium
Philips High
Ziehm PW 57 %
Ziehm PW 100 %
0
0,5
1
1,5
2
2,5
3
3,5
10 15 20 25 30 35
CN
R
PMMA Thickness (cm)
CNR vs. PMMA Thickness
Philips Low
Philips Medium
Philips High
Ziehm PW 57 %
Ziehm PW 100 %

29
Figure 22 - Deviation in judged number of visible discs for duplicate from original, fluoroscopy mode.
4.3.2 Compare Image Acquisition
The constant, as was described in section 3.3.1, was found to be 2.6 seconds, hence, multiplication
of the mAs value by 2.6 gave useful images of the Leeds test object. The results of the observers’
judgments of the number of visible discs, and the result of the CNR investigation can be seen in
figure 23.
Figure 23 – The number of visible discs and CNR as a function of PMMA thickness for image acquisition mode.
0
5
10
15
20
25
30
35
40
-2 -1 0 1
Nu
mb
er
of
jud
gem
en
ts
Deviation in judged number of visible discs for duplicate from original, fluoroscopy mode
0
0,5
1
1,5
2
2,5
3
3,5
10 15 20 25 30 35
CN
R
PMMA Thickness (cm)
CNR vs. PMMA Thickness
Philips
Ziehm
0
2
4
6
8
10
12
10 15 20 25 30 35
Nu
mb
er
of
Vis
ible
Dis
cs
PMMA Thickness (cm)
Number of Visible Discs vs. PMMA Thickness
Philips
Ziehm

30
Both the number of visible discs and the CNR decrease for increasing PMMA thickness. The
relationships between the different curves of the two graphs are quite similar. For Philips Allura
Xper the number of visible discs is judged higher than for Ziehm Vision RFD for all PMMA
thicknesses, also the CNR for Philips Allura Xper is higher for almost all PMMA thicknesses.
The observers most often judged the number of visible discs in the duplicate images equal to that of
the original images, see figure 24.
Figure 24 - Deviation in judged number of visible discs for duplicate from original, image acquisition mode
4.4 Patient Radiation Exposure
The thickness of the PH-4 CT Torso Phantom CTU41 in the interesting region was 20.5 cm, see
figure 25.
Figure 25 – CT image of the torso phantom.
The same ADRC settings were obtained for 19.5 cm PMMA giving a translation factor of 1.05 for
converting PMMA thickness into AP tissue thickness. The AP tissue thickness was then translated
into a cylinder of equal area, and the cylinder diameter was then used to find the mass of the patient.
The results can be seen in table 3.
0
2
4
6
8
10
12
14
16
-2 -1 0 1 2
Nu
mb
er
of
jud
gem
en
ts
Deviation in judged number of visible discs for duplicate from original, image acquisition mode

31
Table 3 – Translation of PMMA thickness into patient mass.
PMMA Thickness (cm) Tissue Thickness (cm) Diameter of an
Effective Cylinder (cm) Patient
Mass (kg)
10.9 11.5 13.7 5
13.0 13.6 16.5 17
15.0 15.8 19.3 30
17.0 17.8 21.8 42
19.0 20.0 24.3 54
21.8 22.9 27.5 69
23.8 25.0 29.7 80
25.9 27.2 31.8 90
27.8 29.2 33.7 100
29.8 31.4 35.4 108
31.8 33.4 37.1 117
33.8 35.5 38.8 125
35.9 37.7 40.2 133
The effective patient dose rates were then calculated using PCXMC 2.0. Figure 26 shows effective
dose rates for fluoroscopy mode, and figure 27 shows effective dose rates for image acquisition
mode.
Figure 26 – Calculated effective patient dose rates as a function of PMMA thickness for fluoroscopy mode.
The relationship between the effective dose rates to the patient for the three dose modes of Philips
Allura Xper are as expected. The low dose mode gives the lowest effective dose rate, and high dose
mode the highest effective dose rate. Medium dose mode gives an effective dose rate that is
between low and high. The effective dose rate of Ziehm Vision RFD is between that of Philips low
and medium dose mode for PMMA thicknesses 19-26 cm. Above 26 cm PMMA the effective dose
rate to the patient for Ziehm Vision RFD is lower than the lowest dose mode of Philips.
0
0,01
0,02
0,03
0,04
0,05
0,06
0,07
0,08
0,09
10 15 20 25 30 35
Effe
ctiv
e D
ose
Rat
e (
mSv
/s)
PMMA Thickness (cm)
Effective Dose Rate vs. PMMA Thickness
Philips Low
Philips Medium
Philips High
Ziehm PW 57 %
Ziehm PW 100 %

32
Figure 27 – Calculated effective patient dose rates as a function of PMMA thickness for image acquisition mode
The effective dose rate to the patient for image acquisition mode is lower for Ziehm Vision RFD
than for Philips Allura Xper for all PMMA thicknesses.
4.5 Personnel Exposure
4.5.1 Correction Factors for Dosimeters
From the intercalibration performed, one correction factor per dose mode and dosimeter were
found, as can be seen in table 4.
Table 4 – Correction factors as found from the intercallibration.
Dose mode\Dosimeter Blue Orange Yellow Red Green
Low 0.92 1.03 0.94 1.02 1.11
Medium 0.91 1.03 0.94 1.02 1.12
High 0.91 1.06 0.89 1.04 1.14
The correction factors for the different dose mode for an individual dosimeter are close to each
other. Due to the small intradosimeter correction factor variance, and for practical reasons, the three
correction factors of each dosimeter are averaged to one correction factor applicable on all dose
modes, see table 5. Calculations show that this does not introduce errors of significant size.
Table 5 – Correction factors
Dosimeter Blue Orange Yellow Red Green
Correction
factor 0.91 1.04 0.92 1.03 1.12
0
0,2
0,4
0,6
0,8
1
1,2
1,4
10 15 20 25 30 35
Effe
ctiv
e D
ose
Rat
e (
mSv
/s)
PMMA Thickness (cm)
Effective Dose Rate vs. PMMA Thickness
Philips
Ziehm

33
In the control if the material behind the dosimeter affects the detected doses it was found that there
was no significant change in the dose registered by the dosimeters depending on whether the
material behind the dosimeters was made of steel or a radiation protection apron, as can be seen
below.
Exposure 1: (A+B)/(C+D) = 1.03
Exposure 2: (A+B)/(C+D) = 1.03
4.5.2 Analysis of the Irradiation Situation
During image guided interventional procedures like EVAR the patient is the main source of the
scattered radiation reaching the personnel. During image acquisition the surgeon and the rest of the
personnel takes several steps away from the patient, or if possible, leaves the room. For that reason
the personnel exposure was only measured during fluoroscopic mode.
Analysis of the irradiation situation shows that it is adequate to measure personnel exposure at a
distance of 30 cm away from the edge of the PMMA phantom. The lowest measuring point was
decided to be 50 cm above the floor and the highest 170 cm above the floor. The rest of the
measuring points were spread at equal distances between the lowest and highest measuring point, as
can be seen in table 6.
Table 6 – Geometrics for the measurements of the personnel exposure.
The vertical line formed by the centers of the dosimeters is 30 cm away from the edge of the
PMMA phantom, and the dosimeters are positioned to face a point in the center of the PMMA
phantom at a height of 17.5 cm over the tabletop. The dosimeters face this point at right angles, as
can also be found in table 6.
4.5.3 Size and Location of the Radiation Field
To get the same scattering volume for the comparison it was necessary to have the same distance
between the focal spot and the entrance surface of the PMMA phantom. For Philips Allura Xper the
focal spot is located 25.3 cm above the floor and for Ziehm Vision RFD the focal spot is located
34.8 cm above the floor. The height of the focal spot for Philips Allura Xper cannot be changed, but
the height of the focal spot of Ziehm Vision RFD can be changed by heightening the C. The focal
spot of Ziehm Vision RFD, when it is at its lowest position, is located 9.5 cm higher than that of
Measuring
Point
Height
above the
Floor (cm)
Angle with
respect to the
stud of wood (o)
1 50 - 53.1
2 80 - 33.7
3 110 0
4 140 + 33.7
5 170 + 53.1

34
Philips Allura Xper. The distance between the focal spot and the entrance surface of the PMMA
phantom can easily be adjusted by lowering or heighten the tabletop. Since the focal spot of Ziehm
Vision RFD is positioned 9.5 cm higher than that of Philips Allura Xper, the tabletop was simply
positioned 9.5 cm higher with respect to the floor. For the dosimeters to be placed in the same
position with respect to the scattering volume, the PMMA, the stud of wood for the measurement of
Ziehm Vision RFD was also heighten with 9.5 cm.
For the measuring of Philips Allura Xper the distance between the floor and tabletop was 92.5 cm,
and for Ziehm the distance was 102 cm. The experimental set up can be seen in figure 28 and 29.
Figure 28 – Schematic image of the experimental set up for the measurements of the personnel exposure.
Detector
PMMA phantom
Tabletop
X-ray tube
67.2 cm
38.5 cm30 cm
Figure 29 – The experimental set up for the measurements of the personnel exposure.

35
4.5.4 Measured Personnel Exposure
The measured personnel exposure at the height of 140 cm is the one best corresponding to chest
level, where the dosimeters are normally placed, and the measurement results can be found in figure
30. The rest of the measurement results for the personnel exposure can be found in appendix H.
Figure 30 – Measured personnel exposure, without radiation protection apron, at a height of 140 cm.
The relationship between the low, medium and high dose mode for Philips are as expected. The low
dose mode gives the lowest dose rate and high dose mode gives the highest dose rate. Medium dose
mode is between low and high. NOTE: It is Hp(10) that has been measured and the measurements
represents as if the dosimeter was worn on the outside of the radiation protection apron. The
effective dose rate to the personnel is much lower due to the effect of the radiation protection apron.
It is not within the scope of this thesis to find the true effective dose rate.
0
2
4
6
8
10
12
14
16
10 15 20 25 30 35
Do
se R
ate
(m
Sv/h
)
PMMA Thickness (cm)
Dose Rate vs. PMMA Thickness
Philips Low
Philips Medium
Philips High
Ziehm PW 57 %
Ziehm PW 100 %

36

37
5 Discussion
5.1 Fluoroscopy Mode
The tube potential for both C-arms investigated increase with increasing PMMA thickness, see
figure 19. This is to compensate for the increase in beam attenuation that is due to the increase in
PMMA thickness. For Ziehm Vision RFD the peak tube potential is reached at 26 cm PMMA, for
Philips Allura Xper low and medium dose mode the peak tube potential is reached at 36 cm
PMMA, and for Philips Allura Xper high dose mode it is reached at 34 cm PMMA. The increase in
tube potential will give a rise in x-ray photon energy and due to the decrease in the difference of
linear attenuation coefficient between contrast object and background with increasing tube potential
this will cause a decrease in contrast. It was found that both CNR and the number of visible discs
decrease with increasing PMMA thickness, see figure 21, due to an increase of tube potential but
also as a result of more scattered radiation. The relation between the different curves of observed
number of circular discs and CNR for Ziehm Vision RFD and Philips Allura Xper medium dose
mode are quite similar and it would be expected that they have approximately the same possibility
to deliver images of equal quality.
The tube current for C-arms can increase until the x-ray tube power limit is reached. The tube
current must then decrease to allow for a proceeding increase in tube potential. At some point the
maximum potential is reached and the system can no longer compensate for thicker patients in order
to keep a constant dose to the detector. For powerful systems the maximum tube output is limited
by the radiation dose to the patient. It was found that the maximum power output for Ziehm Vision
RFD and Philips Allura Xper low and medium dose mode was reached at approximately 26 cm
PMMA, see figure 19, and this is where the tube current starts to decrease. For Philips Allura Xper
high dose mode this occurs at 28 cm PMMA. Here also the power decrease and this is assumed to
be due to patient threshold dose reached. When the x-ray tube and generator limits are reached
image noise will start to increase because of the decrease in number of x-ray photons reaching the
detector.
The observed number of circular discs and CNR for Ziehm Vision RFD and Philips Allura Xper
medium dose are quite similar, as was seen in figure 21. In the same time the effective dose rate to
the patient was significantly lower for Ziehm Vision RFD than for Philips Allura Xper medium dose
mode, see figure 26. Not only does Ziehm Vision RFD has approximately the same image quality as
that of Philips Allura Xper medium dose mode, but does this at a lower dose. This might indicate
that Ziehm Vision RFD is in some way better optimized than Philips Allura Xper.
Lower tube potential gives a higher contrast, see figure 5, which is visible even though there is an
increase in image noise. A method to remain the same CNR and in the same time lower the dose to
the patient, for Siemens CT examinations, is described by Grant and Schmidt [14]. The method is
called CARE kV and the same CNR can be obtained for lower tube potentials. Ziehm Vision RFD
was found to have approximately the same CNR as Philips Allura Xper medium dose mode, see
figure 21, even though the effective dose to the patient was significantly lower, see figure 26, and
that is assumed to be for reasons described by Grant and Schmidt. This might indicate that an
approach similar to that of Siemens CT could be beneficially applied to fluoroscopy systems as

38
well.
The measurements of the personnel exposure were in line with theory. The highest dose rates were
measured below the table and the dose rate was decreasing with increasing height and increased
with increasing PMMA thickness. Further, the relationship between the low, medium and high dose
mode for Philips Allura Xper was as expected. The low dose mode gave the lowest dose rate and
the high dose mode the highest dose rate. Medium dose mode was between low and high.
5.2 Image Acquisition Mode
Ziehm Vision RFD performs image acquisition as fluoroscopy but enhances the image quality, form
what would otherwise have been possible, by recursion. However, the graphs of both the CNR and
number of visible discs indicate that Ziehm Vision RFD can be expected to deliver a lower image
quality than Philips Allura Xper for all patient thicknesses, see figure 23. Further, the graphs of the
tube potential and tube current, see figure 20, indicate that it would be expected that the decrease in
image quality with an increase in PMMA thickness would be faster for Ziehm Vision RFD than for
Philips Allura Xper after 22 cm PMMA. This can also be seen in the results from the CNR and
number of visible discs, see figure 23. After 22 cm PMMA there is a faster decrease for Ziehm
Vision RFD than for Philips Allura Xper.
An advantage of taking a few number of short pulse high quality images like Philips Allura Xper is
that the motion blur will not be as present in the images as in the case with Ziehm Vision RFD. In
this thesis the assumption was made that the patient lies completely still and that there is no
movements. If that is not the case the number of recursion needs to be lowered and then the image
quality, as described in this thesis, becomes even worse for Ziehm Vision RFD.
5.3 Proposed Method for Comparing Image QualityTube Output of Fluoroscopic
Systems
5.3.1 Fluoroscopy Mode
1. Determine the tube potential and tube current as a function of PMMA thicknesses. Also take
note of the spectral filtration used.
2. Make sure that the obtained tube current is the continuous equivalent tube current. If not
make calculations to find it!
3. Now the imaging parameters can be set on a conventional x-ray system and the Image
QualityTube Output compared, by for example evaluating CNR or low contrast sensitivity using
a suitable test object. The test object should be exposed together with the PMMA and the
imaging parameters as found in 1 (and 2). Use the same tube potential as found in 1 in the
simulation, and multiply all continuous equivalent tube currents with the one constant that
has been found to give useful images of the test object, to get the mAs value that is to be
used. If it is not possible to get the desired mAs value on the third x-ray system, use the
square law equation to get the right mAs value through a change in the SID. Also make sure
that the same total spectral beam filtration is used as were noted for the C-arms.
39
4. The evaluation of the images is preferable done by an objective evaluation program, if
available. Other options are performing a blind test where observers evaluate the images or
measure the CNR using suitable software.
5. Measure/calculate the dose to the patient and personnel in a way that is found suitable.
NOTE: The proposed method is a way to compare two different systems on a common but
arbitrary scale, and will not give any absolute values.
5.3.2 Image Acquisition Mode
1. Determine the tube potential and mAs value as a function of PMMA thicknesses. Also take
note of the spectral filtration used.
2. If the mAs value is not displayed then make calculations to find out how much mAs have
been used to build up the image presented on the monitor.
3. Now the imaging parameters can be set on a third x-ray system and the Image QualityTube
Output compared, by for example evaluating CNR or low contrast sensitivity using a suitable
test object. The test object should be exposed together with the PMMA and the imaging
parameters as found in 1 (and 2). Use the same tube potential as found in 1 in the simulation,
and multiply all mAs values with the one constant that has been found to give useful images
of the test object, to get the mAs value that is to be used. If it is not possible to get the
desired mAs value on the third x-ray system, use the square law equation to get the right
mAs value through a change in the SID. Also make sure that the same total spectral beam
filtration is used as were noted for the C-arms.
4. The evaluation of the images is preferable done by an objective evaluation program, if
available. Other options are performing a blind test where observers evaluate the images or
measure the CNR using suitable software.
5. Measure/calculate the dose to the patient in a way that is found suitable.
NOTE: The proposed method is a way to compare two different systems on a common but
arbitrary scale, and will not give any absolute values.
5.4 Reasons for Errors
The image parameters shown on the monitor of the C-arms are all assumed to be the true values
since it is not within the scope of this thesis to investigate the accuracy of the displayed parameters.
When setting the image parameters on the third x-ray system the correct mAs value was obtained
through varying the SID. This can be assumed to introduce errors due to slightly different
magnification factors of the image object. However, they are assumed to be small and considered to
be of no importance in this thesis.
By having different distances between the test object and the detector, there were also a different
magnification factors in the images. By using a large SID, the magnification factor was kept as low
as possible.
Four observers subjectively evaluated the images. Instead of using observes it would have been
40
better to use objective computer software. However, such software was not available.
In the translation of the PMMA thickness to AP thickness only one translation factor was used.
Linear attenuation is dependent on the tube potential, and to get a more exact translation more
translation factors could have been used, however, this was not done for practical reasons.
The software PCXMC 2.0 was used to determine the patient effective dose rate. PCXMC 2.0 has a
mathematical representation of a patient that is stretched out as the weight of the patient increases.
In this study the same size of the radiation field was used for all investigated patient masses since
the diameter of the aorta is not assumed to be affected by the mass of the patient. When the
mathematical patient stretches out, part of the radiation sensitive organs moves out of the radiation
field and, hence, the dose to the patient might be underestimated. The effect of the stretching was
the same for both Philips Allura Xper and Ziehm Vision RFD since the same patient masses were
used.
There are uncertainties in the displayed DAP and AK shown on the monitors of the C-arms. The
uncertainty for the DAP meter is <+/- 25 % [15]. Further, Philips Allura Xper has a measuring DAP
meter and Ziehm Vision RFD a calculating DAP meter, and these introduce different kinds of
errors. As mentioned before, the displayed values were all assumed to be the true values since it was
not within the scope of this thesis to investigate the accuracy of the displayed parameters
The dosimeters used have their own built in uncertainties. The intercalibration performed in the
beginning of this project was repeated at the end and similar results were obtained. Hence, the
dosimeters can be assumed to have been stable during the period of this project.
The edges of the PMMA plates used were not perfectly defined. This could have affected the
measurements of the scattered radiation to some extent. The most well defined edge was placed
towards the dosimeters to make an eventual error as small as possible. No other PMMA plates were
available.
During the measurements of the scattered radiation there were uncertainties in the positioning of the
radiation field. The accuracy can be assumed to have been within +/- 0.5 mm and the uncertainty in
the measurement result this introduce is in the order of +/- 0.5%.
During an interventional procedure the distance between the detector and the patient is kept as small
as possible. In this thesis the distance between the tabletop and the detector was set to a fix distance
such that the detector was close to the PMMA phantom when it was at its thickest. This means that
when a thin PMMA phantom was used the air gap between the PMMA and the detector was rather
big and this is not the case in a real situation. Since the detector shields the radiation it is possible
that the radiation doses on the highest measuring points have been overestimated for thin PMMA
phantoms.
As the PMMA phantom thickness increased the tabletop started to sag and when the maximum
PMMA thickness was placed on the tabletop it sagged with less than 10 mm. Since the tabletop
sagged with less than 10 mm it was considered inelastic and was not taken into consideration.
The C-arms used in this study have different anode angles. The effect of this on the scattering
volume has not been investigated in this thesis. The errors this introduce is assumed to be small.

41
5.5 Future Studies
Two recommendations of future studies are proposed.
First, in this thesis it was found that, for fluoroscopy mode, the effective dose rate to thick patients
for Ziehm Vision RFD was significantly lower than for Philips Allura Xper, even though this was
not shown in the Image QualityTube Output. This can be interpreted as Philips Allura Xper uses
unnecessary high radiation doses without getting the desired increase in contrast. Future work
should in depth investigate possible dose savings during EVAR procedures of thick patients using
Philips Allura Xper.
Second, to continue comparing the Image QualityTube Output for other applications than EVAR as well
as other fluoroscopy systems, using the method described in this thesis, to identify possible
differences that can result in suggestions for improvements.
Further, the clinical outcome of an image guided interventional procedure is not only dependent on
the performance of the x-ray tube and generator but also the surgeons’ ability to correctly use the
fluoroscopic system. By limiting a study to Image QualityTube Output, as described in this thesis, an
interdisciplinary approach could be used which aims at increasing the operators understanding of
the potentials and limitations of the ADRC, to get the best out of the fluoroscopic system.

42
43
6 Conclusion
The use of endovascular interventions have increased in recent years and the use of x-ray image
guidance expose the patient to radiation doses that can possibly introduce both stochastic and
deterministic injury. Therefore, it is of great importance to keep the doses as low as possible and
still get an adequate image quality. Image quality is dependent on the characteristics of the x-rays
produced in the x-ray tube, the detector characteristics and the image processing. The understanding
of what affects the image quality could be made easier if the performance of the different parts of
the system were to be judged separately, rather than considering the system as a whole.
A method was proposed for how to evaluate the image quality of two fluoroscopic x-ray systems
that only consider the characteristics of the x-rays. Using the method proposed in this thesis it was
possible to identify that Philips Allura Xper exposes thick patients to unnecessary high radiation
doses in the EVAR application. By applying the method presented in this thesis to other applications
and systems it would be expected that other potential improvements might be identified.

44
45
References
[1] White, C. J., & Gray, W. A. (2007). Endovascular therapies for peripheral arterial disease: An
evidence-based review. Circulation, 116(19), 2203-2215.
[2] International Electrotechnical Commission. (2010). Medical Electrical Equipment - Part 2-43:
Particular Requirements for the Basic Safety and Essential Performance of X-ray Equipment for
Interventional Procedures. IEC.
[3] Bushberg, J.T., Seibert, J. A., Leidholdt JR, E. M, Boone, J. M. (2002). The Essential Physics of
Medical Imaging, Second edition, Lippincott Williams & Wilkins, ISBN: 978-0-6833-0118-2, pp.
97-99, 255, 257, 278.
[4] Berglund, E., Jönsson, B.-A. (2007). Medicinsk fysik. First edition, Studentlitteratur, ISBN: 978-
91-44-03796-7, pp. 59, 68.
[5] Gislason, A. J., Hoornaert, B., Davies, A. G., Cowen, A., (2011). Allura Xper Cardiac System
Implementation of Automatic Dose Rate Control. Philips Healthcare.
[6] Allisy-Roberts, P., Williams, J.(2008). Farr's Physics for Medical Imaging. Second edition,
Saunders Elsevier, ISBN: 978-0-7020-2844-1, pp. 50-52.
[7] Balter, S., Fukuda, A., Goode, A., Hartwell, G., LaFrance, T., Nickoloff, E.,…Strauss, K. (2012).
Functionality and Operation of Fluoroscopic Automatic Brightness Control/Automatic Dose Rate
Control Logic in Modern Cardiovascular and Interventional Angiography Systems. Report of
American Association of Physicists in Medicine (AAPM) Task Group 125. American Association of
Physicists in Medicine.
[8] Bushong, S. C. (2012). Radiologic Science for Technologists; Physics, Biology, and Protection.
Tenth edition, Elsevier Mosby, ISBN: 978-0-323-08135-1, pp. 54, 139, 188, 583.
[9] International Commission on Radiological Protection. The 2007 recommendations of the
international commission on radiological protection. ICRP publication 103. (2007). Annals of the
ICRP, 37(2-4), 1-332.
[10] Sandblom, V., Lundh, C., Almén, A. (2013). 2013:11Mätmetoder för bestämning av stråldoser
till ögats lins. Strålsäkerhetsmyndigheten.
[11] Olsson, M. Medical physicists, Ph.D. [Oral communication]. Helsingborg hospital, Sweden.
(2014).
[12] Huda, W., Scalzetti, E. M., & Levin, G. (2000). Technique factors and image quality as
functions of patient weight at abdominal CT. Radiology, 217(2), 430-435.
[13] Boone, J.M., Strauss, K.J., Cody, D.D., McCollought, C.H., McNitt-Gray, M.F., Toth, T.L.
(2011). Size-specific Dose Estimates (SSDE) in Pediatric and Adult Body CT Examinations.
Report of American Association of Physicists in Medicine (AAPM) Task Group 204. American
Association of Physicists in Medicine.

46
[14] Grant, K., Schmidt, B. (2011). CARE kV, Automated Dose-Optimized Selection of X-ray Tube
Voltage. White paper.
[15] European Commission. (2012). Radiation Protection N° 162, Criteria for Acceptability of
Medical Radiological Equipment used in Diagnostic Radiology, Nuclear Medicine and
Radiotherapy. European Union.
[16] Kalliokulju, K. Sonographer. [Oral communication]. Helsingborg hospital, Sweden. (2014).
[17] Brewster, D. C., Geller, S. C., Kaufman, J. A., Cambria, R. P., Gertler, J. P., LaMuraglia, G. M.,
. . . Zwolak, R. M. (1998). Initial experience with endovascular aneurysm repair: Comparison of
early results with outcome of conventional open repair. Journal of Vascular Surgery, 27(6), 992-
1005.
[18] Zarins, C. K., Wolf, Y. G., Lee, W. A., Hill, B. B., Olcott IV, C., Harris, E. J., . . . Fogarty, T. J.
(2000). Will endovascular repair replace open surgery for abdominal aortic aneurysm repair? Annals
of Surgery, 232(4), 501-507.
[19] Dua, A., Kuy, S., Lee, C. J., Upchurch Jr., G. R., & Desai, S. S. (2014). Epidemiology of aortic
aneurysm repair in the united states from 2000 to 2010. Accepted for publish in Journal of Vascular
Surgery. Abstract only.
[20] Ziehm Imaging GmbH. (2011). Ziehm Vision RFD: Operating Instructions. Germany
[21] Persson, A., Böiers, L.-C. (2001). Analys i en variabel. Second edition, Studentlitteratur, ISBN:
978-91-44-02056-3, p. 172.
[22] Leeds Test Objects Limited. Leeds test objects TOR TVF. (Manual). United Kingdom
[23] Philips Medical Systems. (2009). Bruksanvisning DoseAware Base Station Package,
Dokumentversion 1.0. Nummer 9897 100 01191 Philips Medical Systems Nederland B.V.

Appendix
Appendix A – Abdominal Aortic Aneurysm and Endovascular Aortic Repair
An abdominal aortic aneurysm, AAA, is a dilation of the part of the aorta that is within the
abdomen. AAA usually causes no symptoms, unless it ruptures, but in some cases the patient might
feel a pulsating lump. It is most often discovered as an incidental finding during another exam, or
by routine scan to screen for AAA. About 2-3 % of all men at the age of 65 have an AAA and most
counties in Sweden offer men at the age of 65 a routine scan, by ultrasound, to screen for AAA. The
prevalence of AAA is 4-6 times higher among men than women. [16]
At the screening the diameter of the abdominal aorta is measured and if it is less than 30 mm it is
considered normal and no dilation is present. The probability to develop an AAA after the age of 65
is small and, therefore, these individuals does not need to be reexamined later on. If the diameter of
the abdominal aorta exceeds 30 mm it is considered to be dilated and the patient will regularly be
examined to follow the growth of the aneurysm. A small aneurysm grows slowly, but as it gets
bigger it will also start to grow faster. When the aneurysm has reached a diameter of 55 mm the risk
of rupture increases significantly and an operation to repair the aneurysm, either by Open Aneurysm
Repair, OAR, or Endovascular Aortic Repair, EVAR, is advised. [16]
Risk factors for abdominal aortic aneurysm are: smoking, cardiovascular disease, hypertension and
heritage. [16]
Endovascular Aortic Repair, EVAR, is a less invasive treatment method of AAA compared to OAR.
Small incisions are made in the femoral artery in the groin area, and using guide wires and
catheters, an endovascular stent graft is placed at the site of the aneurysm. When the stent graft is in
its correct position the blood will flow through the graft taking away the pressure from the aortic
wall and preventing further dilation and rupture. The procedure is image guided and makes use of
fluoroscopic x-ray equipment.
When the EVAR procedure was introduced in the early 1990s [17] it became possible to treat
patients who had previously not been considered suitable for aneurysm repair [18]. In recent years,
however, the use of EVAR has increased in proportion to OAR even though the total number of
AAAs has remained stable [19].

Appendix B – Weighting Factors
Table B1 - Tissue weighting factors, wT. [9]

Appendix C – C-arm Facts
Table C1 – Facts on the C-arms used.
Philips Allura Xper FD20 Ziehm Vision RFD Hybrid
Type Stationary Mobile
Anode angle 11 10
Type of DAP meter Measuring Calculating
Application used for EVAR Buk frontal 3b/s Vaskulär central
Inherent filtering 4.7 mm Al 6.6 mm Al
Additional filter fluoroscopy Low dose mode: 0.9 mm Cu None
Medium dose mode: 0.4 mm Cu
High dose mode: 0.1 mm Cu
Additional filter image acquisition None None
Focal spot(mm) 0.4/0.7 0.3/0.6
Software version 7.2.4 5.30.3

Appendix D – PMMA Thicknesses
Table D1 – Thickness of PMMA plates.
Plate no. Thickness of PMMA Plate (cm)
1 1.0
2 1.0
3 1.0
4 1.0
5 5.0
6 5.0
7 10.8
8 10.9
The PMMA plates in table D1 were combined to PMMA phantom thicknesses as presented in table
D2.
Table D2 – PMMA phantom thicknesses.
PMMA Thickness (cm)
10.9
13.0
15.0
17.0
19.0
21.8
23.8
25.9
27.8
29.8
31.8
33.8
35.9

Appendix E – Recursion of Ziehm Vision RFD Image Acquisition Mode
The recursion logic of Ziehm Vision RFD image acquisition is described by equation (E1) and
figure E1. [20]
𝐼𝑚𝑎𝑔𝑒(𝑜𝑢𝑡) = 𝑎 ∙ 𝐼𝑚𝑎𝑔𝑒(𝑜𝑢𝑡, 𝑡 − 1) + 𝑏 ∙ 𝐼𝑚𝑎𝑔𝑒(𝑖𝑛)
(E1)
where NR is the numbers of recursion, 𝑎 = 1 −1
𝑁𝑅 and 𝑏 =
1
𝑁𝑅 [20]
Figure E1 – Schematic image of the recursion logic of Ziehm Vision RFD.
NR is displayed on the monitor of the C-arm. In this study NR was 8, hence a=0.875 and b=0.125.
When a new image(out) is created it make use of 12.5 % of the t image and 87.5 % of the t-1 image.
It can be said that image(out) consists of 87.5 % of image t-1 updated with 12.5 % of image t. The
farther back an image is taken, the lower the weight factor and, hence, it is of less importance in the
presented image. The weight factor for the (t-n)th
image is (7/8)n. The weight factors for the (t-n)
th
image is presented graphically in figure E2.
Figure E2 - The extent to which the image(t-n, out) is used in the present image(out).
0%
10%
20%
30%
40%
50%
60%
70%
80%
90%
100%
-35 -33 -31 -29 -27 -25 -23 -21 -19 -17 -15 -13 -11 -9 -7 -5 -3 -1
Pre
cen
ce o
f th
e Im
age
(t-
n, o
ut)
in
Imag
e (
ou
t) (
%)
Image (n)

As several images are added together the presented image contains more information than a single
image would. The mAs value that is used to build up the image is that of several images. How many
can be described by the geometric series presented in equation (E2)
∑(𝑥𝑛)
∞
𝑛=0
(E2)
which converges with the sum ∑ (𝑥𝑛) =1
1−𝑥
∞
𝑛=0
if |𝑥| < 1. [21] In the recursion logic mentioned above x=7/8, hence, the sum is 8.
It can be said that the image shown on the monitor of Ziehm Vision RFD is made up of as much
mAs as would have been used for 8 single images, of the type image(in, t). To clarify, if there is no
movement in the image then image acquisition (with recursion) can be expected to give the same
result as if eight single exposures were added together. Hence, to get an appropriate comparison, the
mAs value used for Ziehm should be as much as it takes to create 8 images.
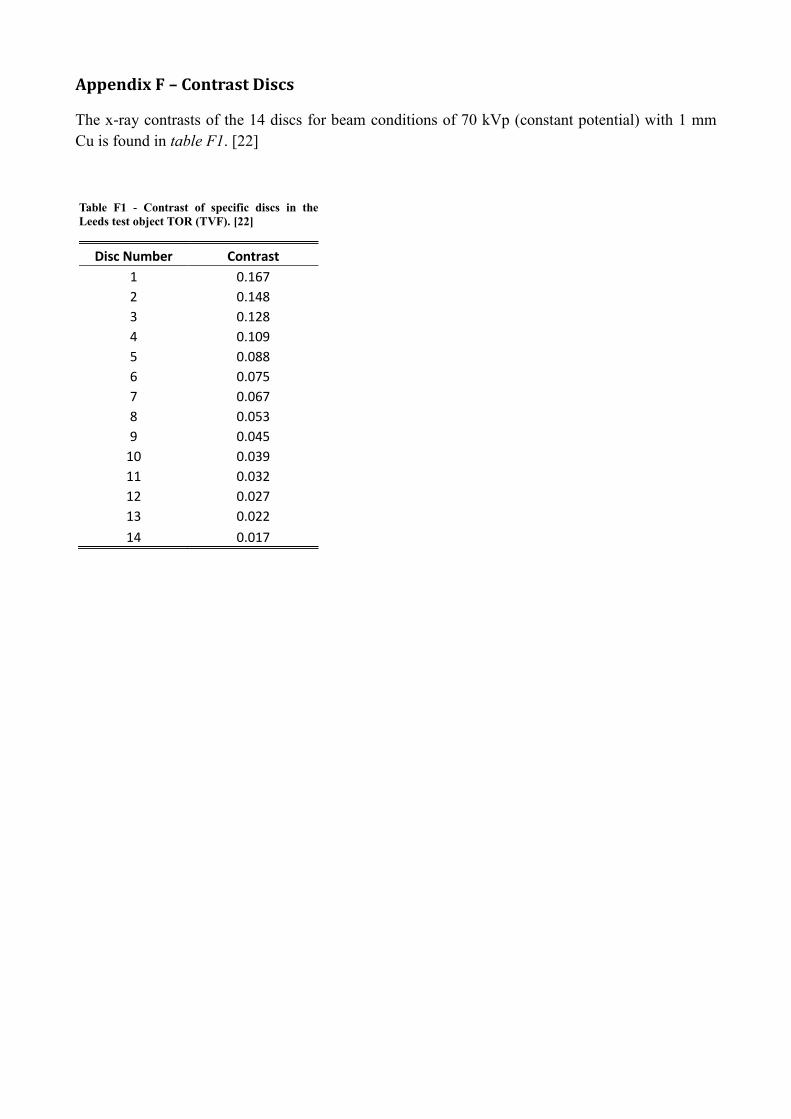
Appendix F – Contrast Discs
The x-ray contrasts of the 14 discs for beam conditions of 70 kVp (constant potential) with 1 mm
Cu is found in table F1. [22]
Table F1 - Contrast of specific discs in the
Leeds test object TOR (TVF). [22]
Disc Number Contrast
1 0.167
2 0.148
3 0.128
4 0.109
5 0.088
6 0.075
7 0.067
8 0.053
9 0.045
10 0.039
11 0.032
12 0.027
13 0.022
14 0.017
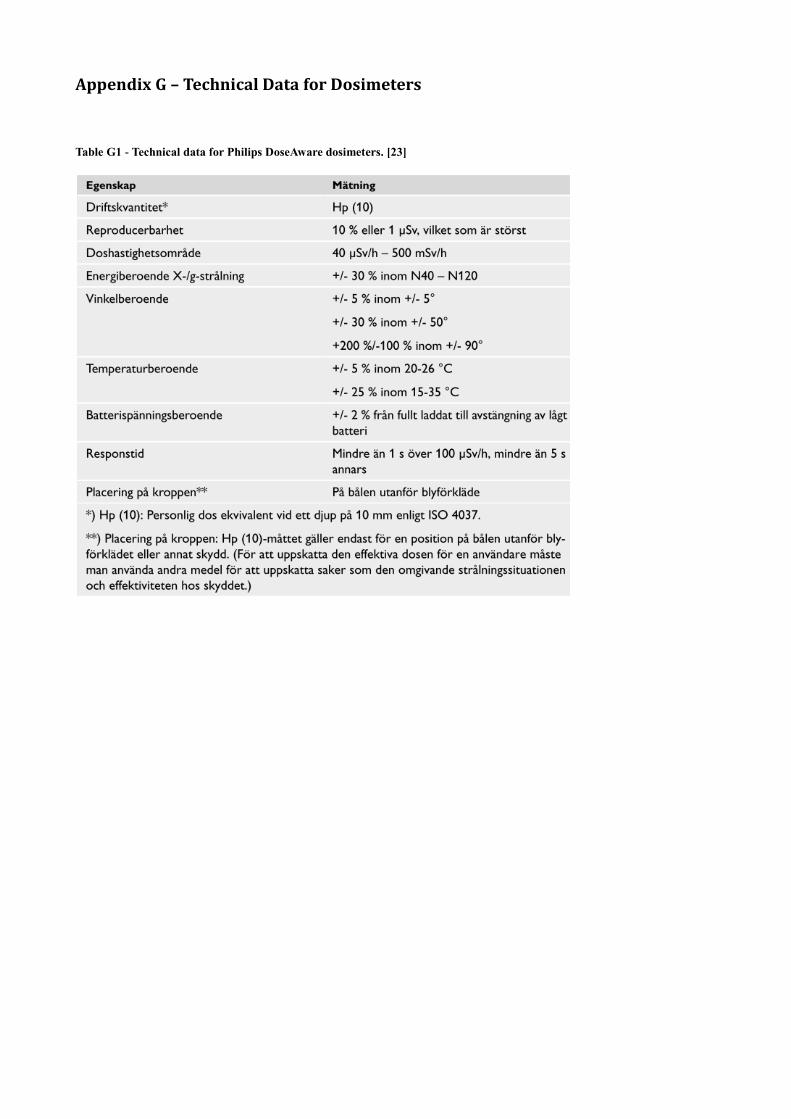
Appendix G – Technical Data for Dosimeters
Table G1 - Technical data for Philips DoseAware dosimeters. [23]

Appendix H – Measurement Results Personnel Exposure
Figure H1 – Personnel exposure as a function of PMMA thickness, Philips Allura Xper low dose mode.
Figure H2 – Personnel exposure as a function of PMMA thickness, Philips Allura Xper medium dose mode.
0
5
10
15
20
25
30
35
10 15 20 25 30 35
Do
se R
ate
(m
Sv/h
)
PMMA Thickness (cm)
Dose Rate vs. PMMA ThicknessPhilips Low
h=170 cm
h=140 cm
h=110 cm
h=80 cm
h=50 cm
0
5
10
15
20
25
30
35
10 15 20 25 30 35
Do
se R
ate
(m
Sv/h
)
PMMA Thickness (cm)
Dose Rate vs. PMMA ThicknessPhilips Medium
h=170 cm
h=140 cm
h=110 cm
h=80 cm
h=50 cm

Figure H3 – Personnel exposure as a function of PMMA thickness, Philips Allura Xper high dose mode.
Figure H4 – Personnel exposure as a function of PMMA thickness, Ziehm Vision RFD.
0
5
10
15
20
25
30
35
10 15 20 25 30 35
Do
se R
ate
(m
Sv/h
)
PMMA Thickness (cm)
Dose Rate vs. PMMA ThicknessPhilips High
h=170 cm
h=140 cm
h=110 cm
h=80 cm
h=50 cm
0
5
10
15
20
25
30
35
10 15 20 25 30 35
Do
se R
ate
(m
Sv/h
)
PMMA thickness (cm)
Dose Rate vs. PMMA ThicknessZiehm
h=170 cm, PW 57%
h=140 cm, PW 57%
h=110 cm, PW 57%
h=80 cm, PW 57%
h=50 cm, PW 57%
h=170 cm, PW 100%
h=140 cm, PW 100%
h=110 cm, PW 100%
h=80 cm, PW 100%
h=50 cm, PW 100%


![Best power point evar! [autosaved]](https://img.dokumen.tips/doc/110x75/548bdd07b479592b788b460b/best-power-point-evar-autosaved.jpg)