Embed Size (px)
Citation preview

Talanta 104 (2013) 140–148
Contents lists available at SciVerse ScienceDirect
Talanta
0039-91
http://d
n Corr
E-m
journal homepage: www.elsevier.com/locate/talanta
Comparison of on-line detectors for field flow fractionation analysisof nanomaterials
A.J. Bednar a,n, A.R. Poda a, D.M. Mitrano b, A.J. Kennedy a, E.P. Gray c, J.F. Ranville b, C.A. Hayes d,F.H. Crocker a, J.A. Steevens a
a US Army Engineer Research and Development Center, Environmental Laboratory, 3909 Halls Ferry Rd., Vicksburg, MS 39180, USAb Department of Chemistry and Geochemistry, Colorado School of Mines, Golden, CO 80401, USAc Department of Civil and Environmental Engineering, Colorado School of Mines, Golden, CO 80401, USAd Badger Technical Services, Vicksburg, MS 39180, USA
a r t i c l e i n f o
Article history:
Received 4 June 2012
Received in revised form
2 November 2012
Accepted 7 November 2012Available online 19 November 2012
Keywords:
Nanomaterials
Detection
Sizing
Field flow fractionation
ICP–MS
ICP–AES
40/$ - see front matter Published by Elsevier
x.doi.org/10.1016/j.talanta.2012.11.008
esponding author. Tel.: þ1 601 634 3652.
ail address: [email protected]
a b s t r a c t
Characterization of nanomaterials must include analysis of both size and chemical composition. Many
analytical techniques, such as dynamic light scattering (DLS), are capable of measuring the size of
suspended nanometer-sized particles, yet provide no information on the composition of the particle.
While field flow fractionation (FFF) is a powerful nanoparticle sizing technique, common detectors used
in conjunction with the size separation, including UV, light-scattering, and fluorescence spectroscopy,
do not provide the needed particle compositional information. Further, these detectors do not respond
directly to the mass concentration of nanoparticles. The present work describes the advantages
achieved when interfacing sensitive and elemental specific detectors, such as inductively coupled
plasma atomic emission spectroscopy and mass spectrometry, to FFF separation analysis to provide
high resolution nanoparticle sizing and compositional analysis at the mg/L concentration level, a
detection at least 10–100-fold lower than DLS or FFF–UV techniques. The full benefits are only achieved
by utilization of all detector capabilities, such as dynamic reaction cell (DRC) ICP–MS. Such low-level
detection and characterization capability is critical to nanomaterial investigations at biologically and
environmentally relevant concentrations. The techniques have been modified and applied to char-
acterization of all four elemental constituents of cadmium selenide–zinc sulfide core–shell quantum
dots, and silver nanoparticles with gold seed cores. Additionally, sulfide coatings on silver nanoparticles
can be detected as a potential means to determine environmental aging of nanoparticles.
Published by Elsevier B.V.
1. Introduction
Nanotechnology offers potential advancements for both indus-trial and commercial sectors, including useful products eitherwhen used alone or when integrated with other materials intolarger products (e.g., consumer goods, foods, pesticides, pharma-ceuticals, and personal care products, among others). Specifically,it is particularly important to develop improved detectiontechniques for metal-containing nanoparticles (NPs) since theyare the fastest growing category of engineered NPs (ENPs).With the list of applications growing rapidly, the use of nano-materials could potentially impact environmental systems.In fact, a number of life cycle assessments concluded that asignificant amount of metal bearing NPs is likely to enter aquaticsystems [1–3]. Despite the rapid progress, use, and probable
B.V.
l (A.J. Bednar).
release of nanoproducts to the environment, questions remainon the potential toxicological risk to the biome [4,5].
Understanding nanoparticle fate in the environment isdifficult, due in part to challenges associated with detectingsmall amounts in complex environmental and biological matrices.These complex, heterogeneous matrices may confound detectionof very low (mg/L or less) levels of engineered nanomaterials.Spectrometry techniques, including a very new method, singleparticle ICP–MS (SP–ICP–MS), have been applied for the detectionof NP determining both concentration and size simultaneously[6–8]. However, the most commonly used detection and char-acterization methods available to assess particle concentrationand size distributions are not adequate for the study of NPs incomplex systems or at low concentrations [9]. These includemicroscopy [10], chromatography [11], centrifugation [12], laserlight scattering [13], and filtration [14,15]. One particular analy-tical challenge is distinguishing engineered nanoparticles fromother constituents of the matrix such as natural particles, humicsubstances, and debris [16]. Perhaps the major problem identified

A.J. Bednar et al. / Talanta 104 (2013) 140–148 141
with most techniques relates to method sensitivity, which isgenerally insufficient compared to environmentally and toxicolo-gically relevant concentrations (mg/L to ng/L ranges) [17,18].
One of the most commonly used approaches to study nano-particles is microscopy, either Transmission Electron Microscopy(TEM) or scanning probe microscopy. Theoretically, microscopyoffers the ultimate sensitivity, with the ability to detect/image asingle nanoparticle; however, accomplishing this practically isequivalent to the proverbial ‘needle in a haystack’. These techniquescreate images of single particles but their shortcomings includeunrepresentative sampling, changes during the preparative process(i.e., agglomeration), and inability to find particles in very dilutesamples. Another common approach that has long been used tostudy colloidal solutions is Dynamic Light Scattering (DLS), whichmeasures the particle hydrodynamic diameter. However, limitationsfor the study of nanoparticles are numerous including: poorsensitivity at dilute concentrations, nonselective material detection,failure to differentiate between nanoparticles and other matrixcomponents, and the inability to reliably quantify the relativeproportions of particle or aggregate sizes in multi-modal distribu-tions. Multi-modal populations are particularly problematic for DLSas intensity-normalized results will characteristically be dispropor-tionately skewed to the larger particles/aggregates in suspensioneven if smaller sizes predominate. Furthermore, many analyticaltechniques have difficulty distinguishing organic coatings that maybe present on nanoparticles.
Field flow fractionation (FFF) consists of a suite of highresolution sizing techniques which allows separation and sizingof macromolecules, submicron colloids, and nanoparticles of1–100 nm, depending on the type of field applied and mode ofoperation [19]. The separation process is similar to chromato-graphy except that it is based on physical forces (e.g., diffusion) asopposed to chemical interactions. Particle separation is preformedin a thin channel with laminar flow under the influence of aperpendicular field. Depending on the type of analysis that isbeing performed, a different member of the FFF family wouldbe chosen to achieve optimal separation results. The threetechniques that are the most commercially available and thusmost commonly used include thermal, sedimentation and flowFFF. Applications of FFF have become increasingly diverse in therecent years to include separation and characterization of pro-teins [20], polymers [21], cells [22], natural nanoparticles [23]and more recently manufactured nanoparticles [24].
Flow FFF (FlFFF) was chosen for this research because it is themost widely used subset of techniques for environmental analysisand is highly versatile for a range of both natural and manufac-tured NPs. As outlined in Baalousha and Lead [25], the increaseduse of FlFFF can be related to the wide size range that can befractionated either of natural colloids (1–1000 nm) or natural andmanufactured NP (1–100 nm) [26]. Many FFF techniques, includ-ing FlFFF, are also adaptive, allowing the ability to change carriersolutions with respect to pH and ionic strength as to match thecarrier solution with sample composition [27], and the possibilityof both on-line hyphenation to a wide range of detectors as wellas collection of sample fractions for further off-line analysis[25,28–31,8].
UV absorbance is a common non-destructive detector for on-line processes; therefore, FFF–UV hyphenation has been usedextensively. However, with the sensitivity limited generally toparticle concentrations in the mg/L range, FFF–UV is not suitablefor many environmental studies since aggregation behavior maybe vastly different at low mg/L levels where the probabilityof particle-to-particle collisions is lower. Additionally, the UVdetector lacks specificity, even when multiple wavelengths areemployed. Interfacing FFF with ICP–MS or ICP–AES, however,allows element specific detection at trace concentration levels
[32] when studying metal-containing NP [33]. Several reviewshave been published discussing the broad range of environmental[32,34], biological [35,36], and nanoparticle [18,37–39] applica-tions for FFF–ICP–MS [40]. Furthermore, the capability of multi-metal analysis is an added benefit when using these detectiontechniques.
Though literature is scarce to engineered nano-specific studies,there is a growing potential for the use of FFF in nanoecotoxicitystudies with increasing interest concerning characterizationmethodology for environmental and biological risk evaluation.Notably, recent studies to characterize quantum dots [41] and NP[42–44] in biological media before and after exposure, as well asenvironmental samples [28,45,46] have shown promising resultswhen using FFF–ICP–MS and FFF–ICP–AES. The resultant hyphe-nated techniques of FFF–ICP–MS and FFF–ICP–AES described inthe present study provide nanoparticle detection, sizing, andcompositional analysis capabilities at the mg/L level for multipleelements present within the nanoparticle, which is critical toenvironmental and toxicological investigations of nanomaterials[14,40]. We demonstrate the advantages of using dynamic reac-tion cell ICP–MS and ICP–AES detectors for non-metallic analytespresent in nanomaterials in addition to standard ICP–MS incomparison to UV absorbance detection. The methodology devel-oped in the current work expands detection capabilities formultiple components of nanoparticle systems, including core–shell gold–silver nanoparticles, Cd–Se–Zn–S quantum dots, andsilver nanoparticles after sulfidation, these methods can be usedfor more descriptive nanoparticle fate and characterization.
2. Materials and methods
2.1. Reagents and nanoparticles
All nanoparticles were obtained from commercially availablesources. Aqueous NanoXact silver nanoparticle suspensions(nominal primary particle sizes of 10, 20, 30, and 60 nm) werepurchased from Nanocomposix (San Diego, CA) at 20 mg/L stockconcentration stabilized with either citrate or tannic acid. Theseparticles were nearly monodisperse in size as determined byTransmission Electron Microscopy, DLS, and FFF–ICP–MS analyses[42]. Aqueous suspensions of gold nanoparticles were purchasedfrom the National Institute of Standards and Technology (NIST,Standard Reference Materials 8011, 8012, and 8013) at nominal50 mg/L stock concentrations. These particles were also mono-disperse as determined by Atomic Force Microscopy, DLS, andFFF–ICP–MS analyses.
All nanosilver and nanogold stock solutions were diluted in18.2 MO cm deionized water and used immediately after dilution.UV–vis spectra were obtained for the Ag and Au particles using aBeckman-Coulter DU 800 spectrometer. Cadmium selenide–zincsulfide core–shell quantum dots (eFluorTM605NC carboxyl func-tionalized) were purchased from eBioscience, Inc. (San Diego, CA)at a reported 10 mM concentration stabilized with DSPEPEGlipid (1,2-distearoyl-sn-glycero-3-phosphoethanolamine-N-[carboxy-(polyethylene glycol)-2000]) and received in 0.1 M borate, 0.3 MNaCl, �0.01% Sodium Azide at pH 8.3. This stock solution wasdiluted 1:200 in 18.2 MO-cm deionized water for all FFF analysespresented below (which results in cadmium, zinc, selenium, andsulfur concentrations of 7.73, 4.12, 1.72, and 43.9 mg/L, respec-tively, as determined by ICP–MS and ICP–AES analysis).
2.2. Asymmetrical FFF(AF4) and DLS
AF4–UV and AF4–light scattering analysis was performed toprovide a comparison to the use of ICP–MS and ICP–AES detection
A.J. Bednar et al. / Talanta 104 (2013) 140–148142
described below. For these experiments an asymmetrical fieldflow fractionation system (AF4) from Postnova Analytics (SaltLake City, UT) was interfaced to a Shimadzu UV–vis detector and aMalvern NanoZS (Malvern, UK). The AF4 channel was fitted with a10 kDa regenerated cellulose membrane and 350 mm channelspacer. The mobile phase was 0.025% FL-70 and 0.01% sodiumazide made in deionized water at 18.2 MO-cm (Barnstead, USA).Separation of particles was performed using a cross flow of0.75 mL/min and a channel flow of 1.0 mL/min. The AF4 eluentwas plumbed directly through both the UV–vis and DLS detectorswithout any channel split. DLS measurements were performed inflow mode using a quartz flow-through cell (Hellma, Germany).Additional AF4 details are presented in Table 1.
Static DLS measurements of quantum dots, silver and goldnanoparticles were determined using a Brookhaven 90 Plus/BI-MAS instrument (Brookhaven Instruments, Holstville, NY, USA),as previously described [17]. Briefly, 2 mL samples were measuredfor nine minutes (three, 3 min replicates) using a scatteringintensity weighted autocorrelation function, providing meaneffective (hydrodynamic) diameters and one standard deviation.For the 10 nm nanogold, log normal distributions of intensity and
Table 1Separation and detection instrument parameters used to measure nanoparticles
by FFF techniques.
Symmetrical FFF–UV–ICP–MS/AES system
Postnova F-1000
Membrane 10 kDa regenerated cellulose
Channel and cross flow 1.0 and 0.75 mL/min, respectively
Injection volume 50 mL
Channel thickness 254 mm
Load time 15 s
Relaxation time 3.2 min
Approximate fractogram time
(100 nm particle elution)
25 min
Asymmetrical FFF–UV–DLSsystem
Postnova AF-2000MT
Membrane 10 kDa regenerated cellulose
Channel and cross flow 1.0 and 0.75 mL/min, respectively
Injection volume 100 mL
Channel thickness 350 mm
Injection-focusing time 8 min
Approximate fractogram time
(60 nm particle elution)
22 min
UV absorbance detector Agilent 1100 VWD
Wavelength monitored 254, 395, 420, or 520 nm
Integration time 0.4 s
ICP–MS Perkin Elmer Elan DRC II
Plasma power 1250 W
Nebulizer, spray chamber, and
flow
MiraMist, Double Pass Scott, 0.85 L/min
Masses monitored (standard
mode)
107Ag, 109Ag, 197Au, 111Cd, 66Zn, 82Se
Masses monitored (DRC mode) 111Cd, 66Zn, 78Se, 48SO, 107Ag, 197Au
DRC reaction gas and flowrate Ultrapure oxygen, 0.7 mL/min
RPq for DRC mode 111Cd¼0.75, 66Zn¼0.75, 78Se¼0.75,48SO¼0.55, 107Ag¼0.75, 197Au¼0.75
Dwell time per AMU 200–500 ms
Readings per replicate 1200–1800
ICP–AES Perkin Elmer Optima 5300 DV
Plasma power 1400 W
Nebulizer, spray chamber, and
flow
MiraMist, Cyclonic, 0.65 L/min
Plasma viewing mode Axial
Wavelengths monitored Ag 328.068 nm, Au 267.595 nm, Cd
228.802 nm, Zn 206.200 nm, Se 196.026 nm,
S 180.669 nm
Integration time 5 s
Readings 300
particle weighted algorithms were compared to investigate thelarger than expected hydrodynamic diameter obtained.
2.3. Symmetrical FFF (SF4)
The SF4 instrument used for on-line interfacing with ICP–MSand ICP–AES was an F-1000 symmetrical FFF system from Post-nova Analytics. It was interfaced to a Perkin Elmer Elan DRC IIICP–MS or a Perkin Elmer Optima 5300 DV ICP–AES by connectionof the FFF effluent tubing directly to the MiraMist pneumaticnebulizer. An injection contact closure then triggered the ICP–MSto begin acquiring data. An Agilent 1100 variable wavelengthdetector was placed in-line between the SF4 and ICP systems tocollect UV absorption data simultaneously. In addition to detec-tion of the metal nanoparticles of interest, the UV detector datawas also used for detection of NIST-traceable polystyrene beadsize standards to convert retention time into particle size [42].The SF4 system was equipped with a 10 kDa regenerated cellulosemembrane and 254 mm channel spacer. The mobile phaseconsisted of a 0.025% sodium azide and 0.025% FL-70 surfactantdissolved in deionized water with a resistivity of 18.2 MO-cm;these instrumental conditions are similar to the asymmetricalsystem described above. Separation of the particles under inves-tigation was achieved using a channel flow of 1.0 mL/min and across flow of 0.75 mL/min. The channel flow conditions allowdirect connection of the SF4 effluent after the UV detector to theICP–MS and ICP–AES nebulizers without the use of a flow splitter.Additional details of the SF4 separation conditions are also listedin Table 1.
The ICP–MS was operated in standard mode for the detectionof silver, gold, and cadmium selenide quantum dots. However, toimprove detection of selenium and allow the detection of sulfur inthe quantum dots analyses, oxygen was used subsequently in theICP–MS dynamic reaction cell to detect the more abundant 78Seisotope and create the polyatomic species 48SO. The dwell timeper AMU was selected for each SF4 analysis such that one datapoint was collected per second. The number of readings perreplicate was chosen such that data were collected for the entirelength of the fractogram, usually for about 25 min. Table 1 alsolists the operating conditions for the variable wavelength detectorand ICP–MS.
The ICP–AES was operated with a nitrogen spectrometer purgeto improve detection of low UV emission elements (e.g., Seleniumand Sulfur), and generally used the most intense emissionwavelength available. Integration time for each data point was5 s to maximize detection of the transient signal. The number ofreadings was also chosen such that data were collected for theentire length of the fractogram, usually for about 25 min. Table 1also lists the operating conditions for the ICP–AES.
3. Results and discussion
3.1. Gold and silver nanoparticles
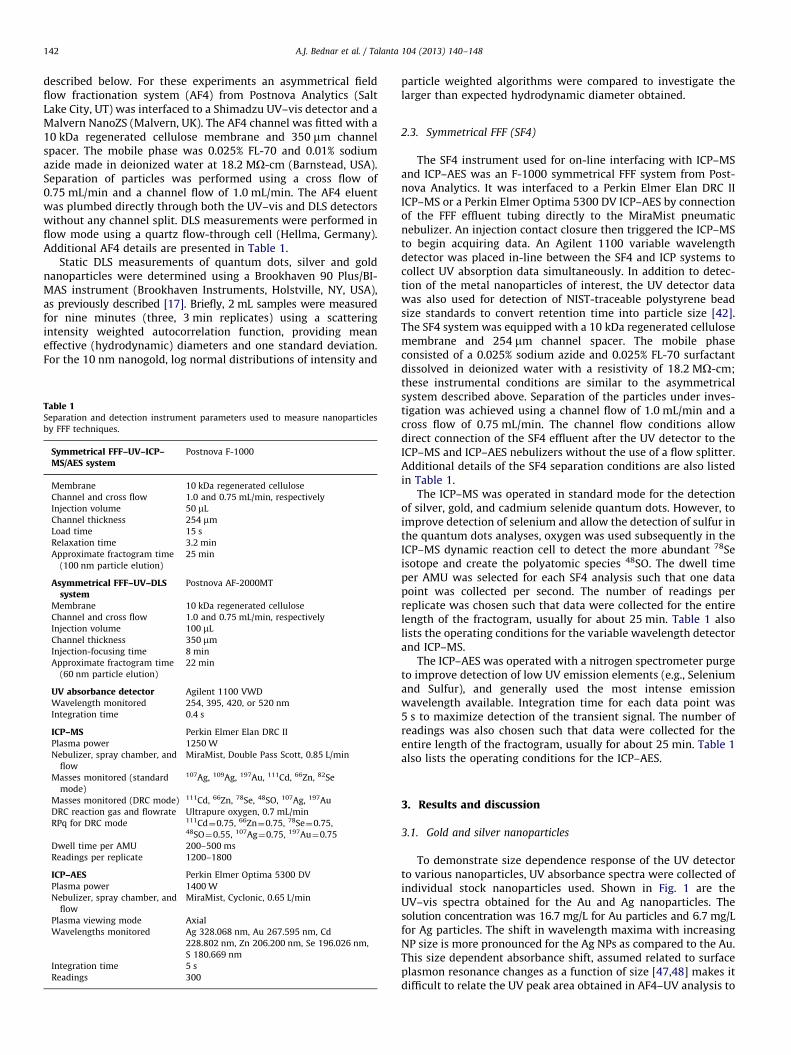
To demonstrate size dependence response of the UV detectorto various nanoparticles, UV absorbance spectra were collected ofindividual stock nanoparticles used. Shown in Fig. 1 are theUV–vis spectra obtained for the Au and Ag nanoparticles. Thesolution concentration was 16.7 mg/L for Au particles and 6.7 mg/Lfor Ag particles. The shift in wavelength maxima with increasingNP size is more pronounced for the Ag NPs as compared to the Au.This size dependent absorbance shift, assumed related to surfaceplasmon resonance changes as a function of size [47,48] makes itdifficult to relate the UV peak area obtained in AF4–UV analysis to
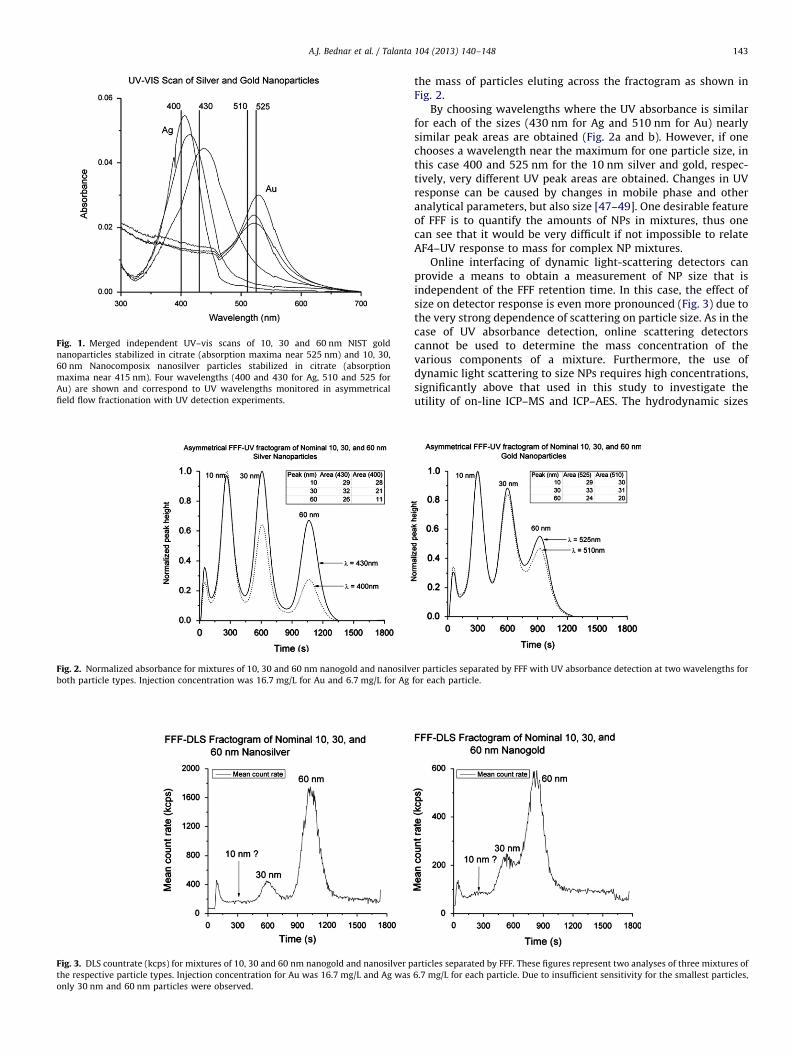
Fig. 1. Merged independent UV–vis scans of 10, 30 and 60 nm NIST gold
nanoparticles stabilized in citrate (absorption maxima near 525 nm) and 10, 30,
60 nm Nanocomposix nanosilver particles stabilized in citrate (absorption
maxima near 415 nm). Four wavelengths (400 and 430 for Ag, 510 and 525 for
Au) are shown and correspond to UV wavelengths monitored in asymmetrical
field flow fractionation with UV detection experiments.
Fig. 2. Normalized absorbance for mixtures of 10, 30 and 60 nm nanogold and nanosilv
both particle types. Injection concentration was 16.7 mg/L for Au and 6.7 mg/L for Ag
Fig. 3. DLS countrate (kcps) for mixtures of 10, 30 and 60 nm nanogold and nanosilver p
the respective particle types. Injection concentration for Au was 16.7 mg/L and Ag was
only 30 nm and 60 nm particles were observed.
A.J. Bednar et al. / Talanta 104 (2013) 140–148 143
the mass of particles eluting across the fractogram as shown inFig. 2.
By choosing wavelengths where the UV absorbance is similarfor each of the sizes (430 nm for Ag and 510 nm for Au) nearlysimilar peak areas are obtained (Fig. 2a and b). However, if onechooses a wavelength near the maximum for one particle size, inthis case 400 and 525 nm for the 10 nm silver and gold, respec-tively, very different UV peak areas are obtained. Changes in UVresponse can be caused by changes in mobile phase and otheranalytical parameters, but also size [47–49]. One desirable featureof FFF is to quantify the amounts of NPs in mixtures, thus onecan see that it would be very difficult if not impossible to relateAF4–UV response to mass for complex NP mixtures.
Online interfacing of dynamic light-scattering detectors canprovide a means to obtain a measurement of NP size that isindependent of the FFF retention time. In this case, the effect ofsize on detector response is even more pronounced (Fig. 3) due tothe very strong dependence of scattering on particle size. As in thecase of UV absorbance detection, online scattering detectorscannot be used to determine the mass concentration of thevarious components of a mixture. Furthermore, the use ofdynamic light scattering to size NPs requires high concentrations,significantly above that used in this study to investigate theutility of on-line ICP–MS and ICP–AES. The hydrodynamic sizes
er particles separated by FFF with UV absorbance detection at two wavelengths for
for each particle.
articles separated by FFF. These figures represent two analyses of three mixtures of
6.7 mg/L for each particle. Due to insufficient sensitivity for the smallest particles,

Fig. 4. FFF–UV, FFF–ICP–MS, and FFF–ICP–AES fractograms of six nanoparticle types at 200 mg/L concentration for each particle. The FFF–UV fractograms are composites
plotted from four individual analyses of three particle mixtures (nanogold and nanosilver at two wavelengths), whereas the fractograms using the ICP–MS and ICP–AES are
single analyses of a mixture of all six nanoparticles. The FFF–ICP–MS determined sizes for gold and silver were 18 and 18, 34 and 37, and 62 and 69 nm, respectively.
A.J. Bednar et al. / Talanta 104 (2013) 140–148144
obtained by online DLS for the samples in Fig. 3 were unreliableand are not reported.
Use of ICP–MS and ICP–AES detectors’ elemental specificityallows simultaneous detection of all six nanoparticle types mixedin a single solution. Fig. 4 shows SF4–UV, SF4–ICP–MS, and SF4–ICP–AES fractograms of nominally 10, 30, and 60 nm nanosilverand nanogold particles. Due to the non-selective nature of the UVdetector, the data shown for the SF4–UV fractogram is a compo-site of four separate analyses: three mixed nanosilver particletypes with UV detection at 420 nm, three mixed nanosilver particletypes with UV detection at 520 nm, three mixed nanogold particletypes with UV detection at 420 nm, and three mixed nanogoldparticle types with UV detection at 520 nm. In contrast to the UVabsorbance data, however, use of ICP–MS and ICP–AES detectors’elemental specificity allows simultaneous detection of all six nano-particle types mixed in a single solution. The SF4–ICP–MS and DLSdetermined particle sizes were similar, with the exception of the10 nm gold which was more than 2-fold higher when measured byDLS. The SF4–ICP–MS determined sizes for gold and silver were 18and 18, 34 and 37, and 62 and 69 nm, respectively. These values agreereasonably well with size determinations in single particle solutionsby DLS for gold (31, 36, and 60 nm) and silver (22, 41, and 67 nm)[41,42]. The larger than expected DLS size for 10 nm gold wasinvestigated by comparing a particle number versus the scatteringintensity weighted autocorrelation, with the particle number functionresulting in a much smaller hydrodynamic diameter (7 nm). This maysuggest that impurities in the suspension or a few large particlesskewed the DLS measurement to a larger size.
The superior detection capabilities of the ICP–MS are clearlyevident in Fig. 4, compared to either ICP–AES or UV absorbance.The peak height for the ICP–MS fractogram suggests that a 1:20dilution would still produce discernable peaks, resulting inestimated detection limits near 10 mg/L as previously reported[41,42]. However, despite the ICP–AES not being as sensitive asICP–MS, the elemental specificity is superior to the UV absor-bance results, and allows simultaneous detection of mixed goldand silver nanoparticles. Detection limits for gold nanoparticlesby ICP–AES are near the 200 mg/L level shown in Fig. 4, however,the silver intensity is sufficient that a 1:2 dilution of this samplecould still be measured, suggesting a detection limit around100 mg/L. The use of NIST gold particles for size calibration (withor without ICP–MS or ICP–AES detection) in place of polystyrenebeads and UV absorbance detection is possible based on theseresults, however, agreement between both types of size standardsand detectors provides validity to the methodology.
3.2. Quantum dots
Multi-element detection capabilities may not always beneeded for environmental studies where a pure phase is beingadded to model system. However, these sensitive techniques maybe applicable to determining co-occurring constituents withina nanoparticle. Quantum dots represent a test case of a nano-material containing several metals that occupy different structuralelements of the particle. The QDs tested below have a cadmiumselenide core with a zinc sulfide shell, surrounded by a stabilizing

A.J. Bednar et al. / Talanta 104 (2013) 140–148 145
carboxylic functionalized organic coating. One property of QDs isabsorption of UV radiation, and therefore the SF4–UV fractogramshown in Fig. 5 demonstrates a very strong response for theseparticles at 50 nM concentration. FFF sizing of these particlesyields a hydrodynamic diameter of 27 nm, which agrees well withDLS measurements of ranging from 15 to 31 nm. The DLS analysisrequired a more concentrated solution (approximately 500 nM)
Fig. 5. FFF–UV fractogram of carboxylated CdSe–ZnS quantum dots with UV
absorbance detection at 254 nm.
Fig. 6. FFF–ICP–MS, FFF–ICP–DRC–MS, and FFF–ICP–AES, fractograms of CdSe–ZnS cor
The prominent void peak likely represents unreacted starting materials from the synth
than was required for FFF analysis (50 nM) and resulted in asecond population of particle aggregates near 500 nm being thedominant population measured by DLS.
The fractogram in Fig. 5 shows excellent detection capabilitiesof the quantum dots by SF4–UV, but still suffers from lack ofspecificity, particularly if there are mixtures of particles present.Analysis of the same sample by SF4–ICP–MS and SF4–ICP–AES isshown in Fig. 6, and again demonstrates the advantages andlimitations of these detectors. ICP–MS has superior detectioncapabilities compared to ICP–AES for cadmium and zinc, althoughboth techniques are quite sensitive for these two elements.Standard mode ICP–MS, however, is unable to measure sulfurbecause of severe polyatomic interferences on all sulfur isotopes(particularly the most abundant, e.g., 32O2 on 32S), whereasICP–AES can measure sulfur, although sulfur does not have astrong emission wavelength. Selenium is not particularly sensitiveby either technique, due to the need to measure a low abundanceisotope in ICP–MS (e.g., 82Se) and the relatively weak seleniumemission wavelength. Due to the sensitivity of Cd and Zn by bothICP–MS and ICP–AES, if only these two metals were used to detectthe quantum dots shown in Fig. 7, it could be accomplished atlevels 1000 and 100 times lower, respectively, than shown(approximately 0.05 and 0.5 nM, Cd and Zn concentrations ofapproximately 8 and 41 mg/L, respectively, which agrees rela-tively well with results for other metals described above andelsewhere [42]). Because the Se and S signals are substantiallyweaker than the Cd and Zn signals, detection of quantum dots at alevel 10 times lower would represent Se and S concentrationsof 0.172 and 4.39 mg/L, respectively, demonstrating for absolute
e–shell quantum dots showing ability to measure 3- and 4-element components.
esis procedure.

Fig. 7. FFF–UV and FFF–ICP–DRC–MS fractograms of tannic acid coated nanosilver with and without sulfidation.
A.J. Bednar et al. / Talanta 104 (2013) 140–148146
detection, Cd and Zn represent the most sensitive candidates byeither ICP–MS or ICP–AES.
Advances in ICP–MS technology, however, have included theaddition of collision and reaction cells where gases are introducedpost-plasma ionization to remove molecular interferences orcreate new molecular species to measure. This technology hasbeen successfully applied for formation of oxide species incomplex matrices [50]. For the current study, addition of oxygento the dynamic reaction cell (DRC) is used to create a newpolyatomic species 48SO, to remove it from the 32O2 majorinterferent. The SF4–ICP–DRC–MS fractogram of the quantumdot sample is also shown in Fig. 6.
Use of the oxygen reaction gas in the DRC also removes 78Ar2
dimers formed in the plasma, thereby allowing detection of themore abundant 78Se isotope, compared to 82Se that is used instandard mode ICP–MS (23.78 vs. 8.73% abundance). Due to thehigh ionization potential of sulfur, and inefficiency in creating theoxygen polyatomic analyte, the signal intensity for 48SO is onlyslightly better than the ICP–AES detection of the sulfur emissionat 180.669 nm, but is a significant improvement over the standardICP–MS method which could not detect all elements present inthe nanoparticle. The DRC conditions listed in Table 1 wereoptimized for both selenium and sulfur, i.e., the oxygen flow rateof 0.7 mL/min was sufficient to remove all 78Ar2 dimers with littleloss of 78Se signal, however, a higher oxygen flow rate willimprove 48SO formation, with a minimal loss of signal for theother three analytes (Fig. 5). These conditions were chosen toallow simultaneous detection of all species since it is notphysically possible to switch between DRC and standard modeICP–MS within a single transient FFF analysis. The ability todetect all four elements present in quantum dot nanoparticlesby either ICP–AES or ICP–DRC–MS presents specific advantagesto UV detection. The FFF provides sizing for the overall nano-particle, however, if the ICP elemental signals are quantified, then
relative sizes of the core–shell system can be estimated, providingadditional structural information.
3.3. Silver nanoparticle sulfidation
The use of multi-element detection capabilities is furtherdemonstrated by the application of SF4–ICP–DRC–MS analysisto silver nanoparticles that have undergone surface sulfidation.Due to the ability of silver (and other noble metals) to ‘tarnish’when exposed to sulfide, being able to detect sulfur simulta-neously with these nanoparticles provides a way to measureenvironmental aging [51–53]. Shown in Fig. 7 are a series offractograms using UV and ICP–DRC–MS detectors of 20 nm tannicacid capped silver nanoparticles at 1 mg/L silver concentrationwith and without exposure to sodium sulfide (4:1 sulfur:silvermolar ratio) for 4 days. The UV wavelength of 395 nm was chosenas this is the maximum absorbance wavelength for this specificnanoparticle. Because ICP–DRC–MS was shown in the previousquantum dot application to be slightly more sensitive than ICP–AES for sulfur detection, only it was used for the sulfur coatingidentification experiment.
The ICP–MS and reaction cell conditions for these analyseswere optimized to maximize the detection of 48SO specifically,and varied slightly from the conditions listed in Table 1, in orderto maximize the detection of the minor sulfur component in thisparticle system. These modifications included the use of acyclonic spray chamber, nebulizer flow of 0.95 L/min, and1.0 mL/min oxygen flow rate in the DRC, all other conditionswere the same as described above (Table 1). The elevated back-ground signal for 48SO, likely due to native Ca and S in the FL-70/sodium azide mobile phase and any 48O3 formed in the reactioncell. Inefficiency in S ionization and oxide formation limit theultimate ability to detect low mg/L concentrations of S in suchanalyses.

Table 2Estimated detection limit (mg/L) for various metals in nanoparticle form by FFF
separation using the various detectors described in the current work. Values
determined by relative S/N ratio of FFF peak height to background and total
measured metal by direct ICP–AES or ICP–MS analysis. This represents a
conservative estimate because some constituents in each sample are present in
the void peak rather than the particle peak.
FFF detector Nanoparticle estimated detection limit (mg/L) by analyte
Au Ag Cd Zn Se S
UVa 400 100 200 100 40 1,100
DLSb 4000 1500 NT NT NT NT
ICP–MS 10 10 10 40 20 NA
ICP–DRC–MS 10 10 10 40 20 4,000
ICP–AES 200 100 80 200 200 10,000
NT— Not tested in this work.
NA—Sulfur cannot be analyzed by ICP–MS in standard mode due to interferences
as described.a Wavelength dependant, assumes particles remain intact.b Nanoparticle size dependant, estimate given for 30 nm particles tested.
A.J. Bednar et al. / Talanta 104 (2013) 140–148 147
The particle size increases from approximately 27 to 35 nmduring the sulfidation process, and is confirmed by both UV andICP–MS detectors. However, there is a notable decrease in the UVsignal, indicating that the surface plasmon resonance has changedwith the development of the sulfide surface coating. Indeed, aUV–vis spectral scan of the sulfidized particles shows a maximumabsorbance wavelength shift from 395 nm to approximately225 nm. It is not entirely clear why the ICP–MS responseincreases after sulfidation, but may be due to the sulfide coatingreducing the loss of particles to the FFF membrane. Indeed, thezeta potential measurement of the tannic acid coating silvernanoparticles became more negative (�7.6 mV for stock particlesto �40.6 mV after sulfidation), indicating higher surface charge,and therefore stronger repulsion of the negative regeneratedcellulose membrane. The particles do increase in mass (and size)(as determined by FFF retention time), possibly by precipitation offresh silver sulfide on the surface of the particles from free silverin solution (generally reported to be in the 2–3% range [17]). Thishigher particle recovery is also supported by a slightly larger goldcore signal observed in the post sulfidation fractogram, which islikely attributed to reduced loss of particles to the membrane,since there is no dissolved gold in the system to precipitate on thesurface to make larger particles. The void peak observed in thesulfide-containing fractogram in Fig. 7 contains both sulfur andsilver. The slight shoulder of the void peak could indicate theformation of small Ag2S particles, yet no confirmatory informa-tion is available to discount unretained dissolved species.
The effect of sulfidation on these particles demonstrates thecritical importance of tracking both particle size and composition,as both may change during exposure to environmental media[51,52]. Although the results in Fig. 7 are not yet quantitative,they do provide important qualitative information at near envir-onmentally relevant concentrations. The SF4–ICP–DRC–MS frac-tograms shown in Fig. 7 also demonstrates the use of thistechnique to detect gold in silver nanoparticles. Silver nanopar-ticle synthesis can sometimes use nanogold ‘seed’ particles, whichresults in a gold core within the silver particle [54,55]. Due to therelative inertness of gold, this may not be a critical factor fortoxicity or environmental studies, but does represent an ability toadd quality control to manufacturing and purity analysis, as wellas add a surrogate metal to aid in detection and tracking whenusing this technique. The gold concentration in the silver nano-particles shown in Fig. 7 as determined by traditional ICP–MSanalysis is approximately 20% of the particle, which is notnecessarily an insignificant amount. Similar investigations ofsilver content in a variety of nanogold particles have beenconducted, with results indicating small, yet detectable amountsgenerally less than 0.01% present. No matter how minute, thepresence of silver in nanogold particles could confound toxicitystudies (lethal median concentrations for nanosilver range from2 to 126 mg/L, as total measurable silver [17]) where gold isintended as a nontoxic control nanoparticle.
4. Conclusions
Field flow fractionation is a powerful nanoparticle sizingtechnique. However, full exploitation of its capabilities requiresthe use of sensitive and selective analyte detectors. Interfacingthe FFF separation method to ICP–MS, and to a lesser extent ICP–AES, provides the ability to detect and size nanoparticles at themg/L level, a detection capability at least 10-fold lower than DLSor FFF–UV techniques. Shown in Table 2 are estimated detectionlimits of the various detectors evaluated in the current work as afunction of nanoparticle constituents. These estimated detectionlimits are based on examination of the signal to noise ratio of the
peak height to background and assume ideal conditions ofpristine nanoparticles in simple media. Use of these hyphenatedmethods has been demonstrated in previous studies of complexenvironmental and biological systems. The additional informationgained from the simultaneous elemental-specific nature of thedetectors can identify co-occurring metals present in nano-particles and can be used to track all constituents of a nanoparticle,including metal–nonmetal salts, as in the case of quantum dotsor coatings resulting from environmental exposure. Additionalwork is underway to further improve capabilities, particularly ofsulfur and possibly extend to chloride, to detect and ultimatelyquantify surface coatings of gold and silver nanoparticles at lowerconcentrations.
Acknowledgments
The use of trade, product, or firm names in this report is fordescriptive purposes only and does not imply endorsement by theU.S. Government. The tests described and the resulting datapresented herein, unless otherwise noted, were obtained fromresearch conducted under the Environmental Quality TechnologyProgram of the United States Army Corps of Engineers by theUSAERDC. Permission was granted by the Chief of Engineers topublish this information. The findings of this report are not to beconstrued as an official Department of the Army position unlessso designated by other authorized documents. The authors alsothank Brandon Lafferty and David Johnson of the USACE for theireditorial comments.
References
[1] N. Mueller, B. Nowack, Environ. Sci. Technol. 42 (2008) 4447–4453.[2] F. Gottschalk, T. Sonderer, R. Scholz, B. Nowack, Environ. Sci. Technol. 43
(2009) 9216–9222.[3] B. Nowack, Nano Today 4 (2009) 11–12.[4] G.V. Lowry, K.B. Gregory, S.C. Apte, J.R. Lead, Environ. Sci. Technol. 46 (2012)
6893–6899.[5] R.D. Handy, N. van den Brink, M. Chappell, M. Muehling, R. Behra,
M. Dusinska, P. Simpson, J. Ahtiainen, J. Seiter, A. Bednar, A. Kennedy,T.F. Fernandes, M. Riediker, Ecotoxicology 21 (2012) 933–972.
[6] D.M. Mitrano, E.E. Lesher, A.J. Bednar, J. Monserud, C.P. Higgins, J.F. Ranville,Environ. Toxicol. Chem. 31 (2012) 115–121.
[7] H.E. Pace, N.J. Rogers, C. Jarolimeck, V.A. Coleman, C.P. Higgins, J.F. Ranville,Anal. Chem. 83 (2011) 9361–9369.
[8] A. Ulrich, S. Losert, N. Bendixen, A. Al-Kattan, H. Hagendorfer, B. Nowack,C. Adlhart, J. Ebert, M. Lattuada, K. Hungerbuhler, J. Anal. Atom. Spec. 27(2012) 1120–1130.

A.J. Bednar et al. / Talanta 104 (2013) 140–148148
[9] K. Tiede, A. Boxall, S. Tear, J. Lewis, H. David, M. Hassellov, Food Addit.Contam. 25 (2008) 795–821.
[10] G. Leppard, D. Mavrocordatos, D. Perret, Water Sci. Technol.: J. Int. Assoc.Water Pollut. Res. 50 (2004) 1.
[11] Y. Song, V. Jimenez, C. McKinney, R. Donkers, R.W. Murray, Anal. Chem. 75(2003) 5088–5096.
[12] D.Y. Lyon, L.K. Adams, J.C. Falkner, P.J.J. Alvarez, Environ. Sci. Technol. 40(2006) 4360–4366.
[13] K.W. Powers, M. Palazuelos, B.M. Moudgil, S.M. Roberts, Nanotoxicology 1(2007) 42–51.
[14] K.A. Howell, E.P. Achterberg, A.D. Tappin, P.J. Worsfold, Environ. Chem. 3(2006) 199–207.
[15] A. Akthakul, A.I. Hochbaum, F. Stellacci, A.M. Mayes, Adv. Mater. 17 (2005)532–535.
[16] J.R. Lead, K.J. Wilkinson, Environ. Chem. 3 (2006) 159–171.[17] A.J. Kennedy, M.S. Hull, A.J. Bednar, J.D. Goss, J.C. Gunter, J.L. Bouldin,
P.J. Vikesland, J.A. Steevens, Environ. Sci. Technol. 44 (2010) 9571–9577.[18] M. Hasselloev, J. Readman, J. Ranville, K. Tiede, Ecotoxicology 17 (2008)
344–361.[19] J. Ranville, D. Chittleborough, F. Shanks, R. Morrison, T. Harris, F. Doss,
R. Beckett, Anal. Chim. Acta 381 (1999) 315–329.[20] J. Liu, J.D. Andya, S.J. Shire, AAPS J. 8 (2006) 580–589.[21] F.A. Messaud, R.D. Sanderson, J. Runyon, T. Otte, H. Pasch, S. Williams, Prog.
Polym. Sci. 34 (2009) 351–368.[22] S.K. Ratanathanawongs, D. Lee, J. Sep. Sci. 29 (2006) 1720–1732.[23] T. Chian �Ea, N. Assidjo, P. Cardot, Talanta 51 (2000) 835–847.[24] J.R. Lead, E.L. Smith, Environmental and Human Health Impacts of Nano-
technology, Wiley Online Library, 2009.[25] M. Baalousha, J. Lead, Environ.Sci. Technol. 41 (2007) 1111–1117.[26] R. Beckett, B.T. Hart, Environ. Part. 2 (1993) 165–205.[27] M.H. Moon, D. Kang, J. Jung, J. Kim, J. Sep. Sci. 27 (2004) 710–717.[28] J.C. Giddings, Science 260 (1993) 1456.[29] C.W. Isaacson, D. Bouchard, J. Chromatogr. A 1217 (2010) 1506–1512.[30] H. Hagendorfer, R. Kaegi, J. Traber, S.F.L. Mertens, R. Scherrers, C. Ludwig,
A. Ulrich, Anal. Chim. Acta 706 (2012) 367–378.[31] H. Hagendorfer, R. Kaegi, M. Parlinska, B. Sinnet, C. Ludwig, A. Ulrich, Anal.
Chem. 84 (2012) 2678–2685.[32] S. Dubascoux, I. Hecho, V. Hassellov, M.F. Kammer, M. Gautier, G. Lespes, J.
Anal. Atom. Spectrom. 25 (2010) 613–623.[33] L. Gimbert, K. Andrew, P. Haygarth, P. Worsfold, TrAC Trends Anal. Chem. 22
(2003) 615–633.
[34] M. Hassellov, F. von der Kammer, R. Beckett, Characterisation of aquaticcolloids and macromolecules by field-flow fractionation, in: Wilkinson KJ,Lead JR (Eds.), Environ. Colloids Part.: Behav., Struct. Charact. (2007)
223–276.[35] P. Reschiglian, A. Zattoni, B. Roda, E. Michelini, A. Roda, Fractionation Trend
Biotechnol. 23 (2005) 475–483.[36] B. Roda, A. Zattoni, P. Reschiglian, M.H. Moon, M. Mirasoli, E. Michelini,
A. Roda, Anal. Chim. Acta 635 (2009) 132–143.[37] S.K.R. Williams, J.R. Runyon, A.A. Ashames, Anal. Chem. 83 (2011) 634–642.[38] M. Baalousha, B. Stolpe, J. Lead, J. Chromatogr. A 1218 (2011) 4078–4103.[39] M. Bouby, H. Geckeis, F. Geyer, Anal. Bioanal. Chem. 392 (2008) 1447–1457.[40] P. Krystek, A. Ulrich, C.C. Garcia, S. Manohar, R. Ritsema, J. Anal. Atom. Spec.
26 (2011) 1701–1721.[41] H.E. Pace, E.K. Lesher, J.F. Ranville, Environ. Toxicol. Chem. 29 (2010)
1338–1344.[42] A. Poda, A. Bednar, A. Kennedy, A. Harmon, M. Hull, D. Mitrano, J. Ranville,
J. Steevens, J. Chromatogr. A 1218 (2011) 4219–4225.[43] B. Schmidt, K. Loeschner, N. Hadrup, A. Mortensen, J.J. Sloth, C. Bender Koch,
E.H. Larsen, Anal. Chem. 83 (2011) 2461–2468.[44] S. Tadjiki, S. Assemi, C.E. Deering, J.M. Veranth, J.D. Miller, J. Nanopart. Res. 11
(2009) 981–988.[45] M. Delay, T. Dolt, A. Woellhaf, R. Sembritzki, F.H. Frimmel, J. Chromatogr. A
1218 (2011) 42064212.[46] M.F. Benedetti, J.F. Ranville, T. Allard, A.J. Bednar, N. Menguy, Colloids Surf.
A 217 (2003) 1–9.[47] J.R. Heath, Phys. Rev. B 40 (1989) 9982–9985.[48] Y. Xiong, J. Chen, B. Wiley, Y. Xia, Y. Yin, Z.-Y. Li, Nanoletters 5 (2005)
1237–1242.[49] T.J. Cho, V.A. Hackley, Anal. Bioanal. Chem. 398 (2010) 2003–2018.[50] A.J. Bednar, Talanta 78 (2009) 453–457.[51] C. Levard, B.C. Reinsch, F.M. Michel, C. Oumahi, G.V. Lowry, G.E. Brown,
Environ. Sci. Technol. 45 (2011) 5260–5266.[52] C. Levard, E.M. Hotze, G.V. Lowry, G.E. Brown, Environ. Sci. Techol. 46 (2012)
6900–6914.[53] R. Kaegi, A. Voegelin, B. Sinnet, S. Zuleeg, H. Hagendorfer, M. Burkhardt,
H. Siegrist, Environ. Sci. Techol. 45 (2011) 3902–3908.[54] N.R. Jana, L. Gearheart, C.J. Murphy, Chem. Mater. 13 (2001) 2313–2322.[55] L. Lu, H. Wang, Y. Zhou, S. Xi, H. Zhang, J. Hu, B. Zhao, Chem. Commun.
2 (2002) 144–145.