Embed Size (px)
Citation preview

Journal of Nondestructive Evaluation (2020) 39:30
https://doi.org/10.1007/s10921-020-00675-4
Comparison of Experimental Measurements of Material Grain SizeUsing Ultrasound
Jie Zhang1 · Yongfeng Song2 · Xiongbing Li2 · ChengHuan Zhong3
Received: 25 November 2019 / Accepted: 12 March 2020
© The Author(s) 2020
Abstract
Material grain size is related to metallic material properties and its elastic behaviour. Measuring and monitoring material
grain size in material manufacturing and service is an important topic in measurement field. In this paper, three materials, i.e.,
aluminium 2014 T6, steel BS970 and copper EN1652, were chosen to represent materials with small, medium and large grain
size, respectively. Various techniques of measuring material grain size were demonstrated and compared. These techniques
include the measurements from material microstructure images, backscattered ultrasonic grain noise using a conventional
transducer, longitudinal wave attenuation using ultrasonic arrays and shear wave attenuation using a lead zirconate titanate
(PZT) plate. It is shown that the backscattered ultrasonic noise measurement and material attenuation measurement are
complementary. The former is pretty good for weak scattering materials, e.g., aluminium, while the latter for materials with
large grains, e.g., steel and copper. Consistent measured grain size from longitudinal and shear wave attenuations in steel and
copper suggests that shear wave attenuation can be calculated from the measured longitudinal wave attenuation integrated
with Stanke–Kino’s model or Weaver’s model, if there is a difficulty to either excite or capture shear waves in practice. The
outcome of the paper expects to provide a further step towards the industrial uptake of these techniques.
Keywords Material grain size · Material attenuation · Ultrasound · Ultrasonic arrays
1 Introduction
Material grain size has significant effect on metallic mate-
rial properties and its elastic behaviour. For example,
fine-grained magnesium-based materials exhibit superplastic
behaviour at high stain rates (≥10−1 s−1) or low temper-
atures (≤473 K) [1]; coarse-grained nickel-based alloys
enhance yield strength by 60 MPa and creep resistance by
15° temperature gain [2]; the coarse grains in both columnar
and equiaxed microstructures have presented a better corro-
sion behaviour than fine grain microstructures [3]. Measuring
and monitoring material grain size in material manufactur-
ing and service is hence an important topic in measurement
B Jie Zhang
1 Department of Mechanical Engineering, University Walk,
University of Bristol, Bristol BS8 1TR, UK
2 Key Laboratory for Traffic Safety on Track, Ministry of
Education, Changsha, China
3 Inductosense Limited, Unit 3, Kings Business Park, Kings
Park Avenue, Bristol BS2 0TZ, UK
field. There are many techniques used to achieve this. Tradi-
tionally, a small piece of specimen was taken from material
and polished for microstructure imaging using either optical
microscope or electron backscattering diffraction (EBSD)
method [4]. Alternatively, the scattered ultrasound from
material microstructure contains the grain size information
and it can be indicated in ultrasound dispersion [5], attenua-
tion [6–9] and backscattered grain noise [10–15].
Compared with the grain size measurement from either
ultrasound dispersion or attenuation, that from backscatter
grain noise has no requirement of parallel front-wall and
back-wall surfaces and known wall thickness of a specimen.
Instead more complicated statistical methods are required to
combine the ultrasonic signals from different sets of grains
at different probe spatial positions [10–15]. Margetan et al.
[10] measured the root-mean-square (RMS) of noise ampli-
tude as a function of material microstructure, termed as
the figure of merit (FOM). Ghoshal et al. [13] developed
a general backscattered grain noise model under multiple-
scattering assumption and then simplified to the case for
singly scattered response (SSR) [14] which is in agreement
with the Margetan’s model [10]. Hu and Turner extended the
0123456789().: V,-vol 123
Mor
e in
fo a
bout
this
art
icle
: ht
tp://
ww
w.n
dt.n
et/?
id=
2539
2

30 Page 2 of 8 Journal of Nondestructive Evaluation (2020) 39:30
SSR model to the doubly scattered response (DSR) model
[15] to include high order grain scattering. All above meth-
ods applied to normal incidence, pulse-echo inspection of
weakly-scattering materials from either a planar or focused
longitudinal wave transducer. From the practice point view,
if the grain size measurement can be achieved by using
other type of ultrasound probes, such as ultrasonic arrays
and shear wave transducers, it will provide more choice for
material grain size measurement in practice as well as add
more inspection functions for each type of ultrasound probes.
The motivation of this paper is to demonstrate the vari-
ous techniques of measuring material grain size and expect
to provide a further step towards the industrial uptake of
these techniques. Three materials, i.e., aluminium 2014 T6,
steel BS970 and copper EN1652, were chosen to represent
materials with small, medium and large grain size respec-
tively and their material properties are shown in Table 1.
The method of measuring grain size demonstrated in this
paper includes the measurements from material microstruc-
ture images, backscattered ultrasonic grain noise using a
conventional transducer and the SSR [14] and DSR models
[15], longitudinal wave attenuation using ultrasonic arrays
and shear wave attenuation using a lead zirconate titanate
(PZT) plate. The last method is used to simulate a case of
permanently attaching a low-cost sensor for structure health
monitoring. It is noted that, in this paper, the grain size
denotes the mean material grain diameter. The experimen-
tally measured results from different methods were compared
to demonstrate the measurement variability in practice. The
measurement sensitivity and the application of measuring
shear wave attenuation were discussed.
2 Measurements fromMaterialMicrostructure Images
The material microstructure images from the chosen mate-
rials were taken using either an optical microscope or the
electron backscattering diffraction (EBSD) technique after
proper preparation. In the preparation, the materials were first
cut to a small specimen pieces and grounded using SiC papers
with 1200 grit. Diamond slurries with particle sizes of 6 µm
and 3 µm were then used to polish coarsely. Alumina slurries
with particle sizes of 0.3 µm and 0.04 µm were finally used
sequentially to polish all specimens. EBSD system composed
of a FEI Quanta 650 FEG SEM and a NordlysMax2 EBSD
detector was used to image the microstructure of the alu-
minium specimen at an indexing rate of 89.9%. However, for
the other specimens, their surfaces were further etched before
taking the micrographs. In the etching process, the steel
specimen has done by the mixture of 5 g C6H2(NO2)3OH,
4 g C18H29NaO3S, 5 mL H2O2 and 100 mL H2O at 90 °C
for ~ 45 s while the copper specimen was immersed in the
mixture of 3 g Fe2O3, 2 mL HCl and 96 mL C2H6O for a
minute. An Olympus BX53M optical microscope was used to
obtain the microstructure images from these two specimens.
The measured microstructure image from the aluminium,
steel and copper specimen is as shown in Fig. 1a–c, respec-
tively. From these images, the material grain size on each
specimen can be measured. In the measurement on the
aluminium specimens, the grain size was calculated using
the grain reconstruction method provided by software HKL
CHANNEL5 (Oxford Instruments, UK). The 5-neighbor-
extrapolation method was used to reduce the indexing rate
effect. While, in the measurement on the other specimens, the
linear intercept method [20] based on ASTM E112 [21] stan-
dard was used. To reduce measurement errors, five optical
micrographs were randomly chosen on the detection cross-
section of each specimen and the above procedures were used
repeatedly to measure grain size. The measured grain sizes
are as shown in Table 2. As expected, the smallest grain size
is from the aluminium specimen while the largest one from
the copper specimen.
3 Measurements from BackscatteredUltrasonic Grain Noise
Due to the randomness of backscattered ultrasonic signals
from material structure, a single signal is not adequate to
estimate the grain size, instead, a statistical quantity of the
ensemble signals is used. In the measurement, a conventional
ultrasonic scanning system is used to capture signals at var-
ious positions. The time-dependent spatial variance of the
ensemble of all captured signals can be written as [14],
�(t) �1
N
N∑
i�1
V 2i (t) −
[
1
N
N∑
i�1
Vi (t)
]2
, (1)
where N is the number of captured signals and Vi (t) is the
amplitude of the ith captured signal. It can be seen that the
spatial variance has no concern with the thickness of the
specimen and the condition of the back-wall surface.
Specifically, considered various material grain sizes of the
chosen specimens, the experiments were performed on the
aluminium and steel specimens using a 10 MHz focused
immersion transducer (Olympus V311-SU-F2.0-PTF), but
on the copper specimen using a 5 MHz focused immersion
transducer (Olympus V309-SU-F2.0-PTF). For the 10 MHz
probe, the actual calibrated central frequency is 8.6 MHz,
the calibrated focal length in water is 54.6 mm, the probe
aperture size is 13.3 mm and this leads to the – 6 dB spot
size as 0.7 mm. For the 5 MHz probe, the actual calibrated
central frequency is 4.6 MHz, the calibrated focal length in
water is 58.3 mm, the probe aperture size is 12.0 mm and this
123

Journal of Nondestructive Evaluation (2020) 39:30 Page 3 of 8 30
Table 1 Elastic material
properties of the chosen
specimens
Material Elastic property
c11 (GPa) c12 (GPa) c44 (GPa) ρ (g/cm3) vl (m/s) vt (m/s)
Aluminium [16] 108 63 29 2780 6408 3120
Steel [17] 229 134 117 7930 5850 3210
Copper [18, 19] 170 121 75 8984 4700 2286
Fig. 1 The microstructure image from the; a–c aluminium, carbon steel and copper specimen
Table 2 Measured grain size from the chosen specimens using different
methods
Material Aluminium Steel Copper
Grain size (µm) measured from
Image of microstructure 11.0±0.6 21.2±1.1 85.7±4.7
Backscattered grain noise
using the
SSR method [13] 11±1 37±3 62±4
DSR method [15] 11±1 35±3 52±4
Longitudinal wave
attenuation measured using
ultrasonic arrays and the
Stanke–Kino model [6] 46±3 36±2 80±3
Weaver model [7] 46±3 36±2 80±3
Shear wave attenuation
measured using a shear
wave PZT and the
Stanke–Kino model [6] 56±4 35±2 78±4
Weaver model [7] 56±4 35±2 78±4
leads to the − 6 dB spot size as 1.6 mm. An Imaginant JSR-
DPR300 pulser/receiver was used to excite the transducers
and an acquisition system with an ADLink PCIe-9852 DAQ
card was used to receive signals under a sampling frequency
of 200 MHz. The above equipment and transducers were
integrated into an automated immersion ultrasound scanning
system and used to capture signals. In the experimental mea-
surements, the transducers were maintained normally to the
front-wall surface of the specimen. In the measurements for
each specimen, 1024 signals were captured in a square region
with scanning distance increment of 0.35 mm when using the
10 MHz transducer or 0.8 mm when using the 5 MHz trans-
ducer. Equation (1) was used to calculate the experimental
spatial variance.
The predicted spatial variance from each specimen was
obtained from the SSR [14] and DSR [15] models with the
known material properties, known calibrated probe parame-
ters and a group of testing grain sizes. The measured grain
size is the one leading to the predicated spatial variance best
fitting to the experimentally measured one. Figure 2a–c com-
pare the best fitting results from the SSR and DSR models
with the experimentally measured one for each specimen and
the measured grain sizes from 10 repeated measurements are
shown in Table 2. Comparing Fig. 2a–c, it is shown that
the measured results on the aluminium specimens from the
SSR and DSR models have a good agreement, however, for
the results from the steel and copper specimens, DSR model
shows better prediction than the SSR model. Comparing the
measured grain sizes from the image of microstructure and
the backscattered grain noise in Table 2, it can be seen that
there is a good agreement for the aluminium specimens but
some difference for the other specimens. There are some
explanations and findings from the observations:
123
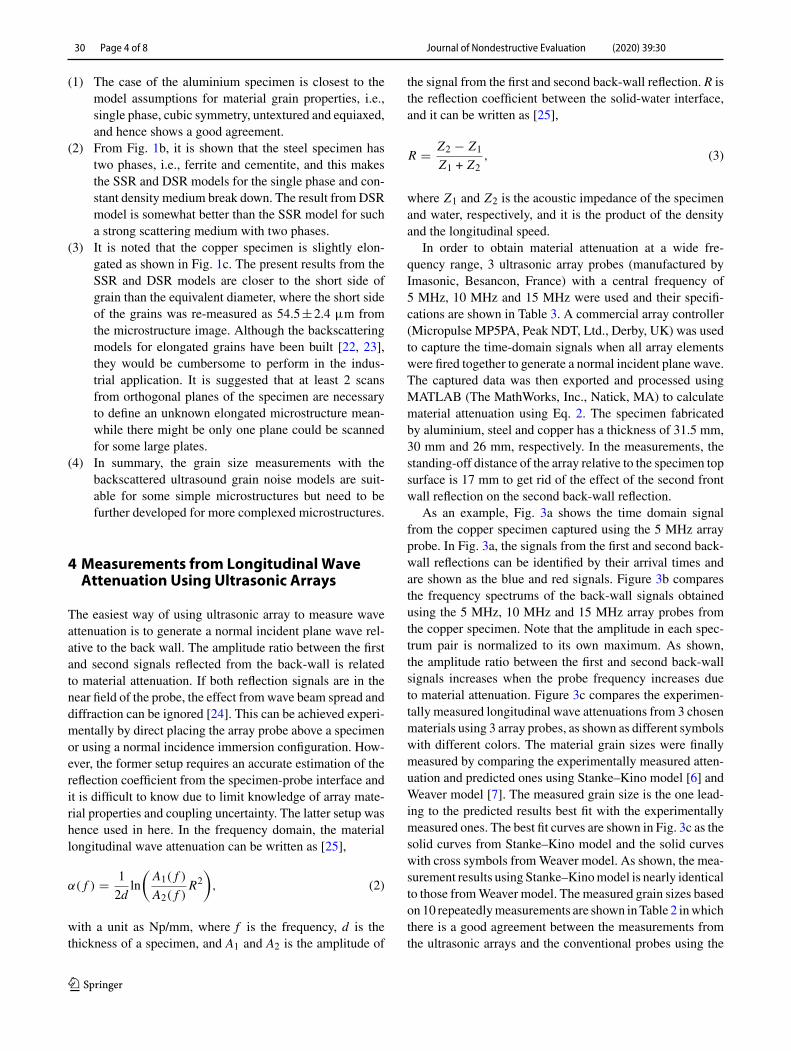
30 Page 4 of 8 Journal of Nondestructive Evaluation (2020) 39:30
(1) The case of the aluminium specimen is closest to the
model assumptions for material grain properties, i.e.,
single phase, cubic symmetry, untextured and equiaxed,
and hence shows a good agreement.
(2) From Fig. 1b, it is shown that the steel specimen has
two phases, i.e., ferrite and cementite, and this makes
the SSR and DSR models for the single phase and con-
stant density medium break down. The result from DSR
model is somewhat better than the SSR model for such
a strong scattering medium with two phases.
(3) It is noted that the copper specimen is slightly elon-
gated as shown in Fig. 1c. The present results from the
SSR and DSR models are closer to the short side of
grain than the equivalent diameter, where the short side
of the grains was re-measured as 54.5±2.4 µm from
the microstructure image. Although the backscattering
models for elongated grains have been built [22, 23],
they would be cumbersome to perform in the indus-
trial application. It is suggested that at least 2 scans
from orthogonal planes of the specimen are necessary
to define an unknown elongated microstructure mean-
while there might be only one plane could be scanned
for some large plates.
(4) In summary, the grain size measurements with the
backscattered ultrasound grain noise models are suit-
able for some simple microstructures but need to be
further developed for more complexed microstructures.
4 Measurements from Longitudinal WaveAttenuation Using Ultrasonic Arrays
The easiest way of using ultrasonic array to measure wave
attenuation is to generate a normal incident plane wave rel-
ative to the back wall. The amplitude ratio between the first
and second signals reflected from the back-wall is related
to material attenuation. If both reflection signals are in the
near field of the probe, the effect from wave beam spread and
diffraction can be ignored [24]. This can be achieved experi-
mentally by direct placing the array probe above a specimen
or using a normal incidence immersion configuration. How-
ever, the former setup requires an accurate estimation of the
reflection coefficient from the specimen-probe interface and
it is difficult to know due to limit knowledge of array mate-
rial properties and coupling uncertainty. The latter setup was
hence used in here. In the frequency domain, the material
longitudinal wave attenuation can be written as [25],
α( f ) �1
2dln
(
A1( f )
A2( f )R2
)
, (2)
with a unit as Np/mm, where f is the frequency, d is the
thickness of a specimen, and A1 and A2 is the amplitude of
the signal from the first and second back-wall reflection. R is
the reflection coefficient between the solid-water interface,
and it can be written as [25],
R �Z2 − Z1
Z1 + Z2, (3)
where Z1 and Z2 is the acoustic impedance of the specimen
and water, respectively, and it is the product of the density
and the longitudinal speed.
In order to obtain material attenuation at a wide fre-
quency range, 3 ultrasonic array probes (manufactured by
Imasonic, Besancon, France) with a central frequency of
5 MHz, 10 MHz and 15 MHz were used and their specifi-
cations are shown in Table 3. A commercial array controller
(Micropulse MP5PA, Peak NDT, Ltd., Derby, UK) was used
to capture the time-domain signals when all array elements
were fired together to generate a normal incident plane wave.
The captured data was then exported and processed using
MATLAB (The MathWorks, Inc., Natick, MA) to calculate
material attenuation using Eq. 2. The specimen fabricated
by aluminium, steel and copper has a thickness of 31.5 mm,
30 mm and 26 mm, respectively. In the measurements, the
standing-off distance of the array relative to the specimen top
surface is 17 mm to get rid of the effect of the second front
wall reflection on the second back-wall reflection.
As an example, Fig. 3a shows the time domain signal
from the copper specimen captured using the 5 MHz array
probe. In Fig. 3a, the signals from the first and second back-
wall reflections can be identified by their arrival times and
are shown as the blue and red signals. Figure 3b compares
the frequency spectrums of the back-wall signals obtained
using the 5 MHz, 10 MHz and 15 MHz array probes from
the copper specimen. Note that the amplitude in each spec-
trum pair is normalized to its own maximum. As shown,
the amplitude ratio between the first and second back-wall
signals increases when the probe frequency increases due
to material attenuation. Figure 3c compares the experimen-
tally measured longitudinal wave attenuations from 3 chosen
materials using 3 array probes, as shown as different symbols
with different colors. The material grain sizes were finally
measured by comparing the experimentally measured atten-
uation and predicted ones using Stanke–Kino model [6] and
Weaver model [7]. The measured grain size is the one lead-
ing to the predicted results best fit with the experimentally
measured ones. The best fit curves are shown in Fig. 3c as the
solid curves from Stanke–Kino model and the solid curves
with cross symbols from Weaver model. As shown, the mea-
surement results using Stanke–Kino model is nearly identical
to those from Weaver model. The measured grain sizes based
on 10 repeatedly measurements are shown in Table 2 in which
there is a good agreement between the measurements from
the ultrasonic arrays and the conventional probes using the
123

Journal of Nondestructive Evaluation (2020) 39:30 Page 5 of 8 30
Fig. 2 The spatial variance of the backscattered ultrasound grain noise
signals from (a); a–c aluminium, steel and copper specimen. Note that,
in each figure, the solid black line is from the experimental measure-
ments, the blue line with circle symbols is predicated using the SSR
model and the red line with cross symbols is done using the DSR model
(Color figure online)
Table 3 Specification of the
array transducer used in the
experimental measurements
Number of
element N
Central frequency
(MHz)
Element width
(mm)
Element pitch
(mm)
Array aperture
size (mm)
128 5 0.1 0.3 40
128 10 0.1 0.3 40
64 15 0.20 0.21 13.23
backscattered grain noise method for the steel specimen but
not for the aluminium and copper specimens. It is noted that
the effects of grain size distribution and grain elongation are
ignored in both Stanke–Kino model [6] and Weaver model
[7]. There are some explanations and findings from the obser-
vations:
1. It is shown that the attenuation measurement in alu-
minium is less accurate than that in steel and copper.
This means that the attenuation in aluminium is too low
to be used to calculate material grain size in practice;
2. It should be noted that the effects of cementite on
the ultrasonic scattering in steel is ignored and this
leads to larger measured grain size than those from the
microstructure images, but a good agreement with those
from the ultrasound backscattering grain noise methods;
3. It is shown that the measured grain sizes from the copper
specimens are close to the equivalent diameters measured
from the microstructure images.
5 Measurements from Shear WaveAttenuation Using a PZT Plate
Here, a shear wave PZT plate was used to measure material
shear wave attenuation to expect to achieve better measure-
ment sensitivity. In the measurements, a PZT plate PIC 255
(fabricated by PI Ceramic, Germany) with a size of 4 mm by
7 mm and a thickness of 0.18 mm was bonded above a spec-
imen using epoxy adhesive. The first resonance frequency of
the PZT plate is 5 MHz. Due to the thin thickness of the PZT
plate and thin and consistent bond condition, the reflection
coefficient from the specimen-PZT plate interface approxi-
mates as same as that from the specimen-air interface (R � 1).
The specimens were fabricated using aluminium, steel and
copper and have a thickness of 15 mm. A tone-burst signal
with a central frequency of 5 MHz and a bandwidth of 100%
fraction at − 20 dB was loaded on the PZT. As an example,
Fig. 4a, b show the time domain signal and its frequency
spectrum from the copper specimen, respectively. Figure 4c
compares the measured shear wave attenuation from various
specimens. As expected, they are higher than the longitu-
dinal wave attenuation as shown in Fig. 3c. The material
grain sizes were measured by comparing the experimentally
measured attenuation (shown as symbols) and predicted ones
using Stanke–Kino model [6] and Weaver model [7]. The best
fit predicted attenuation curves are shown in Fig. 4c as the
solid curves from Stanke–Kino model and the solid curves
with cross symbols from Weaver model. Again, the measure-
ment results using Stanke–Kino model is nearly identical to
those from Weaver model. The measured grain sizes are listed
in Table 2. From Table 2 it is shown that there is a good agree-
ment between the measurements from the longitudinal wave
and the shear wave for the steel and copper specimens but
not for the aluminium specimens. This again indicates the
attenuation in aluminium is too low to be used to calculate
material grain size in practice.
123

30 Page 6 of 8 Journal of Nondestructive Evaluation (2020) 39:30
Fig. 3 Experimental results from the measurements using ultrasonic
arrays. a An example of time domain signal captured using the 5 MHz
array from the copper specimen, b the comparison of the frequency
spectrum of the back-wall signals from the copper specimen and cap-
tured using various array probes and c the comparison of measured
longitudinal wave attenuation using various array probes on different
specimens
Fig. 4 Experimental results obtained from a 5 MHz shear wave PZT plate; a, b the time domain back-wall signals and their spectrums from the
copper specimen and c the comparison of measured shear wave attenuation on different materials
123

Journal of Nondestructive Evaluation (2020) 39:30 Page 7 of 8 30
Fig. 5 The comparison of measured shear wave attenuation using dif-
ferent methods for various materials
6 Discussion
6.1 ShearWave AttenuationMeasurement
In practice, the generation of shear wave using a conventional
probe requests special coupling gel while either oblique inci-
dent in water or a coupling wedge is required in an ultrasonic
array system. This limits shear wave attenuation measure-
ment in practice. The consistent of the measured grain sizes
from longitudinal wave and shear wave for the steel and
copper specimens indicates that shear wave attenuation can
be worked out from longitudinal attenuation through the
measured grain size and proper models, for example, the
Stanke–Kino model [6] and the Weaver model [7]. Figure 5
compares the measured shear wave attenuation using this
method (the dashed lines) and the direct best fit curves (the
solid lines) from the measurements using the shear wave PZT
(the symbols). Again, there is a good agreement for the steel
and copper specimens, but 0.015 Np/mm at 8 MHz for the
aluminium specimens. This indicates the proposed method
works for the steel and copper specimens but not the alu-
minium specimens.
6.2 Measurement Sensitivity
Comparing the best fit curves as shown in Figs. 3c and 4c,
it can be seen that, the attenuation measurement sensitivity
is higher in materials with large grains than those with small
grains and it increases with frequency. It also suggests that
the attenuation in aluminium is more difficult to be measured
compared with the other materials.
Figure 6a, b compares the predicted material attenuation as
a function of grain size for the 3 chosen material properties at
5 MHz and 8 MHz. Again, it is shown that high measurement
sensitivity is happened for large grain size at high frequency
and the measurement from shear wave shows better sensi-
tivity than longitudinal wave. When grain size is less than
20 µm, the sensitivity is poor and hence the grain size in
aluminium is difficult to be measured from material atten-
uation. However, for the other materials, the measurement
sensitivity is good. For example, at 5 MHz, the measurement
sensitivity for a grain with size ranging 40 µm to 60 µm in
steel is 0.00014 Np/(mm µm) and 0.00052 Np/(mm µm) for
longitudinal and shear wave respectively. The measurement
sensitivity for a grain with size ranging 90 µm to 100 µm
in copper is 0.00033 Np/(mm µm) and 0.0017 Np/(mm µm)
for longitudinal and shear wave respectively.
7 Conclusion
The variability of material grain size measurement demon-
strates an acceptable measurement accuracy compared with
the measurements from material microstructure images. It
is shown that the backscattering ultrasound noise method
and material attenuation method for material grain size mea-
surement are complementary. The former is pretty good for
all chosen materials and the latter for materials with large
grains, e.g., steel and copper. The DSR model shows bet-
ter prediction than the SSR model for materials with large
grains. Materials with large grains and measured at high fre-
quency and using shear wave attenuation can achieve better
sensitivity in grain size measurement. Consistent measured
Fig. 6 Predicted material
attenuation as a function of grain
size from the materials with the
properties listed in Table 1 and
using the Stanke–Kino model at;
a, b 5 MHz and 8 MHz
123

30 Page 8 of 8 Journal of Nondestructive Evaluation (2020) 39:30
grain size from longitudinal and shear wave attenuations in
steel and copper suggests that shear wave attenuation can be
calculated from the measured longitudinal wave attenuation
integrated with the Stanke–Kino’s model or the Weaver’s
model, if there is a difficulty to either excite or capture shear
waves in practice.
Acknowledgements This work was supported by Royal Society inter-
national exchanges cost share award with NSFC (Grant No. IE160986).
This work was also supported through the core research programme
within the UK Research Centre in NDE (RCNDE) funded by EPSRC
(Grant No. EP/L022125/1) and the National Natural Science Founda-
tion of China (Grant No. 51575541).
Open Access This article is licensed under a Creative Commons
Attribution 4.0 International License, which permits use, sharing, adap-
tation, distribution and reproduction in any medium or format, as
long as you give appropriate credit to the original author(s) and the
source, provide a link to the Creative Commons licence, and indi-
cate if changes were made. The images or other third party material
in this article are included in the article’s Creative Commons licence,
unless indicated otherwise in a credit line to the material. If material
is not included in the article’s Creative Commons licence and your
intended use is not permitted by statutory regulation or exceeds the
permitted use, you will need to obtain permission directly from the copy-
right holder. To view a copy of this licence, visit http://creativecomm
ons.org/licenses/by/4.0/.
References
1. Kubota, K., Mabuchi, M., Higashi, K.: Review processing and
mechanical properties of fine-grained magnesium alloys. J Mater
Sci 34, 2255–2262 (1999)
2. Cui, C.Y., Gu, Y.F., Yuan, Y., Osada, T., Harada, H.: Enhanced
mechanical properties in a new Ni–Co base superalloy by control-
ling microstructures. Mater. Sci. Eng. A 528, 5465–5469 (2011)
3. Osório, W.R., Freire, C.M., Garcia, A.: The role of macrostructural
morphology and grain size on the corrosion resistance of Zn and
Al castings. Mater. Sci. Eng. A 402, 22–32 (2005)
4. Humphreys, F.J.: Characterisation of fine-scale microstructures by
electron backscatter diffraction (EBSD). Scr. Mater. 51, 771–776
(2004)
5. Every, A.G., Maznev, A.A.: Dispersion of an acoustic pulse passing
through a large-grained polycrystalline film. J. Acoust. Soc. Am.
131, 4491–4499 (2012)
6. Stanke, F.E., Kino, G.S.: A unified theory for elastic wave propaga-
tion in polycrystalline materials. J. Acoust. Soc. Am. 75, 665–681
(1984)
7. Weaver, R.L.: Diffusivity of ultrasound in polycrystals. J. Mech.
Phys. Solids 38, 55–86 (1990)
8. Kube, C.M., Turner, J.A.: Acoustic attenuation coefficients for
polycrystalline materials containing crystallites of any symmetry
class. J. Acoust. Soc. Am. 137, EL476-EL482 (2015)
9. Li, X., Song, Y., Liu, F., Hu, H., Ni, P.: Evaluation of mean grain size
using the multi-scale ultrasonic attenuation coefficient. NDT&E
Int. 72, 25–32 (2015)
10. Margetan, F.J., Gray, T.A., Thompson, R.B.: A technique for quan-
titatively measuring microstructurally induced ultrasonic noise. In:
Thompson, D.O., Chimenti, D.E. (eds.) Review of Progress in
QNDE, vol. 10, pp. 1721–1728. Plenum Press, New York (1991)
11. Han, K.Y., Thompson, R.B.: Ultrasonic backscattering in duplex
microstructures theory and application to titanium alloys. Metall.
Mater. Trans. A 28, 91–104 (1991)
12. Rose, J.H.: Ultrasonic backscatter from microstructure. In: Thomp-
son, D.O., Chimenti, D.E. (eds.) Review of Progress in QNDE, 11,
pp. 1677–1684. New York, Plenum Press (1992)
13. Ghoshal, G., Turner, J.A., Weaver, R.L.: Wigner distribution of a
transducer beam pattern within a multiple scattering formalism for
heterogeneous solids. J. Acoust. Soc. Am. 122, 2009–2021 (2007)
14. Ghoshal, G., Turner, J.A.: Diffuse ultrasonic backscatter at normal
incidence through a curved interface. J. Acoust. Soc. Am. 128,
3449–3458 (2010)
15. Hu, P., Turner, J.A.: Contribution of double scattering in diffuse
ultrasonic backscatter measurements. J. Acoust. Soc. Am. 137,
321–334 (2015)
16. Pierce, D.T., Nowag, K., Montagne, A., Jimenez, J.A., Witting, J.E.,
Ghisleni, R.: Single crystal elastic constants of high-manganese
transformation-and twinning-induced plasticity steels determined
by a new method utilizing nanoindentation. Mater. Sci. Eng. A 578,
134–139 (2013)
17. Du, H., Turner, J.A.: Ultrasonic attenuation in pearlitic steel. Ultra-
sonics 54, 882–887 (2014)
18. Thompson, R.B., Smith, J.F., Lee, S.S., Johnson, G.C.: A compar-
ison of ultrasonic and X-ray determinations of texture in thin Cu
and Al plates. Metall. Mater. Trans. A 20, 2431–2447 (1989)
19. Levy, M., Bass, H.E., Stern, R.R.: Handbook of Elastic Properties
of Solids, Liquids and Gasses. Academic Press, London (2001)
20. Abrams, H.: Grain size measurement by the intercept method. Met-
allography 4, 59–78 (1971)
21. ASTM E112–10: Standard Test Method for Determining Average
Grain Size. American Society for Testing and Materials, West Con-
shohocken (2010)
22. Lobkis, O.I., Rokhlin, S.I.: Characterization of polycrystals
with elongated duplex microstructure by inversion of ultrasonic
backscattering data. Appl. Phys. Lett. 96, 161905 (2010)
23. Arguelles, A.P., Kube, C.M., Hu, P., Turner, J.A.: Mode-converted
ultrasonic scattering in polycrystals with elongated grains. J.
Acoust. Soc. Am. 140, 1570–1580 (2016)
24. Rogers, H., Van Buren, A.L.: An exact expression for the Lommel
diffraction correction integral. J. Acoust. Soc. Am. 55, 724–728
(1974)
25. Krautkramer, J., Krautkramer, H.: Ultrasoinc Testing of Materials.
Springer, New York (2003)
Publisher’s Note Springer Nature remains neutral with regard to juris-
dictional claims in published maps and institutional affiliations.
123


![Measurements of stress fields near a grain boundary ... measurements using X-rays [20,21] can also be employed. Apart from the 5 geometry parameters, the surface roughnessof grain](https://img.dokumen.tips/doc/110x75/5ab7a73d7f8b9ac10d8bf9dc/measurements-of-stress-fields-near-a-grain-boundary-measurements-using-x-rays.jpg)