Embed Size (px)
DESCRIPTION
Fugitive Emission Testing
Citation preview
1
FUGITIVE EMISSIONS EXPERIMENTAL MEASUREMENTS AND EQUIVALENCY
Jay Abrahimzadeh Joe Steinke
Control Components Inc. ABSTRACT
Fugitive Emissions requirements, compliance, and use have gained momentum in the oil and gas industry over the past 10 years which has created new challenges for valve suppliers. In an effort to address this challenge, various government organizations and industry leaders have designed and authored varying fugitive emission tests and specifications. However the variability of measurement techniques, test fluid medium and testing methods has left the seal and valve suppliers in the challenging position to establish uniform specification requirements, qualification and test procedures. Depending on the fugitive emissions requirement there can be a significant impact on cost, delivery, manufacturing and qualifications testing on the hardware and equipment to be supplied. One of the most important variables among the various fugitive emissions specifications is the leakage rate measurement methods. Two of the predominant specifications ISO 15848-1 and Shell 77/300/312 use different leakage rate measurement techniques and test procedures. ISO requires a total/global measurement method where Shell uses sniff measurement to determine leakage rate; while parts-per-million (PPM) or concentration measurements are specified per ISO 15848-2 production testing and EPA method 21. This paper will review and determine the relationship between the various leakage rate measurement techniques and present test data obtained in laboratory experiments to show the correlation between different leakage measurement methods. Performance and qualification between various valve/seal designs and industry standards can be better understood and correlated.
INTRODUCTION
Fugitive Emissions requirements and compliance have gained momentum in the oil and gas industry over the past 10 years. This has created new opportunities and challenges for valve and seal suppliers. Various government organizations and industry leaders have authored number of fugitive emission specifications and qualification requirements. However the variability of measurement techniques, test fluid medium, and testing methods have left the seal and valve suppliers in challenging position to meet the varying leakage requirements, qualification and test procedures. Depending on the fugitive emissions requirement there can be significant impact on cost, delivery, manufacturing, and qualifications testing on equipment supplied. This paper will review and determine if a relationship between the various leakage rate measurement techniques can be established and present test data obtained in laboratory experiments. The result is helpful to understand performance and qualification between various valve/seal designs and industry standards.
TEST SPECIFICATION OVERVIEW
Fugitive emission test procedures are frequently divided in two parts. Prototype qualification tests are where a valve is tested at operating pressure and temperature for a high number of cycles. A production test is then done on a sample of the proven design at a lower number of cycles and frequently a reduced pressure. One of the most important variables among the various fugitive emissions specifications is the leakage rate measurement methods. Two of the predominant prototype procedures, ISO 15848-1 and Shell 77/300, use different test methods and leakage rate measurement units. ISO 158484-1 requires a total/global measurement method and measured in absolute volume leakage rates. Shell 77/300 uses sniff measurement with absolute leakage rates where some leakage can be lost during sniff measurement. ISO 15848-2 and Shell 77/312 are used for production tests, and both procedures use a sniff test in PPM to measure leakage.
2
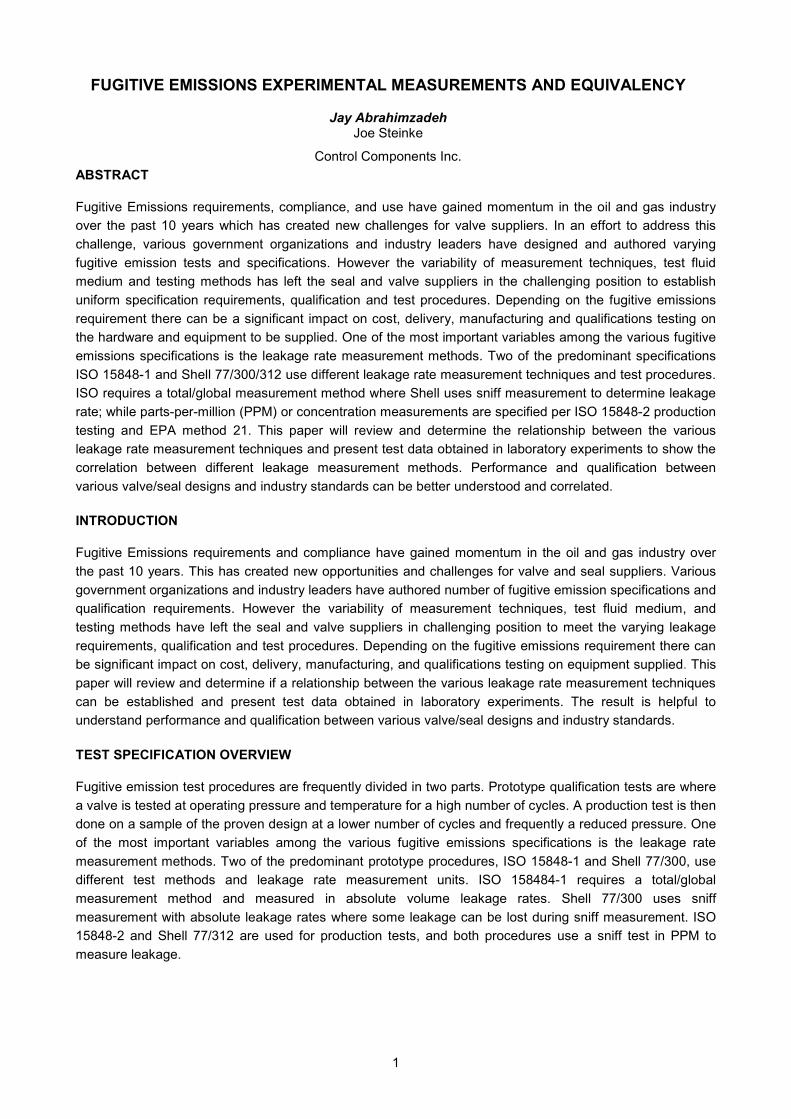
1. Vacuum Enclosure 2. Helium-Inlet 3. Mass Spectrometer
1. Stem 2. Sniff Probe
Figure 1, Global vs. Sniff testing
LEAKAGE RATE CORRELATIONS
The purpose of this test was to investigate how the total vacuum leakage rate results can be correlated with sniff leakage rate results and PPM concentration measurements as there is no direct conversion between these measurements units. Being able to correlate these different measurement values would be very helpful to extrapolate performance of a seal across multiple Fugitive Emissions specifications and estimate the seal performance.
In order to generate an absolute leakage for comparative testing, calibration standards with a variety of leakage rates were obtained. These calibrated leaks could then compared versus sniffed absolute leakage and ppm leakage values.
TESTING VARIABLES AND EQUIPMENT
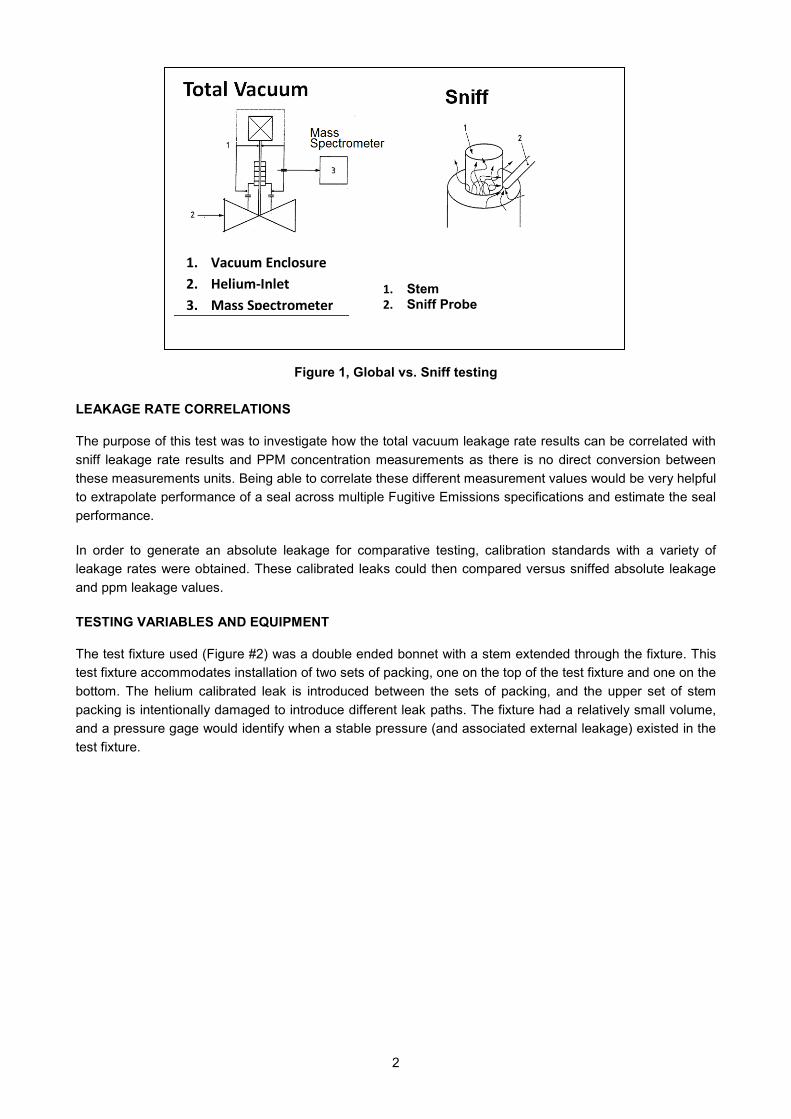
The test fixture used (Figure #2) was a double ended bonnet with a stem extended through the fixture. This test fixture accommodates installation of two sets of packing, one on the top of the test fixture and one on the bottom. The helium calibrated leak is introduced between the sets of packing, and the upper set of stem packing is intentionally damaged to introduce different leak paths. The fixture had a relatively small volume, and a pressure gage would identify when a stable pressure (and associated external leakage) existed in the test fixture.
3
Figure 2, Stem Packing Test Setup
Two different mass spectrometer devices were used, a Pfeiffer HLT-570 and Varian 979. The Pfeiffer HLT-570 has capability of measuring absolute leakage, sniffed absolute leakage, and PPM. The Varian 979 can measure absolute leakage and sniffed absolute leakage. The vacuum flow pulled by the Varian was measured which allowed the calculation of the ppm leakage by dividing the absolute sniffed helium leakage by the total vacuum flow. The total leak source is provided by four standard calibrated helium leak sources ranging from 4.76E-2 atm-cc/sec to 1.00E-06 (atm-cc/sec) to cover a range of possible leak rates. A pressure gauge was used to measure the packing box pressure. When the largest helium leak source (4.76E-02 atm-cc/sec) was attached and packing was installed, the maximum internal pressure was recorded to be as high as 22 psi. Since the bottle pressure on the leak source was 2000+ psi, back pressure from the fixture would have relatively little impact on the leakage rate.
SIMULATION OF LEAKING PACKING
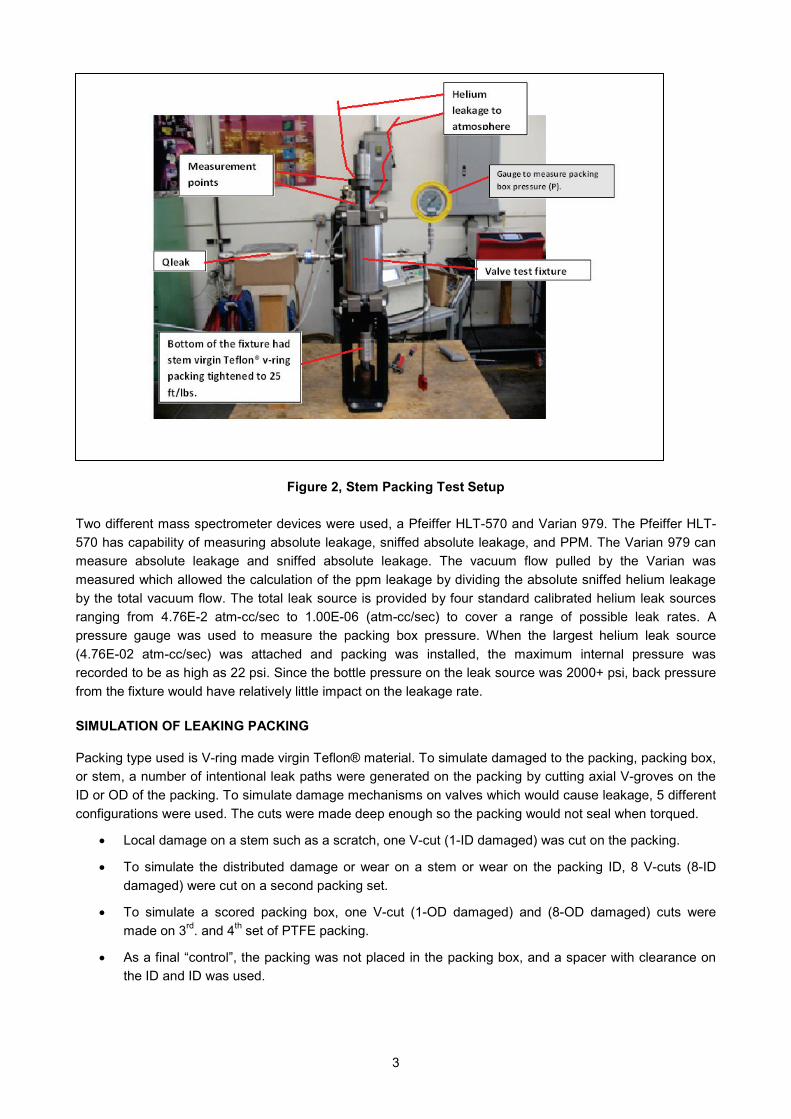
Packing type used is V-ring made virgin Teflon® material. To simulate damaged to the packing, packing box, or stem, a number of intentional leak paths were generated on the packing by cutting axial V-groves on the ID or OD of the packing. To simulate damage mechanisms on valves which would cause leakage, 5 different configurations were used. The cuts were made deep enough so the packing would not seal when torqued.
• Local damage on a stem such as a scratch, one V-cut (1-ID damaged) was cut on the packing.
• To simulate the distributed damage or wear on a stem or wear on the packing ID, 8 V-cuts (8-ID damaged) were cut on a second packing set.
• To simulate a scored packing box, one V-cut (1-OD damaged) and (8-OD damaged) cuts were made on 3rd. and 4th set of PTFE packing.
• As a final “control”, the packing was not placed in the packing box, and a spacer with clearance on the ID and ID was used.
4
Figure 3: V-Rings Packing with Intentional Damage (V-cut); From left to right One point ID- Damaged, eight point ID-Damaged, one point OD-Damaged, and eight point OD-Damaged
TEST MEASUREMENTS
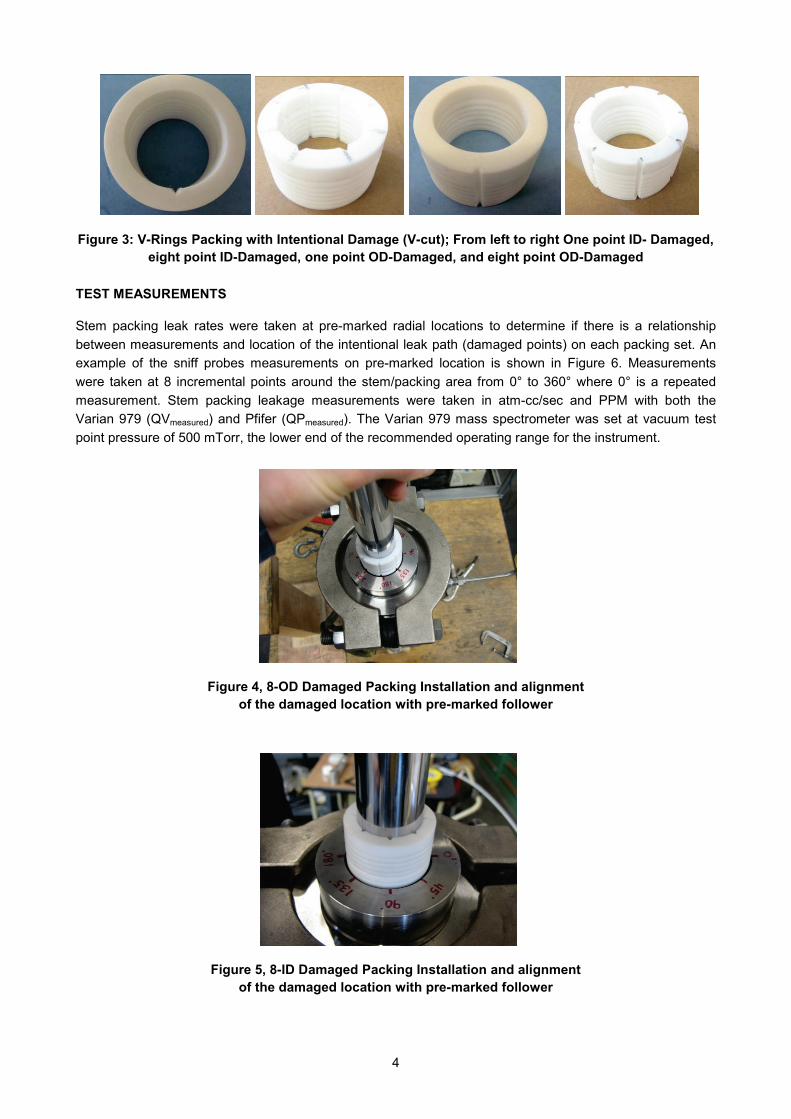
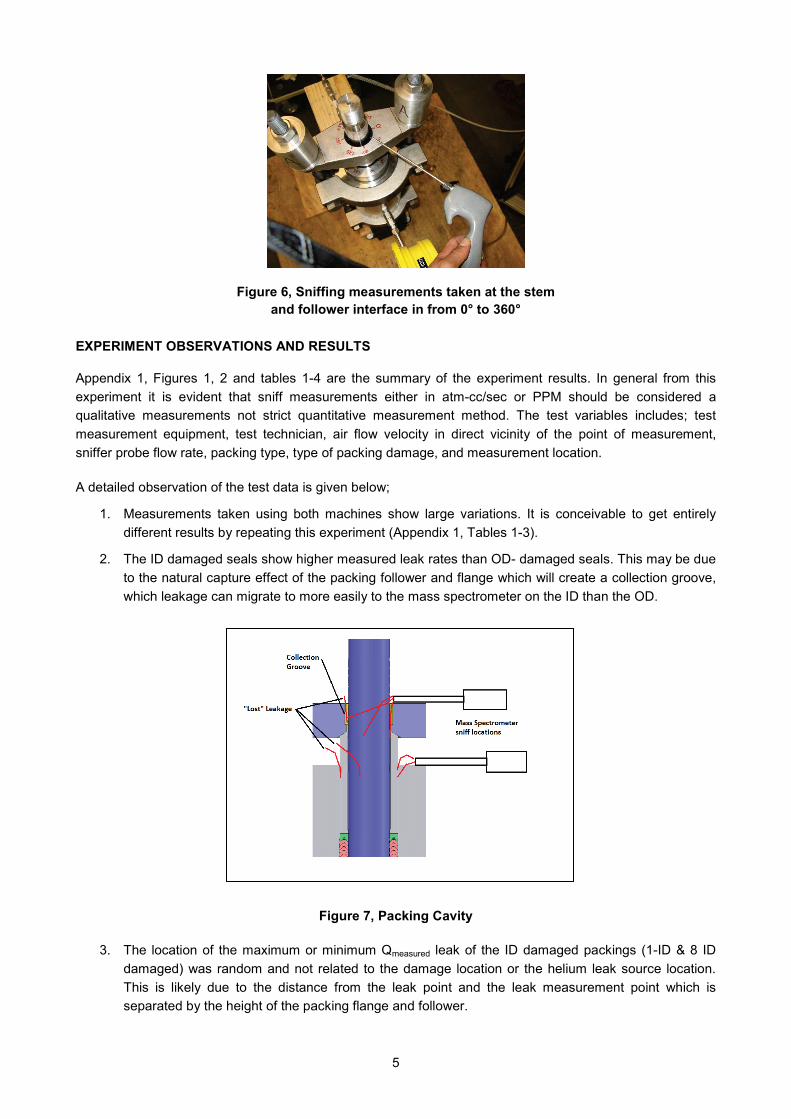
Stem packing leak rates were taken at pre-marked radial locations to determine if there is a relationship between measurements and location of the intentional leak path (damaged points) on each packing set. An example of the sniff probes measurements on pre-marked location is shown in Figure 6. Measurements were taken at 8 incremental points around the stem/packing area from 0° to 360° where 0° is a repeated measurement. Stem packing leakage measurements were taken in atm-cc/sec and PPM with both the Varian 979 (QVmeasured) and Pfifer (QPmeasured). The Varian 979 mass spectrometer was set at vacuum test point pressure of 500 mTorr, the lower end of the recommended operating range for the instrument.
Figure 4, 8-OD Damaged Packing Installation and alignment of the damaged location with pre-marked follower
Figure 5, 8-ID Damaged Packing Installation and alignment of the damaged location with pre-marked follower
5
Figure 6, Sniffing measurements taken at the stem and follower interface in from 0° to 360°
EXPERIMENT OBSERVATIONS AND RESULTS
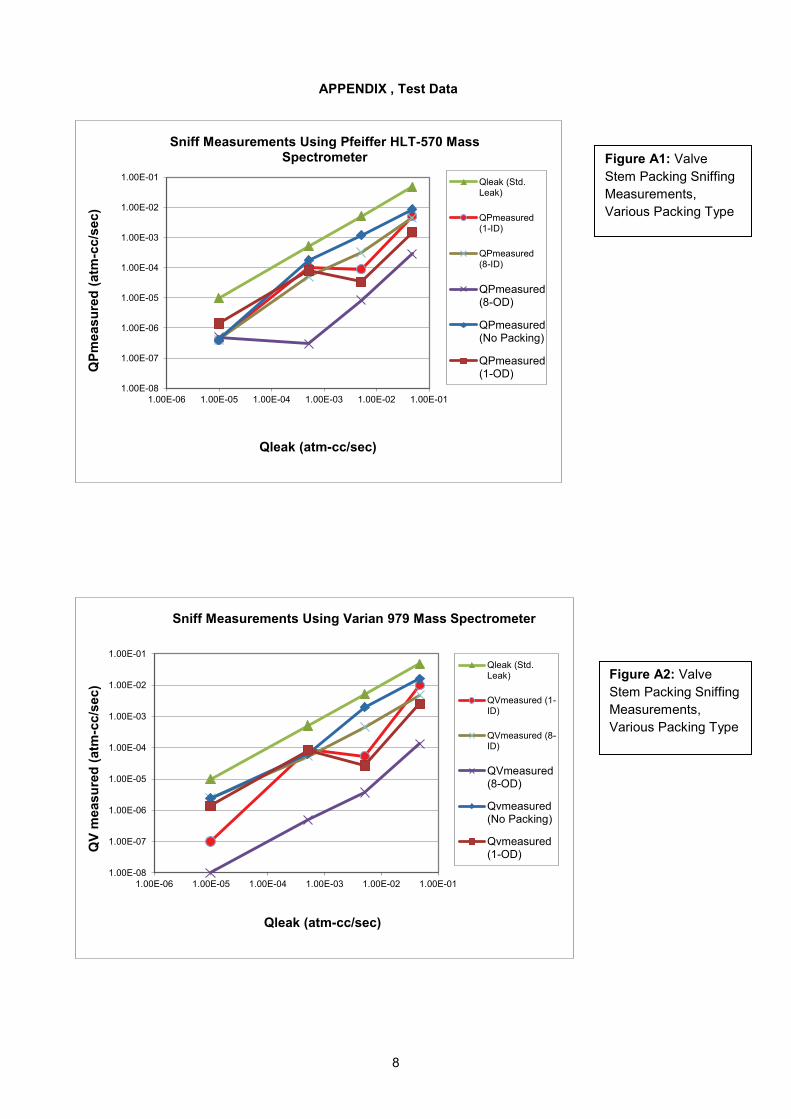
Appendix 1, Figures 1, 2 and tables 1-4 are the summary of the experiment results. In general from this experiment it is evident that sniff measurements either in atm-cc/sec or PPM should be considered a qualitative measurements not strict quantitative measurement method. The test variables includes; test measurement equipment, test technician, air flow velocity in direct vicinity of the point of measurement, sniffer probe flow rate, packing type, type of packing damage, and measurement location.
A detailed observation of the test data is given below;
1. Measurements taken using both machines show large variations. It is conceivable to get entirely different results by repeating this experiment (Appendix 1, Tables 1-3).
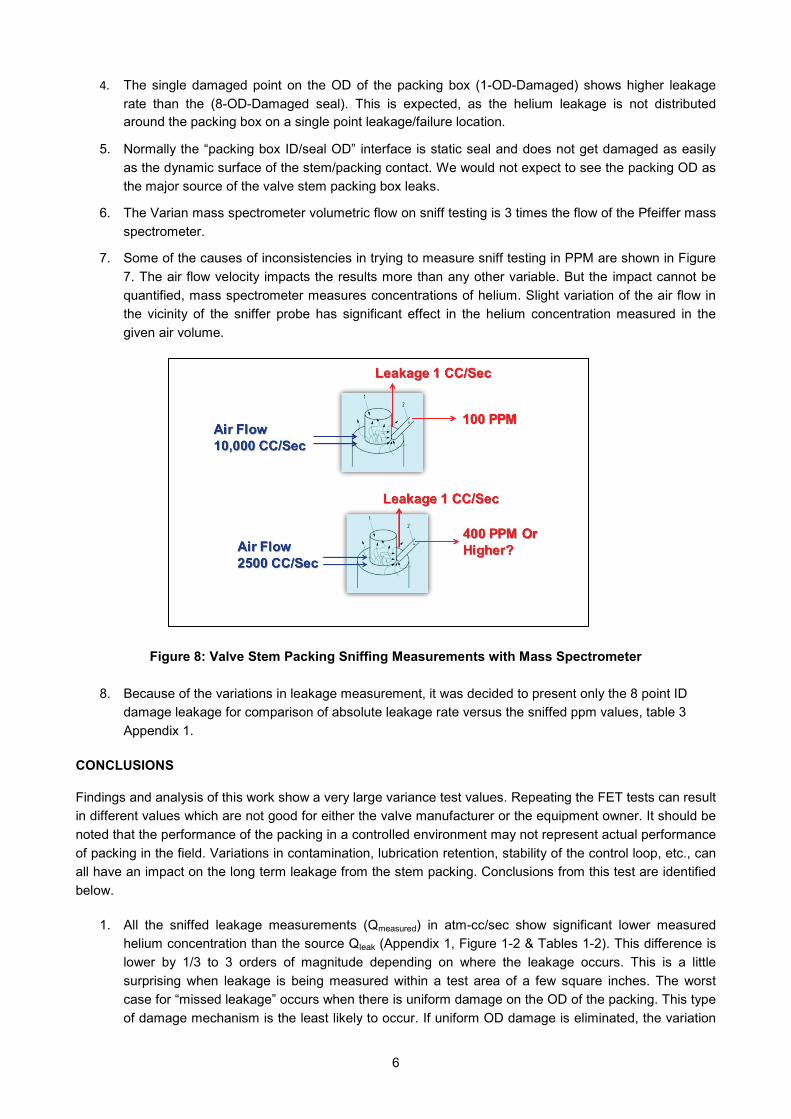
2. The ID damaged seals show higher measured leak rates than OD- damaged seals. This may be due to the natural capture effect of the packing follower and flange which will create a collection groove, which leakage can migrate to more easily to the mass spectrometer on the ID than the OD.
Figure 7, Packing Cavity
3. The location of the maximum or minimum Qmeasured leak of the ID damaged packings (1-ID & 8 ID damaged) was random and not related to the damage location or the helium leak source location. This is likely due to the distance from the leak point and the leak measurement point which is separated by the height of the packing flange and follower.
6
4. The single damaged point on the OD of the packing box (1-OD-Damaged) shows higher leakage rate than the (8-OD-Damaged seal). This is expected, as the helium leakage is not distributed around the packing box on a single point leakage/failure location.
5. Normally the “packing box ID/seal OD” interface is static seal and does not get damaged as easily as the dynamic surface of the stem/packing contact. We would not expect to see the packing OD as the major source of the valve stem packing box leaks.
6. The Varian mass spectrometer volumetric flow on sniff testing is 3 times the flow of the Pfeiffer mass spectrometer.
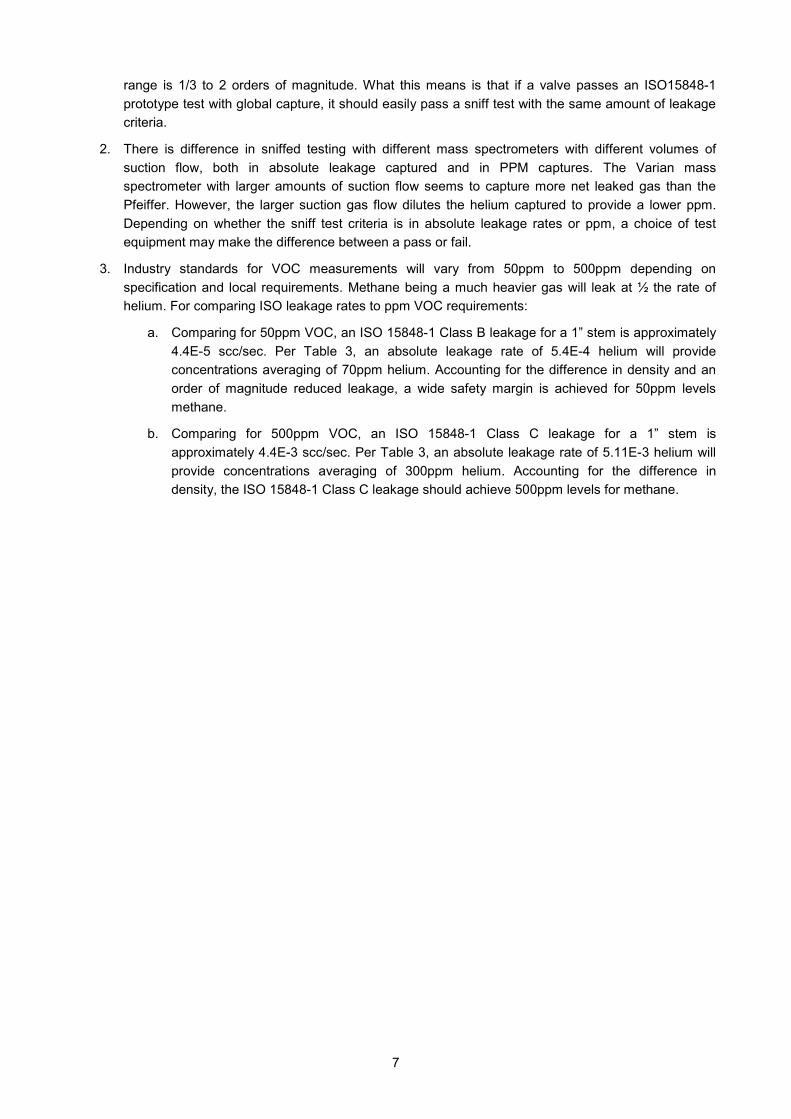
7. Some of the causes of inconsistencies in trying to measure sniff testing in PPM are shown in Figure 7. The air flow velocity impacts the results more than any other variable. But the impact cannot be quantified, mass spectrometer measures concentrations of helium. Slight variation of the air flow in the vicinity of the sniffer probe has significant effect in the helium concentration measured in the given air volume.
Figure 8: Valve Stem Packing Sniffing Measurements with Mass Spectrometer
8. Because of the variations in leakage measurement, it was decided to present only the 8 point ID damage leakage for comparison of absolute leakage rate versus the sniffed ppm values, table 3 Appendix 1.
CONCLUSIONS
Findings and analysis of this work show a very large variance test values. Repeating the FET tests can result in different values which are not good for either the valve manufacturer or the equipment owner. It should be noted that the performance of the packing in a controlled environment may not represent actual performance of packing in the field. Variations in contamination, lubrication retention, stability of the control loop, etc., can all have an impact on the long term leakage from the stem packing. Conclusions from this test are identified below.
1. All the sniffed leakage measurements (Qmeasured) in atm-cc/sec show significant lower measured helium concentration than the source Qleak (Appendix 1, Figure 1-2 & Tables 1-2). This difference is lower by 1/3 to 3 orders of magnitude depending on where the leakage occurs. This is a little surprising when leakage is being measured within a test area of a few square inches. The worst case for “missed leakage” occurs when there is uniform damage on the OD of the packing. This type of damage mechanism is the least likely to occur. If uniform OD damage is eliminated, the variation
7
range is 1/3 to 2 orders of magnitude. What this means is that if a valve passes an ISO15848-1 prototype test with global capture, it should easily pass a sniff test with the same amount of leakage criteria.
2. There is difference in sniffed testing with different mass spectrometers with different volumes of suction flow, both in absolute leakage captured and in PPM captures. The Varian mass spectrometer with larger amounts of suction flow seems to capture more net leaked gas than the Pfeiffer. However, the larger suction gas flow dilutes the helium captured to provide a lower ppm. Depending on whether the sniff test criteria is in absolute leakage rates or ppm, a choice of test equipment may make the difference between a pass or fail.
3. Industry standards for VOC measurements will vary from 50ppm to 500ppm depending on specification and local requirements. Methane being a much heavier gas will leak at ½ the rate of helium. For comparing ISO leakage rates to ppm VOC requirements:
a. Comparing for 50ppm VOC, an ISO 15848-1 Class B leakage for a 1” stem is approximately 4.4E-5 scc/sec. Per Table 3, an absolute leakage rate of 5.4E-4 helium will provide concentrations averaging of 70ppm helium. Accounting for the difference in density and an order of magnitude reduced leakage, a wide safety margin is achieved for 50ppm levels methane.
b. Comparing for 500ppm VOC, an ISO 15848-1 Class C leakage for a 1” stem is approximately 4.4E-3 scc/sec. Per Table 3, an absolute leakage rate of 5.11E-3 helium will provide concentrations averaging of 300ppm helium. Accounting for the difference in density, the ISO 15848-1 Class C leakage should achieve 500ppm levels for methane.
8
APPENDIX , Test Data
1.00E-08
1.00E-07
1.00E-06
1.00E-05
1.00E-04
1.00E-03
1.00E-02
1.00E-01
1.00E-06 1.00E-05 1.00E-04 1.00E-03 1.00E-02 1.00E-01
QPm
easu
red
(atm
-cc/
sec)
Qleak (atm-cc/sec)
Sniff Measurements Using Pfeiffer HLT-570 Mass Spectrometer
Qleak (Std.Leak)
QPmeasured(1-ID)
QPmeasured(8-ID)
QPmeasured(8-OD)
QPmeasured(No Packing)
QPmeasured(1-OD)
1.00E-08
1.00E-07
1.00E-06
1.00E-05
1.00E-04
1.00E-03
1.00E-02
1.00E-01
1.00E-06 1.00E-05 1.00E-04 1.00E-03 1.00E-02 1.00E-01
QV
mea
sure
d (a
tm-c
c/se
c)
Qleak (atm-cc/sec)
Sniff Measurements Using Varian 979 Mass Spectrometer
Qleak (Std.Leak)
QVmeasured (1-ID)
QVmeasured (8-ID)
QVmeasured(8-OD)
Qvmeasured(No Packing)
Qvmeasured(1-OD)
Figure A1: Valve Stem Packing Sniffing Measurements, Various Packing Type
Figure A2: Valve Stem Packing Sniffing Measurements, Various Packing Type
9
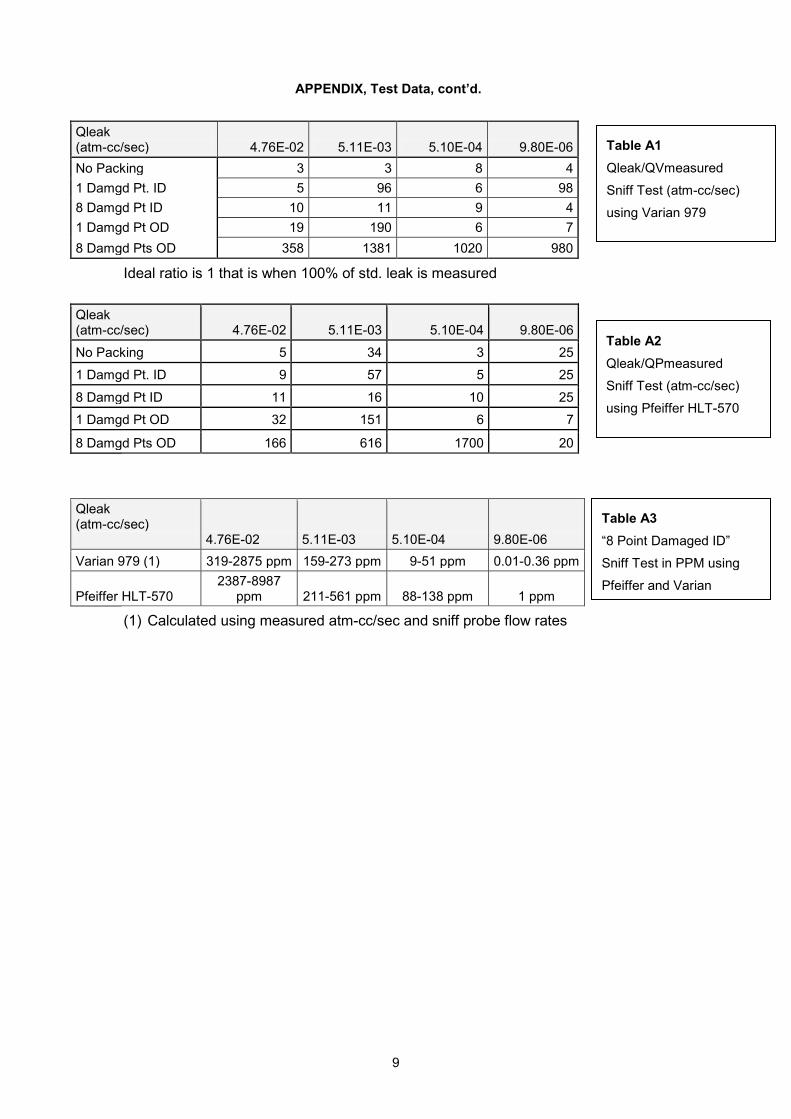
APPENDIX, Test Data, cont’d.
Qleak (atm-cc/sec) 4.76E-02 5.11E-03 5.10E-04 9.80E-06 No Packing 3 3 8 4 1 Damgd Pt. ID 5 96 6 98 8 Damgd Pt ID 10 11 9 4 1 Damgd Pt OD 19 190 6 7 8 Damgd Pts OD 358 1381 1020 980
Ideal ratio is 1 that is when 100% of std. leak is measured
Qleak (atm-cc/sec) 4.76E-02 5.11E-03 5.10E-04 9.80E-06
No Packing 5 34 3 25
1 Damgd Pt. ID 9 57 5 25
8 Damgd Pt ID 11 16 10 25
1 Damgd Pt OD 32 151 6 7
8 Damgd Pts OD 166 616 1700 20
Qleak (atm-cc/sec) 4.76E-02 5.11E-03 5.10E-04
9.80E-06
Varian 979 (1) 319-2875 ppm 159-273 ppm 9-51 ppm 0.01-0.36 ppm
Pfeiffer HLT-570 2387-8987
ppm 211-561 ppm 88-138 ppm 1 ppm
(1) Calculated using measured atm-cc/sec and sniff probe flow rates
Table A1 Qleak/QVmeasured
Sniff Test (atm-cc/sec)
using Varian 979
Table A2 Qleak/QPmeasured
Sniff Test (atm-cc/sec)
using Pfeiffer HLT-570
Table A3 “8 Point Damaged ID”
Sniff Test in PPM using
Pfeiffer and Varian


![Fugitive Emission Frequently Asked Questions - … · Title: Microsoft Word - Fugitive Emissions - FAQ's_2014Feb19_draft3[3].docx Author: Freelance Station 2 Created Date: 2/20/2014](https://img.dokumen.tips/doc/110x75/5b33e0bf7f8b9a8b4b8b7d23/fugitive-emission-frequently-asked-questions-title-microsoft-word-fugitive.jpg)