Embed Size (px)
Citation preview
University of Wisconsin MilwaukeeUWM Digital Commons
Theses and Dissertations
May 2014
Comparison of CBR and Pin Puncture StrengthTesting Used in the Evaluation of GeotextilesStacy Van DykeUniversity of Wisconsin-Milwaukee
Follow this and additional works at: https://dc.uwm.edu/etdPart of the Civil Engineering Commons
This Thesis is brought to you for free and open access by UWM Digital Commons. It has been accepted for inclusion in Theses and Dissertations by anauthorized administrator of UWM Digital Commons. For more information, please contact [email protected].
Recommended CitationVan Dyke, Stacy, "Comparison of CBR and Pin Puncture Strength Testing Used in the Evaluation of Geotextiles" (2014). Theses andDissertations. 773.https://dc.uwm.edu/etd/773

COMPARISON OF CBR AND PIN PUNCTURE STRENGTH TESTING
USED IN THE EVALUATION OF GEOTEXTILES
by
Stacy Van Dyke
A Thesis Submitted in
Partial Fulfillment of the
Requirements for the Degree of
Master of Science
in Engineering
at
The University of Wisconsin-Milwaukee
May 2014

ii
ABSTRACT
COMPARISON OF CBR AND PIN PUNCTURE STRENGTH TESTING
USED IN THE EVALUATION OF GEOTEXTILES
by
Stacy Van Dyke
The University of Wisconsin-Milwaukee, 2014
Under the Supervision of Professor Hani Titi
Geotextiles are commonly used in pavements, earth retaining structures, and
landfills, as well as other geotechnical applications. Various tests are conducted to
evaluate and classify geotextiles to determine their suitability for different applications.
One of these tests is the puncture strength test. This test evaluates the ability of
geotextiles to withstand stresses and loads during construction, which is among the
severe conditions that geotextiles can experience. ASTM has recently replaced the
standard pin puncture strength test, D4833, with the CBR puncture strength test, D6241.
However, many departments of transportation (DOTs) throughout the country and the
Federal Highway Administration still refer to D4833. Other state DOTs refer to both
D4833 and D6241, or provide a list of alternative test methods to be considered in place
of either of these tests. This inconsistency is the result of a missing connection between
the old and new ASTMs. The objective of this research is to attempt to correlate the CBR
and pin puncture strengths for various categories of geotextiles, regardless of weave type
and mass per unit area. Subsequent to this, deterioration of geotextiles due to freeze-thaw
conditioning was investigated. Puncture resistances of materials with like mass per unit
area and base material but with different weave type were also examined. Five types of
polypropylene (PP) geotextiles, three nonwoven and two woven, were subjected to

iii
testing in accordance with ASTM D4833 and ASTM D6241 standard procedures. Ten
and fifteen samples of each geotextile type were tested using CBR and pin punctures
strength tests, respectively. All five types of geotextiles exhibited puncture strength
values, whether pin or CBR, that were consistent within each group with coefficients of
variation ranging from 2.8 and 13.3%. It should be noted that distinct load-displacement
curves were exhibited within each material group. Statistical analyses were conducted to
establish a correlation between CBR and pin puncture strength values. Correlations were
successfully used to estimate the CBR puncture strength values from the pin test with a
reasonable accuracy. The coefficient of determination for this correlation was obtained as
R2= 0.78. An attempt was made to investigate the freeze-thaw cycles’ effect on geotextile
performance with respect to the puncture strength test. Finally, the preliminary testing of
geotextiles subjected to freeze-thaw conditioning showed degradation, but further
investigation using a greater number of freeze-thaw cycles is required to develop a trend.
.

iv
© Copyright by Stacy Van Dyke, 2014
All Rights Reserved

v
TABLE OF CONTENTS
List of Figures ...................................................................................................... vii
List of Tables ........................................................................................................ ix
List of Abbreviations ..............................................................................................x
Acknowledgements ............................................................................................... xi
An important note on terminology used in this thesis .............................................1
CHAPTER 1. INTRODUCTION ........................................................................2
1.1 Problem Statement ..........................................................................................2
1.2 Objectives .......................................................................................................4
1.2.1 Scope .........................................................................................................4
1.3 Organization of manuscript.............................................................................4
CHAPTER 2. BACKGROUND ............................................................................5
2.1 Geotextiles ......................................................................................................5
2.1.1 Function classification .............................................................................5
2.1.1.1 Separation ..........................................................................................5
2.1.1.2 Filtration ............................................................................................6
2.1.1.3 Reinforcement ...................................................................................6
2.1.1.4 Protection ..........................................................................................8
2.1.1.5 Drainage ............................................................................................8
2.1.2 Manufacturing classification ...................................................................8
2.1.2.1 Woven geotextiles ...........................................................................10
2.1.2.2 Nonwoven geotextiles .....................................................................12
2.1.2.3 Knitted geotextiles ..........................................................................13
2.1.3 Polymer classification ............................................................................14
2.1.4 Basic geotextile properties .....................................................................15
2.3 History of geotextile testing .........................................................................16
2.3.1 Evolution of puncture testing .................................................................16
2.3.2 Current significance and use of ASTMs ................................................18
2.3.3 Comparison of ASTM D4833 and ASTM D6241 .................................19
2.4 State of the art research on puncture strength testing of geotextiles ............21
2.4.1 Testing method variations......................................................................21
2.4.1.1 Clamping mechanism .....................................................................21
2.4.1.2 Rate of compression .......................................................................23
2.4.2 Geotextiles tested ...................................................................................25
2.4.2.1 In a system .....................................................................................25
2.4.2.2 Mass per unit area ..........................................................................26
2.4.2.3 Base material ..................................................................................28
2.4.2.4 Weave ............................................................................................28
CHAPTER 3. METHODOLOGY ......................................................................30
3.1 Materials selected for research .........................................................................30
3.2 Methods............................................................................................................32
3.2.1 Sample preparation ....................................................................................32

vi
3.2.1.1 Freeze-thaw conditioning.....................................................................35
3.2.2 Clamping fixture ........................................................................................37
3.2.3 Testing procedure .......................................................................................39
CHAPTER 4. RESULTS AND ANALYSIS ......................................................41
4.1 Pin and CBR puncture Strength .......................................................................41
4.1.1 Behavior of nonwoven geotextiles under CBR puncture failure load .......42
4.1.2 Behavior of woven geotextiles under CBR puncture failure load .............48
4.1.3 CBR puncture testing failure characteristics..............................................60
4.2 Correlation of CBR and Pin Puncture Strength ...............................................61
4.3 Mass per unit area used to select geotextiles ...................................................66
4.3.1 Effect of weave type on CBR puncture strength .......................................66
4.4 Susceptibility of nonwoven geotextiles to freeze/thaw deterioration ..............69
CHAPTER 5. CONCLUSIONS ..........................................................................73
References ..............................................................................................................77
Appendix A: Load-displacement curves for Pin and CBR
puncture strength tests ...................................................................81
Appendix B: R-Controller program settings ........................................................120

vii
LIST OF FIGURES
Figure 2.1 Geotextile functional groups..................................................................7
Figure 2.2 Geotextile manufacturing groups ..........................................................9
Figure 2.3 Classification of geotextiles based on manufacturing process ............10
Figure 2.4 Common geotextile weaves .................................................................10
Figure 2.5 Common yarns used in woven geotextiles ..........................................11
Figure 2.6 Common yarn types at 8x magnification (Bhatia et al., 1996) ............12
Figure 2.7 Nonwoven fibers at 80x magnification (Bhatia et al., 1996) ...............12
Figure 2.8 Plungers used for CBR and pin puncture strength testing of
geotextiles in the UW-Milwaukee Engineering Mechanics
and Composites Lab .......................................................................20
Figure 2.9 Clamping fixtures used for puncture strengh testing of geotextiles
in the UW-Milwaukee Engineering Mechanics and
Composites Lab ...............................................................................20
Figure 2.10 Hydraulic pin and CBR puncture strength testing apparatuses
proposed by Hsieh and Wang (2008) ..............................................22
Figure 2.11 Failure stages of polyester needlepunched nonwoven geotextile
(After Askari et al. (2012)) .............................................................25
Figure 2.12 Puncture resistances of polyester and polypropylene materials
(Koerner and Koerner, 2010) ..........................................................29
Figure 3.1 Geotextile materials (as shown) selected for research .........................31
Figure 3.2 Layout of samples used for testing ......................................................33
Figure 3.3 Sample selections near a deformed area ..............................................34
Figure 3.4 Woven and nonwoven geotextile specimens prepared for pin
and CBR puncture strength tests .....................................................35
Figure 3.5 Freeze-thaw conditioning machine at the UW-Milwaukee
Structural Lab ..................................................................................36
Figure 3.6 Clamping fixtures used for puncture testing at the UW-Milwaukee
Mechanics and Composites Lab .....................................................38
Figure 3.7 Sandpaper used to prevent geotextile slippage (shown on
ASTM D4833 (pin) clamp) .............................................................39
Figure 3.8 Testing Machine at the UW-Milwaukee Engineering Mechanics ......40
and Composites Research Lab
Figure 4.1 Pin puncture strengths for geotextile material A samples ..................43
Figure 4.2 CBR puncture strengths for geotextile material A samples.................44

viii
Figure 4.3 Nonwoven geotextile puncture strength failure curve demonstrated
using a representative material A load vs. displacement curve ......45
Figure 4.4 Failure stages of nonwoven geotextile (Material A is pictured
subjected to the CBR puncture strength test) ..................................47
Figure 4.5 Pin puncture strengths for geotextile material B samples ...................49
Figure 4.6 CBR puncture strengths for geotextile material B samples .................50
Figure 4.7 Woven geotextile puncture strength failure curve demonstrated
using a representative material B load vs. displacement curve .......51
Figure 4.8 Failure stages of woven geotextile (Material D is pictured subjected
to the CBR puncture strength test) .................................................53
Figure 4.9 Pin puncture strengths for geotextile material C samples ...................54
Figure 4.10 CBR puncture strengths for geotextile material C samples ...............55
Figure 4.11 Pin puncture strengths for geotextile material D samples .................56
Figure 4.12 CBR puncture strengths for geotextile material D samples...............57
Figure 4.13 Pin puncture strengths for geotextile material E samples ..................58
Figure 4.14 CBR puncture strength for geotextile material E samples .................59
Figure 4.15 Pin and CBR puncture strength for all materials tested plotted
with their average value ..................................................................60
Figure 4.16 Estimated CBR puncture strength using separate equations to
describe woven and nonwoven materials ........................................63
Figure 4.17 Estimated CBR puncture strength using Equation 6 .........................65
Figure 4.18 Comparison of the estimated CBR puncture strength using
Equation 6 and the line of best fit for measured results ..................65
Figure 4.19 CBR loading curves for material A (PP, nonwoven, 4 oz/yd2)
and material B (PP, woven, 4 oz/yd2) .............................................66
Figure 4.20 CBR loading curves for material C (PP, nonwoven, 8 oz/yd2)
and material D (PP, woven, 8 oz/yd2) .............................................67
Figure 4.21 CBR loading curves for materials A-D .............................................68
Figure 4.22 Puncture strength of materials with two mass per unit areas ............69
Figure 4.23 Bar chart of puncture strength of freeze/thaw conditioned
test samples (error bars indicate standard deviations) ....................70
Figure 4.24 Puncture strength of freeze/thaw conditioned test samples
plotted with the unconditioned material average (error bars
indicate standard deviation of unconditioned samples) ..................71
Figure 4.25 Conditioned vs. unconditioned CBR puncture strengths
of material E ...................................................................................72

ix
LIST OF TABLES
Table 2.1 Polymers used in geotextile materials ...................................................14
Table 2.2 Basic properties of geotextiles ..............................................................15
Table 2.3 Comparison of pin and CBR testing standards .....................................19
Table 2.4 CBR puncture strength test results at five (5) different test speeds
for polyester geotextiles with different mass per unit areas
(Adapted from Askari et al. 2012) ..................................................24
Table 3.1 Materials selected for research ..............................................................31
Table 3.2 Final conditioned sample weights .........................................................37
Table 4.1 Summary of pin and CBR puncture strength tests ................................41
Table 4.2 Puncture strength failure comparison of nonwoven and woven
PP geotextiles .................................................................................61
Table 4.3 Paramaters used in developing CBR and pin puncture
strength correlation ........................................................................62
Table 4.4 Summary of conditioned sample testing ...............................................70

x
LIST OF ABBREVIATIONS
AASHTO: American Association of State Highway and Transportation Officials
ASTM: American Society for Testing and Materials
CBR: California Bearing Ratio
CRE: Constant Rate of Extension
CRT: Constant Rate of Traverse
FHWA: Federal Highway Administration
HDPE: High Density Polyethylene
ISO: International Organization for Standardization
PET: Polyester
PE: Polyethylene
PP: Polypropylene
DOS: Directionally Oriented Structure
DOT: Department of Transportation

xi
ACKNOWLEDGMENTS
My sincere appreciation is extended to my major professor, Dr. Hani Titi, for his
guidance throughout this project and without whom this thesis would not have been
possible. I would also like to acknowledge Dr. Hani Titi, as well as Dr. Rani El-Hajjar,
Dr. Kurt Beschorner, and Dr. Habib Tabatabai who, in particular, have all impacted my
educational goals for the better and made my experience at UWM fruitful and worthwhile.
I would like to thank Issam Qamhia, Peng Yang, Seyed Shams and the UWM
Engineering Mechanics and Composites Lab for their technical assistance as well as
Brian Mullen and the UWM Structural Lab for conditioning a selection of samples. I
would also like to acknowledge TenCate Geosynthetics for supplying the materials used
in testing, with special thanks to Teri Krock and Brett Odgers, and Jay Schabelski of
Romus, Inc. for constructing the clamping fixtures and probes. Additional thanks is due
to the UW-Milwaukee machine shop for their assistance with the test fixture and fast
paced assistance, especially John Condon for being one of the best “go-to” guys there are.
I am grateful to Matthew Cowap and Erik Johnson for their cheery dispositions
and ability to maintain my sanity as well as Valbon Latifi for his camaraderie throughout
the process. I would also like to thank Mr. Tom Stulmacher, Ms. Natalie Kubicek, and
Ms. Brianna Turley for their various contributions to my success.
Finally, I would like to express my deepest gratitude to my parents, my sisters,
Emily and Natalie, and Tucker for their unwavering love and support.

1
An important note on terminology used in this thesis
Several standards published by the American Society for Testing and Materials
(ASTM) are discussed in this thesis. “ASTM” is an acronym describing an organization
that publishes standards, but is commonly used to describe an actual standard when the
standard’s number follows it (ie. ASTM D6241). It is also common to exclude the
“ASTM” when discussing multiple tests. For example, “D6241” will be used to describe
the standard developed by the ASTM to test puncture resistance of geotextiles.
The author would also like to note that, while writing this thesis, ASTM
Committee D35 on Geosynthetics is undergoing a process to convert ASTM D4439
terminology to the International Organization for Standardization (ISO) 10318 standard
terminology (Mackey 2013). All terminology used in this thesis is defined by the ASTM
terminology specified in ASTM D4439-14.
2
CHAPTER 1
INTRODUCTION
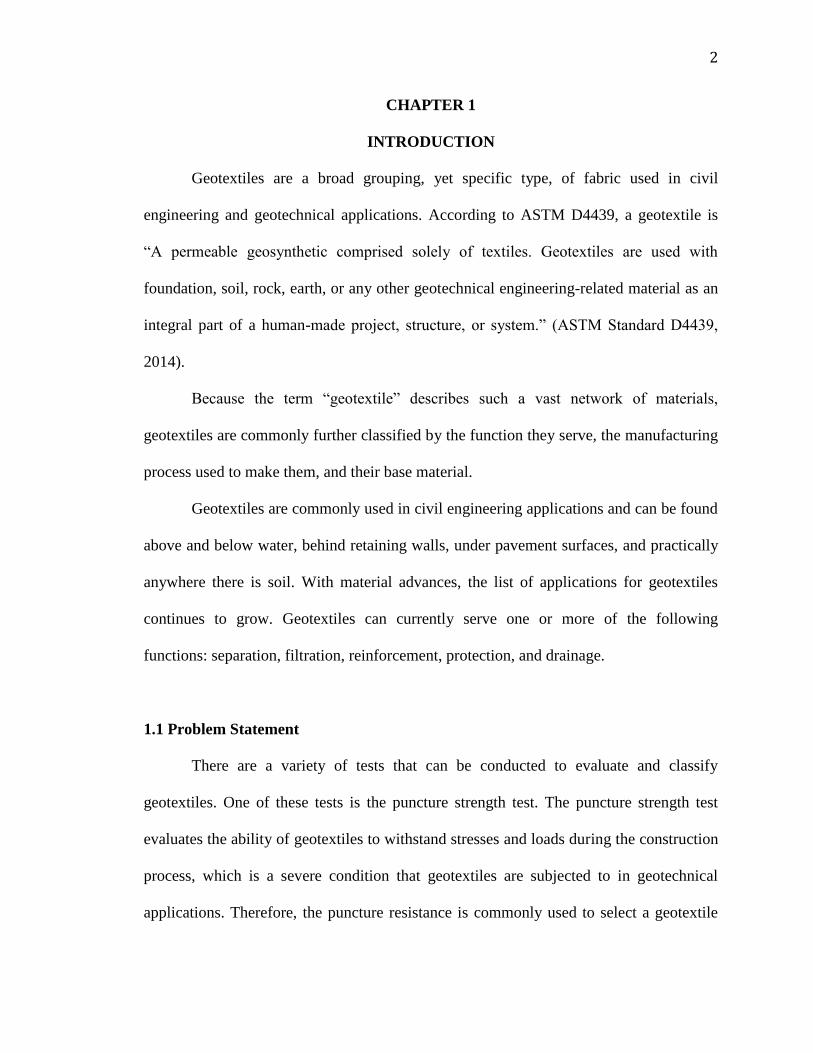
Geotextiles are a broad grouping, yet specific type, of fabric used in civil
engineering and geotechnical applications. According to ASTM D4439, a geotextile is
“A permeable geosynthetic comprised solely of textiles. Geotextiles are used with
foundation, soil, rock, earth, or any other geotechnical engineering-related material as an
integral part of a human-made project, structure, or system.” (ASTM Standard D4439,
2014).
Because the term “geotextile” describes such a vast network of materials,
geotextiles are commonly further classified by the function they serve, the manufacturing
process used to make them, and their base material.
Geotextiles are commonly used in civil engineering applications and can be found
above and below water, behind retaining walls, under pavement surfaces, and practically
anywhere there is soil. With material advances, the list of applications for geotextiles
continues to grow. Geotextiles can currently serve one or more of the following
functions: separation, filtration, reinforcement, protection, and drainage.
1.1 Problem Statement
There are a variety of tests that can be conducted to evaluate and classify
geotextiles. One of these tests is the puncture strength test. The puncture strength test
evaluates the ability of geotextiles to withstand stresses and loads during the construction
process, which is a severe condition that geotextiles are subjected to in geotechnical
applications. Therefore, the puncture resistance is commonly used to select a geotextile

3
and predict its performance over time. Over the last several years ASTM D4833, the
“Standard Test Method for Index Puncture Resistance of Geomembranes and Related
Products,” was used to determine the puncture resistance value.
ASTM, American Association of State Highway and Transportation Officials
(AASHTO), and the geotextile industry have since replaced ASTM D4833 with D6241,
the “Standard Test Method for the Static Puncture Strength of Geotextiles and Geotextile-
related Products Using a 50-mm Probe,” as D4833 has been deemed insufficient in
classifying geotextile materials. Many departments of transportation (DOT) throughout
the country and the Federal Highway Administration (FHWA) Section 716, however, still
refer to D4833. Other state DOTs refer to both D4833 and D6241, or provide a list of
alternative test methods to be considered in place of either of these tests. This
inconsistency is the result of a missing connection between the old and new ASTMs.
Narejo et al. (1996), Jones et al. (2000), Hsieh and Wang (2008), Koerner and Koerner
(2010), and Rawal, Saraswat (2011) and Askari et al. (2012) conducted studies with
varying relationships based on exclusive material types, using either nonwoven materials
or nonwoven materials.
Should DOTs choose to adopt the D6241 testing procedure, a correlation between
the two ASTM tests, regardless of material, is required.
Many research studies have passively compared ASTMs D4833 and D6241 or
determined a trend among a specific manufacturing or material classification, but a
correlation of pin and California Bearing Ratio (CBR) puncture resistance testing
methods, independent of manufacturing or material type, has not been attempted.

4
1.2 Objectives
The objective of this research is to test several geotextiles with a controlled
material type and mass per unit area using ASTMs D4833 and D6241 in order to describe
the relationship between the pin and CBR puncture strengths rather than a relationship
between material types. In addition, this study will investigate if weave type impacts the
puncture resistance of a geotextile’s performance and will attempt to examine the effects
of freeze-thaw conditioning on needlepunched nonwoven materials.
1.2.1 Scope
The scope of this research is limited to performing the standard ASTM pin and
CBRR puncture strength tests on five types, three nonwoven and two woven, of
geotextiles with varying mass per unit areas.
1.3 Organization of Manuscript
This manuscript is organized in five chapters. Chapter One presents the
introduction, problem statement and objectives and scope of the research study. A
literature review and background information on geotextiles with respect to puncture
strength tests are synthesized in Chapter Two. Research methodology and tools used to
perform the research are discussed in Chapter Three. Chapter Four presents the results of
the research and analysis in addition to a critical evaluation of test results. Conclusions
are summarized in Chapter Five.

5
CHAPTER 2
BACKGROUND
This chapter presents the literature review results of geotextile in terms of
material type, manufacturing process, usage in civil engineering applications, and
physical and mechanical properties with an emphasis on puncture strength resistance.
Papers, reports, and standards were reviewed, compiled and synthesized herein. In
addition, the differences between ASTM D4833 (pin) and ASTM D6241 (CBR) puncture
strength tests are also highlighted.
2.1 Geotextiles
Geotextiles are a broad grouping, yet specific type, of fabric used in civil
engineering and geotechnical applications. Because the term “geotextile” describes such
a vast network of materials, geotextiles are commonly further classified by the function
they serve, the manufacturing process used to make them, and their base material.
2.1.1 Function Classification
Geotextiles can serve one or more of the following functions: separation, filtration,
reinforcement, protection, and drainage.
2.1.1.1 Separation
Geotextiles allow two or more soil layers to act independently, yet as part of the
same system. Separating soils that have different grain size distributions allows each
layer to function as an independent component of the soil structure. For example, during
pavement construction, a granular base course is typically constructed over the subgrade

6
or subbase course layer. Repetitive loading can cause the larger aggregate in the base
course to penetrate into the soft subgrade beneath. Contamination in the other direction is
also possible when the moisture content of the soil is increased. When saturated, soft
subgrade particles could transfer via the flow of water to the lower pressure region within
the larger voids of the granular base. The newly combined soil will have a different grain
size distribution, and therefore different properties. Figure 2.1a depicts a geotextile being
used in subgrade-base course separation during pavement construction.
2.1.1.2 Filtration
Geotextiles can also function as a filter. Filter geotextiles are designed to allow
the flow of water while preventing the movement of soil particles. Well-designed
geotextiles will relieve hydrostatic pressure buildup behind embankments, retaining walls,
and other structures. Because the stability of these systems is a function of both the
structural member and the soil behind and beneath the structure, the loss of soil must be
prevented. Geotextiles functioning as filters, as shown in Figure 2.1b, will help stabilize
the soil-structure system by reducing the loss of soil particles due to the flow of water.
2.1.1.3 Reinforcement
Some geotextiles are used to mechanically stabilize soil by employing the shear
strength developed at the soil-geotextile interface. They can be used to reinforce
embankments, roadways, ponds, and many other geotechnical structures. For example,
Figure 2.1c depicts a geotextile used as a transverse reinforcement layer behind a
retaining wall.

7
(a) Separation Geotextile being rolled out to provide separation
for roadway (Carthage Mills)
(b) Filtration Geotextile used for filtration along waterfront
(Terram)
(c) Reinforcement
Composite reinforcing geotextile installed behind
retaining wall (Obeiliao)
(d) Protection Rolling out the geomembrane liner over the
geotextile base (I.S. Dam Lining)
(e) Drainage
Geotextile for vertical drainage (Tex Delta)
Figure 2.1 Geotextile Functional Groups
8
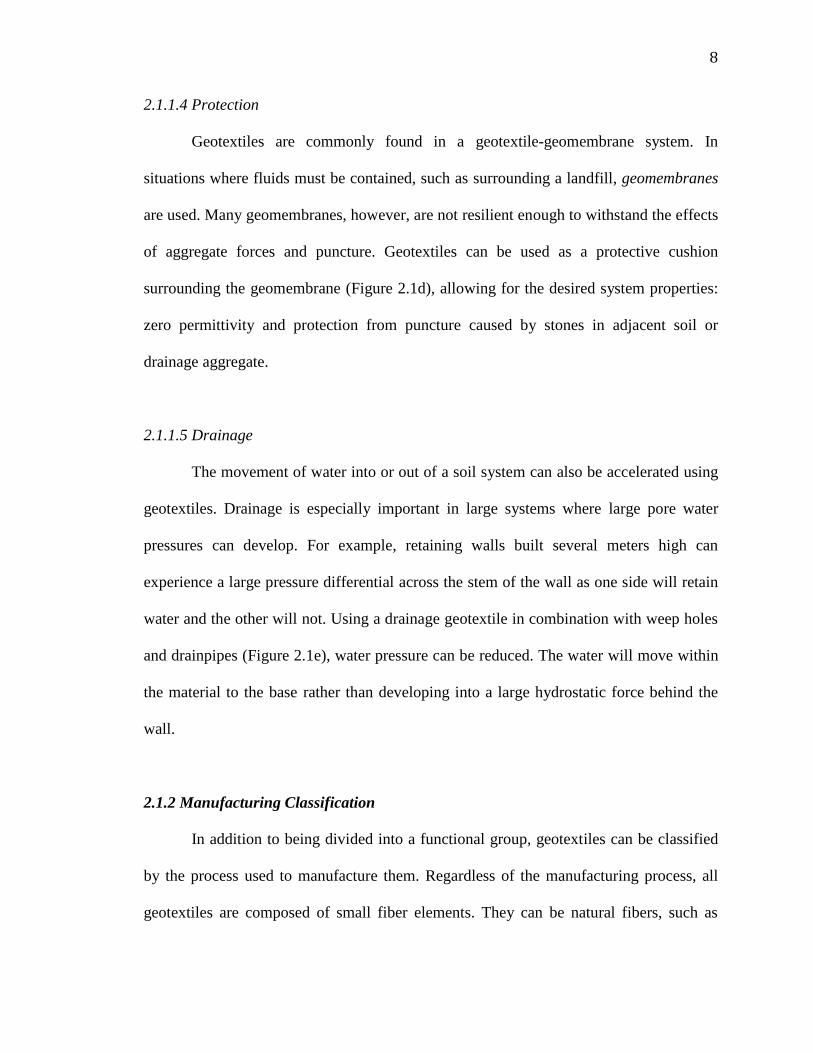
2.1.1.4 Protection
Geotextiles are commonly found in a geotextile-geomembrane system. In
situations where fluids must be contained, such as surrounding a landfill, geomembranes
are used. Many geomembranes, however, are not resilient enough to withstand the effects
of aggregate forces and puncture. Geotextiles can be used as a protective cushion
surrounding the geomembrane (Figure 2.1d), allowing for the desired system properties:
zero permittivity and protection from puncture caused by stones in adjacent soil or
drainage aggregate.
2.1.1.5 Drainage
The movement of water into or out of a soil system can also be accelerated using
geotextiles. Drainage is especially important in large systems where large pore water
pressures can develop. For example, retaining walls built several meters high can
experience a large pressure differential across the stem of the wall as one side will retain
water and the other will not. Using a drainage geotextile in combination with weep holes
and drainpipes (Figure 2.1e), water pressure can be reduced. The water will move within
the material to the base rather than developing into a large hydrostatic force behind the
wall.
2.1.2 Manufacturing Classification
In addition to being divided into a functional group, geotextiles can be classified
by the process used to manufacture them. Regardless of the manufacturing process, all
geotextiles are composed of small fiber elements. They can be natural fibers, such as

9
bamboo and cotton, or synthetic polymers. Because polymer-based fibers are more
resistant to biological and chemical degradation, they are most commonly used for
geotextiles. Only polymer-based geotextiles will be discussed further in this chapter.
Three main groups are used to describe the manufacturing process of a geotextile:
woven, nonwoven, and knitted. Figure 2.2 depicts geotextiles constructed using the
previously mentioned manufacturing processes.
(a) Woven geotextile (b) Nonwoven geotextile
(c) Knitted geotextile (EC21, 2014)
Figure 2.2 Geotextile Manufacturing Groups

10
These groups of geotextiles are further split into subgroups as shown in Figure 2.3.
Bhatia and Smith (1996) summarized the manufacturing processes of geotextiles.
Important aspects from their paper are highlighted in the following sections.
Figure 2.3 Classification of geotextiles based on manufacturing process
2.1.2.1 Woven Geotextiles
Woven geotextiles can be subgrouped based on both the weaving type and yarn
type used. The most common weaves are plain, twill, and leno (Kumar 2008), as
illustrated in Figure 2.4.
(a) Plain weave (b) Twill weave (c) Leno weave
Figure 2.4 Common geotextile weaves

11
Woven geotextiles are composed of monofilament, multifilament, and slit film
fiber yarns as depicted in Figure 2.5. They are classified as follows:
Monofilament Yarn: Individual polymer fibers with an ovular cross section are
extruded from a polymer mass (Figure 2.5a). These fibers, or monofilaments, are
then woven together.
Multifilament Yarn: Groups of polymer monofilaments, or polymer
multifilaments, are woven together (Figure 2.5b). Figure 2.6a shows a woven
multifilament yarn. It should be noted that each woven section is composed of
several monofilaments.
Slit Film Monofilament Yarn: A polymer mass is extruded into a long, smooth
film. Individual flat yarns are then slit from the film (Figure 2.5c) and woven
together as shown in Figure 2.6b.
Slit Film Multifilament Yarn: Slit polymer film monofilaments are grouped
together (Figure 2.5d) and then woven.
Fibrillated Slit Film Yarn: Slit polymer film is scored with small, non-continuous
cuts (Figure 2.5e). This modified slit film is then woven.
(a)
Monofilament
(b)
Multifilament
(c) Slit Film
Monofilament
(d) Slit Film
Multifilament
(e) Fibrillated
Slit Film
Figure 2.5 Common yarns used in woven geotextiles

12
(a) Multifilament (b) Slit Film
Figure 2.6 Common yarn types at 8x magnification (Bhatia et al., 1996)
2.1.2.2 Nonwoven Geotextiles
Nonwoven geotextiles are composed of either continuous filaments or staple
fibers as shown in Figure 2.7. Continuous filaments are made much like the
monofilament yarns used in woven materials: by extruding a polymer through tiny holes
in order to form a long continuous filament. A staple fiber is made by cutting continuous
filament into shorter lengths (<100 mm).
(a) Continuous filament (b) Staple fiber
Figure 2.7 Nonwoven fibers at 80x magnification (Bhatia et al., 1996)
Multifilament
Monofilament

13
The subgroups for nonwoven materials are based on the bonding methods used to
keep these fibers intact. They are classified as follows:
Mechanical Bonding: Polymer filaments or fibers are laid into a web and then
passed through thousands of needles. The needles penetrate the web with
additional outside fibers, interlocking them with one another. The geotextile relies
on fiber-to-fiber interaction to maintain the geotextile properties.
Heat Bonding: Polymer filaments or fibers are laid into a web and then heat-
treated. The heat melts fiber-to-fiber contact points together. A addition of
controlled pressure points is also used to form heat-bonded geotextiles.
Chemical Bonding: Chemical binders, such as acrylic resin or hydrogen chloride
gas, are applied to a fiber web. The binder is cured when the web is passed
through an oven or hot rollers.
2.1.2.3 Knitted Geotextiles
Knitted geotextiles are composed of filaments in a directionally oriented structure
(DOS). Yarns are aligned in four directions: warp, weft, and both diagonals. During the
manufacturing process, a “sheet” of reinforcing yarns is laid out. These reinforcing yarns
are then knitted together at their crossover points using loops of an additional yarn in
order to maintain the DOS. This structure optimizes the multiaxial strength. Regardless,
the use of knitted geotextiles is limited because they expand easily and have relatively
low strength compared to woven geotextiles (Kumar 2008).

14
2.1.3 Polymer Classification
The base material of the fabric determines the last classification of geotextiles.
Geotextiles are made from both naturally occurring and synthetically made polymers. A
polymer’s properties are defined by its monomers and the links bonding the monomers
together. Four polymer groups are commonly used to manufacture geotextiles:
polyamides, polyesters (PET), polyethylenes (PE), and polypropylenes (PP). Basic
chemistry and properties for each are described in Table 2.1.
Table 2.1 Polymers Used in Geotextile Materials
Polymer Chemical Structure Advantages Disadvantages
Polyamide
Contain amide functional
group formed from the
condensation of an amino
group and a carboxylic acid
or acid chloride group
High resistance to
alkalis, high temperature
resistance, good wear
resistance
High moisture
absorption,
require UV
stabilizers
Polyester
Contain the ester functional
group formed from
dicarboxylic acid and two
hydroxl groups
High resistance to UV
light and detergents,
high creep resistance,
wear resistant, low
moisture absorption
Low resistance to
alkalis
Polyethylene Produced from the
polymerization of ethylene
High chemical, abrasion
and puncture resistance,
high creep resistance,
variety of densities
available
Most sensitive to
UV light
Polypropylene Produced from the
polymerization of propene
Very high chemical
resistance, low moisture
absorption, low cost,
high mass per unit
weight
High creep,
requires UV
stabilizers

15
2.1.4 Basic Geotextile Properties
With different base materials, filaments, weaving, thickness, mass and bond type,
geotextiles have a range of characteristics. Because of this, determining physical,
mechanical and hydraulic properties of geotextiles becomes a crucial step in the proper
selection of geotextiles. Basic properties used to describe geotextiles as well as their
ASTM standards and relevant functions are summarized in Table 2.2.
Table 2.2 Basic Properties of Geotextiles
Geotextile
Property Description
ASTM
Standard
Relevant
Functions*
Tensile Strength
(Grab)
Maximum stress a geotextile can
experience while being pulled
before failure
D4632 S, R, F
Tear Strength Ability of a geotextile to withstand
the effects of tearing D4533 S, R, P
Elongation Ratio of the length of a geotextile at
failure relative to its original length D4632 S, F, R
Puncture Strength Maximum force required to rupture
a geotextile D6241 S, F, R, P
Apparent Opening
Size
Approximate largest opening
dimension of a geotextile available
for soil to pass through
D4751 S, D, F, R
Permittivity Quantity of liquid that can pass
through a geotextile D4491 S, D, F, R
UV Resistance
Measure of how a geotextile will
deteriorate due to exposure to
ultraviolet light
D4355 S, P
Chemical
Resistance
Ability of a geotextile to resist
changes in properties due to
exposure to chemicals or liquid
waste
D6389 S, D, F, R, P
Mass/Unit Area Average amount of mass per unit
area of a geotextile D5261 S, R, P
Thickness Average thickness of the geotextile D5199 S, D, F, P
*S=Separation, D=Drainage, F=Filtration, R=Reinforcement, P=Protection
16
2.3 History of Geotextile Testing
The earliest of geotextile testing dates back to the 1970’s with the ASTM
Subcommittee D13.61 of ASTM Committee D13 on textiles. The ASTM subcommittee
D13.61 provided standards for textiles used in civil engineering applications with
additional testing involving soil-fabric interactions. In an effort to accelerate the
development of this specific group of textiles, geotextiles, ASTM Committee D35 was
developed in 1984 when subcommittee D13.61 elected to become a joint committee
under D18 on Soil and Rock. The committee currently has over 155 approved standards
(Committee D35 on Geosynthetics).
2.3.1 Evolution of Puncture Strength Testing
Puncture strength testing of geotextiles dates to the 1970s with ASTM D751-79
Method of Testing Coated Fabrics. The US Army Corps of Engineers proposed using the
tension testing machine with ring clamp of ASTM D751, but replacing the steel ball with
an 8 mm-diameter solid steel, flat-tip probe. The flat-tip probe was temporarily replaced
with a hemispherical probe, but inaccurate data resulted because the tip slipped through
textiles rather than rupturing them. By the 1980s the D35 committee recommended the
puncture test be run using ASTM D3787-80 Test Method for Bursting Strength of
Knitted Goods: Constant-Rate-of-Traverse (CRT) Ball Burst Test, but with a constant
rate of extension, 8 mm-diameter, flat-tip probe, a strain rate of 300 mm/min, and
compression ring clamps (Suits et al., 1987).
By the turn of the century, four key standards were available for geotextile
puncture strength testing. The first, ASTM D3786: Standard Test Method for Hydraulic

17
Bursting Strength of Textile Fabrics-Diaphragm Bursting Strength Tester Method, used
an inflatable rubber membrane to deform the geotextile into the shape of a hemisphere
through a 30 mm-diameter ring until it burst. The second, ASTM D4833: Standard Test
Method for Index Puncture Resistance of Geomembranes and Related Products, is a
variation of ASTM D3787, which utilizes a slip-free ring clamp and 8 mm-diameter, 45
degree beveled edge probe. The samples are subjected to either tension or compression
until rupture occurs. Neither ASTM D3786 (Mullen Burst) nor ASTM D4833 (Pin) are
currently recognized by the ASTM as acceptable geotextile test methods. These tests
were no longer accepted because, as described by Koerner (2013), “lightweight
nonwoven fabrics had a rather large statistical variation” in puncture strength “between
small areas of somewhat dense fibers and other small areas with sparse fabrics.” The
larger probe used in the D6241 standard reduces this statistical impact. The final method,
D5494: Standard Test Method for Determination of Pyramid Puncture Resistance of
Unprotected and Protected Geomembranes, is also relevant but should only be used on a
geotextile when a geotextile-geomembrane system is being tested.
Currently, the American Association of State Highway and Transportation
Officials (AASHTO) M288 has replaced ASTM D4833 with ASTM D6241 Standard
Test Method for the Static Puncture Strength of Geotextiles and Geotextile-Related
Products Using a 50 mm Probe. In 2010, ASTM D3786 and ASTM D4833 information
was no longer reported by Geosynthetic Materials Association members (Bygness 2010).

18
2.3.2 Current Significance and Use of ASTMs
The significance and use for the most relevant ASTMs are described in the active
standards as follows (ASTM Volume 04.13). Their common names are listed in
parenthesis.
D3786 (Mullen Burst): “This method for the determination of diaphragm bursting
strength of knitted, nonwoven and woven fabrics is being used by the textile
industry for the evaluation of a wide variety of end uses.” (ASTM Standard
D3786/D3786M, 2013)
D4833 (Pin or Index): “This test method is an index test for determining the
puncture resistance of geomembranes and related products. The use of this test
method is to establish an index value by providing standard criteria and a basis for
uniform reporting.” (ASTM Standard D4833/D4833M, 2013)
D5494 (Pyramid): “The test method is to be used as an index test to determine the
pyramid puncture resistance of geomembranes and, or both, geomembranes
protected by non-woven geotextiles and other puncture protective geosynthetics.”
(ASTM Standard D5494, 2011)
D6241 (CBR): “This test method for determining the puncture strength of
geotextiles is to be used by the industry as an index of puncture strength. The use
of this test method is to establish an index value by providing standard criteria and
a basis for uniform reporting.” (ASTM Standard D6241, 2009)
According to the standards, the puncture strength resistance of a geotextile should,
therefore, be tested using only ASTM D6241.

19
2.3.3 Comparison of ASTM D4833 and ASTM D6241
The ASTM D4833 and D6241 standards are similar with the exception of a few
key alterations of the clamp and probe system. A summary of the standards is shown in
Table 2.3. Figures 2.8 and 2.9 show the testing fixtures and plungers used in testing.
Table 2.3 Comparison of pin and CBR testing standards
Measure D4833 (Pin) D6241 (CBR)
Probe Diameter 8 mm ± 0.1mm 50 mm ± 1mm
Probe Chamfer/Edge 45°, 0.8 mm 2.5 mm ± 0.5 mm
Specimen Minimum Outer
Diameter 100 mm Clamp outer dia. + 10 mm
Specimen Unsupported Diameter
(Clamp Inner Diameter) 45 mm ± 0.025 mm 150 mm
Compression Speed 300 mm ± 10 mm/min 50 mm/min
Maximum Allowable Slippage None allowed 5 mm
Number of Tests 15 10
Lab Temperature 21 ± 2°C 21 ± 2°C
Lab Relative Humidity 65 ± 5% 50-70%
Test Conclusion Break Break
Resistance Reported Maximum Maximum

20
Figure 2.8 Plungers used for CBR and pin puncture strength testing of geotextiles
in the UW-Milwaukee Engineering Mechanics and Composites Lab
(a) Pin puncture fixture (b) CBR fixture
Figure 2.9 Clamping fixtures used for puncture strengh testing of geotextiles in the
UW-Milwaukee Engineering Mechanics and Composites Lab
CBR Pin
CBR Pin
Probe
Clamp
Base
Probe
Base
Clamp

21
2.4 State of the Art Research on Puncture Strength Testing of Geotextiles
A select few research projects (Narejo et al. (1996), Jones et al. (2000), Hsieh and
Wang (2008), Koerner and Koerner (2010), Rawal and Saraswat (2011) and Askari et al.
(2012)) have been completed in relation to this thesis. Of those, they consist of two
groups: studies to address variations in puncture strength testing methods (Hsieh and
Wang (2008), Askari et al. (2012)) and studies to address variations in the materials
tested (Jones et al. (2000), Koerner and Koerner (2010), and Rawal and Saraswat (2011)).
Also note that although geotextiles can be found in geomembrane/geotextile systems,
discussion of geomembranes is beyond the scope of this literature review. Research
studies involving puncture strength testing of geomembrane/geotextile systems (Narejo et
al. (1996)), however, will be considered when relevant.
2.4.1 Testing Method Variations
2.4.1.1 Clamping Mechanism
Because both ASTM D4833 and ASTM D6241 have a dual plate-screw clamping
mechanism, clamping slippage and technician variations inherently result. Hsieh and
Wang (2008) suggested hydraulic clamping mechanisms for pin (Figure 2.10a) and CBR
(Figure 2.10b) puncture strength testing in addition to studying the time savings and
puncture strength resistance variation related to the proposed mechanism.
22
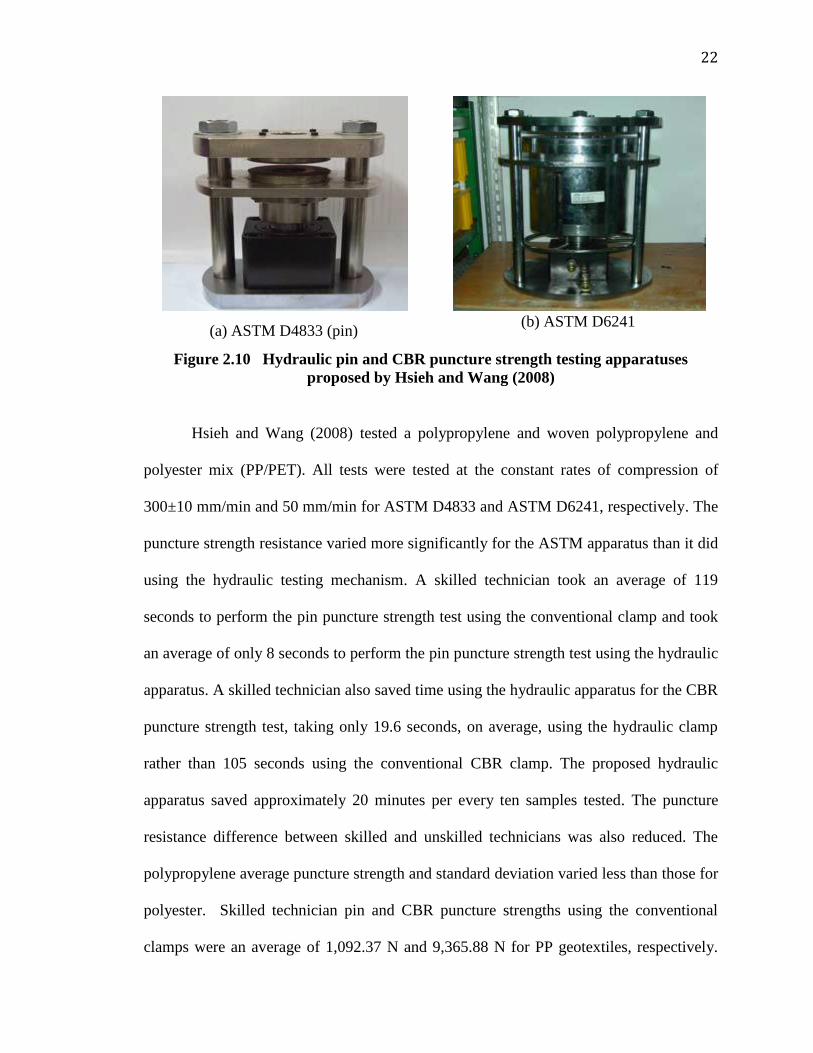
(a) ASTM D4833 (pin) (b) ASTM D6241
Figure 2.10 Hydraulic pin and CBR puncture strength testing apparatuses
proposed by Hsieh and Wang (2008)
Hsieh and Wang (2008) tested a polypropylene and woven polypropylene and
polyester mix (PP/PET). All tests were tested at the constant rates of compression of
300±10 mm/min and 50 mm/min for ASTM D4833 and ASTM D6241, respectively. The
puncture strength resistance varied more significantly for the ASTM apparatus than it did
using the hydraulic testing mechanism. A skilled technician took an average of 119
seconds to perform the pin puncture strength test using the conventional clamp and took
an average of only 8 seconds to perform the pin puncture strength test using the hydraulic
apparatus. A skilled technician also saved time using the hydraulic apparatus for the CBR
puncture strength test, taking only 19.6 seconds, on average, using the hydraulic clamp
rather than 105 seconds using the conventional CBR clamp. The proposed hydraulic
apparatus saved approximately 20 minutes per every ten samples tested. The puncture
resistance difference between skilled and unskilled technicians was also reduced. The
polypropylene average puncture strength and standard deviation varied less than those for
polyester. Skilled technician pin and CBR puncture strengths using the conventional
clamps were an average of 1,092.37 N and 9,365.88 N for PP geotextiles, respectively.

23
Using the hydraulic clamps, skilled technician pin and CBR puncture strengths of PP
geotextiles were an average of 1,082.65 N and 8,669.09 N, respectively. The CBR
puncture strength (ASTM D6241) for both the PP and PP/PET geotextiles, both woven
materials, were eight times the pin puncture strengths (ASTM D4833). Hsieh and Wang
(2008) also indicated that ASTM D4833 results varied less than ASTM D6241.
2.4.1.2 Rate of Compression
The rate of compression used for puncture resistance testing is inherently
expected to affect the maximum value of puncture strength. Askari et al. (2012) studied
the effects of both test speed and fabric weight on the puncture resistance of polyester
needle punched nonwoven geotextiles using ASTM D6241 and D4833. The materials
weights were 460, 715, 970, and 1070 g/m2
and the tests were conducted at 5 speeds: 25,
50, 75, 100, and 125 mm/min. The CBR puncture strength testing results are shown in
Table 2.4.
Askari et al. (2012) determined that the weight and speed both impacted the
maximum puncture strength resistance for both tests. They also used an “R-value”
concept or weight/thickness ratio, measured in g/m2×mm, to indicate the number of fibers
in the layer’s cross-section. The 50 mm plunger size used in D6241 is preferred because
it is less influenced by the irregularities in the fiber densities (Koerner, 2013).

24
Table 2.4 CBR puncture strength test results at five (5) different test speeds for
polyester geotextiles with different mass per unit areas
(Adapted from Askari et al. 2012)
Sample Test Speed (mm/min) Force (kN) Standard Deviation (kN)
A
25 1.73 0.37
50 2.08 0.21
75 1.64 0.15
100 1.77 0.18
125 1.80 0.29
B
25 3.87 0.16
50 3.94 0.31
75 3.72 0.23
100 3.80 0.57
125 3.98 0.24
C
25 5.34 0.33
50 5.26 0.51
75 5.41 0.20
100 5.46 0.20
125 5.24 0.43
D
25 5.27 0.18
50 4.95 0.58
75 5.03 0.50
100 6.25 0.24
125 6.16 0.26
Askari et al. (2012) also described the failure of a geotextile using three distinct
stages of the material failure. During the first stage, the compression forces resuledt in a
rearrangement or movement of fibers. During the second stage, the fibers have become
more tightly packed and will have an added frictional interaction among them, which
increases their ability to resist higher loads. The third stage included the puncture failure
as a result of a sudden separation of fibers. The three stages are shown in Figure 2.11.

25
(a) Fibers are rearranging (b) Fibers experience added frictional
forces in their new arrangement
(c) Fibers separate just before failure
Figure 2.11 Failure stages of polyester needlepunched nonwoven geotextile
(After Askari et al. (2012))
2.4.2 Geotextiles Tested
2.4.2.1 In a System
Narejo et al. (1996) measured the puncture strength resistance of polyethylene
geomembranes with and without nonwoven needle-punched geotextiles used as
protection. The combination of geomembranes and nonwoven geotextiles is common in

26
the landfill applications where the geomembrane acts as a nonporous liquid barrier, and
the geotextile acts as a cushion of protection to the geomembrane, which has a lower
puncture resistance. Narejo et al. (1996) developed empirical design equations based on
truncated cone and stone puncture test results to be used for the design of high density
polyethylene (HDPE) geomembranes using failure pressures, rather than yield pressures,
as the measure of comparison. The equations involve factors for chemical and biological
degradation, creep, soil arching, packing, density, and stone shapes. They found that the
puncture resistance of geomembranes increased as the mass per unit area of protection
geotextile increased.
2.4.2.2 Mass per Unit Area
Jones et al. (2000) later found the relationship between mass per unit area and
puncture strength resistance to be non-linear for needle punched geotextiles. It was
proposed that the performance was derived from the frictional interaction between fibers.
During the study high, medium, and low performance needle punched, non-woven
geotextiles with matching mass per unit areas of 1,000 g/m2
were tested. The base
material used for testing was not indicated. Their CBR puncture strength resistances were
determined using BS EN ISO 12236 (Geosynthetics – Static puncture test (CBR test)) to
be 11,443, 7,974, and 7,353 N, respectively. Although the study described using mass per
unit area to specify geotextile layers as “inappropriate,” Jones et al. (2000) stated that
CBR puncture resistance gives “a better indication of protection performance” than mass
per unit.

27
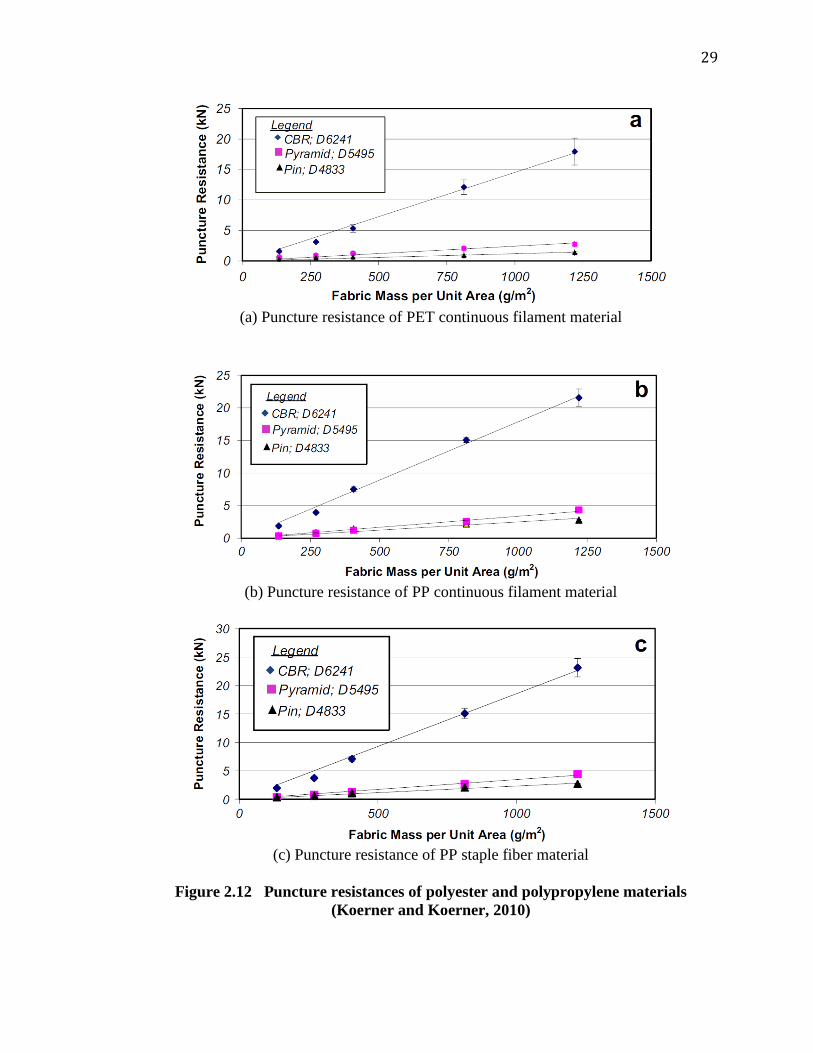
Koerner and Koerner (2010) directly compared nonwoven PP and PET samples
with similar mass per unit area. All PP samples were continuous filament, but two types
of PP materials were used: continuous filaments and staple fibers. They were all tested
without a geomembrane system and on three puncture resistance tests, ASTMs D4833,
D5495, and D6241, two of which are being explored in this thesis. Five different mass
per unit areas of three classifications of material were used. Unlike Jones et al. (2000), all
of the materials tested by Koerner and Koerner (2010) showed an essentially linear
connection between increased mass per unit area and puncture resistance. Because the
material used by Jones et al. (2000) was not indicated, it is difficult to say why the linear
relationship was not found. Koerner and Koerner (2010) also found relationships between
the three puncture mechanisms used. Note that the test relationships were developed
among nonwoven materials exclusively. The continuous filament PET resulted in
pyramid and CBR puncture resistances two and nine times the index pin resistance as
shown in Figure 2.12a. The PP continuous filament resulted in comparable pyramid and
pin resistances and CBR about seven times the pin resistance (Figure 2.12b). The
puncture resistance curves of PP staple fiber had comparable pyramid and pin puncture
strengths and CBR about seven times the pin resistance (Figure 2.12c). For ASTM
D4833 results, the PP continuous filament and staple fiber give similar results and are
two times larger than PET values. The PP results were, again, about the same, and 35%
higher than PET puncture strengths for ASTM D5494 testing. D6241 PP puncture
strengths were comparable and 25% higher than PET values. Koerner and Koerner
(2010) also determined that the material structure, i.e. continuous filaments vs. staple
fibers, has little to no effect on the puncture strength for nonwoven geotextiles. Figures
28
2.12b and 2.12c show two PP materials with different nonwoven fiber structures
(continuous vs. staple). It is apparent the values in these two charts are nearly the same
for all test and all unit weights, supporting the assumption that the materials filament type
does not impact puncture resistance results for nonwoven geotextiles.
2.4.2.3 Base Material
Rawal and Saraswat (2011) studied puncture resistance of hybrid PP/viscose and
PET/viscose geotextiles using ASTM D4833 for use in the stabilization of soil. Viscose is
manufactured from naturally occurring cellulose found in wood pulp. The materials were
adjusted to weight proportions of 0, 20, 40, 60, 80, and 100. The mass per unit area was
held at either 200 g/m2 and 400 g/m
2. The thickness of the materials was also measured at
varying pressures to determine changes in porosity. They found that adding up to 40%
weight of viscose in PP materials with a mass per unit area of 400 g/m2 did not affect the
puncture resistance. Adding up to 20% weight of viscose in PET materials with a mass
per unit area of 200 g/m2 had the same puncture resistance as 100% PET materials.
2.4.2.4 Weave
Of the studies found involving both pin and CBR puncture tests, none used a
combination of woven and nonwoven materials. Studies either examined exclusively
nonwoven or exclusively woven materials. It is in the author’s interest to discover if
geotextiles made of like materials and with the same mass per unit area, yet with different
manufacturing processes perform similarly in puncture resistance tests.
29
(a) Puncture resistance of PET continuous filament material
(b) Puncture resistance of PP continuous filament material
(c) Puncture resistance of PP staple fiber material
Figure 2.12 Puncture resistances of polyester and polypropylene materials
(Koerner and Koerner, 2010)

30
CHAPTER 3
METHODOLOGY
The research methodology followed to accomplish the research objectives is
presented in this chapter. The experiment design, developed to include a sufficient
number of test specimens, as well as the types of investigated geotextiles are highlighted.
Details of obtaining geotextile samples, preparing test specimens, and performing pin and
CBR puncture strength tests are provided. In addition, a description of test equipment and
procedures is presented.
3.1 Materials Selected for Research
The author examined literature of geotextile suppliers used in the Midwestern
United States. Of the most common materials used within those states, nearly all of them
were composed of 100% polypropylene. This is likely due to the fact that polypropylene
costs less than polyester and has a lower specific gravity, resulting in about 25% more
fibers per unit weight (Koerner 2012). The high fiber count increases the mass per unit
area and, therefore, the puncture strength of the material as well. The average puncture
strength and standard deviation of polypropylene materials also vary less than those of
polyester (Hsieh and Wang 2008). For these reasons, polypropylene materials were tested
as they are more commonly used and statistically vary less, allowing for a better
comparison of the tests rather than the material.
Major geotextile manufacturers in the US were contacted to obtain materials for
testing to accomplish the objectives of this research. Samples supplied were
approximately 12 ft by 12 ft.
31
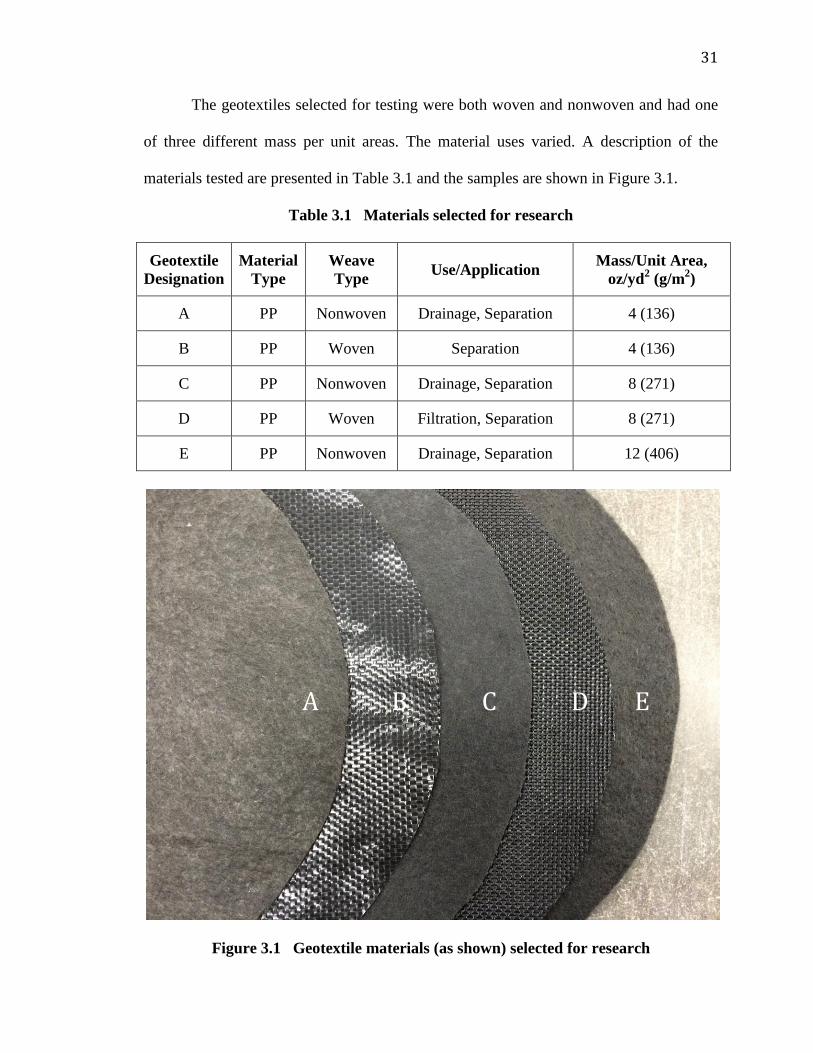
The geotextiles selected for testing were both woven and nonwoven and had one
of three different mass per unit areas. The material uses varied. A description of the
materials tested are presented in Table 3.1 and the samples are shown in Figure 3.1.
Table 3.1 Materials selected for research
Geotextile
Designation
Material
Type
Weave
Type Use/Application
Mass/Unit Area,
oz/yd2 (g/m
2)
A PP Nonwoven Drainage, Separation 4 (136)
B PP Woven Separation 4 (136)
C PP Nonwoven Drainage, Separation 8 (271)
D PP Woven Filtration, Separation 8 (271)
E PP Nonwoven Drainage, Separation 12 (406)
Figure 3.1 Geotextile materials (as shown) selected for research
A B C D E

32
3.2 Methods
ASTM D4833 (pin) and D6241 (CBR) standards were followed to evaluate the
various geotextile samples based on puncture strength tests. Further discussion of testing
follows.
3.2.1 Sample Preparation
All geotextile materials were supplied in approximately 12 ft by 12 ft sections. Ten 120
mm-diameter samples were cut along the material diagonal for testing using the D4833
standard. Fifteen 240 mm-diameter samples were prepared for testing using the D6241
standard and were taken along a parallel diagonal over approximately the same width of
material. The sample selection layout is illustrated in Figure 3.2.
The diagonal sampling captures maximum material variability in both
manufacturing directions. The samples were taken parallel to one another and over the
same material width to reduce the impact of variability in material location on the results
of the two test methods. High quality sewing shears were used to cut all samples.
Samples were neither taken closer than 6 in to the edge for ASTM D6241 testing nor
closer than 16 in to the edge for ASTM D4833 to meet all requirements. Additionally,
any crushed or deformed areas were excluded. In the event of a deformed area, best
efforts were made to select samples from nearby areas as shown in Figure 3.3. Notice that
the samples follow the general diagonal, but do not include the folded material.

33
Figure 3.2 Layout of samples used for testing
Half of geotextile roll not used in testing
Specimens for ASTM D6241 (CBR)
Specimens for ASTM D4833 (pin)

34
Figure 3.3 Sample selections near a deformed area
The samples were labeled for later identification, as needed. Bolt holes were cut
in each specimen using a small “cross” cut of a scissors. Figure 3.4 shows the samples
prepared to be tested. Note that material B easily lost fibers during handling because it
was a woven material with limited fiber-fiber frictional interaction. To prevent changes in
mass and loss of material, all woven geotextile material B samples were outlined with a
thin glue layer. This glue layer was close enough to the perimeter of the sample to never
make contact with the clamping fixture.
Specimens selected for testing
Crushed/deformed areas are excluded

35
Figure 3.4 Woven and nonwoven geotextile specimens prepared for pin and CBR
puncture strength tests
3.4.1.1 Freeze-Thaw Conditioning
In order to investigate the effect of climate conditions on puncture strength of
geotextiles, specimens were subjected to various cycles of freeze-thaw conditioning.
Nine samples of material E were cut at the larger diameter (for testing using
ASTM D6241). Three samples each were subjected to 15, 30, and 45 freeze-thaw
conditioning cycles at the UW-Milwaukee Structural Lab. The freeze-thaw conditioning
was accomplished by fully submerging the samples in water within an insulated drawer
(Figure 3.5) and running them through the designated number of cycles. A cycle is
considered cooling the samples from room temperature to 15°F (-9.4°C) and up to 45°F
(7.2°C). The cycles continue between 15°F (-9.4°C) and 45°F (7.2°C) until completed.
CBR Specimens
Pin Specimens

36
Figure 3.5 Freeze-Thaw Conditioning Machine at the UW-Milwaukee Structural
Lab
ASTM specified that all samples must be brought to “moisture equilibrium in the
atmosphere for testing” using mass determination as a measure. Because all samples,
excluding those subjected to freeze-thaw cycles, were subjected to the same conditions
and stored in the same room for several days, weights were not taken. Samples subjected
to freezing, however, were weighed until successive weights, made at 2-hour increments,
Temperature monitor/regulator
Drawers where geotextiles were fully submerged and
conditioned
Insulated covering

37
differed by less than 0.1%, per ASTM requirements. The weight values for all
conditioned samples were made at least 24 hours after conditioning had completed. The
results are summarized in Table 3.2. Approximately three hours had passed between their
final two weight measurements.
Table 3.2 Final Conditioned Sample Weights
Freeze-Thaw
Conditioned
Sample
Number
Initial Weight
(g)
Final Weight
(g) Change (g)
ASTM D6241
Allowable
Change (g)
1 20.95 20.95 0.00 ±0.02
2 18.40 18.40 0.00 ±0.01
3 20.33 20.34 0.01 ±0.02
4 21.54 21.54 0.00 ±0.02
5 21.59 21.59 0.00 ±0.02
6 21.65 21.65 0.00 ±0.02
7 22.61 22.62 0.01 ±0.02
8 21.13 21.13 0.00 ±0.02
9 21.23 21.24 0.01 ±0.02
3.2.2 Clamping Fixture
As stated above, the testing fixtures met all ASTM requirements. The fixtures are
shown in Figure 3.6 and dimensions were given previously in Table 2.3. Both ASTM
D4833 and ASTM D6241 standards suggested either grooves with O-rings or coarse
sandpaper bonded to opposing sides as a means to prevent slippage. For this study,

38
sandpaper was selected and adhered to the inside surfaces of the clamps as shown in
Figure 3.7.
Figure 3.6 Clamping fixtures used for puncture testing at the UW-Milwaukee
Mechanics and Composites Lab
PIN
CBR Bolt holes to restrain base
Bolt holes to tighten
clamp
Clamp

39
Figure 3.7 Sandpaper used to prevent geotextile slippage (shown on ASTM D4833
(pin) clamp)
3.2.3 Testing Procedure
Each geotextile sample was affixed to the corresponding ASTM test fixture. The
sample was then marked along the inside circumference of the clamp. This marking was
used to determine if slippage had exceeded the maximum allowed per ASTM
requirements. Using the universal testing machine located in the UW-Milwaukee
Engineering Mechanics and Composites Research Lab as shown in Figure 3.8, the
puncture rod was lowered at a constant rate of extension (CRE) until it completely
ruptured the test sample. The time, load, and displacement were recorded for all samples
using R-Controller Version 2.00.09. Screen shots of the R-Controller program settings
are shown in Appendix B. Geotextile materials sometimes display a double peak in the
load-displacement graph. Per ASTM standards, the initial puncture strength value was
reported even if the second peak was higher. All data recorded, including loading curves
Sandpaper

40
after the maximum puncture resistance value had been reached, are presented, analyzed,
and discussed in Chapter 4.
Figure 3.8 Testing Machine at the UW-Milwaukee Engineering Mechanics and
Composites Research Lab
Clamp
Load cell
Plunger
Geotextile sample
Base of test fixture
41
CHAPTER 4
RESULTS AND ANALYSES
This chapter presents geotextile test results and accompanying detailed analyses
conducted. In addition, quantification and evaluation of the various investigated
geotextiles are presented based on their puncture resistance. Moreover, statistical analysis
was conducted to correlate investigated geotextile CBR and pin puncture strengths.
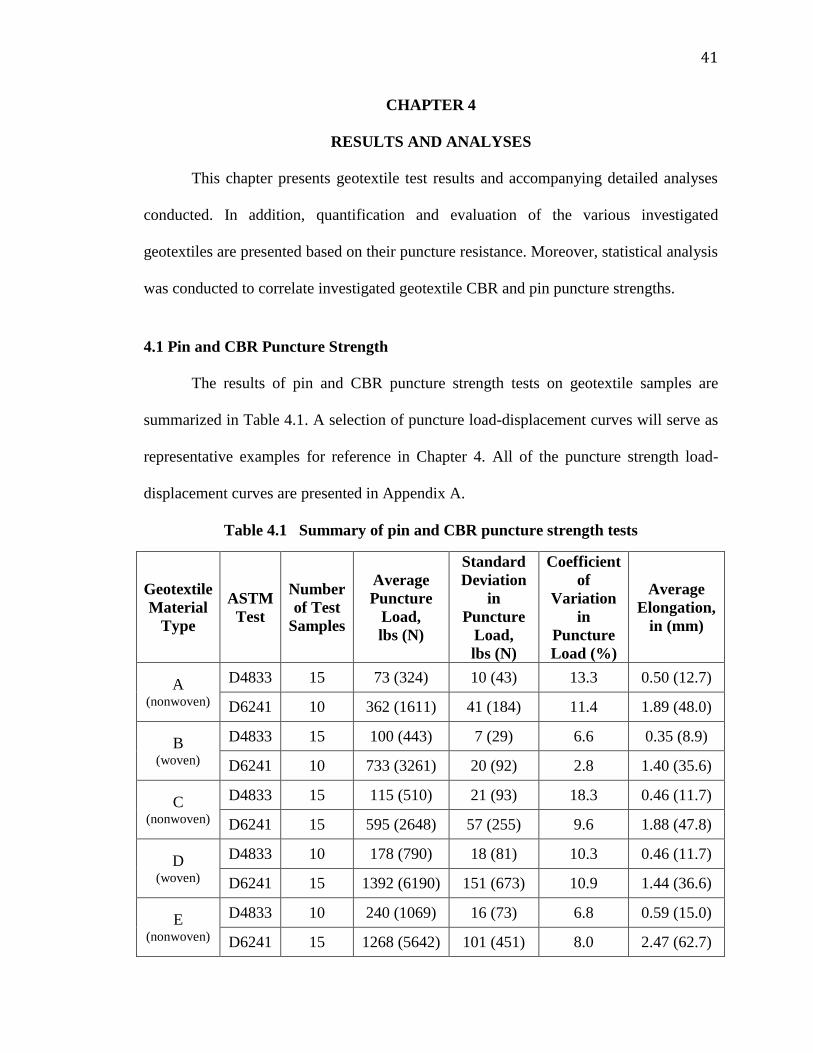
4.1 Pin and CBR Puncture Strength
The results of pin and CBR puncture strength tests on geotextile samples are
summarized in Table 4.1. A selection of puncture load-displacement curves will serve as
representative examples for reference in Chapter 4. All of the puncture strength load-
displacement curves are presented in Appendix A.
Table 4.1 Summary of pin and CBR puncture strength tests
Geotextile
Material
Type
ASTM
Test
Number
of Test
Samples
Average
Puncture
Load,
lbs (N)
Standard
Deviation
in
Puncture
Load,
lbs (N)
Coefficient
of
Variation
in
Puncture
Load (%)
Average
Elongation,
in (mm)
A (nonwoven)
D4833 15 73 (324) 10 (43) 13.3 0.50 (12.7)
D6241 10 362 (1611) 41 (184) 11.4 1.89 (48.0)
B (woven)
D4833 15 100 (443) 7 (29) 6.6 0.35 (8.9)
D6241 10 733 (3261) 20 (92) 2.8 1.40 (35.6)
C (nonwoven)
D4833 15 115 (510) 21 (93) 18.3 0.46 (11.7)
D6241 15 595 (2648) 57 (255) 9.6 1.88 (47.8)
D (woven)
D4833 10 178 (790) 18 (81) 10.3 0.46 (11.7)
D6241 15 1392 (6190) 151 (673) 10.9 1.44 (36.6)
E (nonwoven)
D4833 10 240 (1069) 16 (73) 6.8 0.59 (15.0)
D6241 15 1268 (5642) 101 (451) 8.0 2.47 (62.7)

42
4.1.1 Behavior of Nonwoven Geotextiles under CBR Puncture Failure Load
Figure 4.1 depicts the puncture strength of 15 individual material A geotextile
samples tested using the pin puncture test. The puncture load versus displacement is
shown in Figure 4.1a. Inspection of Figure 4.1a demonstrates that all geotextile samples
tested exhibited consistent behavior. Figure 4.1b depicts the bar chart of pin puncture
strengths for all geotextile material A samples. The pin puncture load at failure varied
from 56 lbs (250 N) to 94 lbs (418 N) with an average of 73 lbs (324 N) and coefficient
of variation of 13.3%.
Figure 4.2a depicts the puncture load versus displacement for material A samples
using the CBR puncture test. Figure 4.2b shows the bar chart of CBR puncture strengths
for all geotextile material A samples. The CBR puncture load at failure varied from 324
lbs (1,441 N) to 457 lbs (2,033 N) with an average of 362 lbs (1,611) and coefficient of
variation of 11.4%.

43
(a) Load-displacement curve
(b) Bar chart (error bars indicate standard deviations)
Figure 4.1 Pin puncture strengths for geotextile material A samples
0
10
20
30
40
50
60
70
80
90
100
0 0.2 0.4 0.6 0.8 1
Lo
ad
(lb
s)
Displacement (in)
0
500
1000
1500
2000
0
50
100
150
200
250
300
350
400
450
500
1 2 3 4 5 6 7 8 9 10 11 12 13 14 15
Pu
nct
ure
Str
en
gth
(N
)
Pu
nct
ure
Str
en
gth
(lb
s)
Test Sample Number
Average

44
(a) Load-displacement curve
(b) Bar chart (error bars indicate standard deviations)
Figure 4.2 CBR puncture strengths for geotextile material A samples
0
50
100
150
200
250
300
350
400
450
500
0 0.5 1 1.5 2 2.5
Lo
ad
(lb
s)
Displacement (in)
0
500
1000
1500
2000
0
50
100
150
200
250
300
350
400
450
500
1 2 3 4 5 6 7 8 9 10
Pu
nct
ure
Str
en
gth
(N
)
Pu
nct
ure
Str
en
gth
(lb
s)
Test Sample Number
Average

45
A representative CBR puncture strength failure curve of material A, one of the
nonwoven materials tested, is shown in Figure 4.3. The curve consists of four phases:
fiber rearrangement, load resistance, maximum resistance, and puncture failure. The
curve begins with a slight slope as the plunger makes contact with the sample. Because
the fibers still contain voids, they are free to rearrange without resisting the probe motion.
As the fibers lose their ability to move relative to one another, they begin to develop
internal material stresses as the fiber to fiber interaction increases. The load resistance
increases due to the fiber-fiber interaction resulting in the region of increased slope.
Eventually the material develops new voids as the fiber-fiber interaction fails. When the
pressure on the material extends beyond the load that the fiber-fiber interaction can
withstand, the material punctures.
Figure 4.3 Nonwoven geotextile puncture strength failure curve demonstrated
using a representative material A load vs. displacement curve
Images of the CBR puncture failure of a material A specimen is shown in Figure
4.4. Initially, the fibers rearrange while only developing a minimal load resistance (4.4a).
The fibers then begin to resist the load (4.4b) using the fiber-fiber surface interaction. The
0
10
20
30
40
50
60
70
80
0 0.1 0.2 0.3 0.4 0.5 0.6
Lo
ad
(lb
s)
Displacement (in)
Material A
Fiber Rearrangement
Load Resistance
Maximum Resistance
Material Failure

46
fiber-fiber connection remains intact, but the relative distance between contact points
increases as the probe is displaced. The fibers have not failed, but they are lengthened,
resulting in large voids within the material as shown in the transition from (4.4c) to (4.4d).
Eventually the fiber-fiber connections fail at puncture loading when they can no longer
resist the probe (4.4e) and recoil along the length of the probe (4.4f) due to the sudden
reduction in material internal stresses and release of potential energy. A load aural
indication of rupture was observed as material failure was of several fibers at the same
moment.
Koerner and Koerner (2010) demonstrated that geotextiles made from staple
fibers or continuous filaments (with the same base material and mass per unit area) will
have similar puncture resistances. This is likely true because the increase in load
resistance is due to the fiber-fiber interaction in nonwoven materials. If two geotextiles
have the same material content per unit area, the fibers contained within each will have a
similar number of contact points regardless of fiber length. Elongation of the material
may, however, be increased for an increased fiber length even if the puncture strength is
not.

47
(a) Fiber rearrangement (b) Load resistance begins
(c) Fiber extension (d) Material voids become apparent
(e) Puncture (f) Recoil
Figure 4.4 Failure stages of nonwoven geotextile (material A is pictured subjected
to the CBR puncture strength test)

48
4.1.2 Behavior of Woven Geotextiles under CBR Puncture Failure Load
Figure 4.5 depicts the puncture strength of 15 individual material B geotextile
samples tested using the pin puncture test. The puncture load versus displacement is
shown in Figure 4.5a. Inspection of Figure 4.5a demonstrates that all geotextile samples
tested exhibited consistent behavior. Figure 4.5b depicts the bar chart of pin puncture
strengths for all geotextile material B samples. The pin puncture load at failure varied
from 88 lbs (391 N) to 110 lbs (489 N) with an average of 99 lbs (440 N) and coefficient
of variation equal to 6.6%.
Figure 4.6a depicts the puncture load versus displacement for material B samples
using the CBR puncture test. Figure 4.6b shows the bar chart of CBR puncture strengths
for all geotextile material B samples. The CBR puncture load at failure varied from 693
lbs (3,083 N) to 762 lbs (3,390 N) with an average of 733 lbs (3,261) and coefficient of
variation equal to 2.8%.

49
(a) Load-displacement curve
(b) Bar chart (error bars indicate standard deviations)
Figure 4.5 Pin puncture strengths for geotextile material B samples
0
20
40
60
80
100
120
0 0.05 0.1 0.15 0.2 0.25 0.3 0.35 0.4
Lo
ad
(lb
s)
Displacement (in)
0
500
1000
1500
2000
2500
3000
3500
0
100
200
300
400
500
600
700
800
1 2 3 4 5 6 7 8 9 10 11 12 13 14 15
Pu
nct
ure
Str
en
gth
(N
)
Pu
nct
ure
Str
en
gth
(lb
s)
Test Sample Number
Average

50
(a) Load-displacement curve
(b) Bar chart
Figure 4.6 CBR puncture strengths for geotextile material B samples
A representative puncture strength failure curve of material B, one of the woven
materials tested, is shown in Figure 4.7. The curve consists of six phases: fiber
0
100
200
300
400
500
600
700
800
0 0.5 1 1.5 2
Lo
ad
(lb
s)
Displacement (in)
0
500
1000
1500
2000
2500
3000
3500
0
100
200
300
400
500
600
700
800
1 2 3 4 5 6 7 8 9 10
Pu
nct
ure
Str
en
gth
(N
)
Pu
nct
ure
Str
en
gth
(lb
s)
Test Sample Number
Average

51
rearrangement, load resistance, monofilament failure (puncture resistance), secondary
fiber rearrangement, and multifilament failure. Like nonwoven materials, the curve
begins with a slight slope as the plunger makes contact with the sample. Because the
geotextile weave still contains voids, the fibers are free to rearrange without resisting the
probe motion. As the fibers lose their ability to move relative to one another, they begin
to develop internal material stresses as the fiber-fiber interaction increases and respective
filaments also develop tensile strains. Eventually the tensile strain increases until the
displacement where monofilaments begin to rupture. Unlike nonwoven geotextiles,
woven geotextiles may reach a secondary peak resistance greater than the puncture
strength when the multifilaments fail. The dip between successive peak resistances occurs
because the material fibers are again able to rearrange and fill newly formed voids within
the geotextile weave. Additional peaks may be observed if extension of the probe is
allowed to continue.
Figure 4.7 Woven geotextile puncture strength failure curve demonstrated using a
representative material B load vs. displacement curve
0
20
40
60
80
100
120
0 0.1 0.2 0.3 0.4 0.5
Lo
ad
(lb
s)
Displacement (in)
Material B
Fiber Rearrangement
Load Resistance
Maximum Resistance
(Multifilament Failure)
Material Failure
Puncture Resistance (Monofilament Failure)

52
The failure of a woven geotextile, material D, is shown in Figure 4.8. Initially, the
fibers rearrange while only developing a minimal load resistance (4.8a). The fibers then
begin to resist the load (4.8b) using the fiber-fiber interaction and tension within fibers
develops. The fibers elongate (4.8c) until tension in the shorter monofilaments causes
them to rupture (4.8d). The monofilament failures are characterized by quiet cracking
noises. Because some of the monofilaments have failed, new voids are formed and the
remaining monofilaments are free to rearrange within their multifilament groups (4.8e).
Eventually, the longer monofilaments will develop resistance to the load resulting in the
additional peak load until the overall multifilament has failed (4.8f). This is indicated by
a long series of failure cracking sounds.
The remaining geotextile materials pin and CBR load vs. displacement curves and
bar charts are presented in Figures 4.9 through 4.14.

53
(a) Fiber rearrangement (b) Load resistance begins
(c) Fiber elongation (d) Monofilament failure
(e) Fiber rearrangement and continued
multifilament load resistance
(f) Multifilament failure
Figure 4.8 Failure stages of woven geotextile (material D is pictured subjected to
the CBR puncture strength test)

54
(a) Load-displacement curve
(b) Bar chart (error bars indicate standard deviations)
Figure 4.9 Pin puncture strengths for geotextile material C samples
0
20
40
60
80
100
120
140
160
0 0.1 0.2 0.3 0.4 0.5 0.6 0.7 0.8
Lo
ad
(lb
s)
Displacement (lbs)
0
500
1000
1500
2000
2500
3000
3500
0
100
200
300
400
500
600
700
800
1 2 3 4 5 6 7 8 9 10 11 12 13 14 15
Pu
nct
ure
Str
en
gth
(N
)
Pu
nct
ure
Str
en
gth
(lb
s)
Test Sample Number
Average

55
(a) Load-displacement curve
(b) Bar chart (error bars indicate standard deviations)
Figure 4.10 CBR puncture strengths for geotextile material C samples
0
100
200
300
400
500
600
700
800
0 0.5 1 1.5 2 2.5
Lo
ad
(lb
s)
Displacement (in)
0
500
1000
1500
2000
2500
3000
3500
0
100
200
300
400
500
600
700
800
1 2 3 4 5 6 7 8 9 10
Pu
nct
ure
Str
en
gth
(N
)
Pu
nct
ure
Str
en
gth
(lb
s)
Test Sample Number
Average
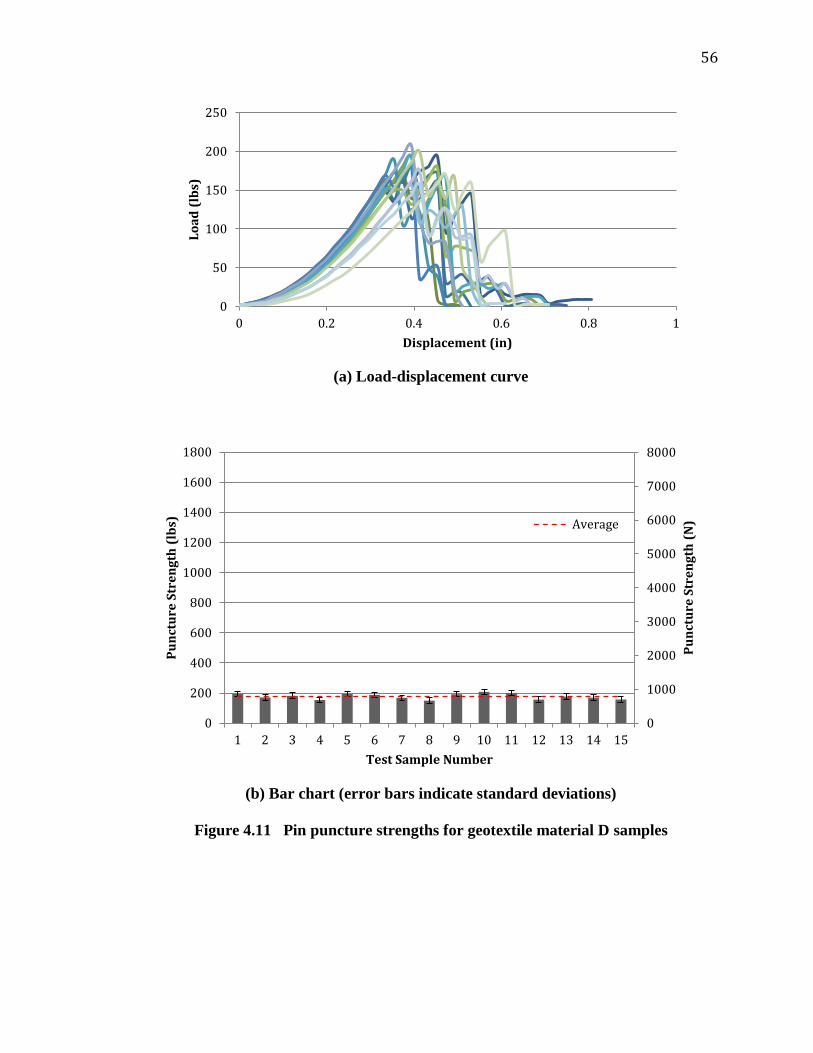
56
(a) Load-displacement curve
(b) Bar chart (error bars indicate standard deviations)
Figure 4.11 Pin puncture strengths for geotextile material D samples
0
50
100
150
200
250
0 0.2 0.4 0.6 0.8 1
Lo
ad
(lb
s)
Displacement (in)
0
1000
2000
3000
4000
5000
6000
7000
8000
0
200
400
600
800
1000
1200
1400
1600
1800
1 2 3 4 5 6 7 8 9 10 11 12 13 14 15
Pu
nct
ure
Str
en
gth
(N
)
Pu
nct
ure
Str
en
gth
(lb
s)
Test Sample Number
Average

57
(a) Load-displacement curve
(b) Bar chart (error bars indicate standard deviations)
Figure 4.12 CBR puncture strengths for geotextile material D samples
0
200
400
600
800
1000
1200
1400
1600
0 0.5 1 1.5 2 2.5 3
Lo
ad
(lb
s)
Displacement (in)
0
1000
2000
3000
4000
5000
6000
7000
8000
0
200
400
600
800
1000
1200
1400
1600
1800
1 2 3 4 5 6 7 8 9 10
Pu
nct
ure
Str
en
gth
(N
)
Pu
nct
ure
Str
en
gth
(lb
s)
Test Sample Number
Average

58
(a) Load-displacement curve
(b) Bar chart (error bars indicate standard deviations)
Figure 4.13 Pin puncture strengths for geotextile material E samples
0
50
100
150
200
250
300
0 0.2 0.4 0.6 0.8 1 1.2
Lo
ad
(lb
s)
Displacement (in)
0
1000
2000
3000
4000
5000
6000
7000
0
200
400
600
800
1000
1200
1400
1600
1 2 3 4 5 6 7 8 9 10 11 12 13 14 15
Pu
nct
ure
Str
en
gth
(N
)
Pu
nct
ure
Str
en
gth
(lb
s)
Test Sample Number
Average

59
(a) Load-displacement curve
(b) Bar chart (error bars indicate standard deviations)
Figure 4.14 CBR puncture strength for geotextile material E samples
The results of all pin and CBR puncture strength tested geotextile samples are
plotted in Figure 4.15 to compare the two test puncture strength values.
0
200
400
600
800
1000
1200
1400
1600
0 0.5 1 1.5 2 2.5 3
Lo
ad
(lb
s)
Displacement (in)
0
1000
2000
3000
4000
5000
6000
7000
0
200
400
600
800
1000
1200
1400
1600
1 2 3 4 5 6 7 8 9 10
Pu
nct
ure
Str
en
gth
(N
)
Pu
nct
ure
Str
en
gth
(lb
s)
Test Sample Number
Average

60
Figure 4.15 Pin and CBR puncture strength for all materials tested plotted with
their average value
It is important to note that geotextile samples tested using ASTM D6241 showed
a lower coefficient of variation compared with ASTM D4833 for materials A, B, and C
but a higher coefficient of variation for D and E. Thus, one test is not preferred over the
other on the basis of testing variability.
4.1.3 CBR Puncture Testing Failure Characteristics
A summary of CBR puncture failure characteristics in woven and nonwoven PP
geotextiles is presented in Table 4.2. Further discussion of elongation and effects of
weave type on puncture resistance are discussed in section 4.3.1 of this thesis.

61
Table 4.2 Puncture strength failure comparison of nonwoven and woven PP
geotextiles
Puncture Strength
Failure Characteristic Nonwoven Woven
Initial Load Failure
Cause Fiber-fiber contact points Monofilament rupture
Secondary Load Failure
Cause None
Additional monofilament
rupture or multifilament rupture
Elongation at failure Greater than woven Less than nonwoven
Aural indicator Single “pop” Series of “cracking”
4.2 Correlation of CBR and Pin Puncture Strength
A means to determine the CBR puncture strength based on a known pin puncture
strength was developed. Askari et al. (2012) previously studied the effects of test speed
on the puncture resistance of polyester needle punched nonwoven geotextiles using
ASTM D6241. Although the material tested was polyester rather than polypropylene,
results of their tests were used in the current study to develop the general relationship
between test speed and puncture resistance. A ratio of increase in puncture strength due
to an increase in speed was determined to be 1 to 4, or 0.25.
Using this ratio, the ratios of probe and sample areas, and the compression rates
shown in Table 4.3, Equation 1 was developed to correlate the CBR puncture strength
based on preexisting pin values.
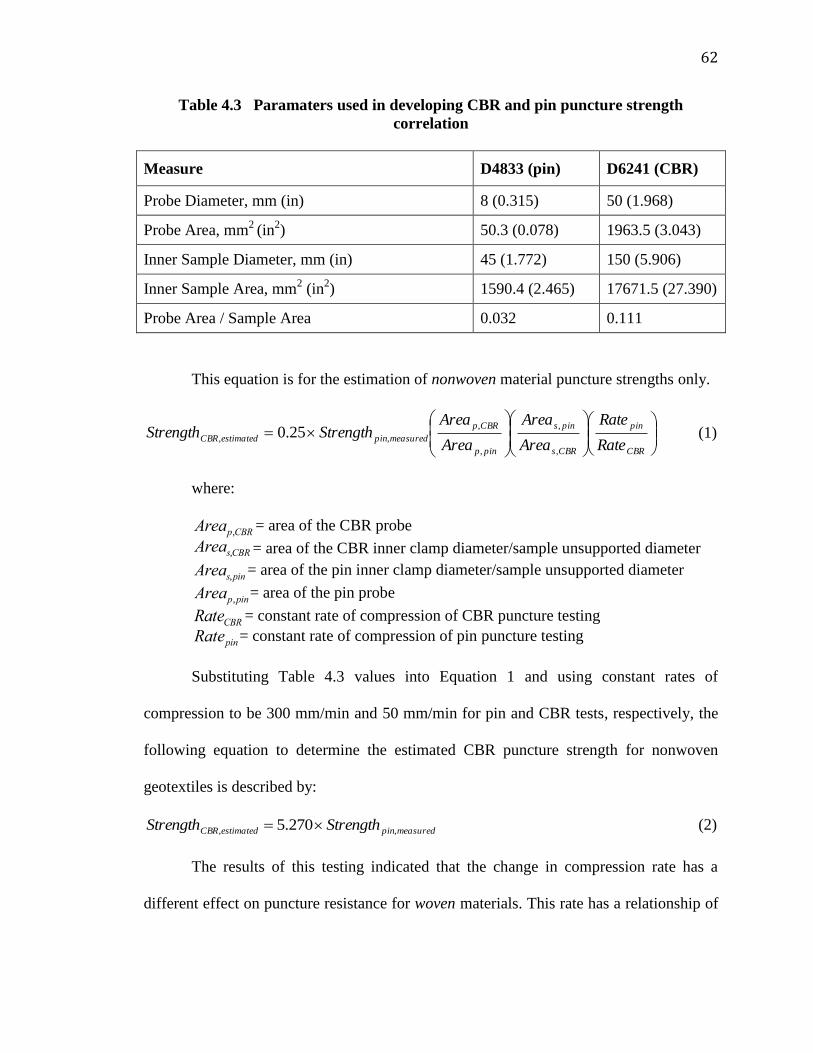
62
Table 4.3 Paramaters used in developing CBR and pin puncture strength
correlation
Measure D4833 (pin) D6241 (CBR)
Probe Diameter, mm (in) 8 (0.315) 50 (1.968)
Probe Area, mm2
(in2) 50.3 (0.078) 1963.5 (3.043)
Inner Sample Diameter, mm (in) 45 (1.772) 150 (5.906)
Inner Sample Area, mm2 (in
2) 1590.4 (2.465) 17671.5 (27.390)
Probe Area / Sample Area 0.032 0.111
This equation is for the estimation of nonwoven material puncture strengths only.
CBR
pin
CBRs
pins
pinp
CBRp
measuredpinestimatedCBRRate
Rate
Area
Area
Area
AreaStrengthStrength
,
,
,
,
,, 25.0 (1)
where:
= area of the CBR probe
= area of the CBR inner clamp diameter/sample unsupported diameter
= area of the pin inner clamp diameter/sample unsupported diameter
= area of the pin probe
= constant rate of compression of CBR puncture testing
= constant rate of compression of pin puncture testing
Substituting Table 4.3 values into Equation 1 and using constant rates of
compression to be 300 mm/min and 50 mm/min for pin and CBR tests, respectively, the
following equation to determine the estimated CBR puncture strength for nonwoven
geotextiles is described by:
measuredpinestimatedCBR StrengthStrength ,, 270.5 (2)
The results of this testing indicated that the change in compression rate has a
different effect on puncture resistance for woven materials. This rate has a relationship of
Areap,CBR
Areas,CBR
Areas,pin
Areap,pin
RateCBR
Ratepin

63
approximately 0.35. The adjusted equation to estimate CBR puncture resistance then
becomes:
CBR
pin
CBRs
pins
pinp
CBRp
measuredpinestimatedCBRRate
Rate
Area
Area
Area
AreaStrengthStrength
,
,
,
,
,, 35.0 (3)
Substituting the standard ASTM values into Equation 3, the following equation is
developed, which can be used to estimate the CBR punctures strength for woven
materials.
measuredpinestimatedCBR StrengthStrength ,, 378.7 (4)
Equation 2 and 4 were then used to estimate the CBR puncture strength from the
pin puncture test results as depicted in Figure 4.16.
Figure 4.16 Estimated CBR puncture strength using separate equations to describe
woven and nonwoven materials

64
In an attempt to find general formula for all samples, Equations 5 and 6 are
proposed:
CBR
pin
CBRs
pins
pinp
CBRp
measuredpinestimatedCBRRate
Rate
Area
Area
Area
AreaStrengthStrength
,
,
,
,
,, 30.0 (5)
measuredpinestimatedCBR StrengthStrength ,, 324.6 (6)
Equation 6 was then used to estimate the CBR puncture strength from the pin
puncture test results as depicted in Figure 4.17. For comparison, Figure 4.18 shows the
line obtained from Equation 6 as well as the line of best fit for the measured test results.
The line of best fit equation for measured puncture strength averages is described by
Equation 7 and has a coefficient of determination R2=0.789. Equation 6 simplifies to
Equation 8 for the samples tested and has an R2=0.781. The statistical results show a
reasonable correlation between the measured and estimated puncture strength values
using pin and CBR tests based on the suggested Equation 6.
pinRCB StrengthStrength 82.517.50 (all values in lb) (7)
pinCBR StrengthStrength 33.6 (all values in lb) (8)

65
Figure 4.17 Estimated CBR puncture strength using Equation 6
Figure 4.18 Comparison of the estimated CBR puncture strength using
Equation 6 and the line of best fit for measured results

66
4.3 Mass per Unit Area used to Select Geotextiles
Jones et al. (2000) determined unit weight is not a good indicator for geotextile
performance. In this study, two sets of materials were tested with the same unit weight.
Materials A and B were made of the same material and had unit weights of 4 oz/yd2, but
A was needlepunched and B was woven. Likewise, materials C and D were of like
materials, had a unit weight of 8 oz/yd2 and were needlepunched and woven, respectively.
4.3.1 Effect of Weave Type on CBR Puncture Strength
To examine the effects that weave play on maximum puncture resistance, typical
CBR puncture results for Materials A and B, which have the same mass per unit area of 4
oz/yd2 and base material, are plotted in Figure 4.19. Likewise, Materials C and D, which
have the same mass per unit area of 8 oz/yd2 are plotted in Figure 4.20. Again, the only
difference in the two sets of materials was whether they were woven or nonwoven.
Figure 4.19 CBR loading curves for material A (PP, nonwoven, 4 oz/yd2) and
material B (PP, woven, 4 oz/yd2)

67
Figure 4.20 CBR loading curves for material C (PP, nonwoven, 8 oz/yd2)
and material D (PP, woven, 8 oz/yd2)
The CBR puncture resistance of material C (8 oz/yd2) was approximately double
that of material A (4 oz/yd2). material D (8 oz/yd
2) showed a puncture resistance
approximately double that of material B (4 oz/yd2). This indicates that woven materials
(with the same base material and mass per unit area as a nonwoven material) will exhibit
a CBR puncture strength approximately double the nonwoven strength. Remember that
further insight to the puncture strength of nonwoven materials is supported by Koerner
and Koerner (2010). Koerner and Koerner (2010) had determined that both staple fiber
and continuous filament nonwoven materials will exhibit similar CBR puncture strengths.
This is likely because the puncture resistance of nonwoven materials is dependent on the
fiber-fiber contact points which is directly proportional to the mass per unit area.

68
The nonwoven materials (A and C) failed at the approximately the same
displacement at failure as shown in Figure 4.21. The woven materials (B and D) also
experienced similar displacements at puncture failure. This implies that the elongation at
puncture failure is determined by weave type, rather than mass per unit area.
Figure 4.21 CBR loading curves for Materials A-D
A comparison of pin and CBR puncture tests are shown in Figure 4.22. Notice
that material B (4 oz/yd2) had a lower puncture resistance than material C (8 oz/yd
2)
during pin testing, yet had a higher puncture resistance during CBR testing. Because
CBR testing has a larger probe size, small material variations become less apparent. By

69
comparing multiple materials of the same unit weight, this research supports the theory
that CBR puncture strength values better indicate field performance.
Figure 4.22 Puncture strength of materials with two mass per unit areas
4.4 Susceptibility of Nonwoven Geotextiles to Freeze/Thaw Deterioration
As stated previously, nine samples of material E were tested to investigate the
effects of freeze/thaw on the puncture strength of geotextiles. The material selected was a
nonwoven, needle punched fabric with a mass per unit area of 12 oz/yd2. The results of
the testing are summarized in Table 4.4. and shown in Figure 4.23.
0
200
400
600
800
1000
1200
1400
D4833 (Pin) D6241 (CBR)
Pu
nct
ure
Str
en
gth
(lb
s)
ASTM Testing Method
Material A (nonwoven, 4 oz)
Material B (woven, 4 oz)
Material C (nonwoven, 8 oz)
Material D (woven, 8 oz)

70
Table 4.4 Summary of Conditioned Sample Testing
Figure 4.23 Bar chart of puncture strength of freeze/thaw conditioned test samples
(error bars indicate standard deviations)
0
1000
2000
3000
4000
5000
6000
7000
0
200
400
600
800
1000
1200
1400
1600
1 2 3 4 5 6 7 8 9
Pu
nct
ure
Str
en
gth
(N
)
Pu
nct
ure
Str
en
gth
(lb
s)
Test Sample Number
Conditioned Average
Material
Type
Condition
Cycle
Count
Sample
Number
Puncture
Load, lbs
(N)
Average
Puncture
Load,
lbs (N)
Standard
Deviation,
lbs (N)
Coefficient
of
Variation
(%)
E 15
1 1130 (5026) 1064
(4733) 141 (627) 13.3 2 902 (4012)
3 1159 (5155)
E 30
4 1063 (4728) 1260
(5605) 85 (378) 6.8 5 1191 (5298)
6 1355 (6027)
E 45
7 1449 (6445) 1303
(5796) 171 (761) 13.1 8 1116 (4964)
9 1346 (5987)

71
The puncture resistances of conditioned and unconditioned material E were
compared. The average puncture resistance and standard deviation of the unconditioned
samples are added in Figure 4.24. An unpaired, two tail, type three t-test was run in excel
on the conditioned vs. unconditioned samples of material E. The resulting p value was
p=0.347, which is much higher than the α=0.05 significance level. There is no evidence
that the puncture resistance of nonwoven geotextiles is significantly impacted when the
material is subjected to up to 45 cycles of freeze-thaw conditioning.
Figure 4.24 Puncture strength of freeze/thaw conditioned test samples plotted with
the unconditioned material average (error bars indicate standard deviation of
unconditioned samples)
The puncture resistances of the first nine unconditioned material E samples are
plotted with the conditioned samples in Figure 4.25. The diagonal line represents the line
of equality where the CBR puncture resistance for both conditioned and unconditioned
would remain the same for each sample. Because the average of the tested samples is
0
1000
2000
3000
4000
5000
6000
7000
0
200
400
600
800
1000
1200
1400
1600
1 2 3 4 5 6 7 8 9P
un
ctu
re S
tre
ng
th (
N)
Pu
nct
ure
Str
en
gth
(lb
s)
Test Sample Number
Unconditioned Average Conditioned Average

72
below this line, the CBR puncture resistance for conditioned samples was, on average,
higher than that of unconditioned samples. This implies that the freeze-thaw cycling may
reduce puncture strength resistance over time. Although the statistical analysis described
previously implies there is no significant difference between conditioned and
unconditioned samples, the small sampling size and limited number of freeze-thaw cycles
may not accurately represent material deterioration, should there be any. Because of this,
future research is necessary to describe any trends related to freeze-thaw deterioration in
nonwoven PP geotextiles.
Figure 4.25 Conditioned vs. unconditioned CBR puncture strengths of material E

73
CHAPTER 5
CONCLUSIONS
Geotextiles are commonly used in geotechnical applications. The puncture
strength test is used to evaluate and classify geotextiles and determine their suitability for
different applications. This test evaluates the ability of geotextiles to withstand stresses
and loads during severe construction conditions. ASTM has recently replaced the
standard pin puncture strength test, D4833, with the CBR puncture strength test, D6241.
However, many DOTs and the FHWA still refer to D4833. Other state DOTs refer to
both D4833 and D6241, or provide a list of alternative test methods to be considered in
place of either of these tests. The objective of this research was to correlate the CBR and
pin puncture strengths for various categories of geotextiles, regardless of weave type and
mass per unit area.
Five types of polypropylene geotextiles, three nonwoven and two woven, were
subjected to testing in accordance with ASTM D4833 and ASTM D6241 standard
procedures. Ten and fifteen samples of each geotextile type were tested using CBR and
pin punctures strength tests, respectively. The following summarizes the testing results:
1. Material A (nonwoven) had an average pin puncture strength of 73 lbs and
average CBR puncture strength of 362 lbs, with coefficients of variation of 13.3%
and 11.4%, respectively.
2. Material B (woven) had an average pin puncture strength of 100 lbs and
average CBR puncture strength of 733 lbs, with coefficients of variation of 6.6%
and 2.8%, respectively.

74
3. Material C (nonwoven) had an average pin puncture strength of 115 lbs and
average CBR puncture strength of 595 lbs, with coefficients of variation of 18.3%
and 9.6%, respectively.
4. Material D (woven) had an average pin puncture strength of 178 lbs and
average CBR puncture strength of 1,392 lbs, with coefficients of variation of
10.3% and 10.9%, respectively.
5. Material E (nonwoven) had an average pin puncture strength of 240 lbs and
average CBR puncture strength of 1,268 lbs, with coefficients of variation of
6.8% and 8.0%, respectively.
6. The average elongation for the woven materials B and D were 0.35 in and 0.46
in, respectively, for pin puncture strength tests and 1.40 in and 1.44 in for CBR
puncture strength tests.
7. The average elongation for two nonwoven materials A and C were 0.50 in and
0.46 in, respectively, for pin puncture strength tests and 1.89 in and 1.88 in for
CBR puncture strength tests.
All five types of geotextiles exhibited puncture strength values, whether pin or CBR, that
were consistent within each group. The following conclusions were made:
1. Nonwoven materials commonly exhibit a load-displacement curve with four
phases: fiber rearrangement, load resistance, maximum resistance, and puncture
failure.
2. Woven materials commonly exhibit a load-displacement curve with six phases:
fiber rearrangement, load resistance, monofilament failure (puncture failure

75
reported), secondary fiber rearrangement, and multifilament failure (maximum
failure).
3. Nonwoven materials’ puncture strength values reported are always equal to the
maximum resistance. Woven materials may reach their puncture resistance and
then reach a higher maximum strength after additional loading. Woven materials
exhibit this dual peak load-displacement curve as monofilaments and
multifilaments fail, respectively.
Statistical analyses were conducted to establish a correlation between CBR and pin
puncture strength values. Correlations were successfully used to estimate the CBR
puncture strength values from the pin test with a reasonable accuracy. The following
summarizes the correlations and their uses:
1. Equation 1 can be used to estimate the CBR puncture strength based on pin test
puncture strengths of PP nonwoven materials only.
2. Equation 3 can be used to estimate the CBR puncture strength based on pin test
puncture strengths of PP woven materials only.
3. Equation 5 can be used to estimate the CBR puncture strength based on pin test
puncture strengths for all PP geotextiles. Equation 5 had a coefficient of
determination R2=0.781. The line of best fit for the materials tested had a
coefficient of determination R2=0.789.

76
CBR puncture resistances of materials with like mass per unit area and base material but
with different weave type were also examined. The following statements were concluded:
1. Woven PP materials exhibit a CBR puncture strength approximately double
that of nonwoven PP materials with the same mass per unit area.
2. The CBR displacement/elongation at puncture failure is determined by weave
type rather than mass per unit area for PP materials.
Deterioration of geotextile puncture resistance due to freeze-thaw conditioning was also
investigated. The following was concluded:
1. Samples subjected to 15, 30, and 45 freeze-thaw cycles had average puncture
loads of 1,064 lbs, 1,260 lbs and 1,303 lbs, respectively. The average for all
conditioned samples was 1,209 lbs. For comparison, the unconditioned material E
average puncture strength was 1,268 lbs. CBR puncture resistance of material E
(nonwoven PP) was not statistically significantly reduced when subjected to up to
45 cycles of freeze-thaw conditioning.
2. The preliminary testing of freeze-thaw conditioned samples showed
degradation, but further investigation using a greater number of freeze-thaw
cycles is required to develop a trend.

77
REFERENCES
Askari, Azadeh Seif., Najar, Saeed Shaikhzadeh., Vaghasloo, Yoness Alizadeh.. “Study
the Effect of Test Speed and Fabric Weight on Puncture Behavior of Polyester
Needlepunched Nonwoven Geotextiles.” Journal of Engineered Fibers and Fabrics. Vol.
7, Iss. 3. 2012: pp. 1-7.
ASTM Standard D3786/D3786M, 2013. “Standard test method for bursting strength of
textile fabrics-Diaphragm bursting strength tester method.” ASTM Designation:
D43786/D3786M-13, ASTM, USA.
ASTM Standard D4439, 2014. “Standard terminology for geosynthetics.” ASTM
Designation: D4439-14, ASTM, USA.
ASTM Standard D4833/D4833M, 2013. “Standard test method for index puncture
resistance of geomembranes and related products.” ASTM Designation: D4833/D4833M-
07(2013)e1, ASTM, USA.
ASTM Standard D5494, 2011. “Standard test method for determination of pyramid
puncture resistance of unprotected and protected geomembranes.” ASTM Designation:
D5494-93(2011), ASTM, USA
ASTM Standard D6241, 2009. “Standard test method for the static puncture strength of
geotextiles and geotextile-related products using a 50-mm probe.” ASTM Designation:
D6241-04(2009)e1, ASTM, USA.
Bhatia, S.K., Smith, J.L. “Geotextile Characterization and Pore-Size Distribution: Part I.
A Review of Manufacturing Processes.” Geosynthetics International. Vol. 3, No. 1. pp.
85-105.
Bygness, Ron. “Say Goodbye to #4833.” Geosynthetics. February 2010: pp. 56.
Carthage Mills. Geotextile being rolled out to provide separation. n.d. [photograph].
Retrieved from http://www.carthagemills.com/pdf/geotextile_cost_benefit_brochure.pdf.
Web. 20 Apr. 2014.
“Committee D35 on Geosynthetics.” ASTM International. Retrieved March 17, 2014,
from http://www.astm.org/COMMITTEE/D35.htm.
Hsieh, Chiwan, Wang, Jau-Bih. “Clamping mechanism effects on the puncture resistance
tests of high strength geotextiles.” Journal of GeoEngineering. Vol. 3, No. 2. August
2008: pp. 47-53.
I.S. Dam Lining. Rolling out the geomembrane (Geomembrane liner is deployed over the
geotextile base). n.d. [photograph]. Retrieved from http://www.isdamlining.com/work-
weve-done/. Web. 20 Apr. 2014.
78
Jones, D.R.V., Shercliff, D.A., Dixon, N.. “Difficulties associated with the specification
of protection geotextiles using only unit weight.” Proc 2nd
European Geosynthetics
Conference, Bologna. October 2000.
Koerner, Bob. “Mullen Burst Test?”. Geosynthetics. October 2013: pp. 15.
Koerner, George R., Koerner, Robert M.. “Puncture resistance of polyester (PET) and
polypropylene (PP) needle-punched nonwoven geotextiles.” Geotextiles and
Geomembrantes 29. 2010: pp. 360-362.
Koerner, Robert. “Polypropylene vs. polyester.” Geosynthetics. June 2012: pp. 43.
Kumar, R. Senthil. (2008) Textiles for Industrial Applications. Boca Raton, FL: CRC
Press, Taylor & Francis Group. pp. 217-219.
Mackey, Bob. “ASTM geosynthetics standards revising to ISO ‘geo terminology’.”
Geosynthetics. October 2013: pp. 42.
Narejo, D., Koerner, R.M. and Wilson-Fahmy, R.F.. “Puncture Protection of
Geomembranes Part II: Experimental” Geosynthetics International. Vol.
3, No. 5. 1996: pp. 629-653.
Obeiliao. The composite reinforcing geotextile was installed at the required elevation as
per in the construction drawing. n.d. [photograph]. Retrieved from
http://obeiliaolife.blogspot.com/2010_11_01_archive.html. Web. 20 Apr. 2014.
“Polymers.” The Essential Chemical Industry Online. CIEC Promoting Science at the
University of York, York, UK. Retrieved April 2, 2014, from
http://www.essentialchemicalindustry.org/index.php.
Rawal, Amit., Saraswat, Harshvardhan.. “Stabilisation of soil using hybrid
needlepunched nonwoven geotextiles.” Geotextile and Geomembranes 29. 2011: pp. 197-
200.
Suits, L.D., Carroll, R.G., Jr., and Christopher, B.R..“ASTM Geotextile Committee
Testing Update. Geotextile Testing and the Design Engineer. ASTM STP 952, J.E. Fluet,
Jr., Ed. American Society for Testing and Materials, Philadelphia, 1987, pp. 161-175.
Terram. Geotextile for filtration. n.d. [photograph]. Retrieved from
http://www.archiexpo.com/prod/terram/geotextiles-filtration-60830-1050043.html. Web.
20 Apr. 2014.
Tex Delta. Geotextile for vertical drainage. n.d. [photograph]. Retrieved from
http://www.archiexpo.com/prod/texdelta/geotextiles-vertical-drainage-80322-
1158977.html. Web. 20 Apr. 2014.

79
Warp-knitting Reinforced Composite Geotextile. n.d. [photograph]. Retrieved from
http://yuexin01.en.ec21.com/Warp-knitting_Reinforced_Composite_Geotextile--
5225509_6071738.html. EC21. Web. 15 Apr. 2014.

80
APPENDICES
81
APPENDIX A
Load-Displacement Curves for Pin and CBR Puncture Strength Tests

82
Figure A.1 Sample A1 (Pin) Figure A.2 Sample A2 (Pin)
Figure A.3 Sample A3 (Pin) Figure A.4 Sample A4 (Pin)

83
Figure A.5 Sample A5 (Pin) Figure A.6 Sample A6 (Pin)
Figure A.7 Sample A7 (Pin) Figure A.8 Sample A8 (Pin)

84
Figure A.9 Sample A9 (Pin) Figure A.10 Sample A10 (Pin)
Figure A.11 Sample A11 (Pin) Figure A.12 Sample A12 (Pin)

85
Figure A.13 Sample A13 (Pin) Figure A.14 Sample A14 (Pin)
Figure A.15 Sample A15 (Pin)

86
Figure A.16 Sample A1 (CBR) Figure A.17 Sample A2 (CBR)
Figure A.18 Sample A3 (CBR) Figure A.19 Sample A4 (CBR)

87
Figure A.20 Sample A5 (CBR) Figure A.21 Sample A6 (CBR)
Figure A.22 Sample A7 (CBR) Figure A.23 Sample A8 (CBR)
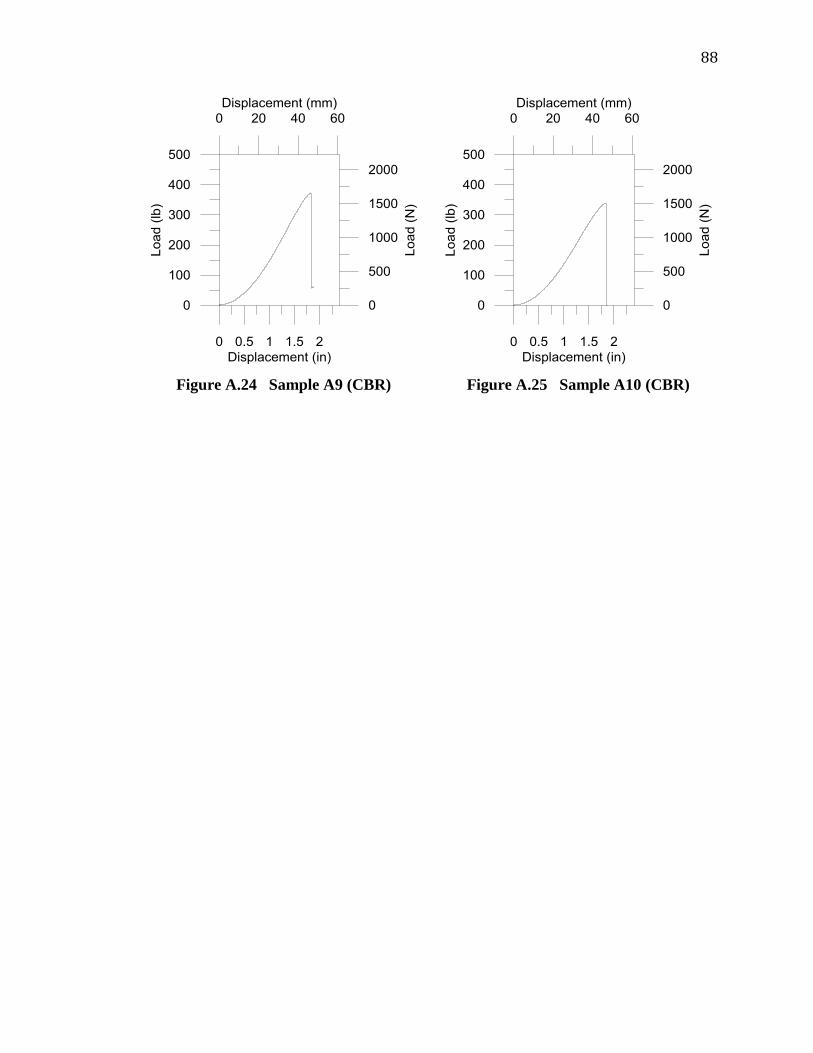
88
Figure A.24 Sample A9 (CBR) Figure A.25 Sample A10 (CBR)

89
Figure A.26 Sample B1 (Pin) Figure A.27 Sample B2 (Pin)
Figure A.28 Sample B3 (Pin) Figure A.29 Sample B4 (Pin)

90
Figure A.30 Sample B5 (Pin) Figure A.31 Sample B6 (Pin)
Figure A.32 Sample B7 (Pin) Figure A.33 Sample B8 (Pin)

91
Figure A.34 Sample B9 (Pin) Figure A.35 Sample B10 (Pin)
Figure A.36 Sample B11 (Pin) Figure A.37 Sample B12 (Pin)

92
Figure A.38 Sample B13 (Pin) Figure A.39 Sample B14 (Pin)
Figure A.40 Sample B15 (Pin)

93
Figure A.41 Sample B1 (CBR) Figure A.42 Sample B2 (CBR)
Figure A.43 Sample B3 (CBR) Figure A.44 Sample B4 (CBR)

94
Figure A.45 Sample B5 (CBR) Figure A.46 Sample B6 (CBR)
Figure A.47 Sample B7 (CBR) Figure A.48 Sample B8 (CBR)

95
Figure A.49 Sample B9 (CBR) Figure A.50 Sample B10 (CBR)

96
Figure A.51 Sample C1 (Pin) Figure A.52 Sample C2 (Pin)
Figure A.53 Sample C3 (Pin) Figure A.54 Sample C4 (Pin)

97
Figure A.55 Sample C5 (Pin) Figure A.56 Sample C6 (Pin)
Figure A.57 Sample C7 (Pin) Figure A.58 Sample C8 (Pin)

98
Figure A.59 Sample C9 (Pin) Figure A.60 Sample C10 (Pin)
Figure A.61 Sample C11 (Pin) Figure A.62 Sample C12 (Pin)
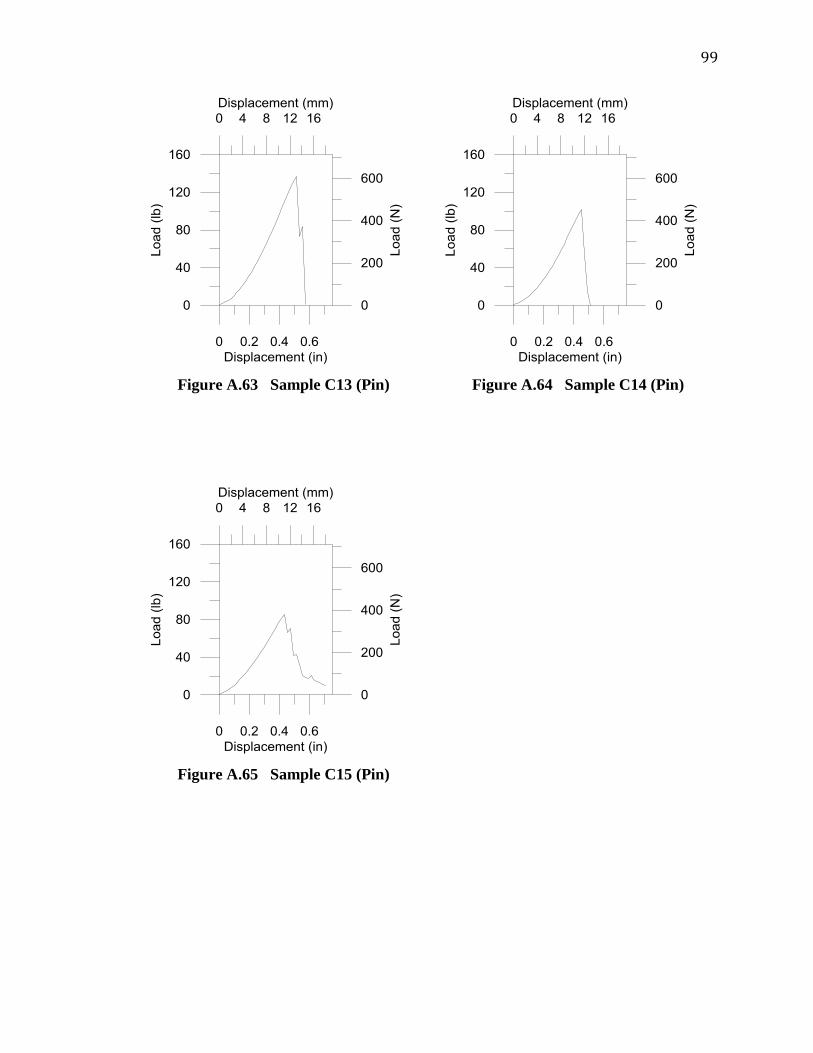
99
Figure A.63 Sample C13 (Pin) Figure A.64 Sample C14 (Pin)
Figure A.65 Sample C15 (Pin)

100
Figure A.66 Sample C1 (CBR) Figure A.67 Sample C2 (CBR)
Figure A.68 Sample C3 (CBR) Figure A.69 Sample C4 (CBR)

101
Figure A.70 Sample C5 (CBR) Figure A.71 Sample C6 (CBR)
Figure A.72 Sample C7 (CBR) Figure A.73 Sample C8 (CBR)

102
Figure A.74 Sample C9 (CBR) Figure A.75 Sample C10 (CBR)

103
Figure A.76 Sample D1 (Pin) Figure A.77 Sample D2 (Pin)
Figure A.78 Sample D3 (Pin) Figure A.79 Sample D4 (Pin)

104
Figure A.80 Sample D5 (Pin) Figure A.81 Sample D6 (Pin)
Figure A.82 Sample D7 (Pin) Figure A.83 Sample D8 (Pin)

105
Figure A.84 Sample D9 (Pin) Figure A.85 Sample D10 (Pin)
Figure A.86 Sample D11 (Pin) Figure A.87 Sample D12 (Pin)

106
Figure A.88 Sample D13 (Pin) Figure A.89 Sample D14 (Pin)
Figure A.90 Sample D15 (Pin)

107
Figure A.91 Sample D1 (CBR) Figure A.92 Sample D2 (CBR)
Figure A.93 Sample D3 (CBR) Figure A.94 Sample D4 (CBR)

108
Figure A.95 Sample D5 (CBR) Figure A.96 Sample D6 (CBR)
Figure A.97 Sample D7 (CBR) Figure A.98 Sample D8 (CBR)

109
Figure A.99 Sample D9 (CBR) Figure A.100 Sample D10 (CBR)

110
Figure A.101 Sample E1 (Pin) Figure A.102 Sample E2 (Pin)
Figure A.103 Sample E3 (Pin) Figure A.104 Sample E4 (Pin)
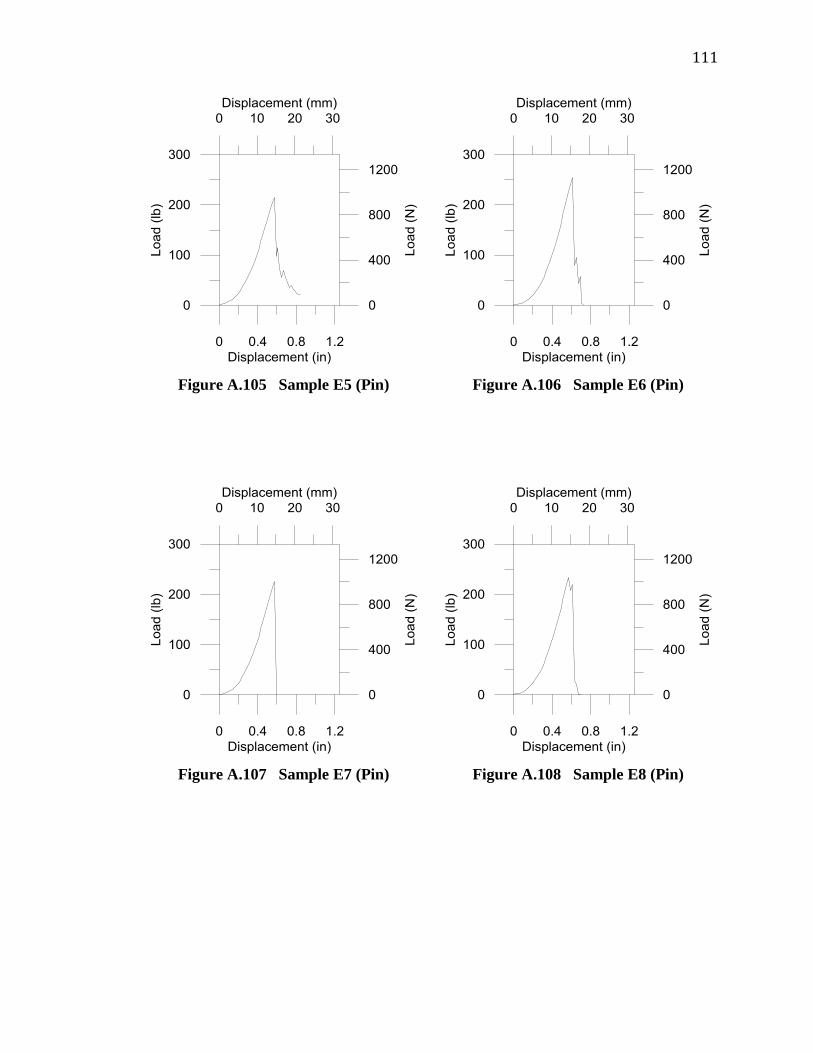
111
Figure A.105 Sample E5 (Pin) Figure A.106 Sample E6 (Pin)
Figure A.107 Sample E7 (Pin) Figure A.108 Sample E8 (Pin)
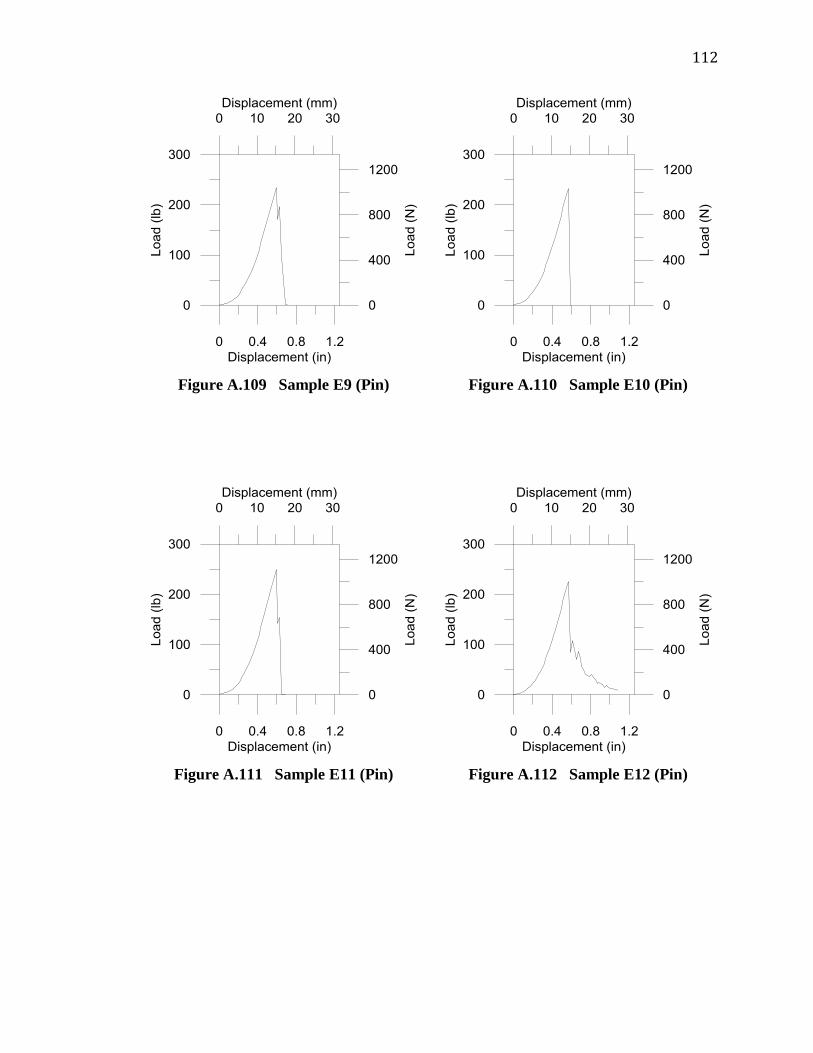
112
Figure A.109 Sample E9 (Pin) Figure A.110 Sample E10 (Pin)
Figure A.111 Sample E11 (Pin) Figure A.112 Sample E12 (Pin)

113
Figure A.113 Sample E13 (Pin) Figure A.114 Sample E14 (Pin)
Figure A.115 Sample E15 (Pin)
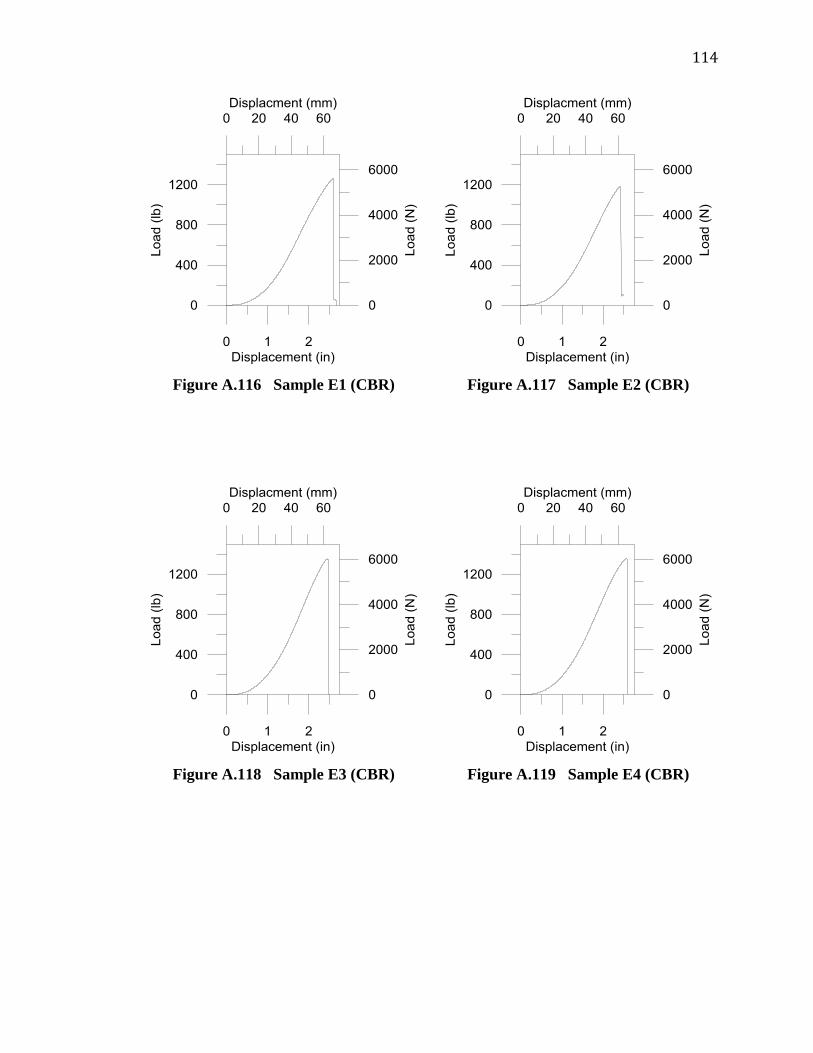
114
Figure A.116 Sample E1 (CBR) Figure A.117 Sample E2 (CBR)
Figure A.118 Sample E3 (CBR) Figure A.119 Sample E4 (CBR)
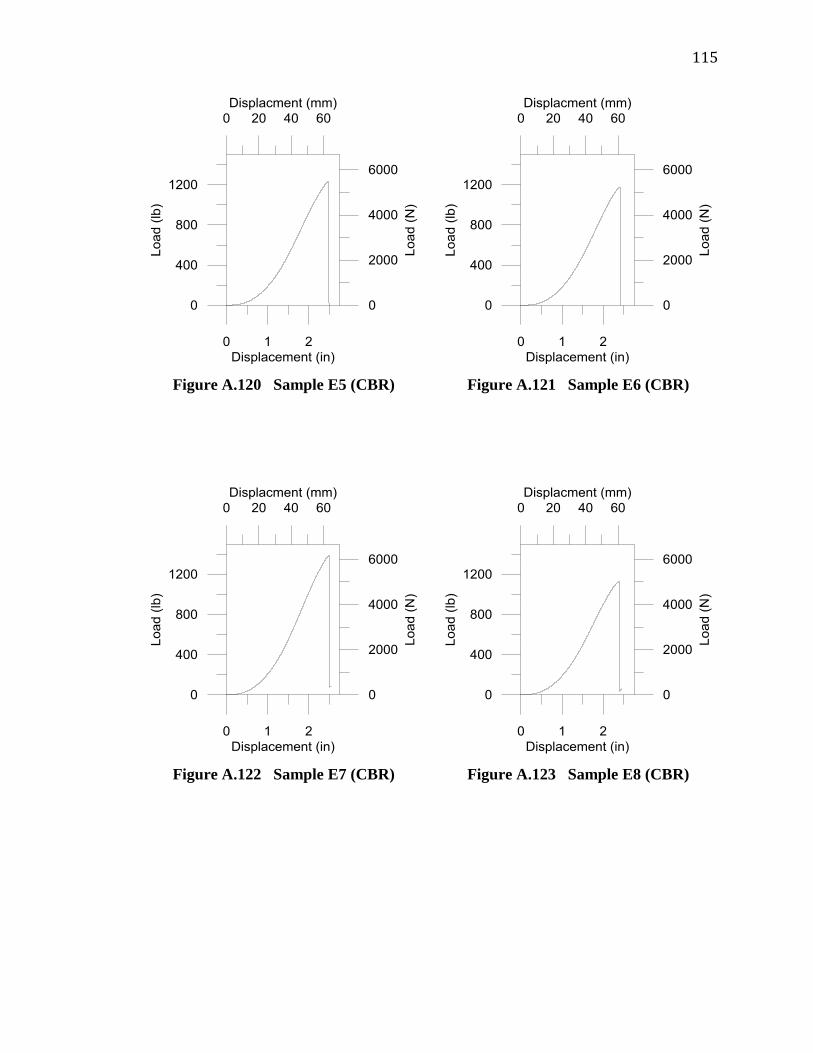
115
Figure A.120 Sample E5 (CBR) Figure A.121 Sample E6 (CBR)
Figure A.122 Sample E7 (CBR) Figure A.123 Sample E8 (CBR)

116
Figure A.124 Sample E9 (CBR) Figure A.125 Sample E10 (CBR)
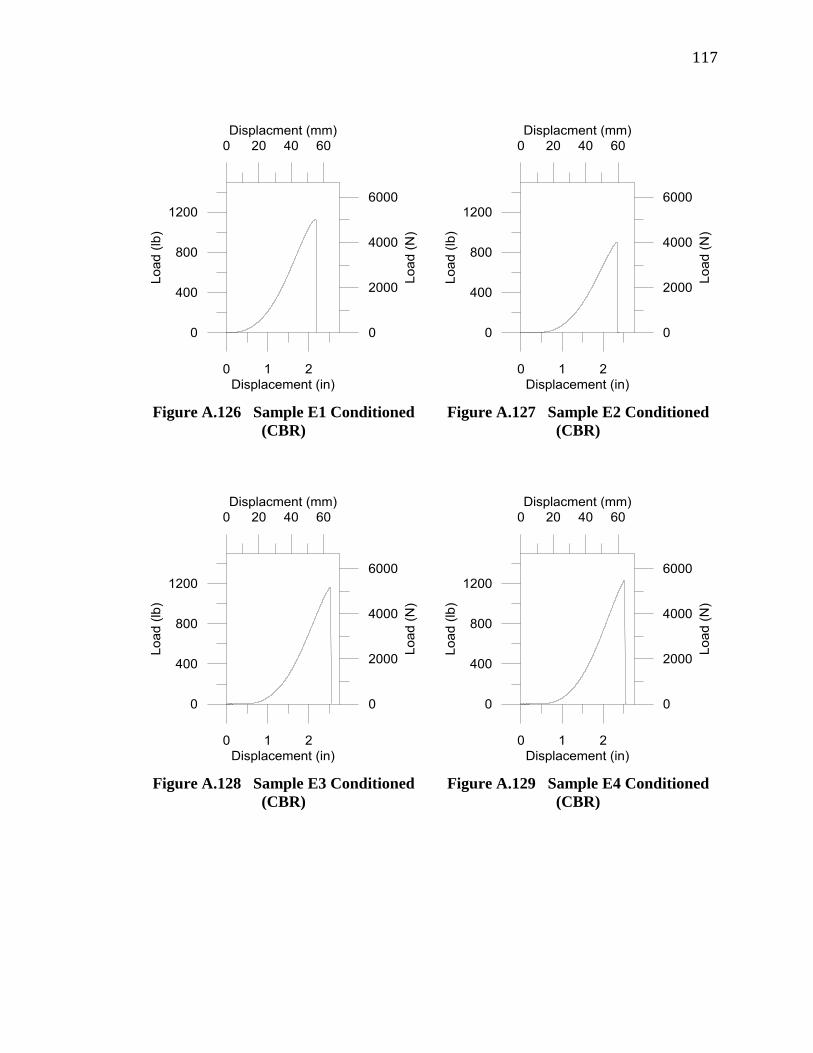
117
Figure A.126 Sample E1 Conditioned
(CBR)
Figure A.127 Sample E2 Conditioned
(CBR)
Figure A.128 Sample E3 Conditioned
(CBR)
Figure A.129 Sample E4 Conditioned
(CBR)

118
Figure A.130 Sample E5 Conditioned
(CBR)
Figure A.131 Sample E6 Conditioned
(CBR)
Figure A.132 Sample E7 Conditioned
(CBR)
Figure A.133 Sample E8 Conditioned
(CBR)

119
Figure A.134 Sample E9 Conditioned
(CBR)

120
APPENDIX B
R-Controller Program Settings

121
Figure B.1 R Controller Program Information
Figure B.2 R Controller Sample Loading Profile
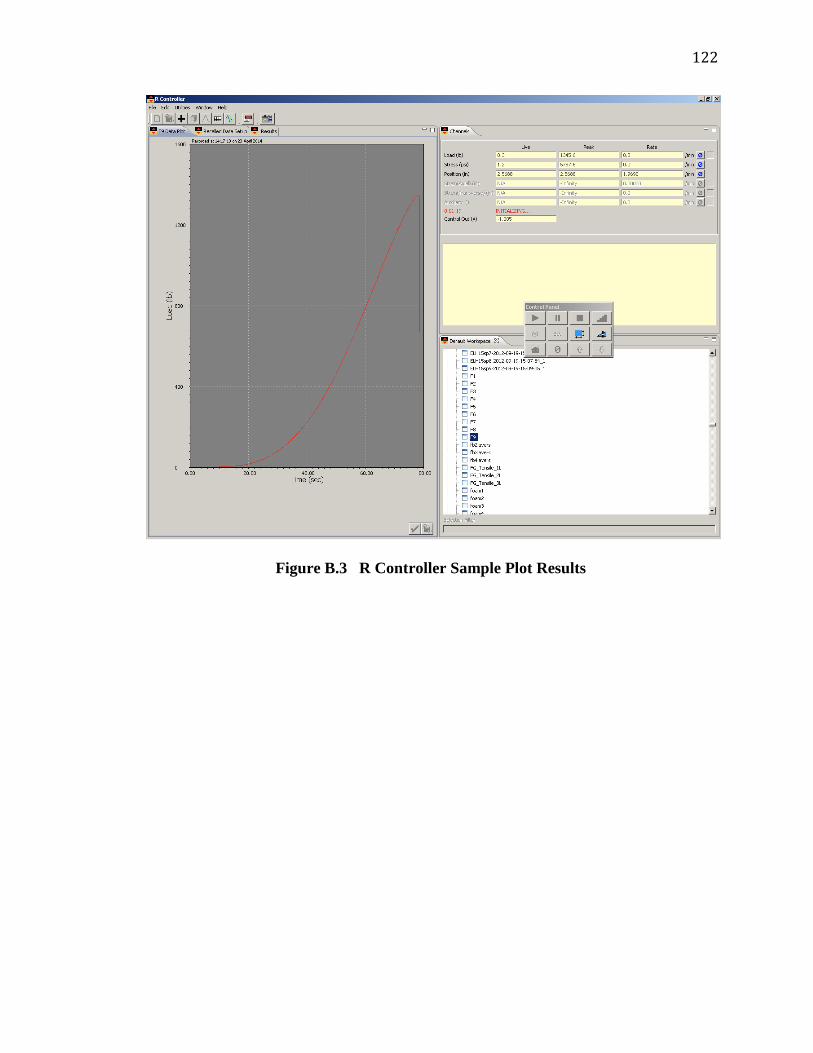
122
Figure B.3 R Controller Sample Plot Results