Embed Size (px)
Citation preview

COMPARATIVE ASSESSMENT OF EXTENDSIM AND ANYLOGIC
EFFICIENCY FOR INVENTORY CONTROL SYSTEMS SIMULATION
Eugene Kopytov and Aivars Muravjovs
Transport and Telecommunication Institute
1, Lomonosova Street, Riga, LV-1019, Latvia
E-Mail: [email protected]; [email protected]
KEYWORDS
Inventory control, simulation tools, ExtendSim,
AnyLogic, efficiency index, assessment of efficiency
ABSTRACT
The given research fulfils the evaluation of the
efficiency of application of two universal simulation
packages ExtendSim 8 and AnyLogic 6.7 for inventory
control system simulation. In the study twenty eight
evaluating criteria have been developed which are
distributed in five groups: general, programming
aspects, visualization, simulation and user support. As
an object of the simulation the inventory control model
with reorder point strategy and stochastic demand has
been chosen.
INTRODUCTION
The inventory control problems are very complicated in
practice. The search of the effective solutions of stock
control in business should be based on a number of
economic, social and technical indicators (Kopytov and
Greenglaz 2004). In the general case the researches
have to investigate the stochastic models for different
situations in inventory control systems. At present
various models are available to solve the inventory
control problem (Chopra and Meindl 2001; Ross 1992).
These models can be realized using analytical and
simulation methods. As was shown in previous authors’
works, the analytical models are fairly complex
(Kopytov et al. 2007). The simulation approach gives
possibility to find optimum solution of an inventory
problem in the case when realization of analytical model
is rather difficult. As a result, the number of projects
that use simulation models to the problems of inventory
management in the last decade has increased
significantly. This is due to the following reasons: the
complexity of obtaining analytical solutions and the
creation of a new generation of modeling, platforms,
which have become more friendly for regular users and
allow to solve the problem within a reasonable time
(Stewart R. 2004).
The existence of a variety of simulation tools makes the
issue of choosing the most suitable one rather difficult.
There are many studies on the evaluation and
comparison of simulation software tools (for example,
Seila et al. 2003; Verma et al. 2010), but they do not
consider their application for inventory control tasks,
which have a number of specific characteristics. For this
reason the presented research has been executed.
The authors have evaluated the efficiency of employing
simulation tools ExtendSim 8 and AnyLogic 6.7 to
solve the inventory control problems. The ExtendSim
package is well known in Latvian academic environment
versus AnyLogic, which is quite new in this field but is
actively used in our university in the last years.
SIMULATION TOOLS UNDER INVESTIGATION
The package ExtendSim (Krahl 2007) is a proven
simulation environment capable of modeling a wide
range of systems. ExtendSim is used to model
continuous, discrete event, discrete rate, and agent based
systems. ExtendSim’s design facilitates every phase of
the simulation project, from creating, validating, and
verifying the model, to the construction of a user
interface that allows others to analyze the system
(Kopytov and Muravjov 2011). Simulation tool
developers can use ExtendSim’s built-in, compiled
language Modl to create reusable modeling components.
All of this is done within a single, self-contained
software program, which does not require external
interfaces, compilers, or code generators.
The package AnyLogic (Marin et al. 2010) is a tool that
supports all the most common simulation methodologies
in place today: System Dynamics, Process-centric
(AKA Discrete Event), and Agent Based modeling
(Emrich et al. 2007). The unique flexibility of the
modeling language enables the users to capture the
complexity and heterogeneity of business, economic
and social systems to any desired level of detail.
AnyLogic’s graphical interface, tools, and library
objects allow users to quickly model diverse areas such
as manufacturing and logistics, business processes,
human resources, consumer and patient behavior. The
object-oriented model design paradigm supported by
AnyLogic provides for modular, hierarchical, and
incremental construction of large models.
METHODOLOGY OF EVALUATION
The procedure for evaluating the effectiveness of the
selected simulation tools for inventory control system
includes the following stages:
Proceedings 26th European Conference on Modelling andSimulation ©ECMS Klaus G. Troitzsch, Michael Möhring,Ulf Lotzmann (Editors)ISBN: 978-0-9564944-4-3 / ISBN: 978-0-9564944-5-0 (CD)

creation of system performance indicators for
simulation tools and justification of criteria for
evaluating the effectiveness of alternatives;
choice of methods for estimating indicators of
simulation tools;
implementation of the inventory control
models in the ExtendSim and AnyLogic
environment;
performing simulation test;
assessment of criteria for simulation tools.
The contents of the separate steps are described below.
СRITERIA FORMATION
The problem of simulation tools efficiency evaluation
and selecting the most appropriate option was
considered by many authors. First of all, we can
mention the works (Seila et al. 2003; Verma et al.
2010). It should be noted that in these researches the
amount of estimated indicators are significantly
different. So, the Seila et al. (2003) have investigated
the effectiveness of 20 discrete event simulation tools
using a small number of indicators. But Verma et al.
(2010) have made an assessment of 4 software tools,
estimating more than 200 parameters. Some of the
parameters have been evaluated by the expert methods;
some parameters were obtained as a result of the
experiments.
Taking in account the specificity of inventory control
model simulation the authors have formed the system of
criteria which includes 28 indicators. These indicators
were distributed in five groups shown in the Tab. 1.
Table 1: Groups of criteria of the effectiveness of
inventory control simulation tools
Group No Group Name
1. General
2. Programming aspects
3. Visualization
4. Simulation
5. User support
Distributing indicators in the groups allows involving in
assessment process various experts: programmers,
graphic interface creators, support team, etc.
To evaluate each indicator the authors have selected the
numeric scale from 0 to 3, with: 0 – unsatisfactory; 1 –
satisfactory; 2 – good; 3 – excellent.
The effectiveness of each simulation tools for the
selected groups is characterized by following criteria:
1) the sum of scores )(ijS , where 1j for package
ExtendSim and 2j for package AnyLogic, where
numbers of groups are 5,..,2,1i ;
2) the priority vector (local criteria) ],,[ 2,1, iii ppp
where the elements of the vector, respectively,
define priorities (weights) of ExtendSim 8 and
AnyLogic 6.7 calculated for the i-th group of
indicators as follows:
2,1,)(
2)(
1
)(
,
jSS
Sp
ii
ij
ji . (1)
It is easy to see that always it is 12,1, ii pp .
In the final step of the assessment process the vector
],[ 21 ppP of the global criteria priorities can be
calculated:
5
1
, ,2,1,i
jiij jpP (2)
where
5
1
;1;5,...,2,1,0i
ii i i is the weight of
criteria of the i-th group.
DESCRIPTION OF THE MODEL
To evaluate the efficiency of the selected simulation
packages for inventory control tasks there have been
selected various models, among them: single- and
multiple-product, with random demand, with random
and fixed lead time, with different ordering strategies,
without restrictions on storage and financing resources.
In this paper we consider a single-product stochastic
inventory control model under following conditions.
The demand for goods D has a normal distribution with
known parameters mean m and standard deviation . In
the moment of time, when the stock level )(t falls till
certain level R, a new order is placed (see Fig.1). The
quantity R is called as reorder point. The order quantity
Q is constant. We suppose that RQ . The lead time L
(time between placing an order and receiving it) is
fixed. There is the possible situation of deficit, when
demand DL during lead time L exceeds the value of
reorder point R. We suppose that in case of deficit the
last cannot be covered by expected order.
)(t
R
Q
Z
0
1T L
t
Figure 1: Dynamics of inventory level during one cycle
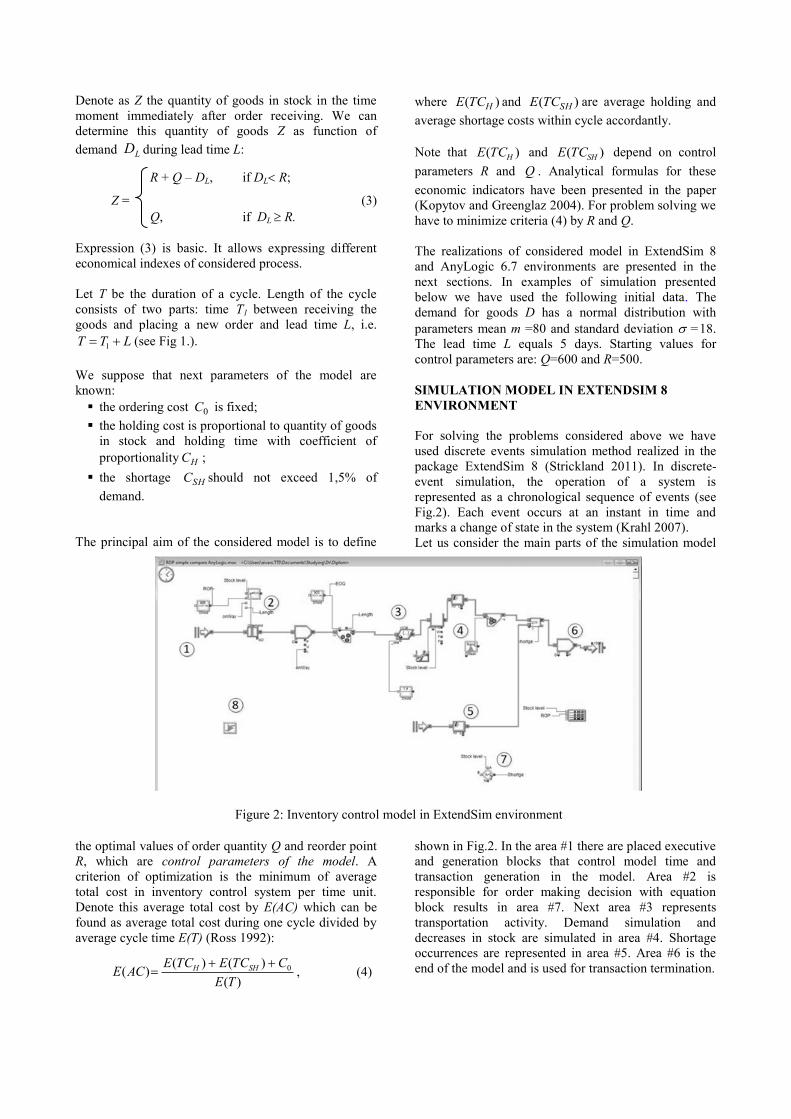
Figure 2: Inventory control model in ExtendSim environment
Denote as Z the quantity of goods in stock in the time
moment immediately after order receiving. We can
determine this quantity of goods Z as function of
demand LD during lead time L:
R + Q – DL, if DL R;
Z = (3)
Q, if DL R.
Expression (3) is basic. It allows expressing different
economical indexes of considered process.
Let T be the duration of a cycle. Length of the cycle
consists of two parts: time T1 between receiving the
goods and placing a new order and lead time L, i.e.
LTT 1 (see Fig 1.).
We suppose that next parameters of the model are
known:
the ordering cost 0C is fixed;
the holding cost is proportional to quantity of goods
in stock and holding time with coefficient of
proportionality HC ;
the shortage SHC should not exceed 1,5% of
demand.
The principal aim of the considered model is to define
the optimal values of order quantity Q and reorder point
R, which are control parameters of the model. A
criterion of optimization is the minimum of average
total cost in inventory control system per time unit.
Denote this average total cost by E(AC) which can be
found as average total cost during one cycle divided by
average cycle time E(T) (Ross 1992):
)(
)()()( 0
TE
CTCETCEACE SHH
, (4)
where )( HTCE and )( SHTCE are average holding and
average shortage costs within cycle accordantly.
Note that )( HTCE
and )( SHTCE
depend on control
parameters R and Q . Analytical formulas for these
economic indicators have been presented in the paper
(Kopytov and Greenglaz 2004). For problem solving we
have to minimize criteria (4) by R and Q.
The realizations of considered model in ExtendSim 8
and AnyLogic 6.7 environments are presented in the
next sections. In examples of simulation presented
below we have used the following initial data. The
demand for goods D has a normal distribution with
parameters mean m =80 and standard deviation =18.
The lead time L equals 5 days. Starting values for
control parameters are: Q=600 and R=500.
SIMULATION MODEL IN EXTENDSIM 8
ENVIRONMENT
For solving the problems considered above we have
used discrete events simulation method realized in the
package ExtendSim 8 (Strickland 2011). In discrete-
event simulation, the operation of a system is
represented as a chronological sequence of events (see
Fig.2). Each event occurs at an instant in time and
marks a change of state in the system (Krahl 2007).
Let us consider the main parts of the simulation model
shown in Fig.2. In the area #1 there are placed executive
and generation blocks that control model time and
transaction generation in the model. Area #2 is
responsible for order making decision with equation
block results in area #7. Next area #3 represents
transportation activity. Demand simulation and
decreases in stock are simulated in area #4. Shortage
occurrences are represented in area #5. Area #6 is the
end of the model and is used for transaction termination.

Figure 4: Inventory control model in AnyLogic environment
The example of one realization of inventory control
simulation is presented in Fig.3. The plot is showing the
stock level for 100 days period simulation.
Figure 3: Example of simulation process in ExtendSim
SIMULATION MODEL IN ANYLOGIC 6.7
ENVIRONMENT
The model considered above uses discrete event
simulation approach. On the other hand AnyLogic
developers promote agent-based modeling (ABM)
approach. In ABM the focus is on individual agents,
their rules, their behaviors, and their interactions with
each other and the environment (Salamon 2011).
Collectively agents may exhibit emergent behaviors
such as self-organization. Since agents do not follow a
pre-scripted flow (as in Discrete Event) and their
structure is not pre-specified at the global/aggregate
level (as in System Dynamics), they can exhibit novel or
surprising behaviors that were not anticipated during
design. ABM is a great methodology for exploring non-
linear, dynamic environments. ABM is also well suited
for situations with no precedent or where past data or
experience does not exist. When combined with data
and data analytics, ABM forms one of the most
powerful predictive analytics / forecasting methodology.
From an architectural viewpoint, a typical AnyLogic
agent based model would have at least two active object
classes. There would be a main class for a top-level
object where agents would be contained and a class for
an agent or person. The Person class in most cases
would be declared as Agent which is a special subclass
of the ActiveObject class that extends the latter with
services useful for agent based modeling. A number of
agents would be embedded into the Main object, as a
replicated object of type Person. One or more
Environment constructs may be defined at the level of
Main to specify properties shared by the agents.
The suggested inventory model realization is presented
in Fig.4. In this figure we can see variable and
parameter window that also contains agents for
distributer, retailer, truck and events for ordering and
transportation tasks. These agents can be used in future
more complex models with multiple retailers,
distribution point and multiproduct ordering.
In AnyLogic 6.2 are introduced special graphical tolls
Action Charts. The designers of AnyLogic have
suggested Action Charts as a simple and commonly
accepted language, that makes action/decision logic
visual, easy to communicate to other people and easier
to develop at the same time. Action Charts consist of
nested elements, each corresponding to a Java
statement: decision-statement, several kinds of loops,
local variable declaration, code section, etc. An action
chart is straightforwardly mapped to a Java method and
therefore is equally efficient. The developers can choose
colors and labels of the action chart boxes to further improve
its expressiveness. The example of action chart for inventory
control model with reorder point is shown in Fig.5.
The example of simulation process realization in
AnyLogic environment is presented on Fig.6. As is
easily seen, the plots in Fig.3 and Fig.6 are very similar.
And this is natural, because the plots show the
simulation results of the same task.

Figure 5: Action chart
Figure 6: Example of simulation process in AnyLogic
EXAMPLE OF INVENTORY CONTROL SYSTEM
OPTIMIZATION
As it was mentioned above the control parameters for
presented model are the order quantity Q and reorder
point R. In considered example the optimum search of
control parameters is carried out in range for
1200400 Q and 800200 R . Both presented
simulation packages have integrated optimization tools
that we had used to find optimal result.
At first let’s consider optimization process in AnyLogic.
To run optimization we should manually create and tune
optimization experiment. In tuning process we need to
create user interface, define objective function,
optimization parameters and constraints. The example
of optimization process in AnyLogic environment is
presented In Fig.7.
Next let’s look at the same procedure in ExtendSim
tool, which is a little easier. We can use the same user
interface, just putting into model window optimization
block, all other steps are similar to AnyLogic except
that in ExtendSim we can use optimization parameters
only in constraints. The example of optimization
process in ExtendSim environment is shown in Fig.8.
Figure 7: Example of optimization process in AnyLogic
Figure 8: Example of optimization process in ExtendSim
In Tab. 2 final optimization results for both simulation
tools are shown. Apparently the obtained results are
very similar to each other.
Table 2: Optimization results
Parameter
Simulation tools
AnyLogic ExtendSim
Reorder point 480 486
Order quantity 980 900
Total cost 862 264 EUR 823 874 EUR
The authors also have investigated more complex
models of inventory control systems (for example, see
(Kopytov and Muravjov 2011)), which due to the article
size limitation are not presented in this paper. The
simulation results were used by authors in the
comparative assessment of ExtendSim 8 and AnyLogic
6.7 presented below.
ASSESSMENT OF EXTENDSIM AND
ANYLOGIC EFFICIENCY
The developed system of criteria described above has
been used for comparative assessment of efficiency of
the packages ExtendSim 8 and AnyLogic 6.7 for
inventory control system simulation. Consequently, the
different groups of criteria have been evaluated by
different qualified experts. For instance, the
programmers have assessed the general and
programming aspects criteria; the experts from the
supporting service have evaluated the user support
criteria, while the decision makers have estimated the
visualization and simulation criteria.
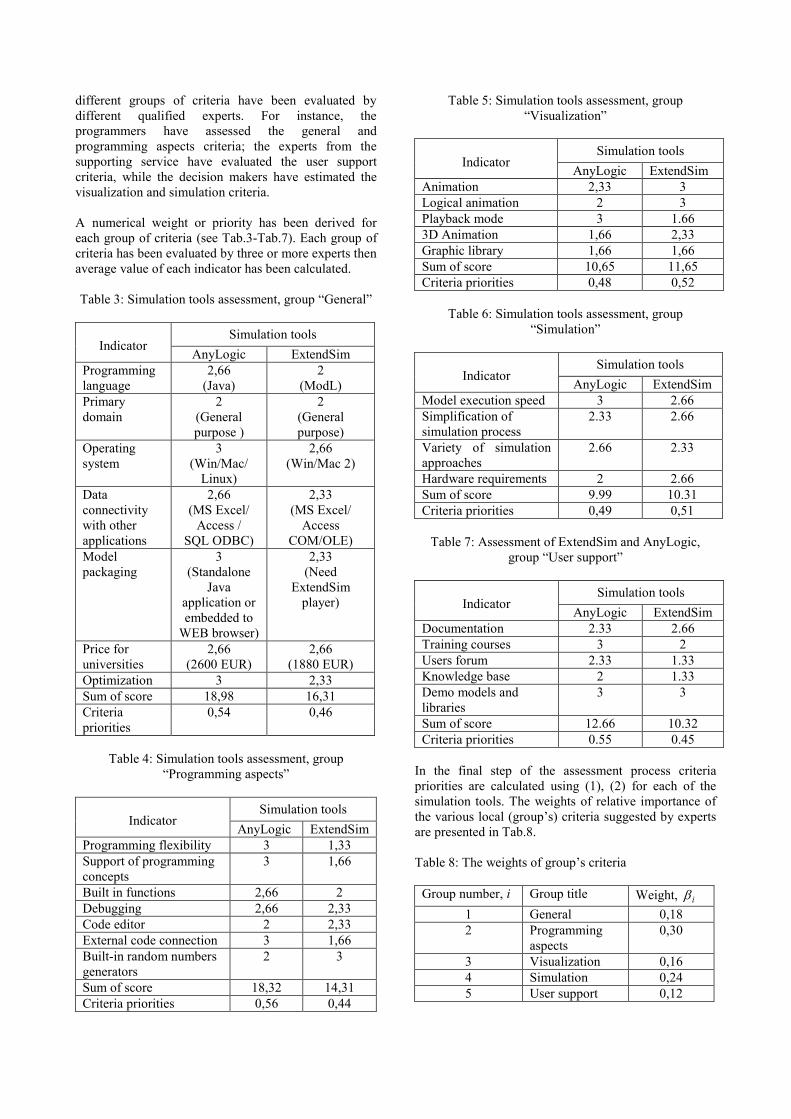
A numerical weight or priority has been derived for
each group of criteria (see Tab.3-Tab.7). Each group of
criteria has been evaluated by three or more experts then
average value of each indicator has been calculated.
Table 3: Simulation tools assessment, group “General”
Indicator Simulation tools
AnyLogic ExtendSim
Programming
language
2,66
(Java)
2
(ModL)
Primary
domain
2
(General
purpose )
2
(General
purpose)
Operating
system
3
(Win/Mac/
Linux)
2,66
(Win/Mac 2)
Data
connectivity
with other
applications
2,66
(MS Excel/
Access /
SQL ODBC)
2,33
(MS Excel/
Access
COM/OLE)
Model
packaging
3
(Standalone
Java
application or
embedded to
WEB browser)
2,33
(Need
ExtendSim
player)
Price for
universities
2,66
(2600 EUR)
2,66
(1880 EUR)
Optimization 3 2,33
Sum of score 18,98 16,31
Criteria
priorities
0,54 0,46
Table 4: Simulation tools assessment, group
“Programming aspects”
Indicator Simulation tools
AnyLogic ExtendSim
Programming flexibility 3 1,33
Support of programming
concepts
3 1,66
Built in functions 2,66 2
Debugging 2,66 2,33
Code editor 2 2,33
External code connection 3 1,66
Built-in random numbers
generators
2 3
Sum of score 18,32 14,31
Criteria priorities 0,56 0,44
Table 5: Simulation tools assessment, group
“Visualization”
Indicator Simulation tools
AnyLogic ExtendSim
Animation 2,33 3
Logical animation 2 3
Playback mode 3 1.66
3D Animation 1,66 2,33
Graphic library 1,66 1,66
Sum of score 10,65 11,65
Criteria priorities 0,48 0,52
Table 6: Simulation tools assessment, group
“Simulation”
Indicator Simulation tools
AnyLogic ExtendSim
Model execution speed 3 2.66
Simplification of
simulation process
2.33 2.66
Variety of simulation
approaches
2.66 2.33
Hardware requirements 2 2.66
Sum of score 9.99 10.31
Criteria priorities 0,49 0,51
Table 7: Assessment of ExtendSim and AnyLogic,
group “User support”
Indicator Simulation tools
AnyLogic ExtendSim
Documentation 2.33 2.66
Training courses 3 2
Users forum 2.33 1.33
Knowledge base 2 1.33
Demo models and
libraries
3 3
Sum of score 12.66 10.32
Criteria priorities 0.55 0.45
In the final step of the assessment process criteria
priorities are calculated using (1), (2) for each of the
simulation tools. The weights of relative importance of
the various local (group’s) criteria suggested by experts
are presented in Tab.8.
Table 8: The weights of group’s criteria
Group number, i Group title Weight, i
1 General 0,18
2 Programming
aspects
0,30
3 Visualization 0,16
4 Simulation 0,24
5 User support 0,12

The final results of tools assessment are presented in
Tab.9. They can be used for choosing simulation
package in a particular inventory problem solving. In
three groups the criteria weights of AnyLogic are
greater (from 8% till 12%) than the weights of
ExtendSim. In two groups the AnyLogic yields the
ExtendSim by 2-4 %. The global criteria for AnyLogic
is greater than global criteria for ExtendSim by 0,06.
Table 9: Evaluations of the vector of the global criteria
priorities for ExtendSim and AnyLogic
Group
number
Group
title
Simulation tools
AnyLogic ExtendSim
1 General 0,54 0,46
2 Programming
aspects
0,56 0,44
3 Visualization 0,48 0,52
4 Simulation 0,49 0.51
5 User support 0,55 0,45
Global criteria priorities 0,53 0,47
CONCLUSIONS
This article solves the issue of estimation and choosing
the simulating tools for inventory control system
modeling. To fulfill the evaluation of the simulating
tools, a two-level hierarchy system of criteria has been
developed. For investigation two simulation tools
ExtendSim 8 and AnyLogic 6.7 were chosen. The
assessment was made on the results of the inventory
control models implemented in chosen environments.
The results indicate the feasibility of the application of
ExtendSim 8 and AnyLogic 6.7 in inventory control
tasks. Further guidelines of the current research are the
following: to apply multiple-criteria decision analysis
methods for systems efficiency evaluation; to consider
the multi-product inventory control model with certain
constraints.
REFERENCES
Chopra, S. and P. Meindl. 2001. Supply Chain Management.
Prentice Hall, London.
Emrich, Sh.; S. Suslov and J. Florian. 2007. “Fully agent
based modellings of epidemic spread using AnyLogic”.
EUROSIM 2007, (Sept. 9-13). Ljubljana, Slovenia, 9-13.
Kopytov, E.; L.Greenglaz; A. Muravjov and E. Puzinkevich.
2007. “Modeling of Two Strategies in Inventory Control
System with Random Lead Time and Demand”.
Computer Modeling & New Technologies, Vol. 11(1),
Riga: Transport and Telecommunication Institute, 21-30.
Kopytov, E. and L. Greenglaz. 2004. “On a task of optimal
inventory control”. In Proceeding of XXIV International
Seminar on Stability Problems for Stochastic Models
(Jurmala, Sept. 9-17). Riga, TTI, 247-252.
Kopytov, E. and A. Muravjov. 2011. ”Simulation of inventory
inventory control system for supply chain “producer –
wholesaler – client” in ExtendSim environment”. In
Proceedings of the 25th European conference on
modeling simulation (ECMS-2011). (Krakow, June 3-4).
Poland, 580-586.
Krahl, D. 2007. “ExtendSim 7”. In Proceedings of the 39th
conference on Winter simulation: 40 years! (Dec. 09-12),
S.G. Henderson, B. Biller, M.-H. Hsieh, J. Shortle, J.D.
Tew and R.R. Barton (Eds.). Washington D.C., 226-232.
Magableh, G. M. and S. J. Mason. 2009. ”An integrated
supply chain model with dynamic flow and
replenishment requirements”. Journal of Simulation, Vol.
3, 84–94.
Marin, M.; Zhu, Y.; Andrade, L. Al.; Atencio, E.; Boya, C.
and C. Mendizabal. 2010. “Supply chain and hybrid
modeling: the Panama Canal operations and it’s salinity
diffusion”. In Proceedings of the 2010 Winter Simulation
Conference. (Dec. 5-8). American Technologika,
Orlando, FL, USA, 2023-2033.
Ross, S. 1992. Applied Probability Models with Optimization
Applications. Dover Publications, INC, New York.
Salamon, T. 2011. Design of Agent-Based Models:
Developing Computer Simulations for a Better
Understanding of Social Processes, Bruckner Publishing.
Seila, A.F.; V. Ceric and P. Tadikamalla. 2003. Applied
Simulation Modeling,Thomson Learning, Australia:
Thomson Learning.
Stewart, R. 2004. Simulation – The practice of model
development and use. Wiley.
Strickland, J. 2011. Discrete Event Simulation using
ExtendSim 8. Lulu.
Verma, R.; A.Gupta and K. Singh. 2009. “A critical evaluation
and comparison of four manufacturing simulation
software”. Kathmandu university journal of science,
Engineering and technology. Vol. 5(1), 104–120.
ACKNOWLEDGEMENTS
The article is written with the financial assistance of
European Social Fund. Project Nr.
2009/0159/1DP/1.1.2.1.2/09/IPIA/VIAA/006 (The
Support in Realisation of the Doctoral Programme
“Telematics and Logistics” of the Transport and
Telecommunication Institute).
AUTHOR BIOGRAPHIES
EUGENE A. KOPYTOV was born in
Lignica, Poland and went to the Riga Civil
Aviation Engineering Institute, where he
studied Computer Maintenance and obtained
his engineer diploma in 1971. Candidate of Technical
science degree (1984), Kiev Civil Aviation Engineering
Institute. Dr.sc.ing. (1992) and Dr.habil.sc.ing. (1997),
Riga Aviation University. Professor (1999). Present
position: Professor of Computer Science Department.
Member of International Telecommunication Academy.
Fields of research: statistical recognition and
classification, modeling and simulation, modern
database technologies. Publication: 270 scientific papers
and teaching books, 1 certificate of inventions.
AIVARS MURAVJOVS has graduated at
Transport and Telecommunication Institute
where he studied Computer Sciences and
obtained Master of Natural Sciences in
Computer Science in 2009. Present studying PhD
student in Telematics and Logistics. Present position:
Deputy Head of IT Department.