Embed Size (px)
Citation preview
Bachelor Thesis
COMMON MISSTATEMENTS IN THE FINANCIAL STATEMENTS
OF LATVIAN COMPANIES.
DO INVESTORS CONSIDER POSSIBLE FRAUD IN FINANCIAL
DATA THEY ANALYZE?
Author: Ģirts Tihomirovs Supervisor: Erki Usin
March 2007 Riga
Common Misstatements in the Financial Statements of Latvian Companies. Ģirts Tihomirovs Do Investors Consider Possible Fraud in Financial Data They Analyze?
Abstract The author of the bachelor thesis identifies common areas of misstatements in the financial statements of Latvian companies and fins out, whether investors consider the possibility of fraud in financial data they analyze. In the first part of the thesis, common areas of misstatements are identified by interviewing auditors. The differences on financial statement items between unaudited and audited financial statements of listed Latvian companies are analyzed to reveal areas, where misstatements and fraudulent data are discovered by auditors. The quantitative findings are compared to the interviews performed and previous researches. In the second part of the thesis, it is found out how investors use financial statements by analyzing responses to questionnaires. Event study methodology is applied to reveal, how investors react to the differences between unaudited and audited financial statements of listed Latvian companies. By analyzing abnormal returns around annual report announcement date, it is discovered, whether investors consider the risk of fraud, when using unaudited financial statements to make decisions. The findings allow drawing conclusions that most commonly, there are misstatements in financial statement items that require judgment to be exercised. Accrued expense, provisions for doubtful debt and inventory were among most frequently the items, where audit adjustments were made. Also, prepaid expense, accounts receivable and payable, and deferred tax liability were often subject to change after audit. It was found that assets were mostly overstated, while liabilities understated in the unaudited financial statements. Net profit was in more than half of reviewed cases revised, partly due to misstatements in the balance sheet items. Event study revealed no evidence that misstatement and fraud possibility in financial statements are considered by investors. However, it was found that investors react to changes, caused by auditing financial statements, if the differences affect the financial ratios they analyze.

Common Misstatements in the Financial Statements of Latvian Companies. Ģirts Tihomirovs Do Investors Consider Possible Fraud in Financial Data They Analyze?
Acknowledgements I would like to express gratitude to my bachelor thesis supervisor Erki Usin
for his valuable comments and guidance of the thesis writing process.
I would also like to thank Ernst&Young Baltics auditors Māris Būmanis,
Oskars Bilzonis, Armands Podoļskis and Juris Misters for the time spent on
answering my questions and sharing their experience.
Special thanks to Jānis Praņevičs, who shared his view on financial statement
analysis from investor’s point of view. Also, I would like to thank all the stock traders
and financial analysts, who completed the questionnaire, thus providing data for the
bachelor thesis.
Common Misstatements in the Financial Statements of Latvian Companies. Ģirts Tihomirovs Do Investors Consider Possible Fraud in Financial Data They Analyze?
Table of Contents
1. Introduction........................................................................................................... 6
1.1 Relevance of the Topic .................................................................................... 6
1.2 Structure of the Paper ...................................................................................... 7
2. Review of Literature.............................................................................................. 7
2.1 Fraud in Financial Statements .......................................................................... 7
2.2 Financial Analysis of Financial Statements ...................................................... 9
2.3 Investor Decisions based on Accounting Information..................................... 11
3. Methodology ....................................................................................................... 12
3.1 Identifying Common Fraud in Financial Statements....................................... 12
3.2 Identifying Investor Usage of Financial Statements........................................ 14
3.3 Consideration of Fraud: Event Study ............................................................. 15
4. Empirical Findings .............................................................................................. 19
4.1 Findings of Common Misstatements in Financial Statements......................... 19
4.1.1 Results from Interviews with Auditors .................................................... 19
4.1.2 Analysis of Audit Differences in Financial Statements ............................ 20
4.2 Use of Financial Statements as Revealed by Questionnaires........................... 24
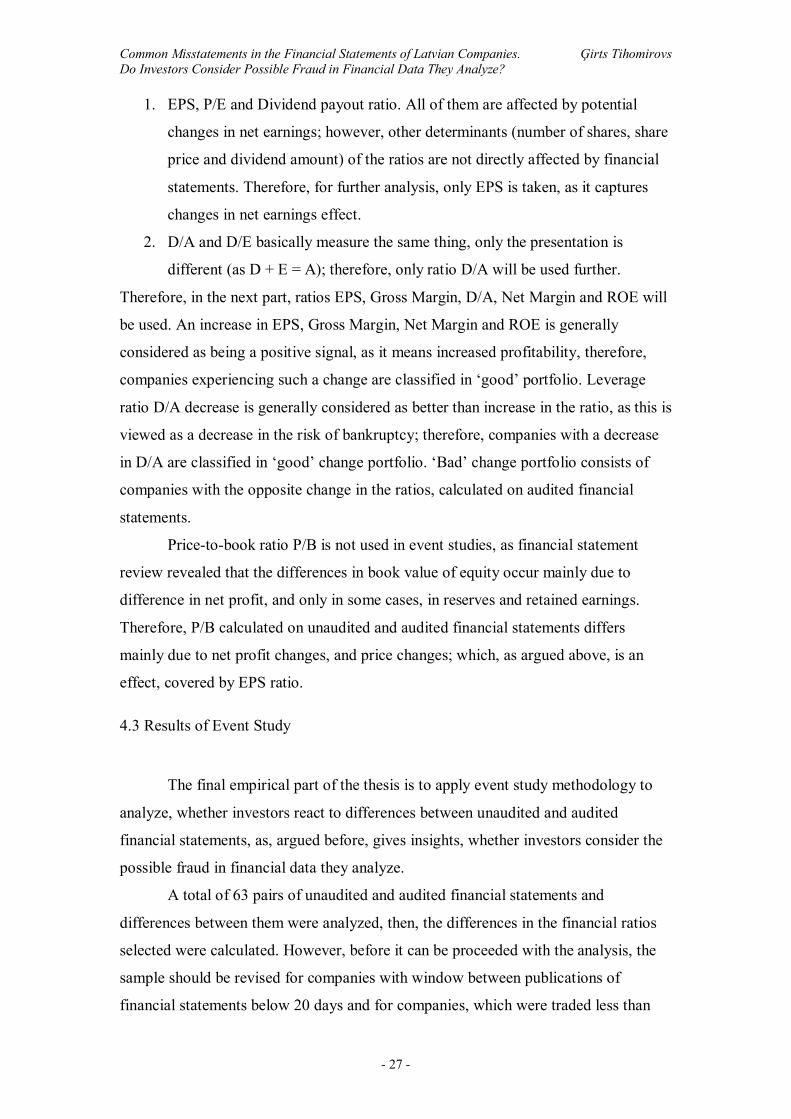
4.3 Results of Event Study................................................................................... 27
5. Conclusions......................................................................................................... 32
6. Suggestions for Further Research ........................................................................ 33
Works Cited ............................................................................................................ 35
Appendix 1.............................................................................................................. 37
Appendix 2.............................................................................................................. 38
Appendix 3.............................................................................................................. 41
Appendix 4.............................................................................................................. 42
Appendix 5.............................................................................................................. 43
Appendix 6.............................................................................................................. 44
Appendix 7.............................................................................................................. 45
Appendix 8.............................................................................................................. 46
Appendix 9.............................................................................................................. 48
Common Misstatements in the Financial Statements of Latvian Companies. Ģirts Tihomirovs Do Investors Consider Possible Fraud in Financial Data They Analyze?
- 5 -
Table of Figures Figure 1: Financial Ratio Usage (percentage) .......................................................... 26
Figure 2: CAR using EPS ratio ................................................................................ 29
Figure 3: CAR using Gross Margin ......................................................................... 30
Figure 4: CAR using D/A ratio ................................................................................ 31
Figure 5: CAR using Net Margin ratio..................................................................... 31
Figure 6: CAR using ROE ratio............................................................................... 32
Table 1: Differences in Profit and Loss statement .................................................... 21
Table 2: Differences in Assets ................................................................................. 22
Table 3: Differences in Equity................................................................................. 23
Table 4: Differences in Liabilities............................................................................ 24
Common Misstatements in the Financial Statements of Latvian Companies. Ģirts Tihomirovs Do Investors Consider Possible Fraud in Financial Data They Analyze?
- 6 -
1. Introduction Financial statement preparation in a company is usually done by internal
accountants, who are directly influenced by the management of the company. This
implies an inherent risk of management to be able to affect company’s financial
statements, causing misstatements or fraud in them. The users of financial statements
may make certain decisions, based on the information they get, so the fraud
possibility implies a risk for financial statements users to make wrong decisions.
The purpose of the paper is to identify most common areas of misstatements in
financial statements of Latvian companies, also describing the possible reasons of the
misstatements. Next, it will be found out how investors’ decisions are based upon
financial statements. Finally, it will be analyzed, whether the risk of fraudulent
financial statement usage is considered by investors.
Thus, two research question are raised:
What are the most common areas of misstatements in the financial statements
of Latvian companies?
Do investors consider the possibility of fraud in financial data they analyze?
The scope of this thesis is to identify fraud that is common in financial
statements of Latvian companies in general; this means that some details of industry
specific frauds are discussed, but that is not the aim of this paper. For the purposes of
the paper, fraud is defined as misstatement in financial statements, either deliberate or
unintentional. This is done because without litigation, it is not possible to distinguish
between the two; however, the author believes that not showing ‘true and fair view’ of
the company shall be considered as fraud. It must be noted that only reporting fraud is
analyzed, excluding such types of fraud as money laundering, embezzlement etc.
When considering investor reaction to financial statements and fraud considerations,
listed Latvian companies are used, as the methodology requires share price to be
known.
1.1 Relevance of the Topic
After the infamous case of Enron, when the management was accused of
committing fraud and Arthur Andersen was accused of hiding it, there has been
significant effort to improve fraud prevention and detection – most noticeably, the
Common Misstatements in the Financial Statements of Latvian Companies. Ģirts Tihomirovs Do Investors Consider Possible Fraud in Financial Data They Analyze?
- 7 -
standards on auditing were reviewed and improved. These global changes influenced
also Latvia, as international auditing companies, doing business in Latvia, use
standardized methodology all over the world. Therefore, it can be assumed that the
quality of audit and fraud detection procedures have improved in Latvia as well,
although no researches have been done in the field to find out the current situation.
Despite these improvements, significant risk of fraud still exists, if unaudited
financial statements are used, as nobody has reviewed the statements for fraud.
Although audit does not eliminate such risks completely, by auditing, much additional
assurance is provided to the users of financial statements. The topic of the thesis is
therefore relevant in the sense that the research might give an insight to the financial
statement users of what are common areas of fraud and how this fraud influences their
decision making.
1.2 Structure of the Paper
The structure of the paper is the following – first, review of literature and
researches done in the field is carried out. In this section, potential areas of fraud are
identified and a review of papers on financial reporting situation in Latvia is done.
Also, financial analysis of financial statements is described, and a review of
researches, showing relationship between accounting numbers and investor decisions,
is performed.
The thesis proceeds with the methodology section, which contains the
methods used, to find out what are the common areas of misstatements in financial
statements of Latvian companies and whether investors consider them, when making
decisions. Next, analysis of empirical findings is done, followed by conclusions of the
thesis.
2. Review of Literature
2.1 Fraud in Financial Statements
Financial statements of Latvian companies are prepared either using Latvian
Generally Accepted Accounting Principles (GAAP), defined by the Law on
Accounting and the Law on Financial Statements, or using International Financial
Common Misstatements in the Financial Statements of Latvian Companies. Ģirts Tihomirovs Do Investors Consider Possible Fraud in Financial Data They Analyze?
- 8 -
Reporting Standards (IFRS) and International Accounting Standards (IAS), issued by
the International Accounting Standards Board. These standards are not enforceable
together; therefore, companies choose one of them for reporting purposes.
According to Law on Financial Statements 4.3, financial statements ‘shall
present true and fair view on enterprise’s assets, liabilities, financial position, profit or
loss and cash flow.’
According to IAS 1.13, financial statements ‘shall present fairly the financial
position, financial performance and cash flows of an entity. Fair presentation requires
the faithful representation of the effects of transactions, other events and conditions in
accordance with the definitions and recognition criteria for assets, liabilities, income
and expenses set out in the Framework.’
Both of these standards basically state that financial statements shall be ‘true
and fair’; nevertheless, this is not always the case in financial reports. Frequently,
companies manipulate with accounting data to show a better financial position than it
actually is; this is called ‘window-dressing’. As Rees (1995) puts it, ‘Some managers
believe that firms can be shown in a better light by judicious choice of accounting
policies and by applying bias to the necessary estimation procedures’.
Rees (1995) also describes analysis of Smith and Hannah (1991), where the
latter classify the most common accounting manipulations into 11 categories:
1. Excessive provisions. Goodwill is overstated and not expensed, thereby
increasing profits
2. Extraordinary items. Significant reorganization/rationalisations costs
showed as extraordinary items
3. Off balance sheet finance. Loans not shown on balance sheet
4. Capitalised costs. Inappropriate capitalisation to reduce costs
5. Non-trading profits. Such profits classified as normal earnings figure
6. Brand accounting. Brands showed as intangible assets
7. Depreciation rate change. Reduction in depreciation policy to show growth
8. Pension fund holidays. Reduction in pension fund contribution shows larger
pre-tax profits
9. Earn-out commitments. Profit-sharing schemes to personnel
10. Foreign exchange mismatch. Mismatch between debts and deposits
11. Low tax charge. If low tax charge appears, profit manipulation probable
Common Misstatements in the Financial Statements of Latvian Companies. Ģirts Tihomirovs Do Investors Consider Possible Fraud in Financial Data They Analyze?
- 9 -
Although the research by Smith and Hannah (1991) is a bit outdated, as
accounting standards have changed, still, the conclusions they make are important –
many largest UK quoted firms have these ‘creative accounting’ procedures. They also
found that these procedures significantly affect important security market variables –
price/earnings ratio, annual abnormal return and beta.
Feroz et al (1992) analysed source of accounting misstatements according to
Securities and Exchange Comission’s (SEC) investigations and found that in most
cases, trade receivables were the source of misstatements, followed by inventories,
investments and long-term assets.
Concerning the accounting problems in Latvia, Silins (2003) has found that
companies in Latvia have problems in accounting of intangible assets, namely, the
distinction between capitalizeable costs and costs that should be directly expensed. He
used case studies of Latvian companies and interviews with auditors. Another study
by Sivare (2004) reveals that companies tend to avoid making proper provisions for
expenses that are hard to estimate, e.g. court cases, warranties. The empirical research
was based on reviewing financial statements of Latvian companies and interviews
with auditors.
These researches are in line with the paper by Gerety and Lehn ‘Causes and
Consequences of Accounting Fraud’ (1997) – they investigate cases of firms accused
of committing accounting fraud. First conclusion they draw concerns the causes of
fraud: they found that external factor - cost of valuing assets - significantly influences
choice of committing fraud. They used industry classification to identify cost of
valuing assets of a firm, and found positive relationship with fraud. Also, presence of
intangible assets positively affects choice of fraud, although this relationship is not
statistically significant. However, they found minimal influence on fraud from
internal factors, such as compensation schemes, corporate governance structures and
auditor reputation.
2.2 Financial Analysis of Financial Statements
The usage of financial statements depends on the user of them; if investors are
viewed, they usually perform financial analysis, based on financial statements.
White et al (2003) present ratio and financial analyses, used by users of
financial statements. Ratios can be classified in 5 groups (some examples of ratios
given).
Common Misstatements in the Financial Statements of Latvian Companies. Ģirts Tihomirovs Do Investors Consider Possible Fraud in Financial Data They Analyze?
- 10 -
Activity ratios. Analyses sustainability of operating activities.
Inventory Turnover = Cost of Goods Sold / Average Inventory
Receivable Turnover = Sales / Average Trade Receivables
Payables Turnover = Purchases / Average Trade Payables
Working Capital Turnover = Sales / Average Working Capital
Fixed Asset Turnover = Sales / Average Fixed Assets
Total Asset Turnover = Sales / Average Total Assets
Liquidity ratios. Analyses ability to meet obligations.
Current Ratio = Current Assets / Current Liabilities
Quick Ratio = Cash+Marketable Securities+Accounts Receivable /
Current Liabilities
Cash Ratio = Cash + Marketable Securities / Current Liabilities
Solvency ratios:
Debt to Assets = Total Debt / Total Assets
Debt to Equity = Total Debt / Total Equity
Debt to Equity (market adjusted) = Debt (book value) / Equity (market value)
Times Interest Earn (Coverage) = EBIT / Interest Expense
Profitability ratios. Analysis of profitability.
Gross Margin = Gross Profit / Sales
Pre-tax Margin = Earnings Before Tax (EBT) / Sales
Profit Margin = Net Income / Sales
Return on Assets = EBIT / Average Total Assets
Return on Equity = Pre-tax Income / Average Equity
Other valuation ratios. Used for securities valuation.
Earning per Share = Earnings Available for Common Shareholders /
Number of Shares
Price-to-Earnings Ratio = Market Value of Equity / Net Income
Dividend Payout Ratio = Dividends / Net Income
Price-to-Book Ratio = Market Value of Equity / Book Value of Equity
According White et al (2003), the latter – ratios for securities valuation – are widely
used by investors, as they link market and book values.
Another way of analyzing financial statements is to use Discounted Cash Flow
method, which involves discounting all estimated future cash flows to present time,
Common Misstatements in the Financial Statements of Latvian Companies. Ģirts Tihomirovs Do Investors Consider Possible Fraud in Financial Data They Analyze?
- 11 -
by using Weighted Average Costs of Capital, which is calculated, using required
returns on equity and debt and solvency ratios; this is also described by White et al
(2003).
2.3 Investor Decisions based on Accounting Information According Fama (1970) Efficient Market Hypothesis (EMH), there exist three
forms of market efficiency:
1. Weak form: market prices incorporate all information on historical prices
and returns. This means that technical analysis of historical prices and trends does not
allow earn abnormal profits. However, the use of other sources of information –
fundamental analysis of financial numbers – can be applied to earn abnormal profits.
2. Semi-strong form: all information on historical prices and returns, as well as
all publicly available information is already incorporated in market prices.
3. Strong form: all information, both publicly and privately available, is
incorporated in market prices, so there is no possibility to earn abnormal profits.
Therefore, according Fama (1970), using information available from financial
statements is feasible, if the form of market efficiency is not stronger than weak form.
Research by Kukins and Strupka (2004) comes to a conclusion that Baltic
markets are approaching weak-form efficiency. This means that historical prices are
incorporated in market prices of stocks; however, it says nothing about financial
statement information.
Martinuks and Stepanovs (2002) find that in Latvian stock market, quarterly
earnings announcements are reflected in stock price movements; however, they do not
influence number of shares traded. This finding means that the market reacts to
financial information, provided publicly, meaning, the market efficiency form is
definitely not strong.
Martinuks and Stepanovs (2002) use a model, originally used by Ball and
Brown (1968), when the latter applied event studies method to find out whether
earning announcements contain important information to investors. They measure the
deviation of announced from expected earnings and measured the relationship with
cumulative abnormal returns within a time window around the announcement date.
What Ball and Brown (1968) find is that firms with announced earnings higher than
expected earn abnormal returns over the window period.
Common Misstatements in the Financial Statements of Latvian Companies. Ģirts Tihomirovs Do Investors Consider Possible Fraud in Financial Data They Analyze?
- 12 -
MacKinlay (1997) researched and compiled different event study methods in
economics and finance, also by Ball and Brown (1968). What he finds is that
methods, used by Ball and Brown (1968) can be adjusted to analyze influence of any
kind of event on stock returns, and explains in detail, how it should be done. The steps
are: defining date event; defining time window around the event date; selecting
sample; calculating expected return and abnormal return thereafter; expected event
and deviation from it. Expected return can be calculated, either using mean return
over some estimation window, or return, compared to market return (by using
regression). Then, sample firms are classified, based on the deviation from the
expected event outcome. Cumulative abnormal returns are compared among the
classified groups to draw conclusion on the relationship between the event and the
returns.
Concerning fraud and stock prices, Gerety and Lehn (1997) find that when the
fraud is commenced, stock prices tend to increase; while on the announcement of
fraud accuse, stock prices significantly decrease. This means that the market is fooled
by the fraud, but later, when the fraud is detected, investors adjust their decisions.
This is found, using conventional event study method used by Ball and Brown (1968)
and described by MacKinlay (1997) – estimating cumulative abnormal returns around
a time window.
3. Methodology
3.1 Identifying Common Fraud in Financial Statements
If companies meet certain turnover, profit or number of employees criteria,
their financial statements must be audited by an independent auditor, as stated by the
law. Auditor’s task, on the other hand, is to provide opinion whether company’s
financial statements provide true and fair view of company in all material aspects.
Therefore, auditor’s prime task is to check, whether there are no material
misstatements or fraud in the financial statements, and give official opinion about
that.
In order to identify most common areas of fraud in financial statements of
Latvian companies, similar methods as in paper by Sivare (2004) will be used –
Common Misstatements in the Financial Statements of Latvian Companies. Ģirts Tihomirovs Do Investors Consider Possible Fraud in Financial Data They Analyze?
- 13 -
interviews with auditors and financial statement review. The choice of this
methodology is made due to several reasons.
Firstly, consulting representatives from companies, which commit fraud by
misstating financial figures, would probably not bring results needed. Neither the
management, nor accountants would be likely to respond to inquiries, as admitting
misstating accounting figures is a sensitive issue. On the other hand, the issue is not
sensitive to auditors, who have revealed the misstatements. Also, auditors have
experience with number of companies and different types of misstatements, so they
are potentially more valuable source of information. Nevertheless, due to
confidentiality issues, names of the companies are not disclosed by the auditors.
Semi-structured, open ended question interviews are performed with auditors.
The author has some prior knowledge in the field and is able to set the guidelines for
the interview, therefore, semi-structured interviews are done. Open ended questions
are used to obtain as much details as possible, also leaving possibility for examples.
Questions to be asked:
1. What are the main areas of misstatements in financial statements of Latvian
companies?
2. What are the most common misstatements in assets/equity/liabilities?
3. What is the cause for such misstatement?
4. Do you think the client intentionally misreports the results?
Interviews are carried out with 4 auditors – one manager level auditor (experience 7
years) and three senior level auditors (experience 3-4 years) from international
auditing company in Latvia “Ernst&Young Baltics”. This company was chosen due to
the fact it is the largest in Latvia in terms of turnover, which might be an indicator of
auditing the widest range of different companies. Although there is a possible bias
from interviewing auditors only from one auditing company, the author believes the
risk is mitigated by the fact that in Latvia, auditors are not specialized – they audit
companies from diverse industries. Next, the methodology applied in Big Four
auditing companies (Ernst&Young, PricewaterhouseCoopers, KPMG and Deloitte) is
fundamentally similar, so choosing another would not cause significantly different
results. Auditors from local auditing companies are not considered for interviews, as
typically they do not audit as wide representation of company types as leading
international companies, both in industry diversification and size. Also, auditors from
Common Misstatements in the Financial Statements of Latvian Companies. Ģirts Tihomirovs Do Investors Consider Possible Fraud in Financial Data They Analyze?
- 14 -
international auditing companies have more sophisticated methods than local auditors,
so they are more valuable source of information for the thesis.
Secondly, financial statements are reviewed. In order to identify misstatements
or fraud, the author looks at unaudited and audited financial statements and
differences between them. Although audited financial statements are not necessarily
fully free from misstatements and fraud, they are significantly more reliable than
unaudited, therefore, the adjustments made by the auditors are reviewed. The
differences are identified on the level of account classification, e.g. debtors, cash,
inventory, accounts payable etc.; the relative differences are taken to draw
conclusions on the magnitude of missatements. Afterwards, the differences are
analyzed to identify most common areas of misstatements. When these results are
compiled with the interviews with auditors, a more clear picture of reporting situation
in Latvia is found – which are the main areas, where unaudited financial statements
are misstated and/or contain fraudulent numbers.
Financial statements to be analyzed are obtained from Riga Stock Exchange,
as the rules of listing require submission of both unaudited and audited financial
statements. The author uses all financial statements available from the source, which
makes a sample of 63 pairs of unaudited and audited annual reports for period 2003-
2005.
Although the usage of listed companies for this purpose imposes a selection
bias, as listed companies are not necessarily a representative sample of all population,
there are very limited opportunities to obtain unaudited financial statements from not
listed companies. This limits the ability to generalize findings to all Latvian
companies; nevertheless, common areas of misstatements as found from interviews
with auditors still apply for the non-listed companies as well. As the final part, the
consideration of fraud by investors, also relies on listed companies, the results can be
compiled to draw meaningful and applicable conclusions.
3.2 Identifying Investor Usage of Financial Statements In order to identify, how investors use financial statements and whether they
consider fraud that is common in financial statements, structured, closed-end nominal
and ordinal scale type questionnaires (see Appendix 1) are provided to investors. Prior
to compiling the questionnaire, a professional financial analyst of an asset
management company is consulted, so the questions asked cover all required
Common Misstatements in the Financial Statements of Latvian Companies. Ģirts Tihomirovs Do Investors Consider Possible Fraud in Financial Data They Analyze?
- 15 -
information, as well as possible answers are known. Ordinal scale is used for answers,
as the degree of respondents approval is important for some questions; for others,
nominal type used. Concerning ratios, they are not further explained, based on the
assumption that if a person uses a ratio, he/she does not need an explanation of what it
is. Another reason for closed-end questionnaires is that relatively large number of
investors are interviewed. Although the precise number can not be known beforehand,
the author expects to receive about 40 answers. From them, approximately one third is
expected to be financial analysts in asset management companies, while the remaining
- private investors. Financial analysts are indirectly contacted through professional
networking; they are from largest asset management companies. Private investors are
selected from users of internet portals, delegated to trading of shares
(www.wallstreet.lv, www.lhv.lv). An online survey is created, to ease collection and
coding of responses.
The results of the questionnaires are coded and analyzed, using statistical
analysis – discovering mean of scaled answers, and percentage of respondents for
nominal scaled answers. Conclusion about investor reliance on unaudited, and thus
potentially fraudulent data, is drawn; also, the types of financial analyses applied by
investors are found.
3.3 Consideration of Fraud: Event Study
In order to find out, whether investors consider possible fraud in financial
statements, event study methodology is applied. The method used is pioneered by Ball
and Brown (1968) and reviewed by MacKinlay (1997).
Investor consideration of fraud is found out by identifying their reaction to
publications of audited financial statements; namely, how do investors react to
differences or absence of differences between unaudited and audited financial
statements. If there are no audit differences (i.e. unaudited and audited are the same)
and on the publication of audited financial statement there are positive abnormal
returns, investors do consider possibility of misstatements in financial statements.
This is because when they observe audited statements, they increase their confidence
in the accounting numbers and react. On the other hand, if there are no differences in
statements and there are no abnormal returns, investors do not consider fraud in
financial statements, when making decisions.
Common Misstatements in the Financial Statements of Latvian Companies. Ģirts Tihomirovs Do Investors Consider Possible Fraud in Financial Data They Analyze?
- 16 -
The publication of the audited statement is an event, which has a definite date
– a prerequisite to use the methodology selected. The sample is all listed companies
(official, second and free list) and all years, for which they have both unaudited and
audited financial statements. This makes a sample of 63 observations over period
2003-2005. However, stocks that were traded less than 90% of trading days should be
omitted, as including them would create a noise in the model. Also, stocks of
companies, which publish their financial statements with less than 20 days between
the dates should be omitted, as, firstly, it would be impossible to distinguish the
reaction to unaudited and audited financial statements. Secondly, if publication of
audited financial statements almost instantly follows the publication of unaudited
financial statements, it is very likely that the latter were already audited, but the audit
opinion was added only to annual reports.
The time window around the event date is set to half of the shortest time in the
sample between publication of unaudited and audited financial statements. This is
done so that window around event date (audited reports) for one company does not
overlap with window around unaudited report, as that would cause distortion in
abnormal returns, as described above. As the stocks with less than 20 days are
eliminated from the event study, time window is set to 10 days.
All stocks will be classified, according to changes in financial ratios due to
changes in financial report items. Expected item is taken from unaudited financial
statements, as financial statements users generally expect them to be correct. On the
event date, when audited financial statements are provided, there might be a change
compared to unaudited financial statements due to identified misstatements or fraud.
Based on these changes, all stocks will be divided into three categories – ‘good’
difference (e.g. increase in Net Margin), ‘no change’; and ‘bad’ difference (e.g.
decrease in Gross Margin; decrease in Net Margin). The stocks will be classified into
abovementioned three categories, according to most popular financial ratios, as
revealed by questionnaires with investors. In such a way, the author is able to later
indirectly identify, to which differences investors react more, and which financial
statement positions investors do not consider fraud in.
Expected return is calculated, using market model, meaning, the estimated
return is connected with the market return and is estimated, using OLS regression:
( 1 ) RK = αK + βK(Rm) + uK

Common Misstatements in the Financial Statements of Latvian Companies. Ģirts Tihomirovs Do Investors Consider Possible Fraud in Financial Data They Analyze?
- 17 -
where RK is the return of a stock k on a certain day, Rm is return of market on the
same day, which is approximated to Riga Stock Exchange index OMXR. uK is the
error term.
The use of market model is justified by reviewing the literature, mentioned
above. Firstly, the researches this thesis partly basis the methodology on, used market
model – Ball and Brown (1968), MacKinlay (1997). Secondly, MacKinlay (1997)
found that market model is substantial improvement over unconditional mean model
in estimating expected return. He also found that factor models, such as APT, adds
little explanatory power, if the companies are not similar i.e. not from the same
industry. As the companies, listed in Riga Stock Exchange, are from diverse
industries, market model is used.
It should be noted that this regression is done for every stock every year it had
unaudited and audited statements, on a period of 120 days starting 150 days before
unaudited statement publishing. Estimation window must be set so that it does not
include effects of unaudited statement publishing, which is the basis of expectation
formation; therefore, estimation started 30 days before. More than 120 days
estimation window not reasonable, as that would mean more than 150 days before
unaudited financial statements and would cause the risk of including effects of half
year report publication. Although such estimation window includes the effects of
quarterly report publications, setting an estimation window large enough that does not
include them is not possible. The estimation to be more precise, as large window as
possible must be made, so the amount of 120 days selected.
Later on, when calculating abnormal returns for a stock, αK and βK are used for
estimation:
( 2 ) ARK = RK – αK – βK (Rm)
ARK is abnormal profit, when the stock’s k return is RK, and estimation of expected
return yielded αK + βK (Rm). Rm, as stated above, is index OMXR.
For the time windows around event dates, abnormal returns for all the stocks
in a portfolio are calculated for each day and summed up. Cumulative Abnormal
Returns (CAR) of portfolios are calculated, accumulating the abnormal returns of
each day from the first event window day; see equation (3).
Common Misstatements in the Financial Statements of Latvian Companies. Ģirts Tihomirovs Do Investors Consider Possible Fraud in Financial Data They Analyze?
- 18 -
( 3 ) CART = ∑ ART
As stated above, if there are no changes between audited and unaudited
statements, and there are no abnormal returns, then the conclusion is that investors do
not consider fraud in unaudited statements, when making decisions. However, if there
are abnormal returns in ‘no change’ group, investors do consider.
As in event classification by comparing the outcome to expected, stocks are
classified to groups according many financial ratios, the author is able to identify the
areas of misstatements that investor are more sensitive to.
Concerning the statistical significance testing of the results, the author is not
performing statistical significance testing, due to following reasons. MacKinlay
(1997) presents a statistical test with an assumption that no clustering exists, meaning,
event windows do not overlap. However, this assumption does not hold in the sample
used for the thesis. Two solutions are provided by MacKinlay (1997) – aggregating
stocks in portfolios according event date or using data without aggregation. The first
solution can not be applied due to relatively small sample size – aggregating stocks in
portfolios according date and then classifying according ‘good’, ‘no change’ and
‘bad’ portfolios would cause results to be less reliable and less applicable, as there
would be large number of portfolios, consisting of small number of stocks.
The second solution – using data without aggregation – according MacKinlay
(1997), has a major drawback - the test often has little power. As the sample size is
relatively small in the thesis, it is believed that applying this test would very likely
have little power. Considering the alternatives, the author believes that none of the
tests can be applied, as they are either incompatible with the methodological setup, or
will add little value to the research. As MacKinlay (1997) has reviewed common
event study methodology applied by different researchers, and the author himself has
found no other applicable statistical tests, a decision not to use statistical testing is
made.
Common Misstatements in the Financial Statements of Latvian Companies. Ģirts Tihomirovs Do Investors Consider Possible Fraud in Financial Data They Analyze?
- 19 -
4. Empirical Findings
4.1 Findings of Common Misstatements in Financial Statements In this section, a summary of findings of common misstatements in financial
statements are presented.
4.1.1 Results from Interviews with Auditors
From the interviews with auditors (see list on Appendix 3), it was found that
there are certain areas in financial statements of Latvian companies, that are more
often misstated then others. Mainly, these are areas, which involve judgments to be
exercised. Usually, assets are more subjected to judgmental issues, although some
liabilities need estimations as well.
On the asset side, impairment of Fixed assets and Goodwill is often times
subject to audit adjustments. Impairment is done, to analyze, whether the investment
is recoverable in the future; it involves an estimation of future cash flows, generated
from Fixed assets or Goodwill. Such estimations can be done very subjectively (for
instance, estimating growth of cash flows above objective amounts), in such a way
not showing true and fair value of financial position. Such types of misstatements are
usually not because of fraudulent intentions, but because of subjective opinions on the
issue. Similarly, fair value determination is an area, commonly misstated. Fair value
most often is applied to financial investments and investment properties; however,
valuing at fair value, revaluation reserves are made, thus increasing also the passive
side of the balance sheet.
Construction in progress is one of the items, which are more likely to be
subject to fraud – inappropriate recognition timing is applied to construction in
progress. In case of a company, providing a good or service over a long period of time
and with estimations involved in the completion rate, this also affects profit and loss
statement – more revenues from contracts are commonly recognized than actually
have been performed. This is an issue, for instance, in construction companies, as well
as various service providing companies, auditing being one of them.
Common Misstatements in the Financial Statements of Latvian Companies. Ģirts Tihomirovs Do Investors Consider Possible Fraud in Financial Data They Analyze?
- 20 -
In current assets, inventory is often misstated; usually, due to inadequate
levels of provision for damaged, obsolete or slow-moving stock. According the
auditors, these are also misstatements due to subjectivity of the accountants.
Most common problem in Accounts receivable is that there are not enough
provisions made for doubtful debtors; usually, there are debts outstanding for too long
to be recognized as fully recoverable. Companies tend to avoid making sufficient
provisions; these are types of misstatements are more likely done on purpose, to show
better short term liquidity.
On the liability side, accrued expenses are common to be misstated. These are
often for litigation, environmental issues, accruals for guarantees, accrual for bonuses.
Sometimes accrued expense for untaken vacation is not calculated correctly; however,
the risk of such technical errors is little in publicly traded companies, as stated by
auditors.
Main concern in profit and loss statement is that companies often times fraud
with revenue recognition, as well as timing of revenues. Concerning recognition, one
of the issues is Incoterm application; another issue is that some companies recognize
full amount of sales, although have issued some kind of after-sales service to
customer, which should be accrued already at the moment of sales. Another problem,
concerning the timing, is known as improper income or expense cut-off. This is
crucial at the financial year end, when typically, companies try to recognize next
year’s revenues already this year, while postponing the expenses.
Main causes for deliberate misstatements or fraud in financial statements of
Latvian companies, according auditors interviewed, are bonus systems, based on
financial performance; meeting loan covenants; income smoothing (typical for
banks); increase company value before selling. These causes mentioned by auditors
are not specific for Latvian companies only – they are prevalent in the whole world.
Misstatements not due to deliberate fraud often occur because of changes in
legislation – accountants are not aware of the new standards.
4.1.2 Analysis of Audit Differences in Financial Statements
Analyzing the differences between unaudited and audited financial statements
reveal results, which generally coincide with auditors’ opinion.
The sample consists of 63 pairs of unaudited and audited financial statements;
a detailed summary with publication dates is in Appendix 4. Data from each of the
Common Misstatements in the Financial Statements of Latvian Companies. Ģirts Tihomirovs Do Investors Consider Possible Fraud in Financial Data They Analyze?
- 21 -
126 financial statements is input in a spreadsheet, according predefined form,
observable in Appendix 5. The differences between unaudited and audited financial
statements are summarized, according the magnitude of the change: more than 1%,
5% and 10%. As the minimum change, 1% threshold is taken, as the author believes a
smaller change is not considered to be a relevant change. In the summary, the number
of companies, with difference greater then the aforementioned threshold is presented.
Also, depending on the sign of the change, it is identified, how many cases of
understatement and overstatement were present.
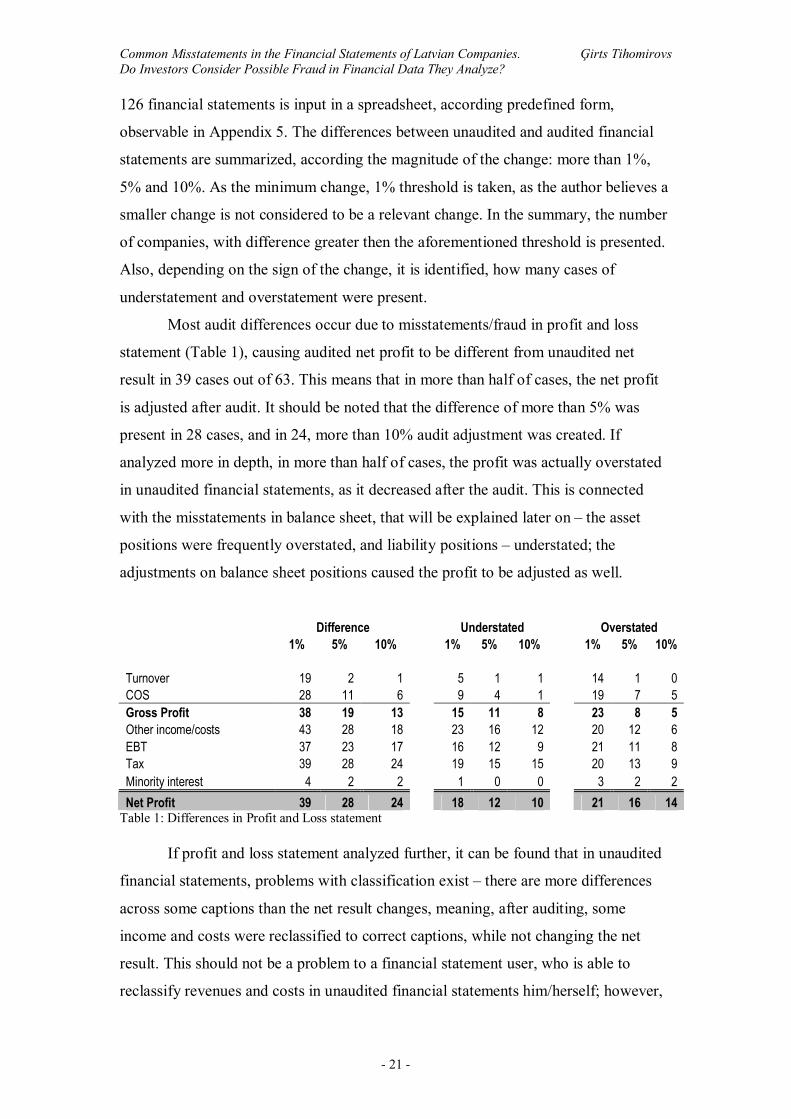
Most audit differences occur due to misstatements/fraud in profit and loss
statement (Table 1), causing audited net profit to be different from unaudited net
result in 39 cases out of 63. This means that in more than half of cases, the net profit
is adjusted after audit. It should be noted that the difference of more than 5% was
present in 28 cases, and in 24, more than 10% audit adjustment was created. If
analyzed more in depth, in more than half of cases, the profit was actually overstated
in unaudited financial statements, as it decreased after the audit. This is connected
with the misstatements in balance sheet, that will be explained later on – the asset
positions were frequently overstated, and liability positions – understated; the
adjustments on balance sheet positions caused the profit to be adjusted as well.
Difference Understated Overstated 1% 5% 10% 1% 5% 10% 1% 5% 10% Turnover 19 2 1 5 1 1 14 1 0 COS 28 11 6 9 4 1 19 7 5 Gross Profit 38 19 13 15 11 8 23 8 5 Other income/costs 43 28 18 23 16 12 20 12 6 EBT 37 23 17 16 12 9 21 11 8 Tax 39 28 24 19 15 15 20 13 9 Minority interest 4 2 2 1 0 0 3 2 2 Net Profit 39 28 24 18 12 10 21 16 14
Table 1: Differences in Profit and Loss statement If profit and loss statement analyzed further, it can be found that in unaudited
financial statements, problems with classification exist – there are more differences
across some captions than the net result changes, meaning, after auditing, some
income and costs were reclassified to correct captions, while not changing the net
result. This should not be a problem to a financial statement user, who is able to
reclassify revenues and costs in unaudited financial statements him/herself; however,
Common Misstatements in the Financial Statements of Latvian Companies. Ģirts Tihomirovs Do Investors Consider Possible Fraud in Financial Data They Analyze?
- 22 -
if figures are taken as is, the user might get wrong impression of financial situation in
the company.
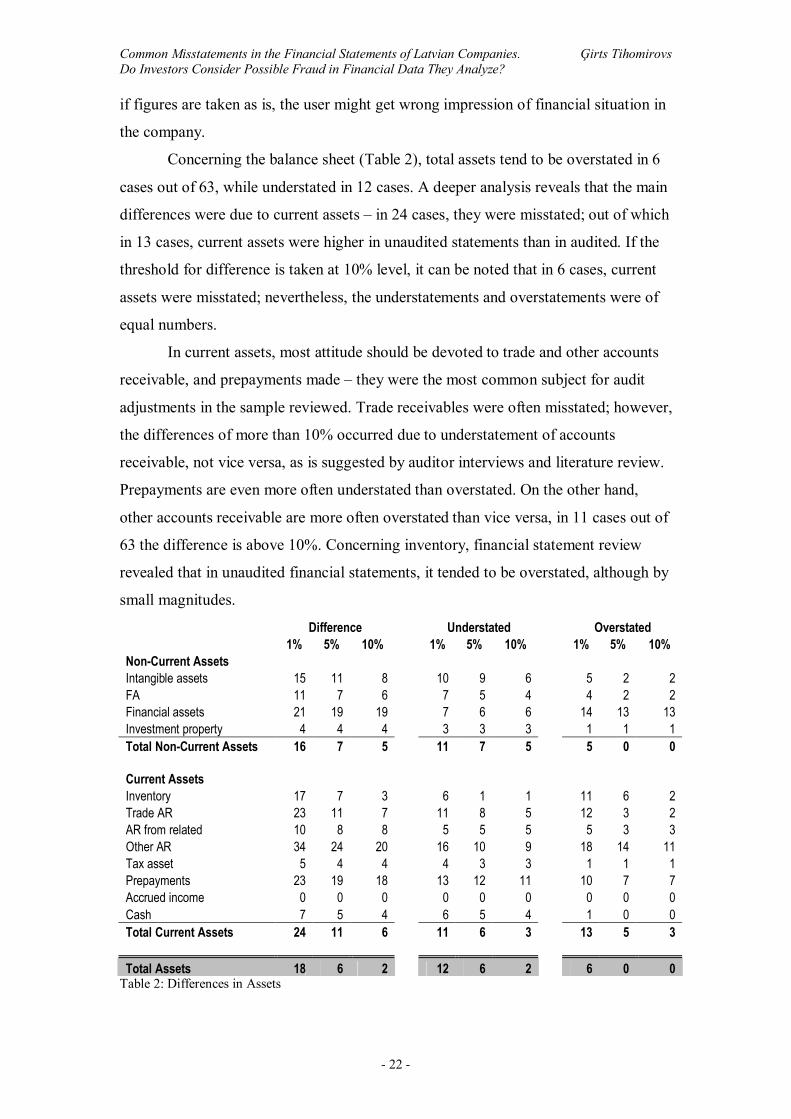
Concerning the balance sheet (Table 2), total assets tend to be overstated in 6
cases out of 63, while understated in 12 cases. A deeper analysis reveals that the main
differences were due to current assets – in 24 cases, they were misstated; out of which
in 13 cases, current assets were higher in unaudited statements than in audited. If the
threshold for difference is taken at 10% level, it can be noted that in 6 cases, current
assets were misstated; nevertheless, the understatements and overstatements were of
equal numbers.
In current assets, most attitude should be devoted to trade and other accounts
receivable, and prepayments made – they were the most common subject for audit
adjustments in the sample reviewed. Trade receivables were often misstated; however,
the differences of more than 10% occurred due to understatement of accounts
receivable, not vice versa, as is suggested by auditor interviews and literature review.
Prepayments are even more often understated than overstated. On the other hand,
other accounts receivable are more often overstated than vice versa, in 11 cases out of
63 the difference is above 10%. Concerning inventory, financial statement review
revealed that in unaudited financial statements, it tended to be overstated, although by
small magnitudes.
Difference Understated Overstated 1% 5% 10% 1% 5% 10% 1% 5% 10% Non-Current Assets Intangible assets 15 11 8 10 9 6 5 2 2 FA 11 7 6 7 5 4 4 2 2 Financial assets 21 19 19 7 6 6 14 13 13 Investment property 4 4 4 3 3 3 1 1 1 Total Non-Current Assets 16 7 5 11 7 5 5 0 0 Current Assets Inventory 17 7 3 6 1 1 11 6 2 Trade AR 23 11 7 11 8 5 12 3 2 AR from related 10 8 8 5 5 5 5 3 3 Other AR 34 24 20 16 10 9 18 14 11 Tax asset 5 4 4 4 3 3 1 1 1 Prepayments 23 19 18 13 12 11 10 7 7 Accrued income 0 0 0 0 0 0 0 0 0 Cash 7 5 4 6 5 4 1 0 0 Total Current Assets 24 11 6 11 6 3 13 5 3 Total Assets 18 6 2 12 6 2 6 0 0
Table 2: Differences in Assets
Common Misstatements in the Financial Statements of Latvian Companies. Ģirts Tihomirovs Do Investors Consider Possible Fraud in Financial Data They Analyze?
- 23 -
Financial statement analysis revealed that companies do have problems with
intangible asset and financial asset accounting. In six cases, intangible assets in
audited financial statements increased than 10%. This is in line with Silins (2003)
main findings – companies have problems with accounting for intangible assets,
namely, identifying capitalizeable costs. In non-current assets, financial assets were
the most misstated caption – in 21 cases, it was wrongly reported, out of which, in 14
cases, financial assets were represented of higher value than should be, as revealed by
audit. It should be noted that in 13 of the cases, the overstatement was by more than
10%.
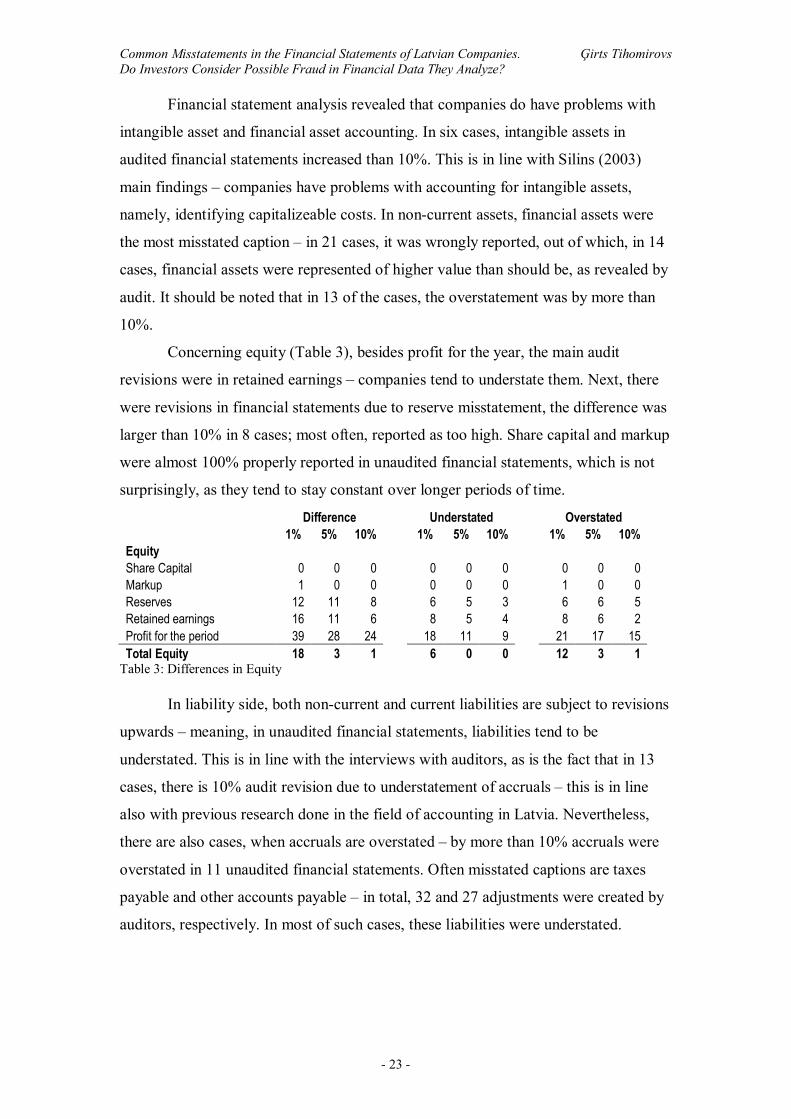
Concerning equity (Table 3), besides profit for the year, the main audit
revisions were in retained earnings – companies tend to understate them. Next, there
were revisions in financial statements due to reserve misstatement, the difference was
larger than 10% in 8 cases; most often, reported as too high. Share capital and markup
were almost 100% properly reported in unaudited financial statements, which is not
surprisingly, as they tend to stay constant over longer periods of time.
Difference Understated Overstated 1% 5% 10% 1% 5% 10% 1% 5% 10% Equity Share Capital 0 0 0 0 0 0 0 0 0 Markup 1 0 0 0 0 0 1 0 0 Reserves 12 11 8 6 5 3 6 6 5 Retained earnings 16 11 6 8 5 4 8 6 2 Profit for the period 39 28 24 18 11 9 21 17 15 Total Equity 18 3 1 6 0 0 12 3 1
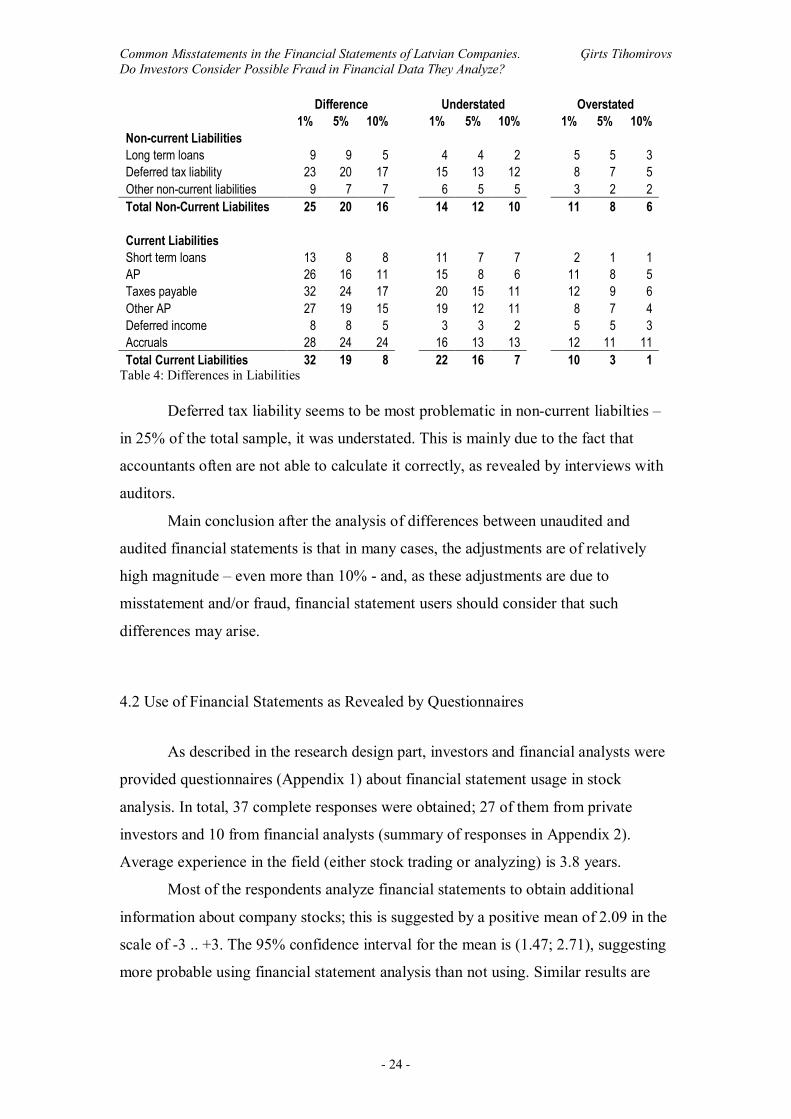
Table 3: Differences in Equity In liability side, both non-current and current liabilities are subject to revisions
upwards – meaning, in unaudited financial statements, liabilities tend to be
understated. This is in line with the interviews with auditors, as is the fact that in 13
cases, there is 10% audit revision due to understatement of accruals – this is in line
also with previous research done in the field of accounting in Latvia. Nevertheless,
there are also cases, when accruals are overstated – by more than 10% accruals were
overstated in 11 unaudited financial statements. Often misstated captions are taxes
payable and other accounts payable – in total, 32 and 27 adjustments were created by
auditors, respectively. In most of such cases, these liabilities were understated.
Common Misstatements in the Financial Statements of Latvian Companies. Ģirts Tihomirovs Do Investors Consider Possible Fraud in Financial Data They Analyze?
- 24 -
Difference Understated Overstated 1% 5% 10% 1% 5% 10% 1% 5% 10% Non-current Liabilities Long term loans 9 9 5 4 4 2 5 5 3 Deferred tax liability 23 20 17 15 13 12 8 7 5 Other non-current liabilities 9 7 7 6 5 5 3 2 2 Total Non-Current Liabilites 25 20 16 14 12 10 11 8 6 Current Liabilities Short term loans 13 8 8 11 7 7 2 1 1 AP 26 16 11 15 8 6 11 8 5 Taxes payable 32 24 17 20 15 11 12 9 6 Other AP 27 19 15 19 12 11 8 7 4 Deferred income 8 8 5 3 3 2 5 5 3 Accruals 28 24 24 16 13 13 12 11 11 Total Current Liabilities 32 19 8 22 16 7 10 3 1
Table 4: Differences in Liabilities Deferred tax liability seems to be most problematic in non-current liabilties –
in 25% of the total sample, it was understated. This is mainly due to the fact that
accountants often are not able to calculate it correctly, as revealed by interviews with
auditors.
Main conclusion after the analysis of differences between unaudited and
audited financial statements is that in many cases, the adjustments are of relatively
high magnitude – even more than 10% - and, as these adjustments are due to
misstatement and/or fraud, financial statement users should consider that such
differences may arise.
4.2 Use of Financial Statements as Revealed by Questionnaires
As described in the research design part, investors and financial analysts were
provided questionnaires (Appendix 1) about financial statement usage in stock
analysis. In total, 37 complete responses were obtained; 27 of them from private
investors and 10 from financial analysts (summary of responses in Appendix 2).
Average experience in the field (either stock trading or analyzing) is 3.8 years.
Most of the respondents analyze financial statements to obtain additional
information about company stocks; this is suggested by a positive mean of 2.09 in the
scale of -3 .. +3. The 95% confidence interval for the mean is (1.47; 2.71), suggesting
more probable using financial statement analysis than not using. Similar results are
Common Misstatements in the Financial Statements of Latvian Companies. Ģirts Tihomirovs Do Investors Consider Possible Fraud in Financial Data They Analyze?
- 25 -
obtained, concerning financial ratio application in analysis – mean for using financial
ratios is 1.34 ± 0.78 for 95% confidence interval.
Responds show that Discounted Cash Flow method and CAPM model are less
popular among investors and financial analysts – both resulted negative means of -
1.16 and -1.72 respectively, which at 5% significance level are below zero.
Respondents claim that they use the newest financial information available
(mean 1.69 ± 0.74 for 95% C.I.) and that they compare it to previous available
information (mean 1.69 ± 0.70 for 95% C.I.).
Concerning the use of unaudited financial statements, a clear approving of the
statement is observed – mean 1.63 with 95% C.I. of (0.93;2.32) suggests that the
respondents do use unaudited financial statements, when performing analytics and
developing their investment decisions.
When asked about consideration of possible misstatement or fraud in financial
statements, the answers were more evenly distributed, forming a positive mean of
0.66; and due to standard error, the true mean lies between 0.02 and +1.30 with 95%
confidence. This suggests that there is evidence of consideration of fraud or
misstatements in financial statements, and the result is statistically significant at 5%
significance level.
Summarizing the results above, investors and financial analysts do use
financial statements to obtain information about company stocks; most often, they use
financial ratios in their analysis. Results show that newest available financial
information is used, even if it is not audited. The results show evidence of
consideration of fraud in financial statements that is barely significant; however, the
answers to previous questions about unaudited financial information usage suggest
that it is not very likely to be true, as possibly misstated and fraudulent data are used.
What is also important, it is claimed that the newest available financial
information is compared to previous; suggesting that if audited financial statements
are available, they are compared to unaudited. This confirms the view of the author
that there should be reaction to audited financial statements, if they are different from
unaudited ones, as in such case, investors and analysts should revisit their decisions,
based on the newest information.
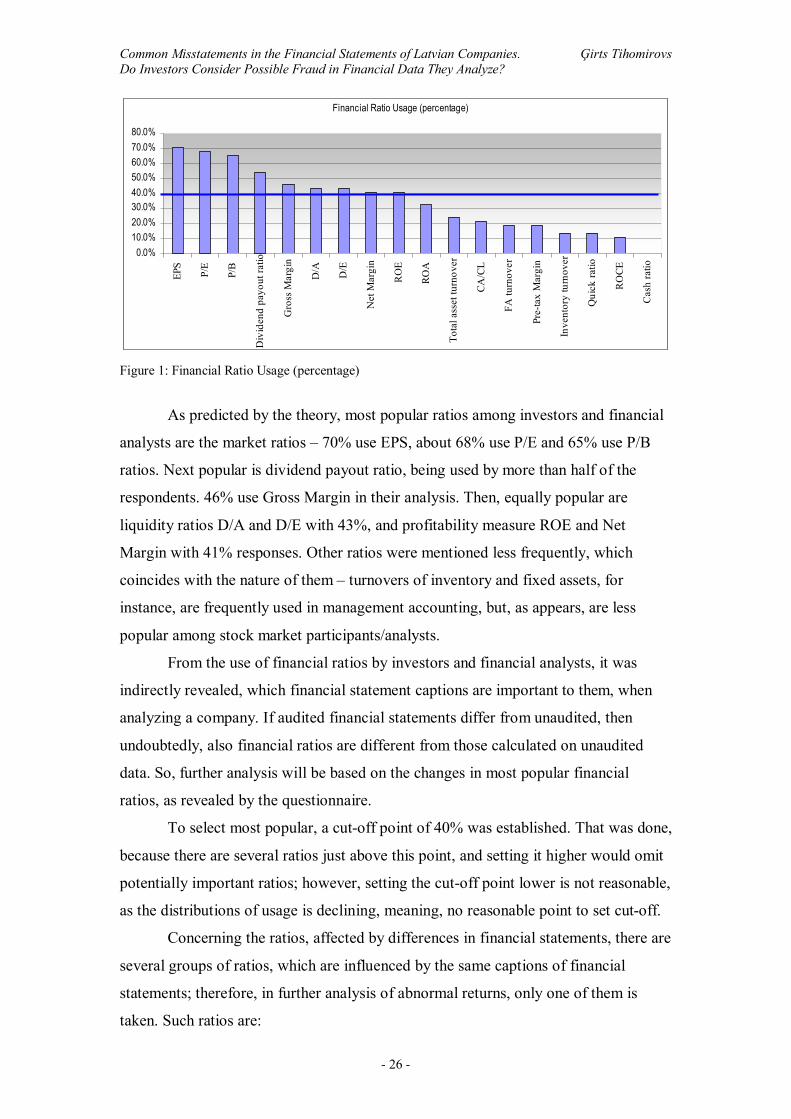
Concerning the use of financial ratios in the analysis of financial statements, a
summary of ratio usage in percentage is presented in Figure 1.
Common Misstatements in the Financial Statements of Latvian Companies. Ģirts Tihomirovs Do Investors Consider Possible Fraud in Financial Data They Analyze?
- 26 -
Financial Ratio Usage (percentage)
0.0%10.0%20.0%30.0%40.0%50.0%60.0%70.0%80.0%
EPS
P/E
P/B
Div
iden
d pa
yout
ratio
Gro
ss M
argi
n
D/A D/E
Net
Mar
gin
RO
E
ROA
Tota
l ass
et tu
rnov
er
CA/C
L
FA tu
rnov
er
Pre-
tax
Mar
gin
Inve
ntor
y tu
rnov
er
Qui
ck ra
tio
RO
CE
Cas
h ra
tio
Figure 1: Financial Ratio Usage (percentage)
As predicted by the theory, most popular ratios among investors and financial
analysts are the market ratios – 70% use EPS, about 68% use P/E and 65% use P/B
ratios. Next popular is dividend payout ratio, being used by more than half of the
respondents. 46% use Gross Margin in their analysis. Then, equally popular are
liquidity ratios D/A and D/E with 43%, and profitability measure ROE and Net
Margin with 41% responses. Other ratios were mentioned less frequently, which
coincides with the nature of them – turnovers of inventory and fixed assets, for
instance, are frequently used in management accounting, but, as appears, are less
popular among stock market participants/analysts.
From the use of financial ratios by investors and financial analysts, it was
indirectly revealed, which financial statement captions are important to them, when
analyzing a company. If audited financial statements differ from unaudited, then
undoubtedly, also financial ratios are different from those calculated on unaudited
data. So, further analysis will be based on the changes in most popular financial
ratios, as revealed by the questionnaire.
To select most popular, a cut-off point of 40% was established. That was done,
because there are several ratios just above this point, and setting it higher would omit
potentially important ratios; however, setting the cut-off point lower is not reasonable,
as the distributions of usage is declining, meaning, no reasonable point to set cut-off.
Concerning the ratios, affected by differences in financial statements, there are
several groups of ratios, which are influenced by the same captions of financial
statements; therefore, in further analysis of abnormal returns, only one of them is
taken. Such ratios are:
Common Misstatements in the Financial Statements of Latvian Companies. Ģirts Tihomirovs Do Investors Consider Possible Fraud in Financial Data They Analyze?
- 27 -
1. EPS, P/E and Dividend payout ratio. All of them are affected by potential
changes in net earnings; however, other determinants (number of shares, share
price and dividend amount) of the ratios are not directly affected by financial
statements. Therefore, for further analysis, only EPS is taken, as it captures
changes in net earnings effect.
2. D/A and D/E basically measure the same thing, only the presentation is
different (as D + E = A); therefore, only ratio D/A will be used further.
Therefore, in the next part, ratios EPS, Gross Margin, D/A, Net Margin and ROE will
be used. An increase in EPS, Gross Margin, Net Margin and ROE is generally
considered as being a positive signal, as it means increased profitability, therefore,
companies experiencing such a change are classified in ‘good’ portfolio. Leverage
ratio D/A decrease is generally considered as better than increase in the ratio, as this is
viewed as a decrease in the risk of bankruptcy; therefore, companies with a decrease
in D/A are classified in ‘good’ change portfolio. ‘Bad’ change portfolio consists of
companies with the opposite change in the ratios, calculated on audited financial
statements.
Price-to-book ratio P/B is not used in event studies, as financial statement
review revealed that the differences in book value of equity occur mainly due to
difference in net profit, and only in some cases, in reserves and retained earnings.
Therefore, P/B calculated on unaudited and audited financial statements differs
mainly due to net profit changes, and price changes; which, as argued above, is an
effect, covered by EPS ratio.
4.3 Results of Event Study
The final empirical part of the thesis is to apply event study methodology to
analyze, whether investors react to differences between unaudited and audited
financial statements, as, argued before, gives insights, whether investors consider the
possible fraud in financial data they analyze.
A total of 63 pairs of unaudited and audited financial statements and
differences between them were analyzed, then, the differences in the financial ratios
selected were calculated. However, before it can be proceeded with the analysis, the
sample should be revised for companies with window between publications of
financial statements below 20 days and for companies, which were traded less than
Common Misstatements in the Financial Statements of Latvian Companies. Ģirts Tihomirovs Do Investors Consider Possible Fraud in Financial Data They Analyze?
- 28 -
10% in the estimation period. A summary of results for this filter (Appendix 6)
reveals that 21 of the initial sample should be omitted, to obtain more reliable results.
This leaves a sample size of 42 to be used in the event study (Appendix 7).
These 42 pairs of unaudited and audited financial statements were grouped in
three categories – ‘good’, ‘no change’ and ‘bad’ – based on financial ratio differences
that arise due to differences in unaudited and audited financial statements. Financial
ratios used, as mentioned above, were EPS, P/B, Gross Margin, D/A, Net Margin and
ROE. Summary of classification can be observed in Appendix 8.
As described in the methodology, Cumulative Abnormal Returns (CAR) are
calculated, by classifying the stocks according the difference in financial ratios,
caused by auditing. Summary of calculations available in Appendix 9.
The main task of this event study was to identify the reaction of investors, as
indicated by CAR, to differences or absence of differences in financial ratio they
analyze.
Firstly, a general tendency can be observed in CAR calculations for ‘no
change’ portfolio across all five ratios – the CAR for this portfolio is negative. Not
only at the last day of the event window the CAR is negative; it is negative for ‘no
change’ portfolio for almost all periods, and there can be observed no tendency of
Abnormal Returns (AR) upwards on the day of and after the day of publication of
audited results. This means there is no positive investor reaction to the fact that
audited financial statements are the same as unaudited financial statements, which, in
turn, means, there is no evidence that audit adds value to the investors. A conclusion
can be drawn that investors do not consider the possible fraud in unaudited financial
statements; if they did, they would value the decrease of fraud risk by increasing
demand for audited company’s stocks, thus increasing price and AR of the stock.
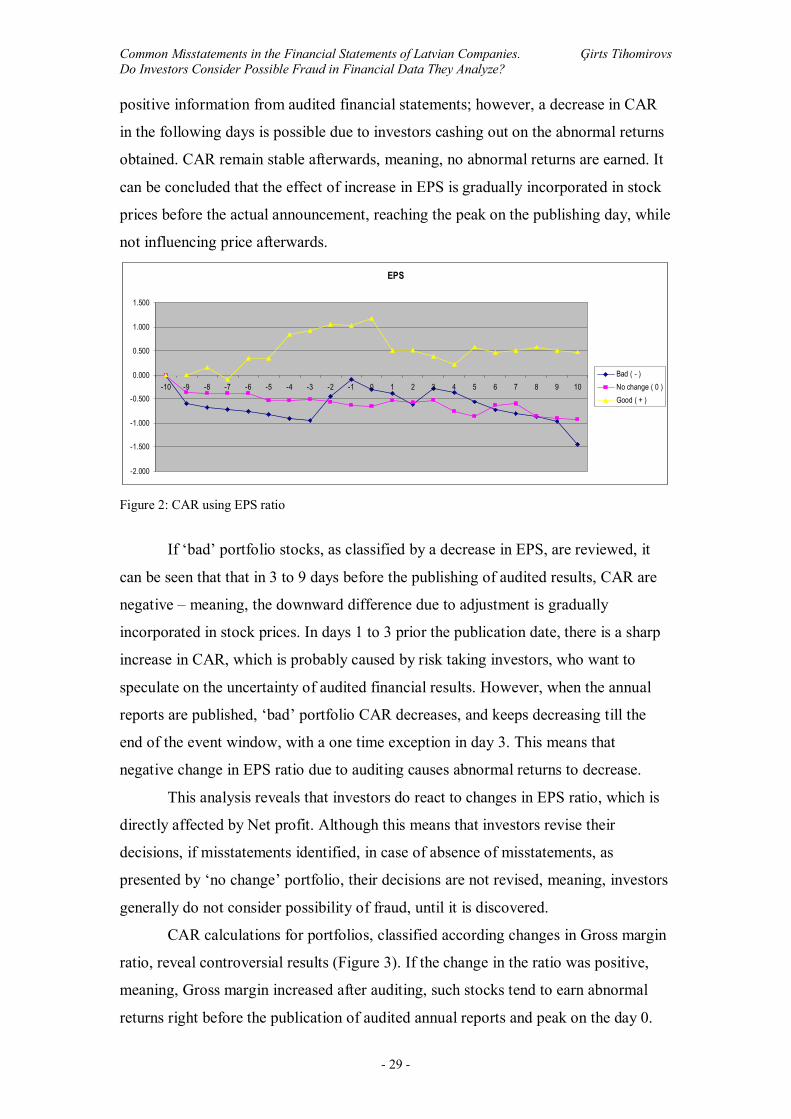
Concerning CAR calculations for differences in individual ratios, if Earnings
per share (EPS) is viewed (Figure 2), several issues can be identified. Firstly, if the
ratio, calculated on audited statements, increased, compared to unaudited financial
statements, ‘good’ change portfolio CAR shows the reaction of such an event. It can
be observed that 7 days prior the publishing of audited annual reports, CAR increases
– this suggests that positive increase in EPS might already be incorporated in the price
of a stock before the actual publishing day. This can possibly occur due to insider
trading – executing deals, using privately held information. On the day of
announcement, CAR reaches the maximum, suggesting investors quickly react to
Common Misstatements in the Financial Statements of Latvian Companies. Ģirts Tihomirovs Do Investors Consider Possible Fraud in Financial Data They Analyze?
- 29 -
positive information from audited financial statements; however, a decrease in CAR
in the following days is possible due to investors cashing out on the abnormal returns
obtained. CAR remain stable afterwards, meaning, no abnormal returns are earned. It
can be concluded that the effect of increase in EPS is gradually incorporated in stock
prices before the actual announcement, reaching the peak on the publishing day, while
not influencing price afterwards.
EPS
-2.000
-1.500
-1.000
-0.500
0.000
0.500
1.000
1.500
-10 -9 -8 -7 -6 -5 -4 -3 -2 -1 0 1 2 3 4 5 6 7 8 9 10Bad ( - )No change ( 0 )Good ( + )
Figure 2: CAR using EPS ratio
If ‘bad’ portfolio stocks, as classified by a decrease in EPS, are reviewed, it
can be seen that that in 3 to 9 days before the publishing of audited results, CAR are
negative – meaning, the downward difference due to adjustment is gradually
incorporated in stock prices. In days 1 to 3 prior the publication date, there is a sharp
increase in CAR, which is probably caused by risk taking investors, who want to
speculate on the uncertainty of audited financial results. However, when the annual
reports are published, ‘bad’ portfolio CAR decreases, and keeps decreasing till the
end of the event window, with a one time exception in day 3. This means that
negative change in EPS ratio due to auditing causes abnormal returns to decrease.
This analysis reveals that investors do react to changes in EPS ratio, which is
directly affected by Net profit. Although this means that investors revise their
decisions, if misstatements identified, in case of absence of misstatements, as
presented by ‘no change’ portfolio, their decisions are not revised, meaning, investors
generally do not consider possibility of fraud, until it is discovered.
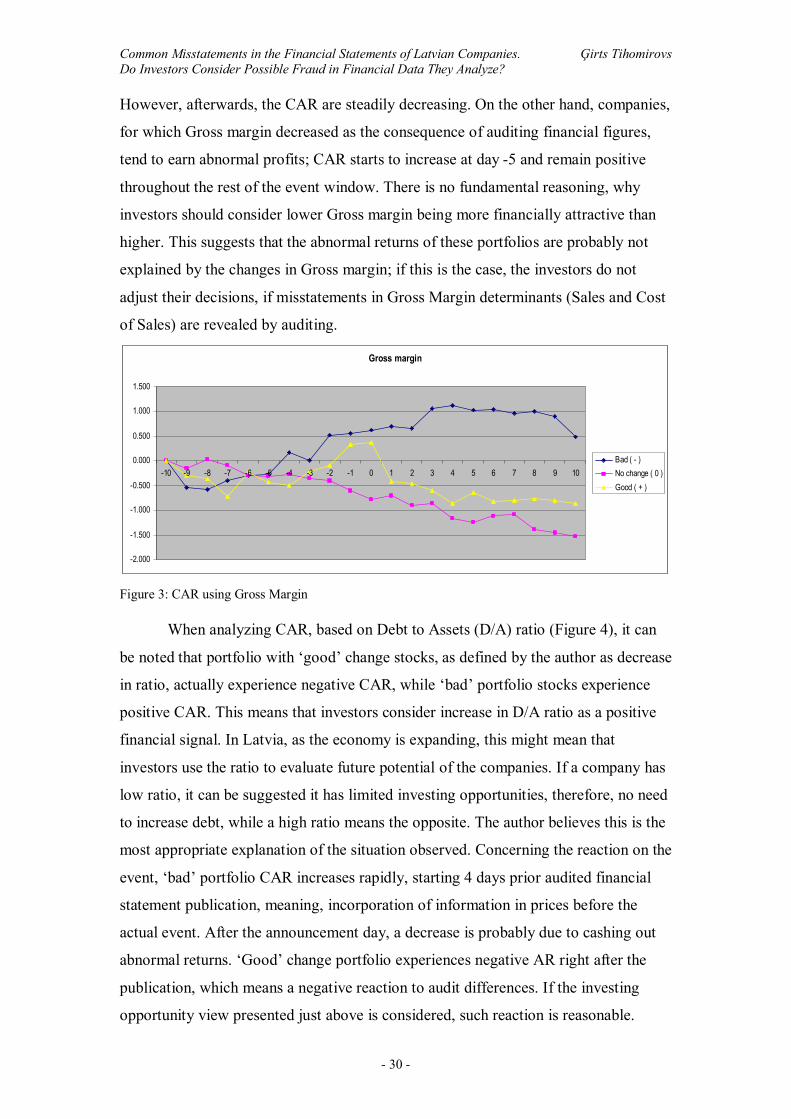
CAR calculations for portfolios, classified according changes in Gross margin
ratio, reveal controversial results (Figure 3). If the change in the ratio was positive,
meaning, Gross margin increased after auditing, such stocks tend to earn abnormal
returns right before the publication of audited annual reports and peak on the day 0.
Common Misstatements in the Financial Statements of Latvian Companies. Ģirts Tihomirovs Do Investors Consider Possible Fraud in Financial Data They Analyze?
- 30 -
However, afterwards, the CAR are steadily decreasing. On the other hand, companies,
for which Gross margin decreased as the consequence of auditing financial figures,
tend to earn abnormal profits; CAR starts to increase at day -5 and remain positive
throughout the rest of the event window. There is no fundamental reasoning, why
investors should consider lower Gross margin being more financially attractive than
higher. This suggests that the abnormal returns of these portfolios are probably not
explained by the changes in Gross margin; if this is the case, the investors do not
adjust their decisions, if misstatements in Gross Margin determinants (Sales and Cost
of Sales) are revealed by auditing.
Gross margin
-2.000
-1.500
-1.000
-0.500
0.000
0.500
1.000
1.500
-10 -9 -8 -7 -6 -5 -4 -3 -2 -1 0 1 2 3 4 5 6 7 8 9 10Bad ( - )No change ( 0 )Good ( + )
Figure 3: CAR using Gross Margin When analyzing CAR, based on Debt to Assets (D/A) ratio (Figure 4), it can
be noted that portfolio with ‘good’ change stocks, as defined by the author as decrease
in ratio, actually experience negative CAR, while ‘bad’ portfolio stocks experience
positive CAR. This means that investors consider increase in D/A ratio as a positive
financial signal. In Latvia, as the economy is expanding, this might mean that
investors use the ratio to evaluate future potential of the companies. If a company has
low ratio, it can be suggested it has limited investing opportunities, therefore, no need
to increase debt, while a high ratio means the opposite. The author believes this is the
most appropriate explanation of the situation observed. Concerning the reaction on the
event, ‘bad’ portfolio CAR increases rapidly, starting 4 days prior audited financial
statement publication, meaning, incorporation of information in prices before the
actual event. After the announcement day, a decrease is probably due to cashing out
abnormal returns. ‘Good’ change portfolio experiences negative AR right after the
publication, which means a negative reaction to audit differences. If the investing
opportunity view presented just above is considered, such reaction is reasonable.
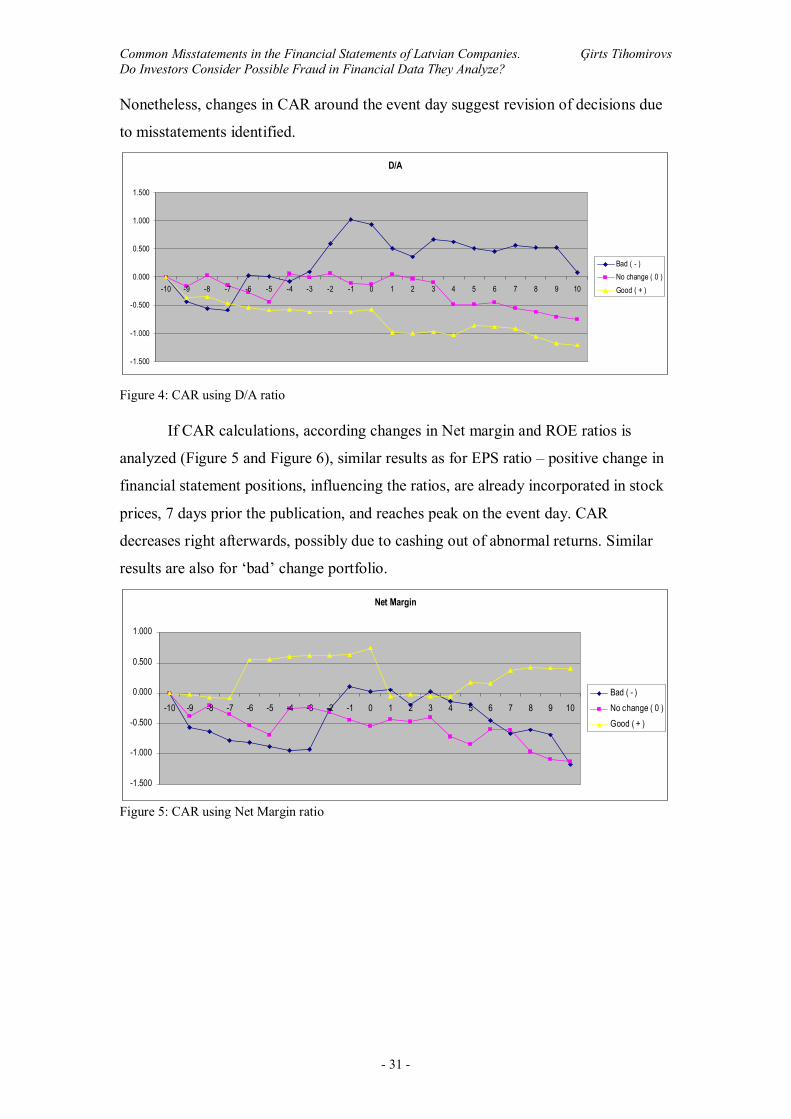
Common Misstatements in the Financial Statements of Latvian Companies. Ģirts Tihomirovs Do Investors Consider Possible Fraud in Financial Data They Analyze?
- 31 -
Nonetheless, changes in CAR around the event day suggest revision of decisions due
to misstatements identified.
D/A
-1.500
-1.000
-0.500
0.000
0.500
1.000
1.500
-10 -9 -8 -7 -6 -5 -4 -3 -2 -1 0 1 2 3 4 5 6 7 8 9 10
Bad ( - )No change ( 0 )Good ( + )
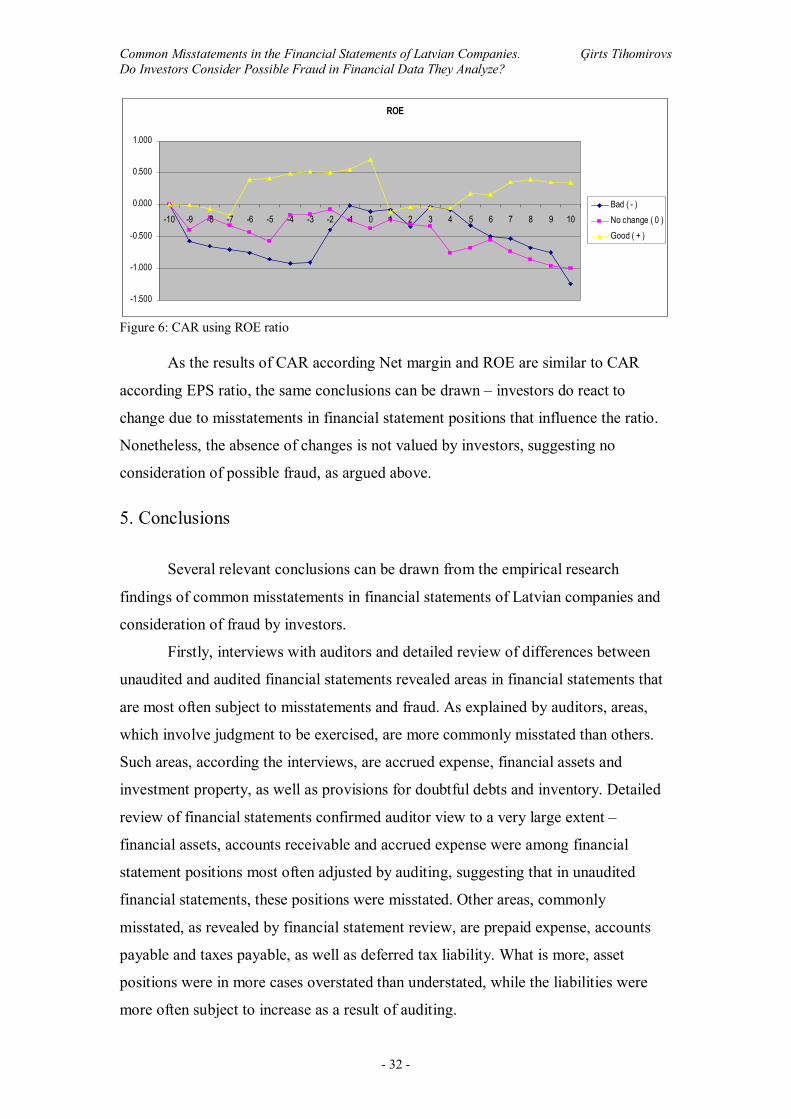
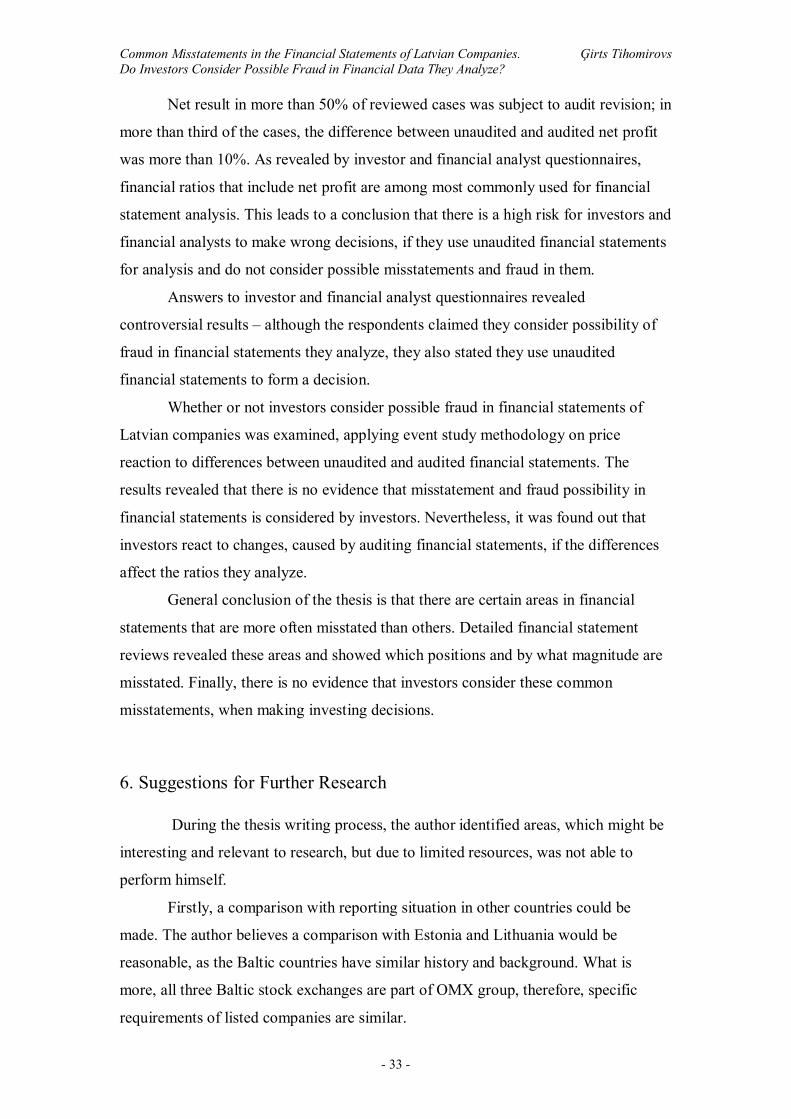
Figure 4: CAR using D/A ratio If CAR calculations, according changes in Net margin and ROE ratios is
analyzed (Figure 5 and Figure 6), similar results as for EPS ratio – positive change in
financial statement positions, influencing the ratios, are already incorporated in stock
prices, 7 days prior the publication, and reaches peak on the event day. CAR
decreases right afterwards, possibly due to cashing out of abnormal returns. Similar
results are also for ‘bad’ change portfolio.
Net Margin
-1.500
-1.000
-0.500
0.000
0.500
1.000
-10 -9 -8 -7 -6 -5 -4 -3 -2 -1 0 1 2 3 4 5 6 7 8 9 10Bad ( - )No change ( 0 )Good ( + )
Figure 5: CAR using Net Margin ratio
Common Misstatements in the Financial Statements of Latvian Companies. Ģirts Tihomirovs Do Investors Consider Possible Fraud in Financial Data They Analyze?
- 32 -
ROE
-1.500
-1.000
-0.500
0.000
0.500
1.000
-10 -9 -8 -7 -6 -5 -4 -3 -2 -1 0 1 2 3 4 5 6 7 8 9 10Bad ( - )No change ( 0 )Good ( + )
Figure 6: CAR using ROE ratio As the results of CAR according Net margin and ROE are similar to CAR
according EPS ratio, the same conclusions can be drawn – investors do react to
change due to misstatements in financial statement positions that influence the ratio.
Nonetheless, the absence of changes is not valued by investors, suggesting no
consideration of possible fraud, as argued above.
5. Conclusions
Several relevant conclusions can be drawn from the empirical research
findings of common misstatements in financial statements of Latvian companies and
consideration of fraud by investors.
Firstly, interviews with auditors and detailed review of differences between
unaudited and audited financial statements revealed areas in financial statements that
are most often subject to misstatements and fraud. As explained by auditors, areas,
which involve judgment to be exercised, are more commonly misstated than others.
Such areas, according the interviews, are accrued expense, financial assets and
investment property, as well as provisions for doubtful debts and inventory. Detailed
review of financial statements confirmed auditor view to a very large extent –
financial assets, accounts receivable and accrued expense were among financial
statement positions most often adjusted by auditing, suggesting that in unaudited
financial statements, these positions were misstated. Other areas, commonly
misstated, as revealed by financial statement review, are prepaid expense, accounts
payable and taxes payable, as well as deferred tax liability. What is more, asset
positions were in more cases overstated than understated, while the liabilities were
more often subject to increase as a result of auditing.
Common Misstatements in the Financial Statements of Latvian Companies. Ģirts Tihomirovs Do Investors Consider Possible Fraud in Financial Data They Analyze?
- 33 -
Net result in more than 50% of reviewed cases was subject to audit revision; in
more than third of the cases, the difference between unaudited and audited net profit
was more than 10%. As revealed by investor and financial analyst questionnaires,
financial ratios that include net profit are among most commonly used for financial
statement analysis. This leads to a conclusion that there is a high risk for investors and
financial analysts to make wrong decisions, if they use unaudited financial statements
for analysis and do not consider possible misstatements and fraud in them.
Answers to investor and financial analyst questionnaires revealed
controversial results – although the respondents claimed they consider possibility of
fraud in financial statements they analyze, they also stated they use unaudited
financial statements to form a decision.
Whether or not investors consider possible fraud in financial statements of
Latvian companies was examined, applying event study methodology on price
reaction to differences between unaudited and audited financial statements. The
results revealed that there is no evidence that misstatement and fraud possibility in
financial statements is considered by investors. Nevertheless, it was found out that
investors react to changes, caused by auditing financial statements, if the differences
affect the ratios they analyze.
General conclusion of the thesis is that there are certain areas in financial
statements that are more often misstated than others. Detailed financial statement
reviews revealed these areas and showed which positions and by what magnitude are
misstated. Finally, there is no evidence that investors consider these common
misstatements, when making investing decisions.
6. Suggestions for Further Research During the thesis writing process, the author identified areas, which might be
interesting and relevant to research, but due to limited resources, was not able to
perform himself.
Firstly, a comparison with reporting situation in other countries could be
made. The author believes a comparison with Estonia and Lithuania would be
reasonable, as the Baltic countries have similar history and background. What is
more, all three Baltic stock exchanges are part of OMX group, therefore, specific
requirements of listed companies are similar.

Common Misstatements in the Financial Statements of Latvian Companies. Ģirts Tihomirovs Do Investors Consider Possible Fraud in Financial Data They Analyze?
- 34 -
Secondly, analyzing differences between unaudited and audited financial
statements in profit and loss statement in a more detailed way would allow drawing
conclusions on the positions, which are more often misstated than others. This would
also explain the most common misstatements in net profit.
Common Misstatements in the Financial Statements of Latvian Companies. Ģirts Tihomirovs Do Investors Consider Possible Fraud in Financial Data They Analyze?
- 35 -
Works Cited
Ball, Ray, Philip Brown. An Empirical Evaluation of Accounting Income Numbers.
Journal of Accounting Research Vol. 6, 159-178, Autumn 1968
Fama, E. F. Efficient Capital Markets: a Review of Theory and Empirical Work.
Journal of Finance, 383-417, 1970
Feroz, E., K. Park and V. Pastena The Financial and Market Effects of the SEC’s
Accounting and Auditing Enforcement Releases. Journal of Accounting Research,
107-148, 1992
Gerety, Mason, Kenneth Lehn. The Causes and Consequences of Accounting Fraud.
Managerial and Decision Economics Vol. 18, 587-599, Dec 1997
International Accounting Standards. International Accounting Standards Board, 16
Feb 2007 <http://www.iasb.org/>
Kukins, Jevgenijs, Voldemars Strupka. Applicability of Filter Rules as a Tool of
Technical Analysis in Assessing Weak-form Stock Market Efficiency of the Baltic
States. Riga: Stockholm School of Economics in Riga, 2004
MacKinlay, A.Craig. Event Studies in Economics and Finance. Journal of Economic
Literature Vol. 35, 13-39, Mar 1997
Martinuks, Ernests, Timofejs Stepanovs. The Information Content of the Quarterly
Earnings Announcements at Riga Stock Exchange Riga: Stockholm School of
Economics in Riga, 2002
Law on Financial Statements (Gada pārskatu likums). Commercial Register of
Republic of Latvia, 16 Feb 2007 <http://www.ur.gov.lv/>
Rees, Bill. Financial Analysis. Harlow, Eng.: Prentice Hall Europe, 1995
Common Misstatements in the Financial Statements of Latvian Companies. Ģirts Tihomirovs Do Investors Consider Possible Fraud in Financial Data They Analyze?
- 36 -
Riga Stock Exchange, 16 Feb 2007 <http://www.lv.omxgroup.com/>
Silins, Ivars. Problems of Accounting of Intangible Assets in Latvia: Comparison
between Latvian GAAP and IAS. Riga: Stockholm School of Economics in Riga,
2003
Sivare, Linda. A Study of Accounting for Provisions in Latvian Companies. Riga:
Stockholm School of Economics in Riga, 2004
Smith, T., Hannah. Accounting for Growth. UK: UBS Phillips and Drew, 1991
White, Gerald I. et al. The Analysis and Use of Financial Statements. Hoboken:
Wiley, 2003

Common Misstatements in the Financial Statements of Latvian Companies. Ģirts Tihomirovs Do Investors Consider Possible Fraud in Financial Data They Analyze?
- 37 -
Appendix 1.
Questionnaire to private investors and financial analysts
You are (please select one, most applicable):
Private investor (You trade stocks)
Financial analyst (You perform analysis, but do not trade)
How many years have you been trading stocks/ performing analytics?
(For the next questions, please rank your answer from -3 (strongly disagree) to 3
(strongly agree))
Do you analyze financial statements, to acquire information about company stocks?
-3 -2 -1 0 1 2 3
Do you use financial ratio analysis?
-3 -2 -1 0 1 2 3
Do you use discounted cash flow method?
-3 -2 -1 0 1 2 3
Do you use the newest financial information available?
-3 -2 -1 0 1 2 3
Do you compare newest financial statements to previous?
-3 -2 -1 0 1 2 3
Do you use unaudited financial statements, when performing analytics?
-3 -2 -1 0 1 2 3
Are you applying CAPM, when performing analytics?
-3 -2 -1 0 1 2 3
Do you consider possible misstatement/fraud in financial statements, when
performing analytics?
-3 -2 -1 0 1 2 3
(Please, select the financial ratios you use (if any))
ROE Gross Margin D/A Quick ratio EPS Dividend payout ratio
ROA Net Margin D/E Cash ratio P/E Inventory turnover
ROCE Pre-tax Margin CA/CL FA turnover P/B Total asset turnover
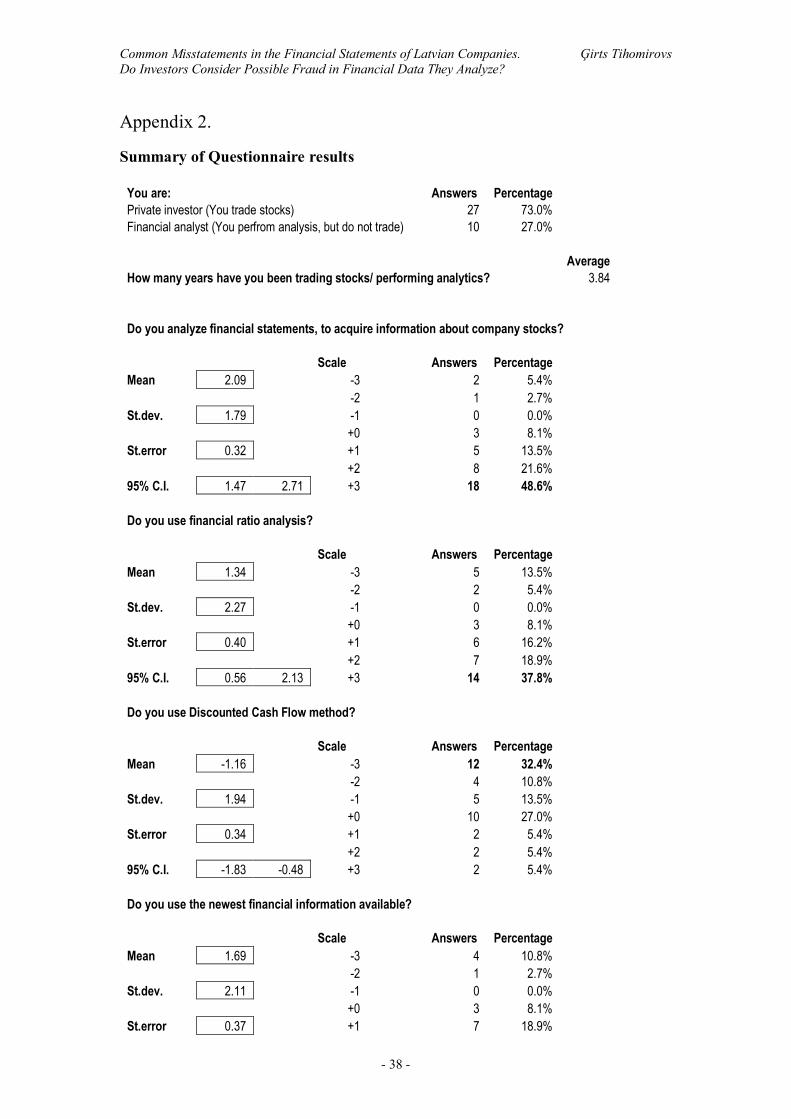
Common Misstatements in the Financial Statements of Latvian Companies. Ģirts Tihomirovs Do Investors Consider Possible Fraud in Financial Data They Analyze?
- 38 -
Appendix 2.
Summary of Questionnaire results
You are: Answers Percentage Private investor (You trade stocks) 27 73.0% Financial analyst (You perfrom analysis, but do not trade) 10 27.0% Average How many years have you been trading stocks/ performing analytics? 3.84 Do you analyze financial statements, to acquire information about company stocks? Scale Answers Percentage Mean 2.09 -3 2 5.4% -2 1 2.7% St.dev. 1.79 -1 0 0.0% +0 3 8.1% St.error 0.32 +1 5 13.5% +2 8 21.6% 95% C.I. 1.47 2.71 +3 18 48.6% Do you use financial ratio analysis? Scale Answers Percentage Mean 1.34 -3 5 13.5% -2 2 5.4% St.dev. 2.27 -1 0 0.0% +0 3 8.1% St.error 0.40 +1 6 16.2% +2 7 18.9% 95% C.I. 0.56 2.13 +3 14 37.8% Do you use Discounted Cash Flow method? Scale Answers Percentage Mean -1.16 -3 12 32.4% -2 4 10.8% St.dev. 1.94 -1 5 13.5% +0 10 27.0% St.error 0.34 +1 2 5.4% +2 2 5.4% 95% C.I. -1.83 -0.48 +3 2 5.4% Do you use the newest financial information available? Scale Answers Percentage Mean 1.69 -3 4 10.8% -2 1 2.7% St.dev. 2.11 -1 0 0.0% +0 3 8.1% St.error 0.37 +1 7 18.9%
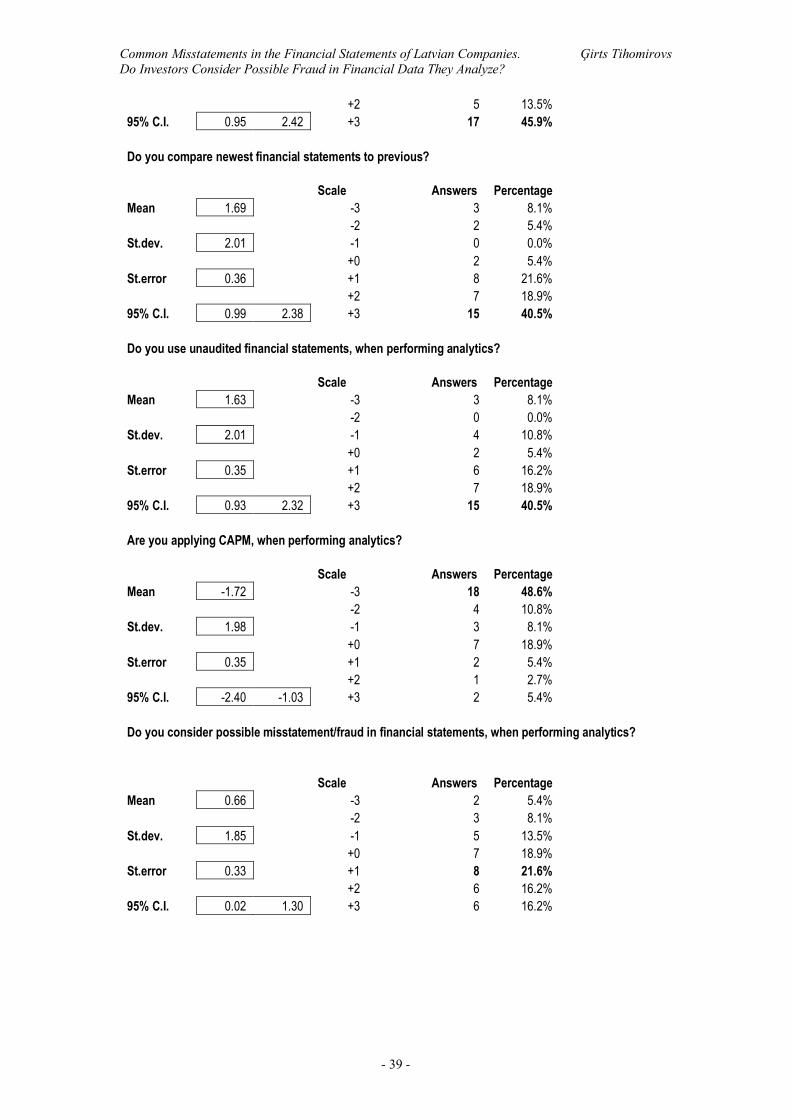
Common Misstatements in the Financial Statements of Latvian Companies. Ģirts Tihomirovs Do Investors Consider Possible Fraud in Financial Data They Analyze?
- 39 -
+2 5 13.5% 95% C.I. 0.95 2.42 +3 17 45.9% Do you compare newest financial statements to previous? Scale Answers Percentage Mean 1.69 -3 3 8.1% -2 2 5.4% St.dev. 2.01 -1 0 0.0% +0 2 5.4% St.error 0.36 +1 8 21.6% +2 7 18.9% 95% C.I. 0.99 2.38 +3 15 40.5% Do you use unaudited financial statements, when performing analytics? Scale Answers Percentage Mean 1.63 -3 3 8.1% -2 0 0.0% St.dev. 2.01 -1 4 10.8% +0 2 5.4% St.error 0.35 +1 6 16.2% +2 7 18.9% 95% C.I. 0.93 2.32 +3 15 40.5% Are you applying CAPM, when performing analytics? Scale Answers Percentage Mean -1.72 -3 18 48.6% -2 4 10.8% St.dev. 1.98 -1 3 8.1% +0 7 18.9% St.error 0.35 +1 2 5.4% +2 1 2.7% 95% C.I. -2.40 -1.03 +3 2 5.4% Do you consider possible misstatement/fraud in financial statements, when performing analytics? Scale Answers Percentage Mean 0.66 -3 2 5.4% -2 3 8.1% St.dev. 1.85 -1 5 13.5% +0 7 18.9% St.error 0.33 +1 8 21.6% +2 6 16.2% 95% C.I. 0.02 1.30 +3 6 16.2%
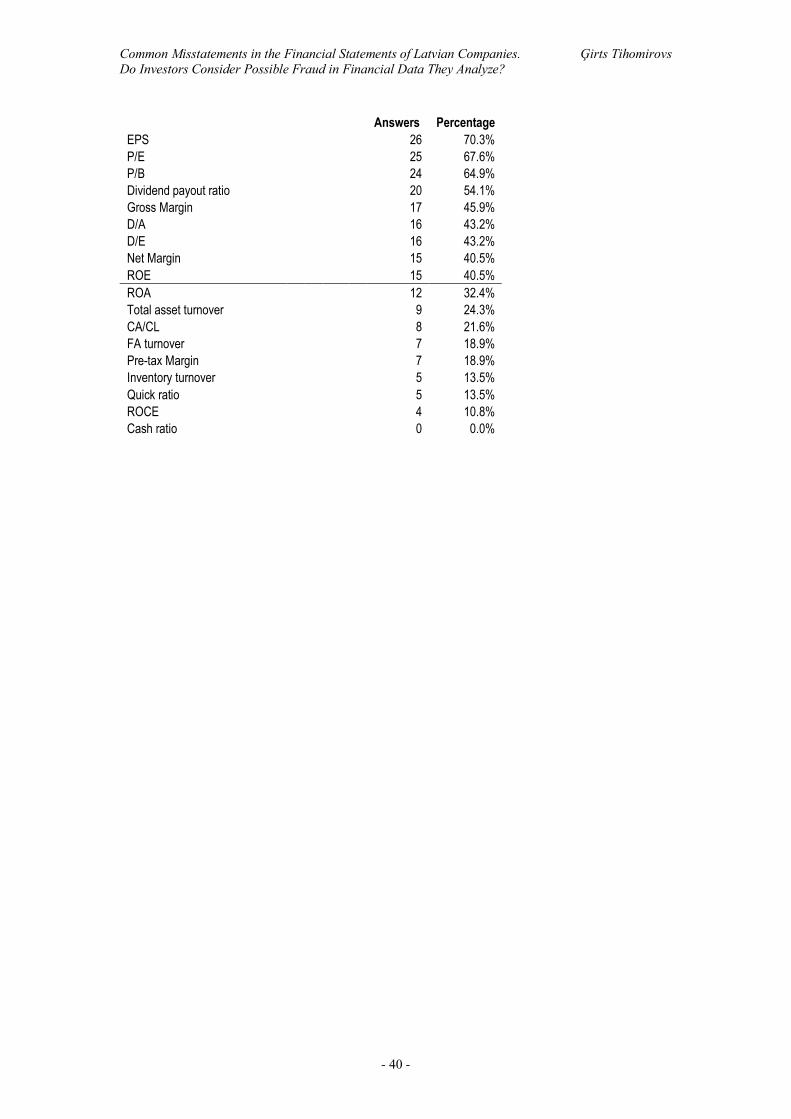
Common Misstatements in the Financial Statements of Latvian Companies. Ģirts Tihomirovs Do Investors Consider Possible Fraud in Financial Data They Analyze?
- 40 -
Answers Percentage EPS 26 70.3% P/E 25 67.6% P/B 24 64.9% Dividend payout ratio 20 54.1% Gross Margin 17 45.9% D/A 16 43.2% D/E 16 43.2% Net Margin 15 40.5% ROE 15 40.5% ROA 12 32.4% Total asset turnover 9 24.3% CA/CL 8 21.6% FA turnover 7 18.9% Pre-tax Margin 7 18.9% Inventory turnover 5 13.5% Quick ratio 5 13.5% ROCE 4 10.8% Cash ratio 0 0.0%

Common Misstatements in the Financial Statements of Latvian Companies. Ģirts Tihomirovs Do Investors Consider Possible Fraud in Financial Data They Analyze?
- 41 -
Appendix 3. List of Auditors Interviewed
Oskars Bilzonis, Senior level auditor, Ernst&Young Baltics
Māris Būmanis, Audit manager, Ernst&Young Baltics
Juris Misters, Senior level auditor, Ernst&Young Baltics
Armand Podoļskis, Senior level auditor, Ernst&Young Baltics
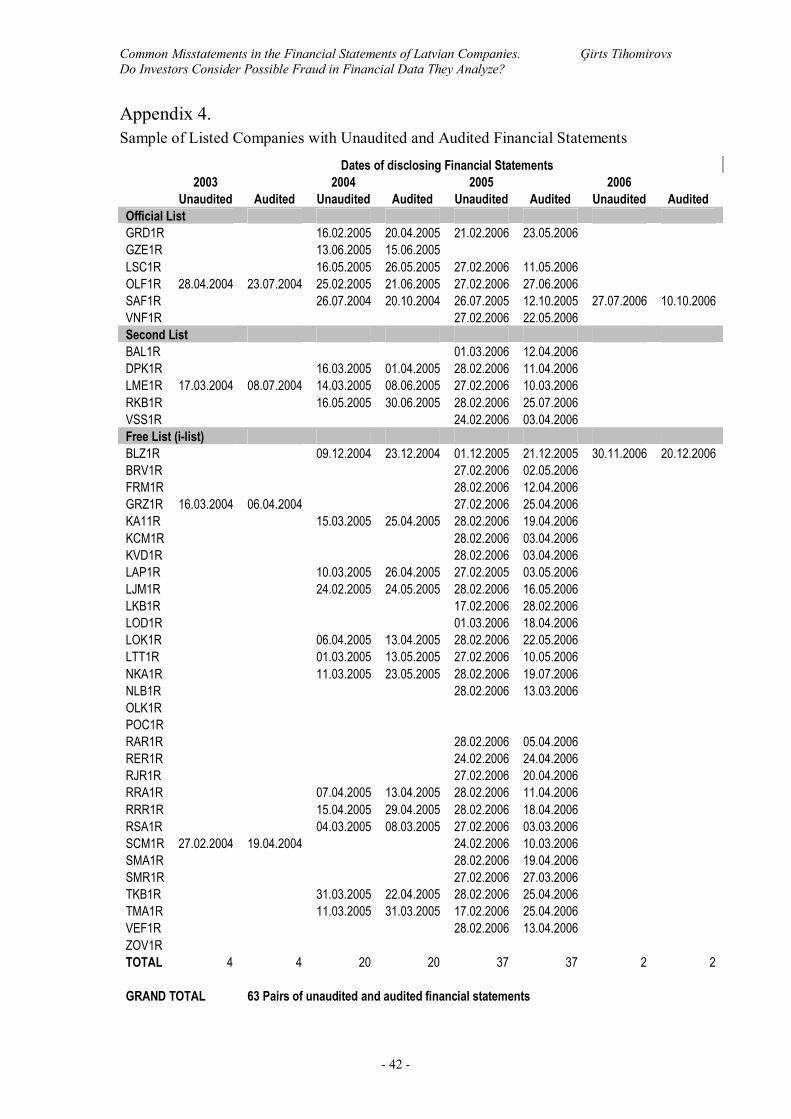
Common Misstatements in the Financial Statements of Latvian Companies. Ģirts Tihomirovs Do Investors Consider Possible Fraud in Financial Data They Analyze?
- 42 -
Appendix 4. Sample of Listed Companies with Unaudited and Audited Financial Statements
Dates of disclosing Financial Statements 2003 2004 2005 2006 Unaudited Audited Unaudited Audited Unaudited Audited Unaudited Audited Official List GRD1R 16.02.2005 20.04.2005 21.02.2006 23.05.2006 GZE1R 13.06.2005 15.06.2005 LSC1R 16.05.2005 26.05.2005 27.02.2006 11.05.2006 OLF1R 28.04.2004 23.07.2004 25.02.2005 21.06.2005 27.02.2006 27.06.2006 SAF1R 26.07.2004 20.10.2004 26.07.2005 12.10.2005 27.07.2006 10.10.2006 VNF1R 27.02.2006 22.05.2006 Second List BAL1R 01.03.2006 12.04.2006 DPK1R 16.03.2005 01.04.2005 28.02.2006 11.04.2006 LME1R 17.03.2004 08.07.2004 14.03.2005 08.06.2005 27.02.2006 10.03.2006 RKB1R 16.05.2005 30.06.2005 28.02.2006 25.07.2006 VSS1R 24.02.2006 03.04.2006 Free List (i-list) BLZ1R 09.12.2004 23.12.2004 01.12.2005 21.12.2005 30.11.2006 20.12.2006 BRV1R 27.02.2006 02.05.2006 FRM1R 28.02.2006 12.04.2006 GRZ1R 16.03.2004 06.04.2004 27.02.2006 25.04.2006 KA11R 15.03.2005 25.04.2005 28.02.2006 19.04.2006 KCM1R 28.02.2006 03.04.2006 KVD1R 28.02.2006 03.04.2006 LAP1R 10.03.2005 26.04.2005 27.02.2005 03.05.2006 LJM1R 24.02.2005 24.05.2005 28.02.2006 16.05.2006 LKB1R 17.02.2006 28.02.2006 LOD1R 01.03.2006 18.04.2006 LOK1R 06.04.2005 13.04.2005 28.02.2006 22.05.2006 LTT1R 01.03.2005 13.05.2005 27.02.2006 10.05.2006 NKA1R 11.03.2005 23.05.2005 28.02.2006 19.07.2006 NLB1R 28.02.2006 13.03.2006 OLK1R POC1R RAR1R 28.02.2006 05.04.2006 RER1R 24.02.2006 24.04.2006 RJR1R 27.02.2006 20.04.2006 RRA1R 07.04.2005 13.04.2005 28.02.2006 11.04.2006 RRR1R 15.04.2005 29.04.2005 28.02.2006 18.04.2006 RSA1R 04.03.2005 08.03.2005 27.02.2006 03.03.2006 SCM1R 27.02.2004 19.04.2004 24.02.2006 10.03.2006 SMA1R 28.02.2006 19.04.2006 SMR1R 27.02.2006 27.03.2006 TKB1R 31.03.2005 22.04.2005 28.02.2006 25.04.2006 TMA1R 11.03.2005 31.03.2005 17.02.2006 25.04.2006 VEF1R 28.02.2006 13.04.2006 ZOV1R TOTAL 4 4 20 20 37 37 2 2 GRAND TOTAL 63 Pairs of unaudited and audited financial statements

Common Misstatements in the Financial Statements of Latvian Companies. Ģirts Tihomirovs Do Investors Consider Possible Fraud in Financial Data They Analyze?
- 43 -
Appendix 5. Sample form of input date from financial statements
Unaudited Audited Difference, % Non-Current Assets Intangible assets FA Financial assets Investment property Total Non-Current Assets Current Assets Inventory Trade AR AR from related Other AR Tax asset Prepayments Accrued income Cash Total Current Assets Total Assets Equity Share Capital Markup Reserves Retained earnings Profit for the period Total Equity Minority Non-current Liabilities Long term loans Deferred tax liability Other non-current liabilities Total Non-Current Liabilites Current Liabilities Short term loans AP Taxes payable Other AP Deferred income Accruals Total Current Liabilities Total Equity and Liabilities Turnover COS Gross Profit Other income/costs EBT Tax Minority interest
Net Profit
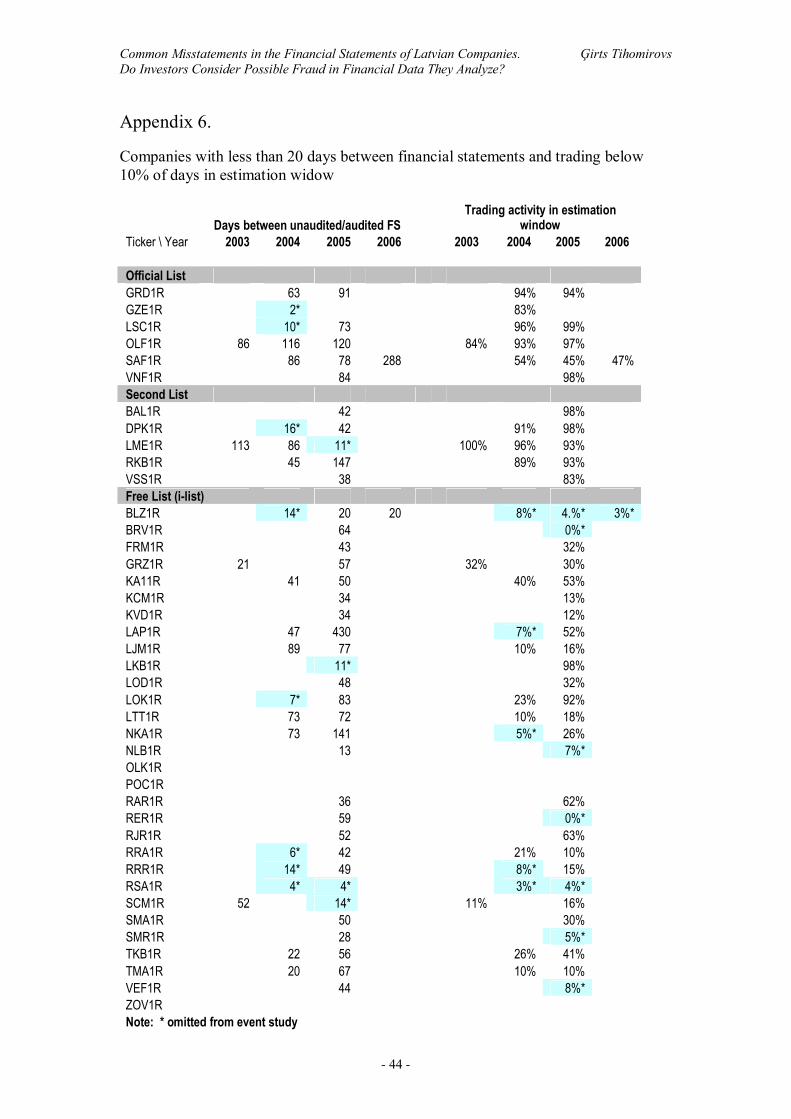
Common Misstatements in the Financial Statements of Latvian Companies. Ģirts Tihomirovs Do Investors Consider Possible Fraud in Financial Data They Analyze?
- 44 -
Appendix 6.
Companies with less than 20 days between financial statements and trading below 10% of days in estimation widow
Days between unaudited/audited FS Trading activity in estimation
window Ticker \ Year 2003 2004 2005 2006 2003 2004 2005 2006 Official List GRD1R 63 91 94% 94% GZE1R 2* 83% LSC1R 10* 73 96% 99% OLF1R 86 116 120 84% 93% 97% SAF1R 86 78 288 54% 45% 47% VNF1R 84 98% Second List BAL1R 42 98% DPK1R 16* 42 91% 98% LME1R 113 86 11* 100% 96% 93% RKB1R 45 147 89% 93% VSS1R 38 83% Free List (i-list) BLZ1R 14* 20 20 8%* 4.%* 3%* BRV1R 64 0%* FRM1R 43 32% GRZ1R 21 57 32% 30% KA11R 41 50 40% 53% KCM1R 34 13% KVD1R 34 12% LAP1R 47 430 7%* 52% LJM1R 89 77 10% 16% LKB1R 11* 98% LOD1R 48 32% LOK1R 7* 83 23% 92% LTT1R 73 72 10% 18% NKA1R 73 141 5%* 26% NLB1R 13 7%* OLK1R POC1R RAR1R 36 62% RER1R 59 0%* RJR1R 52 63% RRA1R 6* 42 21% 10% RRR1R 14* 49 8%* 15% RSA1R 4* 4* 3%* 4%* SCM1R 52 14* 11% 16% SMA1R 50 30% SMR1R 28 5%* TKB1R 22 56 26% 41% TMA1R 20 67 10% 10% VEF1R 44 8%* ZOV1R Note: * omitted from event study
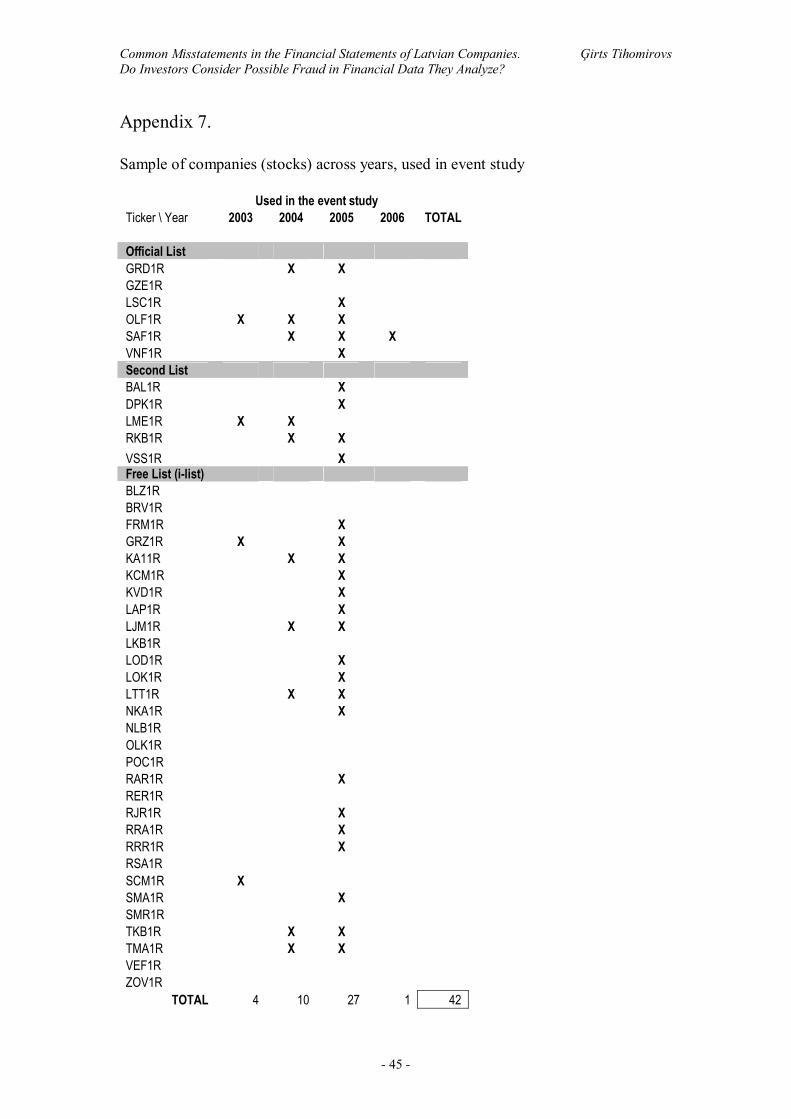
Common Misstatements in the Financial Statements of Latvian Companies. Ģirts Tihomirovs Do Investors Consider Possible Fraud in Financial Data They Analyze?
- 45 -
Appendix 7. Sample of companies (stocks) across years, used in event study Used in the event study Ticker \ Year 2003 2004 2005 2006 TOTAL Official List GRD1R X X GZE1R LSC1R X OLF1R X X X SAF1R X X X VNF1R X Second List BAL1R X DPK1R X LME1R X X RKB1R X X VSS1R X Free List (i-list) BLZ1R BRV1R FRM1R X GRZ1R X X KA11R X X KCM1R X KVD1R X LAP1R X LJM1R X X LKB1R LOD1R X LOK1R X LTT1R X X NKA1R X NLB1R OLK1R POC1R RAR1R X RER1R RJR1R X RRA1R X RRR1R X RSA1R SCM1R X SMA1R X SMR1R TKB1R X X TMA1R X X VEF1R ZOV1R
TOTAL 4 10 27 1 42
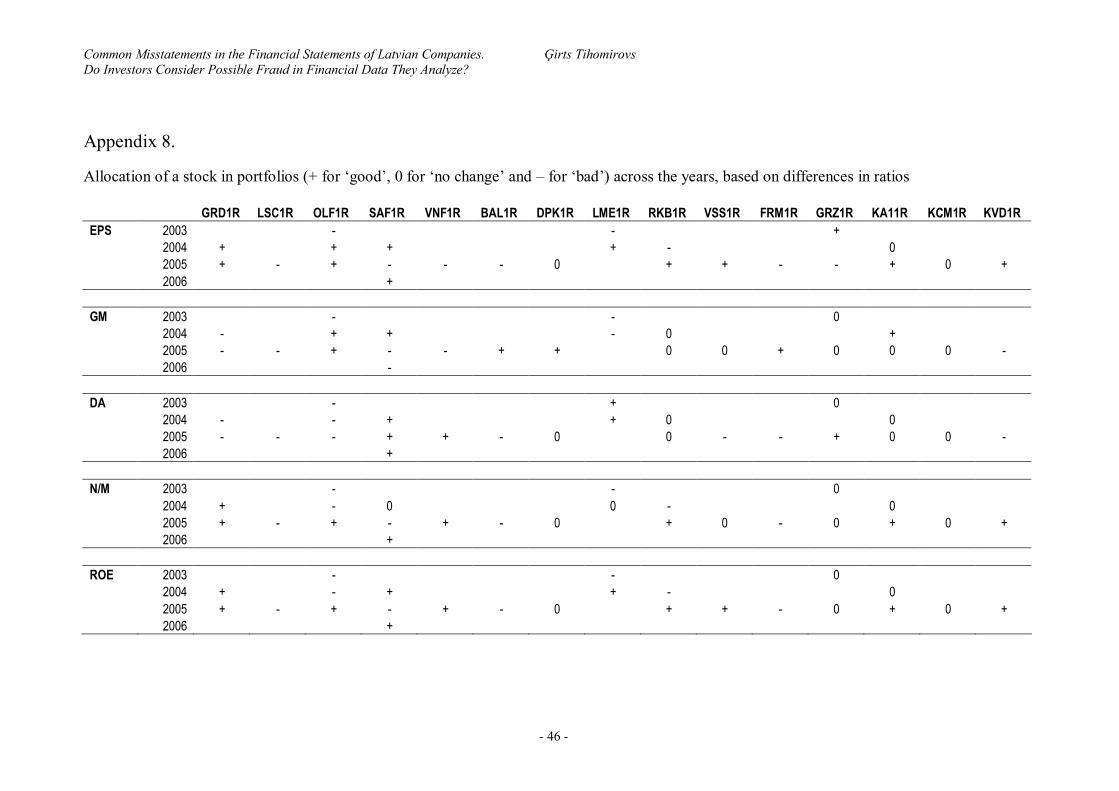
Common Misstatements in the Financial Statements of Latvian Companies. Ģirts Tihomirovs Do Investors Consider Possible Fraud in Financial Data They Analyze?
- 46 -
Appendix 8.
Allocation of a stock in portfolios (+ for ‘good’, 0 for ‘no change’ and – for ‘bad’) across the years, based on differences in ratios GRD1R LSC1R OLF1R SAF1R VNF1R BAL1R DPK1R LME1R RKB1R VSS1R FRM1R GRZ1R KA11R KCM1R KVD1R EPS 2003 - - + 2004 + + + + - 0 2005 + - + - - - 0 + + - - + 0 + 2006 + GM 2003 - - 0 2004 - + + - 0 + 2005 - - + - - + + 0 0 + 0 0 0 - 2006 - DA 2003 - + 0 2004 - - + + 0 0 2005 - - - + + - 0 0 - - + 0 0 - 2006 + N/M 2003 - - 0 2004 + - 0 0 - 0 2005 + - + - + - 0 + 0 - 0 + 0 + 2006 + ROE 2003 - - 0 2004 + - + + - 0 2005 + - + - + - 0 + + - 0 + 0 + 2006 +
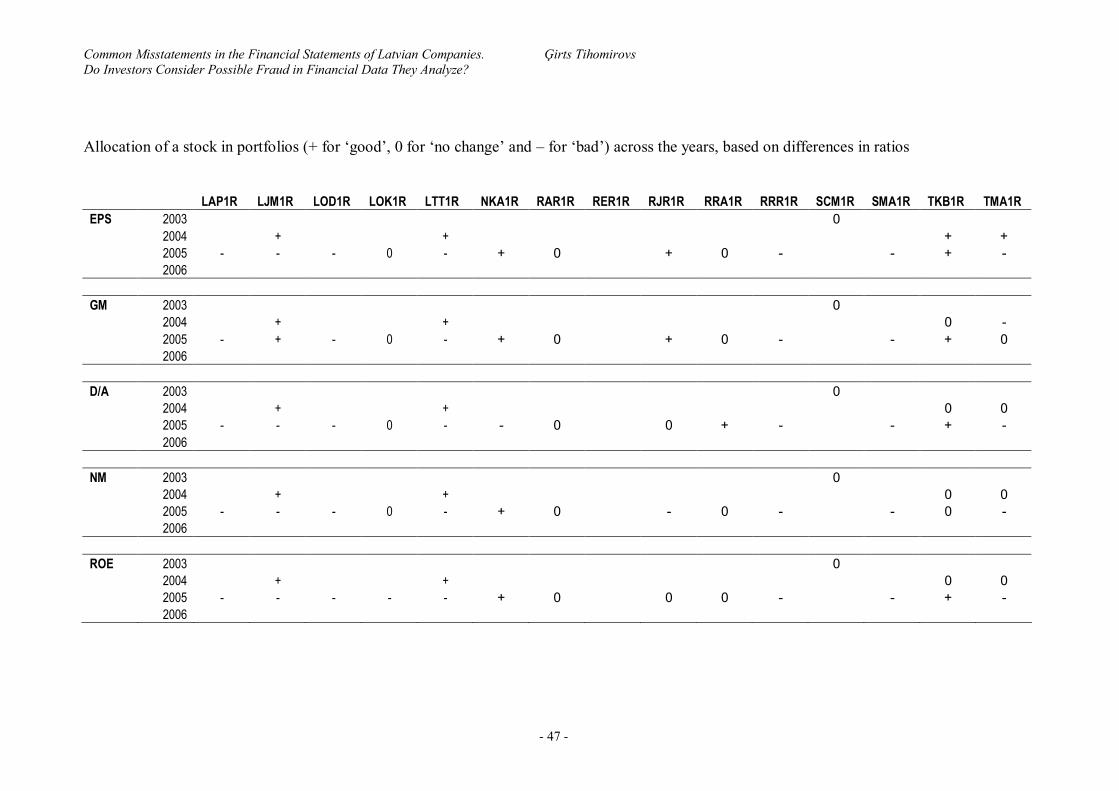
Common Misstatements in the Financial Statements of Latvian Companies. Ģirts Tihomirovs Do Investors Consider Possible Fraud in Financial Data They Analyze?
- 47 -
Allocation of a stock in portfolios (+ for ‘good’, 0 for ‘no change’ and – for ‘bad’) across the years, based on differences in ratios LAP1R LJM1R LOD1R LOK1R LTT1R NKA1R RAR1R RER1R RJR1R RRA1R RRR1R SCM1R SMA1R TKB1R TMA1R EPS 2003 0 2004 + + + + 2005 - - - 0 - + 0 + 0 - - + - 2006 GM 2003 0 2004 + + 0 - 2005 - + - 0 - + 0 + 0 - - + 0 2006 D/A 2003 0 2004 + + 0 0 2005 - - - 0 - - 0 0 + - - + - 2006 NM 2003 0 2004 + + 0 0 2005 - - - 0 - + 0 - 0 - - 0 - 2006 ROE 2003 0 2004 + + 0 0 2005 - - - - - + 0 0 0 - - + - 2006
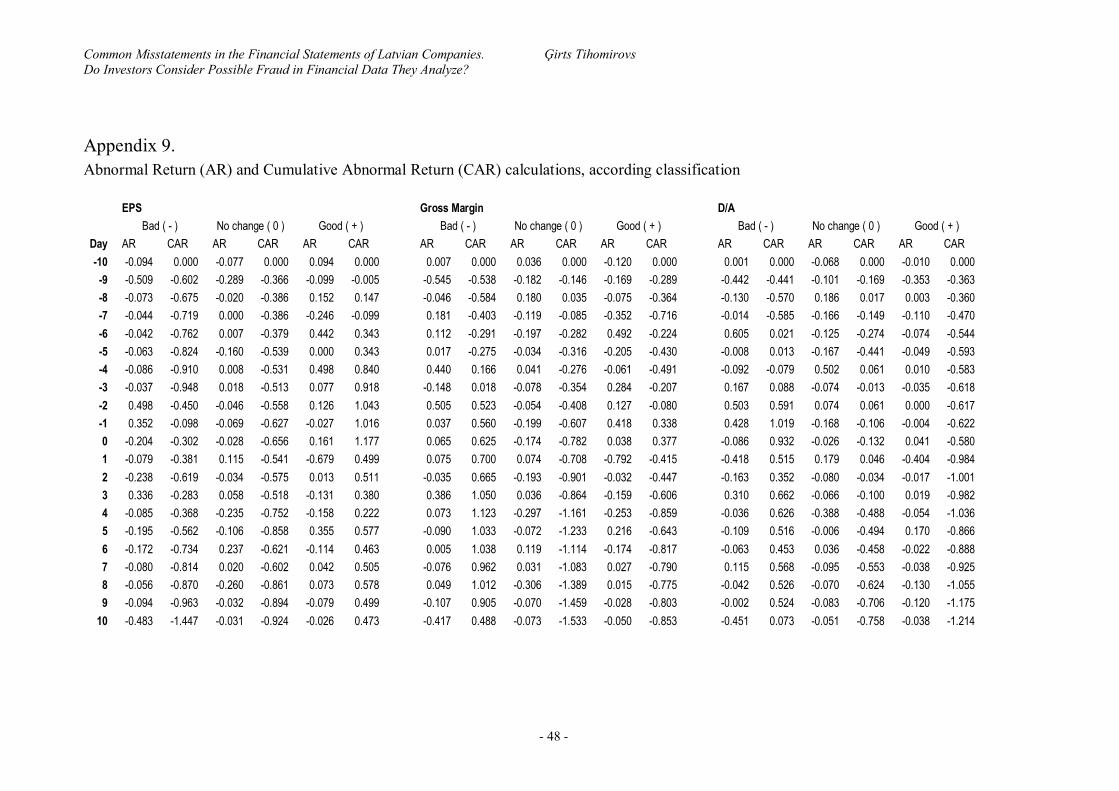
Common Misstatements in the Financial Statements of Latvian Companies. Ģirts Tihomirovs Do Investors Consider Possible Fraud in Financial Data They Analyze?
- 48 -
Appendix 9. Abnormal Return (AR) and Cumulative Abnormal Return (CAR) calculations, according classification
EPS Gross Margin D/A Bad ( - ) No change ( 0 ) Good ( + ) Bad ( - ) No change ( 0 ) Good ( + ) Bad ( - ) No change ( 0 ) Good ( + ) Day AR CAR AR CAR AR CAR AR CAR AR CAR AR CAR AR CAR AR CAR AR CAR -10 -0.094 0.000 -0.077 0.000 0.094 0.000 0.007 0.000 0.036 0.000 -0.120 0.000 0.001 0.000 -0.068 0.000 -0.010 0.000 -9 -0.509 -0.602 -0.289 -0.366 -0.099 -0.005 -0.545 -0.538 -0.182 -0.146 -0.169 -0.289 -0.442 -0.441 -0.101 -0.169 -0.353 -0.363 -8 -0.073 -0.675 -0.020 -0.386 0.152 0.147 -0.046 -0.584 0.180 0.035 -0.075 -0.364 -0.130 -0.570 0.186 0.017 0.003 -0.360 -7 -0.044 -0.719 0.000 -0.386 -0.246 -0.099 0.181 -0.403 -0.119 -0.085 -0.352 -0.716 -0.014 -0.585 -0.166 -0.149 -0.110 -0.470 -6 -0.042 -0.762 0.007 -0.379 0.442 0.343 0.112 -0.291 -0.197 -0.282 0.492 -0.224 0.605 0.021 -0.125 -0.274 -0.074 -0.544 -5 -0.063 -0.824 -0.160 -0.539 0.000 0.343 0.017 -0.275 -0.034 -0.316 -0.205 -0.430 -0.008 0.013 -0.167 -0.441 -0.049 -0.593 -4 -0.086 -0.910 0.008 -0.531 0.498 0.840 0.440 0.166 0.041 -0.276 -0.061 -0.491 -0.092 -0.079 0.502 0.061 0.010 -0.583 -3 -0.037 -0.948 0.018 -0.513 0.077 0.918 -0.148 0.018 -0.078 -0.354 0.284 -0.207 0.167 0.088 -0.074 -0.013 -0.035 -0.618 -2 0.498 -0.450 -0.046 -0.558 0.126 1.043 0.505 0.523 -0.054 -0.408 0.127 -0.080 0.503 0.591 0.074 0.061 0.000 -0.617 -1 0.352 -0.098 -0.069 -0.627 -0.027 1.016 0.037 0.560 -0.199 -0.607 0.418 0.338 0.428 1.019 -0.168 -0.106 -0.004 -0.622 0 -0.204 -0.302 -0.028 -0.656 0.161 1.177 0.065 0.625 -0.174 -0.782 0.038 0.377 -0.086 0.932 -0.026 -0.132 0.041 -0.580 1 -0.079 -0.381 0.115 -0.541 -0.679 0.499 0.075 0.700 0.074 -0.708 -0.792 -0.415 -0.418 0.515 0.179 0.046 -0.404 -0.984 2 -0.238 -0.619 -0.034 -0.575 0.013 0.511 -0.035 0.665 -0.193 -0.901 -0.032 -0.447 -0.163 0.352 -0.080 -0.034 -0.017 -1.001 3 0.336 -0.283 0.058 -0.518 -0.131 0.380 0.386 1.050 0.036 -0.864 -0.159 -0.606 0.310 0.662 -0.066 -0.100 0.019 -0.982 4 -0.085 -0.368 -0.235 -0.752 -0.158 0.222 0.073 1.123 -0.297 -1.161 -0.253 -0.859 -0.036 0.626 -0.388 -0.488 -0.054 -1.036 5 -0.195 -0.562 -0.106 -0.858 0.355 0.577 -0.090 1.033 -0.072 -1.233 0.216 -0.643 -0.109 0.516 -0.006 -0.494 0.170 -0.866 6 -0.172 -0.734 0.237 -0.621 -0.114 0.463 0.005 1.038 0.119 -1.114 -0.174 -0.817 -0.063 0.453 0.036 -0.458 -0.022 -0.888 7 -0.080 -0.814 0.020 -0.602 0.042 0.505 -0.076 0.962 0.031 -1.083 0.027 -0.790 0.115 0.568 -0.095 -0.553 -0.038 -0.925 8 -0.056 -0.870 -0.260 -0.861 0.073 0.578 0.049 1.012 -0.306 -1.389 0.015 -0.775 -0.042 0.526 -0.070 -0.624 -0.130 -1.055 9 -0.094 -0.963 -0.032 -0.894 -0.079 0.499 -0.107 0.905 -0.070 -1.459 -0.028 -0.803 -0.002 0.524 -0.083 -0.706 -0.120 -1.175
10 -0.483 -1.447 -0.031 -0.924 -0.026 0.473 -0.417 0.488 -0.073 -1.533 -0.050 -0.853 -0.451 0.073 -0.051 -0.758 -0.038 -1.214
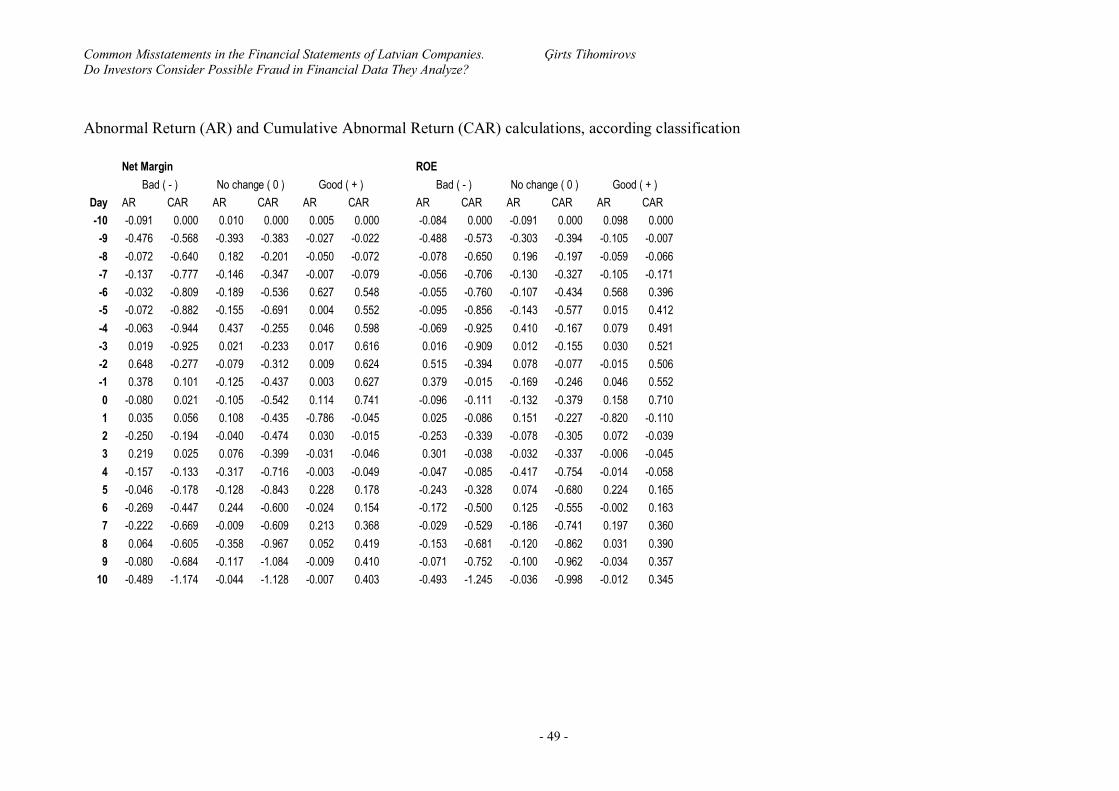
Common Misstatements in the Financial Statements of Latvian Companies. Ģirts Tihomirovs Do Investors Consider Possible Fraud in Financial Data They Analyze?
- 49 -
Abnormal Return (AR) and Cumulative Abnormal Return (CAR) calculations, according classification
Net Margin ROE Bad ( - ) No change ( 0 ) Good ( + ) Bad ( - ) No change ( 0 ) Good ( + ) Day AR CAR AR CAR AR CAR AR CAR AR CAR AR CAR -10 -0.091 0.000 0.010 0.000 0.005 0.000 -0.084 0.000 -0.091 0.000 0.098 0.000 -9 -0.476 -0.568 -0.393 -0.383 -0.027 -0.022 -0.488 -0.573 -0.303 -0.394 -0.105 -0.007 -8 -0.072 -0.640 0.182 -0.201 -0.050 -0.072 -0.078 -0.650 0.196 -0.197 -0.059 -0.066 -7 -0.137 -0.777 -0.146 -0.347 -0.007 -0.079 -0.056 -0.706 -0.130 -0.327 -0.105 -0.171 -6 -0.032 -0.809 -0.189 -0.536 0.627 0.548 -0.055 -0.760 -0.107 -0.434 0.568 0.396 -5 -0.072 -0.882 -0.155 -0.691 0.004 0.552 -0.095 -0.856 -0.143 -0.577 0.015 0.412 -4 -0.063 -0.944 0.437 -0.255 0.046 0.598 -0.069 -0.925 0.410 -0.167 0.079 0.491 -3 0.019 -0.925 0.021 -0.233 0.017 0.616 0.016 -0.909 0.012 -0.155 0.030 0.521 -2 0.648 -0.277 -0.079 -0.312 0.009 0.624 0.515 -0.394 0.078 -0.077 -0.015 0.506 -1 0.378 0.101 -0.125 -0.437 0.003 0.627 0.379 -0.015 -0.169 -0.246 0.046 0.552 0 -0.080 0.021 -0.105 -0.542 0.114 0.741 -0.096 -0.111 -0.132 -0.379 0.158 0.710 1 0.035 0.056 0.108 -0.435 -0.786 -0.045 0.025 -0.086 0.151 -0.227 -0.820 -0.110 2 -0.250 -0.194 -0.040 -0.474 0.030 -0.015 -0.253 -0.339 -0.078 -0.305 0.072 -0.039 3 0.219 0.025 0.076 -0.399 -0.031 -0.046 0.301 -0.038 -0.032 -0.337 -0.006 -0.045 4 -0.157 -0.133 -0.317 -0.716 -0.003 -0.049 -0.047 -0.085 -0.417 -0.754 -0.014 -0.058 5 -0.046 -0.178 -0.128 -0.843 0.228 0.178 -0.243 -0.328 0.074 -0.680 0.224 0.165 6 -0.269 -0.447 0.244 -0.600 -0.024 0.154 -0.172 -0.500 0.125 -0.555 -0.002 0.163 7 -0.222 -0.669 -0.009 -0.609 0.213 0.368 -0.029 -0.529 -0.186 -0.741 0.197 0.360 8 0.064 -0.605 -0.358 -0.967 0.052 0.419 -0.153 -0.681 -0.120 -0.862 0.031 0.390 9 -0.080 -0.684 -0.117 -1.084 -0.009 0.410 -0.071 -0.752 -0.100 -0.962 -0.034 0.357
10 -0.489 -1.174 -0.044 -1.128 -0.007 0.403 -0.493 -1.245 -0.036 -0.998 -0.012 0.345