Embed Size (px)
Citation preview

COMMERCIAL POTENTIAL OF NATURAL GAS
STORAGE IN LINED ROCK CAVERNS (LRC)
Topical Report SZUS-0005 DE-AC26-97FT34348-01
by
Sofregaz US Inc.
200 WestLake Park Boulevard
Suite 1100
Houston, Texas 77079
UNITED STATES
and
LRC
S-205 09 Malmö, Sweden
Carl Gustafsväg 4
SWEDEN
prepared for
U.S. Department of EnergyFederal Energy Technology Center
P.O. Box 880
Morgantown, West Virginia 26507
UNITED STATES
November 1999

i
FOREWORD
This report presents the results of a study performed by Sofregaz US, Houston, Texas, andLRC, a consortium composed of Gaz de France International S.A., Paris, France, and SydkraftAB, Malmo, Sweden. In cooperation with LRC, NYSEG, Binghamton, New York, and ANRStorage Company of Detroit, Michigan, have reviewed the report. In addition to LRC, AcresAmerican Inc., Buffalo, New York, and SPS Inc., Houston, Texas, contributed to the study effortin assessing state and federal permitting requirements and mapping pipelines, respectively.Dr. Joe L. Ratigan was Project Manager for Sofregaz US and Mr. Ola Hall was Project Managerfor LRC.

ii
EXECUTIVE SUMMARY
The geologic conditions in many regions of the United States will not permit thedevelopment of economical high-deliverability gas storage in salt caverns. These regionsinclude the entire Eastern Seaboard; several northern states, notably Minnesota andWisconsin; many of the Rocky Mountain States; and most of the Pacific Northwest. In late1997, the United States Department of Energy (USDOE) Federal Energy Technology Centerengaged Sofregaz US to investigate the commercialization potential of natural gas storage inLined Rock Caverns (LRC). Sofregaz US teamed with Gaz de France and Sydkraft, who hadformed a consortium, called LRC, to perform the study for the USDOE.
Underground storage of natural gas is generally achieved in depleted oil and gas fields,aquifers, and solution-mined salt caverns. These storage technologies require specific geologicconditions. Unlined rock caverns have been used for decades to store hydrocarbons - mostlyliquids such as crude oil, butane, and propane. The maximum operating pressure in unlinedrock caverns is limited, since the host rock is never entirely impervious. The LRC technologyallows a significant increase in the maximum operating pressure over the unlined storagecavern concept, since the gas in storage is completely contained with an impervious liner.
The LRC technology has been under development in Sweden by Sydkraft since 1987. Thedevelopment process has included extensive technical studies, laboratory testing, field tests,and most recently includes a storage facility being constructed in southern Sweden (Skallen).The LRC development effort has shown that the concept is technically and economically viable.The Skallen storage facility will have a rock cover of 115 meters (375 feet), a storage volume of40,000 cubic meters (250,000 petroleum barrels), and a maximum operating pressure of 20 MPa(2,900 psi).
There is a potential for commercialization of the LRC technology in the United States. Tworegions were studied in some detail - the Northeast and the Southeast. The investment cost foran LRC facility in the Northeast is approximately $182 million and $343 million for a 2.6-billion cubic foot (bcf) working gas facility and a 5.2-bcf working gas storage facility,respectively. The relatively high investment cost is a strong function of the cost of labor in theNortheast. The labor union-related rules and requirements in the Northeast result in muchhigher underground construction costs than might result in Sweden, for example.
The LRC technology gas storage service is compared to other alternative technologies. TheLRC technology gas storage service was found to be competitive with other alternativetechnologies for a variety of market scenarios.

iii
TABLE OF CONTENTS
1.0 INTRODUCTION AND SCOPE .......................................................................................... 1
2.0 DESCRIPTION OF THE LINED ROCK CAVERN TECHNOLOGY........................... 2
2.1 BACKGROUND................................................................................................................ 2
2.2 THE LRC STORAGE CONCEPT.................................................................................... 4
2.2.1 Overall Description .............................................................................................. 4
2.2.2 Pressure-Absorbing Rock Mass........................................................................... 6
2.2.3 Pressure-Transferring Concrete Layer .............................................................. 6
2.2.4 Gas-Tight Lining .................................................................................................. 6
2.2.5 Drainage System .................................................................................................. 9
2.3 THE LRC TECHNOLOGY EIGHT-STEP DEVELOPMENT....................................... 10
2.4 SUMMARY OF THE GRÄNGESBERG PILOT PLANT RESULTS............................ 11
2.4.1 Test Plan General Description ............................................................................ 11
2.4.2 Test Plan Objectives............................................................................................. 11
2.4.3 Test Program ........................................................................................................ 13
2.4.4 Test Results .......................................................................................................... 13
2.5 SUMMARY........................................................................................................................ 14
3.0 MARKET DATA COLLECTION FOR CONVENTIONAL ALTERNATIVES ............ 15
3.1 STORAGE DEMANDS..................................................................................................... 15
3.2 GENERAL INVESTMENT COST PROFILE FOR UNITED STATES UNDER-GROUND NATURAL GAS STORAGE........................................................................... 16
4.0 IDENTIFICATION AND SELECTION OF TWO GEOLOGIC CASES....................... 22
4.1 OVERVIEW....................................................................................................................... 22
4.2 BEDROCK GEOLOGY OF NEW ENGLAND................................................................ 22
4.2.1 Regional Geology.................................................................................................. 22
4.2.2 Potential Storage Sites ........................................................................................ 28
4.3 BEDROCK GEOLOGY OF THE SOUTHEAST AREA................................................. 28
4.3.1 Regional Geology.................................................................................................. 28
4.3.2 Potential Storage Sites ........................................................................................ 34
5.0 CONCEPTUAL DESIGN FOR LRC................................................................................... 35
5.1 DESIGN PRINCIPLES .................................................................................................... 35
5.1.1 Historical Background......................................................................................... 35
5.1.2 General Rock Mechanics Aspects ....................................................................... 36
iv
TABLE OF CONTENTS(Continued)
5.1.2.1 Expected General Behavior of the Rock Mass....................................... 36
5.1.2.2 Rock Mass Classification and Properties............................................... 38
5.1.2.3 Predicting the Deformation for the Grängesberg Pilot Plant .............. 40
5.1.2.4 Measured Deformations in Grängesberg Pilot Plant............................ 41
5.1.2.5 Comparison Between Predicted and Measured Behavior .................... 43
5.1.2.6 Behavior During Multiple Cycles........................................................... 44
5.1.2.7 Summary .................................................................................................. 46
5.1.3 Safety Against Uplift ........................................................................................... 46
5.1.3.1 Theoretical Background .......................................................................... 46
5.1.3.2 Study of Uplift in the Grängesberg Pilot Plant..................................... 48
5.1.4 Design Loop .......................................................................................................... 49
5.1.5 Cavern Wall Principles ........................................................................................ 50
5.1.6 Thermodynamic Behavior ................................................................................... 52
5.2 CONCEPTUAL DESIGN................................................................................................. 52
5.2.1 Storage Performance............................................................................................ 53
5.2.2 Site Description .................................................................................................... 53
5.2.3 General Layout..................................................................................................... 54
5.2.4 Rock Excavation ................................................................................................... 54
5.2.4.1 Excavation of the Tunnel Entrance ....................................................... 55
5.2.4.2 Excavation of the Tunnels ...................................................................... 55
5.2.4.3 Excavation of the Shafts ......................................................................... 56
5.2.4.4 Installation Chambers Above the Caverns............................................ 56
5.2.4.5 Excavation of the Rock Caverns............................................................. 56
5.2.4.6 Excavation of the Barrier Positions ....................................................... 57
5.2.4.7 Excavation of the Pump Pits................................................................... 58
5.2.4.8 Excavated Rock Treatment..................................................................... 58
5.2.4.9 Treatment of Leakage Water.................................................................. 59
5.2.5 Cavern Wall .......................................................................................................... 59
5.2.5.1 Concrete Wall........................................................................................... 59
5.2.5.2 Steel Lining .............................................................................................. 60
5.2.5.3 Drainage System...................................................................................... 61
5.2.6 Storage Operation ................................................................................................ 62
5.2.6.1 Injection With Flow Control ................................................................... 62

v
TABLE OF CONTENTS(Continued)
5.2.6.2 Injection With Compression.................................................................... 62
5.2.6.3 Withdrawal With Reduction ................................................................... 62
5.2.6.4 Withdrawal With Compression .............................................................. 64
5.2.6.5 Circulation Cooling/Heating................................................................... 64
5.2.7 Aboveground Facilities Layout and Main Equipment ...................................... 64
6.0 COST ESTIMATE .................................................................................................................. 66
6.1 INTRODUCTION ............................................................................................................. 66
6.2 INVESTMENT COST FOR A FOUR-CAVERN FACILITY ......................................... 67
6.2.1 Preconstruction Cost............................................................................................ 68
6.2.2 Below Ground Cost............................................................................................... 69
6.2.3 Aboveground Cost ................................................................................................ 71
6.2.4 Total Investment Cost for a Four-Cavern Storage Facility.............................. 73
6.2.5 Operating Cost for a Four-Cavern Storage Facility.......................................... 74
6.2.6 Total Investment Cost for an Eight-Cavern Storage Facility .......................... 74
6.2.7 Operating Cost for an Eight-Cavern Storage Facility ...................................... 75
6.2.8 Comparison of Investment Cost in the United States to Investment Cost inScandinavia .......................................................................................................... 76
6.2.9 Cost of Service ...................................................................................................... 77
6.2.10 Cost Reduction Potential ..................................................................................... 77
6.2.11 Project Schedule ................................................................................................... 77
7.0 ECONOMIC COMPARISON OF LRC TO ALTERNATIVES ....................................... 79
7.1 INTRODUCTION ............................................................................................................. 79
7.2 THE NEW ENGLAND AREA ......................................................................................... 80
7.3 THE SOUTHEAST AREA ............................................................................................... 80
7.4 CASE STUDIES ............................................................................................................... 80
7.4.1 New England Area ................................................................................................. 81
7.4.2 Southeast Area ....................................................................................................... 84
8.0 ENVIRONMENTAL IMPACT AND PERMITTING ISSUES........................................ 86
8.1 SUMMARY OF ENVIRONMENTAL IMPACT ............................................................. 86
8.1.1 Environmental Effects During the Construction Period .................................... 86
8.1.2 Environmental Effects After the Construction Period........................................ 88
8.2 PERMIT SUMMARY ....................................................................................................... 89

vi
TABLE OF CONTENTS(Continued)
9.0 REFERENCES........................................................................................................................ 99
APPENDIX A. DESCRIPTION OF JOBFEM FINITE ELEMENT SOFTWARE ............ A-1
APPENDIX B. LRC GAS TEMPERATURE CALCULATIONS........................................... B-1
APPENDIX C. DESIGN DRAWINGS .......................................................................................C-1
APPENDIX D. MANUAL FOR ECONOMIC MODEL...........................................................D-1
D.1 INTRODUCTION .............................................................................................................D-2
D.2 BACKGROUND................................................................................................................D-3
D.3 INSTRUCTIONS ..............................................................................................................D-3
D.3.1 End User Input Data (Sheet 1) ...........................................................................D-4
D.3.2 Transportation Cost (Sheet 2) .............................................................................D-4
D.3.2.1 Transportation Cost to End User (1.) ....................................................D-4
D.3.2.2 Pipeline + Storage (2.).............................................................................D-4
D.3.3 Cost Comparison Graph.......................................................................................D-7
D.3.4 Storage Rate..........................................................................................................D-7
D.3.5 LRC Investment Cost...........................................................................................D-7

vii
LIST OF TABLES
TABLE PAGE
3-1 Summary of Median Size and Investment Cost per Unit Working Gas Volume ....... 20
3-2 Summary of Median Size and Cost per Unit Withdrawal Rate................................... 21
5-1 Methods Used in Grängesberg Pilot Plant to Estimate the Mechanical Propertiesof the Rock Mass .............................................................................................................. 40
5-2 Parameters Used to Describe the Grängesberg Pilot Plant Site ................................. 40
6-1 Investment Cost for a Four-Cavern LRC Facility ........................................................ 73
6-2 Annual Operating Cost for a Four-Cavern LRC Facility ............................................. 74
6-3 Investment Cost for an Eight-Cavern LRC Facility..................................................... 75
6-4 Annual Operating Cost for an Eight-Cavern LRC Facility ......................................... 75
6-5 Investment Cost Comparison for LRC Storage Between the United States andScandinavia...................................................................................................................... 76
6-6 Cost Comparison for LRC Storage Between the United States and Scandinaviafor Certain Below Ground Components......................................................................... 76
6-7 Cost of Service per Deliverability for LRC Storage ...................................................... 77
7-1 Cost Comparison for Various Storage Technologies..................................................... 81
7-2 Assumptions for Case 1................................................................................................... 82
7-3 Assumptions for Case 2................................................................................................... 82
7-4 Comparison of Transportation Cost of 300 MDth Yearly at a Deliverability of 30MDth/d - Case 1 ............................................................................................................. 83
7-5 Comparison of Transportation Cost of 900 MDth Yearly at a Deliverability of 30MDth/d - Case 2 ............................................................................................................. 84
8-1 Federal and State Regulations That are or may be Applicable to the LRCTechnology in Massachusetts ......................................................................................... 90
8-2 Federal and State Regulations That are or may be Applicable to the LRCTechnology in Georgia..................................................................................................... 95

viii
LIST OF FIGURES
FIGURE PAGE
2-1 Concept of Unlined Rock Cavern With a Water Curtain ............................................. 3
2-2 Schematic Illustration of the Lined Rock Cavern Concept.......................................... 5
2-3 Cavern Wall Design in the LRC..................................................................................... 7
2-4 Simple Model for Calculating the Uplift Effect ............................................................ 8
2-5 Schematic Illustration of a Typical Test Room at Grängesberg, Sweden................... 12
3-1 Matrix Showing Characteristics for Different Types of Storage ................................. 17
3-2 Depleted Field Investment Cost per Unit Working Gas Volume ................................ 17
3-3 Depleted Field Investment Cost per Unit Withdrawal Rate........................................ 18
3-4 Aquifer Storage Investment Cost per Unit Working Gas Volume .............................. 18
3-5 Aquifer Storage Investment Cost per Unit Withdrawal Rate ..................................... 19
3-6 Salt Cavern Investment Cost per Unit Working Gas Volume..................................... 19
3-7 Salt Cavern Investment Cost per Unit Withdrawal Rate............................................ 20
4-1 Major Pipelines, Salt Basins, and Precambrian and Premesozoic Outcrops in theUnited States ................................................................................................................... 23
4-2 Index Map and Major Structural Features of Eastern Massachusetts....................... 24
4-3 Regional Location Map Showing Boundaries of the Greater Atlanta Regional Mapand Regional Setting of Map Area ................................................................................. 29
5-1 The Logic Chain of the Approach Adopted for the Grängesberg Pilot Plant Tests.... 37
5-2 Expected Principal Elasto-Plastic Behavior of the Rock Mass. Tensile Stresses inthe Rock Surface Occur at Twice the Initial In Situ Stress, 2P0 (for an IsotropicStress Field). Plastic Deformations Occur When the Compressive Strength of theRock Mass, σσc,m, Is Exceeded .......................................................................................... 37
5-3 Illustration of the Different Deformation Zones Around a Pressurized LRC............. 38
5-4 Predicted Radial Deformations in Test Room 2 (for Horizontal Stress Conditionsof 1.3 and 2.5 MPa), Grängesberg Pilot Plant. Expected Spread in Deformation IsSet at ±±1 Millimeter ........................................................................................................ 41
5-5 Predicted Distribution of Radial Deformation Along an 11.5-Meter-LongExtensometer ................................................................................................................... 42
5-6 Total Radial Deformations Measured in all Three Test Rooms (Grängesberg PilotPlant) .............................................................................................................................. 42
5-7 Measured Distribution of Radial Deformation Along an 11.5-Meter-LongExtensometer ................................................................................................................... 43

ix
LIST OF FIGURES(Continued)
FIGURE PAGE
5-8 Deformations in all Horizontal Extensometers in the Three Test Caverns AlongWith the Predicted Deformations According to JOBFEM (Two Thick Lines for TwoDifferent Horizontal Stress Conditions). The Expected Spread Was Set at±±1 Millimeter ................................................................................................................... 44
5-9 Measured Change in Diameter (K7, K8) and Height (K9) of Test Room 2 During50 Cyclic Pressure Loads Between 15 and 30 MPa....................................................... 45
5-10 Additional Rock Deformation Registered in Test Room 2 During 100 PressureCycles Between 1 and 16.5 MPa..................................................................................... 45
5-11 Uplift of Cylindrical Anchor Plates................................................................................ 47
5-12 Resistance Against Uplift With a Cone-Shaped Rock Overburden............................. 47
5-13 The Resistance of the Rock Mass Against Uplift Calculated With Three DifferentMethods for the Grängesberg Pilot Plant (Cavern Diameter 4.4 Meters andActual Rock Cover 50 Meters) ........................................................................................ 48
5-14 Design Loop for Technical and Economical Optimization of a Lined Rock Cavernfor Storage of Gas ............................................................................................................ 49
5-15 Method for Judging the Potential of a Site for LRC Storage....................................... 50
5-16 Horizontal Projection of Storage Showing the Sandwich Wall.................................... 51
5-17 Circulation Cooling During Injection.............................................................................. 63
5-18 Circulation Heating During Withdrawal........................................................................ 63
6-1 Preconstruction Investment Cost .................................................................................... 68
6-2 Uncertainties for Preconstruction Cost .......................................................................... 69
6-3 Below Ground Investment Cost....................................................................................... 70
6-4 Largest Uncertainties for Below Ground Cost ............................................................... 71
6-5 Aboveground Investment Cost......................................................................................... 72
6-6 Largest Uncertainties for Aboveground Cost ................................................................. 73
6-7 Time Schedule for a Four-Cavern LRC Storage............................................................. 78
B-1 Pressure and Temperature Variation in the Cavern.................................................... B-4
D-1 Alternatives for Gas Transportation.............................................................................. D-2
D-2 End User Input Data....................................................................................................... D-4
D-3 Transportation Cost to End User ................................................................................... D-5
D-4 Transportation Cost to Storage ...................................................................................... D-5
D-5 Storage Cost ..................................................................................................................... D-6

x
LIST OF FIGURES(Continued)
FIGURE PAGE
D-6 Transportation Cost to End User ................................................................................... D-7
D-7 Cost Comparison Graph.................................................................................................. D-7
D-8 Storage Rate..................................................................................................................... D-8
D-9 LRC Investment Cost ...................................................................................................... D-8

1
1.0 INTRODUCTION AND SCOPE
In late 1997, Sofregaz US was engaged by the Federal Energy Technology Center (FETC) toinvestigate the commercialization potential of natural gas storage in Lined Rock Caverns(LRC). Sofregaz US teamed with Gaz de France and Sydkraft to perform the study for theDepartment of Energy.
The geologic conditions in many regions of the United States will not permit thedevelopment of economical high-deliverability gas storage in salt caverns. These regionsinclude the entire Eastern Seaboard; several northern states, notably Minnesota andWisconsin; many of the Rocky Mountain states; and most of the Pacific Northwest. This studyaddresses the development of a design and associated cost estimate for lined rock caverns forthese regions of the United States. The study addresses the development of LRC at twolocations: one along the Southeastern Coast and the other in the Northeast.
In Chapter 2.0, the state-of-the-art in LRC technology is described. Chapter 3.0 provides asummary of the market data for conventional storage alternatives in the area in which the LRCtechnology is being proposed. The two geologic sites are described in Chapter 4.0, and theconceptual LRC design is presented in Chapter 5.0. Chapters 6.0 and 7.0 present the costestimate and a comparison to conventional alternatives for storage. Chapter 8.0 provides avery brief review of the environmental issues associated with the LRC and the permittingissues that need to be addressed with such a development. The report concludes with citedreferences and several appendices with detailed information.

2
2.0 DESCRIPTION OF THE LINED ROCK CAVERN TECHNOLOGY
2.1 BACKGROUND
Underground storage of natural gas is conventionally achieved in depleted oil and gas fields,aquifers, and solution-mined salt caverns. It requires specific geological conditions notavailable everywhere. Alternatives to conventional underground storage are LNG andpropane-air peak-shaving facilities. However, these alternatives are costly. The LRCtechnology is a new alternative to conventional underground storage of natural gas.
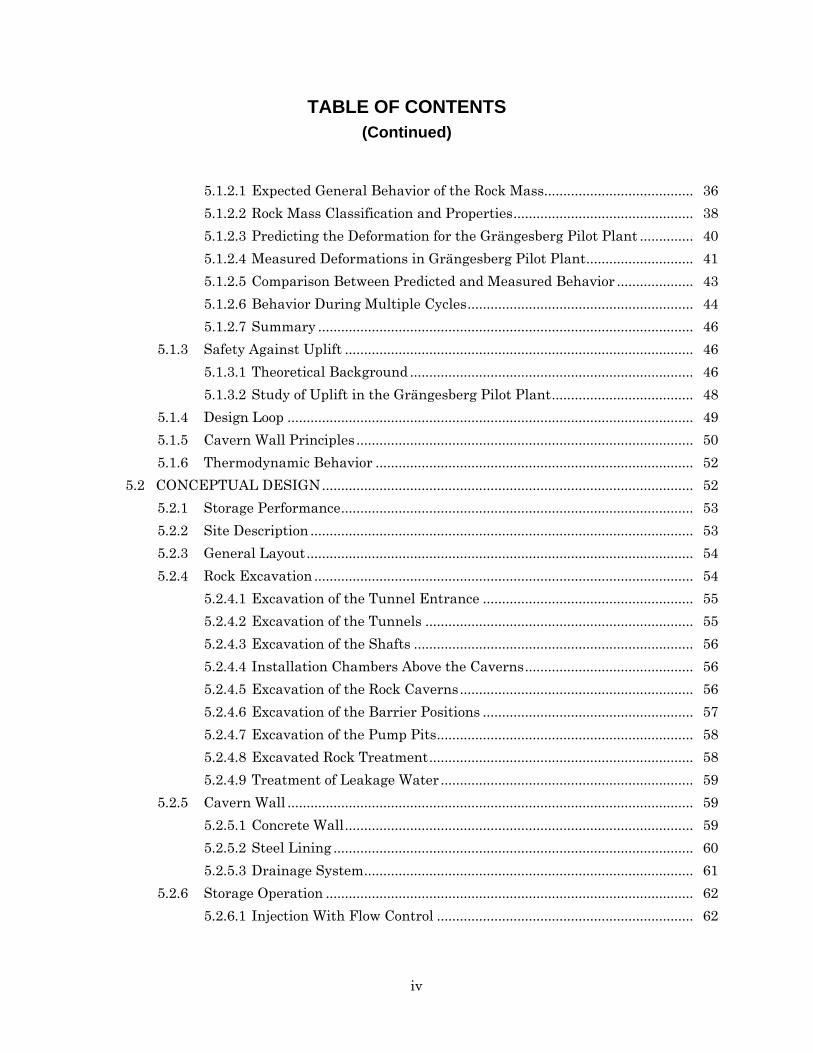
Unlined rock caverns have been used for decades to store a wide range of low vapor pressureproducts, mostly liquids such as crude oil, butane, and propane. Since the host rock is nevercompletely impervious, product confinement within the cavern is sometimes achieved throughthe water curtain technique. The idea is to have water continuously flowing toward the cavernfrom outside so that the stored product can never escape and migrate out of the cavern. Thecavern must be sited deep enough to make sure that the water hydraulic pressure in thefractures of the rock around the cavern is always higher than the vapor pressure of the productstored in the cavern. The water pressure is maintained by injecting water into the rockthrough horizontal water holes above the cavern ("the water curtain") in order to maintain astable groundwater table level. Figure 2-1 illustrates the storage concept of an unlined rockcavern with a water curtain. The same concept of unlined rock with a water curtain has beenenvisaged for air and even natural gas, but it becomes uneconomical as soon as large storagecapacity is required. Indeed, unlined rock caverns must be sited very deep to enable asufficiently high storage pressure. With the new LRC concept, this constraint can be alleviatedsince gas containment within the cavern is ensured by the lining.
The LRC technology has been under development by Sydkraft in Sweden since 1987. Thereare no suitable geological conditions for conventional underground gas storage in Scandinavia.The geology of those countries (Finland, Sweden, and Norway), with the exception of Denmark,is largely dominated by crystalline bedrock. Since the penetration of natural gas into theenergy market is growing, it has become critical for Scandinavian gas companies to find a wayto store natural gas underground. Sydkraft, the largest private energy group in Sweden in thefield of electricity, natural gas, LPG and heating systems, has taken the lead for development ofthe new technology adapted to the Scandinavian geology; the LRC technology. The LRCdevelopment program began in 1987 with Sydkraft in a leading role and with the participationof several Scandinavian entities; among them: Neste, Skanska, Statoil, Swedgas, andVattenfall. Sydkraft entered into a partnership agreement with Gaz de France in 1995 tojointly evaluate the feasibility for an LRC demonstration plant in Sweden. The feasibility studyinvolving the construction of an LRC demonstration plant is now complete and construction hasstarted.
3
RSI-835-99-079
Figure 2-1. Concept of Unlined Rock Cavern With a Water Curtain.

4
2.2 THE LRC STORAGE CONCEPT
2.2.1 Overall Description
Figure 2-2 illustrates the LRC storage concept. The underground facility consists of one ormore storage caverns, a vertical shaft, and a system of tunnels connecting the caverns with theground surface. The storage caverns are excavated in rock as vertical cylinders.
Caverns are planned to be located at a depth of about 100-200 meters below ground (300-600 feet). The maximum storage pressure will be in the range of 15-30 MPa (2,200-4,350 psi),with typical cavern dimensions of 35-40 meters (100-120 feet) in diameter, 60-100 meters(200-340 feet) in height, and 12-30 million Nm3 (400-1,100 million cubic feet (MMcf)) of naturalgas storage (working volume) capacity.
The aboveground facility includes a compressor station, heating equipment, piping, valves,metering, and control system. A dehydration unit will only be needed on a temporary basisupon initiating gas storage service. Injection into the cavern is done directly from the pipelineby flow control when the storage pressure is lower than the pipeline pressure. When the cavernpressure is higher than the pipeline pressure, compression is used to boost gas pressure. Beforebeing injected into the cavern, the gas is cooled (after compression) by an air or water cooler.During gas injection, when the pressure is higher in the cavern than in the pipeline, some gaswill be withdrawn from the cavern by a separate compressor, circulated through a cooler, andinjected back into the cavern. This will increase the working gas volume in the cavern. Inorder to further enhance the working gas capacity, the recirculated gas can be cooled to a lowertemperature by means of a refrigeration unit.
Withdrawal is normally done by free flow from the cavern to the transmission line.Compression is used when the storage pressure falls below the pipeline pressure. To avoid toolow of a gas temperature in the cavern at the end of withdrawal, gas can be heated in a heatexchanger and recirculated into the cavern. The gas also needs to be heated before pressurereduction in the withdrawal mode when the difference in pressure between the cavern and thepipeline is high.
The LRC design is based on the combination of a few key components:
• The surrounding rock mass to absorb the forces
• A concrete layer serving as a base for the lining and as a load transfer media between thegas pressure forces and the rock
• A thin lining enclosing the gas in the cavern.

5
RSI-835-99-080
Figure 2-2. Schematic Illustration of the Lined Rock Cavern Concept.

6
A fourth component, the drainage system between the cavern wall and liner, has been addedto handle groundwater influx. Figure 2-3 illustrates the design of the cavern wall, liner, anddrainage system.
2.2.2 Pressure-Absorbing Rock Mass
The rock mass surrounding the cavern is the pressure-absorbing medium, and thus, thepressure vessel. Typically, for most common rocks contemplated so far for LRC, thesurrounding rock mass starts to deform both elastically and plastically at pressures over about4 MPa (600 psi). The magnitude of these early deformations is critical since it contributes tothe ultimate strain of the lining.
A certain thickness of rock coverage is required to prevent the rock mass from upliftingwhen gas is pressurized in the cavern. Figure 2-4 illustrates a simple model for calculating theuplift effect and implies how much rock coverage must be taken for a given cavern diameterand maximum operating pressure. This model includes rock characteristics (α ), in situ depthconditions (ση), cavern depth (z) and geometry (D), and operating parameters (p).
2.2.3 Pressure-Transferring Concrete Layer
A concrete layer is cast between the lining and the rock. The purpose of this concrete layeris twofold:
1. Transfer the load generated by the gas pressure in the cavern to the surrounding rockmass.
2. Provide a smooth base for the lining.
The concrete layer also has a role to minimize the strain in the lining. The large cracks thatcan be generated by the lining deformation result in a number of smaller cracks in the concrete;thus, producing a strain in the lining.
Concrete reinforcement may vary, depending on the geological conditions and the type oflining. The need for concrete reinforcement will decrease with a higher rock mass strength.However, if the frequency of fractures is too low (e.g., only of few larger fractures), increasedreinforcement has to be incorporated. The amount of reinforcement is also related to the liner.With a thin liner, the allowance for the maximum width of cracks is lower than for a thick liner.The crack width is controlled by the amount of the reinforcement.
2.2.4 Gas-Tight Lining
The lining material must be gas-tight and chemically resistant to gas and to the possiblecondensates and impurities that it may contain, as well as to the outside environment. From astructural standpoint, the lining is not supposed to carry primary loads as it is supported by the

Figure 2-3. Cavern Wall Design in the LRC.
RS
I-835-99-081
7

8
RSI-835-99-082
Figure 2-4. Simple Model for Calculating the Uplift Effect.
9
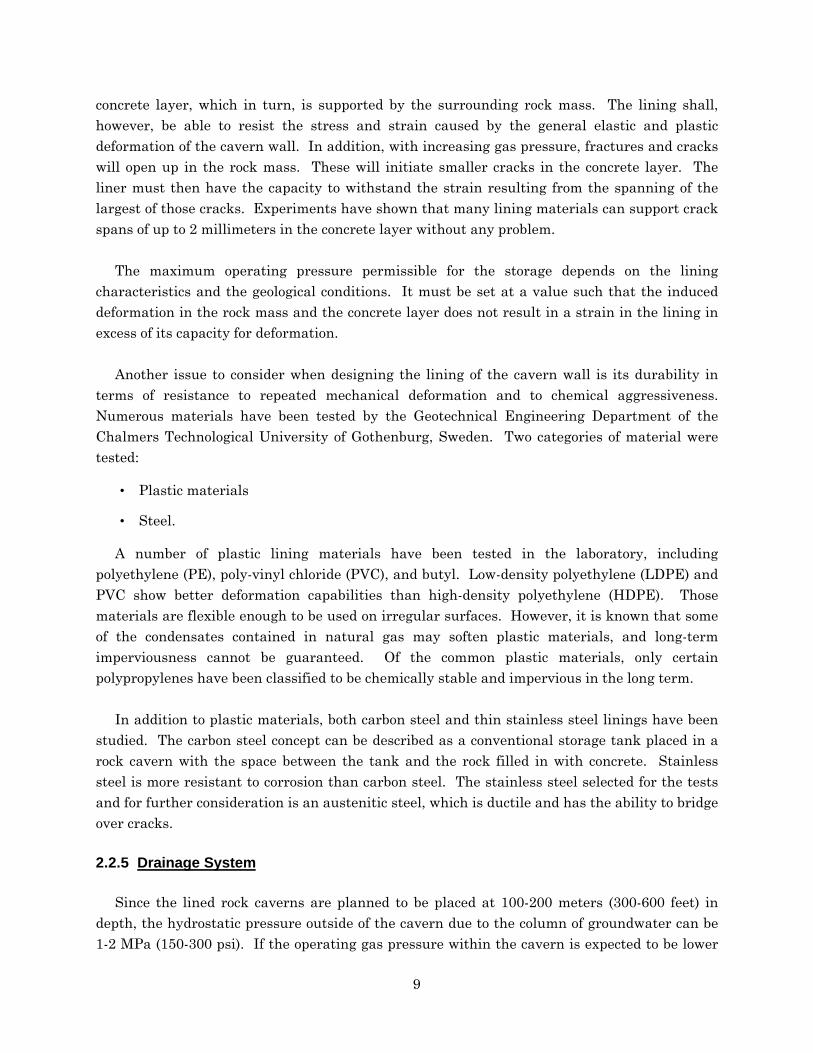
concrete layer, which in turn, is supported by the surrounding rock mass. The lining shall,however, be able to resist the stress and strain caused by the general elastic and plasticdeformation of the cavern wall. In addition, with increasing gas pressure, fractures and crackswill open up in the rock mass. These will initiate smaller cracks in the concrete layer. Theliner must then have the capacity to withstand the strain resulting from the spanning of thelargest of those cracks. Experiments have shown that many lining materials can support crackspans of up to 2 millimeters in the concrete layer without any problem.
The maximum operating pressure permissible for the storage depends on the liningcharacteristics and the geological conditions. It must be set at a value such that the induceddeformation in the rock mass and the concrete layer does not result in a strain in the lining inexcess of its capacity for deformation.
Another issue to consider when designing the lining of the cavern wall is its durability interms of resistance to repeated mechanical deformation and to chemical aggressiveness.Numerous materials have been tested by the Geotechnical Engineering Department of theChalmers Technological University of Gothenburg, Sweden. Two categories of material weretested:
• Plastic materials
• Steel.
A number of plastic lining materials have been tested in the laboratory, includingpolyethylene (PE), poly-vinyl chloride (PVC), and butyl. Low-density polyethylene (LDPE) andPVC show better deformation capabilities than high-density polyethylene (HDPE). Thosematerials are flexible enough to be used on irregular surfaces. However, it is known that someof the condensates contained in natural gas may soften plastic materials, and long-termimperviousness cannot be guaranteed. Of the common plastic materials, only certainpolypropylenes have been classified to be chemically stable and impervious in the long term.
In addition to plastic materials, both carbon steel and thin stainless steel linings have beenstudied. The carbon steel concept can be described as a conventional storage tank placed in arock cavern with the space between the tank and the rock filled in with concrete. Stainlesssteel is more resistant to corrosion than carbon steel. The stainless steel selected for the testsand for further consideration is an austenitic steel, which is ductile and has the ability to bridgeover cracks.
2.2.5 Drainage System
Since the lined rock caverns are planned to be placed at 100-200 meters (300-600 feet) indepth, the hydrostatic pressure outside of the cavern due to the column of groundwater can be1-2 MPa (150-300 psi). If the operating gas pressure within the cavern is expected to be lower

10
than the hydrostatic pressure outside the cavern, or if the cavern is depressurized to theatmospheric pressure for inspection and/or maintenance, the lining could be exposed to a loadfrom the outside. A drainage system installed outside the cavern, within its wall, could havethe function of reducing that hydrostatic pressure by draining the flowing groundwater.
2.3 THE LRC TECHNOLOGY EIGHT-STEP DEVELOPMENT
The LRC technology has been developed step-by-step over a period of more than 10 years,since the initial step in 1987. Seven steps have already been completed, and the eighth andfinal step, the construction of the demonstration plant, was started in 1998 by the partners inthe project: Sydkraft and Gaz de France.
• Step 1 - Conceptual Studies [Sydgas et al., 1987a, 1987b, 1989; Sydgas, 1990a,1990b, 1992; Sydkraft and Vattenfall, 1992]
The first step consisted of basic conceptual studies and was conducted from 1987 through1992 by a combination of Scandinavian companies, including Sydkraft, Sydgas, Swedgas, andVattenfall. These studies principally addressed the issue of the cavern lining and its tightnessto gas.
• Step 2 - Experimental Tests [Stille et al., 1994]
During the second step, from 1990 to 1994, the two concepts of gas storage in rock cavernswith a water seal and storage at low temperature (chilled storage) were studied through aseries of tests performed in the Röda Sten experimental rock cavern.
• Step 3 - Grängesberg Pilot Plant [Stille et al., 1994]
A pilot plant was constructed in 1988-1989 at Grängesberg and was used for testing from1989 through 1993. The purpose was to experiment with different linings, to test the cavernunder pressure and evaluate the effect of increasing pressure, to test the benefit of reducedstorage temperature, to further investigate the feasibility of stainless steel lining, to betterunderstand the fracture mechanism in the surrounding rock, and to test the consequence ofleakage in the liner at high pressure. The results of this pilot plant at Grängesberg arepresented in Section 2.4.
• Step 4 - Test Plant Results Interpretation
The fourth step consisted of compiling and analyzing the test plant results and wascompleted in 1995.
• Step 5 - Technical Studies [Sydkraft and Skanska, 1995a; 1995b; 1995c; 1995d;1995e; 1995f; 1995g; 1995h; 1995i; 1995j]
The fifth step, implemented in 1994-1995, included various technical studies, such asdefinition of operating conditions, siting criteria, risk analysis, modeling of sandwich wall

11
construction and drainage system, rock mechanics studies, quality assurance, creation of thecirculation system, and development of an aboveground plant simplified design.
• Step 6 - Engineering Studies
During the sixth step, from 1994-1996, engineering work was accomplished, includingoptimization of costs, design of sandwich wall and drainage system, gas leakage detection,study of high withdrawal and injection rates, quality control, and market analysis.
• Step 7 - Risk Assessment and Preliminary Design [Sydkraft and Gaz de France,1996a; 1996b; 1997]
The seventh step, started in 1996, was completed in 1997. It addressed mostly the riskassessment and the preliminary design of the demonstration plant.
• Step 8 - Demonstration Project
Implementation of the eighth step was approved by the partners in October 1997. This stepconsists of building and testing a demonstration plant of industrial scale. The constructionwork started in the fall of 1998, and commissioning is scheduled for the beginning of 2001. Thestorage will be located at Skallen near Halmstad in southern Sweden. The geometric volumewill be 40,000 m3 (1.4 MMcf or 250,000 barrels (bbls)), which is about one-half the size of acommercial cavern.
2.4 SUMMARY OF THE GRÄNGESBERG PILOT PLANT RESULTS
2.4.1 Test Plan General Description
The LRC concept was successfully tested in the pilot plant of Grängesberg between 1988 -1992 (e.g., Stille et al. [1994]). This was a critical step before deciding on building a full-scaledemonstration plant. Grängesberg is situated in central Sweden, 250 kilometers west ofStockholm. The predominant type of rock in the area is medium-grained granite. The plantconstruction was started in 1988 and was completed in 1989. Three test rooms were excavatedas vertical cylinders. The schematic of a typical test room is shown in Figure 2-5. Each testroom is 4.4 meters in diameter (14 feet) and 9 meters high (28 feet). The rock overburden abovethe test rooms is 50 meters (179 feet) thick. The rooms are lined on the inside with concreteand steel.
2.4.2 Test Plan Objectives
The main objectives of the test plan were as follows:
• Test the entire system under realistic load conditions.
• Test and evaluate different lining materials.

12
RSI-835-99-083
Figure 2-5. Schematic Illustration of a Typical Test Room at Grängesberg, Sweden.

13
• Analyze bedrock behavior under different pressure and temperature conditions.
• Test the drainage system.
• Demonstrate the viability of the LRC concept on a small scale.
In order to achieve those objectives, each of the test rooms was heavily equipped withinstrumentation for several different independent measurement systems, including:
• Extensometers measuring movements in the rock radially and vertically
• Mini-extensometers measuring movement at the interface between rock and concrete
• Convergence meters measuring the remaining deformation after each test
• Measurement to determine the remaining deformation in the lining
• Convergence measurement to determine deformation in the concrete barriers and in theadjacent tunnels
• Continuous monitoring of pressure and temperature in the test rooms and continuoustemperature monitoring in the concrete layer and the rock.
2.4.3 Test Program
Tests were carried out in four phases during 1989-1993. Room #1 was lined with thinstainless steel. Room #2 was lined with carbon steel. Room #3 was initially lined withpolypropylene which ruptured in an early stage of the test, and the room was later relined withthin stainless steel.
Limited pressure tests have been carried out in Room #1 with a maximum pressure of14 MPa (2,000 psi). In Room #2, comprehensive pressure tests have been carried out, includingmore than 200 load cycles up to a maximum pressure of 52 MPa (7,500 psi). Room #3 has beensubjected to a great number of load cycles up to a maximum pressure of 26 MPa (3,800 psi).
2.4.4 Test Results
The deformations measured in the surrounding rock, the concrete layer, and the lining wererelatively small considering the high-pressure levels experienced. The rock mass accounted for50 percent of the total radial deformation in the lining. The remaining 50 percent was absorbedby the concrete layer and the transition zone between the concrete and the rock. The concretelayer, when inspected after dismantling the steel liner, was relatively intact. Cracks and crackzones were formed, but no large pieces of loose concrete nor crushed zones were found. Strainsin the steel higher than the yield point were observed. However, the metallurgic analysisperformed on samples showed that the structure and properties of the steel had not beenmodified by the high-pressure loading.
14
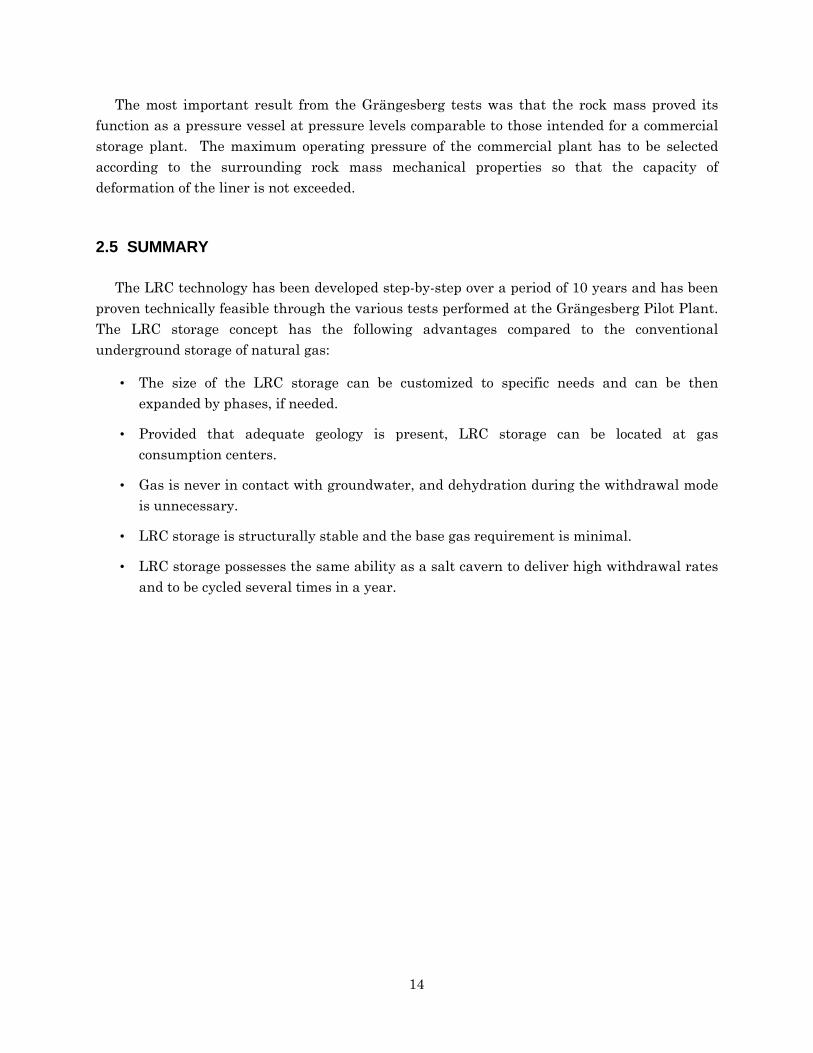
The most important result from the Grängesberg tests was that the rock mass proved itsfunction as a pressure vessel at pressure levels comparable to those intended for a commercialstorage plant. The maximum operating pressure of the commercial plant has to be selectedaccording to the surrounding rock mass mechanical properties so that the capacity ofdeformation of the liner is not exceeded.
2.5 SUMMARY
The LRC technology has been developed step-by-step over a period of 10 years and has beenproven technically feasible through the various tests performed at the Grängesberg Pilot Plant.The LRC storage concept has the following advantages compared to the conventionalunderground storage of natural gas:
• The size of the LRC storage can be customized to specific needs and can be thenexpanded by phases, if needed.
• Provided that adequate geology is present, LRC storage can be located at gasconsumption centers.
• Gas is never in contact with groundwater, and dehydration during the withdrawal modeis unnecessary.
• LRC storage is structurally stable and the base gas requirement is minimal.
• LRC storage possesses the same ability as a salt cavern to deliver high withdrawal ratesand to be cycled several times in a year.

15
3.0 MARKET DATA COLLECTION FOR CONVENTIONALALTERNATIVES
3.1 STORAGE DEMANDS
The storage alternatives that LRC has to compete with are depleted fields, aquifers, saltcaverns, and LNG. When comparing different alternatives, several aspects have to beconsidered, depending on the end customers' need. The customer profile and transportationprofile will create the type of service needed from the storage; thus, determining which costaspect is the most important for the storage to possess: low cost per working gas, low cost perdeliverability, or low cost for swing service and multiple cycles.
The customer profile is determined by the type of customer and the type of service neededfrom storage. The main customers for an underground storage service are:
• Local Distribution Companies (LDC)
• Power generation companies
• Transportation companies
• Marketers.
The LDCs supply residential and commercial customers in their territory. They have amonopoly for that service, but there is an ongoing process of dissolving this monopoly. TheLDCs mainly have two types of variations in demand to consider:
1. Seasonal variations between winter and summer
2. Peak variations due to extreme weather conditions.
The power generation companies are anticipated to cause the major growth in gasconsumption along the Atlantic coast. If a power plant is not a base-load plant, the plant willneed to face several variations in their load:
• Seasonal variation with winter and summer peaks (air conditioning)
• Weekly, daily, and hourly variations due to lower power demand during weekends andpeak demands during mornings and evenings.
The short-term variations require close proximity between the power plant and the storageto be able to deliver the high amounts at a very short notice. If the distance between thestorage and the power plant is too long, a short-term peak demand can cause a pressure drop inthe supplying pipeline; thus, reducing the transportation capacity in the pipeline that suppliesthe power plant as well as other customers with natural gas.
16
The transportation companies need to balance swing in pipeline demand in order tomaximize annual transmission capacity. They also provide "no-notice" and other swingservices, creating variations that can be balanced with storage.
Marketers are used more and more by LDCs and power generation companies to coordinatethe supply and transportation arrangements from the gas supply areas to the market. In thatrole, they have the same basic needs for storage as the LDC or power generation company.Often, a marketer tries to optimize the supply portfolio by utilizing short-term contracts andfutures; thus, taking opportunities from the prevailing market. These activities also result in ademand for short-term storage (i.e., parking and loaning).
Based on the background given above, storage cost is interesting to study from differentperspectives, depending on the customer demand. The different types of storage have differentprofiles, which makes them more or less attractive, depending on the anticipated service. Costparameters of interest to study when comparing different types of storage are:
• Investment cost/cost of service
- per working gas
- per deliverability
- per swing
- for multiple cycles
• Operational cost.
Figure 3-1 shows typical performance for different types of storage. This figure illustratesthe base for the storage cost profile for the different types of storage user. From the matrix, onecan see that salt cavern and LRC are interesting for relatively small volumes and have goodinjection and withdrawal performance, which means they are suitable for peak service, swingservice, parking and loaning, and balancing in pipelines and power generation.
3.2 GENERAL INVESTMENT COST PROFILE FOR UNITED STATES UNDER-GROUND NATURAL GAS STORAGE
In order to provide a picture of average levels of United States' storage investment costs, thecapital investment cost data for projects available from the Energy and Environmental Inc.[1994] and Thompson [1997] are presented in Figures 3-2 through 3-7. The different storagetypes have been divided into three major groups based on their working gas capacity. In orderto reflect the full range of the costs, all projects are represented by the light-colored bar.

17
RSI-835-99-084
Figure 3-1. Matrix Showing Characteristics for Different Types of Storage.
RSI-835-99-085
0.0
5.0
10.0
15.0
20.0
25.0
30.0
35.0
<3.5 <18 >18
Bcf
Do
llars
/Mcf
80% of theprojects
All projects
No. of projects = 41Median costs for capacity for sizes:
<3.5 Bcf = $5/Mcf<18 Bcf = $3/Mcf>18 Bcf = $2/Mcf
Figure 3-2. Depleted Field Investment Cost per Unit Working Gas Volume.

18
RSI-835-99-086
0.0
50.0
100.0
150.0
200.0
250.0
300.0
350.0
400.0
450.0
500.0
<3.5 <18 >18
Bcf
Do
llars
/Mcf
/day
80% of theprojects
All projects
No. of projects = 41Median costs for withdrawal rates for capacity sizes:
<3.5 Bcf = $150/Mcf/day<18 Bcf = $140/Mcf/day>18 Bcf = $100/Mcf/day
Figure 3-3. Depleted Field Investment Cost per Unit Withdrawal Rate.
RSI-835-99-087
0.0
5.0
10.0
15.0
20.0
5.0
30.0
35.0
<18
Bcf
Do
llars
/Mcf
No. of projects = 3Median costs per capacity size:
<18 Bcf = $4/Mcf
Figure 3-4. Aquifer Storage Investment Cost per Unit Working Gas Volume.

19
RSI-835-99-088
0.0
50.0
100.0
150.0
200.0
250.0
300.0
350.0
400.0
450.0
500.0
<18
Bcf
Do
llars
/Mcf
/day
No. of projects = 3Median costs per withdrawal rate for capacity size:
<18 Bcf = $290/Mcf/day
Figure 3-5. Aquifer Storage Investment Cost per Unit Withdrawal Rate.
RSI-835-99-089
0.0
5.0
10.0
15.0
20.0
25.0
30.0
35.0
<3.5 <18
Bcf
Do
llars
/Mcf
80% of theprojects
All projects
No. of projects = 24Median costs for capacity sizes:
<3.5 Bcf = $8.6/Mcf<18 Bcf = $8.2/Mcf
Figure 3-6. Salt Cavern Investment Cost per Unit Working Gas Volume.
20
RSI-835-99-090
0.0
50.0
100.0
150.0
200.0
250.0
300.0
350.0
400.0
450.0
500.0
<3.5 <18
Bcf
Do
llars
/Mcf
/day
80% of theprojects
All projects
No. of projects = 24Median costs per withdrawal rates for capacity sizes:
<3.5 Bcf = $52/Mcf/day<18 Bcf = $57/Mcf/day
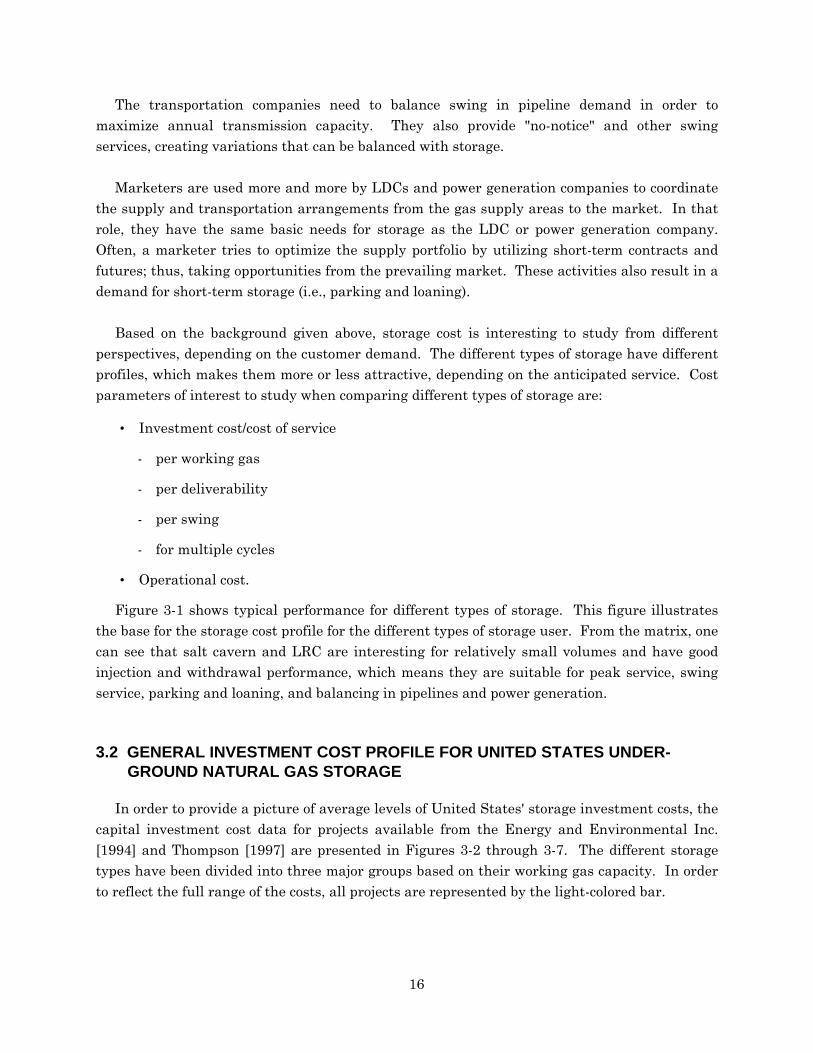
Figure 3-7. Salt Cavern Investment Cost per Unit Withdrawal Rate.
To get a better feeling for the most likely cost, a second grouping of projects, including80 percent of the total number of projects, are represented by the dark bar. The dark bar showsthe cost range if 10 percent of the storage projects with the highest and lowest cost areexcluded.
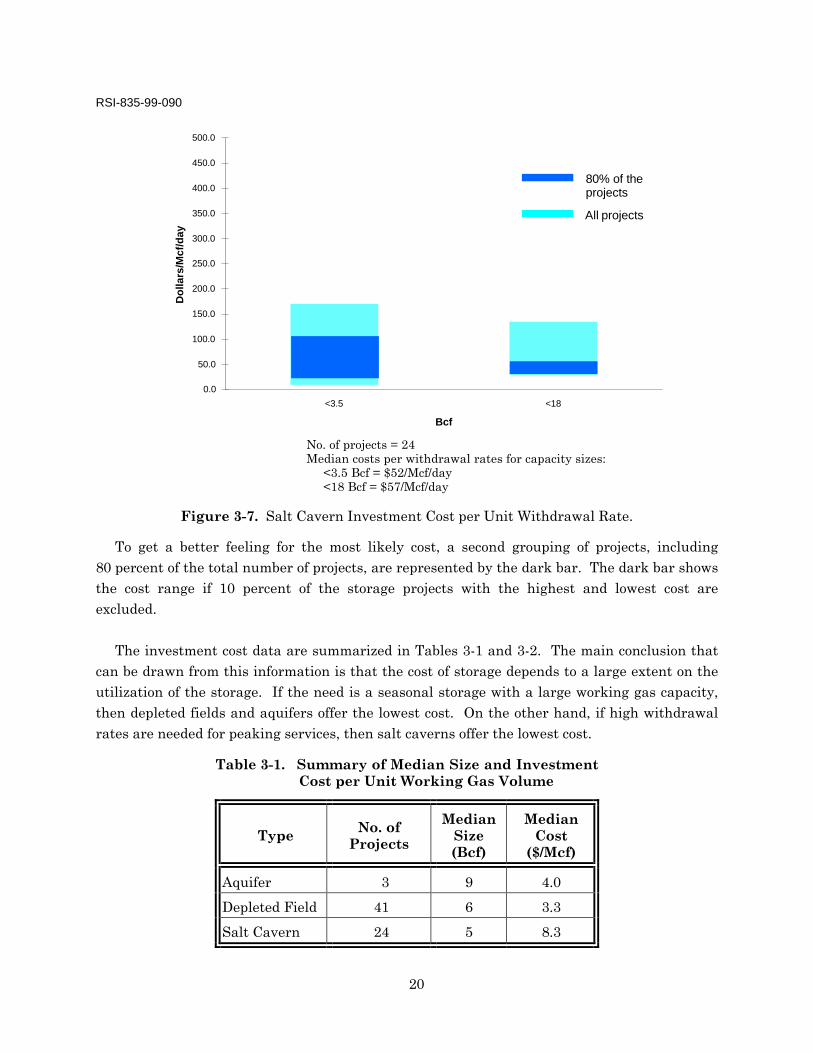
The investment cost data are summarized in Tables 3-1 and 3-2. The main conclusion thatcan be drawn from this information is that the cost of storage depends to a large extent on theutilization of the storage. If the need is a seasonal storage with a large working gas capacity,then depleted fields and aquifers offer the lowest cost. On the other hand, if high withdrawalrates are needed for peaking services, then salt caverns offer the lowest cost.
Table 3-1. Summary of Median Size and InvestmentCost per Unit Working Gas Volume
TypeNo. of
Projects
MedianSize(Bcf)
MedianCost
($/Mcf)
Aquifer 3 9 4.0
Depleted Field 41 6 3.3
Salt Cavern 24 5 8.3
21
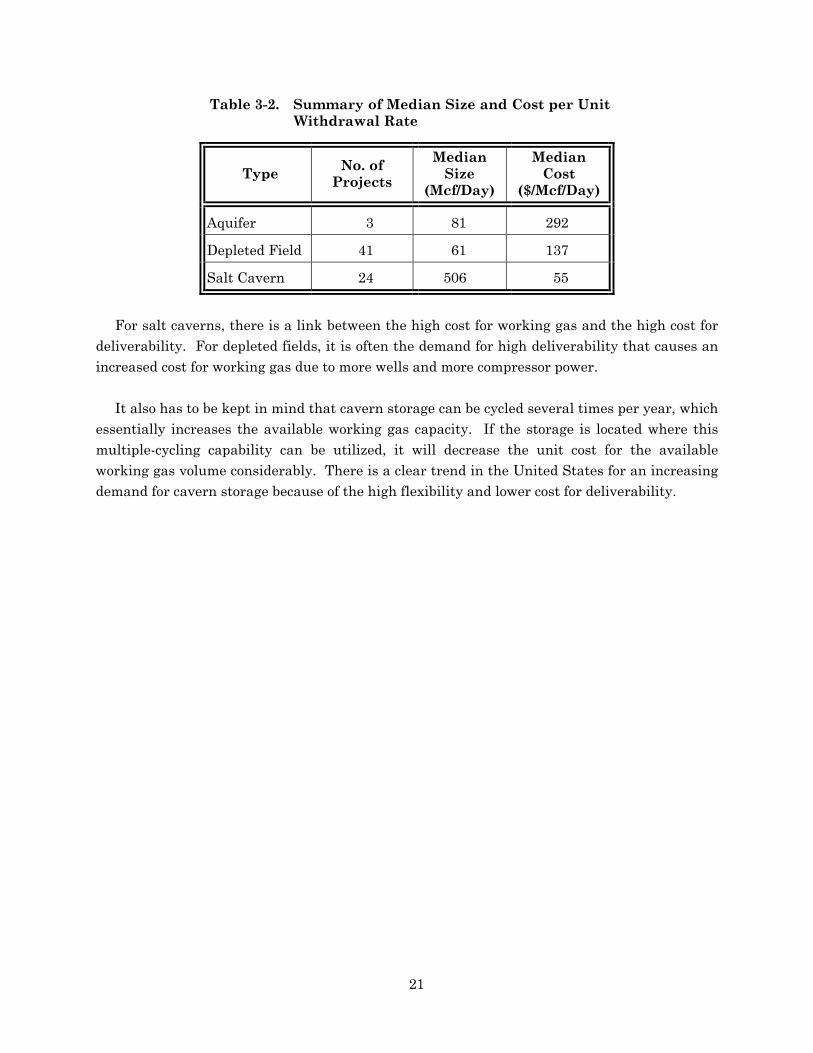
Table 3-2. Summary of Median Size and Cost per UnitWithdrawal Rate
TypeNo. of
Projects
MedianSize
(Mcf/Day)
MedianCost
($/Mcf/Day)
Aquifer 3 81 292
Depleted Field 41 61 137
Salt Cavern 24 506 55
For salt caverns, there is a link between the high cost for working gas and the high cost fordeliverability. For depleted fields, it is often the demand for high deliverability that causes anincreased cost for working gas due to more wells and more compressor power.
It also has to be kept in mind that cavern storage can be cycled several times per year, whichessentially increases the available working gas capacity. If the storage is located where thismultiple-cycling capability can be utilized, it will decrease the unit cost for the availableworking gas volume considerably. There is a clear trend in the United States for an increasingdemand for cavern storage because of the high flexibility and lower cost for deliverability.

22
4.0 IDENTIFICATION AND SELECTION OF TWO GEOLOGIC CASES
4.1 OVERVIEW
Figure 4-1 illustrates the major pipelines and salt basins in the United States, as well as theoutcrops of Precambrian and Premesozoic rocks. The latter are candidate formations for LRC.Clearly, sites for LRC are principally in the East.
Two areas in the eastern United States were selected for LRC assessment: New Englandand the Southeast area. These two areas do not have the potential for conventional storagewithin or reasonably close to their market areas and are in primarily igneous and metamorphicgeologic terrain. In addition, they are both at the eastern end of the national gas transmissionsystem. Both of these areas depend upon LNG for a portion of their supply to meet peak-day(needle peaking) needs. Both areas would benefit greatly from market area, multicycle cavernstorage.
Geological data were collected from published sources and summarized to portray thegeology in and around each of the two selected areas. The locations of pipelines supplying eacharea were plotted on the geological maps.
The geology of the United States East Coast is almost entirely igneous and metamorphicterrain except for coastal plain sedimentary cover in the Southeast and portions of the UpperEast Coast. None of the coastal plain sediments have been found to be useful for gas storage.There is only one reservoir storage facility on the East Coast located in the western part of thestate of Maryland - the Accident Field with 15.3 billion cubic feet (bcf) of working gas, 62 bcftotal capacity. The two regional areas studied are in crystalline igneous or metamorphic rocksadjacent to major supply pipelines and in close proximity to city gates. Both sites are describedin more detail below.
4.2 BEDROCK GEOLOGY OF NEW ENGLAND
The geology of New England is both complex and diverse. Major geologic features of thearea are summarized below and are illustrated in Figure 4-2.
4.2.1 Regional Geology
Eastern Massachusetts is composed of two terrains which differ in stratigraphy,metamorphism, and plutonism. These are the Nashoba zone and the Milford-Dedham zone.The Nashoba zone, which is bounded on the northwest by the Clinton-Newbury fault and on the

23
RSI-835-99-117
Figure 4-1. Major Pipelines, Salt Basins, and Precambrian and Premesozoic Outcrops in theUnited States.
0 100 200 300 400 500
SALT BASIN
GEOLOGIC-PRECAMBRIAN
MAJOR GAS PIPELINE
LEGEND
GAS MARKET HUBS
GEOLOGIC-PREMESOZOIC
AC - DC INTERCONNECTS

24
RSI-835-99-176
Figure 4-2. Index Map and Major Structural Features of Eastern Massachusetts (AfterGoldsmith [1987]).

25
southeast by the Bloody Bluff fault, is a high-grade metamorphic belt composed of steeplydipping Proterozoic Z age schist, paragneiss, and rocks intruded by Ordovician, Silurian, andDevonian age plutons. The Milford-Dedham zone, which is bounded on the west and northwestby the Bloody Bluff fault and on the east by an offshore extension of the Meguma terrain ofNova Scotia, consists of mostly crystalline Proterozoic Z age plutonic and metamorphicbasement rock which have been intruded by younger Proterozoic Z granite and granodioritebatholiths.
Nashoba Zone
The Nashoba zone is a northeast trending belt approximately 25 kilometers wide and100 kilometers long. The Clinton-Newbury fault, which defines the northwestern boundary ofthe zone, extends from the Massachusetts-Connecticut border to the Gulf of Maine. Thesoutheastern boundary of the Nashoba zone, which is defined by the Bloody Bluff fault,approximately parallels the Clinton-Newbury fault and is located 20 kilometers northwest ofthe center of the city of Boston. The Nashoba zone appears to be synformal with only a fewlarge-scale folds identified; however, the zone contains many small-scale easterly trendingfolds. The zone is cut by many northeast-trending longitudinal faults which are post-Silurian,possibly Mesozoic in age. Older faulting within the zone and in the Clinton-Newbury faultsystem are west-dipping, low-angle thrust and reverse faults which are possibly of Acadian age.The younger faulting tends to be steeply dipping and is characterized by brecciation and gougealong the fault trace, while the older faults are characterized by mylonite or microbrecciation.
The Nashoba zone lies in a narrow belt of high-grade metamorphism, which consists ofpelitic rocks of the Nashoba Formation, Fish Brook Gneiss, Shawsheen Gneiss, Tadmuck BrookSchist, and the Marlboro Formation. These rocks are of Proterozoic Z age (580-730 millionyears) and represent sedimentation and volcanism within a basin forming adjacent to a volcanicarc. The pelitic rocks of the Nashoba, Shawsheen, and the eastern part of the Tadmuck Brookcontain sillimanite-muscovite and sillimanite-orthoclase mineral assemblages, while the peliticrocks of the Marlboro and western part of the Tadmuck Brook contain mineral assemblages ofstaurolite and andalucite. The rocks assemblage described have been placed in the sillimanite-almadine-orthoclase subfacies of the highly metamorphosed almadine-amphibolite facies. Themineral associations of the Nashoba belt suggest that these rocks recrystalized at atemperature of 625-650°C and a pressure of 6 kilobars, indicating a burial depth ofapproximately 23 kilometers. In the northern portion of the Nashoba zone, evidence suggeststhat additional thermal metamorphism occurred contemporaneous with the emplacement of theOrdovician age Andover Granite. The later emplacement of the Sharpners Pond Diorite duringthe Silurian and a Devonian age Andover Granite appears to have little additionalmetamorphic effect.
The intrusive rocks of the Nashoba zone range in age from Ordovician to Devonian and arelargely massed in the northern portion of the zone. The Andover Granite intruded in twophases: the Ordovician age Andover Granite (450 million years) covers an area of

26
approximately 200 square kilometers and is a light-colored, muscovite-garnet-bearing gneissicgranite which intruded the formations of the Nashoba zone at all scales. The Sharpners PondDiorite (430 million years) covers an area of approximately 150 square kilometers and is anhornblende diorite to granodiorite. The Straw Hollow Diorite and Assabet Quartz Diorite,which appear to be slightly older than the Sharpners Pond Diorite, cover an area ofapproximately 26 square kilometers and are gray to green colored, weakly foliated hornblendediorite to granodiorite. The Devonian age Andover Granite (410 million years) is a light-colorednongneissic binary granite, and in addition, a nongneissic pegmatitic granite which intrudesboth the gneissic Andover Granite and the Sharpners Pond Diorite.
Milford-Dedham Zone
The Milford-Dedham zone has been broken by normal and reverse faults into upthrownblocks of Proterozoic age plutonic and metamorphic basement rock and downthrown blockscontaining sedimentary and volcanic cover rocks of Proterozoic Z, Cambrian, Silurian-Devonian, Pennsylvanian, Triassic, and Jurassic age. The major upthrown blocks are theMilford antiform, the Salem block, and the southeastern Massachusetts batholith, which issubdivided into the Dedham, Foxborough, and Fall River blocks. The downthrown blocks arethe Newbury, Middleton, Boston, Norfolk, Bellingham, and Narragansett basins.
The Milford antiform consists of gneissic plutonic rocks of the Proterozoic Z SterlingPlutonic Suite, Milford Granite, metasedimentary and metavolcanic rocks of the Plainfield andWestboro Formations and the Blackstone Group. The metasedimentary and metavolcanicformations are largely in the amphibole facies of metamorphism and are thought to haveundergone metamorphism prior to the intrusion of the plutonic rocks. In general, the Milfordantiform is divided into two areas of varying deformation. An extension of the Northern Borderfault, which is the boundary between the Milford antiform and the Boston basin, separate thevariably deformed amphibole facies plutonic, quartzitic, and paragneissic rocks of the west fromthe fractured, brittlely deformed greenschist facies plutonic, metasedimentary, and meta-volcanic rocks.
The Milford Granite is located near the town of Milford and occupies an area ofapproximately 100 square kilometers. The Milford is divided into two phases: a light-coloredpink granite and a darker-colored granodiorite. The Milford Granite, along with the EsmondGranite, form the core of the Milford antiform and are relatively undeformed.
The Salem block, which is located north of the Milford antiform, consists primarily ofProterozoic Z age mafic plutonic rocks, mafic to felsic metavolcanic rocks, and minormetasedimentary rocks. These rocks have been intruded by the younger Proterozoic Z ageDedham Granite and Topsfield Granodiorite and by early and middle Paleozoic alkalic graniteand gabbro. The metavolcanic and metasedimentary rocks contain assemblages typical of theamphibole facies metamorphism, while the Dedham Granite and Topsfield Granodiorite exhibitmetamorphism no higher than the greenschist facies. The Paleozoic age Peabody Granite forms

27
the core of the Peabody pluton, which has an area of approximately 50 square kilometers. ThePeabody Granite is a light-gray to green-colored, weathered granite consisting of alkalifeldspar, quartz, and ferrohornblende. The Cape Ann pluton consists of the Ordovician-Silurian age Cape Ann Granite, the Beverly Syenite, and the Squam Granite. Together, thesemembers occupy an area of approximately 385 square kilometers. The Cape Ann Granite is agrayish-green, medium- to coarse-grained granite to quartz syenite. The term Beverly Syeniterefers to rocks similar to the Cape Ann but completely absent of quartz. The Squam Granite isa gray to brown, fine- to medium-grained, porphyritic alkalic granite and occupies only an areaof 5 square kilometers within the overall Cape Ann Complex.
The Dedham, Foxborough, and Fall River blocks are located southeast of the Milfordantiform and Salem block and form the Proterozoic Z age southeastern Massachusettsbatholith. The Dedham and Foxborough blocks consist almost entirely of plutonic basementrock; metasedimentary and metavolcanic rocks are rare and are only found as inclusions withinthe plutonic rock. The plutonic rocks of the Dedham and Foxborough blocks are similar incomposition and texture as the Proterozoic Z plutonic rocks of the Salem block, except as awhole, they are significantly less deformed, fractured, or altered. The Fall River block isseparated from the Foxborough block by the Narragansett basin. The plutonic rocks are similarin composition and texture to that of the Foxborough block. The Fall River block containssignificantly more metasedimentary and metavolcanic basement rock, which grade from thelow-grade greenschist facies of metamorphism in the northern part of the block to a high-gradeamphibole facies in the south.
The Newbury basin is a small wedge-shaped lenticular basin located between the Nashobazone and the northern part of the Salem block. The basin is believed to have formed as agraben within the Bloody Bluff fault complex during Paleozoic time. The strata isunmetamorphosed Silurian-Devonian marine sediments and volcanic rocks, which havesubsequently been overturned. The Middleton basin lies in the same structural zone as theNewbury basin and includes an area no greater than 6 kilometers long and 0.5 kilometer wide.This basin is filled with Triassic-Jurassic redbed deposits.
The Boston basin, which is separated from the Milford antiform and Salem blocks on thenorth and west by the Northern Border fault and the Dedham and Foxborough blocks on thesouth by the Mount Hope and Blue Hills faults, contains unmetamorphosed Proterozoic Zsedimentary and volcanic rocks of the Boston Bay Group overlying basement rocks of theMilford antiform, Salem, and Dedham blocks. The Northern Border fault is a reverse faultapproximately 38 kilometers long that has thrust the Salem block and Melrose subblocksoutheastward over the Boston Bay Group. The throw on this fault is estimated to be1,300 meters. The Mount Hope fault, which is the northeastern border of the Dedham block, isbelieved to be a northward-directed thrust fault which has subsequently been rotated to nearvertical. The maximum throw on the fault is estimated at 350 meters. The Blue Hill fault,which forms the boundary between the Boston Basin and the Foxborough block, is thought to be

28
a northward-directed thrust fault which has been subsequently rotated and tilted. The throwon this fault is estimated at 5,000 meters. The Quincy pluton is located on the southern borderof the Boston basin and is composed of the Silurian-Ordovician age Quincy Granite and BlueHills Granite. The pluton occupies an area of approximately 55 square kilometers and isdescribed as a light brown to pink, fine- to coarse-grained hornblende granite.
The Norfolk basin is located between the Dedham and Foxborough blocks and is similar tothe Narragansett basin in that it is composed largely of unmetamorphosed Pennsylvanian agemarine and nonmarine sediments overlying Proterozoic Z basement rocks. The basin is faultbounded with throws estimated at 400 meters.
The Bellingham basin, which is located on the Massachusetts-Rhode Island border, is afault-bounded graben composed primarily of slightly metamorphosed (greenschist facies)Pennsylvanian age nonmarine pebbles to conglomeratees clastic deposits.
The Narragansett basin is located between the Foxborough and Fall River blocks and iscomposed largely of the unmetamorphosed fine- to medium-grained Pennsylvanian age marineand nonmarine sedimentary rocks. The Pennsylvanian rests nonconformably on theProterozoic basement rocks. The basin is estimated to be 2,000 meters thick with the maximumsubsidence occurring at the northern and southern borders.
4.2.2 Potential Storage Sites
Numerous potential storage sites for LRC exist in the Northeast. From a geomechanicsstandpoint, evaluation of the Rock Mass Rating (RMR) is perhaps the most expedient methodfor determining site suitability. Other important site selection factors include pipeline access,ease of permitting, groundwater conditions, local faulting, and access.
4.3 BEDROCK GEOLOGY OF THE SOUTHEAST AREA
The geology of the Southeast United States is nearly as diverse as the Northeast. The majorgeologic features of the area are summarized below and illustrated in Figure 4-3.
4.3.1 Regional Geology
Northern Georgia encompasses four geographical regions: Cumberland Plateau, Valley andRidge, Blue Ridge Mountains, and Piedmont Plateau. These geographical regions, except thePiedmont Plateau, are included as part of the Appalachian Mountains. The CumberlandPlateau, which is located in the extreme northwestern corner of the state, is characterized bynarrow infertile valleys bordered by high, steep ridges. The Valley and Ridge region lies to theeast of the Cumberland Plateau and is characterized by wide, flat fertile valleys separated by
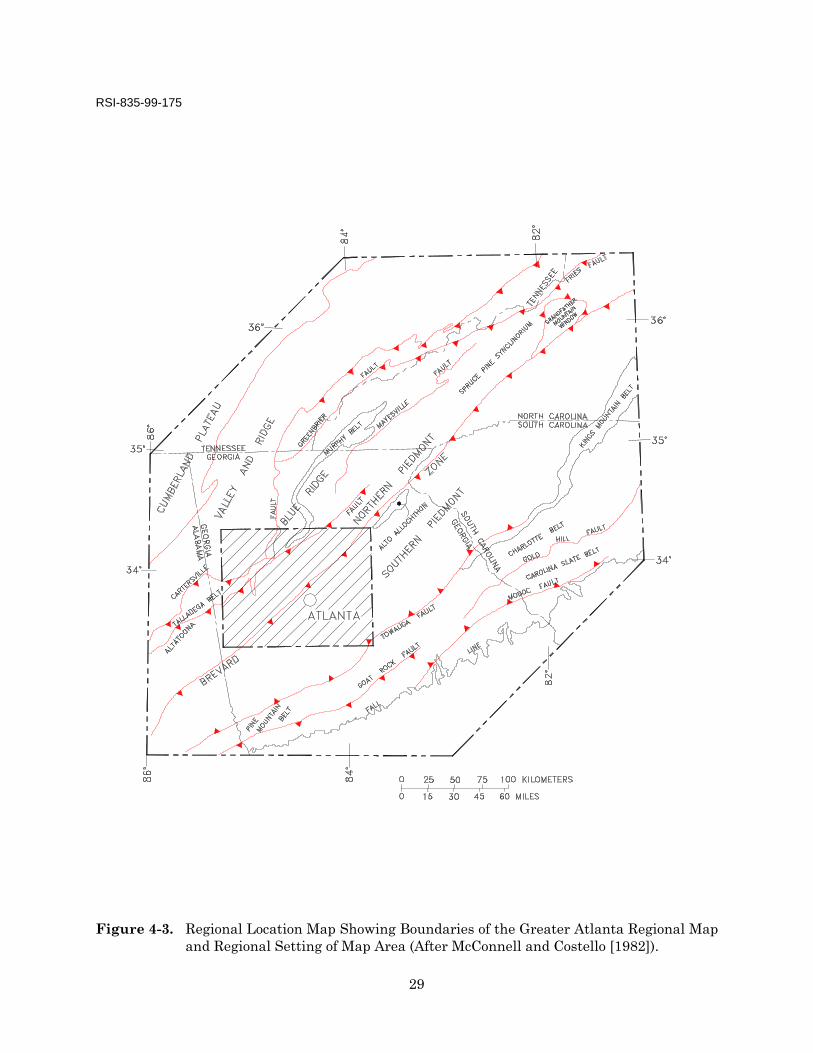
29
RSI-835-99-175
Figure 4-3. Regional Location Map Showing Boundaries of the Greater Atlanta Regional Mapand Regional Setting of Map Area (After McConnell and Costello [1982]).

30
narrow, steep-sided ridges. The Blue Ridge Mountains region is characterized by roundedforested mountains separated by narrow valleys underlain by crystalline bedrock. ThePiedmont Plateau makes up most of the northern one-half of the state and is characterized byrolling hills also underlain by crystalline bedrock.
Rocks of the Atlanta region area are divided into three major geologic provinces: Valley andRidge, Blue Ridge, and Piedmont. The Valley and Ridge Geologic Province is composed ofunmetamorphosed to weakly metamorphosed (greenschist facies) Paleozoic age rocks of theforeland thrust and fold belt. The Blue Ridge Geologic Province is composed of metamorphosedProterozoic Y basement rocks and Proterozoic Z age to early Paleozoic age metasedimentaryrocks. The Piedmont Geologic Province is composed of Proterozoic Z age to early Paleozoic agemetasedimentary and plutonic rocks. The Piedmont Geologic Province is subdivided into theNorthern and Southern Piedmont Provinces and is composed of Proterozoic Z to early Paleozoicmetasedimentary, metavolcanic, and plutonic rocks.
Valley and Ridge Province
The Valley and Ridge Province is defined as that region located between the CumberlandPlateau and the Blue Ridge Mountains. The boundary between the Valley and Ridge Provinceand the Blue Ridge Province corresponds with the trace of the Cartersville fault. Rocksranging in age from Lower Cambrian to Pennsylvanian are present in this region, but onlyrocks of Lower Cambrian age are present in the immediate Atlanta area. The oldest rocks inthe province are represented by the Chilhowee Group, Cochran Formation, Nichols Formation,Wilson Ridge Formation, and Weisner Formation.
The Wilson Ridge and Weisner Formations are the only members of the Chilhowee Grouppresent in the Atlanta area. Rocks of the Wilson Ridge Formation are described as fine- tocoarse-grained, moderately well-sorted orthoquartzite. Overlying the Wilson Ridge is theWeisner Formation, which is composed of rocks described as very fine- to fine-grainedorthoquartzite, cross-bedded fine- to coarse-grained orthoquartzite, conglomerate and grayish-green mudstone.
Overlying the Weisner is the Shady Dolomite, which is described as a thin, dark gray toblack, fine-grained dolomite having paper-thin shale lamellae. The Rome Formation overliesthe Shady Dolomite and is described as a red- to green-colored, fine-grained, slight calcareoussandstone with some thin layers of limestone present.
Blue Ridge Province
The Blue Ridge Province is defined as those rocks present between the Cartersville fault onthe north and the Allatoona fault on the south. The Blue Ridge portion of the Atlanta regionarea is dominated by two structural features: the Salem Church anticlinorium and the Murphysynclinorium.

31
The Salem Church anticlinorium is composed of the Proterozoic Y (1,000 million years) ageCorbin Gneiss Complex and the Proterozoic Z age Ocoee SuperGroup: Snowbird Group, WaldenCreek Group, and Great Smoky Group. Rocks comprising the Corbin Gneiss Complex form thecore of the Salem Church anticlinorium and consists of a paragneiss described as a coarse-grained, quartz-monzonitic orthogeneiss- medium- to coarse-grained, orthoclase-mica gneissand metaigneous granite and granodiorite. The Snowbird Group consists of the PinelogFormation, which unconformably overlies the Corbin Gneiss. The Pinelog Formation isdescribed as poorly sorted quartz-pebble metaconglomerate, metasandstone, metasiltstone, andmetashale. Rocks of the Pinelog Formation are erosional in origin and are derived from thegranitic Corbin Gneiss facies. Overlying the Pinelog is the Wilhite Formation of the WaldenCreek Group, which consists of a think sequence of metasandstone, sandy marble, andcalcareous metasiltstone. The Great Smoky Group is the uppermost member of the OcoeeSuperGroup and consists of the Etowah Formation, Sweetwater Creek Formation, and theDean Formation. The Etowah Formation lies conformably on the Wilhite Formation andconsists of a monotonous sequence of interlayered metasandstones and meta-argillite withsmall lenses of calc-silicate granofels. Overlying the Etowah is the Sweetwater CreekFormation which consists of poorly sorted coarse-grained conglomeritic metasandstone withthin interbeds of graphitic phyllite. The Dean Formation is the uppermost member of the GreatSmoky Group and consists of a moderately well sorted quartz-pebble metaconglomerate.
Within the Murphy synclinorium, the Dean Formation is overlain by Lower Paleozoic agerocks of the Murphy Belt Group: Nantahala Formation, Brasstown Formation, MurphyMarble, Marble Hills Hornblende Schist, and the Mineral Bluff Formation. The NantahalaFormation is predominantly a carbonaceous phyllite to laminated argillite with interbeds offine- to medium-grained metasandstone. Overlying the Nantahala is the Brasstown Formationwhich consists of interlayered gray schists and micaceous quartzites. The Murphy Marble,which is a fine- to medium-grained calcitic to dolomitic marble, overlies the Brasstown and is ahigh-quality commercial quarried commodity. The Murphy Marble grades upward culminatingin the Marble Hills Hornblende Schist. A relatively thin transition zone is considered theformation boundary. The Mineral Bluff Formation is the uppermost member of the MurphyBelt Group and is described as a thick sequence of pelitic rocks with included garnet-quartz-sericite schist and pure-sericite schist.
Northern Piedmont Province
The Northern Piedmont Province includes all rocks lying between the Allatoona fault andthe Brevard fault and includes the late Precambrian age New Georgia and Sandy CreekGroups. In the Atlanta region area, the New Georgia Group is characterized by the dominanceof metavolcanic rocks over metasedimentary rocks. The Sandy Creek Group is the opposite andis characterized by the dominance of metasedimentary rocks over metavolcanic rocks.
The New Georgia Group is exposed in outcrop along a belt 22 kilometers wide and 210 kilo-meters long and contains most of the base and precious metal deposits in the region. The New

32
Georgia Group is composed of intermingled beds of metamorphosed felsic and mafic volcanicrocks, plutonic rocks, and a small amount of sedimentary rocks. Metamorphism and intensedeformation have obliterated the original sedimentary and volcanic textures, making theinternal stratigraphy of the New Georgia Group very difficult. However, portions of the NewGeorgia Group in the Atlanta region area are well known and have been extensively studied.These stratigraphic units and areas include the Mud Creek Formation in the Villa Rica area,the Pumpkinvine Creek Formation to the northeast of the Villa Rica area, and the UniveterFormation near the town of Univeter.
The Mud Creek Formation is composed of garnetiferous, hornblende-plagioclase amphibolitegneiss interlayered with garnet-biotite schist and gneiss and banded-magnetite quartzite. ThePumpkinvine Formation is composed of hornblende-quartz-plagioclase gneiss interlayered withbiotite-muscovite-plagioclase gneiss and amphibolite. The Univeter Formation is composed of asequence of amphibolite, hornblende gneiss, garnet-biotite-muscovite schist, garnet-chloriteschist, and banded-magnetite quartzite.
The Sandy Springs Group overlies the New Georgia Group and represents the most areallyextensive rock group in the Northern Piedmont Province. The Sandy Springs Group is dividedinto rocks of the eastern belt and the western belt. The Sandy Springs (eastern belt) consists ofthree formations: Powers Ferry Formation, Chattahoochee Palisades Quartzite, and FactoryShoals Formation. The Powers Ferry Formation is the oldest unit in the Sandy Springs Groupand is composed of interlayered gneiss, schist, and amphibolite. Overlying the Powers Ferry isthe Chattahoochee Palisades Quartzite, which is described as a massive white to yellowish,sugary to vitreous quartzite containing mica and garnet. Overlying the ChattahoocheePalisades is the Factory Shoals Formation, which is composed of garnet-biotite-oligoclase,which varies from a kyanite-quartz schist to a staurolite-muscovite-quartz schist.
The Sandy Springs (western belt) consists of three formations: Dog River Formation, AndyMountain Formation, and Bill Arp Formation. The Dog River Formation is composed ofinterbedded muscovite-biotite-quartz-feldspar gneiss, garnet-muscovite schist, amphibolite, andthin beds of magnatite quartzite. Overlying the Dog River is the Andy Mountain Formation,which is composed of garnet-muscovite-quartz schist and sugary quartzite. The Bill ArpFormation is the uppermost member of the Sandy Springs (western belt) Group and consists ofinterlayered garnet-biotite-muscovite-plagioclase-quartz schist and metagraywacke.
Southern Piedmont Province
The city of Atlanta is located within the Southern Piedmont Province. The SouthernPiedmont Province is defined as those rocks lying between the Brevard fault and the AtlanticCoastal Plain and includes late Proterozoic Z to early Paleozoic rocks of the Atlanta Group. Thesimilarity of the rock units and stratigraphic sequence indicates the rocks of the Atlanta Groupare equivalent to those of the New Georgia and Sandy Springs Group. The Southern PiedmontProvince has been complicated by intrusion of late Paleozoic plutons but is currently accepted

33
that the rocks south of the Brevard fault were deposited in similar environments as the rocksnorth of the Brevard fault. In general, the Camp Creek and Big Cotton Indian Formations ofthe Southern Piedmont are equivalent to the New Georgia Group. The Clarkston, Stonewall,Wahoo Creek, Clairmont, Norcross Gneiss, and Promise Land Formations of the SouthernPiedmont are equivalent to the Powers Ferry Formation of the Sandy Springs Group. TheLanier Mountain Quartzite of the Southern Piedmont is equivalent to Chattahoochee PalisadesQuartzite, and the Norris Lake Schist is equivalent to the Factory Shoals Formation.
Plutonic Rocks
Post Grenville (Proterozoic Y) age-intrusive rocks are generally limited to the PiedmontProvinces, although numerous pegmatites occur in the Blue Ridge Province. Plutons ofGrenville age or older are limited to the Corbin Gneiss Complex in the Blue Ridge Province.Paleozoic-intrusive rocks in the Piedmont Provinces are divided into three categories:premetamorphic, presynmetamorphic, and postmetamorphic. Paleozoic metamorphism is notexactly known or defined but has been interpreted to have occurred at approximately 265million years.
Intrusive rocks in the Piedmont Provinces that were emplaced prior to metamorphism andsubsequent deformation have lost most of their original fabric and texture; however, severalpremetamorphic plutons are recognized in the Atlanta region area. The Villa Rica Gneiss,Laura Lake Mafic Complex, Acworth Gneiss, Kellogg Creek Mafic Complex, and Galts FerryGneiss are members of the premetamorphic category north of the Brevard fault. Biotitic-plagioclase gneisses of the Big Cotton Indian, Camp Creek, possibly Promise Land and NorcrossGneiss formations are premetamorphic intrusives found south of the Brevard fault.
Presynmetamorphic intrusive, like those intrusives in the premetamorphic category, retaindeformational fabrics associated with Paleozoic metamorphism. However, unlike thosepremetamorphic plutons, presynmetamorphic intrusives, they show no direct relationship tosurrounding extrusive rocks. In general, presynmetamorphic intrusives contain far morepotassium and are considered as peraluminous to meta-aluminous. The Austell, Sand Hill, andMulberry Rock Gneiss are intrusives found north of the Brevard fault while the Union CityComplex is the only intrusive in this category found south of the Brevard fault.
Postmetamorphic-intrusive rocks in the Atlanta region area can be divided into twosubdivisions: those emplaced 300-325 million years and those emplaced 180-230 million years.The older of the two subdivisions is represented by large felsic plutons, such as the StoneMountain, Ben Hill, Panola, and Palmetto Granites, and are limited to the Southern PiedmontProvince. These large plutons are similar in texture and composition and are characteristicallymedium- to coarse-grained porphyritic granites composed of biotite-muscovite-quartz-plagioclase-microcline. These plutonic rocks show no metamorphic overprint or fabricdeformation. Intrusives of the younger subdivision are Jurassic-Triassic age diabase dikes and

34
are also limited to the Southern Piedmont Province except one small diabase dike located in theBlue Ridge Province.
4.3.2 Potential Storage Sites
As with the Northeast, many potential LRC sites exist in the Southeast. Again, evaluatingthe RMR is perhaps the most expedient method for accessing site suitability from ageomechanics perspective. The groundwater, pipeline access, ease of permitting, and accesswill also play important roles in siting an LRC in the Southeast.
35
5.0 CONCEPTUAL DESIGN FOR LRC
5.1 DESIGN PRINCIPLES
Certain aspects of the LRC technology or technology development that were discussed inChapter 2.0 are discussed again below in more detail to more fully explain the LRC designprinciples.
5.1.1 Historical Background
More than 10 years of research and development have been invested in the LRC concept.The development work can briefly be described by looking at the eight major steps taken duringthis period to advance the development of the LRC concept. A brief description of the eightmajor steps discussed previously in Chapter 2.0 is summarized below.
• Step 1 - Conceptual Studies
The first step consisted of basic conceptual studies and was conducted from 1987 through1992 by a combination of Scandinavian companies, including Sydkraft, Sydgas, Swedgas, andVattenfall. These studies principally addressed the issue of the cavern lining and its tightnessto gas.
• Step 2 - Experimental Tests
During the second step, from 1990 to 1994, two concepts of gas storage in rock cavern using awater seal and storage at low temperature (chilled storage) were studied through a series oftests performed in the Röda Sten experimental rock cavern.
• Step 3 - Grängesberg Pilot Plant
A pilot plant was constructed in 1988-1989 at Grängesberg in Sweden and used for testingfrom 1989 through 1993. The purpose was to experiment with different linings and evaluatethe effect of increasing pressure, to test the benefit of reduced storage temperature, to furtherinvestigate the feasibility of stainless steel lining, to better understand the fracture mechanismin the surrounding rock, and to test the consequence of leakage in the liner at high pressure.
• Step 4 - Test Plant Result Interpretation
The fourth step consisted of compiling and analyzing the test plant results and wascompleted in 1995.
• Step 5 - Technical Studies
Technical studies, such as operational conditions, siting criteria, risk analysis, modeling ofsandwich wall construction, drainage system, rock mechanics studies, quality assurance,
36
creation of the circulation system, and aboveground plant simplified design were implemented1994-1995.
• Step 6 - Engineering Studies
During the sixth step, from 1994-1996, engineering work had been accomplished, includingdesign of sandwich wall and drainage system, gas leakage detection, study of high withdrawaland injection rates, quality control, and market analysis.
• Step 7 - Risk Assessment and Preliminary Design
The seventh step, started in 1996, was completed in 1997. It addressed mostly the riskassessment and the preliminary design of the demonstration plant. These studies were carriedout jointly by the present LRC partners: Gaz de France and Sydkraft.
• Step 8 - Demonstration Project
The eighth step, whose implementation was approved by the partners in October 1997,consists of building and testing a demonstration plant of industrial scale. The constructionwork started in the fall of 1998, and commissioning is scheduled for the beginning of 2001. Thestorage will be located at Skallen near Halmstad in southern Sweden. The geometric volumewill be 40,000 m3 (1.4 MMcf or 250,000 bbls), which is one-half the size of a commercial cavern.
Besides development of the concept, the efforts made in cooperation with the Royal Instituteof Technology in Stockholm, Sweden, and the Chalmers Institute of Technology, Gothenburg,Sweden, have contributed to the knowledge of strength and general behavior of the rock massthat is subjected to the high gas storage pressures.
5.1.2 General Rock Mechanics Aspects
This section will describe general rock mechanical aspects which constitute the basis for thebehavior of the rock mass, and thus, the design. The presentation is related to the test plant inGrängesberg which was used for verification and development of the theories behind the LRCconcept.
The general approach for the Grängesberg pilot tests was to use established and well-knownmethods to classify the rock mass in order to establish the rock mass parameters. Theparameters were used together with rock mechanics principals for prediction of deformations.The logic chain of the approach is shown in Figure 5-1.
5.1.2.1 Expected General Behavior of the Rock Mass
The expected deformation of the rock mass in the Grängesberg Pilot Plant (see Figure 5-2)was based on the rock mechanics principles (e.g., Brown et al. [1983]; Stille [1984]). The rockmechanics approach, termed here as the "elasto-plastic" approach, is the normal approach for

37
rock mechanic applications commonly used in Sweden. At low pressures, an elastic behavior isexpected. At higher pressures, tensile stresses will occur, starting in the rock surface. Whenthe strength of the rock mass is exceeded, shearing and compression takes place in the jointsleading to plastic or irreversible deformations.
RSI-835-99-091
Field inves-tigationsLaboratorytests
Rock massclassification
Estimation of rockmass parameters
Prediction ofdeformationsaccording to thetheory of elasto-plasticity
Pilot test inGrängesberg
ANALYSIS
Figure 5-1. The Logic Chain of the Approach Adopted for the Grängesberg Pilot Plant Tests.
RSI-835-99-092
Figure 5-2. Expected Principal Elasto-Plastic Behavior of the Rock Mass. Tensile Stresses inthe Rock Surface Occur at Twice the Initial In Situ Stress, 2P0 (for an IsotropicStress Field). Plastic Deformations Occur When the Compressive Strength of theRock Mass, σc,m, Is Exceeded.

38
At high pressures, three deformation zones will develop around the cavern, as illustrated inFigure 5-3. The radius and the thickness of each zone depends on the strength of the rock massand the initial in situ stress field. A weaker rock will result in a larger plastic zone.
RSI-835-99-093
Elastic zone
Elastic+tensile zone
Elastic+tensile+shear zone
Concrete lining
Storage cavern
Steel lining
P0, T0, Em
Ψ, ϕ, c
Figure 5-3. Illustration of the Different Deformation Zones Around a Pressurized LRC.
An isotropic elasto-plastic behavior is relevant when studying large volumes of a rock masswith several joint sets. This is, for example, the case for the Grängesberg Pilot Plant. If a rockmass contains only a few sets of discontinuities, then when looking at the detailed behavior ofsingle rock blocks and joints, a more anisotropic behavior must be considered, as themechanical properties will vary in different directions.
5.1.2.2 Rock Mass Classification and Properties
The Grängesberg Pilot Plant is located in an area dominated by a medium-grained graniticrock (for intact rock: σc = 340 MPa, E = 56 GPa). Steep joints are found in mainly threedirections in the area. Horizontal joints occur only sparsely. The initial horizontal stresses arelow (1-4 MPa). During the investigation phase, geological information was gathered from thefollowing activities:
• Field observations relating to joint spacing and orientation, joint roughness, jointfilling materials, and groundwater flow.
• In situ stress measurements to determine the principal stresses of the rock mass.
39
• Core drilling to determine the Rock Quality Designation (RQD).
• Laboratory tests on core samples for determining uniaxial compressive strength,elastic modulus, density, and Poisson's ratio of the intact rock.
The geological information gathered above was used to classify the rock mass according totwo different methods: the geomechanics Rock Mass Rating (RMR) system and the Q(Tunneling Quality Index) method. Both of these methods are standard methods in Sweden,are internationally recognized, and have been used for the design of underground excavationsall over the world.
The RMR system [Bieniawski, 1973] uses six parameters to classify a rock mass:
1. Uniaxial compressive strength of the intact rock
2. RQD
3. Spacing of discontinuities
4. Condition of discontinuities
5. Groundwater conditions
6. Orientation of discontinuities.
The Q method [Barton et al., 1974] is based on a large number of case histories. The ratingis based on the following six parameters:
• RQD
• Joint set number, Jn
• Joint roughness number, Jr
• Joint alteration number, Ja
• Joint water reduction factor, Jw
• Stress reduction factor, SRF.
In order to estimate the mechanical properties; i.e., the compressive strength (characterizedwith cohesion, c, and the angle of internal friction, φ) and the E modulus of the rock mass inGrängesberg, several empirical methods were used. The methods are based on or related to therock mass classification. Methods used in Grängesberg are listed in Table 5-1.
As a result of the site investigation, the rock mass classification and the estimation of themechanical properties, the values for the important parameters shown in Table 5-2 wereobtained.
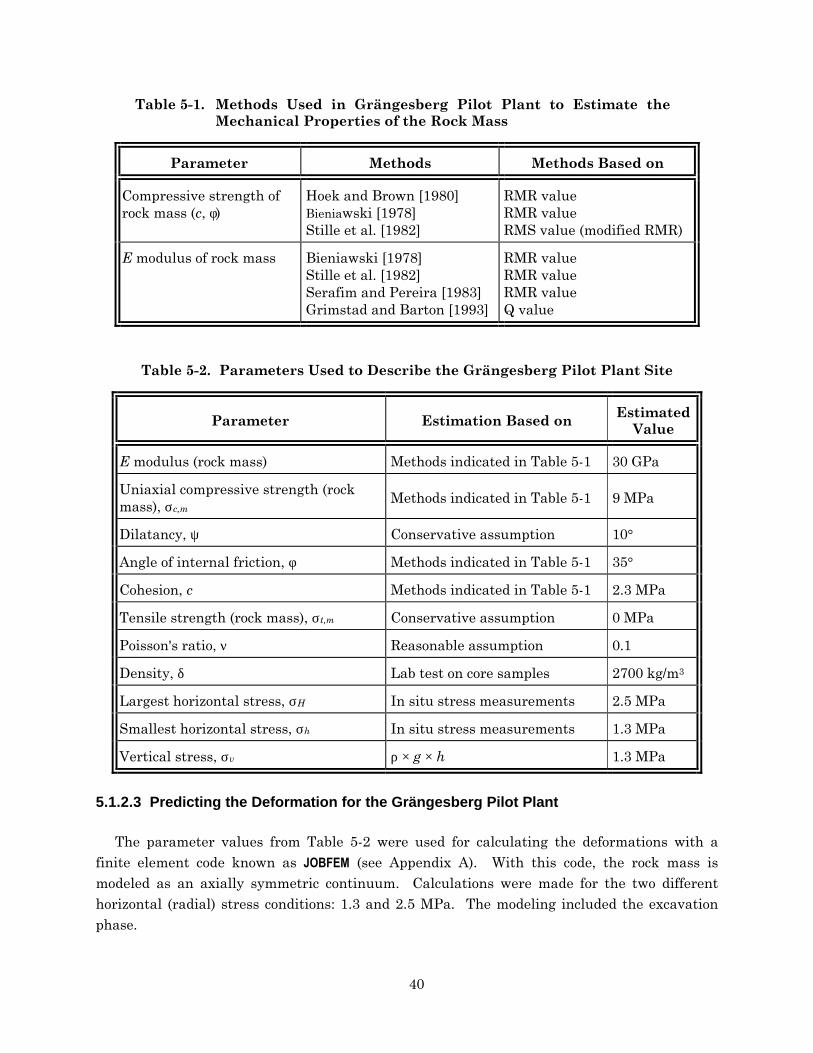
40
Table 5-1. Methods Used in Grängesberg Pilot Plant to Estimate theMechanical Properties of the Rock Mass
Parameter Methods Methods Based on
Compressive strength ofrock mass (c, φ)
Hoek and Brown [1980]Bieniawski [1978]Stille et al. [1982]
RMR valueRMR valueRMS value (modified RMR)
E modulus of rock mass Bieniawski [1978]Stille et al. [1982]Serafim and Pereira [1983]Grimstad and Barton [1993]
RMR valueRMR valueRMR valueQ value
Table 5-2. Parameters Used to Describe the Grängesberg Pilot Plant Site
Parameter Estimation Based onEstimated
Value
E modulus (rock mass) Methods indicated in Table 5-1 30 GPa
Uniaxial compressive strength (rockmass), σc,m
Methods indicated in Table 5-1 9 MPa
Dilatancy, ψ Conservative assumption 10°
Angle of internal friction, φ Methods indicated in Table 5-1 35°
Cohesion, c Methods indicated in Table 5-1 2.3 MPa
Tensile strength (rock mass), σt,m Conservative assumption 0 MPa
Poisson's ratio, ν Reasonable assumption 0.1
Density, δ Lab test on core samples 2700 kg/m3
Largest horizontal stress, σH In situ stress measurements 2.5 MPa
Smallest horizontal stress, σh In situ stress measurements 1.3 MPa
Vertical stress, σv ρ × g × h 1.3 MPa
5.1.2.3 Predicting the Deformation for the Grängesberg Pilot Plant
The parameter values from Table 5-2 were used for calculating the deformations with afinite element code known as JOBFEM (see Appendix A). With this code, the rock mass ismodeled as an axially symmetric continuum. Calculations were made for the two differenthorizontal (radial) stress conditions: 1.3 and 2.5 MPa. The modeling included the excavationphase.

41
The predicted total radial deformation at the cavern boundary (for either of the twohorizontal in situ stress conditions) in Test Room 2 (Grängesberg Pilot Plant) due topressurization is shown in Figure 5-4. Also shown is the expected spread in deformation of±1 millimeter due to local behavior of single rock blocks and joints.
RSI-835-99-094
0
2
4
6
8
10
12
0 5 10 15 20 25 30 35 40 45 50 55
Pressure (MPa)
Pre
dict
ed d
efor
mat
ion
(mm
)
Figure 5-4. Predicted Radial Deformations in Test Room 2 (for Horizontal Stress Conditionsof 1.3 and 2.5 MPa), Grängesberg Pilot Plant. Expected Spread in Deformation IsSet at ±1 Millimeter.
The JOBFEM calculations were also used for predicting how far out from the cavern the rockmass will be affected by the cavern pressure. The deformations were expected to beexponentially decreasing with the distance from the cavern. Figure 5-5 shows the predicteddistribution of radial deformation along a 11.5-meter-long extensometer for different pressures.The length of the extensometer is measured from the rock surface outward.
5.1.2.4 Measured Deformations in Grängesberg Pilot Plant
The total radial deformations measured in all three test rooms in Grängesberg Pilot Plantfor different cavern pressures are shown in Figure 5-6. Figure 5-7 shows the measureddistribution of radial deformation along a 11.5-meter-long extensometer. The length of theextensometer is measured from the rock surface outward.
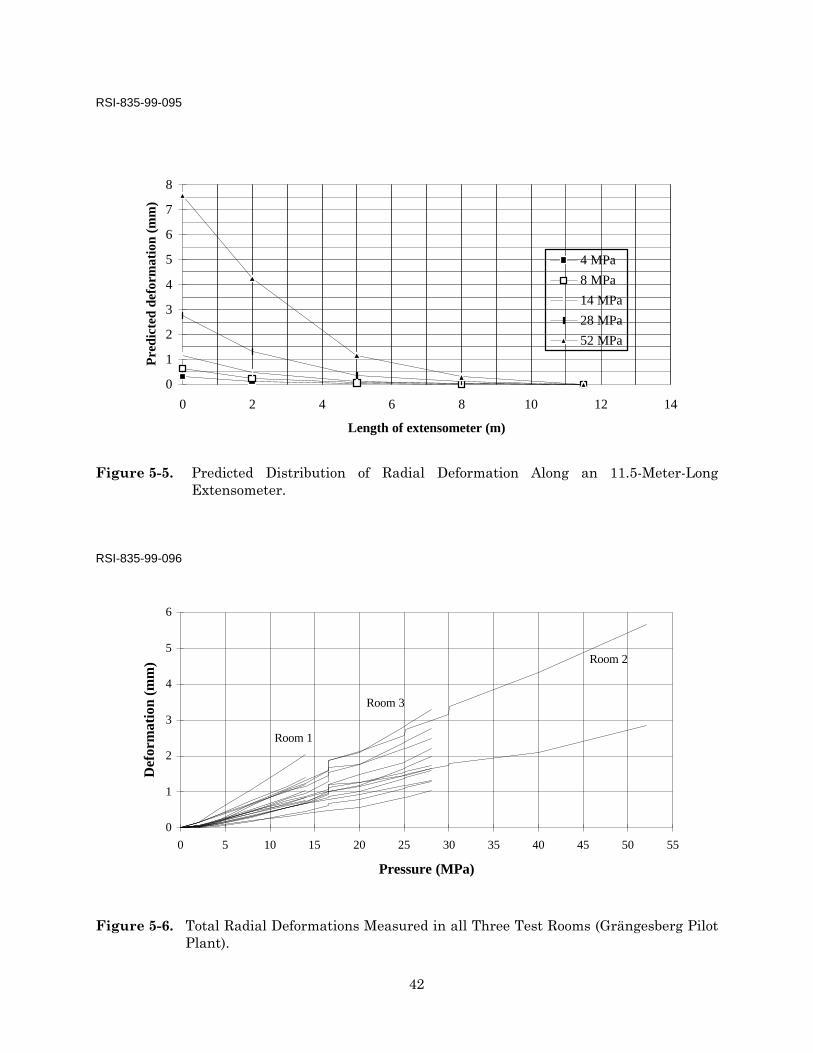
42
RSI-835-99-095
0
1
2
3
4
5
6
7
8
0 2 4 6 8 10 12 14
Length of extensometer (m)
Pre
dict
ed d
efor
mat
ion
(mm
)
4 MPa
8 MPa
14 MPa
28 MPa
52 MPa
Figure 5-5. Predicted Distribution of Radial Deformation Along an 11.5-Meter-LongExtensometer.
RSI-835-99-096
0
1
2
3
4
5
6
0 5 10 15 20 25 30 35 40 45 50 55
Pressure (MPa)
Def
orm
atio
n (m
m)
Room 1
Room 2
Room 3
Figure 5-6. Total Radial Deformations Measured in all Three Test Rooms (Grängesberg PilotPlant).

43
RSI-835-99-097
-1
0
1
2
3
4
5
6
7
8
0 2 4 6 8 10 12
Length of extensometer (m)
Def
orm
atio
n (m
m)
4 MPa
8 MPa
14 MPa
28 MPa
52 MPa
Figure 5-7. Measured Distribution of Radial Deformation Along an 11.5-Meter-LongExtensometer.
5.1.2.5 Comparison Between Predicted and Measured Behavior
Figure 5-8 shows the predicted radial deformations (for either of the two horizontal stressconditions) along with the measured deformations in all installed horizontal extensometers (acombination of Figures 5-4 and 5-6). The predicted deformation span and the measureddeformations show good agreement for the intended maximum storage pressure range; i.e., 20-25 MPa. No measured deformation has exceeded the upper limit of the predicted span.
At high-pressure levels, the measured deformations are considerably smaller than thepredicted deformations. The explanation to this is to be found both in a built-in conservatism inthe methods used for estimating the mechanical properties and in the conservative approachadopted by design engineers with little previous experience in the field of high-pressure storagein an LRC.
The evaluation of the distribution of deformation along the length of all the installedextensometers shows that approximately 90 percent of the radial deformation at 28 MPa takesplace within a distance of two diameters from the cavern wall (see the example in Figure 5-7).
The analysis of the results has shown that the E modulus generally was underestimated atthe initial prediction. The results at 52 MPa also indicate that the E modulus is different indifferent directions (the deformations were measured in two perpendicular directions). Themain reason for the large discrepancy at high pressures, however, has to do with theunderestimation of the rock mass strength in the finite element model.

44
RSI-835-99-098
0
2
4
6
8
10
12
0 5 10 15 20 25 30 35 40 45 50 55
Pressure (MPa)
Rad
ial d
efor
mat
ion
(mm
)
Figure 5-8. Deformations in all Horizontal Extensometers in the Three Test Caverns AlongWith the Predicted Deformations According to JOBFEM (Two Thick Lines for TwoDifferent Horizontal Stress Conditions). The Expected Spread Was Set at±1 Millimeter.
5.1.2.6 Behavior During Multiple Cycles
Knowledge about the long-term behavior is essential when designing peak-shaving facilities;i.e., storage caverns subjected to a very large number of cyclic loads. Several hundreds of cyclicloads to high-pressure levels have been performed in the Grängesberg Pilot Plant test rooms toevaluate the impact of the long-term deformations. Figure 5-9 shows the measured change inheight (K7) and diameter (K8, K9) in Test Room 2 during 50 pressure cycles between 15 and30 MPa. The duration of each cycle was 1 to 1.5 hours.
The general conclusion from the cyclical tests is that no significantly escalatingdeformations have occurred. On the contrary, a hardening behavior has been recorded; seeFigure 5-10 showing the additional rock deformation in Test Room 2 during 100 pressure cyclesbetween 1 and 16.5 MPa. This is explained by the fact that the rock mass closest to the cavernis probably compacted as rock joints are closed and sheared.
The main part of the additional deformation arises during the first 50 cycles. The totalincrease in the radial deformation from the 100 cycles is only about 17 percent. Pressure cycletests performed in Test Room 3 show the same behavior. The increase in deformation due topressure cycles is thus very limited and diminishing with the number of cycles for this case.This conclusion is assumed to be valid also for a peak-shaving facility subjected to ten completepressure cycles a year (500 cycles over a lifetime of 50 years).

45
RSI-835-99-099
10
12
14
16
0.00 5.00 10.00 15.00 20.00 25.00 30.00 35.00
Pressure (MPa)
Def
orm
ati
on
(m
m)
K7K8K9
Figure 5-9. Measured Change in Diameter (K7, K8) and Height (K9) of Test Room 2 During50 Cyclic Pressure Loads Between 15 and 30 MPa.
RSI-835-99-100
0.00
0.05
0.10
0.15
0.20
0.25
0.30
0 25 50 75 100
Load Cycle
Def
orm
ati
on
(m
m)
Ext. 5Ext. 6
Figure 5-10. Additional Rock Deformation Registered in Test Room 2 During 100 PressureCycles Between 1 and 16.5 MPa.
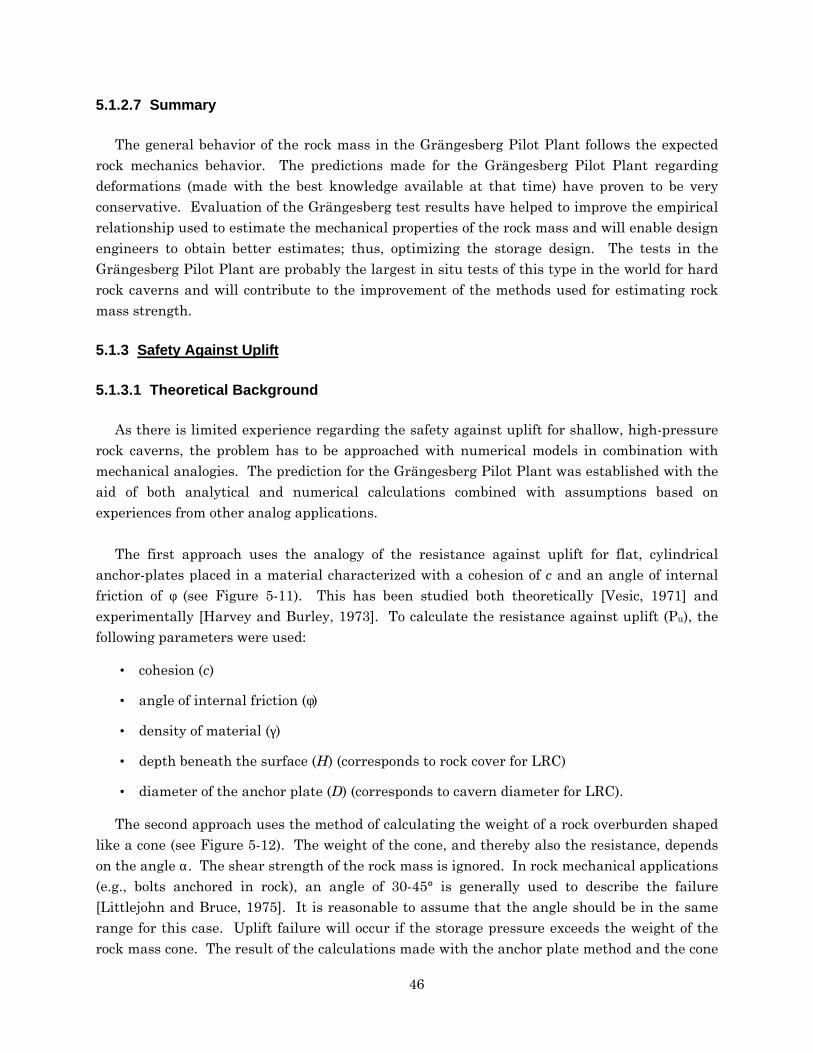
46
5.1.2.7 Summary
The general behavior of the rock mass in the Grängesberg Pilot Plant follows the expectedrock mechanics behavior. The predictions made for the Grängesberg Pilot Plant regardingdeformations (made with the best knowledge available at that time) have proven to be veryconservative. Evaluation of the Grängesberg test results have helped to improve the empiricalrelationship used to estimate the mechanical properties of the rock mass and will enable designengineers to obtain better estimates; thus, optimizing the storage design. The tests in theGrängesberg Pilot Plant are probably the largest in situ tests of this type in the world for hardrock caverns and will contribute to the improvement of the methods used for estimating rockmass strength.
5.1.3 Safety Against Uplift
5.1.3.1 Theoretical Background
As there is limited experience regarding the safety against uplift for shallow, high-pressurerock caverns, the problem has to be approached with numerical models in combination withmechanical analogies. The prediction for the Grängesberg Pilot Plant was established with theaid of both analytical and numerical calculations combined with assumptions based onexperiences from other analog applications.
The first approach uses the analogy of the resistance against uplift for flat, cylindricalanchor-plates placed in a material characterized with a cohesion of c and an angle of internalfriction of φ (see Figure 5-11). This has been studied both theoretically [Vesic, 1971] andexperimentally [Harvey and Burley, 1973]. To calculate the resistance against uplift (Pu), thefollowing parameters were used:
• cohesion (c)
• angle of internal friction (φ)
• density of material (γ)
• depth beneath the surface (H) (corresponds to rock cover for LRC)
• diameter of the anchor plate (D) (corresponds to cavern diameter for LRC).
The second approach uses the method of calculating the weight of a rock overburden shapedlike a cone (see Figure 5-12). The weight of the cone, and thereby also the resistance, dependson the angle α. The shear strength of the rock mass is ignored. In rock mechanical applications(e.g., bolts anchored in rock), an angle of 30-45° is generally used to describe the failure[Littlejohn and Bruce, 1975]. It is reasonable to assume that the angle should be in the samerange for this case. Uplift failure will occur if the storage pressure exceeds the weight of therock mass cone. The result of the calculations made with the anchor plate method and the cone

47
method for the Grängesberg Pilot Plant, using angles in the range of 30-45°, are shown inFigure 5-13.
RSI-835-99-101
H
Pu
D
γ, c, φ
Figure 5-11. Uplift of Cylindrical Anchor Plates.
RSI-835-99-102
Hα
D
Figure 5-12. Resistance Against Uplift With a Cone-Shaped Rock Overburden.

48
RSI-835-99-103
0
10
20
30
40
50
60
70
80
90
100
20 30 40 50 60
Rock cover (m)
Res
ista
nce
agai
nst
uplif
t (M
Pa)
AnchorCone 30°Cone 35°
Cone 40°
Cone 45°JOBFEMTested Grängesberg
Weight of rock mass
Figure 5-13. The Resistance of the Rock Mass Against Uplift Calculated With Three DifferentMethods for the Grängesberg Pilot Plant (Cavern Diameter 4.4 Meters andActual Rock Cover 50 Meters).
The third method involved is a finite element modeling using the JOBFEM code. The principalinput parameters for Grängesberg are those previously presented in Table 5-2. The results ofthe JOBFEM calculation are also shown in Figure 5-13.
5.1.3.2 Study of Uplift in the Grängesberg Pilot Plant
Figure 5-13 summarizes the calculations of safety against uplift made for the GrängesbergPilot Plant as well as the weight of the vertical rock mass directly above the cavern.
The vertical weight of the rock mass directly above the cavern corresponds only to a pressureof 1.3 MPa. The JOBFEM calculation was made for a rock cover of 35 meters1, indicating an upliftfailure at 57.5 MPa. As shown in Figure 5-13, the uplift resistance calculated with the anchoranalogy, the cone theory (with α = 35-40°), and the JOBFEM code are approximately equal at arock cover of 35 meters. This indicates a resistance against uplift in the range of 50-70 MPa.
Test Room 2, located with a rock cover of 50 meters, was successfully pressurized to 52 MPawithout any observed tendency for uplift. As indicated in Figure 5-13, this point is far below
1 The JOBFEM calculations were carried out before the final location of the storage rooms was finalized. Due to
local geologic reasons, the final location selected has a rock cover of 50 meters.

49
the estimated resistance against uplift. Extrapolating along the calculated results inFigure 5-13 to the actual rock cover of 50 meters, the resistance against uplift for theGrängesberg case would be expected to be approximately 135 MPa.
5.1.4 Design Loop
The LRC concept is characterized by a high degree of flexibility with respect to siting. Theconcept has been primarily developed and demonstrated to function well in Swedish bedrock ofnormal quality (Grängesberg). However, locations within geological formations of considerablylower quality are possible. The minimum requirements on rock mass quality are connectedwith the requirement to excavate and to maintain a large-scale rock cavern (diameter of 20-40 meters). If this basic requirement is fulfilled, an LRC storage may be constructed. However,to make the storage economically feasible, the storage pressure must, of course, be relativelyhigh. The maximum storage pressure is dictated by the chosen lining material and the actualgeological conditions. The deformations must not exceed the maximum strain capacity of thelining material. This leads to a design loop where the design parameters are optimized inrelation to each other within the frame of the geological conditions (see Figure 5-14).
RSI-835-99-104
Geologicalconditions
Estimateddeformations inthe rock mass
Maximum allowedstrain level in the
lining
Maximum storagepressure level
DESIGN LOOP
Figure 5-14. Design Loop for Technical and Economical Optimization of a Lined Rock Cavernfor Storage of Gas.
With the knowledge of rock quality, the degree of homogeneity, and the initial state of stress,the same rock mechanical approach used for the Grängesberg Pilot Plant can be used for anyother location to estimate the deformation caused by high gas storage pressures. A maximumallowable cavern pressure can then be determined, depending on the cavern size and the liningmaterial according to the previously described design loop. When the maximum cavernpressure has been determined, the minimum required rock cover can also be determined.

50
Screening criteria for siting LRC storage have been developed as a result of the evaluation ofthe Grängesberg Pilot Plant. The only geological input-data needed are the rock mass ratingaccording to the RMR or the Q methods. As the rock mass rating often is well known fromother underground excavations in many candidate areas, a first estimate of the suitability ofthe intended location may normally be possible without any significant site investigations.
Application of the RMR method for establishing cavern storage pressures is illustrated inFigure 5-15. With a knowledge of the RMR value, the storage pressure can be determined fromthe graph in Figure 5-15. For example, with an RMR value of 70, a storage pressure in therange up to 34 MPa can be expected to be acceptable.
RSI-835-99-105
Geological Feasibility for LRC Storage
0
5
10
15
20
25
30
35
40
45
50
30 35 40 45 50 55 60 65 70 75 80 85 90 95 100
Rating RMR'89
Stor
age
pres
sure
(M
Pa)
Feasible conditions
May be feasible. Further investi-gations needed
Not feasible
Figure 5-15. Method for Judging the Potential of a Site for LRC Storage.
If a site is judged to have potential for LRC storage, the suitability has, of course, to befurther analyzed in order to make a final decision. The key to an accurate evaluation of rockmass behavior and LRC suitability is the mechanical properties estimation. This is done byusing the empirical relations described in Section 5.1.2.2.
To determine the values of the relevant parameters needed for establishing a suitablepredictive model, a range of field test methods and laboratory tests must be executed.
5.1.5 Cavern Wall Principles
The LRC concept is based on the interaction of four elements, as shown in Figure 5-16:

51
1. steel liner
2. concrete layer
3. surrounding rock
4. drainage system.
RSI-835-99-106
RockConcrete
Drainage
LRC Gas Storage
RockSteel lining
Figure 5-16. Horizontal Projection of Storage Showing the Sandwich Wall.
The steel liner will be made of carbon steel. The test in the Grängesberg Pilot Plant hasshown that this is the most successful of the materials tested. The role of the steel liner is toachieve gas tightness. It is able to bridge minor cracks in the concrete.
The concrete layer is an intermediate layer and is located between the steel liner and therock. Its main purpose is to transmit the gas pressure in the cavern to the rock and todistribute it uniformly across cracks. At the same time, it will serve as a smooth base for thesteel liner.
The surrounding rock mass will support the gas pressure load on the wall, thus acting asa pressure absorber.
The drainage system consists of perforated drainpipes fixed at an oblique angle to crosshorizontal and vertical cracks in the concrete and the rock. The drainage system allows thewater pressure against the steel liner to be lowered when the gas pressure in the cavern is low,thus avoiding the risk of liner buckling.

52
5.1.6 Thermodynamic Behavior
The temperature response of gas in LRC storage is a bit different than for other storageconcepts. The main reason is the depth, and thus, the surrounding rock temperature. An LRCcavern will be located at approximately 150 meters (500 feet) below ground. At this depth, thetemperature of the rock will be about 17°C (62°F). This is a great difference compared to domalsalt caverns that are located at a depth of 1,000-1,500 meters (3,300-4,900 feet) where thetemperature of the surrounding rock may be 50-60°C (120-140°F).
A sample calculation of the temperature of gas in storage is shown in Appendix B. Duringthe rapid withdrawals (anticipated for LRC to be 10 days or less), the gas temperature will gobelow 0°C (32°F). The worst case is a withdrawal after a quiescent period in the storage inwhich the temperature will have gone down by cooling from the ambient rock temperature.After a 3-month quiescent period, the temperature after withdrawal will go down to -18°C(0°F).
The transient temperature distribution can have a negative impact on the steel liner and theconcrete. A low temperature at the end of the withdrawal results in an increase in the residualgas volume in the cavern, thus increasing the base gas requirement and can also cause gashydrate formation to occur. If repeated freezing and thawing occurs, it could have a negativeimpact on the concrete outside the steel liner. After many years of operation, the concretemight degrade.
Depending on the water content of the gas, hydrates may form toward the end of the gaswithdrawal cycle. During gas injection, the reaction is, of course, the opposite. Gas will becooled after the compressor, but the compression inside the cavern will develop heat that willincrease the temperature inside the cavern, and thus, limit the working gas volume in thecavern. At the end of a 20-day injection, the cavern temperature is approximately 43°C (108°F)(see Appendix B).
In order to increase the working gas volume and avoid the risks associated with lowtemperature described above, a circulation system was created. With the circulation system,gas inside the cavern will be cooled during injection and heated during withdrawal. Thetemperature after injection will be equal to the ambient rock temperature, 17°C (62°F), and thetemperature after withdrawal will be a minimum of 0°C (32°F). The working gas will increaseapproximately 30 percent with the circulation system compared to an unheated/uncooled LRCstorage system. The circulation system is further described in Section 5.2.6.
5.2 CONCEPTUAL DESIGN
The storage consists of four rock caverns located at a depth of approximately 150 meters(500 feet). Caverns are excavated through an access tunnel. Each cavern will have a separate
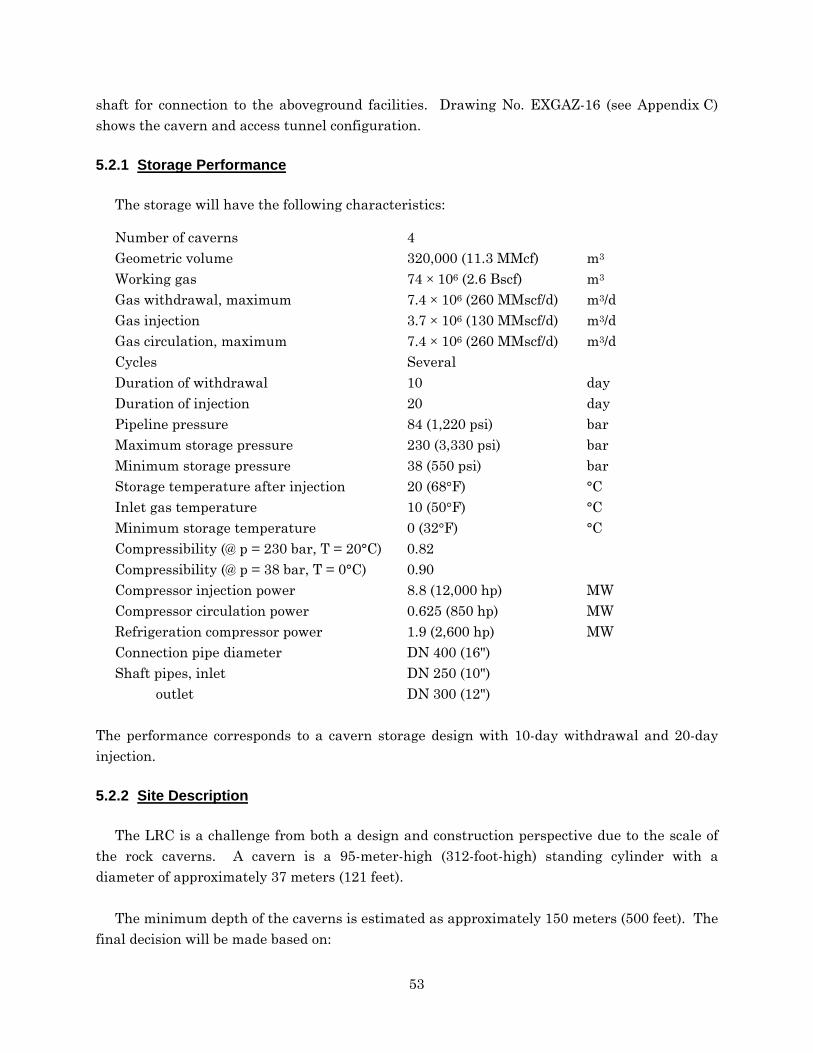
53
shaft for connection to the aboveground facilities. Drawing No. EXGAZ-16 (see Appendix C)shows the cavern and access tunnel configuration.
5.2.1 Storage Performance
The storage will have the following characteristics:
Number of caverns 4Geometric volume 320,000 (11.3 MMcf) m3
Working gas 74 × 106 (2.6 Bscf) m3
Gas withdrawal, maximum 7.4 × 10⁶ (260 MMscf/d) m3/dGas injection 3.7 × 10⁶ (130 MMscf/d) m3/dGas circulation, maximum 7.4 × 10⁶ (260 MMscf/d) m3/dCycles SeveralDuration of withdrawal 10 dayDuration of injection 20 dayPipeline pressure 84 (1,220 psi) barMaximum storage pressure 230 (3,330 psi) barMinimum storage pressure 38 (550 psi) barStorage temperature after injection 20 (68°F) °CInlet gas temperature 10 (50°F) °CMinimum storage temperature 0 (32°F) °CCompressibility (@ p = 230 bar, T = 20°C) 0.82Compressibility (@ p = 38 bar, T = 0°C) 0.90Compressor injection power 8.8 (12,000 hp) MWCompressor circulation power 0.625 (850 hp) MWRefrigeration compressor power 1.9 (2,600 hp) MWConnection pipe diameter DN 400 (16")Shaft pipes, inlet DN 250 (10")
outlet DN 300 (12")
The performance corresponds to a cavern storage design with 10-day withdrawal and 20-dayinjection.
5.2.2 Site Description
The LRC is a challenge from both a design and construction perspective due to the scale ofthe rock caverns. A cavern is a 95-meter-high (312-foot-high) standing cylinder with adiameter of approximately 37 meters (121 feet).
The minimum depth of the caverns is estimated as approximately 150 meters (500 feet). Thefinal decision will be made based on:
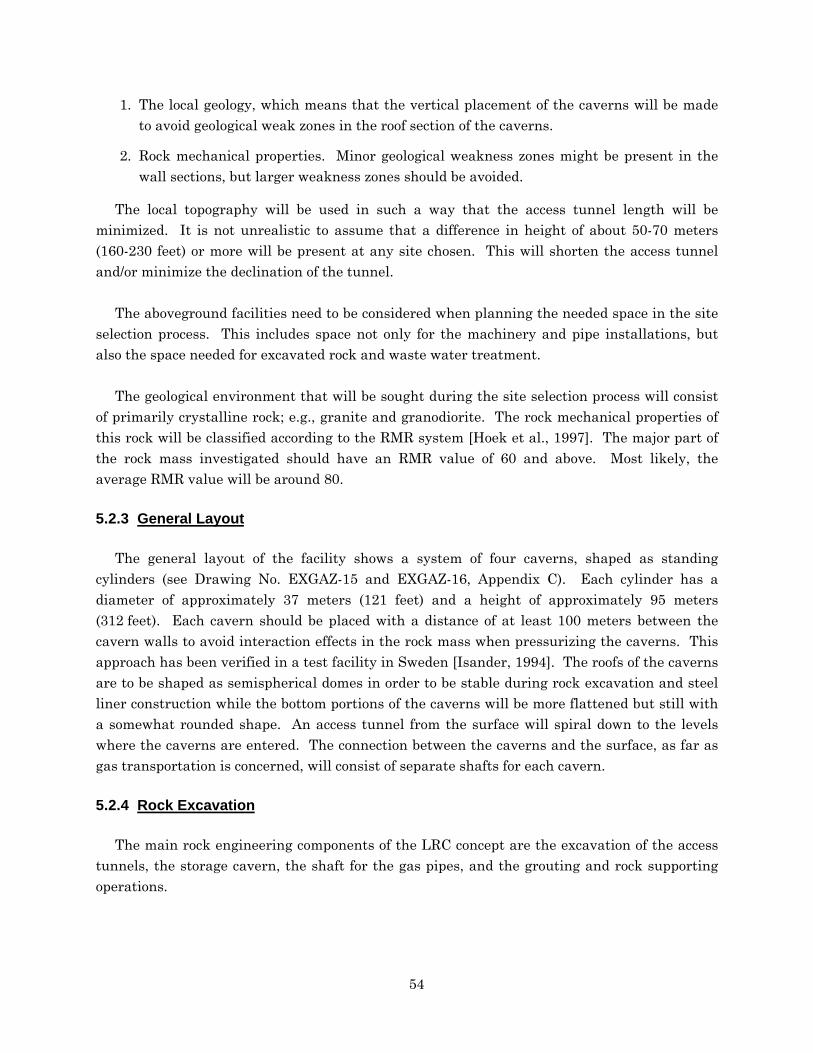
54
1. The local geology, which means that the vertical placement of the caverns will be madeto avoid geological weak zones in the roof section of the caverns.
2. Rock mechanical properties. Minor geological weakness zones might be present in thewall sections, but larger weakness zones should be avoided.
The local topography will be used in such a way that the access tunnel length will beminimized. It is not unrealistic to assume that a difference in height of about 50-70 meters(160-230 feet) or more will be present at any site chosen. This will shorten the access tunneland/or minimize the declination of the tunnel.
The aboveground facilities need to be considered when planning the needed space in the siteselection process. This includes space not only for the machinery and pipe installations, butalso the space needed for excavated rock and waste water treatment.
The geological environment that will be sought during the site selection process will consistof primarily crystalline rock; e.g., granite and granodiorite. The rock mechanical properties ofthis rock will be classified according to the RMR system [Hoek et al., 1997]. The major part ofthe rock mass investigated should have an RMR value of 60 and above. Most likely, theaverage RMR value will be around 80.
5.2.3 General Layout
The general layout of the facility shows a system of four caverns, shaped as standingcylinders (see Drawing No. EXGAZ-15 and EXGAZ-16, Appendix C). Each cylinder has adiameter of approximately 37 meters (121 feet) and a height of approximately 95 meters(312 feet). Each cavern should be placed with a distance of at least 100 meters between thecavern walls to avoid interaction effects in the rock mass when pressurizing the caverns. Thisapproach has been verified in a test facility in Sweden [Isander, 1994]. The roofs of the cavernsare to be shaped as semispherical domes in order to be stable during rock excavation and steelliner construction while the bottom portions of the caverns will be more flattened but still witha somewhat rounded shape. An access tunnel from the surface will spiral down to the levelswhere the caverns are entered. The connection between the caverns and the surface, as far asgas transportation is concerned, will consist of separate shafts for each cavern.
5.2.4 Rock Excavation
The main rock engineering components of the LRC concept are the excavation of the accesstunnels, the storage cavern, the shaft for the gas pipes, and the grouting and rock supportingoperations.

55
5.2.4.1 Excavation of the Tunnel Entrance
The tunnel entrance will be excavated using conventional drill-and-blast methods. Thismeans that the work needs to be planned carefully to avoid inconveniences regardingvibrations, noise, dust, and air pressure waves to people, the surrounding structures, and otherconcerns that might be sensitive. The entrance will be planned in such a way that the amountof excavated rock will be minimized, although this is dependent on the local geology and rockmechanical features.
5.2.4.2 Excavation of the Tunnels
The excavation will be performed as conventional drill-and-blast operations, and the tunnelswill be made in a horseshoe shape, although the shape might vary slightly due to localgeological and rock mechanical conditions. The final shape of the tunnels should not be lessthan the theoretical section and the excess excavation should be limited. Controlled blastingtechniques will be utilized throughout construction to minimize overbreak damage to theremaining rock mass. The drilling pattern and the charge plan will be adapted to suit the localgeology and to meet the demands set out regarding the damaged zone around the tunnel as wellas to minimize the overbreak of rock.
The tunnels will be excavated with a minimum of excess rock. The cross section of thetunnels at straight stretches should be around 25 square meters (270 square feet) and in curvesaround 43 square meters (463 square meters). The tunneling operations will need niches alongthe tunnel to allow for vehicles turning. Temporary pump pits will also be made, as well asmeeting places for vehicles.
Rock support will be used when needed; i.e., spot bolting. The bolting will be performed withgrouted rebar. Use of temporary support might be needed; e.g., friction bolts or anchored bolts,but will not be included in the final support. Systematic bolting can occur as well as shotcretewith or without steel fibers, depending on the local geological and rock mechanical conditions.
In certain portions of the facility, systematic bolting and shotcrete can be used, such aswhere the tunnel splits in two or at the position of pump pits. Systematic bolting may also beneeded at sections with poor Rock Mass Quality.
Grouting will be needed to minimize the amount of groundwater leaking into the tunnel, inorder to optimize the pumping equipment as well as to reduce the influence on the groundwaterlevel. Grouting operations will primarily use cement-based grout. The grout curtain will bedesigned to suit the local geology and might vary during the excavation of the tunneling works.The design of the grouting will include specification of the number of holes, lengths, anddirections. The grouting operations will need careful monitoring as the tunneling proceeds.Change of the drilling pattern might also be necessary.

56
5.2.4.3 Excavation of the Shafts
Two types of shafts will be excavated in the LRC facility. The locations and functions of thevarious shafts are described below. One shaft type is the shorter shaft, 15-20 meters (49-66 feet) in length, which will be excavated by the drill-and-blast method. Drilling can beperformed as long-hole drilling, after which blasting can be performed either as retreat blastingor in one single blast. The choice is dictated by the quality demands that are made and on thelocal geological and rock mechanical conditions.
Longer shafts can be made by using raise-boring techniques. Shafts with a length of morethan 40 meters (131 feet) and with a diameter of less than 5 meters (16 feet) can easily be madeby raise boring at competitive costs. Rock support costs will be lower using the raise-boringmethod, compared to conventional drill-and-blast methods. When raise boring a shaft, it isimportant to be able to control ingress of groundwater into the shaft. Therefore, it is advised todrill long holes at the position of the shaft where grouting can be performed.
Support might be needed in the shafts, even if raise boring is used. These supports will mostlikely be limited to shorter rock bolts and shotcrete, possibly fiber reinforced.
5.2.4.4 Installation Chambers Above the Caverns
Above each cavern, a small chamber will be made. It will be used for pregrouting above thecavern and pouring concrete. The chamber will be approximately 7 × 7 meters (23 × 23 feet)and some 6-7 meters (20-23 feet) high. The shaft down to the cavern has to be adapted to theconcrete plug needed to seal the cavern. The distance between the cavern and the tunnel aboveis around 15-20 meters (49-66 feet). This dimension might change, however, due to localgeological conditions. The shaft can be made by raise boring or by using the drill-and-blastmethod, the latter being the most efficient.
5.2.4.5 Excavation of the Rock Caverns
The excavation of the caverns can be made in different ways and the decision on whatmethod to use will be based on the experience and capability of the different contractors (e.g.,Sturk and Stille [1995]; Sagefors and Daerga [1996]).
Before the excavation work starts inside the caverns, grouting operations will take placefrom the small chambers above the caverns. Long drillholes will be made in a fan shape intothe rock mass above the caverns. These drillholes will be grouted, using cement, to ensure thatthe groundwater movements in the rock mass around the caverns will be kept as small aspossible during excavation.

57
The access tunnels will enter the planned cavern at two or more points. From theseentrance points, the excavation will proceed in a manner that will be both safe and economical.The height of the caverns makes it necessary to have the highest level of safety during theoperations, and the excavation sequence will be planned in such a way that exposure tohazardous situations is minimized.
The more traditional way of excavating the caverns would be to enter the cavern at the topand to excavate the cupola. This operation puts very high demands on accuracy when drillingand blasting, as the roof is a sensitive part of the construction. From the entrance level, aspiralling ramp is made upward as the roof section is excavated. As the cupola is half-spherical, it puts special demands on the excavation technique used. Once the roof is excavatedand secured with systematic bolting and shotcrete, the ramp is removed and the wall reinforcedaccordingly. The barrier position at the top of the cavern will be finally shaped from inside thecavern as the excavation work is being done in the cavern cupola.
The cavern would also be entered at the bottom where a level for mucking out the waste rockwould be established. The shape of this level might vary, depending on what excavationsequence is chosen. One possible scenario is to excavate a small chamber at the center of thecavern at the lower entrance level. A raise-bored shaft could then be made from the upperaccess level. This shaft might be enlarged to a suitable diameter as it would be used as a rockpass into which the waste rock will be dumped. The rock would be loaded and hauled tosurface.
The remaining rock in the cylindrical part of the cavern will be slashed into the shaft as theexcavation operation proceeds downward in a spiral. The size of the blasts will depend on localgeological factors, as well as on the methods used by the contractor. Reinforcement of thecavern walls will be carried out, using rockbolts and shotcrete, as the excavation proceeds.Additional grouting of the walls might be necessary to avoid wet working conditions inside thecavern and to facilitate later casting of concrete against the walls.
The last part of the rock cavern to be excavated is the bottom. The most optimal shapewould be to make the same shape as the roof, which is half-spherical. The problemsencountered doing that in the bottom of the cavern are so significant that a compromise has tobe made, allowing the bottom to be rounded but not in a perfect half-sphere. The excavationproceeds in the same way as earlier; i.e., a spiralling ramp is used to reach the correct level.
5.2.4.6 Excavation of the Barrier Positions
The barrier or seal positions are to be blasted with extra care to create a smooth surface withas few fractures as possible. The barriers will be placed at the tunnel entrances in connectionwith the concrete wall inside the caverns. The barriers will be approximately 4-6 meters (13-20 feet) long. The blasting procedure will include making a pilot tunnel along the length of the

58
barrier, after which slashing of the walls will be made in shorter sections. At the position of thebarrier, the tunnel will be made wedge shaped to increase the pressure-absorbing capability ofthe barrier.
The same technique will be used at the top of the cavern where the shaft will enter thecavern. The smooth blasting of the barrier position will be made from inside the cavern. Thissection of the shaft will also be made wedge shaped.
5.2.4.7 Excavation of the Pump Pits
Pump pits of a conventional type will be needed at one or more positions within the facility.The excavation of these pits will be made using the conventional drill-and-blast method, afterwhich concrete casting works will take place.
At the bottom of the access tunnels at the lower parts of the caverns, a pump pit will bemade. It will be made to a depth lower than the bottom of the cavern to ensure that thedrainage water from the cavern will be transported to the pump pit. The connection betweenthe pump pit and the cavern will be through one or more drillholes from the bottom of thecaverns to the bottom of the pump pit.
5.2.4.8 Excavated Rock Treatment
The calculated amount of excavated rock for a four-cavern facility is approximately400,000 m3 (14 million cubic feet). Assuming a swelling factor of 1.6 results in a total volume of640,000 m3 (22.6 million cubic feet) of excavated rock to be deposited, sold, or used in theconstruction works.
The rock produced at the construction site will be of good quality and there should be severalways of using it in the construction work at the site. The rock can be used for aggregates in theconcrete production and for the foundation of the surface structures. If not used on site, theproduced aggregates should hold a commercial value in a favorable market, provided otherconstruction projects are occurring in the same area. The value of the aggregates decreasesvery quickly with required haulage distance.
If the excavated rock is not being used for construction work, it has to be deposited on site.Even if the excavated rock is being used, a temporary deposit area needs to be established,although not of the same size as if all rock has to be deposited.
A permanent deposit area needs to be designed to accommodate the local demands.Consideration has to be taken of the surrounding landscape and vegetation as far as the visualperception of the deposit is concerned. The effects on vegetation and groundwater must also betaken into consideration as far as water treatment is concerned. Other factors, such as dust,

59
noise, and visual impact on the site, must be considered. If the deposit is placed in remote areaswith little or no population, the environmental effects should be limited.
5.2.4.9 Treatment of Leakage Water
A certain amount of groundwater will leak into the tunnel system of the facility. This waterhas to be pumped to the surface and processed before passing it on to any natural recipient.This treatment will most likely consist of sedimentation dams to allow any rock particlespresent in the water to settle. These sediments are being produced mainly in the drillingoperations of the rock excavation. Other materials can be present in the leakage water, such ascement from the grouting and casting operations. This will be treated in the same way asdescribed above. If any oil is present in the leakage water, an oil separator must be installed.
5.2.5 Cavern Wall
5.2.5.1 Concrete Wall
A concrete layer will be cast between the lining and the rock. The purpose of this concretelayer is twofold:
1. Transfer the load generated by the gas pressure in the cavern to the surrounding rockmass.
2. Provide a smooth base for the steel lining.
The concrete layer also has a role to minimize the strain in the lining. The large cracks thatcan be generated by the deformation result in a number of smaller cracks in the concrete, thus,limiting the local strain in the lining.
The selection of concrete quality should be made carefully. The concrete lining must be ofsufficient strength to facilitate the distribution of cavern pressure to the rock walls. Theproposed procedure to construct the wall after excavation is to start with the steel liningfollowed by the concrete wall.
The primary concerns related to the construction of the concrete casting are:
• Support for the form pressure
• Transportation and distribution of concrete
• Need for working space inside the formwork
• Coordination with the steel lining construction.

60
Support for the form pressure
There will be a considerable height to the wall being casted. The pressure of the concreteneeds to be balanced by some kind of support from inside the liner.
A special concern has to do with the support needed when pouring concrete under the bottompart of the steel lining. The upward lift of the concrete will be very large, and the only methodfor having a counterforce is to use dead weight in the form of water filling of the lining.
Transportation and distribution of concrete
The total concrete volume needed for one cavern wall is of the order of 7,000 m3 (245,000cubic yards), which results in a total of 28,000 m3 (980,000 cubic yards) for a four-cavernfacility. To ensure a steady supply, a concrete mixing plant is needed on site (or in the nearvicinity). The concrete will be transported by truck into the tunnels and might be pumped thelast part of the way.
Other concrete works in the facility include the casting of pump pits and the barriers to thecaverns. The amount of concrete for these works is small in comparison with the needs for thecavern wall lining, but are estimated at approximately 3,500 m3 (120,000 cubic yards) for a four-cavern facility.
5.2.5.2 Steel Lining
The steel lining will provide the primary guarantee of gas tightness in the cavern. Thelining material must be resistant to gas and the possible condensates and impurities that itmay contain, as well as to the environment to which the outer surface is exposed.
From the structural standpoint, the lining is not intended nor designed to carry primaryloads, as the concrete layer supports the lining, which in turn, is supported by the surroundingrock mass. The lining should, however, be able to withstand the stress and strain caused by thegeneral elastic and plastic deformation of the cavern wall. In addition, with increasing gaspressure, fractures and cracks will open up in the rock mass. These will initiate smaller cracksin the concrete layer. The liner must then have the capacity to withstand the strain resultingfrom the spanning of the largest of those cracks.
The maximum operating pressure allowed for the storage depends on the liningcharacteristics and the geological conditions. It must be set at a value such that the induceddeformation in the rock mass and the concrete layer does not result in the strain of the lining inexcess of its capacity for deformation.
The quality of the steel lining is of primary importance for a successful LRC. It must,therefore, have the highest priority, and every effort must be put into creating the best possible
61
conditions for the emplacement of the lining. The different steps in the steel liningconstruction work are:
• Transportation and placing of the steel plates
• Welding, including pretreatment of joint surfaces and posttreatment of weld surfaces
• Quality control regarding strength
• Quality control regarding gas tightness.
Each one of these work steps will constitute a separate workstation with specializedpersonnel and equipment. The main question for the choice of construction method is where toput these workstations and how the work should be carried out at these workstations.
Another important choice is the decision as to whether the welds are to be made withautomatic or manual welding. Automatic welding (e.g., Submerged Arc Welding (SAW)) isexpected to give a higher production rate and a uniform and high weld quality, and is,therefore, preferred. There will probably, however, always remain some welds that are notsuitable to automate.
5.2.5.3 Drainage System
The hydrostatic pressure outside of the cavern due to the column of groundwater can be1.5-2.5 MPa (220-360 psi). The drainage system is a part of the general groundwatermanagement plan. This plan consists of three major parts:
1. During construction of the cavern, the rock mass is grouted in the cavern roof and wallin order to minimize groundwater inflow to the cavern. This is needed both forconstruction and operation purposes.
2. During concrete placement for the cavern wall, water influx is prevented by the drainagesystem.
3. During operation, when gas pressure within the cavern is lower than the hydrostaticpressure outside the cavern, or when the cavern is depressurized to atmosphericpressure for inspection and/or maintenance, the lining can then be exposed to a load fromthe outside. This is prevented by lowering the pressure through the drainage system.
During construction, the drainage system is in operation, draining all groundwater so as tonot damage the steel lining. When the construction is completed, the drainage system is closed,and full groundwater pressure is allowed (1.5-2.5 MPa). The groundwater pressure must neverbe allowed to be higher than the storage pressure inside the cavern.

62
The movements of the groundwater are to be minimized during operation of the LRC. Thisrestriction is intended to reduce the risk for chemical and bacterial obstruction in the system,as well as to avoid lowering of the groundwater table.
5.2.6 Storage Operation
A flow diagram for the aboveground facilities is shown in Drawing No. EXGAZ-01 (seeAppendix C). The operating principles for the aboveground facilities are described below. Thedifferent operational cases for the aboveground facilities are shown in Drawing No. EXGAZ-02to 06 (see Appendix C).
5.2.6.1 Injection With Flow Control
Drawing No. EXGAZ-02 (see Appendix C) illustrates injection with flow control. When thepipeline pressure is above the cavern pressure, gas will be injected with flow control. The gasflow is measured during injection in an ultrasonic flow meter before the flow control valve. Theinlet gas is analyzed in a gas chromatograph and a dew point meter. The gas will pass througha filter to capture rust and other particles coming from the pipeline.
5.2.6.2 Injection With Compression
Drawing No. EXGAZ-03 (see Appendix C) illustrates injection with compression. When thepressures in the pipeline and the cavern are equalized, injection continues by means of theinjection compressors. The injection rate is 3.7 × 10⁶ m3/day (130 MMcf/day) at an inletpressure of 700 psi and an outlet pressure of 3,330 psi. Gas is cooled in an air cooler down tothe ambient temperature of about +38°C (100°F). The cooling will continue by means of arefrigeration unit down to a temperature of 10°C (50°F). At the same time, gas is circulatedfrom the caverns by means of the circulation compressor through an air cooler and arefrigeration unit, in order to cool the storage gas; thus, increasing the working gas volume.The circulation flow rate is maximum at 260 MMcf/day, and the temperature of the gas goingback to the storage is 10°C (50°F). The goal is to have a final gas temperature close to theambient rock temperature (see Section 5.1.6). In order to achieve maximum efficiency, the coolgas is injected at the bottom of the cavern and warmer gas is taken out at the top (seeFigure 5-17).
5.2.6.3 Withdrawal With Reduction
Drawing No. EXGAZ-04 (see Appendix C) illustrates withdrawal with pressure reduction.During withdrawal, gas is removed from the cavern by free flow down to the pipeline pressure.The withdrawal capacity is 7.4 × 10⁶ m3/day (260 MMscf/day). At the same time, the sameamount of gas is circulated and heated in order to maintain a temperature above 0°C inside the

63
cavern. During the circulation, warm gas is injected at the bottom of the cavern in order toavoid any cold areas (see Figure 5-18).
RSI-835-99-107
Warm gas
Cool gas
Figure 5-17. Circulation Cooling During Injection.
RSI-835-99-108
Blended
Warm gas
Figure 5-18. Circulation Heating During Withdrawal.

64
Before pressure reduction, the gas flows through a filter, protecting the pressure reductionvalves from water or rust particles. The gas is heated before the pressure reduction to avoidlow temperatures in the pipeline.
5.2.6.4 Withdrawal With Compression
Drawing No. EXGAZ-05 (see Appendix C) illustrates withdrawal with compression. Whenthe cavern pressure level reaches the pipeline pressure, gas will continue to be withdrawn bymeans of the main compressors. In this case, the installed compressor power is utilized toreduce the base gas requirement by going below the pipeline pressure in the cavern. Thecompressors can be utilized to withdraw gas down to a pressure of 38 bar (555 psi) and inject itinto the pipeline at a maximum pressure of 84 bar (1,215 psi).
5.2.6.5 Circulation Cooling/Heating
Drawing No. EXGAZ-06 (see Appendix C) illustrates circulation cooling and heating. Thiscase is used if the temperature for some reason should need to be adjusted. This can be used foroptimization of the storage operation.
5.2.7 Aboveground Facilities Layout and Main Equipment
The layout for the aboveground facilities is shown in Drawing No. EXGAZ-07 (seeAppendix C). The facility consists of four headshafts - one for each cavern. The shafts containtwo gas pipes: one for injection and one for withdrawal. Each cavern can be operatedseparately.
The compressor station consists of two electric motor-driven, two-stage reciprocatingcompressors for injection and one circulation compressor. Adjacent to the compressors, aircoolers for cooling by ambient air are installed. In line with the air cooler, the refrigerationunit, which is cooling the gas to 10°C, is installed.
The metering and pressure reduction consists of two outlet trains with filters, heaters, andpressure reduction valves. "Slam-shuts" will ensure that the storage pressure does notoverpressure the pipeline. Heat for warming the gas is provided from a boiler central with awater/glycol system. Gas analysis instruments are installed to measure the gas compositionand the dew point.
The facility is controlled from a control room which also includes staff facilities. Theoperation is controlled by a PLC system. Electricity is supplied through a high-voltagetransformer and switch gear. The aboveground facilities will include the support systems listedbelow:
65
• Air compressors for instrument air
• ESD system, including venting of the compressor system
• Gas detectors
• Fire detectors
• Lubrication oil storage tank
• Glycol system
• Waste oil tank
• UPS system.

66
6.0 COST ESTIMATE
6.1 INTRODUCTION
This chapter gives the investment and operational cost for a four- and an eight-cavern LRCstorage facility. A time schedule for the project is also presented. The costs are believed to beaccurate for December 1998 for a location in New England. The New England area is selectedfor the cost estimate as it is the most promising area from a market point of view (seeChapter 7.0). The primary difference between the cost of an LRC in New England and theSoutheast would relate to differences in labor rates.
To be able to handle all uncertainties linked to the cost, a probabilistic approach has beenchosen for presenting the cost. The result is a cost-versus-probability curve that is believed togive a truer cost picture than just one single value.
The cost achieved in the United States for the rock excavation has been compared with theScandinavian cost for similar excavation. This comparison is presented in Section 6.2.6.
A cost estimate that is 100 percent accurate is impossible to develop for any major project.The cost level will depend on design parameters but also local geological conditions as well asthe competition and the general situation in the construction market. A probabilistic modelcalled Multirisk is used to handle the uncertainties. Multirisk has been used by Sycon in manyprojects in the past.
The general factors that will impact the cost level of an LRC storage include:
1. Design
2. Geology
3. Production methods
4. Permitting
5. Competition
6. Location.
The anticipated design of a four-cavern storage for the cost estimate is presented inChapter 5.0.
The anticipated geology is described in Chapters 4.0 and 5.0. An RMR value of at least 70is anticipated. This represents competent rock with a low requirement for rock support. Thewater influx is anticipated to be low.

67
The production methods used are well recognized by United States rock excavationcontractors. Improvements can be made using, for example, Scandinavian methods.
The cost for permitting is based on "normal" requirements for underground storage.
The cost estimate is made without consideration of competition. It is, therefore, likely thatthe cost can be lowered when the project is ready to be bid.
An LRC project is a very labor-intensive construction project. The location where the LRCis being constructed will, therefore, have a significant impact on construction costs because ofvariations in labor union issues. This uncertainty is handled in the probabilistic model at ageneral influence level.
The costs for the LRC facility are divided into three groups: preconstruction cost, belowground cost, and aboveground cost. For the calculation of these costs, each item in each grouphas been assigned a low, likely, and high value. The items are regarded as independent of eachother. To combine the items for a total project cost, Multirisk has been used. For the belowground group, general conditions are also applied for competition and location impact.
6.2 INVESTMENT COST FOR A FOUR-CAVERN FACILITY
The four-cavern storage facility will have the characteristics below:
Number of caverns 4
Geometrical volume 320,000 (11.3 MMcf) m3
Working gas 74 × 106 (2.6 Bscf) m3
Gas withdrawal, maximum 7.4 × 10⁶ (260 MMscf/d) m3/d
Gas injection 3.7 × 10⁶ (130 MMscf/d) m3/d
Gas circulation, maximum 7.4 × 10⁶ (2.60 MMscf/d) m3/d
The calculated investment cost for the three groups: preconstruction, below ground, andaboveground, is presented below. The cost is presented as a probabilistic S-curve. In the curve,the cost will depend on the confidence level that is chosen for the project. An 80 percentprobability is what is normally chosen for investment decisions. This means that theprobability that the cost is lower than this value is 80 percent. The graphs below show theS-curves for the three groups of costs. Also, the top ten uncertainties are indicated. These arethe items in the cost calculation in which the cost portion combined with the uncertainty createthe greatest impact on the total cost.

68
6.2.1 Preconstruction Cost
The preconstruction cost consists of:
• Permits
• Design and tender documents
• Site selection and geologic evaluation.
The S-curve for the preconstruction cost is presented in Figure 6-1, and the top ten risks arepresented in rank-order in Figure 6-2. The cost with 80 percent probability for preconstructionis $5,800,000. The most uncertain item is the cost for permitting.
RSI-835-99-109
Figure 6-1. Preconstruction Investment Cost.
0
25
50
75
100
Preconstruction Cost($MM)
Pro
babi
lity
%
2.6 3.05 3.5 3.95 4.4 4.85 5.3 5.75 6.2 6.65 7.1

69
RSI-835-99-110
Figure 6-2. Uncertainties for Preconstruction Cost.
6.2.2 Below Ground Cost
The below ground cost includes:
• Site preparation
• Spiral access tunnels
• Cavern access tunnels
• Above cavern tunnels
• Caverns
• Cavern shafts
• Concrete barriers
• Water drainage pipes
• Rock support
• Shotcrete
• Grouting
20 30 40 50 60
Permitting
Design and tenderdocuments
Site Selection, Geologicevaluation
Top 10 risksPreconstruction
Ris
ks

70
• General service
• General and administrative labor
• General and administrative expenses
• Insurance and bonding
• Equipment purchase and rent
• Electrical consumption
• Water treatment plant.
The S-curve for the below ground portion of the LRC project is illustrated in Figure 6-3 andshows that the cost with 80 percent probability for below ground construction is $125,500,000.
RSI-835-99-111
Figure 6-3. Below Ground Investment Cost.
The three dominating uncertainties shown in Figure 6-4 are competition, location, and thesteel lining. In a tender procedure, there is always a span between the highest and lowest bid.A 30 percent span between the highest and the lowest is not unusual. Since the cost estimationis done without any competition, it is reasonable to believe that the cost will go down duringbidding. In the model, a likely reduction has been set to 5 percent with a span from -15 percentto +10 percent.
0
25
50
75
100
Below Ground Cost($MM)
Pro
babi
lity
%
83.5 89.0 94.5 100.0 105.5 111.0 116.5 122.0 127.5 133.0 138.5 144.0

71
RSI-835-99-112
Figure 6-4. Largest Uncertainties for Below Ground Cost.
The second major uncertainty factor has to do with the project location. This parameter isrelated to the labor union situation and the wages at the location where the project might bebuilt. It is anticipated that there will be a difference between the individual states in NewEngland. In the model, a likely reduction has been set to 0 percent with a span from -15percent to +10 percent.
The third major uncertainty concerns the steel liner. This uncertainty is related to theproduction cost of the liner. This type of liner has never been developed before; thus, there isno experience base. The first steel liner will be built in the demonstration plant in Sweden.
The analysis is based on the assumption that the site has been selected and the geologicinvestigations are made in the preconstruction phase. The uncertainties associated with rockexcavation are higher prior to the geological investigation.
6.2.3 Aboveground Cost
The aboveground facilities cost includes:
• Pipeline connection of one-half mile
• Power supply
0 5 10 15 20 25
Competition
Location
Steel Lining
Cavern
General Service
Concrete Lining
Shotcrete
Grouting
G & A Labor
G & A Expense
Other risks
Top 10 risksBelow Ground Items
Ris
ks
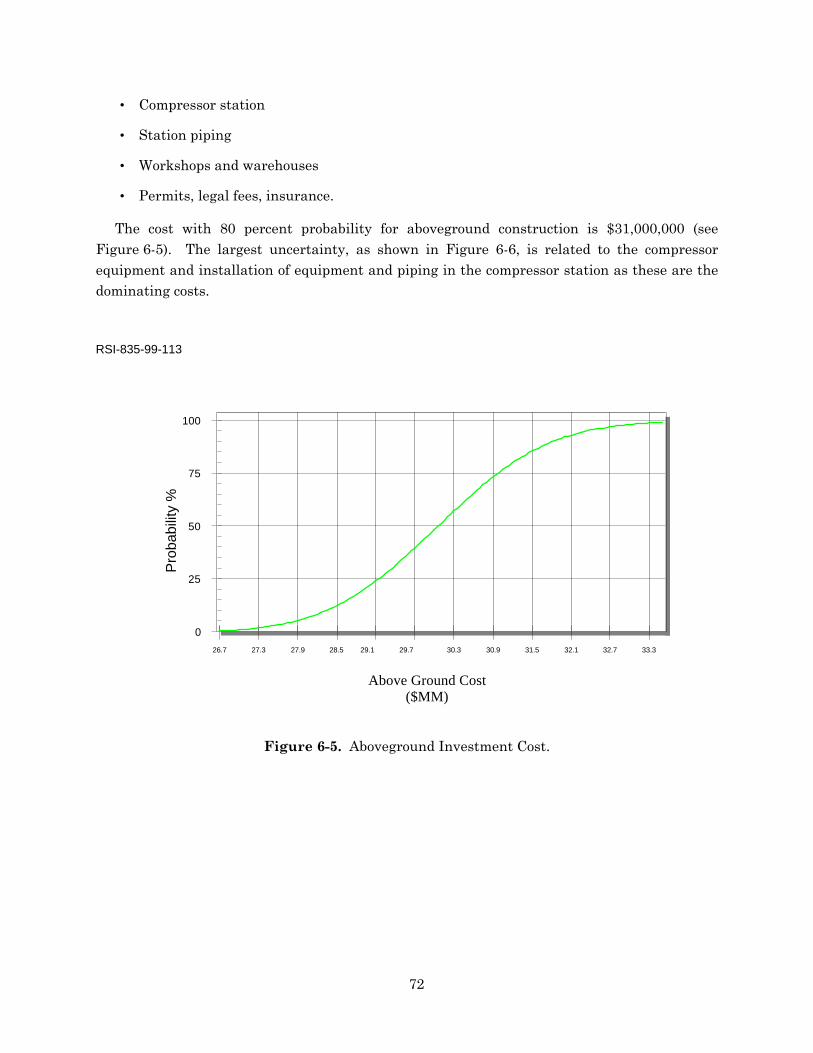
72
• Compressor station
• Station piping
• Workshops and warehouses
• Permits, legal fees, insurance.
The cost with 80 percent probability for aboveground construction is $31,000,000 (seeFigure 6-5). The largest uncertainty, as shown in Figure 6-6, is related to the compressorequipment and installation of equipment and piping in the compressor station as these are thedominating costs.
RSI-835-99-113
Figure 6-5. Aboveground Investment Cost.
0
25
50
75
100
Above Ground Cost($MM)
Pro
babi
lity
%
26.7 27.3 27.9 28.5 29.1 29.7 30.3 30.9 31.5 32.1 32.7 33.3

73
RSI-835-99-114
Figure 6-6. Largest Uncertainties for Aboveground Cost.
6.2.4 Total Investment Cost for a Four-Cavern Storage Facility
The total investment cost includes the cost from each of the three main cost groupings:preconstruction, below ground, and aboveground, together with base gas cost and Allowance forFunds During Construction (AFDC). The base gas cost of $1,250,000 is calculated assuming agas volume of 0.5 bcf and a gas price of $2.5. The AFDC is calculated assuming an interest rate7.5 percent and the project time schedule in Section 6.2.1. The total investment cost for a four-cavern storage facility (with an 80 percent probability) is shown in Table 6-1.
Table 6-1. Investment Cost for a Four-Cavern LRC Facility
CostComponent
InvestmentCost
($1,000)
Preconstruction 5,800
Below ground 125,550
Aboveground 31,000
Base gas 1,250
AFDC 18,700
Total 182,300
0 5 10 15 20 25 30 35 40 45
Compressor Equipment
Mech. and piping inst.
Engineering and Constr. mgmt
Gas Gathering System
Gas Refrig. Sys.
Pipeline Connection
Electr. & Instr.
Power Supply to Site (Electric)
Withdrawal equipment
Station Support Aux
Other risks
Top 10 uncertainties
Above Ground%of total uncertainty
Ris
ks

74
6.2.5 Operating Cost for a Four-Cavern Storage Facility
The operating cost for a four-cavern storage facility with one cycle is presented in Table 6-2.With several cycles, the fixed operational cost will be constant except for compressormaintenance, which will increase with the run time. The variable cost is proportional to thenumber of cycles.
Table 6-2. Annual Operating Cost for a Four-Cavern LRC Facility
Cost ComponentAnnual
Operating Cost($1,000)
Fixed cost:Personnel (7)Maintenance compressorsInsuranceFixed maintenance
600200100100
Variable cost for one cycle:Electricity for injection and cooling plus fuel gas 500
Total cost for one cycle 1,500
The Skallen demonstration plant in Sweden will be built with a remote-control capability.Personnel operating the main pipeline will also operate the storage. This manpower approachis also possible with a four-cavern facility, which would cut the cost for personnel shown.
6.2.6 Total Investment Cost for an Eight-Cavern Storage Facility
The eight-cavern storage facility will have the characteristics below:
Number of caverns 8
Geometrical volume 640 000 (22.6 MMcf) m3
Working gas 148 × 106 (5.2 Bscf) m3
Gas withdrawal, maximum 14.8 × 10⁶ (560 MMscf/d) m3/d
Gas injection 7.4 × 10⁶ (260 MMscf/d) m3/d
Gas circulation, maximum 14.8 × 10⁶ (560 MMscf/d) m3/d

75
The design will basically include two modules of four caverns each with a separate accesstunnel. The two four-cavern modules can be built simultaneously or sequentially. The costestimate has been revised for an eight-cavern based on the two four-cavern modules being builtat the same time. This will create some synergies regarding indirect construction cost that aremore related to the construction time than to the size; e.g., supervision, general service, watertreatment, and operation. The cost increase for preconstruction of an eight-cavern facilityinstead of a four-cavern facility is small. The cost estimate for an eight-cavern facility, with an80 percent probability, is presented in Table 6-3, together with the four-cavern facility costmultipliers.
Table 6-3. Investment Cost for an Eight-Cavern LRC Facility
CostComponent
InvestmentCost
($1,000)
Four-Cavern FacilityMultiplier
Preconstruction 7,000 1.21
Below ground 239,000 1.90
Aboveground 60,000 1.94
Base gas 2,500 2.00
AFDC 35,200 1.88
Total 343,700 1.89
6.2.7 Operating Cost for an Eight-Cavern Storage Facility
The operating cost for an eight-cavern storage facility is presented in Table 6-4. Theoperating cost is 1.87 times the four-cavern facility cost.
Table 6-4. Annual Operating Cost for an Eight-Cavern LRC Facility
Cost ComponentAnnual
Operating Cost($1,000)
Fixed cost:Personnel (11)Maintenance compressorsInsuranceFixed maintenance
1,700400150150
Variable cost for one cycle:Electricity for injection and cooling plus fuel gas 1,100
Total cost for one cycle 2,800
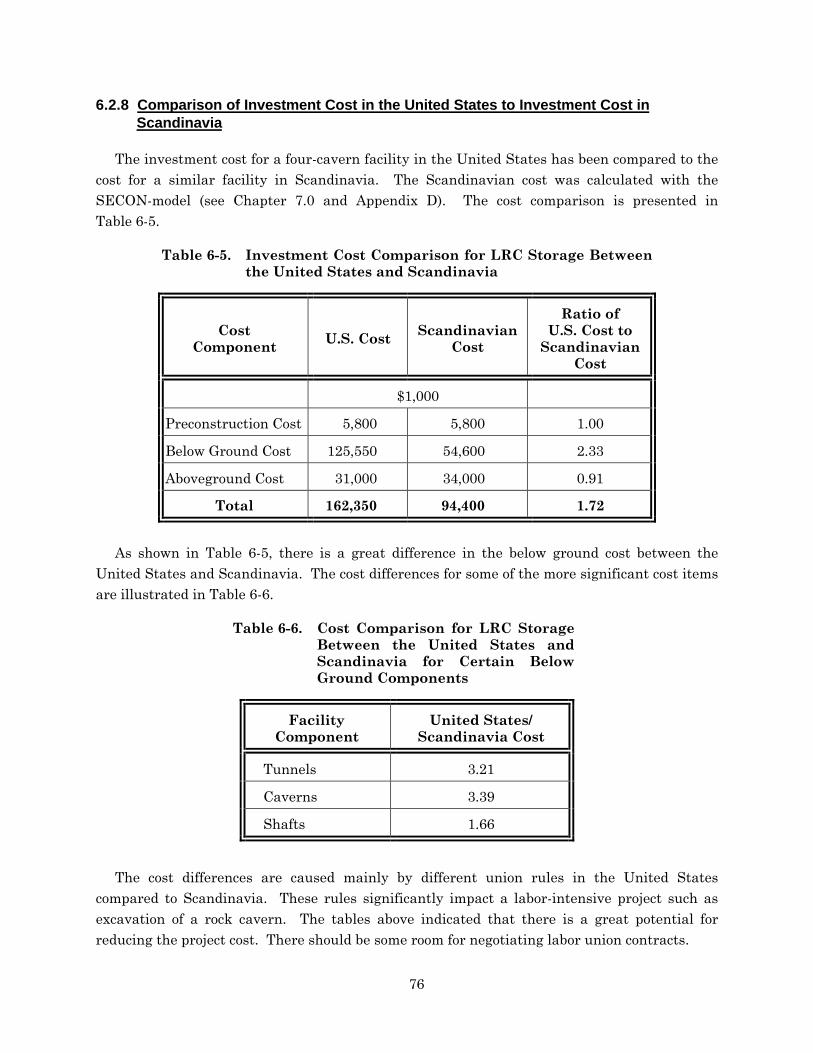
76
6.2.8 Comparison of Investment Cost in the United States to Investment Cost inScandinavia
The investment cost for a four-cavern facility in the United States has been compared to thecost for a similar facility in Scandinavia. The Scandinavian cost was calculated with theSECON-model (see Chapter 7.0 and Appendix D). The cost comparison is presented inTable 6-5.
Table 6-5. Investment Cost Comparison for LRC Storage Betweenthe United States and Scandinavia
CostComponent
U.S. CostScandinavian
Cost
Ratio ofU.S. Cost to
ScandinavianCost
$1,000
Preconstruction Cost 5,800 5,800 1.00
Below Ground Cost 125,550 54,600 2.33
Aboveground Cost 31,000 34,000 0.91
Total 162,350 94,400 1.72
As shown in Table 6-5, there is a great difference in the below ground cost between theUnited States and Scandinavia. The cost differences for some of the more significant cost itemsare illustrated in Table 6-6.
Table 6-6. Cost Comparison for LRC StorageBetween the United States andScandinavia for Certain BelowGround Components
FacilityComponent
United States/Scandinavia Cost
Tunnels 3.21
Caverns 3.39
Shafts 1.66
The cost differences are caused mainly by different union rules in the United Statescompared to Scandinavia. These rules significantly impact a labor-intensive project such asexcavation of a rock cavern. The tables above indicated that there is a great potential forreducing the project cost. There should be some room for negotiating labor union contracts.

77
6.2.9 Cost of Service
The cost of service is calculated using the model presented in Chapter 7.0 and Appendix D.The cost of service calculation shown in Table 6-7 is based on the following conditions:
Interest rate 8.4%
Return on equity 14.0%
Equity debt ratio 25/75
Federal tax 36.0%
State tax 8.25%
Property tax 1.0% (Calculated on the entire investment, including that below ground)
Cost of electricity and fuel are included in the cost of service shown in Table 6-7.
Table 6-7. Cost of Service per Deliverability for LRC Storage
FacilityDeliverability
MMcf/d$/Mcf/d/Month
Annual Costfor Capacity
at 1 Cycle($/Mcf)
Annual Costfor Capacityat 12 Cycles
($/Mcf)
Four-cavern facility 260 $9.79 11.75 1.28
Eight-cavern facility 520 $9.23 11.07 1.21
6.2.10 Cost Reduction Potential
Sycon and Gaz de France are presently working with cost reductions for the LRC concept.The evaluations include changes in design, such as increased height and width of the caverns,as well as more economical production methods for mining of the caverns. Options with gascooling and higher gas pressure are also being evaluated.
The design changes are evaluated technically and economically in an ongoing process with afeasibility target price of $8/Dth/d/month.
6.2.11 Project Schedule
Figure 6-7 illustrates the project schedule for a four-cavern storage facility. The schedule isbased on a project construction start in January 1999. The project schedule for the LRCdemonstration plant in Sweden is also shown for information.
The total project time is about 6 years. However, two caverns can be commissionedapproximately 1 year before total project completion.

78
RSI-835-99-115
Figure 6-7. Time Schedule for a Four-Cavern LRC Storage.
ID Activity1 Pre- Construction
2 Permitting
3 SiteSelection and Design
4 Below Ground Construction
5 Excavation of tunnels
6 Excavation of Shafts and 2 first caverns
7 Lining of 2 first caverns
8 Test and commission of 2 first caverns
9 Filling of first 2 caverns
10 Excavation of 2 last caverns
11 Lining of 2 last caverns
12 Test and commission of 2 last caverns
13 Filling of 2 last caverns
14 Above Ground Construction
15
16 Demonstration Plant in Skallen, Sweden
17 Construction of Demo-plant
18 Test of Demo-plant
09-30
08-31
H1 H2 H1 H2 H1 H2 H1 H2 H1 H2 H1 H2 H1 H2 H1 H21999 2000 2001 2002 2003 2004 2005 2006

79
7.0 ECONOMIC COMPARISON OF LRC TO ALTERNATIVES
7.1 INTRODUCTION
In this chapter, the LRC is compared to other storage alternatives and pipelinetransportation. The comparison is made for two regions: the Northeast, covering NewEngland, and the Southeast, covering Georgia, North Carolina, and South Carolina. Both ofthese areas have geology suitable for LRC and both are facing the highest gas consumptionrates in the country, leading to a tremendous increase in the need for flexibility andmodulation. The growth is mainly driven by power generation and climate conditions thatgenerate strong peak demands either in winter (Northeast and Southeast) or both in winter andin summer (Southeast).
The Northeast area is located at the far end of the transmission pipeline systems thatoriginate in the gas production regions of the Gulf of Mexico. The gas has to be transportedover long distances to reach the East Coast market. Thus, it is expensive to transport the gaswith a low load factor; i.e., it is uneconomical to cover the consumption variation with thepipeline. The distance to the Southeast area is shorter, but the pipeline transportation capacityis limited.
There is no salt cavern storage in the two subject areas. The closest salt storage is located inthe middle Atlantic for the Northeast and in Louisiana, Mississippi, and Alabama for theSoutheast. Furthermore, storage for modulation of a power plant has to be located very close tothe facility to be able to function properly. Long transmission distances will create problems inthe gas supply due to pressure drop in the system.
LNG peak-shaving facilities, which have been the only storage means in the two areas for along time, have three major drawbacks:
1. The cost is high.
2. They are not very well perceived by the population, making approval for new projectsdifficult.
3. An LNG liquefaction plant can generally only provide one cycle per year, depending onthe investment for liquefaction equipment. Vaporization plants, which are recharged bytruck delivery, can be cycled. However, they then have to rely on a larger liquefactionunit or an import terminal located within a reasonable distance.
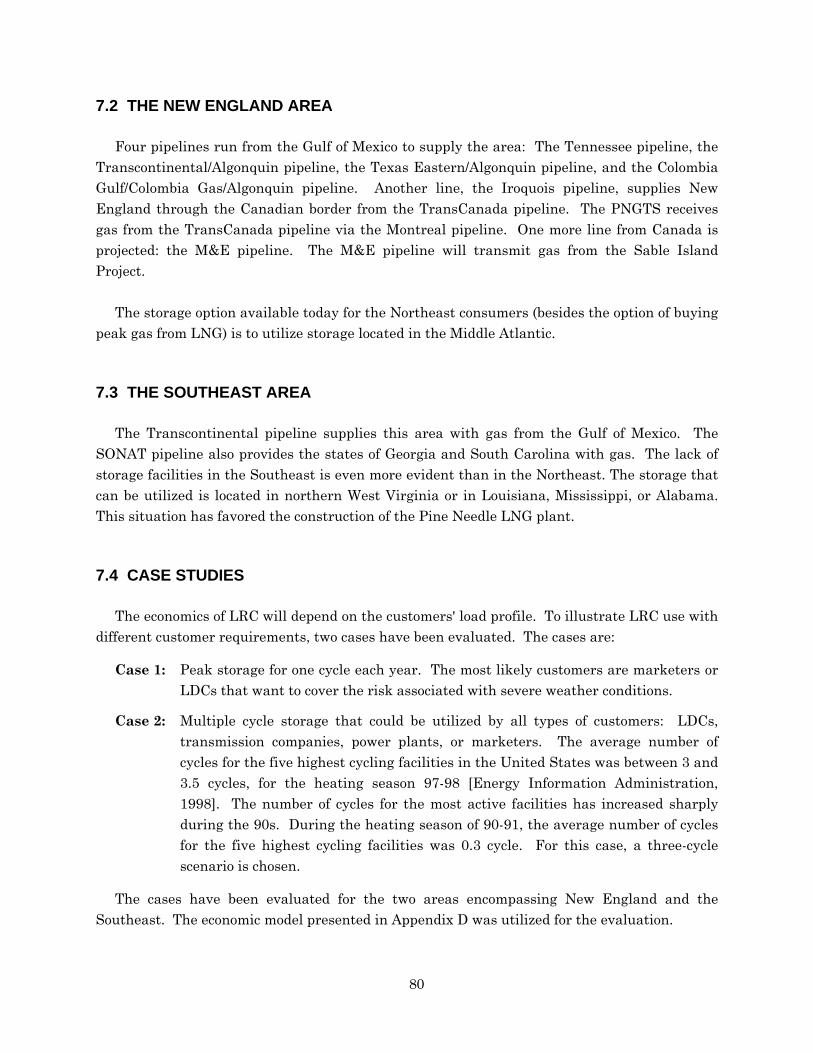
80
7.2 THE NEW ENGLAND AREA
Four pipelines run from the Gulf of Mexico to supply the area: The Tennessee pipeline, theTranscontinental/Algonquin pipeline, the Texas Eastern/Algonquin pipeline, and the ColombiaGulf/Colombia Gas/Algonquin pipeline. Another line, the Iroquois pipeline, supplies NewEngland through the Canadian border from the TransCanada pipeline. The PNGTS receivesgas from the TransCanada pipeline via the Montreal pipeline. One more line from Canada isprojected: the M&E pipeline. The M&E pipeline will transmit gas from the Sable IslandProject.
The storage option available today for the Northeast consumers (besides the option of buyingpeak gas from LNG) is to utilize storage located in the Middle Atlantic.
7.3 THE SOUTHEAST AREA
The Transcontinental pipeline supplies this area with gas from the Gulf of Mexico. TheSONAT pipeline also provides the states of Georgia and South Carolina with gas. The lack ofstorage facilities in the Southeast is even more evident than in the Northeast. The storage thatcan be utilized is located in northern West Virginia or in Louisiana, Mississippi, or Alabama.This situation has favored the construction of the Pine Needle LNG plant.
7.4 CASE STUDIES
The economics of LRC will depend on the customers' load profile. To illustrate LRC use withdifferent customer requirements, two cases have been evaluated. The cases are:
Case 1: Peak storage for one cycle each year. The most likely customers are marketers orLDCs that want to cover the risk associated with severe weather conditions.
Case 2: Multiple cycle storage that could be utilized by all types of customers: LDCs,transmission companies, power plants, or marketers. The average number ofcycles for the five highest cycling facilities in the United States was between 3 and3.5 cycles, for the heating season 97-98 [Energy Information Administration,1998]. The number of cycles for the most active facilities has increased sharplyduring the 90s. During the heating season of 90-91, the average number of cyclesfor the five highest cycling facilities was 0.3 cycle. For this case, a three-cyclescenario is chosen.
The cases have been evaluated for the two areas encompassing New England and theSoutheast. The economic model presented in Appendix D was utilized for the evaluation.

81
The cost utilized in this comparison for LRC is the forecasted cost of $8/Dth/d/month. This isa targeted cost for LRC, as discussed in Chapter 6.0.
7.4.1 New England Area
For this area, the possible pipeline transportation alternatives have been listed in Table 7-1.
Table 7-1. Cost Comparison for Various Storage Technologies
In State Cost BasisCost
($/Dth/d/Month)
Maine Tennessee+Granite 19.82
Tennessee 17.15New Hampshire
Col.Gulf/Col.Gas/Tennessee 14.96
Tennessee 17.15
Col.Gulf/Col.Gas/Tennessee 16.02
Texas Eastern/Algonquin 27.53
TransCanada/Iroquois/Tennessee 33.18
Massachusetts
TransCanada/Iroquois/ Algonquin 39.86
Tennessee 17.15
TransCanada/Iroquois 33.61
Col.Gulf/Col.Gas/Tennessee 16.02Connecticut
Texas Eastern/Algonquin 27.53
A comparison has been made for a typical customer needing a deliverability of 30 MDth/d.When comparing pipeline transportation and storage utilization, the Tennessee pipelinetransportation rate has been utilized. The proposed storage in salt caverns at Tioga and theproposed LNG storage in Wells, Maine, have been used for the storage alternatives. It shouldbe noted that the proposed LNG facility in Wells has been canceled. However, it shouldnonetheless serve as a reasonable comparison for possible alternatives. A small local LNGsatellite tank has also been included for comparison. The satellite can only supply 6 MDth/dwith refilling every day. The assumptions made for the evaluation of Cases 1 and 2 are given inTables 7-2 and 7-3, respectively. The results of the evaluations are shown in Tables 7-4 and 7-5for Cases 1 and 2, respectively.
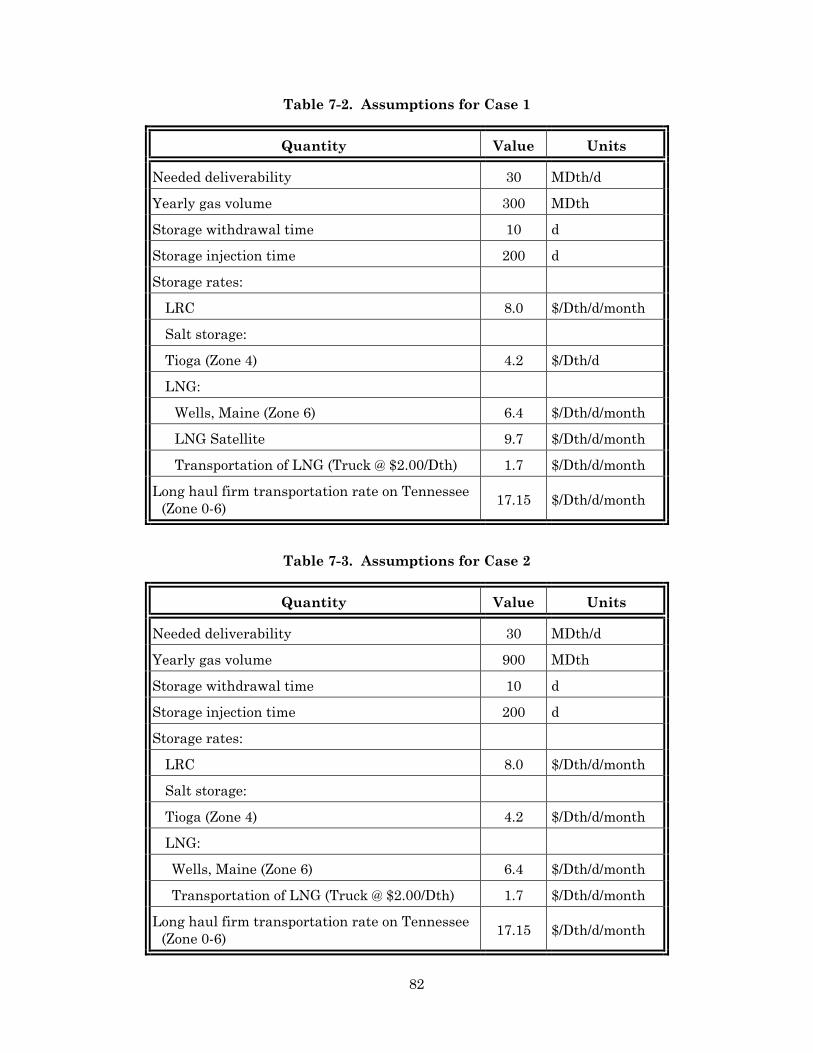
82
Table 7-2. Assumptions for Case 1
Quantity Value Units
Needed deliverability 30 MDth/d
Yearly gas volume 300 MDth
Storage withdrawal time 10 d
Storage injection time 200 d
Storage rates:
LRC 8.0 $/Dth/d/month
Salt storage:
Tioga (Zone 4) 4.2 $/Dth/d
LNG:
Wells, Maine (Zone 6) 6.4 $/Dth/d/month
LNG Satellite 9.7 $/Dth/d/month
Transportation of LNG (Truck @ $2.00/Dth) 1.7 $/Dth/d/month
Long haul firm transportation rate on Tennessee(Zone 0-6)
17.15 $/Dth/d/month
Table 7-3. Assumptions for Case 2
Quantity Value Units
Needed deliverability 30 MDth/d
Yearly gas volume 900 MDth
Storage withdrawal time 10 d
Storage injection time 200 d
Storage rates:
LRC 8.0 $/Dth/d/month
Salt storage:
Tioga (Zone 4) 4.2 $/Dth/d/month
LNG:
Wells, Maine (Zone 6) 6.4 $/Dth/d/month
Transportation of LNG (Truck @ $2.00/Dth) 1.7 $/Dth/d/month
Long haul firm transportation rate on Tennessee(Zone 0-6)
17.15 $/Dth/d/month

83
Table 7-4. Comparison of Transportation Cost of 300 MDth Yearly at a Deliverabilityof 30 MDth/d - Case 1
Long-HaulFirm
Transportation
TiogaStorage
Wells LNGLNG
Satellite(a) LRC
Transportation to storage - 233,000 600,000 600,000 308,000
Storage Cost - 1,512,000 2,304,000 3,500,000 2,880,000
Transportation to end customer 6,174,000 2,225,000 1,217,000 -(a) 1,217,000
Total annual cost 6,174,000 3,970,000 4,121,000 -(a) 4,405,000
Total cost (per yearly gasvolume)
20.6 13.2 13.7 -(a) 14.7
Cost compared to long-haulfirm transportation
-2,204,000 -2,053,000 -(a) -1,767,000
Total annual cost,Direct connection
4,100,000 3,188,000
Cost compared to long haulfirm transportation withdirect connection
-2,074,000 -2,986,000
Total cost (per yearly gasvolume)
13.7 10.63
(a) Max 6 MDth/d.
The cost for injection and withdrawal are comparably small for all alternatives, and arethus, neglected in this comparison.
The conclusions that can be drawn from these tables are:
• LRC has possibilities to lower the cost for transportation of gas from the Gulf of Mexicoto the New England area.
• The cost for LRC is a bit higher than the proposed alternatives for a one-cycle operation.However, for some operations, such as power plant hourly peaks, salt caverns located inTioga may cause problems for the transmission company due to pressure drop in thetransmission line. LRC could then be used for pipeline pressure balancing.
• For the three-cycle case, LRC competes with firm transportation and LNG.
• If the LRC storage can be located so that a direct connection with the end customer, or ifback haul delivery can be utilized, the LRC storage competes with all of the alternatives.

84
Table 7-5. Comparison of Transportation Cost of 900 MDth Yearly at a Deliverabilityof 30 MDth/d - Case 2
Long-HaulFirm
Transportation
TiogaStorage
Wells LNGLNG
Satellite(a) LRC
Transportation to storage - 233,000 1,800,000 1,800,000 308,000
Storage Cost - 1,512,000 2,304,000 3,500,000 2,880,000
Transportation to end customer 6,174,000 2,225,000 1,217,000 -(a) 1,217,000
Total annual cost 6,174,000 3,970,000 5,321,000 -(a) 4,405,000
Total cost (per yearly gasvolume)
6.9 4.4 5.9 -(a) 4.9
Cost compared to long-haulfirm transportation
-2,204,000 -853,000 -(a) -1,767,000
Total annual cost,Direct connection
5,300,000 3,188,000
Cost compared to long haulfirm transportation withdirect connection
-874,000 -2,986,000
Total cost (per yearly gasvolume)
5.9 3.5
(a) Max 6 MDth/d.
7.4.2 Southeast Area
Fewer specific alternatives exist in the Southeast for cost comparison. However, it is clearthat the Southeast area is closer to the Gulf of Mexico; thus, the transportation cost for gasfrom the production area to the southern market is lower than transportation to the NewEngland market.
The TRANSCO rates for firm transportation from production areas (Zone 1-3) are$6-7 Dth/d/month for transportation into Alabama and Georgia (Zone 4). Transportation costsinto South Carolina and North Carolina (Zone 5) are $9-10 Dth/d/month. Transportation costinside Zone 4 is $5 Dth/d/month, and the cost inside Zone 5 is $4 Dth/d/month.
The available storage alternative in the southern market area is the Pine Needle LNGstorage. The demand charge for this storage is $4.85 Dth/d/month.

85
The conclusions for the Southeast area are:
• LRC will not compete with firm transportation in Georgia but will in South Carolina andNorth Carolina. However, connection directly to an end customer or back haul deliveryis needed to compete.
• LRC will not compete with LNG for the single cycle of Case 1. However, LRC willcompete in Case 2, with a three-cycle operation. This could be of interest for pipelinebalancing and power generation.

86
8.0 ENVIRONMENTAL IMPACT AND PERMITTING ISSUES
8.1 SUMMARY OF ENVIRONMENTAL IMPACT
Construction of the LRC facility will last approximately 4-5 years. Conventional techniqueswill be used to construct tunnels and rooms in the rock; i.e., drill-and-blast. Electrical drillingmachines will be used, which implies that new electric cables must be supplied to the workingarea. There will be minor ground vibrations from the construction. However, the vibration willbe very small and contained within approximately 200 meters (650 feet) from the constructionarea.
Some of the rock mass can be used for site preparation in connection with the facility and inproduction of concrete for the storage. Remaining rock aggregate will be piled or sold on themarket. Traffic will mainly occur in connection with disposal of crusher material. The rockaggregate used for construction purposes may be crushed in a mobile crusher near the pile.The total amount of rock aggregate from the excavation will be approximately 600,000 m2
(21 million cubic feet) for a four-cavern facility.
In this chapter of the report, a very brief summary of the potential environmental impacts(both during and after construction) is provided.
8.1.1 Environmental Effects During the Construction Period
Effects on the environment during the construction of the plant can be divided into two maincategories: (1) influence from rock excavation work and (2) influence from construction of theconnecting pipeline. Pipeline connection is a well-known technology, and is, therefore, notdiscussed here.
Landscape
The landscape will be influenced from establishing the working site and construction of theplant. Trailers for workers, warehouse, and workshop will be placed at the tunnel entrance.Areas for parking and arrangements for trailers will be made adjacent to the entrance.
Rock aggregate that is placed permanently or temporarily can affect the landscape.Vegetation in the rock aggregate area has to be cut. Access roads will also be developed.
Ground
Within the working area for the storage, there will be an impact on soil because of thetraffic. There will be effects on the forestry in the area that is affected by the workings.

87
Certain work near the working site will be limited. The damage incurred is estimated to bemoderate and restoration will be done after the construction is finished.
Vegetation
No affect is assumed on the vegetation due to eventual lowering of the water table in thearea. Other damages to the vegetation are estimated only to be in the areas of the buildings andthe tunnel entrance.
Animals
The animals in the area may be disturbed by the construction. After some work progress,the rock excavating will be done at greater depths and the disturbance on the ground will beminimized. Other work on the ground may also disturb the animal life, but this disturbance isexpected to be very low.
Groundwater
An eventually lower water table will be very local and presumably will only exist for a veryshort time. Eventually, a well very near the working site could be influenced by a lower watertable. However, this is estimated only to occur for short periods of time.
The technique of constructing the storage cavern is based on limiting the inflowing water inthe tunnel system. This will be done by grouting; i.e., injection of a cement slurry in the rockcracks.
The water that is still leaking into the tunnel system and cavern room will be pumped up tothe ground and be cleaned. Some water will be reused in the building process and some will bedisposed. As an alternative, the water can be injected back into the ground.
Watercourses and wetlands
A very small influence is expected on watercourses and wetlands in the area.
Recreation
Recreation in the area around the working site may be disturbed because of the noise fromwork at the plant and from the traffic. This is expected to be contained within 200-500 meters(650-1,640 feet), depending on the site topography. At large distances, the influence will besmall. Certain restrictions can be put in place concerning trespass on ground areas near theworking site.
Noise and vibration on the ground
It is a matter of course that a construction site of this size will generate noise. This noise iscaused by excavation, transportation, and the ventilation plant for the tunnel. Disturbing noise

88
levels from the excavation will only be present during the first 3-4 weeks. After this, theexcavation will have gone so far into the rock that almost no noise can be heard on the ground.
Dust
Dust arises in connection with vehicular travel. The amount of dust from vehicles should bevery small, depending on the condition of the roads. Dust from excavation near the ground islimited in both time and space.
Discharge
The risk of discharge in the surroundings is regarded as small. A source of discharge thatcan be identified is from the vehicles that are used at the site. Exhaust from these vehicles can,however, be cleaned effectively. Eventual discharge of oil will be limited by demands on thecontractor.
8.1.2 Environmental Effects After the Construction Period
Landscape
The plant will have three to four smaller buildings that will be built within an area that willbe fenced. A small parking space will be built in connection with the aboveground plant.Existing vegetation and trees shall, as far as possible, be left to minimize the impact on thelandscape.
Ground
The use of ground for forestry and farming will be influenced in the area where theaboveground plant is situated. The aboveground plant will be fenced.
Animals
Noise from compressors may disturb sensitive animal life. However, this is not differentfrom existing storage alternatives.
Groundwater
An eventually lower level of groundwater around the storage will be very local and limitedduring a very short time.
The technique of constructing the storage is based on limiting the inflowing water in thetunnel system. This will be done by grouting; i.e., injection of cement slurry in the rock cracks.The rock mass can be expected to be very dense and no large problems with groundwater loss isexpected.

89
Watercourses and wetlands
A very small influence is expected on watercourses and wetlands.
Recreation
There will be local noise from compressors. Area for the aboveground plant will be fenced.However, this is no different from existing storage alternatives.
Cultural environment
No influence is expected.
Noise
There will be noise from the compressor station. The compressors will be isolated tominimize the noise.
Dust
Dust will practically not exist.
Emission
Emission of natural gas will only occur during maintenance of the aboveground facilities orin an emergency situation.
8.2 PERMIT SUMMARY
Tables 8-1 and 8-2 identify the federal and state regulations (Massachusetts and Georgia)that are or may be applicable to the LRC technology. Regulations and permits required in eachstate are principally driven by federal legislation, and are, therefore, generally similar.
A column is included in both tables that is entitled "Relevance to LRC Technology." Thiscolumn indicates whether a specific permit is required, likely to be required, or unlikely to berequired. Many of the permit requirements are site specific. It is, therefore, important toconsider all potential permit requirements in the site selection and design phases of the work.
Factors which will affect the permitting schedule and cost for an LRC storage facility in eachstate are highly site specific and should be an important consideration during the site selectionprocess. For example, locating an LRC facility near a valuable and protected resource, such asa wild and scenic river, will result in an increase in the time required and cost for permitting.In addition, a river basin commission authorization may also be required based on the proposedlocation of the LRC facility and the potential impacts of dewatering operations on areagroundwater.

90
Table 8-1. Federal and State Regulations That are or may be Applicable to the LRCTechnology in Massachusetts (Page 1 of 5)
Type Citation Agency Description and RequirementsRelevance
to LRCTech.
7(C) Certificates of the Natural Gas Act
Certificates are required to demonstrate or receive:• public convenience and necessity• provision of storage and transportation services• approval of market-based rates• confidential treatment
18 CFR Part157 & 284(a)
FERC
Typical permit application requirements include thefollowing descriptions or evaluations:• project• water use & quality• vegetation & wildlife• cultural resources• socioeconomics• geology• soils• land use, recreation, and aesthetics• air & noise quality• alternatives• reliability & safety• engineering design.
Yes
Massachusetts Environmental Policy Act
Environmental Notification Form (ENF) to be filedwith the Massachusetts Environmental Policy Act(MEPA) Office.
Agency and public comment period follow.
Likely
RegulatoryAffairs
301 CMR11.00(b)
MEPA(State)
Environmental Impact Report (EIR) may be required.Agency and public comment periods follow with astatement issued at the end of the process.
Unlikely
Air Permits
Air Plan approval required for construction of certainprojects:• fuel utilization facility with energy input above
certain threshold limits• construction in nonattainment areas• certain boilers, stationary engines, & emergency
generators.
Air QualityControl
310 CMR6.00, 7.00, &8.00
MADEP(State)
Relevant Permits:BWP AQ 02 (Nonmajor comprehensive approval)BWP AQ 03 (Major comprehensive approval)
LikelyUnlikely

91
Table 8-1. Federal and State Regulations That are or may be Applicable to the LRCTechnology in Massachusetts (Page 2 of 5)
Type Citation Agency Description and RequirementsRelevance
to LRCTech.
314 CMR MADEP(State)
NPDES Permits - Industrial WastewaterIndustrialWastewaterManagement
314 CMR3,00, 4.00 &12.00
BWP IW 18 Permit required for industrial wastewaterdischarge to surface waters (no threshold limits basedon discharge volume or rate).
Possible
314 CMR7.00 & 12.00
BWP IW 12 (Type I Facility) Permit and Plan approvalrequired for industrial wastewater discharge to MAsewer system.
Possible
314 CMR5.00 & 6.00
BWP IW 24 (Type I Facility) - plan approval only. Possible
314 CMR12.00
BWP IW 05 (Type I Facility) Permit to dischargeindustrial wastewater to groundwater.
Unlikely
Permits required to store industrial wastewater on sitein a holding tank with disposal via POTW. Nothresholds based on amount of discharge.
BWP IW 01 (Permit to construct & install a non-hazardous holding tank).BWP IW 28 (Permit to convert an existing tank to anonhazardous holding tank).
Unlikely
Unlikely
310 CMR15.00 (Title 5Regulations)
MunicipalBoard ofHealth
Sanitary Sewage Systems
Disposal Works Construction Permit is required fromthe local municipal Board of Health for septic systems<10,000 gpd.
Possible
WaterPollutionControl
314 CMR7.00 & 12.00
MADEP(State
State permits are required for sanitary sewage disposalsystems >10,000 gpd.BWP WP 01 Title 5 Plan ApprovalBWP WP 02 Title 5 VarianceBWP WP 03 Approval of miscellaneous sewagetreatment systemsBWP WP 04 Permit to pump sewage prior to entranceto septic tankBWP WP 10 Permit for discharge to groundwater(includes noncontact cooling water >2,000 gpd, -stormwater, construction dewatering, & otherdischarges with certain limited treatment
Unlikely

92
Table 8-1. Federal and State Regulations That are or may be Applicable to the LRCTechnology in Massachusetts (Page 3 of 5)
Type Citation Agency Description and RequirementsRelevance
to LRCTech.
314 CMR7.00 & 12.00
MADEP(State)
Sewer Connection to Public System
Permits are required for the following public sewerconnections.BRP WP 14 Sewer extension ≤2,500 feet & with flows<50,000 gpd or connected to a pump station.
Possible
WaterPollutionControl
314 CMR7.00 & 12.00
MADEP(State)
BRP WP 55 Permit for sewer extension or industrialwastewater connection (not covered under IndustrialWastewater Management Program) for flows ≥15,000gpd.
Unlikely
Industrial Wastewater Holding Tank
BRP WP 56 Permit for industrial wastewater holdingtank for a facility without a safer alternative.
Unlikely
WatershedManagement
40 CFR122-125
31 CMR3.00 & 4.00
NPDES Permits - Surface Water Discharge
NOTE: Massachusetts is not a delegated state underthe Clean Water Act; therefore, a USEPA GeneralPermit is required for Stormwater (Notice of Intent),construction site dewatering, noncontact cooling water,& minor nonprocess wastewater. An approved stormwater management plan is required. MADEP reviewwill not being until after a draft permit has beenreceived from USEPA. The permit program isadministered jointly with the USEPA.
USEPA &MADEP(State)
BWP WM 06 (Type I Surface Water Discharge).BWP WM 08 (EPA General Permit (NOI), Stormwater).BWP WM 09 (Approval of Stormwater ManagementPlan).BWP WM 10 (EPA General Permit, Construction SiteDewatering).BWP WM 11 (EPA General Permit, Noncontact CoolingWater).BWP WM 13 (EPA General Permit, Minor NonprocessWastewater).
UnlikelyYesYes
Yes
Unlikely
Possible
WatershedManagement
310 CMR4.00 & 36.00
MADEP(State
Surface Water & Groundwater Withdrawal
BRP WM 03 Permit required for surface water orgroundwater withdrawal from river basins at a rate>100,000 gpd or >9 million gal/3 mos.
Unlikely

93
Table 8-1. Federal and State Regulations That are or may be Applicable to the LRCTechnology in Massachusetts (Page 4 of 5)
Type Citation Agency Description and RequirementsRelevance
to LRCTech.
WaterSupply
310 CMR27.00
MADEP(State)
Underground Injection Control
BRP WS 06 Permit required for Class V well(underground injection).
NOTE: A recharge well(s) used to replenish water in anaquifer is classified as Class V.
Possible
Wetlands &Waterways
310 CMR9.00 & 10.00
MADEP(State)
401 Water Quality Certification
Required under the Federal Clean Water Act forcertain activities in wetlands and waters.Massachusetts has the authority to review projects thatmust obtain federal licenses or permits that result indischarges to state waters. This applies to dredging,disposal of dredged material, & placement of fill invegetated wetlands or waters subject to federaljurisdiction.
An optional Determination of Applicability (BRP WW04) for projects can be made by the WaterwaysRegulations Program.
Relevant license, permit, or certificate of compliancerequired for wetlands or waterways work include:
Possible
BRP WW 01 Waterways license - required for projectsinvolving the placement of structures & fill in nontidalrivers & streams and other categories.
Unlikely
Waterways permit - required for projects not involvingfill or placement of structures in waterways (such asdredging).
Possible
BRP WW 11 Project certification required for minor fillor excavation (loss up to 5,000 ft2 of bordering &isolated wetland).
Unlikely
BRP WW 08 Project certification required for minordredging (between 100 yd3 and 5,000 yd3).
Unlikely
BRP WW 05 Certificate of Compliance required within60 days of completion of the project.
Possible
USACOE Section 404 Permit (Federal)
Needed for a proposed activity that involves filling andconstruction in any waterway or wetland.
Likely
USACOE Section 10 Permit (Federal)
Needed for dredging, filling, or construction & repair ofstructures in navigable waters.
Unlikely

94
Table 8-1. Federal and State Regulations That are or may be Applicable to the LRCTechnology in Massachusetts (Page 5 of 5)
Type Citation Agency Description and RequirementsRelevance
to LRCTech.
Wetlands &Waterways
310 CMR10.00
LocalConservationCommission
Wetlands Protection
Wetlands protection is administered by localconservation commissions.
A Notice of Intent (NOI) and permit (Order ofConditions) is required from the local conservationcommission for removing, dredging, filling, or otheraltering of a wetland.
Possible
HazardousMaterials
Hazardous Waste Generators
Registration required for hazardous waste generators(LQG, SQG, & VSQG).
Possible
40 CFR 262 USEPA • EPA ID Number required for LQG & SQG (except waste oil)
310 CMR30.00
MADEP(State)
• MADEP registration required for VSQG & waste oil SQG.
NOTE: Waste oil is classified as hazardous in MA.
Hazardous materials recycling permit required for >27gal. hazardous waste per month.
Unlikely
Toxics UseReporting
310 CMR40.00,41.00, &50.00
MADEP(State)
Regulations which apply to facilities that use at least10,000 lbs. of any chemical listed on EPA's ToxicRelease Inventory (Section 313 - Emergency Planningand Right-to-Know and CERCLA).
Unlikely
Solid WasteManagement
310 CMR16.00 &19.00
MADEP(State)
Solid Waste Management Facilities
NOTE: A comprehensive site assessment is requiredfor a solid waste management facility permit.
Permits (or other) are required for the followingcategories:
BWP SW 17 Determination of Need, Small OperationSite Assignment.
BWP SW 27 Permit for new landfill between 25 & 250acre feet (volume).
BWP SW 28 Permit for new landfill <25 acre feet(volume)
BWP SW 10 Permit to receive authorization to operatea new landfill.
BWP SW 01 Permit to establish a new solid wastefacility.
Unlikely
(a) Code of Federal Regulations.
(b) Code of Massachusetts Regulations.

95
Table 8-2. Federal and State Regulations That are or may be Applicable to the LRCTechnology in Georgia (Page 1 of 4)
Type Citation Agency Description and RequirementsRelevance
to LRCTech.
7(C) Certificates of the Natural Gas Act
Certificates are required to demonstrate or receive:• public convenience and necessity• provision of storage and transportation services• approval of market-based rates• confidential treatment
18 CFR Part157 & 284(a)
FERC
Typical permit application requirements include thefollowing descriptions or evaluations:• project• water use & quality• vegetation & wildlife• cultural resources• socioeconomics• geology• soils• land use, recreation, and aesthetics• air & noise quality• alternatives• reliability & safety• engineering design.
Yes
UndergroundStorage
OCGASection 46-4-50 to 46-4-62
GA PublicServiceComm.(State)
Underground Gas Storage
Requirements & regulations which apply to utilitiesdesiring to use or operate an underground reservoir. Anorder approving the project is required from the PublicService Commission.
• The application shall include a legal description of all proposed improvements, maps showing the proposed facilities and underground reservoir, and other information to provide a clear and concise presentation.
Yes
SurfaceMining
Chapter 390-3-3(b),SurfaceMining
GDNR(EPD)(State)
Surface Mining
Permit and Mine Land Use Plan required for surfacemining. The Mine Land Use Plan shall include:• Engineering drawings, plans, specifications, maps, or
other attachments• A specific plan of action• Description of the company• Mining methods & lands to be affected• Reclamation objective & schedule• Affected acreage• Protection of contiguous natural resources &
property on the National Register of Historic Places• Erosion & siltation control.
Likely

96
Table 8-2. Federal and State Regulations That are or may be Applicable to the LRCTechnology in Georgia (Page 2 of 4)
Type Citation Agency Description and RequirementsRelevance
to LRCTech.
EminentDomain
Chapter 391-3-23,PetroleumPipelineEminentDomainProcedures
GDNR(EPD)(State)
Petroleum Pipeline Eminent Domain
A Certificate of Public Convenience and Necessity isneeded from the Commissioner followed by a permit.Permit application requirements include:• Certificate of Public Convenience• Property information (inc. consultations with owners)• Environmental effects report• Background engineering reports.
Possible
Air Chapter 391-3-1, AirQualityControl
GDNR(EPD)(State)
Air Permits
Title V Program Permit, application requirementsinclude:• Facility-wide information• Emission unit information• Emissions data• Monitoring program• Compliance program (for existing facilities not in
compliance)• Accidental release prevention program.
NOTE: Applicant may be able to combine groups ofemissions units.
Likely
Water Chapter 391-3-16.03
GDNR(EPD)(State)
Joint Application
401 Certification of Water Quality Likely
FederalWaterPollutionControl Act,Sections 301-303, 306 &307
State program is coordinated with USACOE (SavannaDist.) via a Memorandum of Understanding. FederalWater Pollution Control permits through USACOE aretypically included.
USACOE(Federal)
Section 404 Permit (Federal)
Needed for a proposed activity that involves filling andconstruction in any waterway or wetland.
Likely
USACOE(Federal)
Section 10 Permit (Federal)
Needed for dredging, filling, or construction ofstructures in navigable waters.
Unlikely
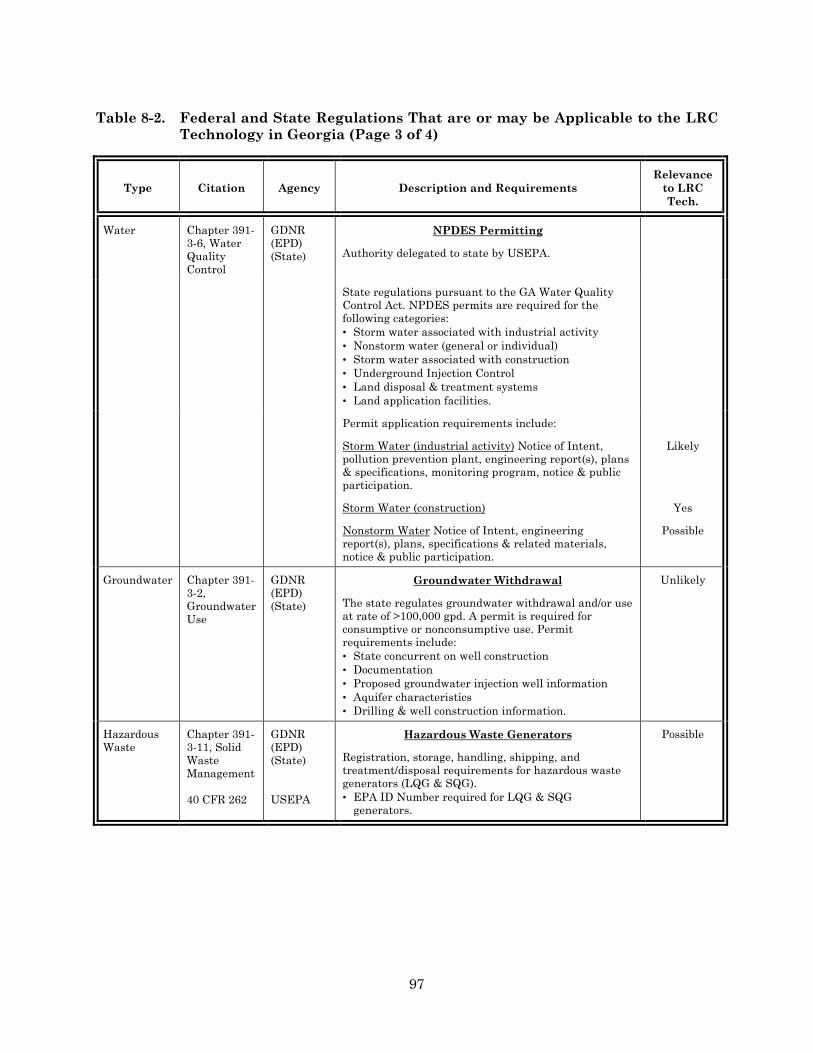
97
Table 8-2. Federal and State Regulations That are or may be Applicable to the LRCTechnology in Georgia (Page 3 of 4)
Type Citation Agency Description and RequirementsRelevance
to LRCTech.
Chapter 391-3-6, WaterQualityControl
GDNR(EPD)(State)
NPDES Permitting
Authority delegated to state by USEPA.
Water
State regulations pursuant to the GA Water QualityControl Act. NPDES permits are required for thefollowing categories:• Storm water associated with industrial activity• Nonstorm water (general or individual)• Storm water associated with construction• Underground Injection Control• Land disposal & treatment systems• Land application facilities.
Permit application requirements include:
Storm Water (industrial activity) Notice of Intent,pollution prevention plant, engineering report(s), plans& specifications, monitoring program, notice & publicparticipation.
Storm Water (construction)
Nonstorm Water Notice of Intent, engineeringreport(s), plans, specifications & related materials,notice & public participation.
Likely
Yes
Possible
Groundwater Chapter 391-3-2,GroundwaterUse
GDNR(EPD)(State)
Groundwater Withdrawal
The state regulates groundwater withdrawal and/or useat rate of >100,000 gpd. A permit is required forconsumptive or nonconsumptive use. Permitrequirements include:• State concurrent on well construction• Documentation• Proposed groundwater injection well information• Aquifer characteristics• Drilling & well construction information.
Unlikely
HazardousWaste
Chapter 391-3-11, SolidWasteManagement
40 CFR 262
GDNR(EPD)(State)
USEPA
Hazardous Waste Generators
Registration, storage, handling, shipping, andtreatment/disposal requirements for hazardous wastegenerators (LQG & SQG).• EPA ID Number required for LQG & SQG
generators.
Possible

98
Table 8-2. Federal and State Regulations That are or may be Applicable to the LRCTechnology in Georgia (Page 4 of 4)
Type Citation Agency Description and RequirementsRelevance
to LRCTech.
Solid WasteManagement
Chapter 391-3-4, SolidWasteManagement
GDNR(EPD)(State)
Solid Waste Management Landfills
Permit required for construction & operation of a solidwaste landfill. Landfill siting requirements include:• Site assessment report geologic, hydrologic, & env.
resources)• Application of specific design criteria• Approved monitoring program• Closure requirements.
Unlikely
UndergroundStorage TankManagement
Chapter 391-3-15,UndergroundStorageTankManagement
GDNR(EPD)(State)
Underground Storage Tank Registration
Annual registration required for underground storagetanks.
Possible
(a) Code of Federal Regulations.
(b) Rules of the Georgia Department of Natural Resources, Environmental Protection Division.
Overall, a rough estimate of the time required to obtain necessary permits in these stateswill generally range between 18 and 24 months, based on the following assumptions:
• An Environmental Impact Statement (EIS) is not required (site location is critical forthis issue).
• Site selection, property acquisition (excluding pipeline right-of-ways, if required), andpreliminary design are substantially complete at the onset of permit studies andapplications.
It should be further noted that the following issues may increase the permitting schedule:
• If the project is opposed by the agencies, special interest groups, or intervenors.
• Construction and/or project health and safety reviews, as may be required by theOccupational Safety and Health Administration (OSHA) or Mine Safety and HealthAdministration (MSHA) may be required.
• Local municipal reviews and approvals will be required.
As far as costs for licensing and permitting, project specifics, such as length of pipeline tie-ins, proximity to environmentally sensitive areas, and level of opposition to the project, greatlyimpact the costs of permitting and licensing. Therefore, a range of $2-10 million for permittingactivities would not be unreasonable.

99
9.0 REFERENCES
Barton, N., R. Lien, and J. Lunde, 1974. "Engineering Classification of Rock Masses for theDesign of Tunnel Support," Rock Mechanics, Springer Verlag, Vol. 6, pp. 189-236.
Bieniawski, Z. T., 1973. "Engineering Classification of Jointed Rock Masses," Trans. SouthAfrican Inst. Civ. Eng., Vol. 15, No. 12, pp. 335-344.
Bieniawski, Z. T., 1978. "Determining Rock Mass Deformability - Experiences From CaseHistories," International Journal of Rock Mechanics and Mining Science & GeomechanicsAbstracts, Vol. 15, pp. 237-247.
Brown, E. T., J. W. Bray, B. Ladanyi, and E. Hoek, 1983. "Ground Response Curves forRock Tunnels," Journal of Geotechnical Engineering, ASCE 109, pp. 15-39.
Energy and Environmental Inc., 1994. Cost of New Underground Natural Gas StorageFacilities in the Lower 48 States, final report submitted to United States Department of Energyand the Energy Information Administration.
Energy Information Administration, 1998. Natural Gas 1998: Issues and Trends.
Goldsmith, R., 1987. The Bedrock Geology of Massachusetts, U.S. Geologic SurveyProfessional Paper 1366-E-J.
Grimstad, E. and E. Barton, 1993. "Updating of the Q-System for NMT," Proceedings,International Symposium on Sprayed Concrete - Modern Use of Wet Mixed Sprayed Concretefor Underground Support, Fagernes, Eds. Kompen Opsahl och Berg. Norwegian ConcreteAssociation, Oslo, Norway.
Harvey, R. C. and E. Burley, 1973. "Behaviour of Shallow Inclined Anchorages inCohesionless Sand," Ground Engineering, Vol. 6, pp. 48-55.
Hoek, E., and E. T. Brown, 1980. "Underground Excavations in Rock," Institute of Miningand Metallurgy, London.
Hoek, E., P. K. Kaiser, and W. F. Bawden, 1997. Support of Underground Excavations inHard Rock, A. A. Balkema.
Isander, A., 1994. "Rock Mechanical Results From a Research Facility for Storage of NaturalGas in Lined Rock Caverns," ISRM International Symposium, Santiago, Chile.

100
Littlejohn, G. S. and D. A. Bruce, 1975. "Rock Anchors - State of the Art," GroundEngineering, May.
McConnell, K. I. and J. O. Costello, 1982. "Guide to Geology Along a Traverse Through theBlue Ridge and Piedmont Provinces of North Georgia," Excursions in Southeastern Geology,R. W. Frey (ed.), American Geological Institute, Vol. 1, pp. 241-258.
Sagefors, I. and P-A. Daerga, 1996. "An Excavation Method for Large Vertical CylindricalCaverns," Tunnelling and Underground Space Technology, Vol. 11, No. 3, pp. 279-285.
Serafim, J. L. and J. P. Pereira, J. P., 1983. "Consideration of the GeomechanicalClassification of Bieniawski," Proceedings, International Symposium on Engineering Geologyand Underground Construction, Lisbon 1(II), pp. 33-44.
Stille, H., 1984. Rock Bolting - Analysis Based on the Theory of Ground Reaction Curve,Report 151:1/84, Swedish Rock Engineering Research, SveBeFo, Stockholm, Sweden.
Stille, H., A. Fredriksson, and T. Groth, 1982. FEM-Analys Av Bergmekaniska ProblemMed JOBFEM, BeFo Nr. 307:1/82.
Stille, H., J. Johansson, and R. Sturk, 1994. "High Pressure Storage of Gas in Lined RockCaverns - Results From Field Tests," Proceedings, EUROCK'94 International Conference, Delft,Balkema, Rotterdam.
Sturk, R. and H. Stille, 1995. "Design and Excavation of Rock Caverns for Fuel Storage - ACase Study From Zimbabwe," Tunneling and Underground Space Technology, Vol. 10, No. 2,pp. 193-201.
Sydgas, 1990a. Catastrophic Case for Lined Rock Caverns, Internal report.
Sydgas, 1990b. Simulation of Natural Gas Dispersion at Leakage From a Rock Storage,Internal report.
Sydgas, 1992. Initial Risk Analysis for Lined Rock Caverns Storage for Natural Gas, Internalreport.
Sydgas and Vattenfall, 1992. Swedgas' Storage Project, Technology and Costs, Summary,Internal report.
Sydgas, Sydkraft, Vattenfall, and Swedgas, 1987a. Lined Rock Caverns: Project CarbonSteel Lining, Internal report.
101
Sydgas, Avesta Lining, and Swedgas, 1987b. Stainless Steel for Lining of Rock Cavern forStoring of Pressurized Natural Gas, Internal report.
Sydgas, Sydkraft, Avesta Lining, and Vattenfall, 1989. Sydgas Natural Gas Storage -Phase 1, Internal report.
Sydkraft and Gas de France, 1996a. Basic Design Report, Internal report.
Sydkraft and Gas de France, 1996b. Final Risk Asssessment, Internal report.
Sydkraft and Gas de France, 1997. Elaboration of Detailed Demonstration Program,Internal report.
Sydkraft and Skanska, 1995a. Authority Standards, Internal report.
Sydkraft and Skanska, 1995b. Operational Conditions, Internal report.
Sydkraft and Skanska, 1995c. Site Specific Conditions, Internal report.
Sydkraft and Skanska, 1995d. Technical Criteria for Localization, Internal report.
Sydkraft and Skanska, 1995e. Risk Analysis, Internal report.
Sydkraft and Skanska, 1995f. Modelling of Sandwich Wall Construction, Internal report.
Sydkraft and Skanska, 1995g. System for Water and Gas Drainage for Lined Gas Storage,Internal report.
Sydkraft and Skanska, 1995h. Supplementary Rock Mechanical Studies, Internal report.
Sydkraft and Skanska, 1995i. Strategy and Program for Quality Assurance, Internal report.
Sydkraft and Skanska, 1995j. Simplified Above Ground Plant, Internal report.
Thompson, J. M., 1997. "U.S. Underground Storage of Natural Gas in 1997: Existing andProposed," Natural Gas Monthly, September.
Vesic, A. S., 1971. "Breakout Resistance of Objects Embedded in Ocean Bottom," Journal ofSoil Mechanics and Foundation Division, ASCE, Vol. 97, No. SM9, pp. 1183-1205.

A-1
APPENDIX A
DESCRIPTION OF JOBFEMFINITE ELEMENT SOFTWARE

A-2
APPENDIX ADESCRIPTION OF JOBFEM FINITE ELEMENT SOFTWARE
A FINITE ELEMENT COMPUTER PROGRAM FOR ANALYSISOF SOIL AND ROCK STRUCTURES
JOBFEM is a finite element program specially designed to simulate soil and rock structuresand offers the following features:
• Material behaviors, such as elasto-plasticity with Mohr-Coulomb failure criteria, multi-laminate materials, hyperbolic stress-strain relationship, and a joint model.
• Excavation, filling, variable pore pressure, and temperature loads.
• Calculation of transient and steady state groundwater head or temperature flow.
• Three- and four-node area elements and a four-node joint element.
• The application of support elements such as tensioned and untensioned rock bolts,linings, beams, and shells.
• Analysis of either two-dimensional (plane strain, plane stress) or axisymmetricalproblems.
The program system JOBFEM includes a preprocessor for mesh generation and mesh plottingand postprocessors for plotting the results of the analysis in different forms.
JOBFEM was developed at the Department of Soil and Rock Mechanics at the Royal Instituteof Technology in Stockholm. The program has been used in Sweden for several years inpractical design. A manual in English is available.

B-1
APPENDIX B
LRC GAS TEMPERATURE CALCULATIONS

B-2
APPENDIX BLRC GAS TEMPERATURE CALCULATIONS
1. Temperature and pressure initialization
During the commissioning procedure, it is planned to pressurize the cavern with water.Therefore, temperature simulations can be initiated with a water-filled cavern. The cavern isassumed to be filled with water for 60 days for the tests. The dewatering phase will lastapproximately 1 month. The initial conditions are as follows:
Water temperature 11°C (51°F)Rock temperature 17°C (62°F)
2. Cavern Characteristics
The cavern geometric characteristics are as follows:
Midcavern depth 200 mVolume 80 000 m3
Diameter 35 mHeight 83 m
3. Thermal characteristics for the surrounding rock mass
The rock thermal properties are as follows:
Conductivity 3.5 W/m/KSpec. weight 2,700 kg/m3
Spec. heat 800 J/kg/KGeothermal Gradient 0.03 K/m
4. Gas Characteristics
The thermodynamic functions of the gas are calculated by using norm AGA8.
5. Cavern performance
The cavern performance characteristics are as follows:
Working gas 14.3 × 10⁶m3 (0.50 Bscf)Gas withdrawal, maximum 1.4 × 10⁶m3/day (50 MMscf/day)Gas injection 0.7 × 10⁶m3/day (25 MMscf/day)Time of withdrawal 10d

B-3
Time of injection 20dPressure after injection 230 bar (3,330 psi)Pressure after withdrawal 38 bar (550 psi)Gas injection temperature is equal to 10°C (50°F).
RESULTS
The results of the thermal simulation are shown in Figure B-1. The first injection starts atDay 11 and lasts for 20 days. After that, there is a quiescence period of 20 days before the10-day withdrawal starts. The temperature for this cycle varies from a maximum of +43°C(108°F) after injection to -18°C (0°F).
The second injection cycle starts directly after the withdrawal. At the end of the 20-dayinjection, the cavern temperature is 37°C (99°F). The preceding 10-day withdrawal startsimmediately after the injection. The temperature after withdrawal is -18°C (0°F). The cycle isrepeated again with the same results.

Figure B-1. Pressure and Temperature Variation in the Cavern.
RS
I-835-99-116
B-4
Pressure and temperature variation in the cavern
-30
-20
-10
0
10
20
30
40
50
0 20 40 60 80 100 120 140 160
Time (days)
Tem
pera
ture
(°C
)
0
50
100
150
200
250
Pre
ssur
e (b
ar)
TEMP, CAVERN (C)
PRESS, CAVERN (BAR)

C-1
APPENDIX C
DESIGN DRAWINGS

C-2
APPENDIX CDESIGN DRAWINGS
DRAWING LISTDEPARTEMENT OF ENERGYLRC NATURAL GAS STORAGE Date 1999-01-31Drawing No. Date Name Rev Date Remark
EXGAZ -01 980831 PROCESS DIAGRAM A 990121EXGAZ -02 980831 PROCESS DIAGRAM LOADING WITH REDUCTION A 990121EXGAZ -03 980831 PROCESS DIAGRAM LOADING WITH COMPRESSION A 990121EXGAZ -04 980831 PROCESS DIAGRAM WITHDRAWAL WITH REDUCTION A 990121EXGAZ -05 980831 PROCESS DIAGRAM WITHDRAWAL WITH COMPRESSION A 990121
EXGAZ -06 980831 PROCESS DIAGRAM CIRCULATION COOLING/HEATING A 990121EXGAZ -07 980902 NEW ENGLAND LAY-OUT -EXGAZ -08 980902 PIPING IN STORAGE ROOM -EXGAZ -12 990128 STORAGE ROOM, SECTION SITE 2 -EXGAZ -13 990128 ROCK REINFORCEMENT -EXGAZ -14 990128 ACESS TUNNEL, SECTION STRAIGHT, CURVE -EXGAZ -15 GENERAL LAYOUT -EXGAZ -16 CAVERN AND TUNNELLING CONFIGURATION -


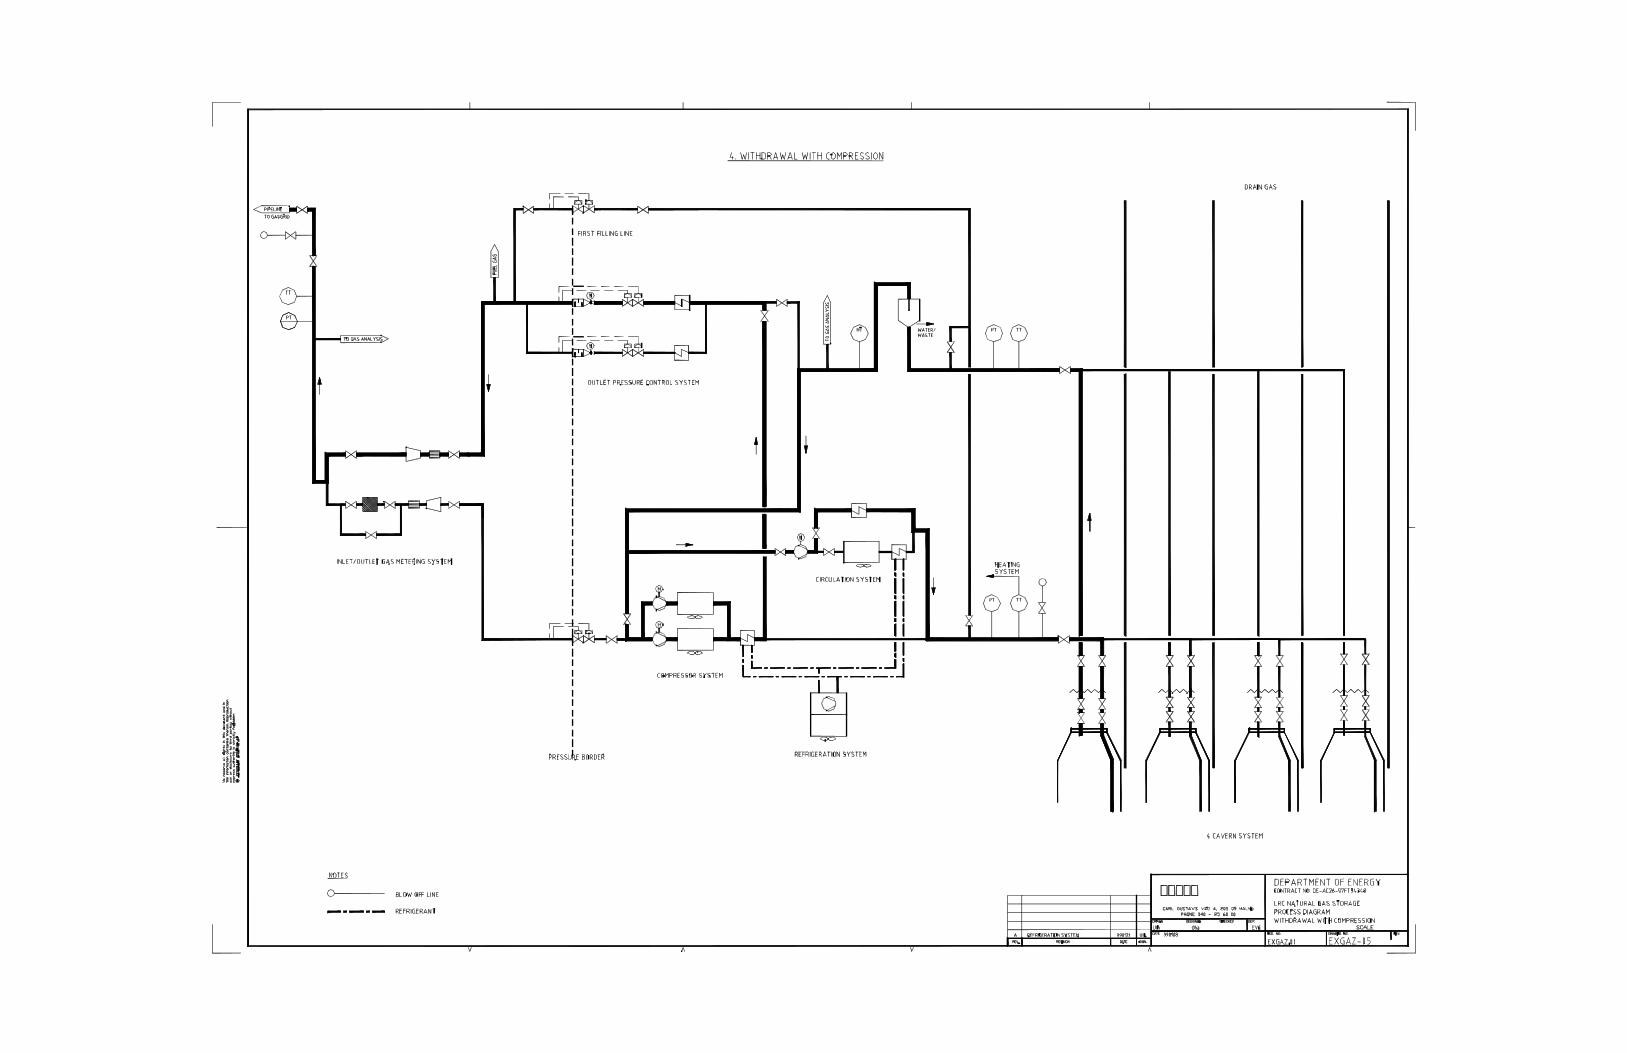


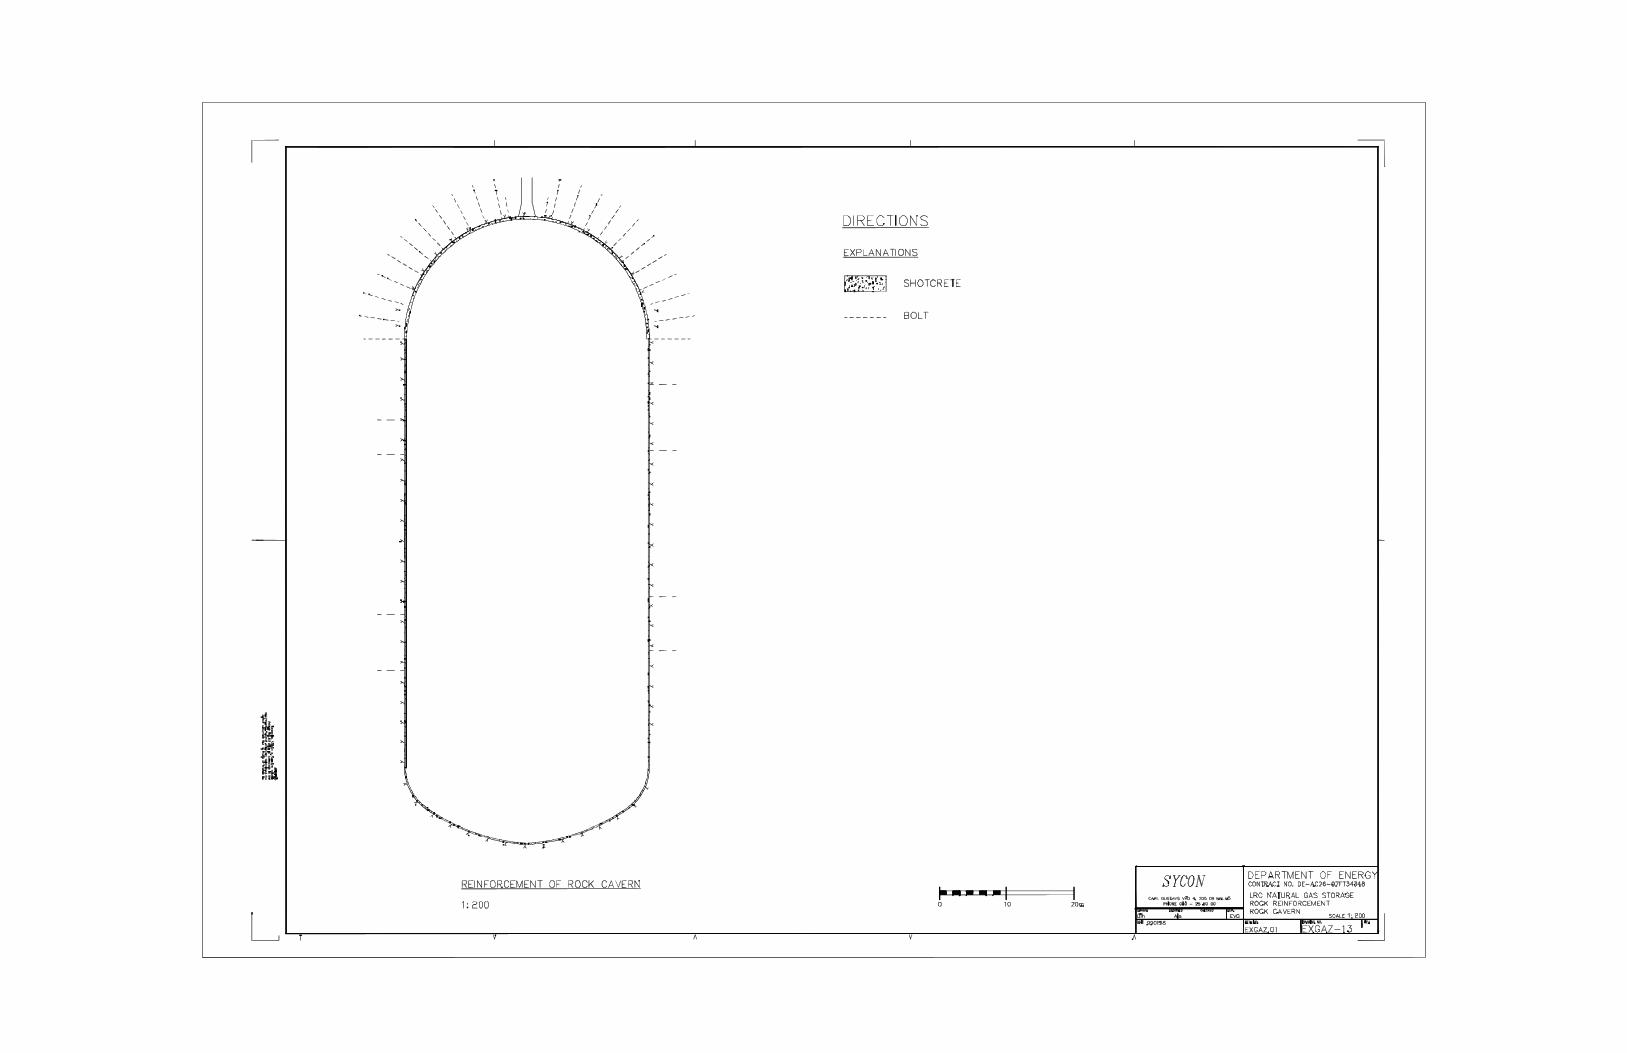


Drawing No. EXGAZ-15. General Layout.

Drawing No. EXGAZ-16. Cavern and Tunneling Configuration.
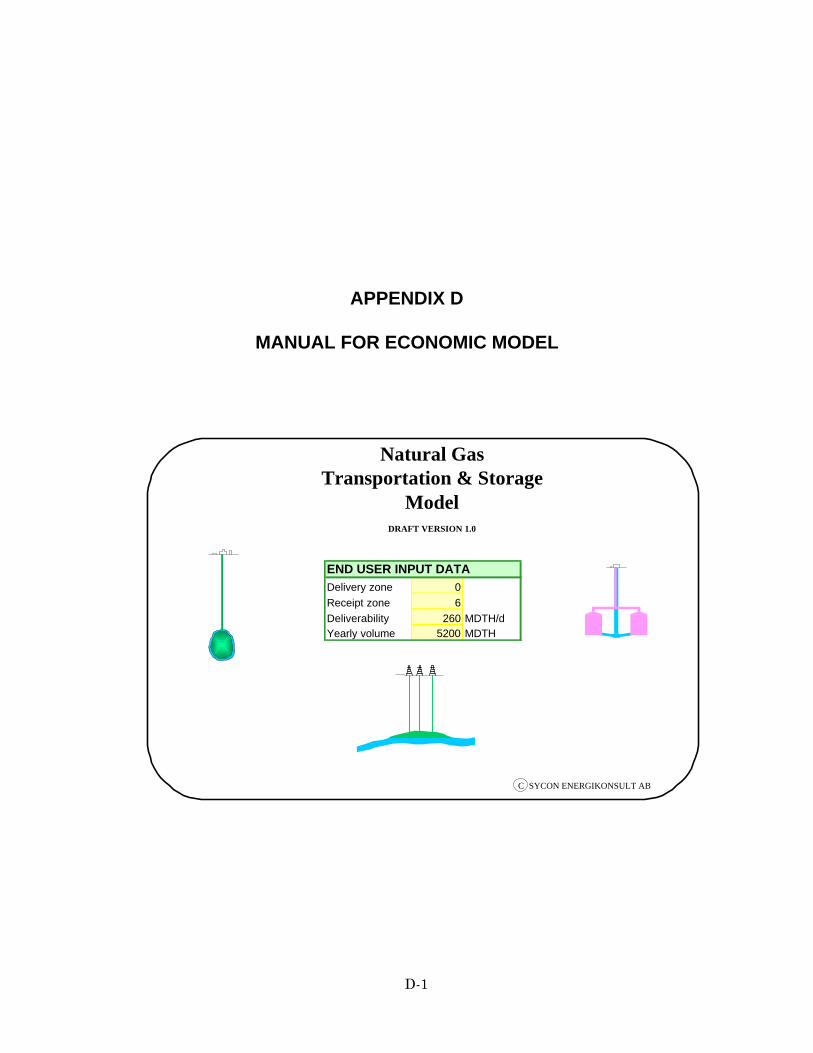
D-1
APPENDIX D
MANUAL FOR ECONOMIC MODEL
END USER INPUT DATADelivery zone 0Receipt zone 6Deliverability 260 MDTH/dYearly volume 5200 MDTH
Natural Gas Transportation & Storage
Model DRAFT VERSION 1.0
C SYCON ENERGIKONSULT AB

D-2
APPENDIX DMANUAL FOR ECONOMIC MODEL
D.1 INTRODUCTION
This economic model was developed by Sycon Energikonsult, Sweden. It is developed inMicrosoft Excel 97, SR-2.
The economic model can be used for two types of investigations:
1. Evaluation of investment and operating cost for an LRC storage facility.
2. Evaluation of a cost estimate for transportation of natural gas between different parts ofthe eastern United States gas grid.
A natural gas customer may wish to buy a certain yearly volume of gas and may have acertain need for deliverability. The gas is consumed in one zone and supplied in another. Thegas has to be transported from the delivery zone to the receipt zone. As shown in Figure D-1,this can be done in two ways; either directly by pipeline or via storage. You can choose differentstorage types and they can be placed in different zones. With the model, alternatives can becompared and the most favorable alternative can be chosen.
Figure D-1. Alternatives for Gas Transportation.
Receipt Zone 3Delivery Zone 1
Storage Zone 2
Receipt Zone 3

D-3
The different types of storage that are handled by the model are:
• Salt cavern
• Depleted fields
• LRC
• LNG.
D.2 BACKGROUND
Storage costs for salt caverns and depleted fields are based on the study U.S. UndergroundStorage of Natural Gas in 1997: Existing and Proposed. The proposed storage projects in thestudy reflect the costs for building new storage projects.
Storage costs for LRC are based on the SECON model. The SECON model was developed bySycon Energikonsult AB and was originally designed to calculate the costs for building LRCstorage in Sweden. The costs in the model have been revised to match the United States'conditions.
LNG storage costs are based on the study titled Advanced Underground Gas StorageConcepts Refrigerated-Mined Cavern Storage, DOE Contract Number DE-AC26-97FT34349.
Transportation rates are those of the Tennessee Gas Pipeline Company.
D.3 INSTRUCTIONS
Cells used for input data in the spreadsheet model are yellow. In the model, the user canselect the eight sheets noted below:
1. End User Input Data
2. Transportation Cost
3. Cost Comparison Graph
4. LRC Investment Cost
5. Storage Rate
6. i-Data
7. i-Model Transportation Rate
8. i-COS LRC.

D-4
Some sheets in the model have a name that begins with "i;" for example, i-Data. Thesesheets give background information only.
D.3.1 End User Input Data (Sheet 1)
In this sheet, the user must insert the delivery zone and the receipt zone. The user will alsohave to insert the deliverability volume and the yearly volume to be transported, as illustratedin Figure D-2. As mentioned above, the cells with yellow cover are for inserting data.
Figure D- 2. End User Input Data.
D.3.2 Transportation Cost (Sheet 2)
In this sheet, the model calculates (1) the transportation cost directly by pipeline to the enduser and (2) in the other alternative, via storage. The user must also give the size andperformance for the LRC investment cost calculation on this sheet.
D.3.2.1 Transportation Cost to End User (1.)
The model calculates the cost for transportation of gas directly to the end user by pipeline.The model uses a firm transportation rate based on the chosen delivery and receipt zone. If theuser wishes to use the calculated value from the model, the calculated value must be insertedin the cell for "Actual Transportation Rate." If another transportation rate is to be used, thatvalue needs to be input in the cell for "Actual Transportation Rate" and the model will use thatvalue instead. The user must always insert a value in the cell for "Actual Transportation Rate."
The model shows the yearly transportation cost. It also shows transportation cost per yearlygas volume and yearly transportation cost per deliverability, as shown in Figure D-3.
D.3.2.2 Pipeline + Storage (2.)
The next step in the modeled process is to calculate the cost for transportation of gas,including storage.
END USER INPUT DATADelivery zone 0
Receipt zone 6
Deliverability 520 MDTH/d
Yearly volume 62400 MDTH
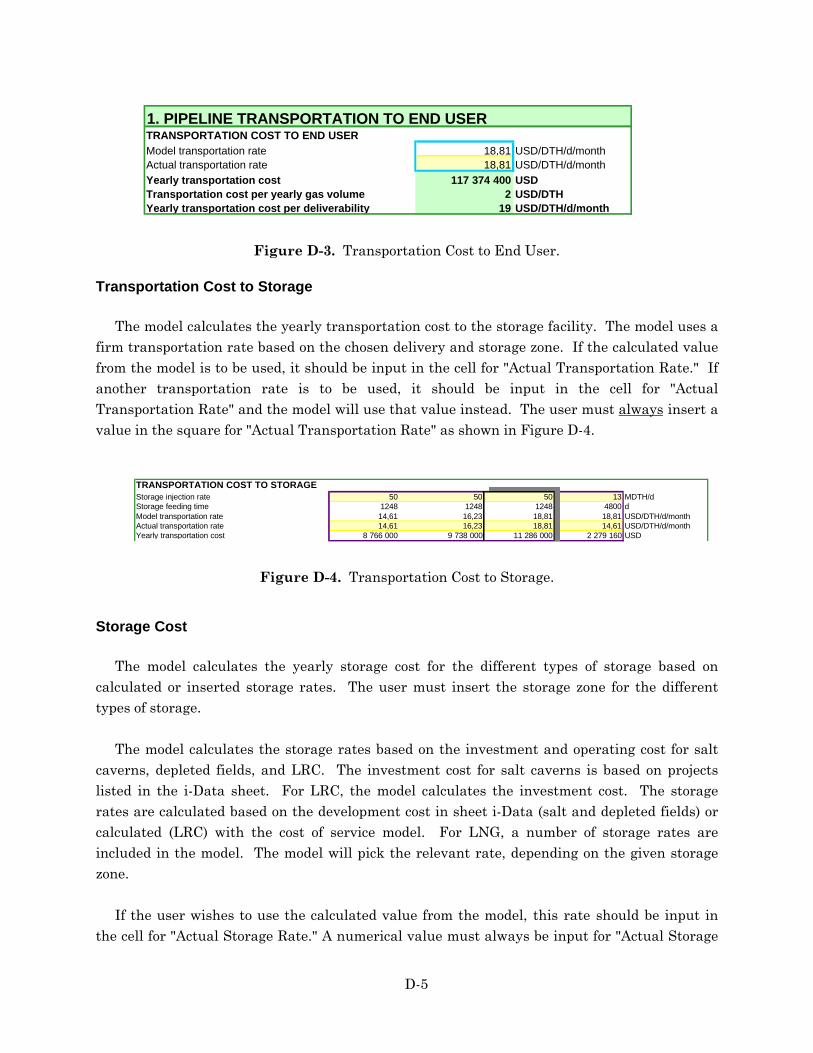
D-5
Figure D-3. Transportation Cost to End User.
Transportation Cost to Storage
The model calculates the yearly transportation cost to the storage facility. The model uses afirm transportation rate based on the chosen delivery and storage zone. If the calculated valuefrom the model is to be used, it should be input in the cell for "Actual Transportation Rate." Ifanother transportation rate is to be used, it should be input in the cell for "ActualTransportation Rate" and the model will use that value instead. The user must always insert avalue in the square for "Actual Transportation Rate" as shown in Figure D-4.
Figure D-4. Transportation Cost to Storage.
Storage Cost
The model calculates the yearly storage cost for the different types of storage based oncalculated or inserted storage rates. The user must insert the storage zone for the differenttypes of storage.
The model calculates the storage rates based on the investment and operating cost for saltcaverns, depleted fields, and LRC. The investment cost for salt caverns is based on projectslisted in the i-Data sheet. For LRC, the model calculates the investment cost. The storagerates are calculated based on the development cost in sheet i-Data (salt and depleted fields) orcalculated (LRC) with the cost of service model. For LNG, a number of storage rates areincluded in the model. The model will pick the relevant rate, depending on the given storagezone.
If the user wishes to use the calculated value from the model, this rate should be input inthe cell for "Actual Storage Rate." A numerical value must always be input for "Actual Storage
1. PIPELINE TRANSPORTATION TO END USERTRANSPORTATION COST TO END USERModel transportation rate 18,81 USD/DTH/d/monthActual transportation rate 18,81 USD/DTH/d/monthYearly transportation cost 117 374 400 USDTransportation cost per yearly gas volume 2 USD/DTHYearly transportation cost per deliverability 19 USD/DTH/d/month
TRANSPORTATION COST TO STORAGEStorage injection rate 50 50 50 13 MDTH/dStorage feeding time 1248 1248 1248 4800 dModel transportation rate 14,61 16,23 18,81 18,81 USD/DTH/d/monthActual transportation rate 14,61 16,23 18,81 14,61 USD/DTH/d/monthYearly transportation cost 8 766 000 9 738 000 11 286 000 2 279 160 USD

D-6
Rate" except for LRC. For LRC, there is no actual storage rate, so the model will always use thecalculated storage rate.
If the user wishes to use an actual storage rate, that rate must be input in the cell for"Actual Storage Rate" and the model will calculate with that value instead.
For LRC, various working gas volumes, deliverability, injection rate, and number of cyclescan be input to obtain the best option for minimizing the transportation cost. The calculatedstorage rate is presented in the "Transportation Cost" sheet (see Figure D-5). The investmentcost is detailed in the "LRC-Investment Cost" sheet (described in Section D.3.6).
Figure D-5. Storage Cost.
Transportation Cost to End User
The model calculates the yearly cost for transportation of gas from the storage facility to theend user. The model uses a transportation rate based on the chosen storage zone and thechosen receipt zone. If the user wishes to use the calculated value from the model, this ratemust be input in the cell for "Actual Transportation Rate." If the user wishes to calculate withanother transportation rate, that rate must be input in the cell for "Actual Transportation Rate"and then the model will use that value instead.
If the user inputs a "Y" in the cell for "Customer Connected Directly to Storage," then themodel will not account for any cost for transportation from storage to the end user.
The model shows the total yearly cost for the different alternatives with storage. It alsoshows the total cost per yearly gas volume and per deliverability.
Finally, the yearly cost difference between using pipeline transportation plus differentstorages and alternative pipeline transportation directly to the end user is provided as shownin Figure D-6.
STORAGE COSTType of Storage Salt Cavern Depleted Field LRC LNGStorage zone 4 5 6 6Deliverability 260 260 260 260 MDTH/dInjection rate 130 MDTH/dWithdrawal time 10 dWorking gas 2,6 BcfNo. of cycles 2No of caverns 4Calculated storage rate 6,8 19,1 10,1 6,4 USD/DTH/d/monthActual storage rate 6,4 19,1 6,4 USD/DTH/d/monthYearly storage cost 19 968 000 59 592 000 31 534 767 39 936 000 USD

D-7
Figure D-6. Transportation Cost to End User.
D.3.3 Cost Comparison Graph
In the cost comparison graph, the transportation cost for the different alternatives and theallocation of transportation costs are illustrated in Figure D-7.
Figure D-7. Cost Comparison Graph.
D.3.4 Storage Rate
As shown in Figure D-8, the actual storage rate and the calculated storage rate for thedifferent storage types in the selected storage zone are illustrated by the model.
D.3.5 LRC Investment Cost
The model shows the investment costs for LRC, based on the working gas volume,deliverability, injection rate, and number of cycles that are input to the model, as shown inFigure D-9.
TRANSPORTATION COST TO END USERCustomer connected directly to storage (Y/N) N N N NModel transportation rate 7,81 6,82 5,01 7,81 USD/DTH/d/monthActual transportation rate 7,81 6,81 5 7,8 USD/DTH/d/monthYearly transportation cost 48 734 400 42 494 400 31 200 000 48 672 000 USDTotal yearly cost 97 436 400 171 416 400 118 642 987 500 231 160 USDTotal cost per yearly gas volume 1,6 2,7 1,9 8,0 USD/DTHTotal yearly cost per deliverability 15,6 27,5 19,0 80,2 USD/DTH/d/monthYearly cost difference 2-1 -19 938 000 54 042 000 1 268 587 382 856 760 USD
Yearly Cost
0
10 000
20 000
30 000
40 000
50 000
60 000
70 000
80 000
90 000
100 000
Only T
rans
porta
tion
Salt C
aver
n
Deplet
ed F
ield
LRC
LNG
MU
SD Transportation to end user
Storage
Transportation to storage

D-8
Figure D-8. Storage Rate.
Figure D-9. LRC Investment Cost.
Storage Rate
0
2
4
6
8
10
12
14
16
18
20
Salt Cavern Depleted Field LRC LNG
US
D/D
TH
/d/m
on
th
Calculated storage rate Actual storage rate
Deliverability 6 MDTH/dWorking gas 5,2 BcfInjection rate 260 MDTH/dNo. of cycles 12Pre-Construction 7 000 MUSDBelow Ground Cost 239 480 MUSDAbove Ground 62 000 MUSDBase Gas 2 500 MUSDSubtotal 310 980 MUSDAFUDC 35 189 MUSDTotal 346 169 MUSD


![Alabaster Caverns[1]](https://img.dokumen.tips/doc/110x75/577cc1eb1a28aba7119403cd/alabaster-caverns1.jpg)