Embed Size (px)
Citation preview
Comments on Low Carbon Fuel Standard
Re-Adoption Fuel Availability Workshop
October 2014
1
Co
pyrig
ht ©
20
14
by T
he
Bo
sto
n C
on
su
ltin
g G
rou
p,
Inc.
All
rig
hts
re
se
rve
d.
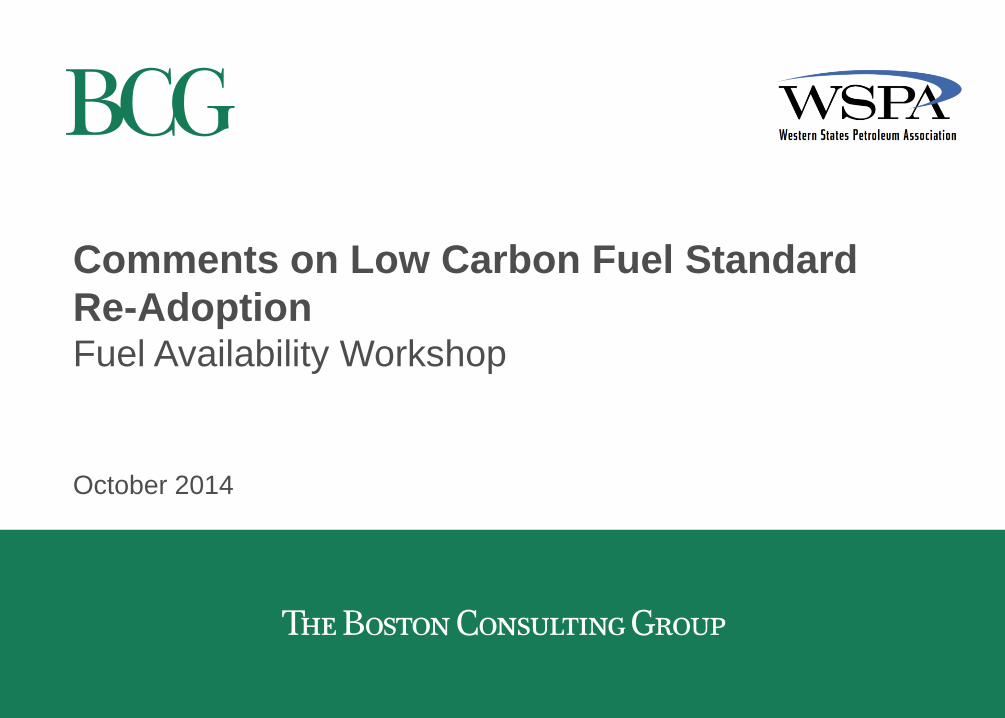
Overview
On September 25, 2014 the California Air Resources Board (CARB) presented their findings on the
availability of low carbon intensity (CI) fuels expected to be available through 2020.
These findings are expected to have a significant impact on the following CARB analyses in process:
• Availability of low-CI fuels available in California through 2020
• Estimates of regulated parties' compliance through 2020
The following comments and questions relate to CARB's current estimate of US low-CI fuel availability
and what is expected as the re-adoption process continues
Specifically, we would like to raise the following points:
• The forecast of some of the low-CI fuels are overly optimistic (e.g. sugarcane ethanol, Brazilian cellulosic
ethanol, renewable gasoline, renewable diesel)
• CARB's forecasts appear to depend heavily on the assumption that a strong regulation ("market signal")
will drive the availability of low-CI fuels in the next five years
• There are a number of factors that should be considered going forward that were not addressed in this
workshop. These must be addressed in the following workshop currently scheduled for October 27

2
Co
pyrig
ht ©
20
14
by T
he
Bo
sto
n C
on
su
ltin
g G
rou
p,
Inc.
All
rig
hts
re
se
rve
d.
Agenda
Sugarcane ethanol
Cellulosic ethanol
Renewable gasoline
Renewable diesel
Low-CI fuel market signal
Constraints to consider for California fuel availability
Expectations for upcoming workshop
3
Co
pyrig
ht ©
20
14
by T
he
Bo
sto
n C
on
su
ltin
g G
rou
p,
Inc.
All
rig
hts
re
se
rve
d.
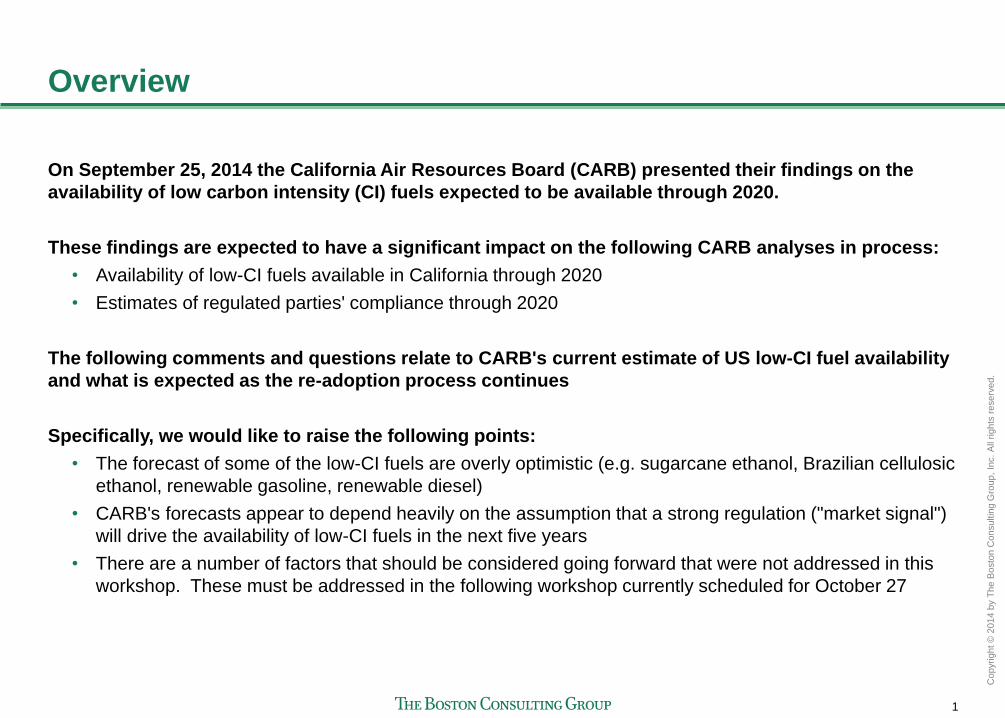
Brazilian exports to US have increased in recent years
despite uneven production levels
173
541432
421
346
277
334
82
465
72
0
200
400
600
800
1,000
MGY
2013
767
2012
818
2011
520
2010
503
20141
537
to US to other countries
Ethanol produced in Brazil Ethanol exported from Brazil
1. Projected 2014 totals using Jan-May 2014 data Source: Unicadata
7,2737,232
5,000
5,500
6,000
6,500
7,000
7,500
2010 2011 2012 2013 2014
MGY +2%
6,136
5,992
6,787
Annual Production
4
Co
pyrig
ht ©
20
14
by T
he
Bo
sto
n C
on
su
ltin
g G
rou
p,
Inc.
All
rig
hts
re
se
rve
d.
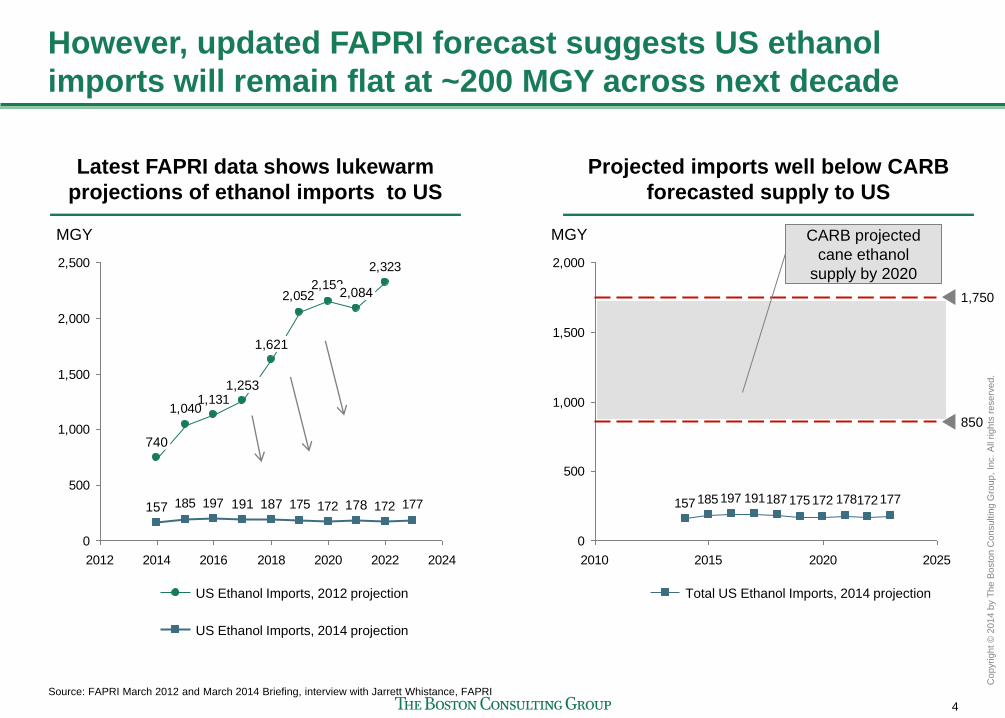
However, updated FAPRI forecast suggests US ethanol
imports will remain flat at ~200 MGY across next decade
2,323
2,1522,052
1,1311,040
177172172175197185
0
500
1,000
1,500
2,000
2,500
2012 2014 2016 2018 2020 2022 2024
1,253
157
740
178
2,084
187
1,621
191
MGY
Source: FAPRI March 2012 and March 2014 Briefing, interview with Jarrett Whistance, FAPRI
Latest FAPRI data shows lukewarm
projections of ethanol imports to US
US Ethanol Imports, 2012 projection
US Ethanol Imports, 2014 projection
177172178172175187191197185157
0
500
1,000
1,500
2,000
2010 2015 2020 2025
850
MGY
1,750
Total US Ethanol Imports, 2014 projection
Projected imports well below CARB
forecasted supply to US
CARB projected
cane ethanol
supply by 2020

5
Co
pyrig
ht ©
20
14
by T
he
Bo
sto
n C
on
su
ltin
g G
rou
p,
Inc.
All
rig
hts
re
se
rve
d.
Long-term, several factors could affect the supply of
Brazilian sugarcane ethanol
Factors Description Effect on ethanol volume availability to CA
Weather Bad weather such as drought or
harsh winters
Reduced sugarcane crop for ethanol production
World sugar prices Greater demand driving higher
sugar prices
Reduced % of sugar cane allocated to ethanol vs.
sugar
Flex fuel adoption in Brazil
Increased level of flex-fuel
adoption
Price of hydrous < 70% of gasoline
Price of hydrous > 70% of gasoline
Brazil gasoline prices
Higher gasoline prices
Reduced domestic demand for anhydrous ethanol
if hydrous < 70% of gasoline price
No change in domestic demand for anhydrous if
hydrous > 70% of gasoline price
RIN prices in U.S. Higher RIN prices driven by
RFS2 mandates
Demand up for sugarcane ethanol in U.S.
reduces CA share
Infrastructure
constraints
State of ports Ports congested and under-
invested; not expect to change in
next four years
May not be able to export significantly high
projected ethanol volume
Domestic
logistics cost
Logistics costs from inland to
coast are high
Potentially unattractive if trying to export to U.S.
from inland Brazil
U.S. pipeline
availability
Very few dedicated ethanol
pipelines in the U.S.
Would have to ship directly to California; in
absence of it, would need trucks and rails to
transport sugarcane ethanol to California
Cyc
lic
al
Str
uc
tura
l
Key factor Source: World Ethanol Outlook to 2020, Unica, Deustsche Bank, Credit Suisse, BCG Analysis
6
Co
pyrig
ht ©
20
14
by T
he
Bo
sto
n C
on
su
ltin
g G
rou
p,
Inc.
All
rig
hts
re
se
rve
d.
Agenda
Sugarcane ethanol
Cellulosic ethanol
Renewable gasoline
Renewable diesel
Low-CI fuel market signal
Constraints to consider for California fuel availability
Expectations for upcoming workshop

7
Co
pyrig
ht ©
20
14
by T
he
Bo
sto
n C
on
su
ltin
g G
rou
p,
Inc.
All
rig
hts
re
se
rve
d.
Industry expectations for cellulosic fuels in the medium-
term not improving
233233233233233233233
138
176163
155
132
91
56
100
0
50
100
150
200
250
Forecasted production of
cellulosic ethanol (MGY)
2020 2019 2018 2017 2016 2015 2014 2013
-25%
AEO 2014 AEO 2013
1. Annual Energy Outlook 2. Low case Note: Converted from Quadrillion BTU to MGY using ethanol higher heating value (HHV) of 84,530 published by Oak Ridge National Laboratory Source: EIA Annual Energy Outlooks 2013 & 2014, E2
EIA has sharply dropped near-term
and moderated medium-term forecasts
163
118
12
337
267
126
0
100
200
300
400
Forecasted capacity2 (MGPY)
-52%
2015 2014 2013 2015 2014 2013
E2 has lowered forecasted short-term
capacity additions
Cell. Ethanol
2013 report 2012 report
8
Co
pyrig
ht ©
20
14
by T
he
Bo
sto
n C
on
su
ltin
g G
rou
p,
Inc.
All
rig
hts
re
se
rve
d.
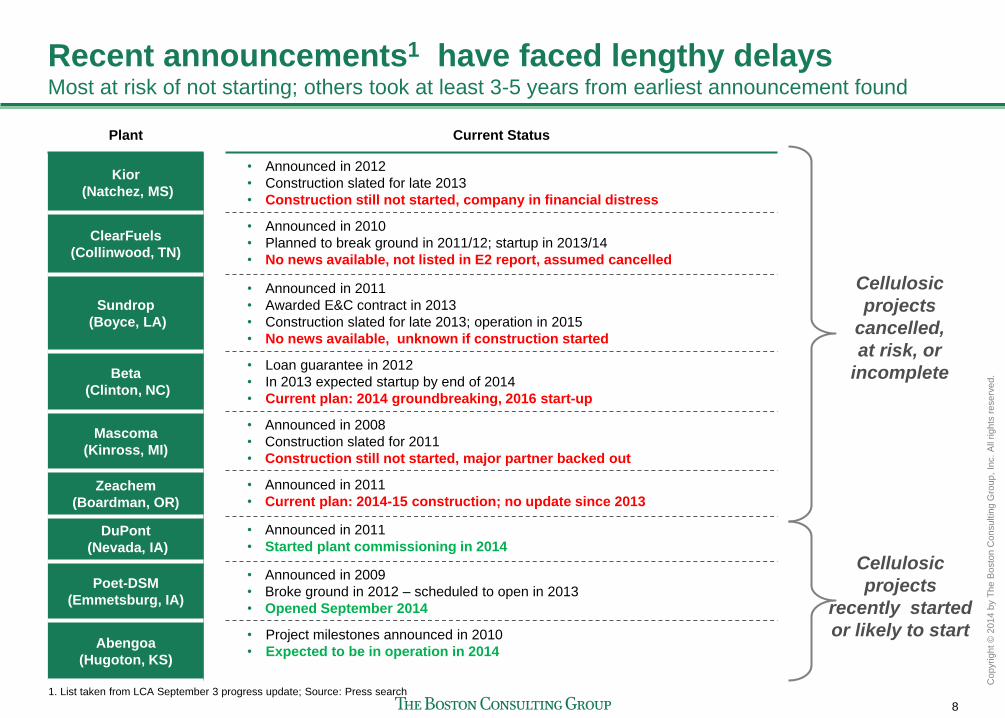
Recent announcements1 have faced lengthy delays Most at risk of not starting; others took at least 3-5 years from earliest announcement found
1. List taken from LCA September 3 progress update; Source: Press search
Plant Current Status
Kior
(Natchez, MS)
• Announced in 2012
• Construction slated for late 2013
• Construction still not started, company in financial distress
ClearFuels
(Collinwood, TN)
• Announced in 2010
• Planned to break ground in 2011/12; startup in 2013/14
• No news available, not listed in E2 report, assumed cancelled
Sundrop
(Boyce, LA)
• Announced in 2011
• Awarded E&C contract in 2013
• Construction slated for late 2013; operation in 2015
• No news available, unknown if construction started
Beta
(Clinton, NC)
• Loan guarantee in 2012
• In 2013 expected startup by end of 2014
• Current plan: 2014 groundbreaking, 2016 start-up
Mascoma
(Kinross, MI)
• Announced in 2008
• Construction slated for 2011
• Construction still not started, major partner backed out
Zeachem
(Boardman, OR)
• Announced in 2011
• Current plan: 2014-15 construction; no update since 2013
DuPont
(Nevada, IA)
• Announced in 2011
• Started plant commissioning in 2014
Poet-DSM
(Emmetsburg, IA)
• Announced in 2009
• Broke ground in 2012 – scheduled to open in 2013
• Opened September 2014
Abengoa
(Hugoton, KS)
• Project milestones announced in 2010
• Expected to be in operation in 2014
Cellulosic
projects
cancelled,
at risk, or
incomplete
Cellulosic
projects
recently started
or likely to start
9
Co
pyrig
ht ©
20
14
by T
he
Bo
sto
n C
on
su
ltin
g G
rou
p,
Inc.
All
rig
hts
re
se
rve
d.
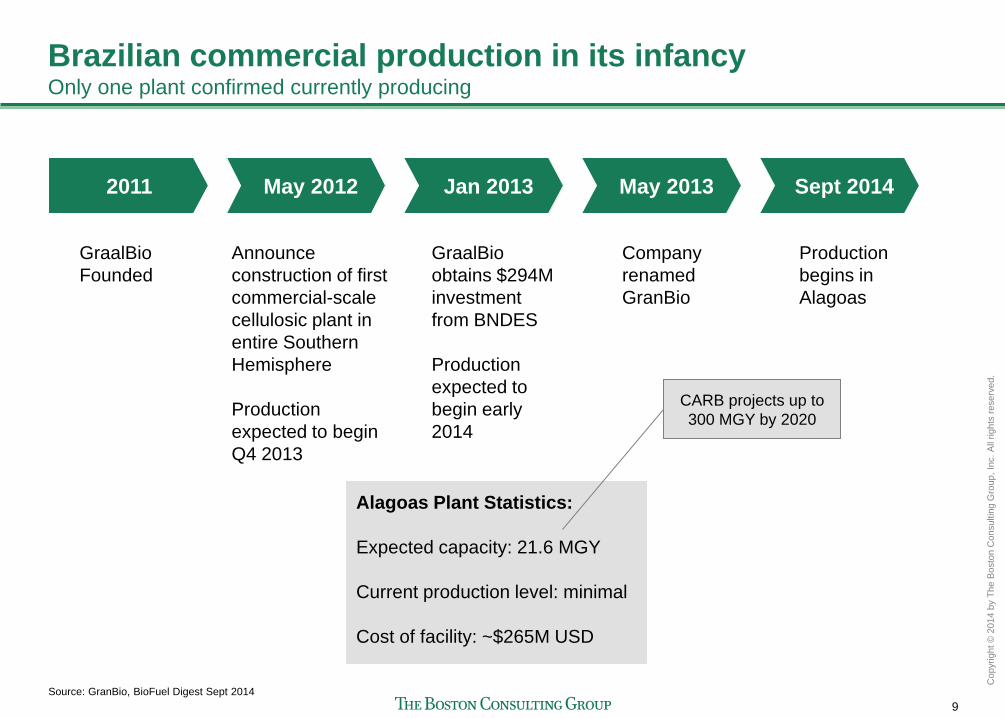
Brazilian commercial production in its infancy Only one plant confirmed currently producing
2011 May 2012 Jan 2013 Sept 2014
GraalBio
Founded
Announce
construction of first
commercial-scale
cellulosic plant in
entire Southern
Hemisphere
Production
expected to begin
Q4 2013
GraalBio
obtains $294M
investment
from BNDES
Production
expected to
begin early
2014
Production
begins in
Alagoas
May 2013
Company
renamed
GranBio
Alagoas Plant Statistics:
Expected capacity: 21.6 MGY
Current production level: minimal
Cost of facility: ~$265M USD
Source: GranBio, BioFuel Digest Sept 2014
CARB projects up to
300 MGY by 2020
10
Co
pyrig
ht ©
20
14
by T
he
Bo
sto
n C
on
su
ltin
g G
rou
p,
Inc.
All
rig
hts
re
se
rve
d.
Agenda
Sugarcane ethanol
Cellulosic ethanol
Renewable gasoline
Renewable diesel
Low-CI fuel market signal
Constraints to consider for California fuel availability
Expectations for upcoming workshop

11
Co
pyrig
ht ©
20
14
by T
he
Bo
sto
n C
on
su
ltin
g G
rou
p,
Inc.
All
rig
hts
re
se
rve
d.
CARB scenarios optimistic given challenges to renewable
gasoline supply by 2020
60
10
00
50
100
150
200
Total
160
Unknown
(2018-2020)
90
Sundrop
(2017)
Cool Planet
(2016)
Current
MGY
Renewable
gasoline not
commercially
available
Status of
facility
unknown – no
update since
July 2013
No facilities
announced,
unlikely to
have operating
facilities in <5
years
CARB forecasted renewable gasoline volumes
30 100
High range projection
Low range projection
Range of 30-90 MGY
counted toward total,
despite no new facilities
announced
Source: Press search, CARB, BCG analysis
12
Co
pyrig
ht ©
20
14
by T
he
Bo
sto
n C
on
su
ltin
g G
rou
p,
Inc.
All
rig
hts
re
se
rve
d.
Agenda
Sugarcane ethanol
Cellulosic ethanol
Renewable gasoline
Renewable diesel
Low-CI fuel market signal
Constraints to consider for California fuel availability
Expectations for upcoming workshop
13
Co
pyrig
ht ©
20
14
by T
he
Bo
sto
n C
on
su
ltin
g G
rou
p,
Inc.
All
rig
hts
re
se
rve
d.
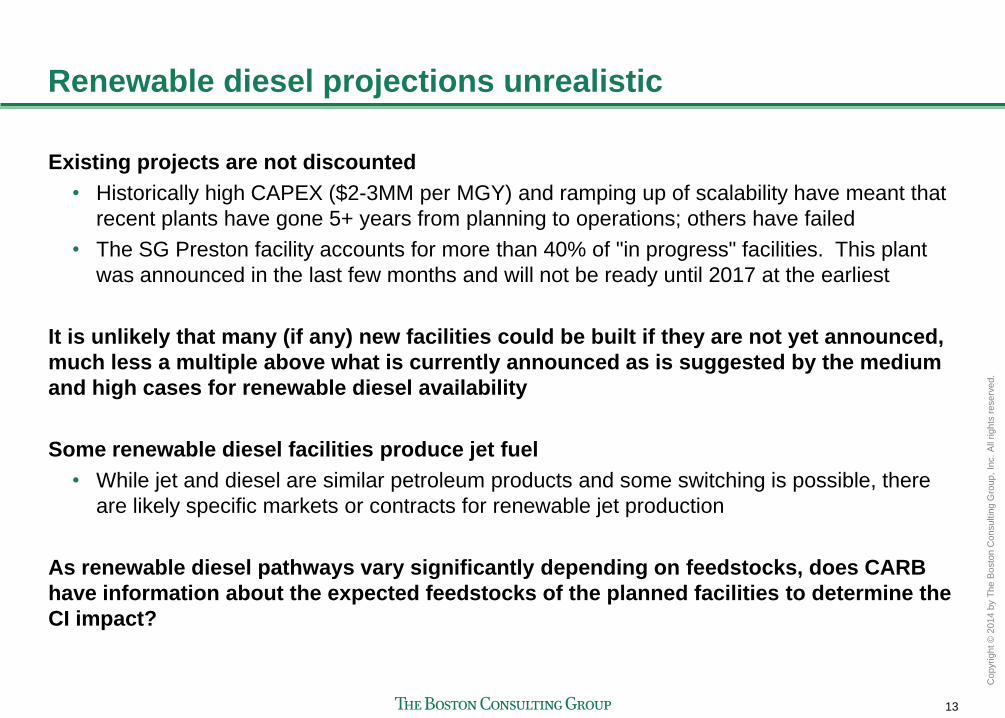
Renewable diesel projections unrealistic
Existing projects are not discounted
• Historically high CAPEX ($2-3MM per MGY) and ramping up of scalability have meant that
recent plants have gone 5+ years from planning to operations; others have failed
• The SG Preston facility accounts for more than 40% of "in progress" facilities. This plant
was announced in the last few months and will not be ready until 2017 at the earliest
It is unlikely that many (if any) new facilities could be built if they are not yet announced,
much less a multiple above what is currently announced as is suggested by the medium
and high cases for renewable diesel availability
Some renewable diesel facilities produce jet fuel
• While jet and diesel are similar petroleum products and some switching is possible, there
are likely specific markets or contracts for renewable jet production
As renewable diesel pathways vary significantly depending on feedstocks, does CARB
have information about the expected feedstocks of the planned facilities to determine the
CI impact?
14
Co
pyrig
ht ©
20
14
by T
he
Bo
sto
n C
on
su
ltin
g G
rou
p,
Inc.
All
rig
hts
re
se
rve
d.
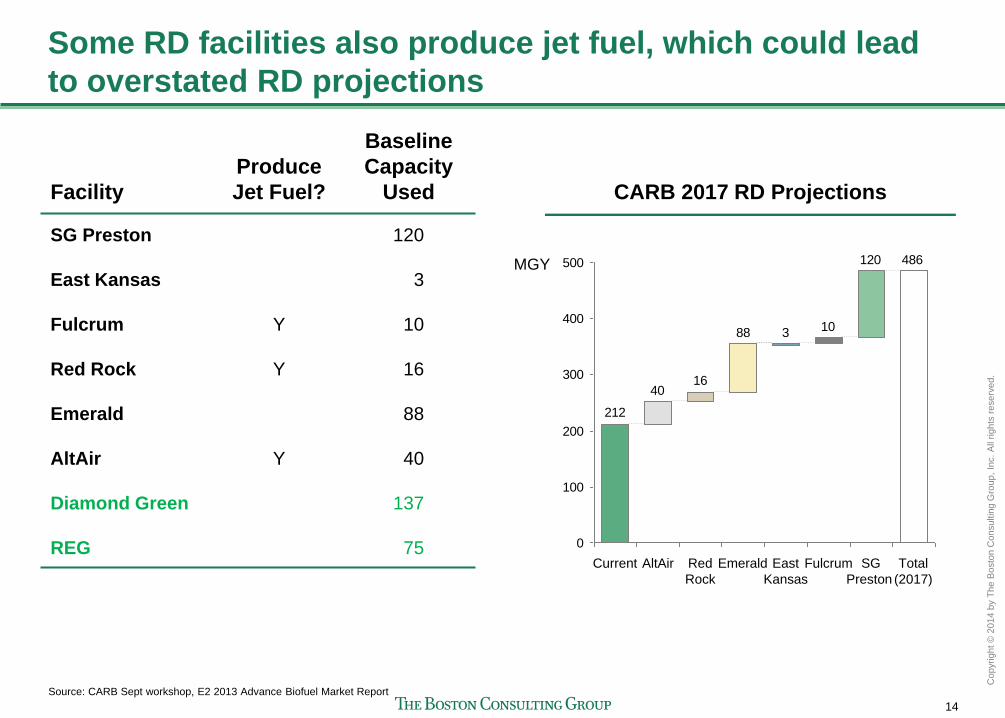
Some RD facilities also produce jet fuel, which could lead
to overstated RD projections
486120
10
1640
212
388
0
100
200
300
400
500
Fulcrum East
Kansas
Red
Rock
Emerald AltAir Current
MGY
Total
(2017)
SG
Preston
Facility
Produce
Jet Fuel?
Baseline
Capacity
Used
SG Preston
East Kansas
Fulcrum
Red Rock
Emerald
AltAir
Diamond Green
REG
Y
Y
Y
120
3
10
16
88
40
137
75
CARB 2017 RD Projections
Source: CARB Sept workshop, E2 2013 Advance Biofuel Market Report
15
Co
pyrig
ht ©
20
14
by T
he
Bo
sto
n C
on
su
ltin
g G
rou
p,
Inc.
All
rig
hts
re
se
rve
d.
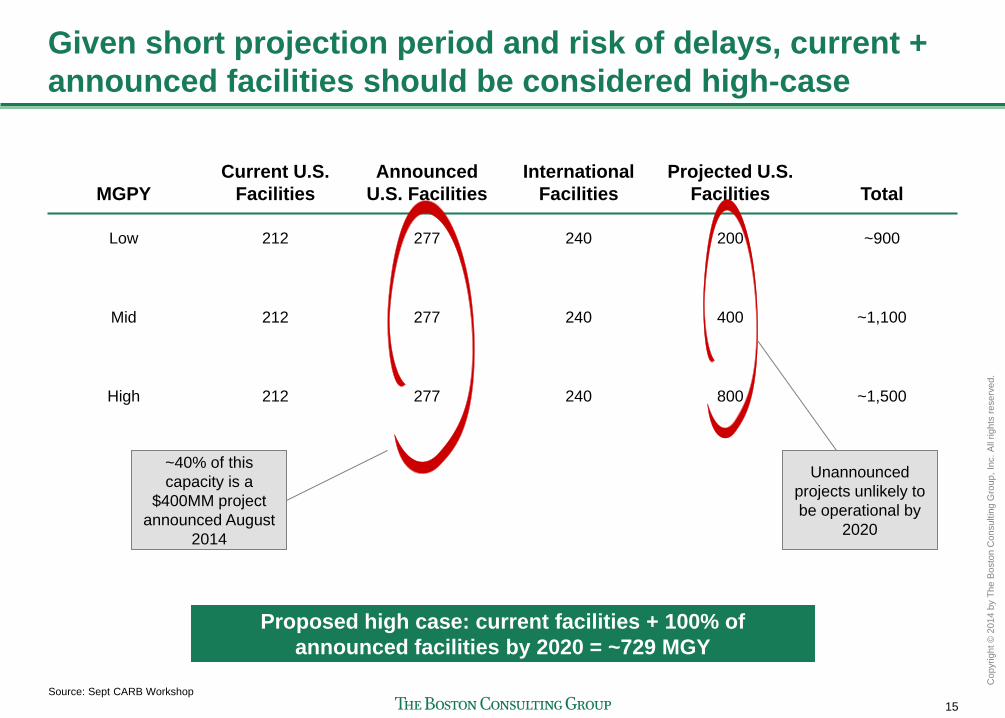
Given short projection period and risk of delays, current +
announced facilities should be considered high-case
MGPY
Current U.S.
Facilities
Announced
U.S. Facilities
International
Facilities
Projected U.S.
Facilities Total
Low
212
277
240
200
~900
Mid
212
277
240
400
~1,100
High
212
277
240
800
~1,500
Unannounced
projects unlikely to
be operational by
2020
Source: Sept CARB Workshop
~40% of this
capacity is a
$400MM project
announced August
2014
Proposed high case: current facilities + 100% of
announced facilities by 2020 = ~729 MGY

16
Co
pyrig
ht ©
20
14
by T
he
Bo
sto
n C
on
su
ltin
g G
rou
p,
Inc.
All
rig
hts
re
se
rve
d.
Rapid increase in RD coming to California has leveled off
0
10
30
20
40
8
12Q4
7
12Q3
1
12Q2
1
12Q1
1
11Q4
1
11Q3
0
11Q2
0
11Q1
0
14Q1 13Q4
23
13Q1
Million gallons
26
30
13Q3
36
13Q2
Est. weighted CI 33.3 32.4 35.2 33.6 34.0 34.5
Source: CARB July 8, 2014 quarterly report, bCG analysis
~96 million gallons in
2013
17
Co
pyrig
ht ©
20
14
by T
he
Bo
sto
n C
on
su
ltin
g G
rou
p,
Inc.
All
rig
hts
re
se
rve
d.
Agenda
Sugarcane ethanol
Cellulosic ethanol
Renewable gasoline
Renewable diesel
Low-CI fuel market signal
Constraints to consider for California fuel availability
Expectations for upcoming workshop
18
Co
pyrig
ht ©
20
14
by T
he
Bo
sto
n C
on
su
ltin
g G
rou
p,
Inc.
All
rig
hts
re
se
rve
d.
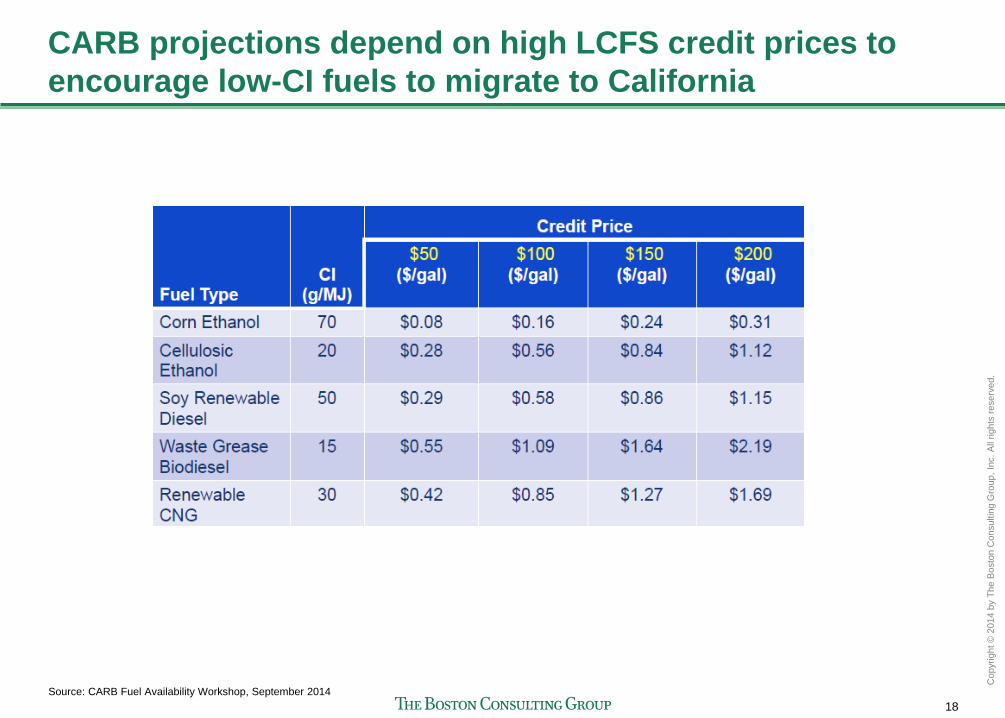
CARB projections depend on high LCFS credit prices to
encourage low-CI fuels to migrate to California
Source: CARB Fuel Availability Workshop, September 2014

19
Co
pyrig
ht ©
20
14
by T
he
Bo
sto
n C
on
su
ltin
g G
rou
p,
Inc.
All
rig
hts
re
se
rve
d.
Any new regulation requires investment, but relying on
high credit prices to drive investment is risky
Stage Producers Product Credit Price
Early
Mid
Late
A few innovative producers
respond quickly to regulation by
investing in innovative production
techniques
High credit prices encourage
more producers to enter space
Expensive, low supply
Moderate, supply
growing
High, small supply of low-CI
fuels means few in
compliance
Lower, as larger supply of
low-CI fuels means many in
compliance
How will LCFS encourage investment differently than the RFS2?
• RFS2 consistently adjusted downward as investment has lagged expectations
As "traditional" pathways like corn ethanol improve reflect lower-CI values, the gap
required to fill with very low-CI fuels lessens, making investment even riskier.
With lower credit prices, will producers continue to invest? Will existing investments
still be making a suitable return?
20
Co
pyrig
ht ©
20
14
by T
he
Bo
sto
n C
on
su
ltin
g G
rou
p,
Inc.
All
rig
hts
re
se
rve
d.
Agenda
Sugarcane ethanol
Cellulosic ethanol
Renewable gasoline
Renewable diesel
Low-CI fuel market signal
Constraints to consider for California fuel availability
Expectations for upcoming workshop
21
Co
pyrig
ht ©
20
14
by T
he
Bo
sto
n C
on
su
ltin
g G
rou
p,
Inc.
All
rig
hts
re
se
rve
d.
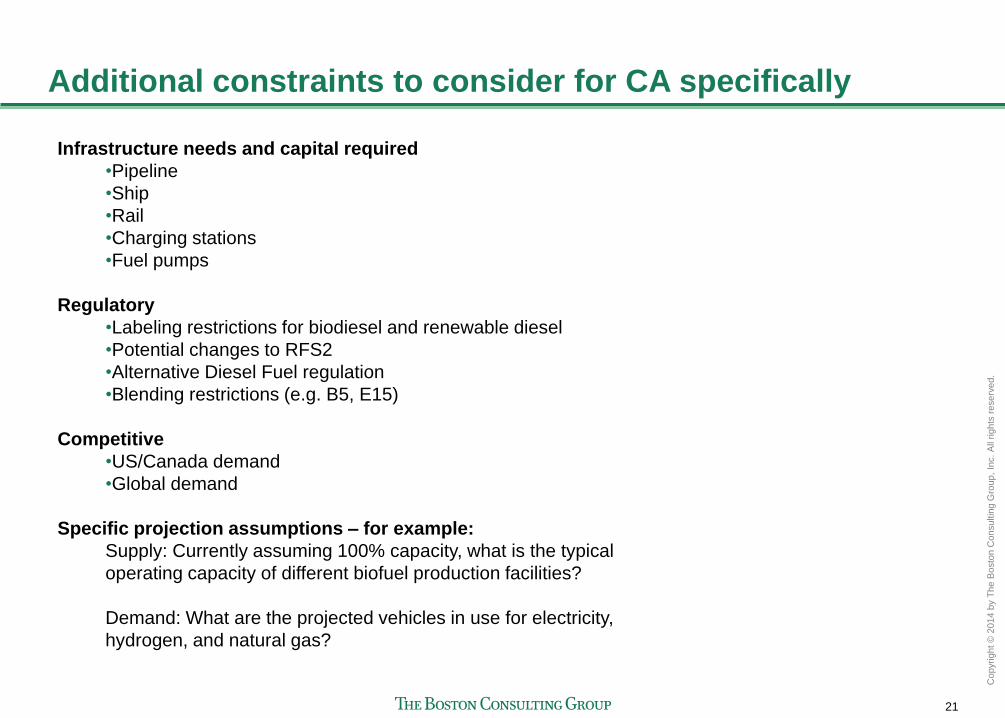
Additional constraints to consider for CA specifically
Infrastructure needs and capital required
•Pipeline
•Ship
•Rail
•Charging stations
•Fuel pumps
Regulatory
•Labeling restrictions for biodiesel and renewable diesel
•Potential changes to RFS2
•Alternative Diesel Fuel regulation
•Blending restrictions (e.g. B5, E15)
Competitive
•US/Canada demand
•Global demand
Specific projection assumptions – for example:
Supply: Currently assuming 100% capacity, what is the typical
operating capacity of different biofuel production facilities?
Demand: What are the projected vehicles in use for electricity,
hydrogen, and natural gas?
22
Co
pyrig
ht ©
20
14
by T
he
Bo
sto
n C
on
su
ltin
g G
rou
p,
Inc.
All
rig
hts
re
se
rve
d.
Agenda
Sugarcane ethanol
Cellulosic ethanol
Renewable gasoline
Renewable diesel
Low-CI fuel market signal
Constraints to consider for California fuel availability
Expectations for upcoming workshop
23
Co
pyrig
ht ©
20
14
by T
he
Bo
sto
n C
on
su
ltin
g G
rou
p,
Inc.
All
rig
hts
re
se
rve
d.
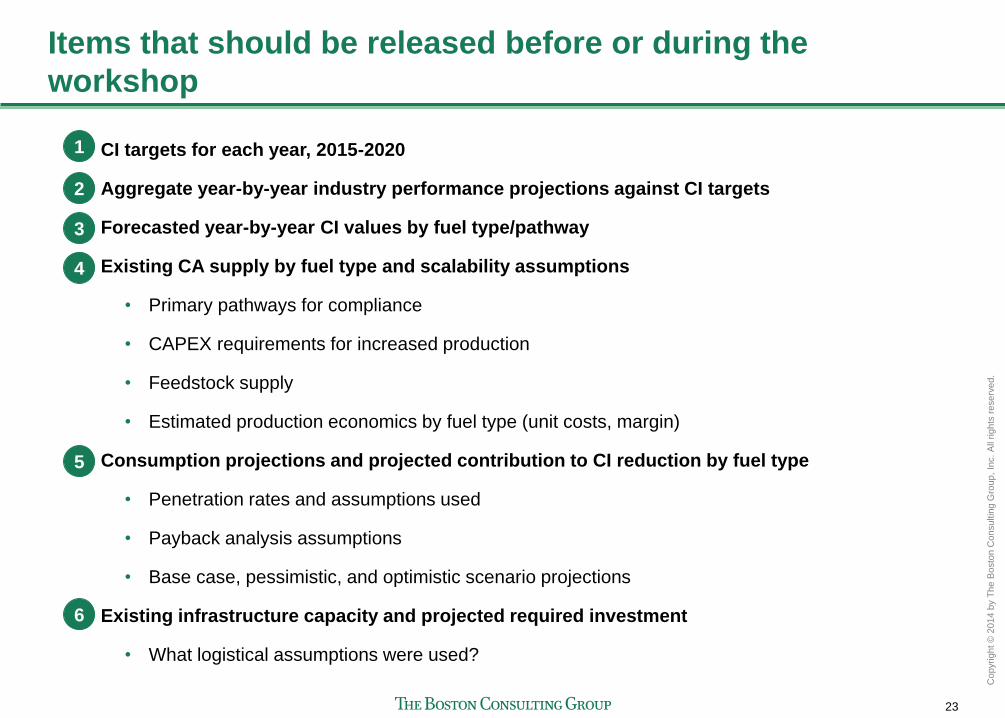
Items that should be released before or during the
workshop
CI targets for each year, 2015-2020
Aggregate year-by-year industry performance projections against CI targets
Forecasted year-by-year CI values by fuel type/pathway
Existing CA supply by fuel type and scalability assumptions
• Primary pathways for compliance
• CAPEX requirements for increased production
• Feedstock supply
• Estimated production economics by fuel type (unit costs, margin)
Consumption projections and projected contribution to CI reduction by fuel type
• Penetration rates and assumptions used
• Payback analysis assumptions
• Base case, pessimistic, and optimistic scenario projections
Existing infrastructure capacity and projected required investment
• What logistical assumptions were used?
1
2
3
4
5
6