Embed Size (px)
Citation preview

Partnership for AiR Transportation Noise and Emissions ReductionAn FAA/NASA/Transport Canada-sponsored Center of Excellence
Market Cost of Renewable Jet Fuel Adoption in the United States
prepared byNiven Winchester, Dominic McConnachie, Christoph Wollersheim, Ian Waitz
March 2013
REPORT NO. PARTNER-COE-2013-001
A PARTNER Project 31 Report

Market Cost of Renewable Jet Fuel
Adoption in the United States
A PARTNER Project 31 (Understanding the Relationship Between
Aviation Economics and the Broader Economy) Report
Niven Winchester, Dominic McConnachie, Christoph Wollersheim,. and Ian A. Waitz
PARTNER-COE-2013-001
March 2013
This work is funded by the US Federal Aviation Administration Office of Environment and Energy under FAA Award Numbers: 06-C-NE-MIT, Amendment Nos. 018 and 028, and 09-C-NE-MIT, Amendment Nos. 007, 020, and 025, and DTFAWA-05-D-00012 Task Order 0009. This project was managed by Thomas Cuddy, FAA.
Any opinions, findings, and conclusions or recommendations expressed in this material are those of the authors and do not necessarily reflect the views of the FAA, NASA, Transport Canada, the U.S. Department of Defense, or the U.S. Environmental Protection Agency
The Partnership for AiR Transportation Noise and Emissions Reduction — PARTNER — is a cooperative aviation research organization, and an FAA/NASA/Transport Canada-sponsored Center of Excellence. PARTNER fosters breakthrough technological, operational, policy, and workforce advances for the betterment of mobility, economy, national security, and the environment. The organization's operational headquarters is at the Massachusetts Institute of Technology.
The Partnership for AiR Transportation Noise and Emissions Reduction Massachusetts Institute of Technology, 77 Massachusetts Avenue, 33-240
Cambridge, MA 02139 USA http://partner.aero

1
Market Cost of Renewable Jet Fuel Adoption in the United States
Niven Winchester,*†
Dominic McConnachie,‡ Christoph Wollersheim
‡ and Ian A. Waitz
‡
Abstract
The US Federal Aviation Administration (FAA) has a goal that one billion gallons of renewable jet
fuel is consumed by the US aviation industry each year from 2018. We examine the cost to US airlines
of meeting this goal using renewable fuel produced from a Hydroprocessed Esters and Fatty Acids
(HEFA) process from renewable oils. Our approach employs an economy-wide model of economic
activity and energy systems and a detailed partial equilibrium model of the aviation industry. If
soybean oil is used as a feedstock, we find that meeting the aviation biofuel goal in 2020 will require
an implicit subsidy to biofuel producers of $2.69 per gallon of renewable jet fuel. If the aviation goal
can be met by fuel from oilseed rotation crops grown on otherwise fallow land, the implicit subsidy is
$0.35 per gallon of renewable jet fuel. As commercial aviation biofuel consumption represents less
than two per cent of total fuel used by this industry, the goal has a small impact on the average price
of jet fuel and carbon dioxide emissions. We also find that, as the product slate for HEFA processes
includes diesel and jet fuel, there are important interactions between the goal for renewable jet fuel
and mandates for ground transportation fuels.
Contents
1. INTRODUCTION ................................................................................................................... 1 2. AVIATION AND BIOFUEL PATHWAYS ........................................................................... 3 3. RFS2 AND AVIATION BIOFUEL GOALS .......................................................................... 6 4. MODELING FRAMEWORK ............................................................................................... 10
4.1 The EPPA-A model ...................................................................................................... 11 4.2 The APMT-E model ..................................................................................................... 17 4.3 Scenarios ...................................................................................................................... 18
5. RESULTS AND DISCUSSION............................................................................................ 19 6. SENSITIVITY ANALYSIS .................................................................................................. 21 7. CONCLUSIONS ................................................................................................................... 22 8. REFERENCES ...................................................................................................................... 24
1. INTRODUCTION
The global aviation industry aims to achieve carbon neutral growth by 2020 and reduce
carbon dioxide (CO2) emissions by 50% relative to 2005 levels by 2050 (IATA, 2009). To
achieve these goals, the International Air Transport Association (IATA) has outlined a “four
pillar” approach that includes (i) technology, (ii) operations, (iii) infrastructure and (iv) economic
measures. Of the four pillars, technology is seen as the most promising option for reducing
emissions and includes improved engine technologies, aircraft design, new composite
lightweight materials, and use of biofuels that have significantly lower lifecycle greenhouse gas
* Joint Program on the Science and Policy of Global Change, MIT, Cambridge, Massachusetts, U.S.A.
‡ Department of Aeronautics and Astronautics, MIT, Cambridge, Massachusetts, U.S.A.
† Corresponding author (Email: [email protected])

2
(GHG) emissions than conventional fuel (IATA, 2009). Use of renewable jet fuel is also
expected to reduce fuel price volatility (IATA, 2010).
The US Federal Aviation Administration (FAA) has set a goal for the US aviation industry to
consume one billion gallons of renewable jet fuel each year from 2018 onwards (FAA, 2011,
p.10). This goal is an aggregate of renewable fuel targets for the US Air Force, the US Navy and
US commercial aviation. The renewable fuel target for commercial aviation represents 1.7% of
predicted total fuel consumption by US airlines in 2018. The aviation biofuel goal is set against a
backdrop of a renewable fuel standard for ground transportation, which sets minimum annual
volume requirements for use of advanced biofuels and total renewable fuels that must be used
through 2022.
In this paper, we examine the cost to commercial aviation of meeting the renewable fuel
target set out by the FAA. As the cost of renewable jet fuel currently exceeds the price of
conventional jet fuel, we assume that the aviation biofuel goal is met by airlines and the military
voluntarily purchasing renewable fuel. Our modeling framework uses an economy-wide model
of economic activity and energy systems to determine the implicit subsidy to renewable jet fuel
producers and the impact of the goal on overall economic activity, and a partial equilibrium
model of air transportation to estimate changes in aviation operations.
Our analysis builds on several previous studies of the impact of climate policies on aviation.
Hofer et al. (2010) and Winchester et al. (2013) evaluate the impact of US carbon prices on the
aviation industry. The effects of including aviation in the EU ETS are investigated by, among
others, Anger (2010), Scheelhaase et al. (2010), Vespermann and Wald (2011) and Malina et al.
(2012). More pertinent for our analysis are studies that consider the use of biofuels in air
transportation. Bauen et al. (2009) estimate the uptake of biofuels by the global aviation industry
between 2010 and 2050. Their analysis considers a range of conversion technologies, feedstocks
and carbon prices. Consumption of aviation biofuels is determined by estimates of time-
dependent conversation and feedstock costs and deployment of new technologies. The authors’
results indicate that biofuels will account for a low proportion of global aviation fuel
consumption before 2020, but could make a significant contribution over a longer time horizon.
Under a high carbon price with optimistic assumptions regarding the development of biofuel
technologies, 100% of global aviation fuel consumption is sourced from biofuels by the early
2040s. With no carbon price and slow development of biofuel technologies, biofuels account for

3
3% of aviation fuel use in 2030 and 37% in 2050. Sgouridis et al. (2011) examine the impact of
several policies and strategies for mitigating global CO2 emissions from air transportation. In
their renewable fuels scenarios, the authors assume that the price of biofuels is equal to the price
of conventional fuel and specify an exogenous consumption path for biofuels. Sgouridis et al.
(2011) assume that the proportion of biofuels in total fuel consumption by commercial aviation is
0.5% in 2009 and rises to 15.5% in 2024 in a “moderate” scenario, and to 30.5% in an
“ambitious” scenario. Under these assumptions, the authors estimate that biofuels reduce
cumulative CO2 emissions from aviation between 2004 and 2024 by between 5.5% and 9.5%
relative to their reference case. Our analysis extends earlier work by explicitly modeling the
production and cost of biofuels, including land constraints and competition for resources among
sectors, and considering interactions between aviation biofuel strategies and existing biofuel
policies.
This paper has six further sections. The next section outlines aviation biofuel pathways.
Section 3 provides information on RFS2 and aviation biofuel goals and discusses interactions
between renewable fuel targets for ground and air transportation. Our modeling framework and
the scenarios we consider are set out in Section 4. Results are presented and discussed in Section
5 and a sensitivity analysis is considered in Section 6. The final section concludes.
2. AVIATION BIOFUEL PATHWAYS
Renewable jet fuel processes currently certified for use in commercial aviation include fuel
produced from a Hydroprocessed Esters and Fatty Acids (HEFA) process (also known as
Hydrotreated Renewable Jet fuel) and biomass-to-liquid (BTL) via a Fischer-Tropsch (F-T)
process.1 Both these processes produce a product slate that includes diesel, jet fuel and other co-
products. BTL production involves vaporizing a mixture of biomass and coal and converting the
gas to synthetic liquid fuels through an F-T process. Fuel produced using an F-T process was
certified for aviation by ASTM International Standard D7566 in September 2009. A 50% blend
of F-T synthetic fuel with conventional fuels is currently used by O.R. Tambo International
Airport in Johannesburg for use in commercial aviation (Sasol, 2011).
Under a HEFA process, renewable oil (vegetable oils, animal fat, waste grease and algae oil)
is processed using hydrogen treatment (hydroprocessing) to yield a fuel in the distillation range
1 Processes expected to be certified in the near future include alcohol-to-jet and synthetic kerosene containing
aromatics. Other possible pathways include sugar-to-jet and fuel from pyrolysis processes. See Hileman et al.
(2013) and OECD (2012) for a comprehensive list of renewable jet fuel processes.

4
of jet fuel, diesel and naphtha (Pearlson, 2011; UOP, 2005). On July 1, 2011, ASTM approved
the jet fuel product slate of HEFA under alternative fuel specification D7566 (ASTM, 2011).
HEFA fuel that meets this specification can be mixed with conventional jet fuel, up to a blend
ratio of 50%. HEFA is currently the leading process for producing renewable jet fuel and several
airlines (including Aeroméxico, Air China, Air France, Finnair, Iberia, KLM, Lufthansa and
United) have performed commercial passenger flights with blends of up to 50% renewable fuel
produced using this technology (IATA, 2012). In addition to the popularity of HEFA fuel in
demonstration flights, Bauen et al. (2009) estimate that the near-term uptake of biofuels will be
greatest when oil crops are used in a HEFA process. For these reasons, our economic analysis
focuses on meeting the FAA aviation biofuel goal using HEFA-derived fuel.
Pearlson (2011) estimates production costs and outputs for a HEFA process using soybean oil
as a feedstock. When the proportion of output that is liquid fuel is maximized, a HEFA process
with this feedstock produces, by weight, 76.9% (ultra-low-sulphur) diesel, 14.4% jet fuel, 4.7%
propane, 2% naphtha and 1.8% liquefied petroleum gas (LPG).2 In volume terms, five gallons of
renewable diesel are produced for each gallon of renewable jet fuel. The product mix can be
altered to produce more jet fuel and less diesel, but changing the product slate requires additional
processing and increases the proportion of output that is comprised of less-valuable co-products,
such a naphtha and LPG. Stratton et al. (2011), estimate that, when there is no land use change,
the lifecycle CO2 emissions from HEFA fuel with a soybean oil feedstock relative to emissions
from conventional jet fuel range from 31% to 68% with a median estimate of 42%.
Historical and predicted prices (in 2010 dollars) for soybean oil and jet fuel are presented in
Figure 1. On average, the price of soybean oil was $1.19 more than the price of jet fuel between
April 1990 and June 2012 and future predicted soybean oil prices are between $1.07 and $0.66
above the price of jet fuel. These numbers indicate that HEFA production using a soybean oil
feedstock is unlikely to be cost competitive with conventional jet fuel in at least the next decade
or so.
2 HEFA processes also produce outputs that currently have no commercial value (water and CO2). These co-
products are not included in the volume proportions reported above.

5
Figure 1. Soybean oil and jet fuel prices, 2010$/gallon. Source: Historical jet fuel and
soybean oil prices are sourced from EIA (2012b) and World Bank (2012) respectively;
and projected jet fuel and soybean oil prices are taken from EIA (2012a) and USDA
(2012) respectively.
Potentially low-cost feedstocks for HEFA processes include oilseed crops grown in rotation
with other crops on land that would otherwise be left fallow (Shonnard, 2010; EPA, 2012). Two
promising rotation crops in the US include Thlaspi arvense L. (commonly known as pennycress)
and Camellia sativa (camelina).3 Pennycress is a winter annual crop that could potentially be
grown in the Midwest in rotation with summer corn and spring soybean crops. Traditionally,
land is left fallow between the fall corn harvest and before spring soybean planting. Pennycress
requires minimal inputs (fertilizer, pesticides and water), is compatible with existing farm
3 Other potential oilseed rotation crops include Brassica carinata, Brassica napus L. (Canola/Rapeseed), Linim
usitatissimum L. (Flax), Sinapis alba L. (Yellow mustard), Carthamus tinctorius L. (Safflower) and Helianthus
annuus L. (Sunflower).

6
infrastructure, and could potentially be grown on 40 million acres each year.4 Camelina is well
suited to be rotated with wheat grown in dry areas, where farmers leave land fallow once every
three to four years to allow moisture and nutrients to accumulate and to control pests (Shonnard
et al., 2010). Camelina is currently grown on 50,000 acres of land in the US. Approximately
95% of current production is used for testing purposes and 5% is used as a dietary supplement or
in the cosmetics industry (EPA, 2012). According to EPA (2012), camelina could potentially be
grown in rotation with wheat on three to four million acres of land each year that would
otherwise be left fallow. When calculating the lifecycle GHG emissions from camelina
production, EPA (2012) assumes that there are no direct impacts on land use or food supply. If
oilseed rotation crops do not have detrimental effects on pest control and the moisture and
nutrient content of the soil relative to leaving the land fallow, the opportunity cost of land used
for these crops will be zero. Thus, oil from rotation crops could potentially be produced at a
lower cost than oil from conventional crops. Combining estimates on available acres, oil content
and yields suggests that, each year, land currently left fallow could be used to produce 2.5 to 6
billion gallons of oil from pennycress5 and 0.1 to 0.4 billion gallons from camelina (EPA, 2012).
However, as many oilseed rotation crops are currently in the early phase of development, there
are large uncertainties concerning the production potential and costs for these crops. For
example, the upper limit of 6 billion gallons of oil from pennycress is dependent on deployment
of technologies currently under development.
3. RFS2 AND AVIATION BIOFUEL GOALS
The current renewable fuels standard in the US has its origins in the 2005 Energy Policy Act,
which mandated the production of ethanol from cornstarch through the Renewable Fuels
Standard. In 2007, this standard was updated under Title II (“Energy Security through Increased
Production of Biofuels”) of the Energy Independence and Security Act (EISA) to create a
renewable fuels standard known as RFS2. This standard sets targets for US consumption of
renewable fuels by type from 2008 to 2022 that rise over time. By 2022, the target for total
4 The pennycress acreage estimate is based on conversations with Terry Isbell, research chemist, Bio-oils Research
Unit, Agricultural Research Service, USDA and Professor Win Phippen at the School of Agriculture at Western
Illinois University. Pennycress is assumed to be grown in the central corn belt following the corn harvest. The
area with rotation potential extends from North of I-70 to South of Minneapolis, Madison and Lansing and East
of Sioux City, Iowa to New York and Pennsylvania. Spring pennycress could also be grown well into Canada
(from Ontario to Saskatoon). 5 These estimates assume that pennycress is grown on 40 million acres and draw on yields reported by Moser et al.
(2009).
7
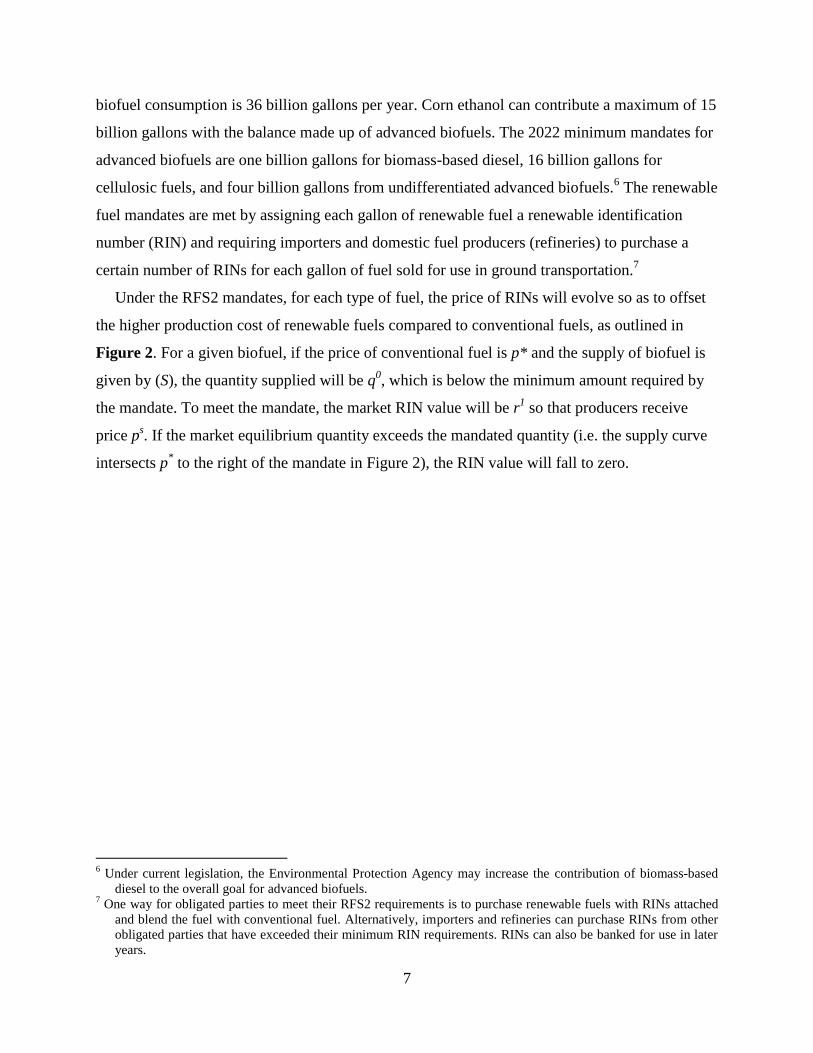
biofuel consumption is 36 billion gallons per year. Corn ethanol can contribute a maximum of 15
billion gallons with the balance made up of advanced biofuels. The 2022 minimum mandates for
advanced biofuels are one billion gallons for biomass-based diesel, 16 billion gallons for
cellulosic fuels, and four billion gallons from undifferentiated advanced biofuels.6 The renewable
fuel mandates are met by assigning each gallon of renewable fuel a renewable identification
number (RIN) and requiring importers and domestic fuel producers (refineries) to purchase a
certain number of RINs for each gallon of fuel sold for use in ground transportation.7
Under the RFS2 mandates, for each type of fuel, the price of RINs will evolve so as to offset
the higher production cost of renewable fuels compared to conventional fuels, as outlined in
Figure 2. For a given biofuel, if the price of conventional fuel is p* and the supply of biofuel is
given by (S), the quantity supplied will be q0, which is below the minimum amount required by
the mandate. To meet the mandate, the market RIN value will be r1 so that producers receive
price ps. If the market equilibrium quantity exceeds the mandated quantity (i.e. the supply curve
intersects p* to the right of the mandate in Figure 2), the RIN value will fall to zero.
6 Under current legislation, the Environmental Protection Agency may increase the contribution of biomass-based
diesel to the overall goal for advanced biofuels. 7 One way for obligated parties to meet their RFS2 requirements is to purchase renewable fuels with RINs attached
and blend the fuel with conventional fuel. Alternatively, importers and refineries can purchase RINs from other
obligated parties that have exceeded their minimum RIN requirements. RINs can also be banked for use in later
years.

8
Figure 2. The determination of RIN values under RFS2.
Although obligated parties are not required to surrender RINs for sales of jet fuel, renewable
jet fuel is eligible for RINs and can contribute to RFS2 mandates. Fuels produced from
renewable oil using a HEFA process qualify for both biomass-based diesel and undifferentiated
advanced RINs (but each gallon of fuel can only be assigned a single RIN). As (i) renewable jet
fuel can be sold as diesel, (ii) there is very little difference in prices for the two fuels and (iii)
separating jet fuel from diesel requires additional processing, RFS2 is unlikely to induce
consumption of renewable fuel in the aviation industry.8
To help achieve sustainable growth in the aviation industry, the FAA has a goal that one
billion gallons of renewable jet fuel is consumed in the US each year from 2018 onward (FAA,
2011). The goal includes renewable jet fuel targets set by the US Air Force (USAF), the US
Navy and commercial aviation. The USAF goal is that 50% of domestic aviation operations will
use a 50-50 blend of renewable fuel from domestic sources and conventional jet fuel by 2016
(USAF, 2010). The target for the US Navy is that 50% of total energy consumption is from
renewable sources by 2020 (US Navy, 2010). According to Carter et al. (2011), the US Air Force
goal is equivalent to 0.37 billion gallons per year, the Navy goal amounts to 0.28 billion gallons
8 The primary difference between jet fuel and diesel is the number of carbon atoms per molecule (or carbon chain
length). Jet fuel typical contains between nine and 16 carbon atoms per molecule while the range for diesel is
between nine and 24. As the range of carbon chain lengths for diesel encompasses the jet fuel range, diesel
engines can burn jet fuel, but not the other way around (Pearlson, 2011).
P
Q
p*
S
Mandate
r1 ps
q0

9
per year, and commercial aviation’s contribution to the overall goal (which is determined
residually) is 0.35 billion gallons per year. Predicted jet fuel consumption by US commercial
airlines in 2018 is 20.2 billion gallons (FAA, 2012, p. 104), so the target for commercial aviation
represents 1.7% of total fuel consumed by this industry. If the cost of renewable jet fuel remains
above the price of conventional fuel and in the absence of blending requirements for sales of jet
fuel, the FAA biofuel goal will be met by commercial airlines and the US military voluntarily
purchasing renewable fuel.
As HEFA processing of renewable oil produces a product slate that includes diesel and jet
fuel, the cost of achieving the aviation goal will be influenced by RFS2 mandates. Specifically,
the profitability of producing renewable jet fuel via a HEFA process will not only depend on the
price of jet fuel, but also revenue received for co-products, including RIN prices for biomass-
based diesel and undifferentiated advanced fuel. These RIN prices will be influenced by the
increased supply of renewable diesel induced by renewable jet production to meet the aviation
goal.
We illustrate the relationship between the aviation goal and RFS2 mandates and RIN prices in
Figure 3. For simplicity, and without loss of generality, we assume that there is a single mandate
for biomass-based diesel and undifferentiated advance fuel, which we collectively refer to as
“other advanced” biofuel. Without an aviation goal (G1 = 0), due to the cost of separating jet
from diesel, all qualifying renewable fuel will be sold as other advanced fuel. The market for
other advanced biofuel is displayed in Figure 3a. The supply curve for other advanced renewable
fuel without a mandate is denoted . If the price of conventional (diesel and jet) fuel is p
*, a
RIN price equal to r1 is required to meet the mandate (so that the price received by renewable
fuel producers is ). The market for renewable jet fuel is illustrated in Figure 3b. If other
advanced renewable fuel continues to receive a RIN price of r1, the supply of renewable fuel is
given by and an (implicit) subsidy of s
1 is required to meet the aviation renewable fuel goal
(G2 > 0). Meeting the aviation goal induces production of other advanced renewable fuels, which
causes a shift in the other advanced supply schedule from to
in Figure 3a. This supply
increase will reduce the other advanced RIN price to r2. In turn, the lower RIN price will
increase the subsidy required to induce jet fuel production, which results in an upward shift of
the supply curve from to
and renewable jet subsidy of s2 is required to meet the aviation
biofuel goal.

10
Figure 3. The market for (a) “other advanced” biofuels, and (b) renewable jet fuel.
Meeting the aviation goal will have a further feedback on the other advanced RIN price
(which is not shown in Figure 3). Specifically, as HEFA jet fuel contributes to the other
advanced mandate, meeting the aviation goal reduces the quantity of non-aviation other
advanced biofuel required under RFS2. This will shift the effective other advanced mandate to
the left in Figure 3b and further reduce the RIN price. Ultimately, there will be an additional
upward shift in the supply curve for renewable jet fuel and a further increase in the subsidy
required to meet the aviation goal. The above analysis indicates that, under the RFS2 mandates,
the implicit subsidy required to meet the aviation biofuel goal is larger than the difference
between the price of conventional fuel and the cost per gallon of total renewable fuel.
4. MODELING FRAMEWORK
Following Winchester et al. (2013) and Malina et al. (2012), our modeling approach employs
an economy-wide computable general equilibrium (CGE) model and a partial equilibrium model
that focuses on the aviation industry (the Aviation Portfolio Management Tool for Economics,
APMT-E). We use a CGE model to determine the impact of biofuels policies and goals on
biofuel production and costs, RIN prices, fuel prices and GDP. Estimated changes in fuel prices,
which are passed through to consumers, and GDP-induced changes in demand are then simulated
in APMT-E to determine changes in aviation operations.

11
4.1 The EPPA-A model
Our CGE model is an augmented version of the Emissions Prediction and Policy Analysis
model for Aviation (EPPA-A) as outlined in Gillespie (2011). The EPPA-A model builds on
version five of the MIT EPPA model (Paltsev et al., 2005) by separating air transport from other
industrial transport (road, rail and sea transport). The EPPA-A model is a recursive dynamic
model of the global economy that links GHG emissions to economic activity. The model
recognizes the US and 15 other regions, as detailed in Table 1. Sectors identified in the model
include crops, forestry, livestock, two manufacturing sectors (energy-intensive industry and other
industry), air transportation, other industrial transportation, household transportation (which
includes privately owned vehicles and purchases of industrial transportation), services and five
energy sectors (coal, crude oil, refined oil, gas and electricity). Several energy technologies and
sources are specified in the model. For example, electricity technologies include conventional
fossil, natural gas combined cycle, and wind and solar generation. Additionally, resources for
crude oil and gas include oil and gas from conventional sources, shale oil, oil sands, shale gas
and gas from sandstone.

12
Table 1. Aggregation in the EPPA-A model.
Regions Sectors Primary inputs
Developed Crops Non-energy resources
United States Livestock Capital
Canada Forestry Labor
Japan Coal Crop land
Australia-New Zealand Crude Oil Pasture land
European Union Refined oil Forest land
Eastern Europe Aviation fuel
Russia Gas Energy resources Electricity Crude oil
Developing Energy-intensive industry Shale oil
Mexico Other industry Conventional natural Gas
China Services Shale gas
India Air transportation Coal
East Asia Other industrial transportation
Rest of Asia Household transport
Africa
Middle East
Brazil
Latin America
Each good is produced by perfectly competitive firms that assemble primary factors and
intermediate inputs using nested constant elasticity of substitution (CES) production functions.
All commodities are traded internationally. Crude oil is considered to be homogenous across
regions and other goods are differentiated by region of origin following the Armington
assumption (Armington, 1969). There is a single representative agent in each region that derives
income from factor payments and tax revenue and allocates expenditure across goods and
investment to maximize utility. The model is calibrated using economic data from the Global
Trade Analysis Project database (Narayanan and Walmsley, 2008) and energy data from the
International Energy Agency and is solved through time in five-year increments.
We extend the EPPA-A model by separating jet fuel from the model’s aggregate Refined oil
sector and including several biofuel production pathways. Biofuel technologies added to the
model include corn ethanol, a representative cellulosic technology, a HEFA process, and a
generic undifferentiated advanced technology. The HEFA technology is the only pathway that
produces jet fuel. Our undifferentiated advanced process includes production from Fatty Acid
Methyl Ester (FAME) processes. FAME processes produce biodiesel that qualifies as biomass-
based diesel and undifferentiated advanced fuel under RFS2. In March 2012, there were 148

13
biodiesel plants in the US with total annual production capacity of 1.4 billion gallons (NBB,
2012) and future production of biodiesel is expected to exceed the current minimum mandate (1b
gal) for biomass-based diesel under RFS2 (USDA, 2011). If this occurs, some biodiesel will
attract biomass-based diesel RINs and some will be assigned undifferentiated RINs, which will
equalize RIN values across the two categories. For this reason, and because the future
contribution of the biomass-based diesel mandate to the advanced biofuels target is uncertain, we
include a single category for both biomass-based diesel and undifferentiated advanced biofuel.
As in Section 3, we label this category “other advanced” renewable fuel.
Our parameterization of biofuel technologies, except the HEFA process, follows Gurgel et al.
(2007) and Gitiaux et al. (2012). To characterize HEFA biofuel production, we draw on
estimates for plants with a 6,500 barrels per day (BPD) capacity from Pearlson (2011).
Production of HEFA fuel in the model combines oilseed crops with capital and labor and other
intermediate inputs using a series of nested CES functions, as illustrated in Figure 4. In the base
data with a soybean oil feedstock, soy oil purchases account for 81% of the cost of production.
Other major inputs include hydrogen (Gas), capital and labor.
Jet fuel Naphtha LPG
Diesel J-N-L
D-J-N-L Propane
Biofuel
K-L-Intermediates Oilseed crop
Capital-Labor Intermediate inputs
Capital Labor Input1 ………….. InputN
Figure 4: Production of HEFA fuels in the EPPA-A model.

14
We represent trade-off possibilities among products by a HEFA process using a sequence of
nested constant elasticity of transformation (CET) functions. In this framework, product slate
trade-offs are influenced by the output nesting structure and elasticities of transformation in the
production function. Our representation of trade-off possibilities is calibrated using production
under the “maximum distillate” and “maximum jet” alternatives considered by Pearlson (2011).
As maximizing the output of jet fuel results in greater production of less-valuable co-products, a
jet fuel price premium is needed to induce a higher proportion of this fuel in total output than
when total distillate is maximized. In the model, this relationship is captured using a CET
function that divides output between diesel and a jet-fuel-naphtha-LPG composite using a CET
function with an elasticity value equal to 10. Under this framework, represents the
elasticity of supply of the jet fuel-naphtha-LPG composite when output is constant. The jet-fuel-
naphtha-LPG composite is then allocated to individual products in fixed proportions. Propane
and a jet fuel-diesel-naphtha-LPG composite are also a fixed proportion of total output.
Benchmark production value shares, assigned using the “maximum distillate” calculations
from Pearlson (2011), are 78.5% for diesel, 15.7% for jet fuel, 2.6% for propane, 2.1% for
naphtha and 1.1% for LPG. To fit our sectoral aggregation, diesel and naphtha are sold as
Refined oil and propane and LPG are sold as Gas in the model. HEFA production of diesel, jet
fuel and naphtha are eligible for other advanced RINs.9
To specify biofuel production costs, as is convention in CGE models, for each biofuel, we
apply a mark-up factor to all inputs, which determines the cost of biofuels relative to
conventional fuels. Our mark-up factors for corn ethanol, representative undifferentiated
advanced fuel and cellulosic biofuels draw on Gitiaux et al. (2012), Gurgel et al. (2007), and
existing RIN prices. Our mark-up factor for HEFA production is guided by Pearlson (2011).
When the price of soybean oil is $2.46/gal, Pearlson (2011) estimates that the gate cost of HEFA
diesel and jet fuel is $3.80/gal for a 6,500 BPD plant operating at maximum distillate.10
The
mark-up factors combined with input cost shares set the cost of production for each biofuel in the
base year (2005). In subsequent years, production costs are determined endogenously in the
model based on inputs prices and the underlying production functions.
9 RINs could also be allocated for LPG and propane, but the cost of recovering these gases for use in transportation
is likely to be greater than the RIN values (Pearlson, 2011). 10
The cost estimates from Pearlson (2011) are for commercial-sale operations. Consequently, we do not specify
decreasing production costs as a function of cumulative output.

15
In biofuel scenarios, we simulate the RIN systems specified under RFS2 and the aviation
biofuel goal using a series of permit schemes. Although there are no current plans to mandate the
use of renewable jet fuel, a permit system is consistent with airlines and the military voluntarily
purchasing renewable jet fuel. Under this interpretation, the amount paid for renewable jet fuel
above the price of conventional jet fuel can be interpreted as an implicit subsidy to renewable
fuel producers. The operation of the permit systems are depicted in Figure 5. For biofuel type j (j
represents corn ethanol, other advanced, cellulosic, and jet fuel), a permit belonging to that type
is attached to each gallon of fuel produced. For non-aviation fuel, a certain number of permits for
each type of biofuel must be turned in for each gallon of fuel used in ground transportation.
Similarly, production of aviation fuel requires a fixed proportion of renewable jet fuel permits.
The proportion of each non-aviation biofuel in ground transportation fuel is determined by
(i represents corn ethanol, other advanced, and cellulosic) and the proportion of
renewable jet fuel in commercial aviation fuel is determined by choosing and the proportion
of renewable aviation fuel purchased by the military is determined by .11
We simulate biofuel
quantities specified in RFS2 and the aviation goal in the model by solving the model iteratively
for alternative values of ; ; and until the desired biofuel volume requirements
are achieved.
11
The military is included in the Services sector in the EPPA-A model. As such, we require Services to purchase
renewable jet fuel to meet the military aviation biofuel goal.
16
Fuel Permitj Non-aviation fuel Commercial aviation fuel 1 gal 1 1 gal 1 gal
1 gal α1 α I 1 gal αCA 1 gal Biofuelj Permit1 …….. PermitI Fuel PermitA Fuel
(a) (b) (c)
Military aviation fuel
1 gal
αMA 1 gal PermitA Fuel
(d)
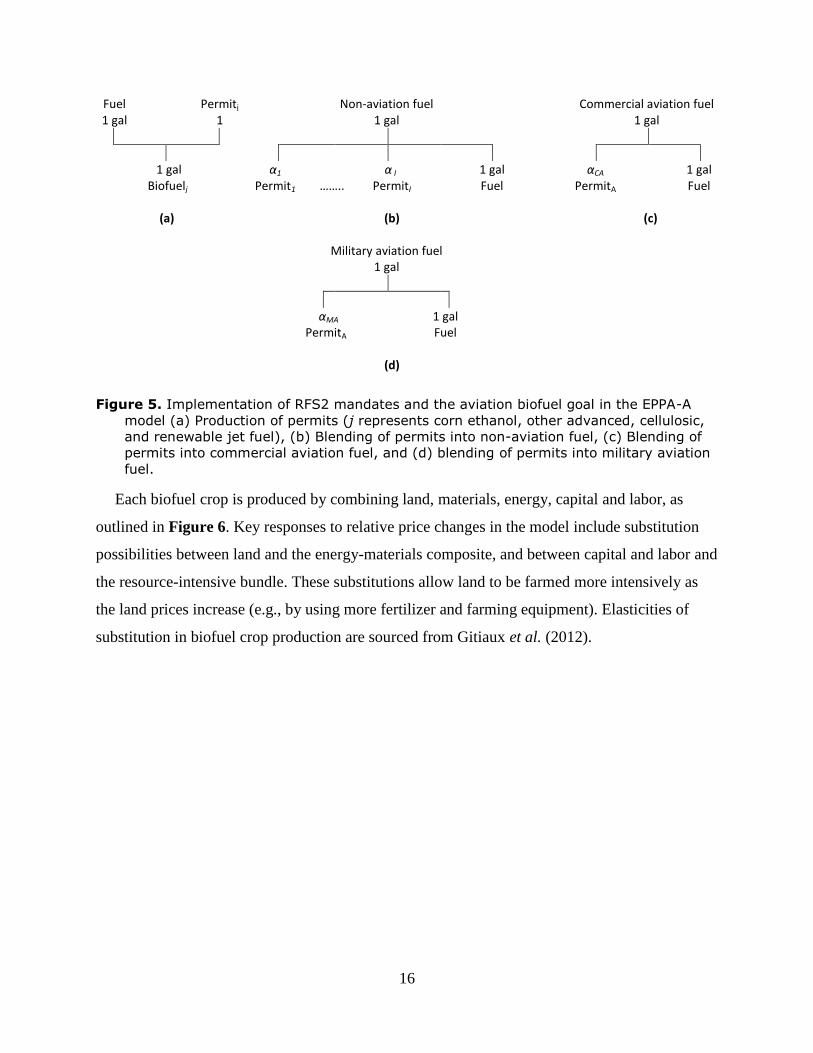
Figure 5. Implementation of RFS2 mandates and the aviation biofuel goal in the EPPA-A
model (a) Production of permits (j represents corn ethanol, other advanced, cellulosic,
and renewable jet fuel), (b) Blending of permits into non-aviation fuel, (c) Blending of
permits into commercial aviation fuel, and (d) blending of permits into military aviation
fuel.
Each biofuel crop is produced by combining land, materials, energy, capital and labor, as
outlined in Figure 6. Key responses to relative price changes in the model include substitution
possibilities between land and the energy-materials composite, and between capital and labor and
the resource-intensive bundle. These substitutions allow land to be farmed more intensively as
the land prices increase (e.g., by using more fertilizer and farming equipment). Elasticities of
substitution in biofuel crop production are sourced from Gitiaux et al. (2012).

17
Biofuel crop
Resource-intensive Capital-Labor
Land Energy-Materials Capital Labor
Aggregate energy Intermediate inputs
Electricity Other energy Input1 ……….. InputN
Coal Oil Gas Refined oil
Figure 6: Production of biofuel crops in the EPPA-A model.
As discussed in Section 2, there is the potential for oilseed crops to be grown in rotation with
other crops on land that would otherwise be left fallow. Reflecting a productive use for otherwise
unused land, in some scenarios, we endow the economy with additional land that can only be
used for oilseed rotation crops. Additionally, we set and
equal to zero in production
of rotation crops (see Figure 6), so there is a one-to-one mapping between the rotation crop land
endowment and oil from rotation crops.
Guided by Wheeler and Guillen-Portal (2007) and EPA (2012), we calibrate the production
input costs shares for our representative oilseed rotation crop using value-weighted average
production costs for corn and soybeans, excluding land and fertilizer costs. As land has no value
for the time that it is left fallow, we assume that the initial cost of land is zero. Once fallow land
is used for an oilseed rotation crop, the return to that land is calculated endogenously in the
model.
4.2 The APMT-E model
We model the aviation industry using the Aviation Portfolio Management Tool for Economics
(APMT-E). APMT-E is one of a series of models developed by the FAA and the Partnership for
Air Transportation Noise and Emissions Reduction Center of Excellence. The APMT tool suite
is designed to assess the effects of aviation on the environment, and APMT-E focuses on airline

18
responses to policy changes. The model has been used in support of ICAO/GIACC (2009) and
ICAO/CAEP (2010) and is outlined by MVA Consultancy (2009).
APMT-E is a global model that determines operations for country pair-stage length
combinations. The model identifies 23 route groups (e.g., North Atlantic, Domestic US, North
America-South America), nine distance bands (e.g., in kilometers, 0–926, 927–1,853, and 6,483–
8,334), ten aircraft seat classes defined by the number of available seats (e.g., 0–19, 20–50 and
211–300) and two carrier types (passenger and freight). In APMT-E, airlines can respond to fuel
price increases by raising prices (and flying less) and, when purchasing new aircraft (which are
combinations of airframes, engines and seat configurations), selecting more fuel efficient
alternatives. The model is calibrated using 2006 data. As the EPPA-A model has a five-year time
step and APMT-E is solved annually, we use linear interpolation techniques to generate yearly
estimates of changes in fuel prices and GDP. Guided by Gillen et al. (2002), we use an income
elasticity of demand for air travel of 1.4 to convert changes in GDP to changes in the demand for
aviation.
4.3 Scenarios
We simulate a reference scenario and five core policy scenarios. In the Reference scenario,
we update the standard benchmark scenario used in the EPPA model by changing oil resources
so that simulated jet fuel prices match projections by EIA (2012a). Our first policy simulation
(RFS2), models RFS2 mandates for renewable fuels. Remaining scenarios simulate the aviation
biofuel goal in tandem with RFS2 targets. The Additional scenario assumes that one billion
gallons of renewable jet fuel is produced in addition to the RFS2 targets. Consistent with current
legislation, renewable jet fuel contributes to the undifferentiated advanced RFS2 mandate in the
Include scenario. A further two scenarios consider renewable fuel from oilseed rotation crops
under the assumption that the aviation goal is included within the RFS2 mandates. Guided by our
calculations in Section 2, in one scenario (R-Low), we set the quantity of rotation crop land so
that three billion gallons of oil are available from rotation crops each year, and in another (R-
High) we assume that six billion gallons of oil are produced from rotation crops annually. We
also consider sensitivity analyses relating to (i) alternative characterizations of product slate
trade-offs in HEFA output, and (ii) fertilizer use for rotation oilseed crops.

19
5. RESULTS AND DISCUSSION
Results for our core scenarios in 2020 are presented in Table 2. In the Reference scenario, the
2020 price of jet fuel (in 2010 dollars) is $3.41/gal and jet fuel consumption by commercial
aviation is 20.8 billion gallons. Corn ethanol is the only renewable fuel produced in the reference
scenario. In the RFS2 scenario, decreased demand for ground transportation fuels reduces the
(net of RIN value) price of Refined oil. As RINs are not required for sales of jet fuel under
RFS2, the price of this fuel decreases to $3.39/gal. However, as the RFS2 policy reduces GDP
and ultimately the demand for aviation, there is a small decrease in aviation operations, as
measured by revenue (metric) ton kilometers (RTKs) and available ton kilometers (ATKs).
There are also small decreases in fuel use and CO2 emissions.
Table 2. Core simulation results, 2020.
Reference RFS2 Additional Include R-Low R-High
GDP (∆ relative to ref.) - –0.18% –0.20% –0.18% –0.12% –0.08%
Average jet fuel price (2010$/gal) 3.41 3.39 3.43 3.43 3.42 3.39
Price of HEFA jet fuel (2010$/gal) - - 6.25 6.08 5.61 3.74
Implicit sub./RIN price (2010$/gal)
Renewable jet fuel - - 2.86 2.69 2.22 0.35
Other advanceda - 1.88 1.81 1.68 1.29 0
HEFA jet fuel (gal, bil.)
From soy 0 0 1 1 0.5 0
From rotation crops - - - - 0.5 1
HEFA diesel production (gal, bil.) 0 1 1.5 1.4 3 4.6
Price of soy oil (2010$/gal) 2.99 4.25 4.45 4.39 3.97 2.49
Soybean biofuel land (acres, mil.) 0 13.3 70.1 58.9 23.5 0
Aviation metrics
Operating costs ($2010, bil.) 267.5 267.3 267.6 267.6 267.5 267.3
Operating revenues ($2010, bil.) 276.3 276.1 276.4 276.4 276.3 276.1
Revenue tonne km (bil.) 283.4 282.9 282.1 282.1 282.2 282.5
Available tonne km (bil.) 350.0 349.2 348.6 348.6 348.7 349.0
Fuel use (gal, bil.) 20.77 20.74 20.70 20.70 20.71 20.72
Lifecycle CO2 emissions (∆ relative to ref.)b
Due to reduced fuel use - –0.18% –0.36% –0.35% –0.32% –0.25%
Due to biofuels - 0% –0.98% –0.98% –0.98% –0.98%
Total - –0.18% –1.34% –1.33% –1.30% –1.23%
Note: a Other advanced biofuels are an aggregate of biomass-based diesel and undifferentiated advanced biofuels; b CO2 emission calculations assume that lifecycle CO2 emissions from HEFA production are 42% of those from conventional jet fuel.

20
In the Additional scenario in 2020, meeting the aviation biofuel goal induces production of
renewable diesel and decreases the other advanced RIN price (from $1.88 to $1.81) and an
implicit subsidy of $2.86 per gallon of renewable jet fuel is required to meet the aviation goal.
The average price of jet fuel reported in Table 2 represents the average price paid by commercial
aviation when the industry purchases 0.35 billion gallons of renewable fuel (at $3.39 + $2.86 =
$6.25/gal) and remaining consumption is conventional fuel (at a price of $3.39/gal). As
commercial aviation’s purchases of renewable fuel are a small proportion (1.7%) of total fuel
purchases, there is only a small increase in the average price of jet fuel. There is also a small
decrease in GDP (and aviation demand) relative to the RFS2 due to the additional constraints on
the economy. Relative to the reference case, lifecycle CO2 emissions fall by 1.34% due to
reduced fuel use (0.36%) and the use of biofuels (0.98%).12
When renewable jet fuel contributes to the RFS2 target (Include), the reduction in the
effective mandate for other advanced biofuel results in a further decrease of the RIN price for
this fuel. However, the lower total quantity of renewable fuel produced decreases the price of
land and ultimately soy oil, so the implicit subsidy to the aviation biofuel ($2.69/gal) is lower
than in the Additional scenario. There are only very small differences between the average price
of jet fuel and aviation metrics in the Additional and Include scenarios.
In the R-Low scenario, the availability of a low cost option to meet a proportion of the
aviation goal reduces the average cost of production. However, as production from soy oil is still
required and the market price is determined by the cost of producing the marginal unit, there is
only a moderate decrease in the implicit renewable jet fuel subsidy. As farmers are owners of the
relatively scarce factor (rotation crop land), they are the major beneficiaries of development of a
rotation crop pathway. When 6 billion gallons of oil are available from rotation crops annually
(R-High), production of other advanced fuels using this oil exceeds the mandates for these fuels,
so the other advanced RIN price is zero. An implicit subsidy is required for HEFA manufacturers
to produce a higher portion of renewable jet fuel than at maximum distillate, but due to the low
cost of producing fuel from rotation crops, this amount is small ($0.35/gal). The availability of a
large quantity of oil from rotation crops also significantly reduces the reduction in GDP due to
biofuel policies (including RFS2).
12
Following the median estimate of lifecycle emissions without land use change from Stratton et al. (2011), our CO2
emissions calculations assume that lifecycle CO2 emissions from HEFA fuel are 42% of those from conventional
jet fuels.

21
6. SENSITIVITY ANALYSIS
Important characterizations in our analysis include the ability of HEFA producers to substitute
between jet and diesel, and the amount of fertilizer required to grow rotation crops. The key
parameter governing product slate trade-offs in HEFA production is the elasticity of
transformation between diesel and a composite of jet fuel, naphtha and LPG, . We set
= 10 in our core scenarios and consider values of 5 and 20 for the Include scenario in
sensitivity cases. Results are reported in Table 3. When trade-off possibilities between diesel and
jet fuel production are low, a higher jet fuel price is required to induce jet fuel production than
when there are high trade-off possibilities. Consequently, the implicit subsidy to renewable jet
fuel to meet the aviation goal increases (from $2.69 to $2.85) when we reduce the value
and decreases (to $2.53) when there is greater scope for product slate trade-offs. However,
differences in modeling outcomes, particularly for the average jet fuel price, across scenarios are
small, indicating that our results are relatively insensitive to alternative values of in the
range that we consider.
Table 3. Sensitivity analysis results, 2020.
Product slate trade-offs (Include) Fertilizer for rotation crops
R-Low R-High
Average jet fuel price (2010$/gal) 3.43 3.43 3.42 3.40
Price of HEFA jet fuel (2010$/gal) 6.24 5.92 5.61 4.39
Implicit subsidy/RIN price
Renewable jet fuel (2010$/gal) 2.85 2.53 2.22 1.00
Other advanced (2010$/gal)a 1.67 1.68 1.29 0.07
HEFA jet fuel (gal, bil.)
From soy 1 1 0.5 0
From rotation crops - - 0.5 1
HEFA diesel production (gal, bil.) 2.4 0.7 3.5 3.5
Price of soy oil (2010$/gal) 4.44 4.34 3.97 2.75
Soybean biofuel land (acres, mil.) 59.1 58.7 23.5 0
Note: a Other advanced biofuels are an aggregate of biomass-based diesel and undifferentiated advanced biofuels.
Our second set of sensitivity analyses examines alternative assumptions for the use of
fertilizer when growing rotation crops. Fertilizer was not required for rotation crops in the core
scenarios. In alternative cases for the R-Low and R-High scenarios, we assume that rotation
crops require the same amount of fertilizer per acre as corn production. This increases the cost of

22
rotation crop production by 35% and results in the cost of HEFA production with a rotation crop
feedstock exceeding the price of conventional fuel. In the R-Low scenario, as renewable fuel
with a soy oil feedstock is used to supply the marginal unit, as in our core scenario, there is little
difference between results with and without fertilizer use. When a large quantity of rotation crop
land is available (R-High) and fertilizer costs are included, fuel from rotation crops continues to
be used to meet both the aviation goal and the other advanced mandate. Increased production
costs result in an increase in the implicit subsidy to renewable jet fuel (from $0.35 without
fertilizer costs to $1.00 with such costs) and a small increase in the average jet fuel price, relative
to in the corresponding core scenario. This analysis indicates that our findings are sensitive to
rotation crop production costs when the aviation goal is met by fuel derived from rotation crop
oil.
7. CONCLUSIONS
We examined the cost to US commercial aviation of meeting the FAA’s aviation biofuel goal
of consuming one billion gallons of renewable jet fuel each year from 2018 onwards. We began
by analysing interactions between the aviation biofuel goal and an existing renewable fuel
standard for fuels used in ground transportation (RFS2). If a renewable jet fuel pathway produces
a product slate that includes renewable diesel, encouraging production of renewable jet fuel will
increase the supply of other renewable fuels and decrease RIN prices for these fuels. To
compensate producers for lower RIN prices, the implicit subsidy to aviation jet fuel will need to
be larger than the difference between the cost of production per gallon of total distillate and the
price of conventional jet fuel. However, encouraging production of advanced renewable fuel
(both jet fuel and diesel) will not induce consumption of renewable fuel in air transportation. As
jet fuel can be sold as diesel (at approximately the same price) and there are additional costs
associated with separating jet fuel and diesel, jet fuel will be sold as diesel under mandates for
ground transportation fuels.
Our analysis considered renewable jet fuel production via HEFA processes. These
processes produce a mixed product slate that includes diesel, naphtha and gases, in addition to
renewable jet fuel. Feedstocks considered include soybean oil and (in some simulations) a
representative rotation oilseed crop grown on otherwise fallow land. Our modeling framework
employed an economy-wide model and a partial equilibrium model of the aviation industry.

23
We found that, without the development of an oilseed rotation crop, meeting the aviation
biofuel goal will require an implicit subsidy to renewable fuel producers of $2.69/gal of jet fuel
and increase the average price of jet fuel by $0.04/gal. As renewable jet fuel accounts for 1.7%
of total fuel use by commercial aviation, meeting the aviation biofuel goal had only a small
impact on CO2 emissions. When a rotation oilseed crop was considered as a feedstock, the
outcome was influenced by the amount of oil available from this crop. If renewable oil from
rotation crops can only meet a fraction of demand for renewable jet production, the price of
renewable jet fuel was determined by the cost of production using a soybean oil feedstock, and
the implicit subsidy to renewable jet producers was $2.22/gal. When there is sufficient rotation
crop oil to meet the aviation goal, the implicit subsidy to renewable jet fuel producers was only
$0.35/gal.
Overall, our analysis revealed that renewable jet fuel pathways producing higher fractions of
jet fuel (as a proportion of total distillate) may be a more cost-effective way of meeting the
aviation goal, even if they have higher production costs per gallon of total distillate than
pathways producing a lower proportion of jet fuel. Similarly, a cellulosic pathway may be more
cost effective than a non-cellulosic pathway with lower production costs, as relatively large
cellulosic mandates mean that inducing production of these fuels will have a relatively small
impact on the cellulosic RIN price. Our results also showed that development of a rotation crop
grown on otherwise fallow land has the potential to significantly reduce the cost of achieving
biofuel goals.
We close by noting that, as we did not consider the full suite of pathways potentially available
in 2018, our calculations may overestimate the cost of meeting the aviation biofuel goal.
Including more feedstocks, such as canola oil, animal fat and waste grease, will likely lower the
cost of producing renewable jet fuel. Additionally, processes to produce alcohol-to-jet and
synthetic kerosene containing aromatics are expected to be certified by the end of 2013. The
addition of these processes and other new technologies may also lower the cost renewable jet
consumption.
Acknowledgements
The authors wish to thank Matthew Pearlson, James Hileman, Robert Malina and Thomas Cuddy
for helpful comments and suggestions. Remaining errors are our responsibility. This work is

24
funded by the US Federal Aviation Administration Office of Environment and Energy under
FAA Award Numbers: 06-C-NE-MIT, Amendment Nos. 018 and 028, and 09-C-NE-MIT,
Amendment Nos. 007, 020, and 025, and DTFAWA-05-D-00012 Task Order 0009. The Joint
Program on the Science and Policy of Global Change is funded by the US Department of Energy
and a consortium of government and industrial sponsors (for the complete list see
http://globalchange.mit.edu/sponsors/all). Any opinions, findings, and conclusions or
recommendations expressed in this material are those of the authors and do not necessarily
reflect the views of the FAA, NASA, Transport Canada, the U.S. Department of Defense, or the
U.S. Environmental Protection Agency.
8. REFERENCES
American Society for Testing and Materials (ASTM), 2011: D7566-11a standard specification
for aviation turbine fuel containing synthesized hydrocarbons.
(http://enterprise.astm.org/filtrexx40.cgi?+REDLINE_PAGES/D7566.htm) (retrieved
February 2012).
Anger, A., 2010: Including aviation in the European emissions trading scheme: Impacts on the
industry, CO2 emissions and macroeconomic activity in the EU. Journal of Air Transport
Management, 16: 100-05.
Armington, P.S., 1969: A theory of demand for products distinguished by place of production.
IMF Staff Papers, 16: 159-76.
Bauen, A., J. Howes, L. Bertuccioli, C. Chudziak, 2009: Review of the potential for biofuels in
aviation. Final report prepared for the Committee on Climate Change. E4tech: Switzerland.
Carter, N., R. Stratton, M. Bredehoeft, J. Hileman, 2011: Energy and environmental viability of
select alternative jet fuel pathways. 47th
AIAA Joint Propulsion Conference, San Diego, CA.
Energy Information Administration (EIA), 2012a: Annual energy outlook 2012 with projections
to 2035. US Department of Energy: Washington, DC.
Energy Information Administration (EIA), 2012b: Petroleum and other liquid spot prices. US
Department of Energy: Washington, DC.
(http://www.eia.gov/dnav/pet/pet_pri_spt_s1_m.htm) (retrieved August 2012).
Environmental Protection Agency (EPA), 2012: Regulation of fuels and fuel additives:
Identification of additional qualifying renewable fuel pathways under the renewable fuel
standard program. 40 CFR Part 80: 13009-13010.
Federal Aviation Administration (FAA), 2011: FAA Destination 2025, Washington, DC.
(www.faa.gov/about/plans_reports/media/Destination2025.pdf) (retrieved January 2012)
Federal Aviation Administration (FAA), 2012: FAA aerospace forecast fiscal years 2012-2032.
US Department of Transportation: Washington, DC.
Gillen, D.W., W.G. Morrison, C. Stewart, 2002: Air travel demand elasticities: Concepts, issues
and measurement. Department of Finance: Ottawa, Canada.
Gillespie, C.W., 2011: A general equilibrium analysis of climate policy for aviation. Masters
Thesis, Massachusetts Institute of Technology, Cambridge, MA.
Gitiaux, X., S. Paltsev, J., Reilly. S. Rausc, 2012: Biofuels, climate policy, and the European
vehicle fleet. Journal of Transport Economics and Policy, 46(1): 1-23.
Gurgel, A., J.M. Reilly, S. Palstsev, 2007: Potential Land Use Implications of a Global Biofuels
Industry. Journal of Agricultural & Food Industrial Organization, 5 (2). (DOI:
10.2202/1542-0485.1202).

25
Hileman, J., H.M. Wong, I.A. Waitz, D.S. Ortiz, J.T. Bartis, M.A. Weiss, 2009: Near-Term
Feasibility of Alternative Jet Fuels. Transport Policy, in press.
Hofer, C., M.E. Dresner, R.J. Windle, 2010: The environmental effects of airline carbon
emissions taxation in the US. Journal of Transportation Research Part D: Transport and
Environment, 15, 37-45.
International Air Transport Association (IATA), 2009: A global approach to reducing aviation
emissions.(http://www.iata.org/SiteCollectionDocuments/Documents/Global_Approach_Red
ucing_Emissions_251109web.pdf) (retrieved March 2012).
International Air Transport Association (IATA), 2010: Report on alternative fuels.
(http://www.iata.org/ps/publications/Documents/IATA%202010%20Report%20on%20Alter
native%20Fuels.pdf) (retrieved March 2012).
International Air Transport Association (IATA), 2012: Fact sheet: Alternative fuels.
(http://www.iata.org/pressroom/facts_figures/fact_sheets/pages/alt-fuels.aspx) (retrieved
January 2012).
International Civil Aviation Organization/Committee on Aviation Environmental Protection
(ICAO/CAEP), 2010: NOX stringency cost-benefit analysis demonstration using APMT-
Impacts. 8th Meeting, February 2010, Montréal, Canada.
International Civil Aviation Organization / Group on International Aviation and Climate Change
(ICAO/GIACC), 2009: US fuel trends analysis and comparison to GIACC/4-IP/1. Fourth
Meeting of the Group on International Aviation and Climate Change, Montreal.
Malina, R., D. McConnachie, N. Winchester, C. Wollersheim, S. Paltsev, I.A. Waitz, 2012: The
impact of the European Union emissions trading scheme on US aviation. Journal of Air
Transport Management, 19 (2012): 36-41.
Moser, B., G. Knothe, S. Vaughn, T. Isbell, 2009: Production and evaluation of biodiesel from
field pennycress (Thlaspi arWense L.) oil. Energy Fuels, 23 (8): 4149-4155.
MVA Consultancy, 2009: Aviation Environmental Portfolio Management Tool (APMT):
APMT-Economics, algorithm design document (ADD), London.
Narayanan, B.G. and T.L. Walmsley, 2008: Global Trade, Assistance, and Production: The
GTAP 7 database. Center for Global Trade Analysis, Purdue University, West Lafayette, IN.
National Biodiesel Board (NBB), 2012: NBB Member Plants. (http://www.nbb.org/about-
us/member-plants/nbb-member-plant-lists) (retrieved April 2012).
OECD, 2012: Green Growth and the Future of Aviation. 27th
Round Table on Sustainable
Development. (http://www.oecd.org/dataoecd/13/38/49482790.pdf) (retrieved January 2012).
Paltsev, S., J. Reilly, H.D. Jacoby, R.S. Eckaus, J. McFarland, M. Sarofim, M. Asadooria, M.
Babiker, 2005: The MIT Emissions Prediction and Policy Analysis (EPPA) model: Version
4. MIT JPSPGC, Report No. 125, August, 72p.
(http://globalchange.mit.edu/files/document/MITJPSPGC_Rpt125.pdf) (retrieved June
2012).
Pearlson, M., 2011: Economic and environmental assessment of hydroprocessed renewable
distillate fuels. Masters Thesis, Massachusetts Institute of Technology, Cambridge, MA.
Sasol, 2011: Sasol facts, Johannesburg, South Africa.
(http://www.sasol.com/sasol_internet/downloads/11029_Sasol_Facts_2011_1309786765289.
pdf) (retrieved February 2012).
Scheelhaase, J., W. Grimme, M. Schaefer, 2010: The inclusion of aviation into the EU emission
trading scheme – Impacts on competition between European and non-European network
airlines. Transportation Research Part D: Transport and Environment, 15(1): 14-25.

26
Sgouridis, S., P. Bonnefoy, R.J. Hansman, 2011: Air transportation for a carbon constrained
world: Long-term dynamics of policies and strategies for mitigating the carbon footprint of
commercial aviation. Transportation Research Part A: Policy and Practice, 45(10): 1077-
1091.
Shonnard, D., L. Williams, T.N. Kalnes, 2010: Camelina-derived jet fuel and diesel: Sustainable
advanced biodiesel. Environmental Progress & Sustainable Energy, 29(3): 382–392.
Stratton, R., H.M. Wong, , J. Hileman, 2011: Quantifying variability in life cycle greenhouse gas
inventories of alternative middle distillate transportation fuels. Environmental Science and
Technology. 45 (10): 4637-4644.
United States Air Force (USAF), 2010: Air Force energy plan: 2010. The United States Air
Force, Washington, DC.
United States Department of Agriculture (USDA), 2011: The renewable identification number
system and U.S. biofuel mandates. USDA Economic Research Service, Washington, DC.
United States Department of Agriculture (USDA), 2012: USDA long-term projections to 2021.
Interagency Agricultural Projections Committee.
United States Navy (USNAVY), 2010: A Navy energy vision for the 21st century. The United
States Navy, Washington, DC.
Universal Oil Products (UOP), 2005: Opportunities for biorenewables in oil refineries, Des
Plaines, IL. (http://www.osti.gov/bridge/servlets/purl/861458-Wv5uum/861458.pdf)
(retrieved January 2012).
Vespermann, J. and A. Wald, 2011: Much ado about nothing? – An analysis of economic
impacts and ecologic effects of the EU-emissions trading scheme in the aviation industry.
Transportation Research Part A: Policy and Practice, 45(10):1066-1076.
Wheeler, P. and F. Guillen-Portal, 2007: Camelina production in Montana: A survey study
sponsored by Targeted Growth Inc. and Barkley Ag. Enterprises, LLP (unpublished).
Winchester, N., C. Wollersheim, R. Clewlow, N.C. Jost, S. Paltsev, J. Reilly, I.A. Waitz, 2013:
The impact of climate policy on US aviation. Journal of Transport Economics and Policy.
47(1): 1-15.
World Bank, 2012: Soybean Oil, Chicago Soybean Oil Futures.
(http://www.indexmundi.com/commodities/?commodity=soybean-oil) (retrieved August
2012).


![Robot Adoption and Labor Market Dynamics · 2020-01-07 · Robot Adoption and Labor Market Dynamics Anders Humlum* Princeton University Job Market Paper [Link to latest version] November](https://img.dokumen.tips/doc/110x75/5e983920ca7d8f294f5bc087/robot-adoption-and-labor-market-dynamics-2020-01-07-robot-adoption-and-labor-market.jpg)