Embed Size (px)
Citation preview
Copyright 2011 American Business Analytics & Research, LLC, www.shadowstats.com 1
COMMENTARY NUMBER 390 August CPI, Real Retail Sales, Industrial Production
September 15, 2011
__________
Consumer Inflation at Three-Year High
August’s Annual Inflation: 3.8% (CPI-U), 4.3% (CPI-W), 11.4% (SGS)
“Core” Inflation Jumped Again with Some Acceleration
Real Retail Sales Fell 0.3% in August
August’s 0.2% Production Gain Was a 0.1% Loss Against Initial September Reporting
__________
PLEASE NOTE: The next regular Commentary is scheduled for Tuesday, September 20th. It will cover August housing starts. A Special Commentary would be published, as appropriate, in response to any unusual market, systemic or economic developments.
—Best wishes to all, John Williams
Opening Comments and Executive Summary. Inflation continues to increase, while the economy falters. In today’s (September 15th) reporting, consumer inflation hit a three-year high, while annual “core” inflation—net of food and energy—rose for the 10th straight month and at an accelerating pace. The inflation problem has been triggered by federal government fiscal malfeasance and Federal Reserve
Shadow Government Statistics — Commentary No. 390, September 15, 2011
Copyright 2011 American Business Analytics & Research, LLC, www.shadowstats.com 2
actions, with Fed policies aimed specifically at debasing the U.S. dollar. The rising pace of inflation is due to perverse monetary policies; it does not reflect strong economic demand.
In current business activity, real (inflation-adjusted) retail sales contracted for August and are on track to contract for third-quarter 2011. August industrial production slowed markedly, and showed a monthly gain only because of relative downside revisions to prior periods.
August CPI. The seasonally-adjusted CPI-U rose by 0.37% for the month, up 3.77% year-to-year (versus 3.63% in July), while the seasonally-adjusted CPI-W rose by 0.42% for the month, up 4.26% year-to-year (versus 4.11% in July). The SGS-Alternate Consumer inflation measures in August were 7.1% (1990-base) and 11.4% (1980-base).
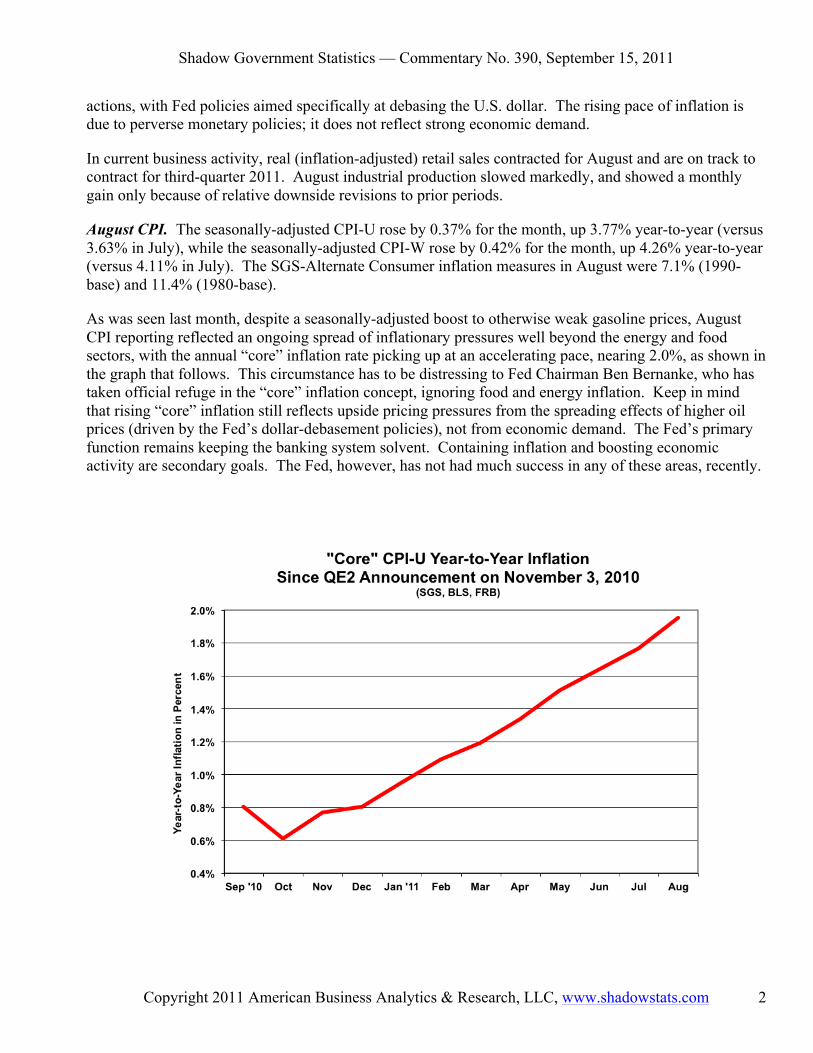
As was seen last month, despite a seasonally-adjusted boost to otherwise weak gasoline prices, August CPI reporting reflected an ongoing spread of inflationary pressures well beyond the energy and food sectors, with the annual “core” inflation rate picking up at an accelerating pace, nearing 2.0%, as shown in the graph that follows. This circumstance has to be distressing to Fed Chairman Ben Bernanke, who has taken official refuge in the “core” inflation concept, ignoring food and energy inflation. Keep in mind that rising “core” inflation still reflects upside pricing pressures from the spreading effects of higher oil prices (driven by the Fed’s dollar-debasement policies), not from economic demand. The Fed’s primary function remains keeping the banking system solvent. Containing inflation and boosting economic activity are secondary goals. The Fed, however, has not had much success in any of these areas, recently.
Shadow Government Statistics — Commentary No. 390, September 15, 2011
Copyright 2011 American Business Analytics & Research, LLC, www.shadowstats.com 3
August Real Retail Sales. With nominal (not adjusted for inflation) sales basically flat in August, the increase in the CPI-U caused a 0.33% monthly decline in the real retail series. Annual growth slowed to 3.28% in August from 4.57% in September. Given the pace of currently reported July and August sales, third-quarter 2011 is on track to show a quarterly decline versus the second-quarter, a pattern that easily could be followed by GDP reporting, as the double-dip becomes formalized. There effectively has been no growth in retail sales in the last six months, other than what can be accounted for by rising prices, that is no growth in physical economic activity. Continued weakening in the series is likely
August Industrial Production. The August production number showed a 0.18% increase, versus a 0.90% increase in September, but the August level of activity was down by 0.12% from the initial reporting of September activity. Revisions showed lower activity in the period since April 2011. Continued weakening in this series also is likely in the months ahead.
Hyperinflation Watch. With the still-unfolding economic and systemic solvency crises—as discussed in the recent Commentaries and repeated here—the broad inflation and economic outlooks detailed in the Hyperinflation Special Report (2011) continue to unfold and are unchanged. To the extent that euro-area problems threaten to trigger a global or U.S. systemic collapse, the Fed—most likely with other parties—will create, spend, loan, or guarantee whatever money is needed to prevent a collapse. This has been the case for some time, but the cost to the system is inflation, as discussed previously (Hyperinflation Report and Commentary No. 388, for example, links are elsewhere in this section).
The financial markets still are unstable and extremely volatile, roiled by deepening crises of confidence in the U.S. dollar and in the long-term outlook for U.S. financial, economic, systemic and political stability. For those living in a U.S. dollar-denominated world, regardless of further near-term extreme volatility in the U.S. dollar—in either direction—versus the stronger major currencies and gold, the stronger currencies and precious metals remain the fundamental hedges against what lies ahead.
Massive, fundamental dollar dumping and dumping of dollar-denominated assets could start at anytime, with little or no further warning. With a U.S. government unwilling to balance or even to address its uncontainable fiscal condition; with the federal government and Federal Reserve standing ready to prevent a systemic collapse, so long as it is possible to print and spend whatever money is needed; and with the U.S. dollar at risk of losing its global reserve currency status; much higher inflation lies ahead, in a circumstance that rapidly could evolve into hyperinflation.
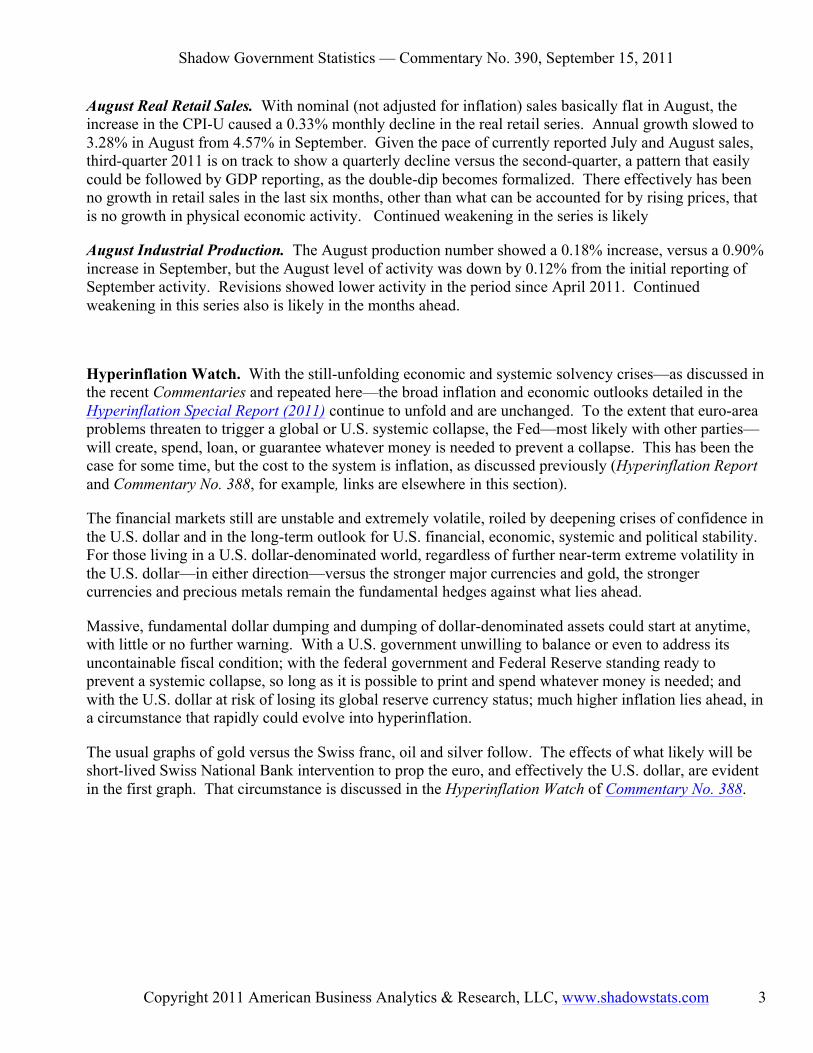
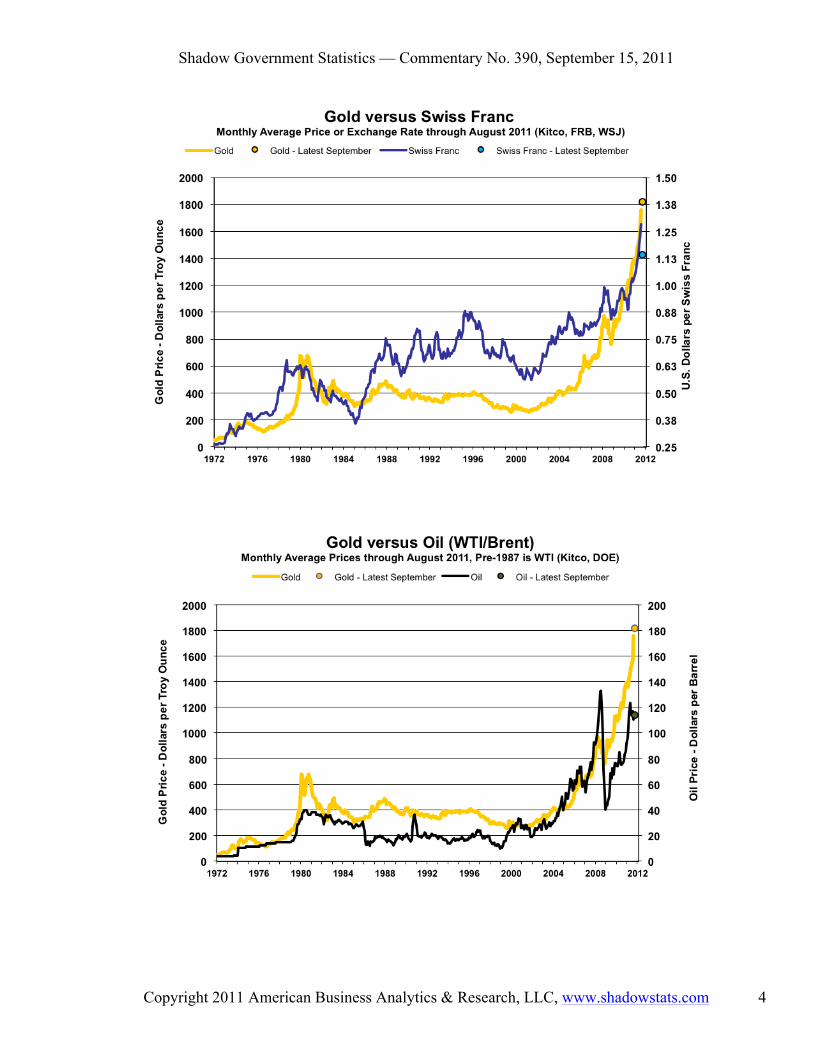
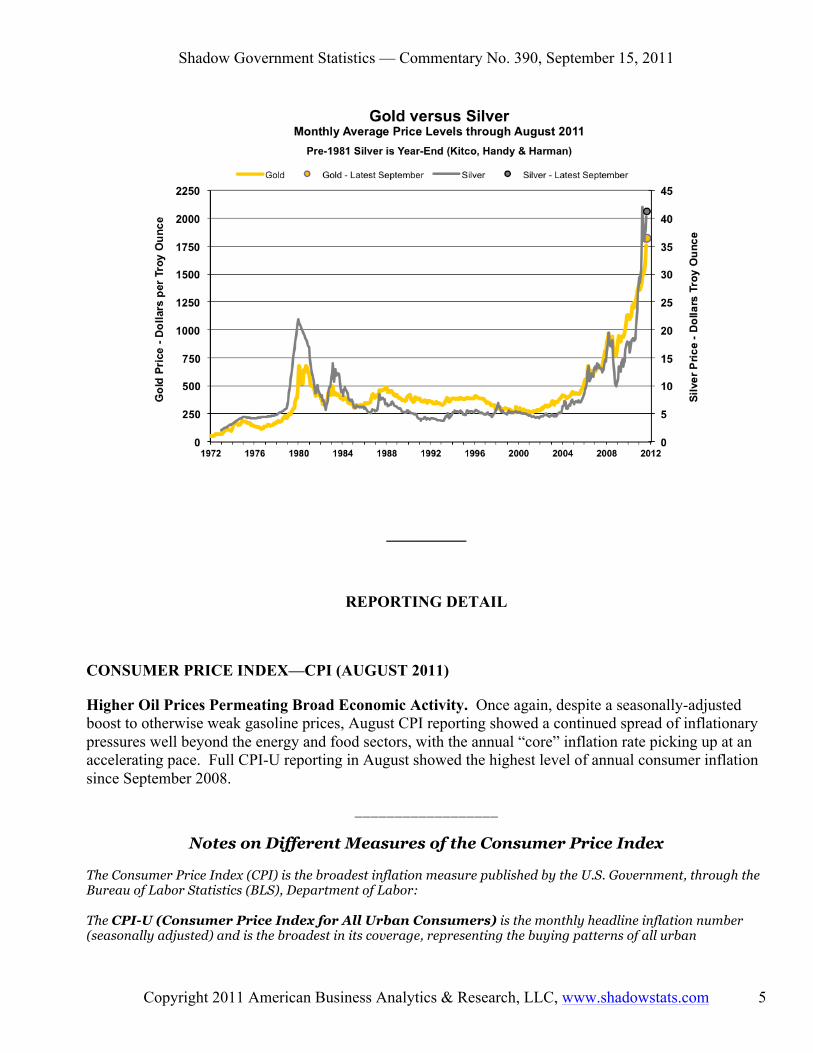
The usual graphs of gold versus the Swiss franc, oil and silver follow. The effects of what likely will be short-lived Swiss National Bank intervention to prop the euro, and effectively the U.S. dollar, are evident in the first graph. That circumstance is discussed in the Hyperinflation Watch of Commentary No. 388.
Shadow Government Statistics — Commentary No. 390, September 15, 2011
Copyright 2011 American Business Analytics & Research, LLC, www.shadowstats.com 4
Shadow Government Statistics — Commentary No. 390, September 15, 2011
Copyright 2011 American Business Analytics & Research, LLC, www.shadowstats.com 5
__________
REPORTING DETAIL
CONSUMER PRICE INDEX—CPI (AUGUST 2011)
Higher Oil Prices Permeating Broad Economic Activity. Once again, despite a seasonally-adjusted boost to otherwise weak gasoline prices, August CPI reporting showed a continued spread of inflationary pressures well beyond the energy and food sectors, with the annual “core” inflation rate picking up at an accelerating pace. Full CPI-U reporting in August showed the highest level of annual consumer inflation since September 2008.
__________________
Notes on Different Measures of the Consumer Price Index
The Consumer Price Index (CPI) is the broadest inflation measure published by the U.S. Government, through the Bureau of Labor Statistics (BLS), Department of Labor: The CPI-U (Consumer Price Index for All Urban Consumers) is the monthly headline inflation number (seasonally adjusted) and is the broadest in its coverage, representing the buying patterns of all urban
Shadow Government Statistics — Commentary No. 390, September 15, 2011
Copyright 2011 American Business Analytics & Research, LLC, www.shadowstats.com 6
consumers. Its standard measure is not seasonally adjusted, and it never is revised on that basis except for outright errors. The CPI-W (CPI for Urban Wage Earners and Clerical Workers) covers the more-narrow universe of urban wage earners and clerical workers and is used in determining cost of living adjustments in government programs such as Social Security. Otherwise its background is the same as the CPI-U. The C-CPI-U (Chain-Weighted CPI-U) is an experimental measure, where the weighting of components is fully substitution based. It generally shows lower annual inflation rate than the CPI-U and CPI-W. The latter two measures once had fixed weightings—so as to measure the cost of living of maintaining a constant standard of living—but now are quasi-substitution-based. The SGS Alternative CPI-U Measures are attempts at adjusting reported CPI-U inflation for the impact of methodological change of recent decades designed to move the concept of the CPI away from being a measure of the cost of living needed to maintain a constant standard of living.
__________________
CPI-U. The BLS reported today (September 15th) that the seasonally-adjusted August 2011 CPI-U jumped by 0.37% (up by 0.28%, unadjusted) for the month. That followed a gain of 0.50% (up by 0.09%, unadjusted) in July. The August reporting reflected an unadjusted 0.5% drop (the Department of Energy reported an unadjusted 0.2% decline) in monthly average gasoline prices, but the unadjusted BLS estimate was turned into a seasonally-adjusted monthly gain of 1.9%, with gasoline-price seasonal-adjustment factors in a price-boosting mode.
August’s unadjusted year-to-year CPI-U inflation rose to 3.77%, from July’s 3.63%, the strongest pace of annual inflation since September 2008.
The August report also showed accelerating inflationary pressures from higher energy prices spreading further into the broad economy (see the graph and comments in Opening Comments and Executive Summary). On an annual basis, “core” CPI-U inflation moved higher for the 10th straight month, up to 1.95% in August, versus 1.77% in July and 1.64% in June. When Fed Chairman Bernanke used his jawboning in an effort to debase the U.S. dollar in the markets, in advance of announcing QE2 in November 2010, annual “core” inflation was at 0.61%.
Year-to-year total CPI-U inflation would increase or decrease in next month’s September 2011 reporting, dependent on the seasonally-adjusted monthly change, versus the 0.16% gain in the adjusted monthly level reported for September 2010. I use the adjusted change here, since that is how consensus expectations are expressed. To approximate the annual unadjusted inflation rate for September 2011, the difference in September’s headline monthly change (or forecast of same) versus the year-ago monthly change should be added to or subtracted directly from August 2011’s reported annual inflation rate of 3.77%. Annual CPI-U inflation should move to top 4% in the next couple of months. The CPI-W broke that barrier in May and stood at 4.26% for August in today’s reporting.
CPI-W. The narrower, seasonally-adjusted CPI-W, which has greater weighting for gasoline than does the CPI-U, rose by 0.42% (up by 0.29% unadjusted), following July’s gain of 0.59% (up by 0.07% unadjusted).
Shadow Government Statistics — Commentary No. 390, September 15, 2011
Copyright 2011 American Business Analytics & Research, LLC, www.shadowstats.com 7
Unadjusted, August 2011’s year-to-year CPI-W inflation was 4.26%, against a 4.11% annual increase in July. The July and August annual CPI-W are the first two of three months to be averaged into the next Social Security cost of living adjustment (COLA), net of any residual deflation from recent years.
C-CPI-U. The Chain-Weighted CPI-U—the fully substitution-based series that gets touted by CPI opponents and inflation apologists, including the recent presidential deficit commission and some members of Congress, as the replacement for the CPI in COLA adjustments—is reported only on an unadjusted basis. Year-to-year inflation increased to 3.61% in August, up from 3.47% in July.
Alternate Consumer Inflation Measures. Adjusted to pre-Clinton (1990) methodology, annual CPI inflation was roughly 7.1% in August 2011, up from 7.0% in July, while the SGS-Alternate Consumer Inflation Measure, which reverses gimmicked changes to official CPI reporting methodologies back to 1980, rose to to about 11.4% (11.35% for those using the extra digit) in August, from about 11.2% in July.
The SGS-Alternate Consumer Inflation Measure adjusts on an additive basis for the cumulative impact on the annual inflation rate of various methodological changes made by the BLS (the series is not recalculated). Over the decades, the BLS has altered the meaning of the CPI from being a measure of the cost of living needed to maintain a constant standard of living, to something that no longer reflects the constant-standard-of-living concept. Roughly five percentage points of the additive SGS adjustment reflect the BLS’s formal estimate of the annual impact of methodological changes; roughly two percentage points reflect changes by the BLS, where SGS has estimated the impact not otherwise published by the BLS.
Gold and Silver Highs Adjusted for CPI-U/SGS Inflation. Despite the September 5th historic-high gold price of $1,895.00 per troy ounce (London afternoon fix), and despite the multi-decade high silver price of $48.70 per troy ounce (London fix of April 28th), gold and silver prices have yet to re-hit their 1980 historic levels, adjusted for inflation. The earlier all-time high of $850.00 (London afternoon fix, per Kitco.com) of January 21, 1980 would be $2,475 per troy ounce, based on August 2011 CPI-U-adjusted dollars, $8,639 per troy ounce based on SGS-Alternate-CPI-adjusted dollars (all series not seasonally adjusted).
In like manner, the all-time high price for silver in January 1980 of $49.45 per troy ounce (London afternoon fix, per silverinstitute.org), although approached recently, still has not been hit since 1980, including in terms of inflation-adjusted dollars. Based on August 2011 CPI-U inflation, the 1980 silver price peak would be $144 per troy ounce and would be $503 per troy ounce in terms of SGS-Alternate-CPI-adjusted dollars (again, all series not seasonally adjusted).
As shown on page 43 of the Hyperinflation Special Report (2011), over the decades, the price of gold has compensated for more than the loss of the purchasing power of the U.S. dollar as reflected by CPI inflation, while it has effectively fully compensated for the loss of purchasing power of the dollar based on the SGS-Alternate Consumer Price Measure (1980 Methodologies Base).
Real (Inflation-Adjusted) Retail Sales. Based on the August 2011 CPI-U reporting, inflation- and seasonally-adjusted August 2011 retail sales declined by 0.33% for the month, where, before inflation adjustment, the current number was virtually unchanged, up by 0.04% (see Commentary No. 389). Real July retail sales revised to a monthly decline of 0.23% (previously down by 0.03%, basically unchanged),
Shadow Government Statistics — Commentary No. 390, September 15, 2011
Copyright 2011 American Business Analytics & Research, LLC, www.shadowstats.com 8
where nominal (not-adjusted for inflation) sales in July revised to a gain of 0.27% (previously up by 0.47%).
The average real retail sales level for July and August (the first two months of the third-quarter) was down by 0.18% (annualized real quarterly decline of 0.73%) versus the average for second-quarter 2011, a negative indicator at this point in time for third-quarter GDP. Second-quarter real retail sales were up by 0.14% (0.58% annualized) from first-quarter 2011.
August’s real retail sales rose at a year-to-year pace of 3.28%, versus a revised 4.57% (previously 4.77%) annual gain reported for July.
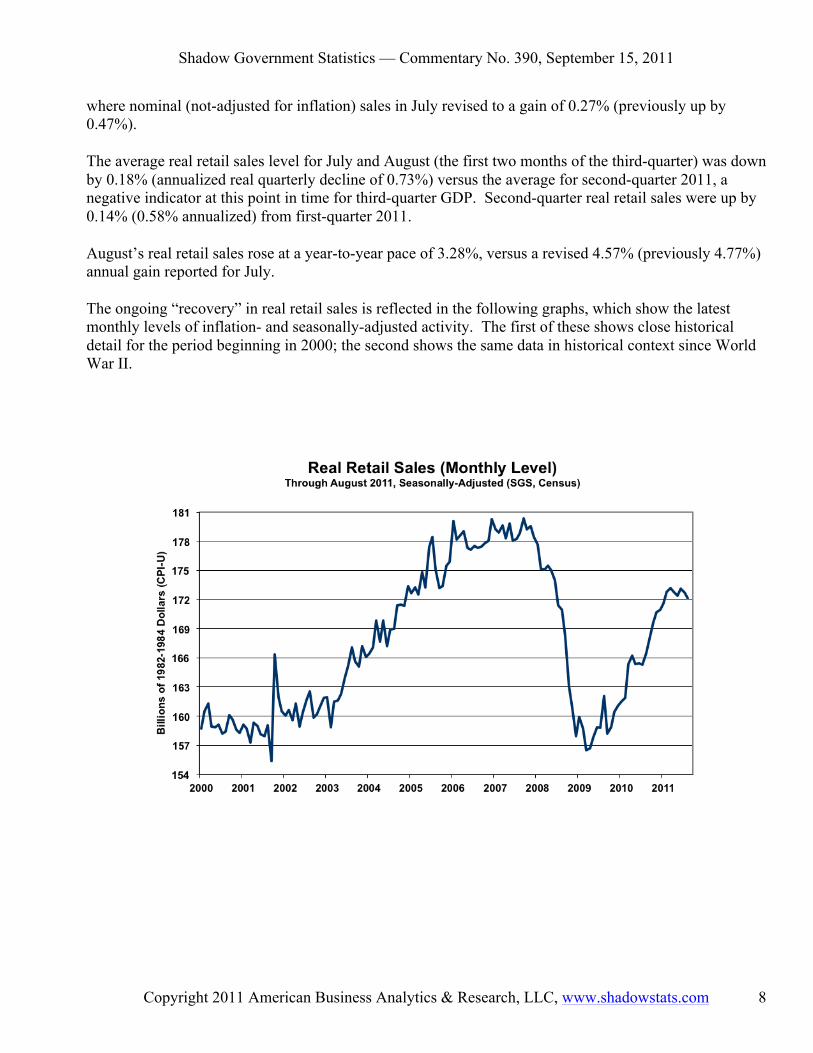
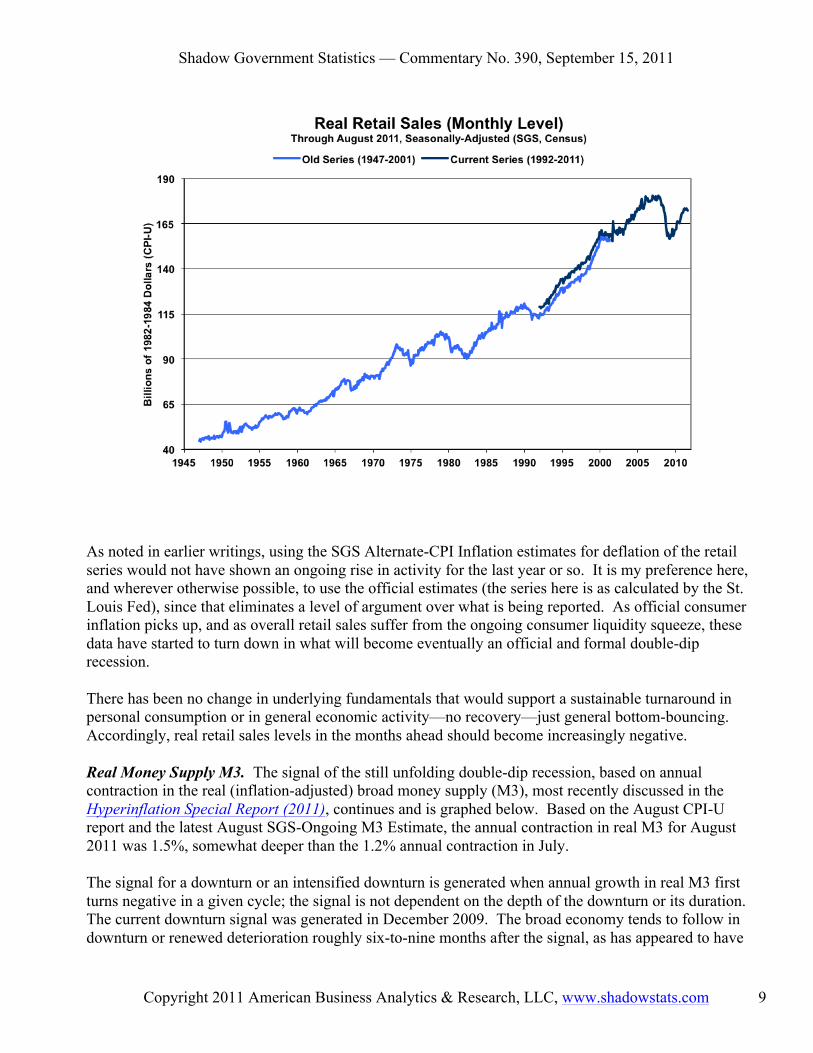
The ongoing “recovery” in real retail sales is reflected in the following graphs, which show the latest monthly levels of inflation- and seasonally-adjusted activity. The first of these shows close historical detail for the period beginning in 2000; the second shows the same data in historical context since World War II.
Shadow Government Statistics — Commentary No. 390, September 15, 2011
Copyright 2011 American Business Analytics & Research, LLC, www.shadowstats.com 9
As noted in earlier writings, using the SGS Alternate-CPI Inflation estimates for deflation of the retail series would not have shown an ongoing rise in activity for the last year or so. It is my preference here, and wherever otherwise possible, to use the official estimates (the series here is as calculated by the St. Louis Fed), since that eliminates a level of argument over what is being reported. As official consumer inflation picks up, and as overall retail sales suffer from the ongoing consumer liquidity squeeze, these data have started to turn down in what will become eventually an official and formal double-dip recession.
There has been no change in underlying fundamentals that would support a sustainable turnaround in personal consumption or in general economic activity—no recovery—just general bottom-bouncing. Accordingly, real retail sales levels in the months ahead should become increasingly negative.
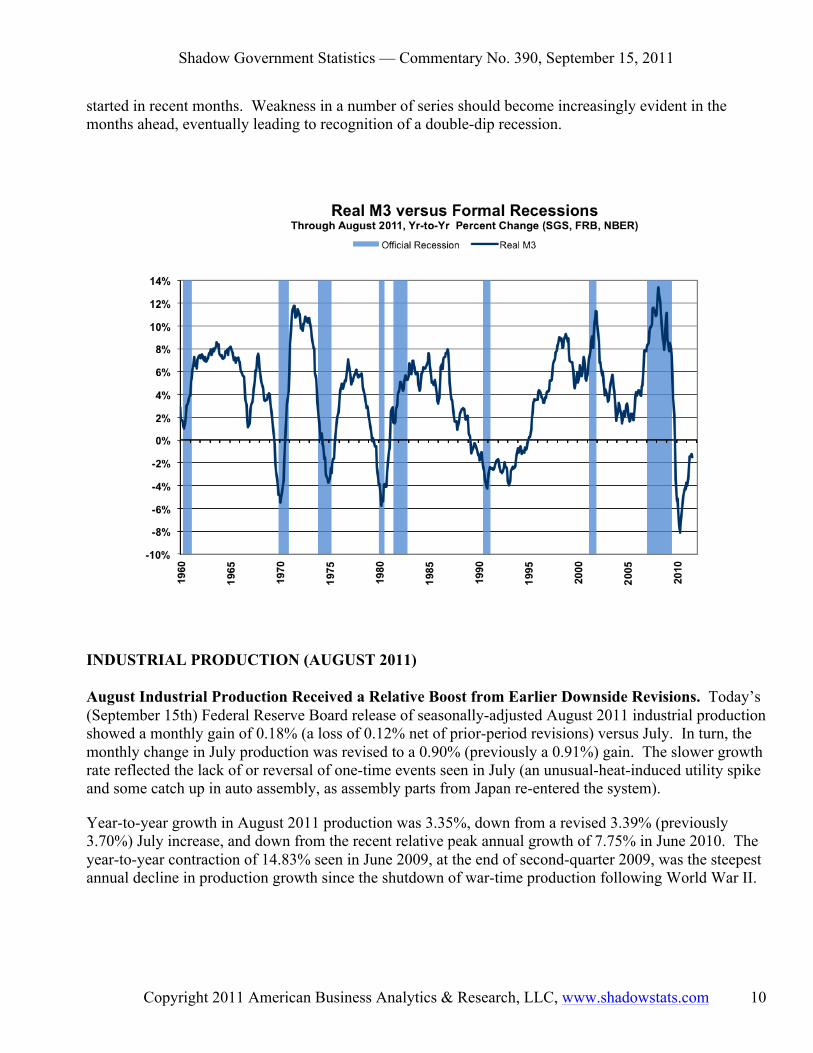
Real Money Supply M3. The signal of the still unfolding double-dip recession, based on annual contraction in the real (inflation-adjusted) broad money supply (M3), most recently discussed in the Hyperinflation Special Report (2011), continues and is graphed below. Based on the August CPI-U report and the latest August SGS-Ongoing M3 Estimate, the annual contraction in real M3 for August 2011 was 1.5%, somewhat deeper than the 1.2% annual contraction in July.
The signal for a downturn or an intensified downturn is generated when annual growth in real M3 first turns negative in a given cycle; the signal is not dependent on the depth of the downturn or its duration. The current downturn signal was generated in December 2009. The broad economy tends to follow in downturn or renewed deterioration roughly six-to-nine months after the signal, as has appeared to have
Shadow Government Statistics — Commentary No. 390, September 15, 2011
Copyright 2011 American Business Analytics & Research, LLC, www.shadowstats.com 10
started in recent months. Weakness in a number of series should become increasingly evident in the months ahead, eventually leading to recognition of a double-dip recession.
INDUSTRIAL PRODUCTION (AUGUST 2011)
August Industrial Production Received a Relative Boost from Earlier Downside Revisions. Today’s (September 15th) Federal Reserve Board release of seasonally-adjusted August 2011 industrial production showed a monthly gain of 0.18% (a loss of 0.12% net of prior-period revisions) versus July. In turn, the monthly change in July production was revised to a 0.90% (previously a 0.91%) gain. The slower growth rate reflected the lack of or reversal of one-time events seen in July (an unusual-heat-induced utility spike and some catch up in auto assembly, as assembly parts from Japan re-entered the system).
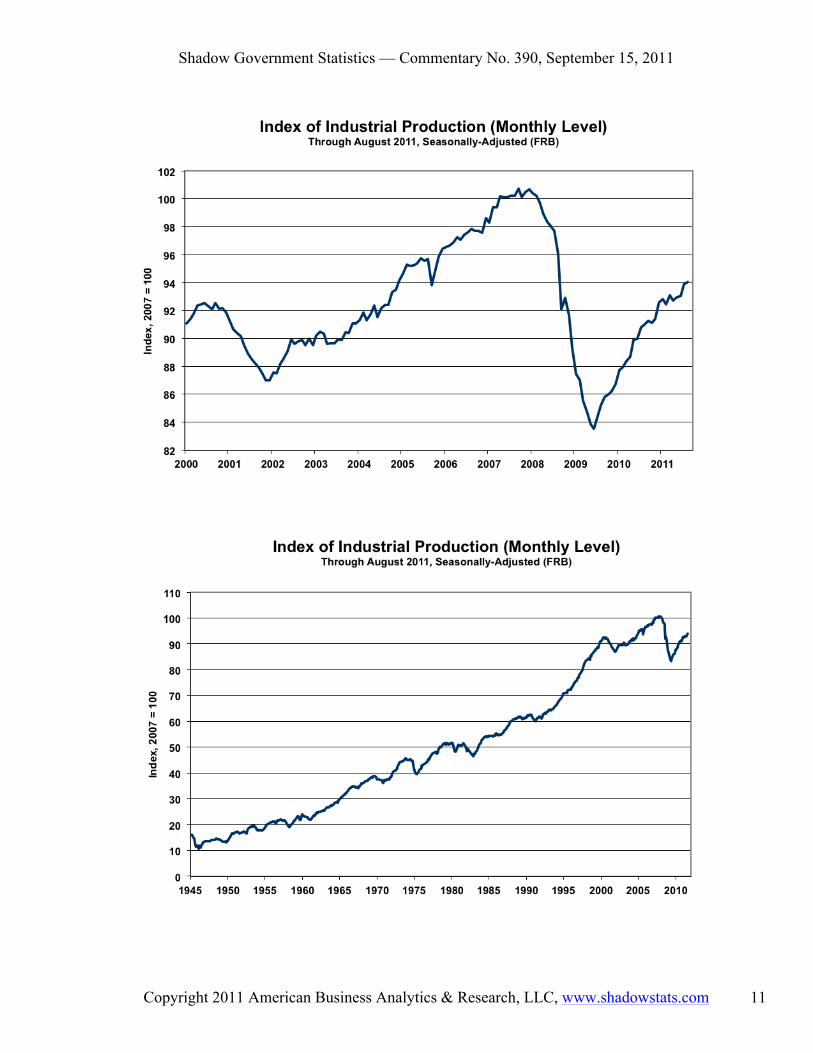
Year-to-year growth in August 2011 production was 3.35%, down from a revised 3.39% (previously 3.70%) July increase, and down from the recent relative peak annual growth of 7.75% in June 2010. The year-to-year contraction of 14.83% seen in June 2009, at the end of second-quarter 2009, was the steepest annual decline in production growth since the shutdown of war-time production following World War II.
Shadow Government Statistics — Commentary No. 390, September 15, 2011
Copyright 2011 American Business Analytics & Research, LLC, www.shadowstats.com 11
Shadow Government Statistics — Commentary No. 390, September 15, 2011
Copyright 2011 American Business Analytics & Research, LLC, www.shadowstats.com 12
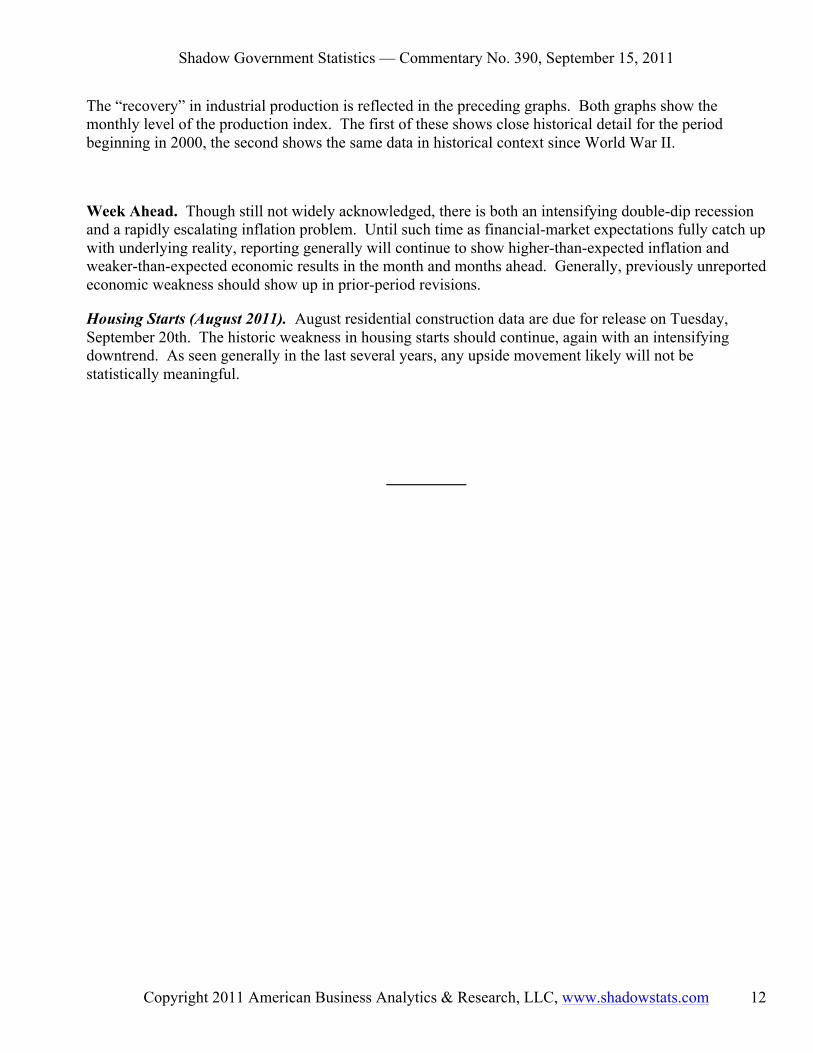
The “recovery” in industrial production is reflected in the preceding graphs. Both graphs show the monthly level of the production index. The first of these shows close historical detail for the period beginning in 2000, the second shows the same data in historical context since World War II.
Week Ahead. Though still not widely acknowledged, there is both an intensifying double-dip recession and a rapidly escalating inflation problem. Until such time as financial-market expectations fully catch up with underlying reality, reporting generally will continue to show higher-than-expected inflation and weaker-than-expected economic results in the month and months ahead. Generally, previously unreported economic weakness should show up in prior-period revisions.
Housing Starts (August 2011). August residential construction data are due for release on Tuesday, September 20th. The historic weakness in housing starts should continue, again with an intensifying downtrend. As seen generally in the last several years, any upside movement likely will not be statistically meaningful.
__________