Embed Size (px)
Citation preview
Coming to the End
Final Report
Summary
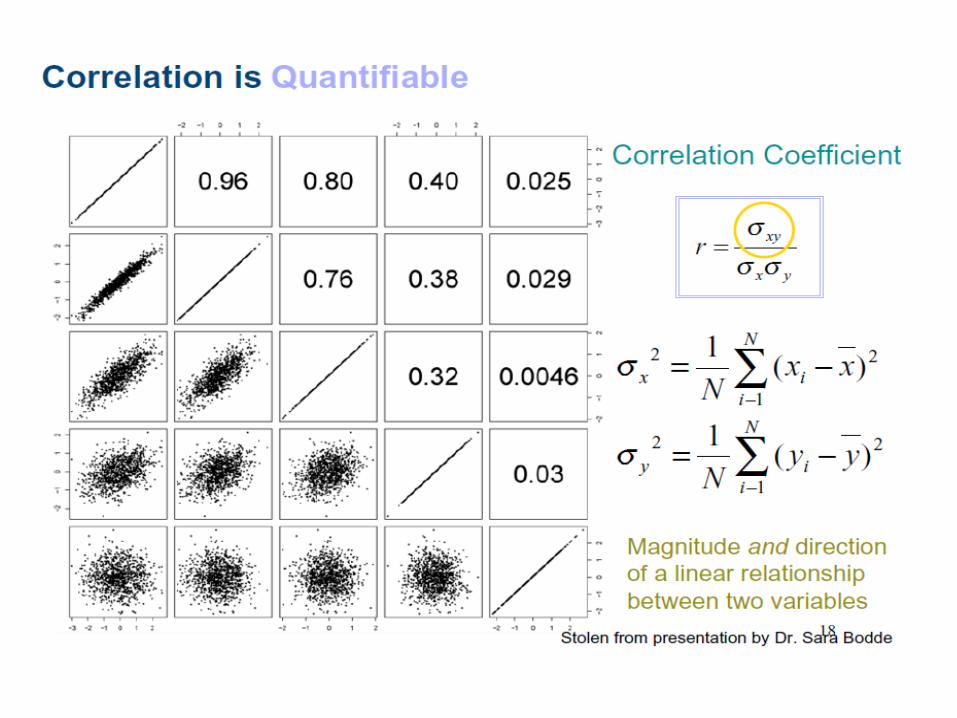
Correlation/Covariance
c2 Testing
Lecture # 7
Physics 2CL
Summer 2011

Missing Clicker Registrations
• #1551C48 #1C4B7522 #1E07CAD3
#1E085046 #1E7CA6C4 #1F2A3A0F
#21F472A7 #5D2BD6A #751A6F
#8A4E04C #8E2D13B #FAB1ABE
#FBD05B7
• Need name or cannot give credit

Formal Report• 5-6 pages
• Title page
• Introduction
• Theory
• Experiment
• Results
• Discussion

Title page
– Title page
• Experiment title
• Name, institution
• Date
• Abstract
– 150 word limit
– Succinct summary of experimental goals,
results and significance of results

Introduction
• Overall description
• Background
• Objectives

Theory
• Review theory – give references
• Predictions
• Diagrams

Experiment
• Apparatus - diagrams
• Procedure
• Make clear all tools
• Easily understood

Results
• Raw data
– Tables
– Graphs
– organization
• Analysis of data
– Sample and clear calculations
– Uncertainty analysis
– Tables, graphs
– units
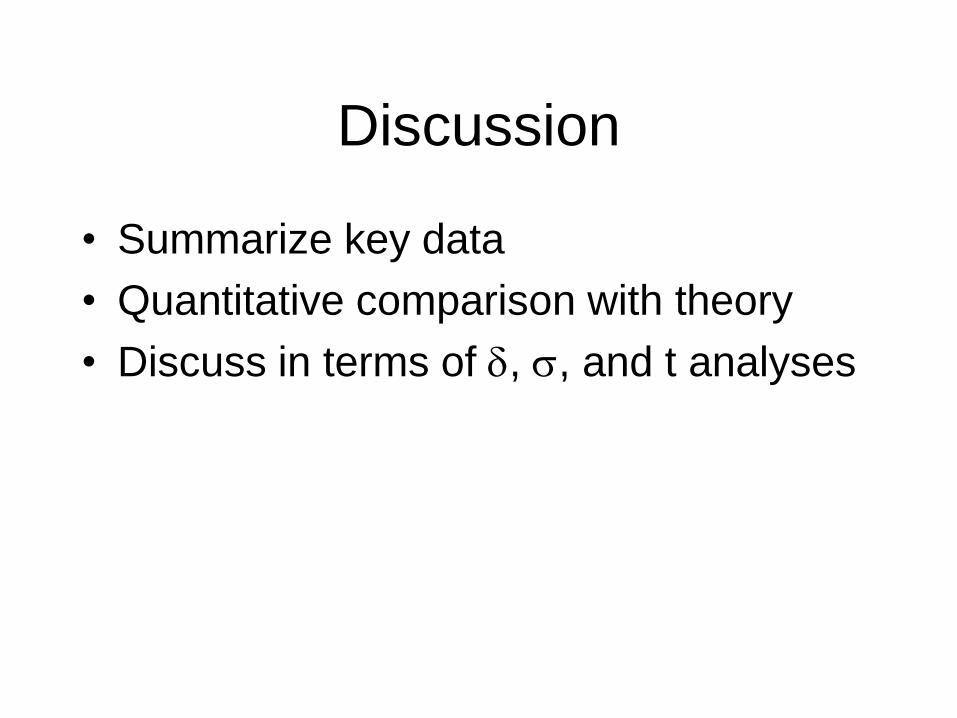
Discussion
• Summarize key data
• Quantitative comparison with theory
• Discuss in terms of d, s, and t analyses
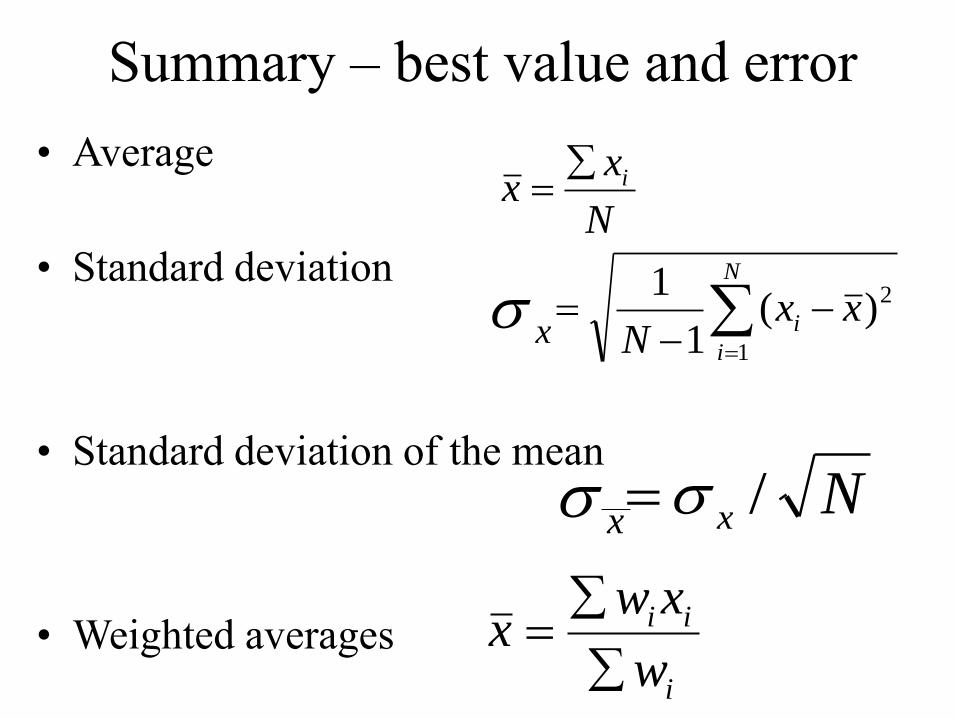
Summary – best value and error
• Average
• Standard deviation
• Standard deviation of the mean
• Weighted averages
N
xx i
N
i
i xxN 1
2)(1
1
xs
xs Nx /s
i
ii
w
xwx

Summary of propagation formulae
222 )()()( zyxq
zyxq
dddd
222 )()()( zyxq
zyxq
eeee
xq
xBq
Bxq
ee
dd
summation
multiplication
constants

From Yagil

Distributions - Normal
69.4 69.6 69.8 70.0 70.2 70.40
1
2
3
4
Num
ber
mea
sure
men
ts
height (inches)
± 1 s
± 2 s
68 %
95 %
)2)(exp(2
1)( 22
, ss
s xxxGX

Probability within 1.47 s – App. A
Rejection of data

Area under part of curve -
integration
69.4 69.6 69.8 70.0 70.2 70.40
1
2
3
4
Num
ber
mea
sure
men
ts
height (inches)
)2)(exp(2
1)( 22
, ss
s xxxGX
a
a
b
b

Area under part of curve – two
steps
69.4 69.6 69.8 70.0 70.2 70.40
1
2
3
4
Num
ber
mea
sure
men
ts
height (inches)
)2)(exp(2
1( 22 s
sxxx
x-b
a
b
-a
-b
))2)(exp(2
1 22 ss
xx
x-a
x+ax+b
12

Clicker Question # 10You measure two lens in series, each with a power of 10 ± 2 diopters (i.e. P1=P2 = 10 ± 2 diopters). What is the t-value is your measurement of the combination is 22 ± 2 diopters and the expected value is given by PTOTAL = P1
+P2?
(A) 0.5 s
(B) 1.0 s
(C) 1.5 s
(D) 2.0 s
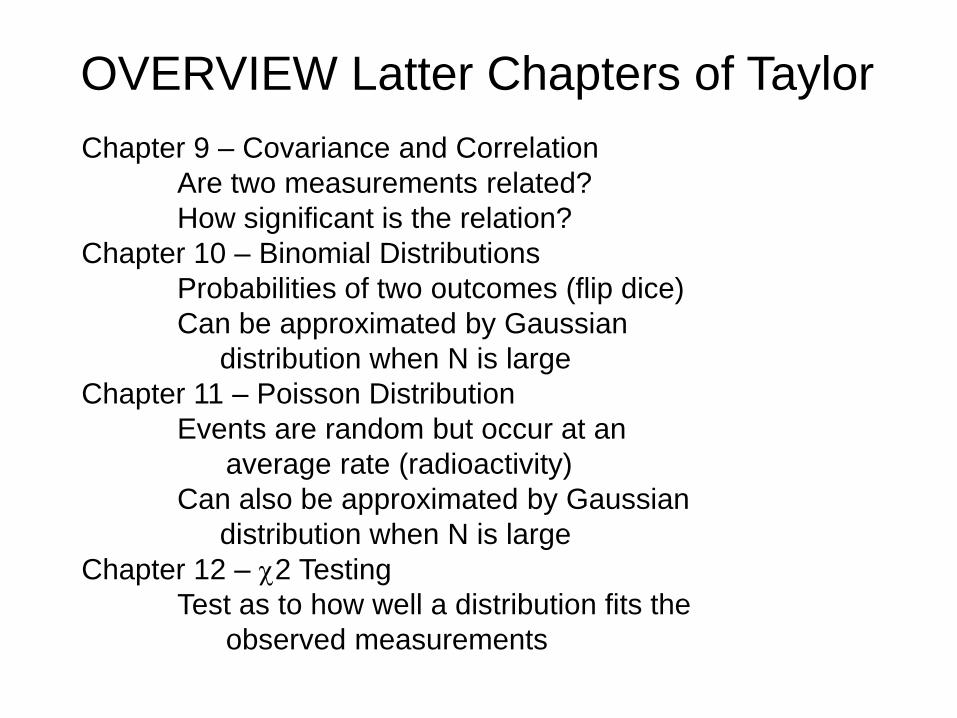
OVERVIEW Latter Chapters of Taylor
Chapter 9 – Covariance and Correlation
Are two measurements related?
How significant is the relation?
Chapter 10 – Binomial Distributions
Probabilities of two outcomes (flip dice)
Can be approximated by Gaussian
distribution when N is large
Chapter 11 – Poisson Distribution
Events are random but occur at an
average rate (radioactivity)
Can also be approximated by Gaussian
distribution when N is large
Chapter 12 – c2 Testing
Test as to how well a distribution fits the
observed measurements

Correlation and Covariance(Taylor Chapter 9)


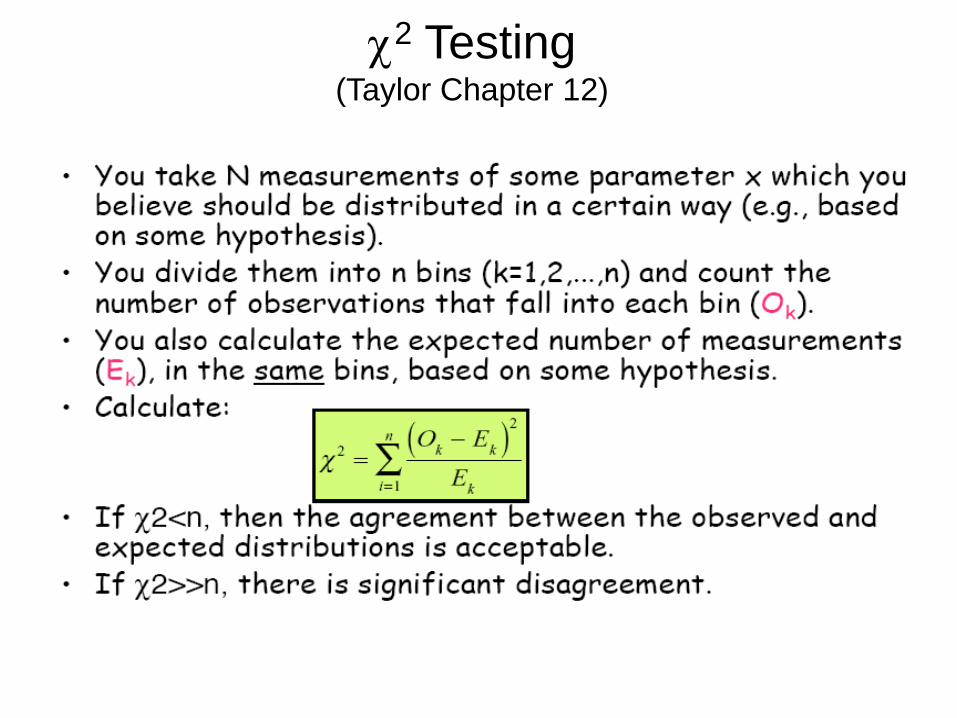
c2 Testing(Taylor Chapter 12)

Degrees of Freedom
d

Fitting Summary

Example - Dice

Application of c2 – Use of Table D
~

c2 Test for a Fit
If Prob(c2 > c2) is less than 5% - disagreement “significant”~
~
If Prob(c2 > c2) is less than 1% - disagreement “highly significant”~
~

Reminder
• Formal Report due next week
• No more Homework
• No more lectures