Embed Size (px)
Citation preview

FILTERING NOISE FROM
CORRELATION/COVARIANCE MATRICES
IMPLICATIONS FOR TRADING, ASSET ALLOCATION AND RISK MANAGEMENT
Teknavo Group Ltd. & Market Memory Trading L.L.C. (presented to QWAFAFEW August 27th 2013 meeting by Alexander Izmailov)

PRESENTATION CONTEXT: I. Presence of Intrinsic Noise in Correlation/Covariance Matrices II. Identification of Noise Characteristics Based on Random Matrix Theory III. Noise Filtering Procedure IV. Entropy as Measure of Efficacy of Noise Filtering Procedure V. Dramatic Improvements of:
• Unconstrained Markowitz Mean-Variance Optimization • Out-Of-Sample Stability
VI. Robustness with Respect to Deliberate Noise Insertion VII. Filtering Noise from Volatility VIII. Big Data Applications IX. Conclusions X. Bloomberg Application Portal: NEUTRON

“Intrinsic” noise is present in covariance matrices when the number of data points is of the same order as the number of securities .
“It can be proved that in this case estimates of covariance and correlation are subject to significant uncertainties. Say, for example, there is a portfolio of 500 securities, then the number of independent entries in the covariance matrix is 500*501/2=125,250. Even in the case when there are 1000 data points, e.g. closing prices, available for each security, the total number of data points will be 500,000, i.e. less than four (500,000/125,500<4) points per covariance matrix entry.
Therefore, estimates of covariance cannot be considered reliable. The statement that number of securities and data points are of the same order of magnitude implies that estimates of the correlation matrix are uncertain, i.e. noisy, regardless of the method by which they have been obtained.”
(Frank Fabozzi)

NOISE IN EMPIRICAL CORRELATION MATRICES
0 0.25 0.5 0.75 1 1.25 1.5 1.75 2 2.25 2.5 2.75 3 3.25 3.50
0.01
0.02
0.03
0.04
His togram1 j
f j 2 ( )
j
IMPORTANT
SPECTRA OF EMPIRICAL AND RANDOM CORRELATION MATRICES COINCIDE MORE THAN 90%

Dramatic Improvements of:
Unconstrained Markowitz Mean-Variance Optimization
2 103
6 103
0.01
0
5 103
0.01
0.015
0.02
unfilteredn
filteredn
fixedn
Excerpts of Efficient Frontiers: • Maximized Portfolio Returns at Fixed Risks and • Minimized Portfolio Risks at Fixed Returns
0 5 103
0.01 0.015 0.02
0
0.01
0.02
0.03
unfilteredn
filteredn
fixedn

Dramatic Improvements of: Out-of-Sample Stability
A. increase of the history horizon B. increase of the # of portfolio securities
A. The unfiltered stability measure is on average 340% more than the noise-filtered stability measure
B. The unfiltered stability measure ranges from 460% to 360% of the noise-filtered stability measure
60 70 80 90 1000
0.1
0.2
0.3
unfiltered 10 50 T ( )
filtered 10 50 T ( )
T
50 60 70 800
0.05
0.1
0.15
unfiltered 10 N 100 ( )
filtered 10 N 100 ( )
N

Dramatic Improvements of:
Robustness with Respect to Deliberate Noise Insertion
emp
1 2 3 4 5
1
2
3
4
5
6
7
8
9
10
11
12
1 0.721 0.197 0.454 0.341
0.721 1 0.499 0.294 0.309
0.197 0.499 1 0.188 -33.5·10
0.454 0.294 0.188 1 0.219
0.341 0.309 -33.5·10 0.219 1
0.434 0.519 0.24 -35.118·10 0.162
0.467 0.487 0.315 0.243 0.297
0.56 0.528 0.4 0.281 0.251
0.295 0.383 0.2 -3-4.414·10 0.101
0.557 0.641 0.358 0.294 0.49
0.602 0.698 0.51 0.264 0.155
0.476 0.505 0.024 0.013 ...
655.2empS
emp_filtered
1 2 3 4 5
1
2
3
4
5
6
7
8
9
10
11
12
1 0.98 0.898 0.857 0.903
0.98 1 0.932 0.832 0.901
0.898 0.932 1 0.788 0.814
0.857 0.832 0.788 1 0.787
0.903 0.901 0.814 0.787 1
0.957 0.966 0.901 0.785 0.881
0.955 0.958 0.905 0.819 0.891
0.967 0.967 0.919 0.829 0.891
0.923 0.934 0.875 0.757 0.848
0.971 0.978 0.918 0.833 0.92
0.97 0.977 0.932 0.827 0.878
0.959 0.963 0.873 0.784 ...
603.0emp
filteredS

Filtering Noise from Volatility
The horizontal axis marks index n=1,2,…,100 that enumerates securities in the name’s universe, e.g. n=5 corresponds to ABT, while the vertical axis marks volatility percentage change.
The horizontal axis marks volatility percentage change , while the vertical axis gives relative frequency in percentage points of a given volatility percentage change .
More than 30% of all names have percentage change in volatility of more than 10% as a result of noise filtering.
Phenomenon should not be ignored in trading and risk assessments.
In particular, it becomes vital in connection with option trading and hedging that are very sensitive to volatility.
0 10 20 30 40 50 60 70 80 90 1000
10
20
30
40
volatilityn
n
0 4 8 12 16 20 24 28 32 36 400
2
4
6
8
10
Relative_Frequencyn
volatilityn

Identification of the Moment of Regime Change
Time is a number of time units from the moment of regime change for securities # 2 and # 15.
DIFF is the average of absolute values of differences between correlations of each security with all others before and after regime change (artificial trend escalation for securities #2 and # 15) .
Red line: no artificial trend escalation;
Blue line: artificial trend escalation (at each next point return is increased by two standard deviations) starting at
Filtered Case
Stable in Signal
0 6 12 18 24 300
0.05
0.1
0.15
DIFF 0 ( )2
DIFF 2 ( )2
0 6 12 18 24 300
0.05
0.1
0.15
0.2
DIFF 0 ( )15
DIFF 2 ( )15
0 6 12 18 24 300
0.02
0.04
0.06
0.08
0.1
DIFF 0 ( )12
DIFF 2 ( )12

Non-Filtered Case
Stable In Noise
0 6 12 18 24 300.02
0.03
0.04
0.05
0.06
0.07
DIFF 0 ( )2
DIFF 2 ( )2
0 6 12 18 24 300.01
0.02
0.03
0.04
0.05
DIFF 0 ( )15
DIFF 2 ( )15
0 6 12 18 24 300
0.02
0.04
0.06
0.08
0.1
DIFF 0 ( )12
DIFF 2 ( )12

Big Data
1. Each data pool is chronological in nature (like financial time series). 2. Almost all data pools are already digitized or can be easily digitized. 3. Web applications are already studying dependences (correlations) between different data, e.g. is monthly oil output in Saudi Arabia is correlated with construction of production wells in Texas? 4. Correlations are extremely muddy due to ever-present “intrinsic” noise and, therefore, can convey absolutely wrong conclusions that might affect policy making on local, state and even national level.
Noise filtering from correlation matrices is needed to make sense of any big data because people collect these data with mainly one primary purpose:
to find hidden dependences in order to draw conclusions.

Applications in Big Data are Enormous:
1. for separate entities struggling to make right business decisions based on dependencies between different data, (e.g. are current sales figures and cost of labor in China highly correlated, anti-correlated or else?)
2. for government agencies attempting to identify hidden dependencies in terrorist activities in Iraq and monthly drug production in Afghanistan, etc.

Conclusions
• Detecting Correlation Diversion After filtering noise from a correlation matrix it is possible to reliably identify those names that noticeably diverge in their correlation from a common positive pattern.
• Portfolio Risk Management and Asset Allocation Experiments with Markowitz mean-variance optimization have clearly demonstrated significant advantages of usage of the noise filtered covariance.
• Pairs Trading Noise filtered correlations between some securities might become quite high implying that a long-short trade of these securities can be a low-risk transaction if one of these securities is “dear” and the other “cheap”.

Removing Noise from Volatility More than 30% of all names have percentage correction in volatility of more than 10% as a result of noise filtering. Implications: trading, option trading and hedging, that are very sensitive to volatility and risk assessments.
Determination of the Optimum History Horizon The history horizon corresponding to minimum entropy of the correlation matrix determined over this horizon is treated as the optimal history horizon with respect to the entropy measure.
Efficient Hedging of Individual Securities and Portfolios with Indexes To hedge a long position in a security(ies) with an index one has to find highly either positively or negatively correlated ETF (Index).
Big Data Analysis Noise filtering from correlation matrices is needed to make sense of any big data because people collect these data with mainly one purpose: to find hidden dependences in order to draw conclusions.
Identification of the Moment of Regime Change Noise filtering exposes regime change in stochastic behavior at a very early stage.

Bloomberg Application Portal: NEUTRON
Now available on Bloomberg Application Portal
(type: APPS NEUTRON <GO>)
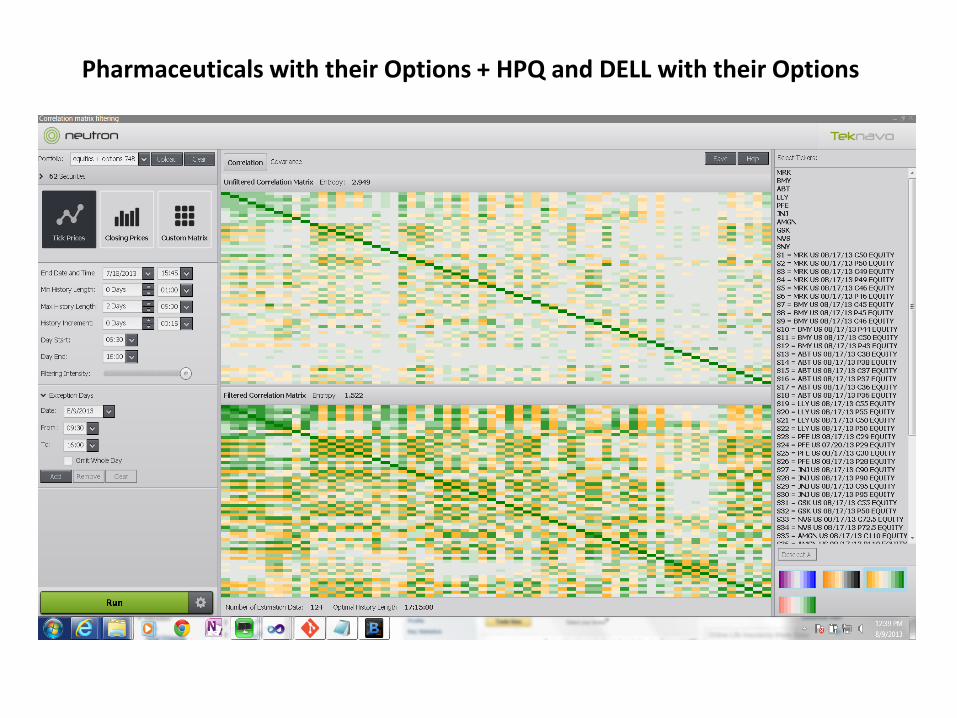
Pharmaceuticals with their Options + HPQ and DELL with their Options


![Joint Distributions, Independence Covariance and Correlation … · · 2018-02-16Joint Distributions, Independence Covariance and Correlation 18.05 Spring 2014 ... [a, b], Y takes](https://img.dokumen.tips/doc/110x75/5adf75c87f8b9ab4688c261e/joint-distributions-independence-covariance-and-correlation-distributions.jpg)