Embed Size (px)
Citation preview

COMBINED HEAT AND POWER - TECHNOLOGY
REVIEW AND ANALYSIS FOR A
RESIDENTIAL BUILDING
By
Nadine Reinert
Approved:
______________________________ ______________________________
Prakash Dhamshala James Hiestand
Professor of Engineering Professor of Engineering
(Chair) (Committee Member)
______________________________
Neslihan Alp
Professor of Engineering
(Committee Member)
______________________________ ______________________________
Will H. Sutton A. Jerald Ainsworth
Dean of the College of Engineering Dean of the Graduate School
And Computer Science
ii
COMBINED HEAT AND POWER - TECHNOLOGY
REVIEW AND ANALYSIS FOR A
RESIDENTIAL BUILDING
By
Nadine Reinert
A Thesis
Submitted to the Faculty of the
University of Tennessee at Chattanooga
in Partial Fulfillment of the Requirements
for the Degree of Master of Science
in Engineering
The University of Tennessee at Chattanooga
Chattanooga, Tennessee
November 2012

iii
Copyright © 2012
By Nadine Reinert
All Rights Reserved

iv
ABSTRACT
This thesis intends to show the current state of Combined Heat and Power Systems and
highlights the different aspects of the technologies. A manufacturer directory was developed and
the theoretical principals for planning and analysis of a CHP system are described.
In the second part, a case study is analyzed for residential application in the USA. Three
Micro-CHP systems are chosen: Otto engine, Stirling engine, and fuel cell. Also two locations,
Chicago and Atlanta, are selected to represent the northern and southern region. The calculations
are based on models in TRNSYS and BHKW Plan. The results show, that the fuel cells,
represents the heat demand in the best way. Environmentally, each system shows improvements
of over 50% CO2 reduction. From the economic perspective none of the systems can offer a
return of the more investment compared to the conventional heat and power generation.
v
TABLE OF CONTENTS
LIST OF TABLES ........................................................................................................................ vii
LIST OF FIGURES ....................................................................................................................... ix
LIST OF ABBREVIATIONS ....................................................................................................... xii
NOMENCLATURE .................................................................................................................... xiii
I. INTRODUCTION ................................................................................................................... 1
Principle of Combined Heat and Power Systems .................................................................... 3
CHP Design Considerations .................................................................................................... 4 Need for a large Spark Spread ................................................................................................. 7
II. ECONOMIC ASSESSMENT OF CHP SYSTEMS ............................................................. 11
Annuity Method..................................................................................................................... 12 Dynamic Payback Calculation .............................................................................................. 17
III. BUILDING LOAD EVALUATION ..................................................................................... 19
IV. COMPONENTS OF CHP ..................................................................................................... 22
Fuels ...................................................................................................................................... 22 Prime Movers ........................................................................................................................ 25
Steam Turbines .............................................................................................................. 27 Gas Turbines .................................................................................................................. 29
Reciprocating Engines ................................................................................................... 32 Fuel Cells ....................................................................................................................... 40 Overview of CHP Technology Characteristics .............................................................. 43
Efficiency of CHP Systems ................................................................................................... 45 Barriers to CHP Technologies ............................................................................................... 46
V. RESULTS OF CHP APPLICATION FOR A RESIDENTIAL BUILDING ........................ 50
Building Loads ...................................................................................................................... 51
Building Description ...................................................................................................... 51 Weather Data .................................................................................................................. 52 Heating and Cooling Load ............................................................................................. 53 Hot Water ....................................................................................................................... 55
vi
Electricity Demand ........................................................................................................ 56
Energy Requirements for Residential Buildings ............................................................ 58 Supply Systems ..................................................................................................................... 59
Separate Seat and Power System ................................................................................... 59
Integration of Combined Heat and Power...................................................................... 61 Economic Data ............................................................................................................... 63
Results ................................................................................................................................... 65 Performance ................................................................................................................... 65 Emission ......................................................................................................................... 73
Economics ...................................................................................................................... 75
VI. TECHNIQUES TO IMPROVE ECONOMIC BENEFITS ................................................... 81
VII. DISCUSSIONS AND CONCLUSIONS ............................................................................... 83
REFERENCES ............................................................................................................................. 86
APPENDIX ................................................................................................................................... 90
A. MARKET SURVEY – MANUFACTURER LISTS ..................................................... 90
B. BUILDING DIMENSIONS ........................................................................................... 99 C. BUILDING LOAD SIMULATION WITH TRNSYS................................................. 101
D. BHKW PLAN SOFTWARE ....................................................................................... 104 E. MONTHLY BALANCE OF HEAT AND ELECTRICITY GENERATION ............. 109 F. FUEL BALANCE: SEPARATE AND COMBINED HEAT AND POWER
GENERATION ............................................................................................................ 112
G. COST PROGRESSION OF CHP UNITS ................................................................... 114
VITA ........................................................................................................................................... 118
vii
LIST OF TABLES
1 Economic Calculation Methods [8] ........................................................................................ 11
2 Heating Values of common Fuels [50] ................................................................................... 23
3 Comparison of Fuel Cell Technologies by NREL and [11] ................................................... 40
4 Typical Performance Characteristics by CHP Technology – Part 1 [47] ............................... 43
5 Typical Performance Characteristics by CHP Technology – Part 2 [47] ............................... 44
6 Measuring the Efficiency of CHP Systems [47] ..................................................................... 46
7 Building Dimensions and Thermal Resistance ....................................................................... 52
8 Building Load Schedule .......................................................................................................... 53
9 Monthly Average Supply Temperatures in [°C] [15] ............................................................. 55
10 Total Heat and Power Demand ............................................................................................... 59
11 Average U.S. Power Plant Emissions ..................................................................................... 60
12 Performance Data Micro-CHP System ................................................................................... 63
13 Economic Data of Micro-CHP Units in Atlanta ..................................................................... 64
14 Economic Data of Micro-CHP Units in Chicago ................................................................... 64
15 Performance Results for Micro-CHP Systems in Atlanta ....................................................... 65
16 Performance Results for Micro-CHP Systems in Chicago ..................................................... 66
17 Performance Results Separate Heat and Power Production ................................................... 71
18 Performance Results Electricity Production Power Plant – Atlanta ....................................... 72
19 Performance Results Electricity Production Power Plant – Chicago ..................................... 72
viii
20 Emission Results for Atlanta .................................................................................................. 74
21 Emission Results Chicago....................................................................................................... 75
22 Economic Calculation for Separate Heat and Power Production ........................................... 76
23 Economic Results Atlanta ....................................................................................................... 77
24 Economic Results Chicago ..................................................................................................... 77
25 Percentage Reduction of Investment Cost .............................................................................. 79
26 Percentage of Energy Cost Increase ....................................................................................... 80
27 Technical Data for Steam Turbine Manufactures ................................................................... 91
28 Technical Data for Gas Turbine Manufacturers ..................................................................... 91
29 Technical Data Internal Combustion Engines ........................................................................ 93
30 Technical Data for Steam Engine Manufacturers ................................................................... 94
31 Technical Data Stirling Engine ............................................................................................... 95
32 Technical Data for Fuel Cell ................................................................................................... 97
33 Fuel Balance: Separate and Combined Heat and Power Generation – Atlanta .................... 113
34 Fuel balance: Separate and Combined Heat and Power Generation – Chicago ................... 113

ix
LIST OF FIGURES
1 Comparison of Combined and Separate Heat and Power Generation ...................................... 3
2 Example of Annual Heating Load Duration Curve .................................................................. 5
3 Heat oriented Operation [34] .................................................................................................... 8
4 Power oriented Operation [34].................................................................................................. 9
5 Operating Strategies for CHP Systems [21] ........................................................................... 10
6 Overview CHP Technologies ................................................................................................. 26
7 Process for Back-Pressure Steam Turbine (left) and Extraction Steam Turbine (right) ......... 28
8 Organic Rankine Cycle ........................................................................................................... 29
9 Simple Gas Turbine Process (left), Steam injected Gas Turbine Process (right) ................... 30
10 Diesel and Gas Engine Process ............................................................................................... 33
11 Steam Engine Process ............................................................................................................. 36
12 Stirling Engine Process ........................................................................................................... 37
13 Stirling Engine Process Steps ................................................................................................. 38
14 Fuel Cell Process..................................................................................................................... 41
15 Heating and Cooling Load Atlanta ......................................................................................... 54
16 Heating and Cooling Load Chicago ........................................................................................ 54
17 Hot Water Demand ................................................................................................................. 56
18 Electricity Demand over 24h .................................................................................................. 57
19 Annual Electricity Consumption for Atlanta and Chicago ..................................................... 58
x
20 Separate Heat and Power Supply ............................................................................................ 60
21 CHP integrated System ........................................................................................................... 62
22 Annual Heat Load Duration Curve: Atlanta - Otto Engine .................................................... 68
23 Annual Heat Load Duration Curve: Chicago - Otto Engine ................................................... 68
24 Annual Heat Load Duration curve: Atlanta – Stirling Engine ................................................ 69
25 Annual Heat Load Duration Curve: Chicago – Stirling Engine ............................................. 69
26 Annual Heat Load Duration Curve: Atlanta – Fuel Cell ........................................................ 70
27 Annual Heat Load Duration Curve: Chicago - Fuel Cell ....................................................... 70
28 Fuel Savings Separate compared with Combined Heat and Power Generation ..................... 72
29 CO2 Reduction for Micro-CHP Units ..................................................................................... 74
30 Avoided Cost if no CHP is acquired ....................................................................................... 78
31 Savings if no CHP acquired and Return of Invest within 15 Years........................................ 80
32 Building Dimensions [16] ..................................................................................................... 100
33 TRNSYS Model for Heating and Cooling Load Simulation ................................................ 103
34 BHKW Plan Program ........................................................................................................... 106
35 Heat and Electricity Results: Atlanta - Otto Engine ............................................................. 110
36 Heat and Electricity Results: Atlanta - Stirling Engine ........................................................ 110
37 Heat and Electricity Results: Atlanta - Fuel Cell .................................................................. 110
38 Heat and Electricity Results: Chicago - Otto Engine............................................................ 111
39 Heat and Electricity Results: Chicago - Stirling Engine ....................................................... 111
40 Heat and Electricity Results: Chicago - Fuel Cell ................................................................ 111
41 Economic Calculation Atlanta - Otto Engine ....................................................................... 115
42 Economic Calculation Atlanta - Stirling Engine .................................................................. 115

xi
43 Economic Calculation Atlanta - Fuel Cell ............................................................................ 116
44 Economic Calculation Chicago - Otto Engine ...................................................................... 116
45 Economic Calculation Chicago - Stirling Engine ................................................................. 117
46 Economic Calculation Chicago - Fuel Cell .......................................................................... 117
xii
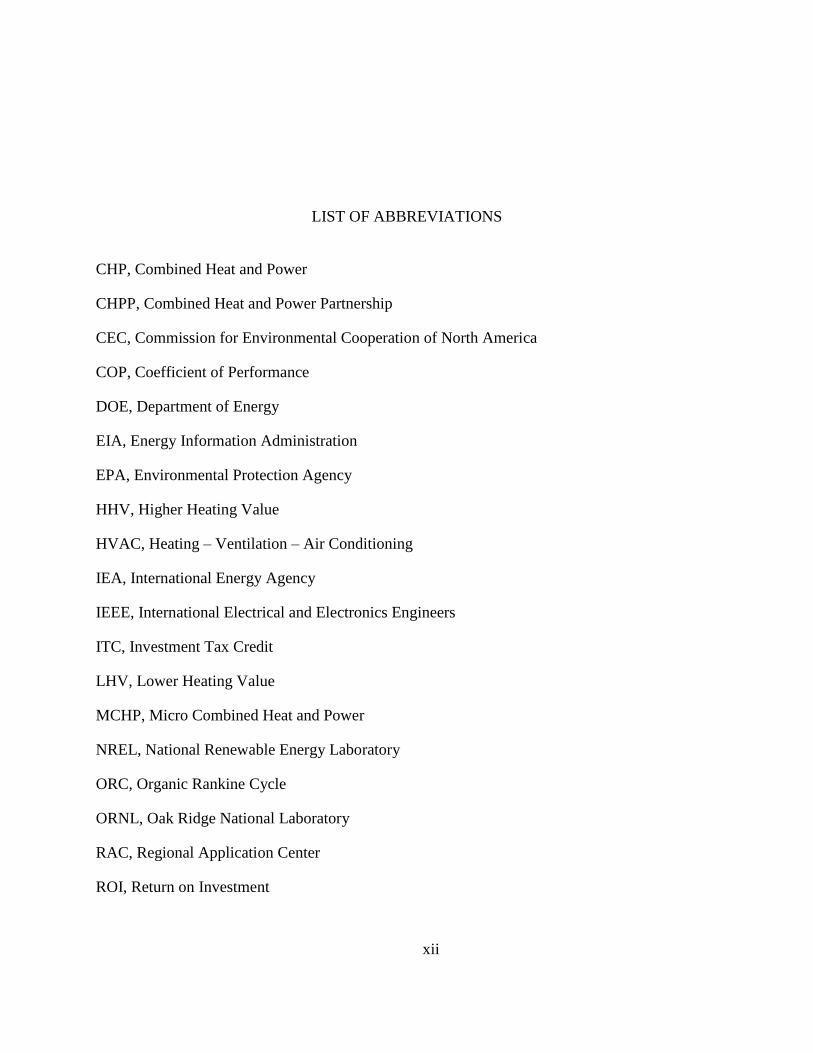
LIST OF ABBREVIATIONS
CHP, Combined Heat and Power
CHPP, Combined Heat and Power Partnership
CEC, Commission for Environmental Cooperation of North America
COP, Coefficient of Performance
DOE, Department of Energy
EIA, Energy Information Administration
EPA, Environmental Protection Agency
HHV, Higher Heating Value
HVAC, Heating – Ventilation – Air Conditioning
IEA, International Energy Agency
IEEE, International Electrical and Electronics Engineers
ITC, Investment Tax Credit
LHV, Lower Heating Value
MCHP, Micro Combined Heat and Power
NREL, National Renewable Energy Laboratory
ORC, Organic Rankine Cycle
ORNL, Oak Ridge National Laboratory
RAC, Regional Application Center
ROI, Return on Investment

xiii
NOMENCLATURE
A Area [m2]
a year
CLF Cooling load factor
CLTD Cooling load temperature difference [°C]
cp Specific heat [kJ/kgK]
H.G. L Latent heat gain [kW]
H.G. S Sensible heat gain [kW]
No Number of people
Mass flow rate [kg/s]
Q Heat capacity [kW]
QL Latent Load [kW]
QS Sensible Load [kW]
Qtotal Total heat capacity [kW]
P Perimeter [m]
PL Power Lamp [W]
SC Shading Coefficient
SHGF Solar heat gain factor [kWh/m2]
Taverage Average room temperature [°C]
Tg Ground temperature [°C]
Ti Inside temperature [°C]

xiv
To Outside temperature [°C]
Ts Supply temperature [°C]
Tset Set temperature [°C]
U Overall heat transfer coefficient [W/m2K]
Volume flow rate [m3/s]
wi Inside humidity [g/m3]
wo Outside humidity [g/m3]
1
CHAPTER I
I. INTRODUCTION
Economic health of a nation primary depends upon the mineral and energy resources and
agricultural production along with many other factors. The per capita consumption of electricity
in a community plays a vital role in improving the living conditions, industrial production, and
thus the standard of living. More than 70% of the electricity produced in most of the nation is
provided by the use of fossil fuels, such as coal and natural gas. Combustion of these fuels
produces greenhouse gases such as CO2, NOX or SO2. These gases are found to cause the global
warming phenomenon. Climate change and extreme weather patterns are attributed to global
warming. The energy required for heating and cooling of buildings in industrialized nations is
significant, and 72% of electricity produced in the U.S. is utilized for HVAC operation of
buildings. The electricity demand is increasing 1% per year. Since 2010, the U.S. has become the
second largest consumer of electricity after China. The average annual electricity for U.S.
residential consumers is 11,496 kWh.
The current situation in the energy sector is characterized by a constant rise in energy
consumption on the one hand, and diminishing resources of fossil fuels on the other. This allows
for a constant rise in costs. Furthermore, the rise in energy consumption has a negative impact on
the environment due to increased greenhouse gas emissions. In order to overcome these
problems, intense efforts are needed for energy consuming devices. A low cost and more
efficient renewable energy conversion has a key role to address these needs in the future. A CHP
2
system uses various fuels and has a potential to make a quantum leap in energy efficiency by
producing forms of energy outputs, the shaft power and heat energy.
The major portion of this energy consumption is typically utilized in heating and cooling
of building space and for producing domestic hot water. A CHP system primarily consists of a
prime mover such as steam or gas turbine, or reciprocating engine, and a heat energy recovery
system. Depending on the capacity of the system and type of fuel used, the components
employed in the CHP system vary. Generally reciprocating engines are used for small capacity
units. The CHP system is capable of providing heat energy and electric power simultaneously
from a single fuel source, thus increasing overall energy efficiency of the CHP system. In
winters, the system of appropriate size is capable of providing sufficient heat energy to meet the
building heating loads, domestic hot water and electric power demand. In certain cases, the heat
energy produced from CHP systems can also be employed as an input to an absorption chiller to
meet the cooling load during the summer. Due to increase in temperature observed in recent
times during summers, the utilities are under pressure to meet the electrical demand of their
customers with a potential for brownouts and blackouts to occur during the time of peak loads.
CHP systems can serve as an efficient, side-management tool to meet the electrical loads. CHP
systems will also serve as a valuable and powerful tool for implementation of small grid
applications.
3
Principle of Combined Heat and Power Systems
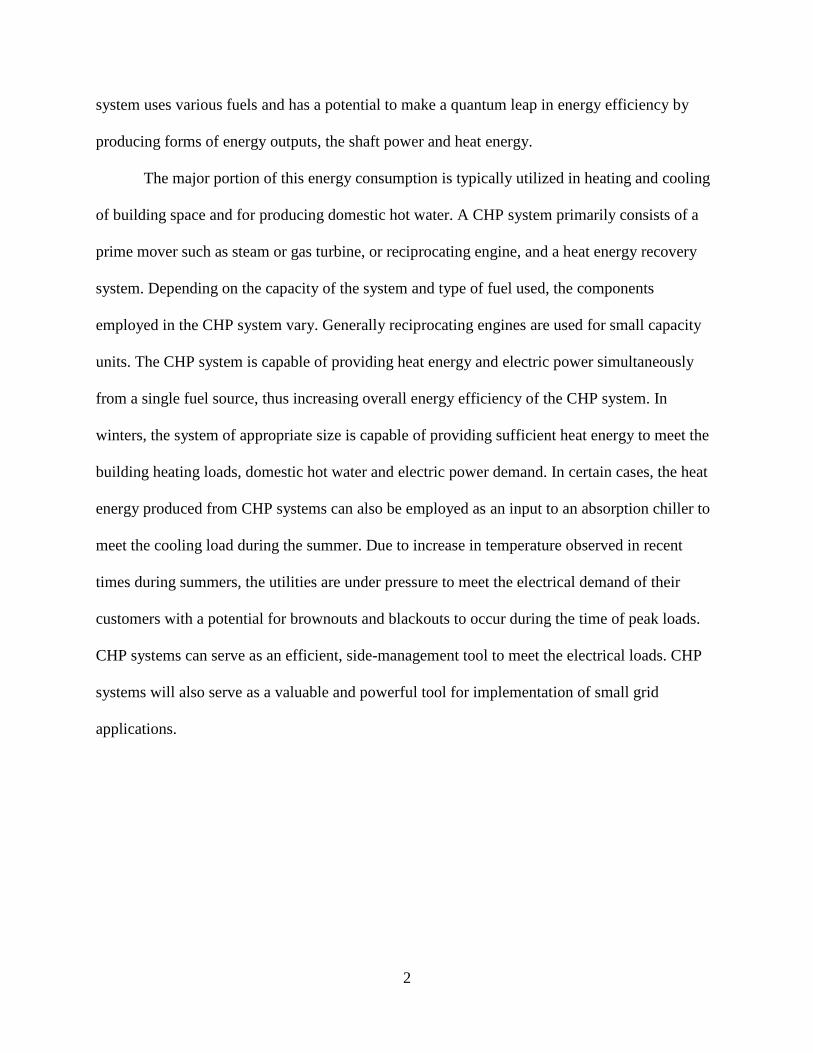
The combined heat and power generation is the simultaneous conversion of energy to
produce electricity or mechanical shaft work and useful heat energy by use of one primary fuel
source.
Figure 1 Comparison of Combined and Separate Heat and Power Generation
The mechanical shaft work produced from thermodynamic processes occurring in the
engine is converted into electrical power by use of an electrical generator. The heat energy
generated by this engine is typically discharged into the environment and thus wasted. The
combined heat and power recovers this heat energy which can be employed for space heating,
hot water, or chilled water through use of an absorption chiller for space cooling. Generation of
two energy forms (electricity and heat, in form of steam or hot water) from one single primary
source is also called co-generation. Generation of three different forms of energy is called tri-

4
generation, i.e. generation of electricity, steam or hot water and chilled water. The fuel
consumption of CHP systems compared to separate production of electricity and hot water or
steam is more efficient. Exclusive power generation has efficiencies around 30 to 45%, but CHP
has an overall efficiency up to 90% and higher, as shown in Figure 1, thereby reducing the
greenhouse emissions. The difference in efficiency can be higher for larger CHP plants.
CHP Design Considerations
Proper sizing and design are crucial criteria for the use of CHP and thus for the economic
calculation of such a system. If a CHP system is too small, the energy cost savings cannot be
realized. However, if it is too large, it has to run often under part-load conditions. Such part-load
conditions result in lower efficiency or time mode operation, which means frequent start and stop
modus of the unit. Different boundary conditions generally require individual design and
planning of a CHP system. Therefore, technical and economic parameters are used for the exact
analysis of a CHP plant.
The approach to calculate heating and cooling load is different for existing and new
buildings. New buildings can be simulated with software when the results are at hourly demand
values. The applicable considerations and calculations are described in more detail in chapter III.
For an existing building a simulation can also be performed if all necessary data is known.
Bigger buildings, especially commercial or industrial buildings, use a building monitoring
system, in which a history of consumption data is reported. Unfortunately, this is often not the
case for smaller buildings. A review of the utility bills is often helpful. However, it only gives a
vague monthly break down.
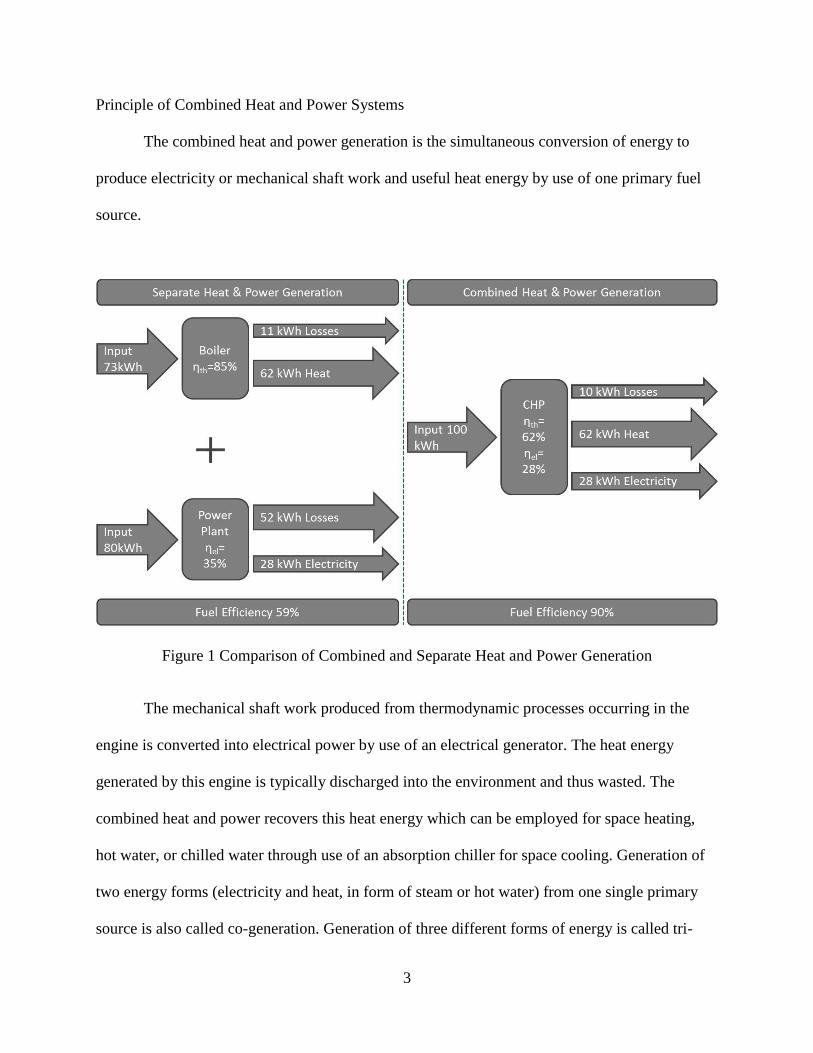
Based on the integration of hourly heating values, an annual load curve can be obtained.
An example is shown in Figure 2. All performance values for the year (e.g. hourly values) are
5
sorted according to size (e.g. thermal load). This relationship is referred to as an annual load
duration curve. The units on the y-axis represent the percentage of the maximum heat demand,
the units on the x-axis represent the hours over the year. The area located below the line indicates
the annual heat demand. The design of a cogeneration plant for 100% of the maximum heat load
is irrational; a recommended value is 30% of the maximum load. However, electricity, which can
then be used or fed into the public grid, is produced only during these operating hours. The
recommended value is about 6,000 operating hours per year to generate enough power to be able
to refinance the CHP.
Figure 2 Example of Annual Heating Load Duration Curve
Classification can be made in the area of the operation design of CHP systems. Generally,
three different design variants are possible [23]:

6
Power-oriented
Heat-oriented
Cost-based
In a Power-oriented design, the system is created with adjustments to the power demand.
If the electricity demand deviates from the electrical output, the CHP unit can be reduced. If not,
the overly high or low power supply gets compensated by the public grid. In this case the heat
production is the by-product.
Conversely, for the heat-oriented design, operation is adjusted to the heat demand. If the
heat output is lower than the demand, an auxiliary system has to start up. If the heat demand is
less than the thermal output of the CHP unit, it can either be reduced to part-load conditions,
switched on and off, or generate excess heat. This excess heat can be stored to a certain degree in
thermal storage tanks. However, excess heat should be avoided, as discharging the product into
the environment reduces the efficiency of the system.
The cost-based design considers the case with minimum overall costs. CHP systems are
most efficient under full load, thus a system design to cover the base load should be created. The
heat peak load is covered with an additional boiler and the electrical peak load is covered by the
grid. Generally, full load hours are desirable to allow the high investment costs to be paid back
as soon as possible.
Another important aspect of CHP is the load control, which can be realized as cycle mode
or rolling mode. If operating in tact mode, the system either operates at rated load or is turned
off. If a system operates in rolling mode, the CHP device is not able to operate under full load at
all times. When the demand decreases, the system operates only in the partial load range which,

7
due to technical and economic reasons, is only possible within certain limits. Thus, the efficiency
of the plant is reduced.
Furthermore, three different supply concepts are distinguished:
parallel
emergency power
standalone operation
In general, micro-CHP units are operated in parallel with the power grid. This means that
the CHP plant feeds excess power into the grid, and receives electricity from the grid when the
demand is higher.
If there is no connection available to the grid, CHP units can be driven in a standalone
mode. Typical applications are isolated homes, shelters, etc. The CHP provides the building with
electricity and heat. In this case, the electricity supply has priority. In addition to the CHP system
an inverter and a battery are required for standalone operations.
The emergency power concept is a combination of parallel and standalone operations. In
power mode, the CHP unit operates in parallel with the main power source while the network is
available. If a failure occurs in the grid, the CHP takes over the power supply. The CHP will
initially be separated by an external isolating switch from the network. The CHP is turned off
and then started up again in standalone operation. This type of electrical integration is used
especially for applications where power and heat are essential.
Need for a large Spark Spread
CHP units are characterized by the simultaneous generation of usable heat and power in a
constant proportion. As a result, two types of operation modes for CHP systems are possible:

8
Heat-oriented
Power-oriented
In a heat-oriented mode, the cogeneration system will rise to its upper limit of the heat
demand curve; the peak boiler covers the remaining heat demand. The generated electricity is
either used within the same time or fed into the public power grid. The demand for electricity
during the downtime of the CHP and any additional requirements are supplied by the electric
grid. In Figure 3, the purpose of the buffer can be recognized. It allows continued operation of
the cogeneration system at specific load when the demand for heat goes down. If the buffer is
fully charged, the performance limit of the CHP will be reduced. If that lower limit is reached,
the CHP is turned off and the heat demand is provided by the thermal storage tank.
Figure 3 Heat oriented Operation [34]
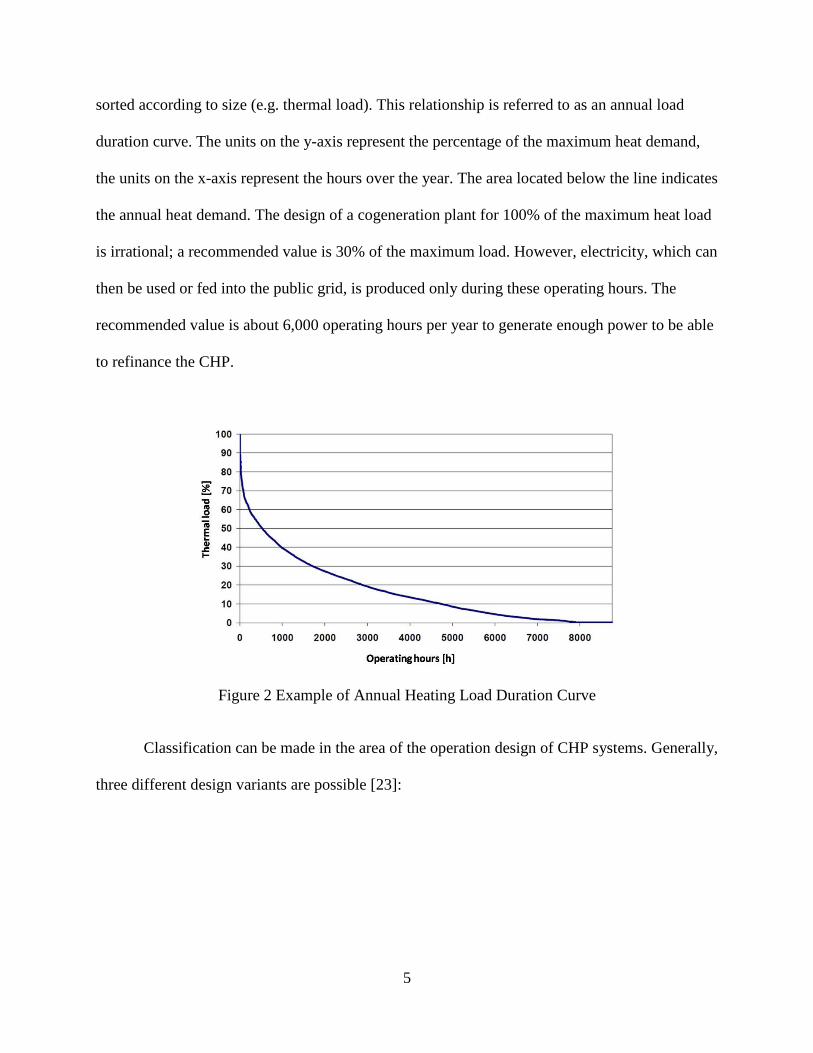
The design of the CHP unit for power-oriented operation is based on the power demand
and is similar to a heat-oriented mode. The CHP operates to its upper limit of the power demand
curve, and an additional demand is compensated by the public grid, see Figure 4. Examples of
power-oriented operations can be found mostly in the commercial sector. The CHP may form the
9
central part of the operational power supply if an expensive electric power demand is present.
From an ecological perspective, this mode is only useful if the heat generated can be completely
used. Excess heat must be stored in a thermal storage tank or dissipated to the environment.
Figure 4 Power oriented Operation [34]
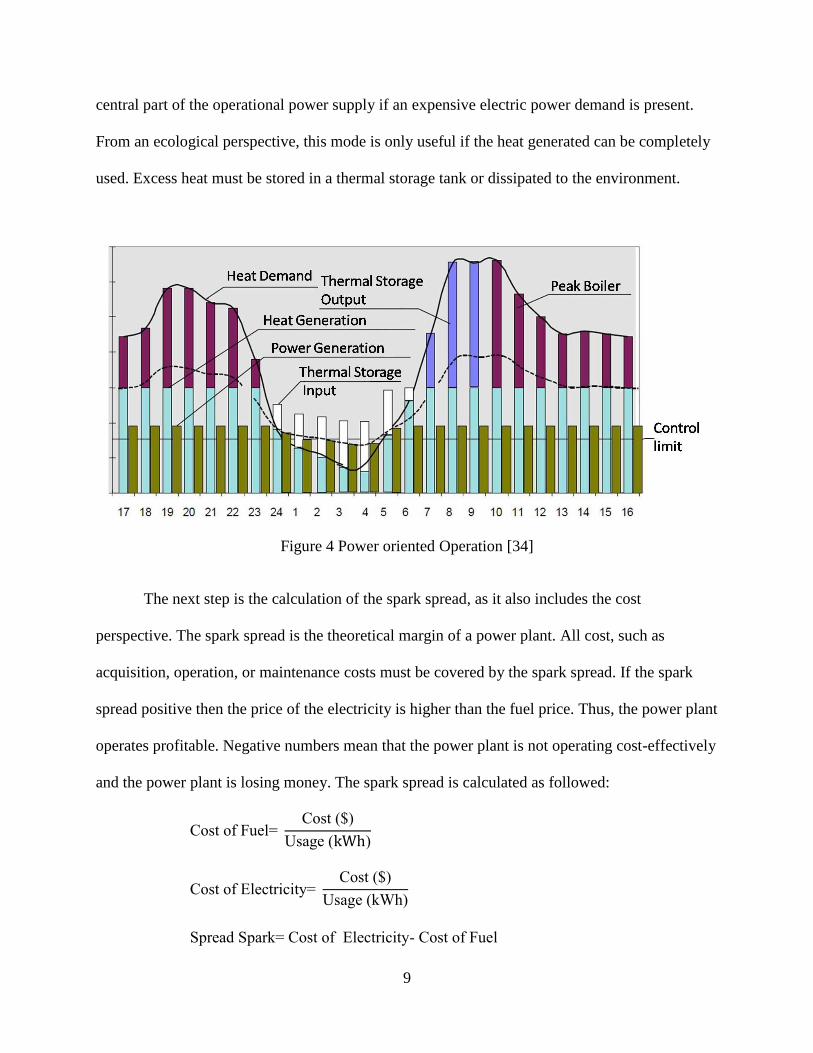
The next step is the calculation of the spark spread, as it also includes the cost
perspective. The spark spread is the theoretical margin of a power plant. All cost, such as
acquisition, operation, or maintenance costs must be covered by the spark spread. If the spark
spread positive then the price of the electricity is higher than the fuel price. Thus, the power plant
operates profitable. Negative numbers mean that the power plant is not operating cost-effectively
and the power plant is losing money. The spark spread is calculated as followed:
10
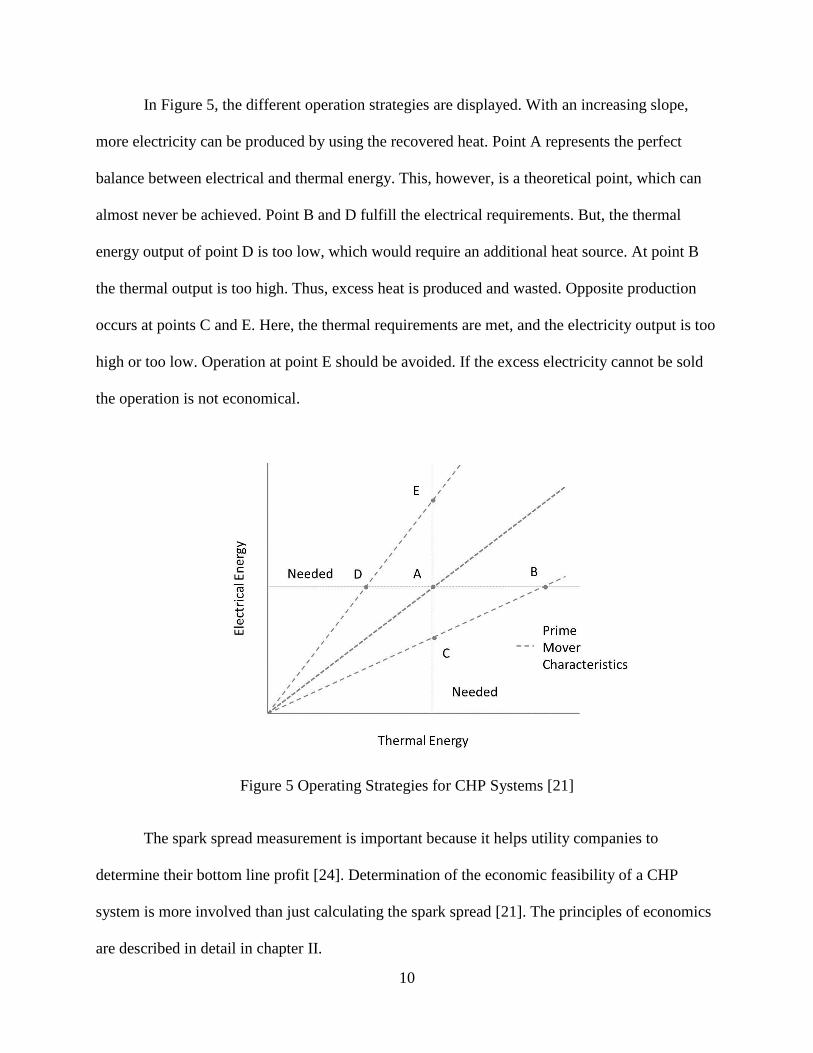
In Figure 5, the different operation strategies are displayed. With an increasing slope,
more electricity can be produced by using the recovered heat. Point A represents the perfect
balance between electrical and thermal energy. This, however, is a theoretical point, which can
almost never be achieved. Point B and D fulfill the electrical requirements. But, the thermal
energy output of point D is too low, which would require an additional heat source. At point B
the thermal output is too high. Thus, excess heat is produced and wasted. Opposite production
occurs at points C and E. Here, the thermal requirements are met, and the electricity output is too
high or too low. Operation at point E should be avoided. If the excess electricity cannot be sold
the operation is not economical.
Figure 5 Operating Strategies for CHP Systems [21]
The spark spread measurement is important because it helps utility companies to
determine their bottom line profit [24]. Determination of the economic feasibility of a CHP
system is more involved than just calculating the spark spread [21]. The principles of economics
are described in detail in chapter II.
11
CHAPTER II
II. ECONOMIC ASSESSMENT OF CHP SYSTEMS
The purchase of a CHP plant, even in the low power range, is typically a more expensive
investment than a regular heat supply system. Therefore, the capital expenditure budget needs to
be studied before making such an investment.
A characteristic of an investment is that cash flow is generated and financial resources are
borrowed and paid off on either mid to long term ranges. To assess the financial impact of an
investment, different calculation methods are established. A distinction is made between static
and dynamic methods of investment appraisals. Table 1 displays the different methods.
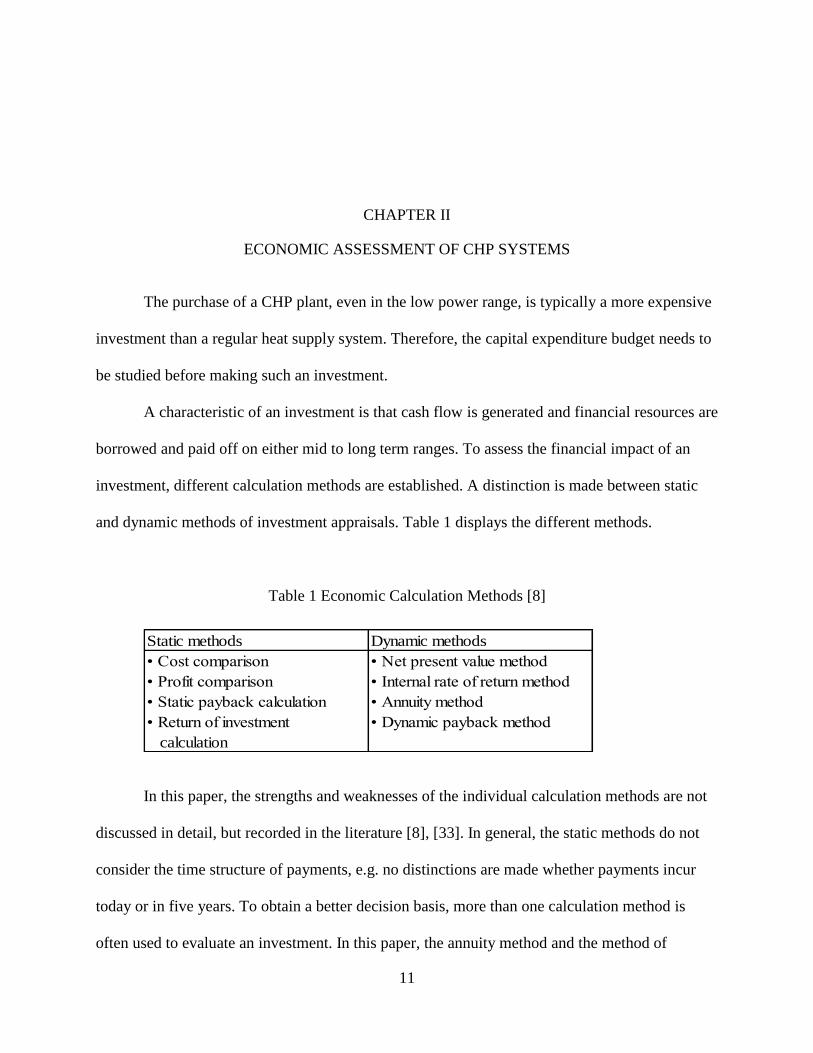
Table 1 Economic Calculation Methods [8]
Static methods Dynamic methods
• n • N n v
• P n • In n n
• b n • Ann
• R n nv n
calculation
• D n b
In this paper, the strengths and weaknesses of the individual calculation methods are not
discussed in detail, but recorded in the literature [8], [33]. In general, the static methods do not
consider the time structure of payments, e.g. no distinctions are made whether payments incur
today or in five years. To obtain a better decision basis, more than one calculation method is
often used to evaluate an investment. In this paper, the annuity method and the method of
12
dynamic payback are described in detail, since these two methods give the most detailed
understanding of the economic situation.
Annuity Method
The main idea of the annuity is to evenly distribute payments associated with an
investment during the operations lifetime [8]. The annuity method allows the combination of
one-time payments / investments and current payments with the help of an annuity factor, during
the observation period, T. The payments represent the following costs: fixed capital costs, usage
costs, operating costs, and others.
Depending on the project and the operation, the deposit payments may have the same
results as the disbursements described above. This is especially true for capital-linked deposits, if
such subsidies or grants are awarded for investments or for tax benefits. The difference between
the deposit annuity and disbursement annuity gives the cumulative annuity. Small-scale CHP
plants are usually not designed for the goal of generating profit. Therefore, it is the rule that the
best system is the one which costs the least.
For CHP systems the assignment of separate costs for electricity and heat is
inappropriate. For an economic analysis, the capital, fuel and operating costs and revenues from
the CHP operation are compared with the use of a separate power and heat supply. The annual
heat production cost is measured from the annual cost of the CHP system after deducting the
value of its produced electricity. The annual costs represent the sum of fixed capital costs, usage
costs, operating costs, and other costs. The usage and operating costs also depend on how much
of the CHP production is used to cover the demand for heat and electricity.
13
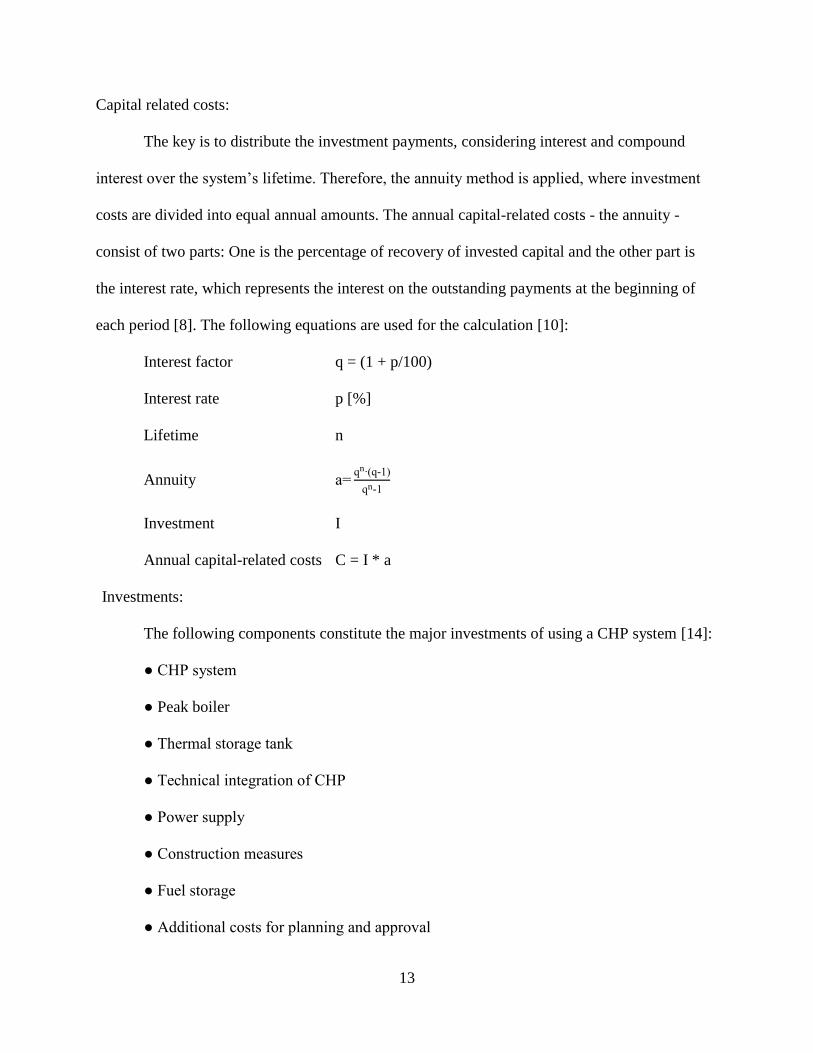
Capital related costs:
The key is to distribute the investment payments, considering interest and compound
n v ’ . T , nn , w nv n
costs are divided into equal annual amounts. The annual capital-related costs - the annuity -
consist of two parts: One is the percentage of recovery of invested capital and the other part is
the interest rate, which represents the interest on the outstanding payments at the beginning of
each period [8]. The following equations are used for the calculation [10]:
Interest factor q = (1 + p/100)
Interest rate p [%]
Lifetime n
Annuity n -
n-
Investment I
Annual capital-related costs C = I * a
Investments:
The following components constitute the major investments of using a CHP system [14]:
● HP
● Peak boiler
● T n
● T n n n HP
● P w
● n n
●
● A n nn n n v

14
It should be noted that the components of an existing heat supply system can be used.
Thus, for example, an existing boiler may be used as a peak boiler, or an existing hot water tank
can be integrated into the CHP system.
Useful lifetime:
For the calculation of the annuity of the individual investment, the useful lifetime is
critical. The calculated lifetime ends before required repair, overhaul and maintenance costs for
the renovation of individual system components are more expensive than the acquisition cost.
From a technical point of view it makes sense to put the useful life equal to the lifetime. Under
the security aspect of an investment, however, the choice of a shorter useful life, and therefore
the distribution of costs over a shorter period are reasonable to minimize the risks [34].
Interest rate:
In addition to the life span, the discount rate is of particular importance for the economic
analysis. The amount of the discount rate depends on the type of financing for the planned
investment. In a fully self-financed project, the discount rate is set at least at the level of the
interest rates of a particular capital market investment. The interest rate for debt financing
determines the lower limit, if money needs to be borrowed. Since the resulting investments and
the useful time can be risky, an additional risk factor can be added in both cases. Mixed
financing from equity and debt can be used with an interest rate that is set by the discount rate
for equity as well as the invested capital. [8] The discount rate and the useful lifetime are
determined based on the economic analysis and the specific point of view of the planner or
operator.
15
Consumption related costs:
The consumption related costs, also referred to as fuel costs, are composed of the annual
fuel costs for the CHP system and the boiler, as well as the annual power supply costs. When
natural gas is chosen as fuel some tax systems may include a demand charge in addition to a pure
energy price.
Operating costs:
The annual operating costs include maintenance and personnel costs. The maintenance
refers to maintenance, inspection and repair. Very often full service contracts with the
manufacturer are completed for CHP modules. These agreements provide a comprehensive
service at a fixed rate per kilowatt hour of electricity produced. This includes all work which is
generally understood to be necessary for the smooth operation of a system and includes
inspection, all maintenance and repair, spare parts and supplies (except fuel). A major overhaul
is usually also included in long-term contracts. Besides the good predictability of such contracts,
another advantage is that the execution of all work on the CHP is transferred to the seller, and the
technical risks are covered, e.g. an engine failure, by the full maintenance contract. [33]
Review of self-power generation:
The value of the electrical energy generated in CHP systems (for both: power and energy)
is calculated as follows:
Costs of additional electricity acquisition
- Additional costs for electricity purchases
- Cost of backup power purchase
+ If needed: credit for excess / residential electricity supply
= Value of own power generation.
16
The additional electricity acquisition costs arise if the power company has no self-
generated power supply. The electricity, which is still needed after installation of a CHP plant as
additional power is called excess - or residual electricity. Costs for backup power may arise
when a higher power rating is used than ordered. These costs are dependent on the rate for
backup power ordered from the utility companies. When supplying excess power into the grid,
revenues can be credited.
The energy generation characteristics need to be known for the CHP system to evaluate
the self-generated electricity. The superposition of the power load profile and the electricity
generation by the CHP system defines the fractions of electricity fed into the grid and the
additional electrical power needed. For this calculation, a simulation based on hourly values is
inevitable. Specialized software for the design of CHP plants simulates typical load curves for
calculated usage.
For the evaluation of electrical energy generation, the knowledge of individual power
delivery terms and the conditions of the energy companies is crucial. There is usually a price
difference for the agreed day and night rate, also called high- or low-rate, and established winter
and summer time rates. With the recognition of the hourly flow data and the linkage with the
different price conditions of the utility companies, the cost of the residual current reference for
possible back-up power, and the revenues for the supply of surplus power can be calculated.
These cost calculations can then be compared with the cost faced by procuring electricity more
traditionally.
Heat generation cost and comparison with central heating:
17
The annual cost of the CHP systems are calculated as described in the Section “Capital
related Costs”. A n -generated electricity, the annual heat production costs
are, calculated as follows:
Annual costs of heat-und power generation
- Current value of generated electricity
= Annual heat production costs
For alternative heat generation with a boiler, the annual heat production costs can also be
calculated from fixed capital, demand/ consumption-bound, operating, and other costs. Dividing
the annual heat production costs by the annual amount of heat generation results in the specific
heat generation costs [$/kWh] for both systems. According to the criteria of economic efficiency,
those power plants are selected, which have the lower annual heat production costs. [33]
Dynamic Payback Calculation
This payback method is one of the most frequently used methods for the capital
budgeting process. The payback period length is a measure of the investment risk and is another
criterion for assement of a system. The owner must decide between the static and dynamic
payback calculation. For the static payback period, which is determined by the initial investment,
the later resulting net cash flows which will be recovered, regardless of the timing and the
resulting interest rate effects. The neglect of pay back timing is a major criticism for this type of
calculation because payments at different times are not easily compared with each other.
The dynamic calculation of amortization is derived from the capital value method and
eliminates this criticism. The annual cash flows are discounted to time zero and the dynamic
payback period is reached when the cumulative present value of cash flows is equal to the initial
18
investment. Thus, the fact is taken into account that future payments are worth less than previous
payments. [8]
For CHP units, whose aim is self-supply and who earn no profit from the sale of
electricity and heat, the amortization of CHP plants cannot be employed. Therefore, the
amortization time for the extra investment, which a CHP plant needs, compared to a
conventional heating system, is calculated.
All operating and fuel costs for the CHP plant are assessed as disbursements. All
operating and fuel costs for the comparable heating system, the values of power generation
(avoided electricity purchases, plus revenue from the power supply) are considered as deposits,
and tax credit or debits may need to be taken into account. The difference between the payments
and deposits will be accounted for annually and discounted to time zero. The values are
cumulative and the dynamic payback period is reached when the cumulative net present values
are equal to the added investment of the CHP plant. The smaller the payback period, the smaller
is the risk of the investment. If the payback period exceeds the life of the CHP, the plant is not
economical. For CHP units in residential buildings payback periods that lie within their lifetime
and less, or up to 10 years are quite acceptable. For industrial or commercial combined heat and
power applications, which follow the business principle of making a profit, shorter payback
periods are required.

19
CHAPTER III
III. BUILDING LOAD EVALUATION
The heating and cooling loads of a building to maintain a comfortable room temperature
is affected by various factors. These factors are: the solar angles and weather conditions, which
are defined by the location, the building with its footprint and insulation materials, as well as the
ventilation and infiltration factors. Determination of the cooling load requires additional
information about the heat gain by occupants, computers or other appliances. Based on this
information the heat can be calculated based on the following equations [10]. The total heat
capacity of the building is calculated by the sum of the single heat fluxes.
Heating:
Heat transfer through roofs, ceiling, walls and floors: A T -T
Heat Transfer through floors below grade: A T -
Heat Transfer through floors around the grade: P T -T
Heat Transfer through ventilation and infiltration . T -T
w -w
Cooling:
Heat transfer through roofs, ceiling, walls, and windows: A TD
Heat transfer through windows (solar): A H
Heat Transfer through people: N H
20
N H
Heat Transfer through lights: . P
Heat Transfer through appliance: H
H
Heat Transfer through ventilation and infiltration: . T -T
w -w
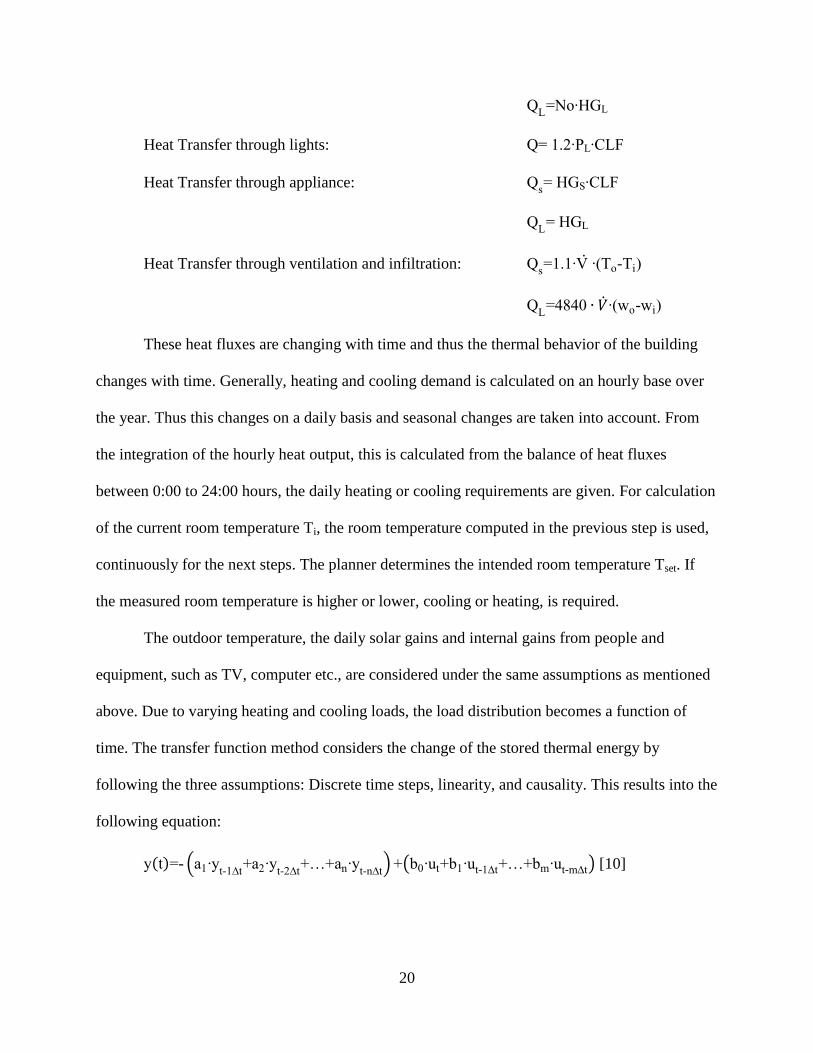
These heat fluxes are changing with time and thus the thermal behavior of the building
changes with time. Generally, heating and cooling demand is calculated on an hourly base over
the year. Thus this changes on a daily basis and seasonal changes are taken into account. From
the integration of the hourly heat output, this is calculated from the balance of heat fluxes
between 0:00 to 24:00 hours, the daily heating or cooling requirements are given. For calculation
of the current room temperature Ti, the room temperature computed in the previous step is used,
continuously for the next steps. The planner determines the intended room temperature Tset. If
the measured room temperature is higher or lower, cooling or heating, is required.
The outdoor temperature, the daily solar gains and internal gains from people and
equipment, such as TV, computer etc., are considered under the same assumptions as mentioned
above. Due to varying heating and cooling loads, the load distribution becomes a function of
time. The transfer function method considers the change of the stored thermal energy by
following the three assumptions: Discrete time steps, linearity, and causality. This results into the
following equation:
( ) - ( -
-
n -n
) (b b - b - ) [10]
21
Simplifying the above equation, all the different influence factors are combined in the
variable C. Because this transient calculation results in an inhomogeneous linear differential
equation of 1st order.
T v
( T v )

22
CHAPTER IV
IV. COMPONENTS OF CHP
The following chapters will introduce the basics of the CHP technologies, the usable
primary fuel, efficiency factors, advantages and challenges.
Fuels
This chapter gives a brief overview of the potential fuels for CHP systems. The
applicability for a particular technology is given in the according chapter for the prime movers,
where the technologies are described in detail. The choice of fuel has a major influence on CHP
systems. On the one hand, fuel cost can be controlled; however, it is important to understand that
fluctuation on the market energy price can lead to misleading results in the economic analysis.
On the other hand, the environmental impact can be reduced by using less polluting fuels such as
biomass and natural gas. Moellersten et al. [29] investigated the potential of carbon dioxide and
cost of carbon dioxide reduction. Their results show that CHP is one of the most cost-effective
technologies having a large potential for carbon dioxide reduction. The heating value of the fuel
indicates how energy dense the fuel is, which directly influences efficiency of the CHP systems.
Two different measurements of the heating value exist:
23
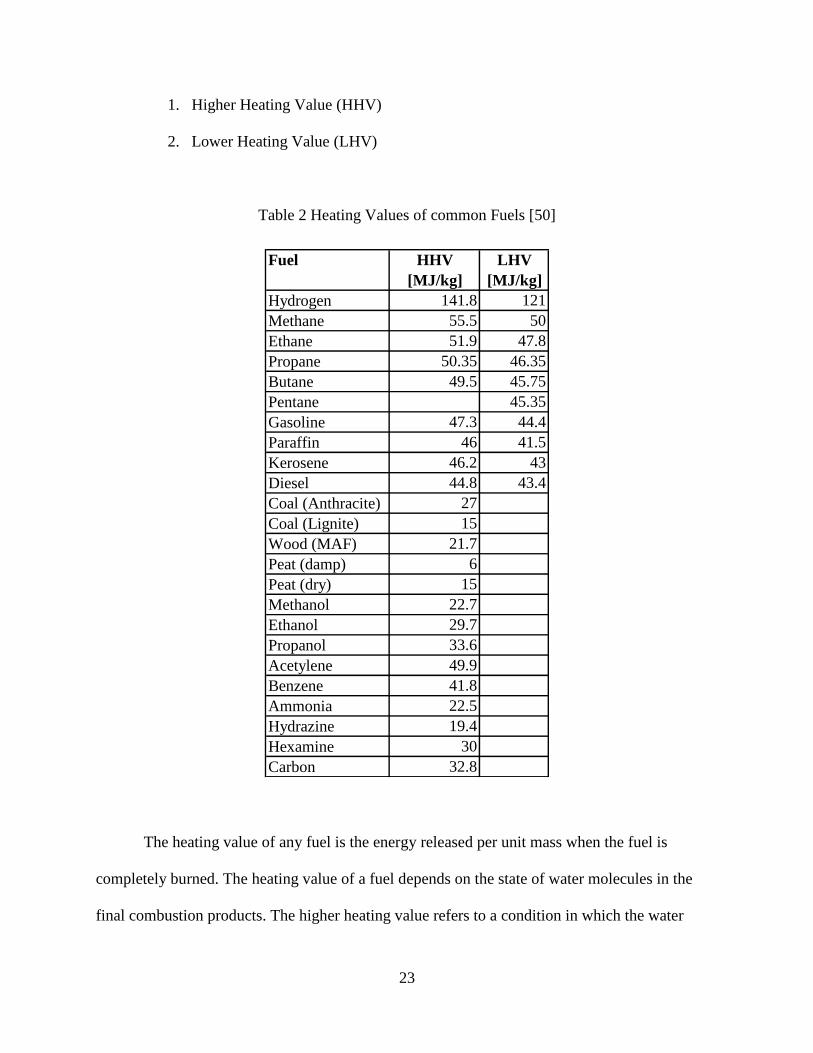
1. Higher Heating Value (HHV)
2. Lower Heating Value (LHV)
Table 2 Heating Values of common Fuels [50]
Fuel HHV LHV
[MJ/kg] [MJ/kg]
Hydrogen 141.8 121
Methane 55.5 50
Ethane 51.9 47.8
Propane 50.35 46.35
Butane 49.5 45.75
Pentane 45.35
Gasoline 47.3 44.4
Paraffin 46 41.5
Kerosene 46.2 43
Diesel 44.8 43.4
Coal (Anthracite) 27
Coal (Lignite) 15
Wood (MAF) 21.7
Peat (damp) 6
Peat (dry) 15
Methanol 22.7
Ethanol 29.7
Propanol 33.6
Acetylene 49.9
Benzene 41.8
Ammonia 22.5
Hydrazine 19.4
Hexamine 30
Carbon 32.8
The heating value of any fuel is the energy released per unit mass when the fuel is
completely burned. The heating value of a fuel depends on the state of water molecules in the
final combustion products. The higher heating value refers to a condition in which the water

24
condenses out of the combustion products. Because of this condensation, both sensible and latent
heat affect the heating value. The lower heating value, on the other hand, refers to the condition
in which water in the final combustion products remains as vapor (or steam); i.e. the steam is not
condensed into liquid water and thus the latent heat is not accounted for. In Table 2 higher and
lower heating values of some common fuels are given.
Generally, fuels can be defined in two groups: fossil fuels and biomass fuels. It is
common in most applications to use fossil fuels, especially natural gas. This also applies to
innovative technologies, e.g. the Stirling engine. Renewable energy sources are already widely
used for CHP engines in the form of liquid and gaseous fuels. In addition, there are promising
developments for the use solid biomass fuels for Stirling engines and steam engines, because
their combustion process takes place outside the engine.
Fossil fuels are made by natural processes from buried dead organisms. They do not
belong to the renewable energies, because it takes millions of years to form them. For internal
combustion the following fossil fuel types are used: natural gas, petroleum gas, gasoline and
diesel. Natural gas is the most common gas used for combustion, because of the cheap price and
good availability. Refined petroleum gas, along with propane or butane, has a higher heating
value than natural gas, but is not as cheap.
Biomass fuel can be produced in relatively short time and from a variety of products,
such as: wood waste, crop residues, energy crops, manure biogas, landfill gas, wastewater
treatment biogas, and food processing waste. Before biomass is usable as a fuel, it must be
processed by direct-fired and gasification systems. In direct-fired burners, biomass fuel burns
and produces high pressure steam or hot water. Biomass gasification systems convert solid
25
biomass into solid waste and a flammable gas. This gas is also called synthesis gas or syngas,
which is further used for the combustion process.
For the environmental benefit, a detailed investigation of biofuels is inevitable, because
not all biofuel are carbon neutral. Some kinds of agricultural feedstock, like soybeans or corn,
are particularly far from being carbon-neutral. Both are fertilizer intensive, which increases the
greenhouse gas of the produced biofuels. Their production also includes drying process which
uses large amounts of energy derived from fossil fuels. Further, compounding of the biofuels
ultimately produces more emissions and pushing the fuels farther away from carbon neutrality.
However, some other biofuels have the potential to become carbon-neutral in the future. Plants
from canola, algae, or sugarcane sequester. If the released carbon dioxide as feedstock in
biofuels equals the amount they sequestered as crops, then they can be considered carbon-
neutral. The supply and distribution of biomass or biofuel to the consumer must be also taken
into account. The emission evaluation is affected by the pollutants which result from transport.
A second interesting aspect for biofuel in CHP application can be the economic
calculation. Since biofuels are in general more expensive than natural gas it does not seem to be
advantageous on the first glace. However, the government provides special incentives for
biofuel, as it is part of the renewable energies, which can be applied by the investor.
Prime Movers
CHP systems consist of a number of individual components: prime movers/ heat engines,
generators, heat recovery, and electrical interconnection. The prime mover typically identifies
the CHP system. Four different technologies can be characterized: steam turbines, gas turbines,
reciprocating engines, and fuel cells.
26
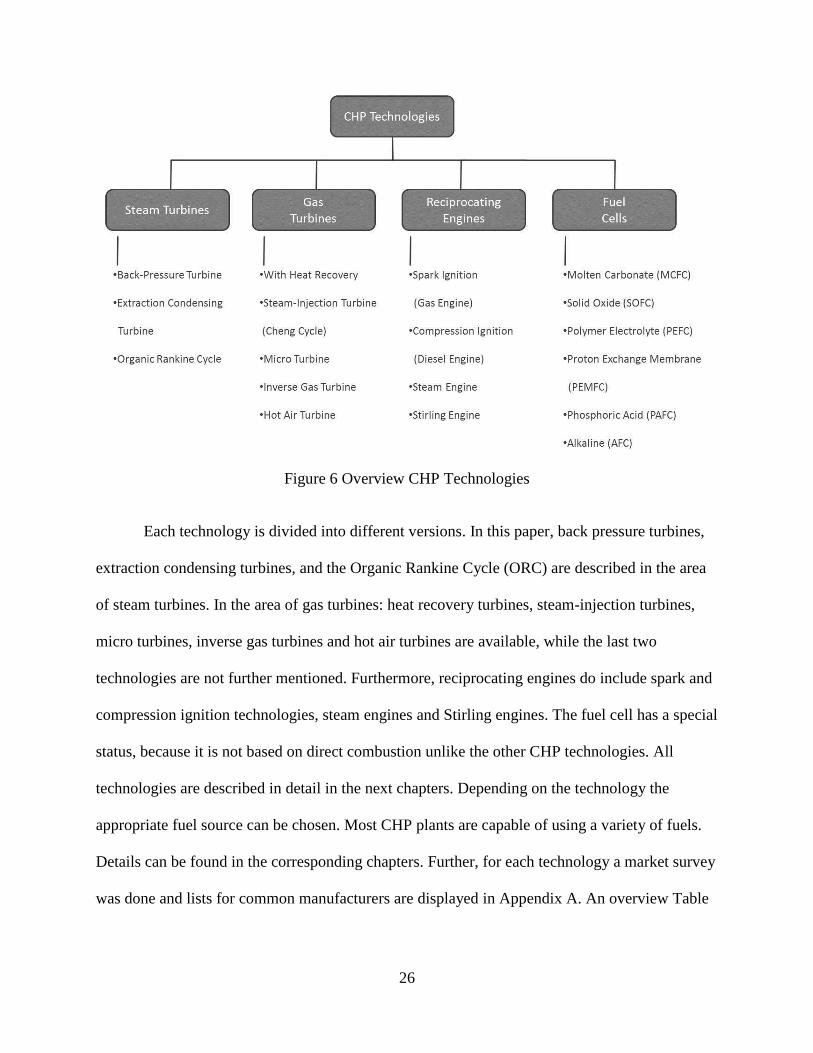
Figure 6 Overview CHP Technologies
Each technology is divided into different versions. In this paper, back pressure turbines,
extraction condensing turbines, and the Organic Rankine Cycle (ORC) are described in the area
of steam turbines. In the area of gas turbines: heat recovery turbines, steam-injection turbines,
micro turbines, inverse gas turbines and hot air turbines are available, while the last two
technologies are not further mentioned. Furthermore, reciprocating engines do include spark and
compression ignition technologies, steam engines and Stirling engines. The fuel cell has a special
status, because it is not based on direct combustion unlike the other CHP technologies. All
technologies are described in detail in the next chapters. Depending on the technology the
appropriate fuel source can be chosen. Most CHP plants are capable of using a variety of fuels.
Details can be found in the corresponding chapters. Further, for each technology a market survey
was done and lists for common manufacturers are displayed in Appendix A. An overview Table

27
of all the characteristics of these technologies was established and can be found at the end of this
chapter.
Steam Turbines
Steam turbines are one of the oldest engine technologies. The process is based on the
Rankine Cycle, which ideally consists of constant pressure heat addition in a boiler, isentropic
expansion in the turbine, constant pressure heat rejection and isentropic compression in the pump
[6], as shown in Figure 7. The main purpose of a steam turbine system is to produce heat by
combustion in the boiler. The generated high pressure, high temperature steam is used to power a
turbine and to generate electricity. This is unique for CHP systems, because all other
technologies are designed to generate electricity, while heat is the byproduct.
Two different types of steam turbines are used for CHP systems: non-condensing or back
pressure turbines and extraction turbines. Back pressure turbines operate on the principle
described on the left side of Figure 7. The entire steam flow is used for power generation and the
remaining amount of energy is extracted in the condenser. The applications are perfect for a
constant heat demand. The operating principle of extraction turbines is similar, with the
difference that steam extraction for heat generation is not just at the end, but also in the middle
Section of the turbine. This has the advantage that the power or heat generation can be adjusted
to different demands.

28
Figure 7 Process for Back-Pressure Steam Turbine (left) and Extraction Steam Turbine (right)
Steam turbines have the advantage that the technology is well known, which results in
longevity and reliability. Steam turbine systems have the benefit of external combustion, which
means the steam is utilized outside of the power prime mover. Thus, flexibility arises as to
choice of fuel, including fossil fuels such as coal, oil, or natural gas, as well as biomass fuels like
wood or waste products [46]. The choice of fuel only depends on the selected boiler.
In addition, the power-to-heat ratio can be varied using extraction steam turbines. This
makes it possible to meet more than one site heat grade requirement. Compared to other
technologies, and because electricity is a byproduct of heat generation, this power-to-heat ratio is
relatively low. Also, reliant on the fuel choice are the emissions. The biggest disadvantage of
steam turbines is the slow start-up time of the system, due to the design of the turbine. It also has
poor part-load behavior, which makes it more suitable for constant heat demand rather than
variable demand. There is a broad field of application for middle size about 100 kW to higher
demands of 250 MW [23]. In this size range steam turbines are mostly found in industrial
applications. The capital cost range is about $800 - $1000/kW. Since heat generation is the main
purpose of steam turbines, heat at high thermal quality can be generated. This can also be seen in
29
the efficiency of steam turbines, the thermal efficiency is between 50%– 65%, and the electrical
efficiency is around 10%– 20%. Further information is described in Table 4. [43]
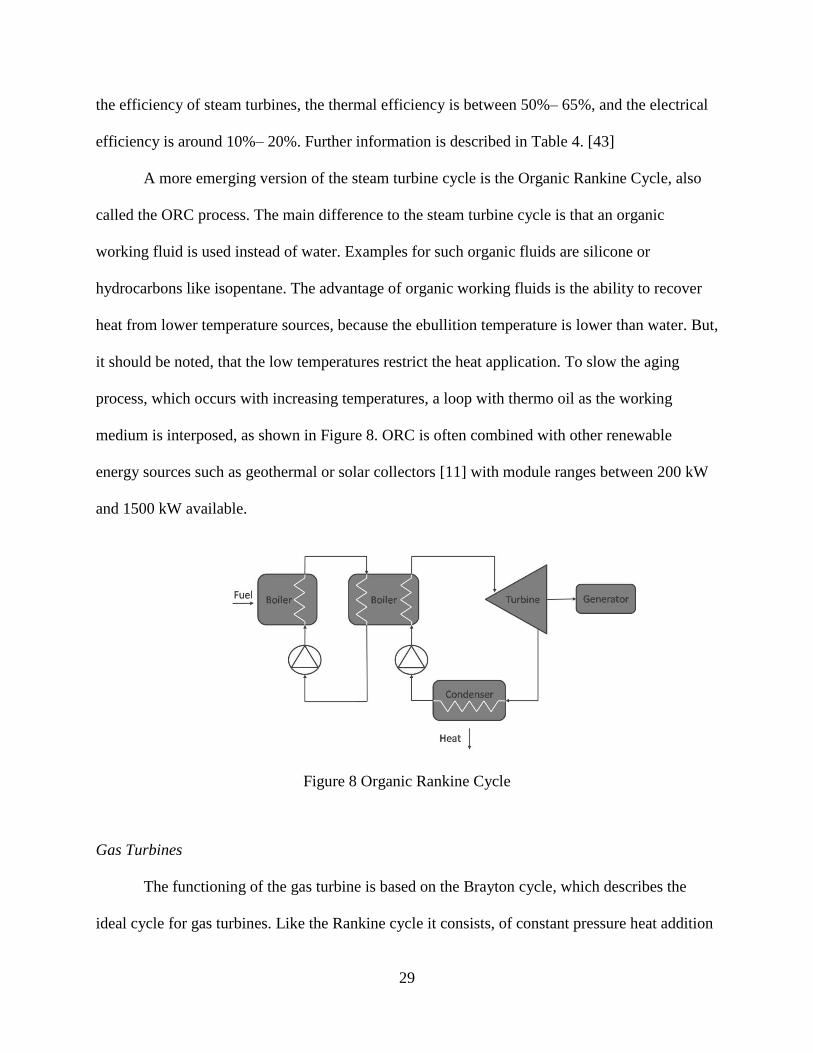
A more emerging version of the steam turbine cycle is the Organic Rankine Cycle, also
called the ORC process. The main difference to the steam turbine cycle is that an organic
working fluid is used instead of water. Examples for such organic fluids are silicone or
hydrocarbons like isopentane. The advantage of organic working fluids is the ability to recover
heat from lower temperature sources, because the ebullition temperature is lower than water. But,
it should be noted, that the low temperatures restrict the heat application. To slow the aging
process, which occurs with increasing temperatures, a loop with thermo oil as the working
medium is interposed, as shown in Figure 8. ORC is often combined with other renewable
energy sources such as geothermal or solar collectors [11] with module ranges between 200 kW
and 1500 kW available.
Figure 8 Organic Rankine Cycle
Gas Turbines
The functioning of the gas turbine is based on the Brayton cycle, which describes the
ideal cycle for gas turbines. Like the Rankine cycle it consists, of constant pressure heat addition
30
in a boiler, isentropic expansion in the turbine, constant pressure heat rejection and isentropic
compression in the pump [6]. Ambient air is drawn into the compressor and then fed into the
combustion chamber. There, a combustion reaction takes place by adding fuel. The flue gas is
expanded in a turbine, which drives the compressor and the generator for electricity production.
The hot exhaust gas exiting from the turbine passes through a heat exchanger, where heat
transfer to another medium, usually water, takes place. Afterwards the gas gets exhausted to the
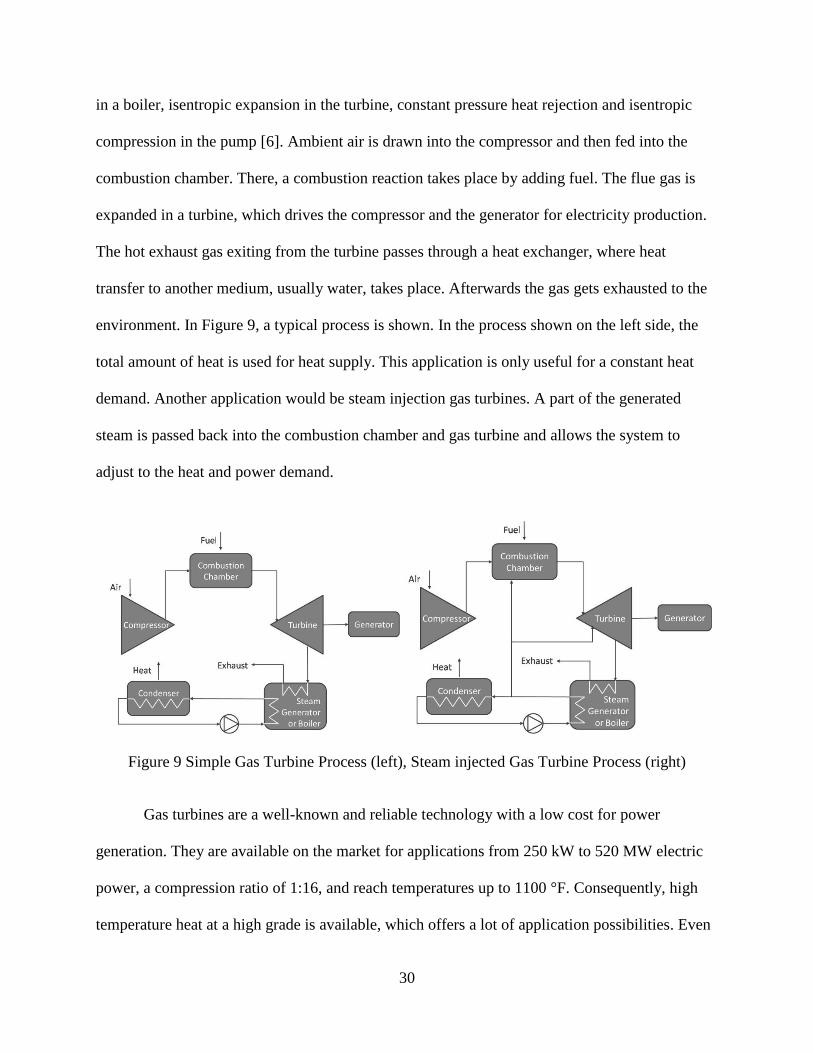
environment. In Figure 9, a typical process is shown. In the process shown on the left side, the
total amount of heat is used for heat supply. This application is only useful for a constant heat
demand. Another application would be steam injection gas turbines. A part of the generated
steam is passed back into the combustion chamber and gas turbine and allows the system to
adjust to the heat and power demand.
Figure 9 Simple Gas Turbine Process (left), Steam injected Gas Turbine Process (right)
Gas turbines are a well-known and reliable technology with a low cost for power
generation. They are available on the market for applications from 250 kW to 520 MW electric
power, a compression ratio of 1:16, and reach temperatures up to 1100 °F. Consequently, high
temperature heat at a high grade is available, which offers a lot of application possibilities. Even
31
with these high temperatures no cooling equipment is required since excess heat is exhausted to
the environment. An issue with gas turbines is the outside air conditions. With increasing air
temperatures, the density of the air will decrease, which results in a higher mass flow rate and
higher compression rate. Thus, power output and efficiency will decrease. A solution is
aeroderivative gas turbines, where high pressure gas or in-house gas compressors operate on a
compression ratio of 1:30. It makes the system thermally efficient, light weight, but also more
expensive and limited in capacity (max. 40 MW). Recupereators, intercoolers, and inlet air
cooling are further efficiency enhancement technologies. Recuperators are basically heat
exchangers, which use the hot turbine exhaust gases to preheat the compressed inlet air. If the
flow rate through the recuperator can be varied, the released process heat can be increased if
needed at the expense of electrical efficiency. While gas turbines generally have applications for
a constant heat demand, the recuperators are a good possibility to adjust to a variable heat
demand. In intercoolers the compressor is divided in two different compression stages and the air
gets cooled before it enters the second stage. The required power for the compression is reduced,
but the negative side effect is that the decrease in temperature results in higher fuel consumption.
Furthermore, gas turbines have a poor electrical efficiency at low loading, but the overall CHP
efficiency does generally not decrease so much because a decrease in electrical energy results in
a relative increase in heat energy. This aspect could be advantageous for a steam-driven plant.
An additional advantage is that the emission values are very low, because of the high
temperatures in the combustion chamber.
Micro turbines are basically the small version of a gas turbine. They are available
between 30 kW to 250 kW and thus they are used for smaller applications such as restaurants,
multi-family homes, or office buildings. An economic life time of up to 80,000 operating hours

32
can be achieved. The maintenance interval, 4000-8000 hours of operation, is generally much
longer than those in internal combustion engines [46]. The functionality and the resulting aspects
are the same as mentioned above, so only the differences are described next. First of all, due to
the smaller components, a light weight system with compact size can be built. Usually
recuperators are used to raise the peak temperature due to preheating. Since the power produced
is proportional to the inlet temperature and the inlet temperature is limited to material properties,
the current technology is limited to 1800 °F and a pressure ratio of 3.5 to 4. Consequently, the
compact design limits the electrical efficiency. Multistage axial flow compressors and turbines
are implemented to improve efficiency even further. Production of micro turbines is more
expensive than regular gas turbines, as shown in Table 4. There, further performance indicators
are shown for gas turbines and micro turbines.
Most applications use natural gas or liquefied petroleum gas as the combustion fuel. But
renewable gases such as biogas, sewage gas and landfill gas are suitable too, due to the simple
construction of a gas turbine.
Reciprocating Engines
Internal combustion engines:
The most widely used technology in regards to CHP systems are internal combustion
engines, because they are robust, well-proven and reliable. They are differentiated between spark
ignition (Otto cycle) and compression ignition (Diesel cycle). The mechanical parts of both
systems are the same; and both cycles consist of isentropic compression, constant volume heat
addition, isentropic expansion, and constant-volume heat rejection. The primary difference is
how the combustion is induced. Otto engines ignite the pre-mixed fuel-air mixture by a spark
plug; Diesel engines compress the air to a high pressure where the temperature is so high that the
33
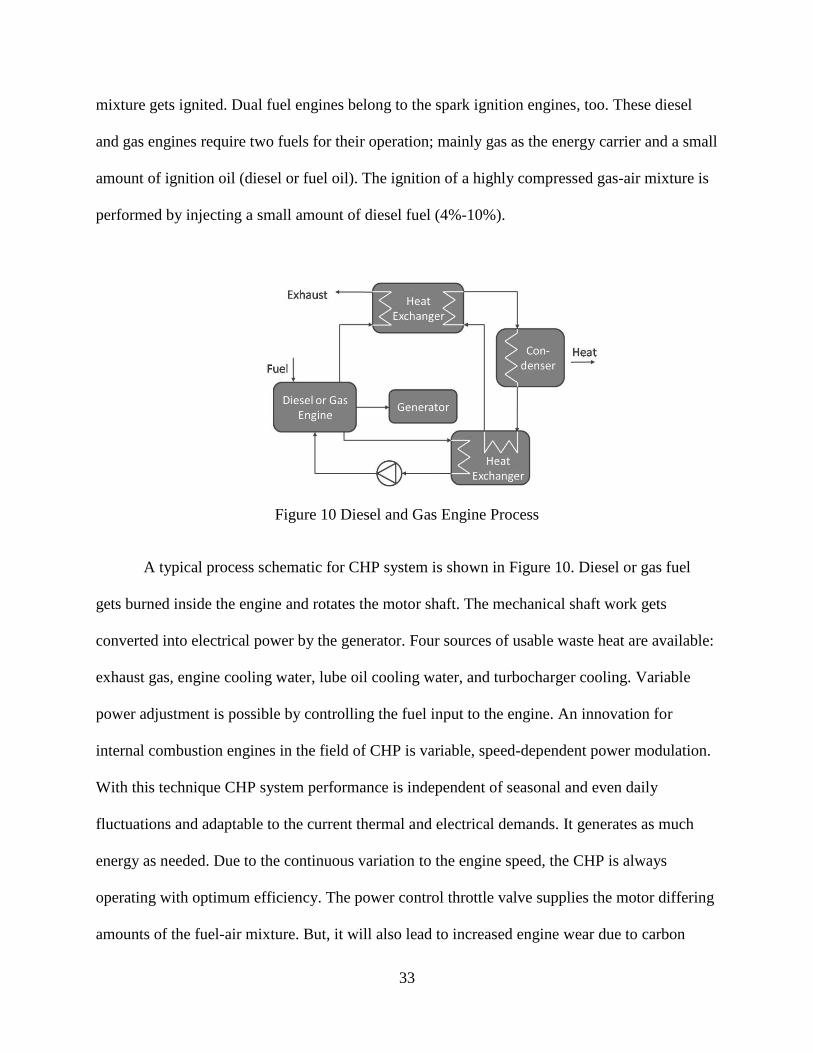
mixture gets ignited. Dual fuel engines belong to the spark ignition engines, too. These diesel
and gas engines require two fuels for their operation; mainly gas as the energy carrier and a small
amount of ignition oil (diesel or fuel oil). The ignition of a highly compressed gas-air mixture is
performed by injecting a small amount of diesel fuel (4%-10%).
Figure 10 Diesel and Gas Engine Process
A typical process schematic for CHP system is shown in Figure 10. Diesel or gas fuel
gets burned inside the engine and rotates the motor shaft. The mechanical shaft work gets
converted into electrical power by the generator. Four sources of usable waste heat are available:
exhaust gas, engine cooling water, lube oil cooling water, and turbocharger cooling. Variable
power adjustment is possible by controlling the fuel input to the engine. An innovation for
internal combustion engines in the field of CHP is variable, speed-dependent power modulation.
With this technique CHP system performance is independent of seasonal and even daily
fluctuations and adaptable to the current thermal and electrical demands. It generates as much
energy as needed. Due to the continuous variation to the engine speed, the CHP is always
operating with optimum efficiency. The power control throttle valve supplies the motor differing
amounts of the fuel-air mixture. But, it will also lead to increased engine wear due to carbon
34
deposits on the valves. The thermal power and gas consumption ratio also decrease
advantageously in the partial load range, resulting in significant cost reduction. The use of
standard engines from the automotive sector is not fully possible. Those engines have to be
modified to ensure reliability in continuous operation.
Generally, reciprocating engines are characterized by good start-up behaviour. They can
be started with a minimal amount of power; usually a battery provides enough energy, which
makes it perfect for standalone systems. In addition, good part-load behaviour needs to be
mentioned. Diesel engines have a small advantage in contrast to Otto engines due to the leaner
fuel-air ratio at reduced load. Reciprocating engines generally drive synchronous generators at
constant speed to produce steady alternating current power. As the load is reduced, the heat rate
of spark ignition engines increases and efficiency decreases. At 50% load the efficiency is
approximately 8% to 10% less than under full load conditions contrary to diesel engines whose
efficiency stays relatively constant between 50% and 100% load capacity. The electrical
efficiency of internal combustion engines is between 25% – 50%, whereas Diesel engines have a
little higher efficiency compared to spark ignition engines. Their thermal efficiency is between
60% – 70%. The engine exhaust heat temperature is 850 – 1,200 °F and generates hot water
about 200 °F or steam up to 150 psig. The waste heat from the remaining components produces
hot water or low pressure steam less than 30 psig. Overall internal combustion engines are a
well-known and reliable technology, with a maintenance cycle of 12,000 to 15,000 hours. They
are available in a wide range of sizes, 1 kW to 5000 kW. [47]
The main pollutants associated with reciprocating engines are oxides of nitrogen (NOx),
carbon monoxide (CO) and volatile organic compounds (VOC) [9]. As with every engine,
emissions are influenced by the fuel source. Diesel engines have relatively high emission

35
pollutants; especially the particulates are an issue. Only Diesel fuel or heavy oil is suitable for a
compression ignition engine. For Otto cycles mainly two methods are employed to reduce
emission: lean burn/ combustion control and rich burn/ catalytic after-treatment. In general spark
ignition engines can be operated with a variety of fuels such as: natural gas, propane, butane,
sour gas, gasoline, or biogas such as landfill gas, sewage digester gas, and animal waste digester
gas.
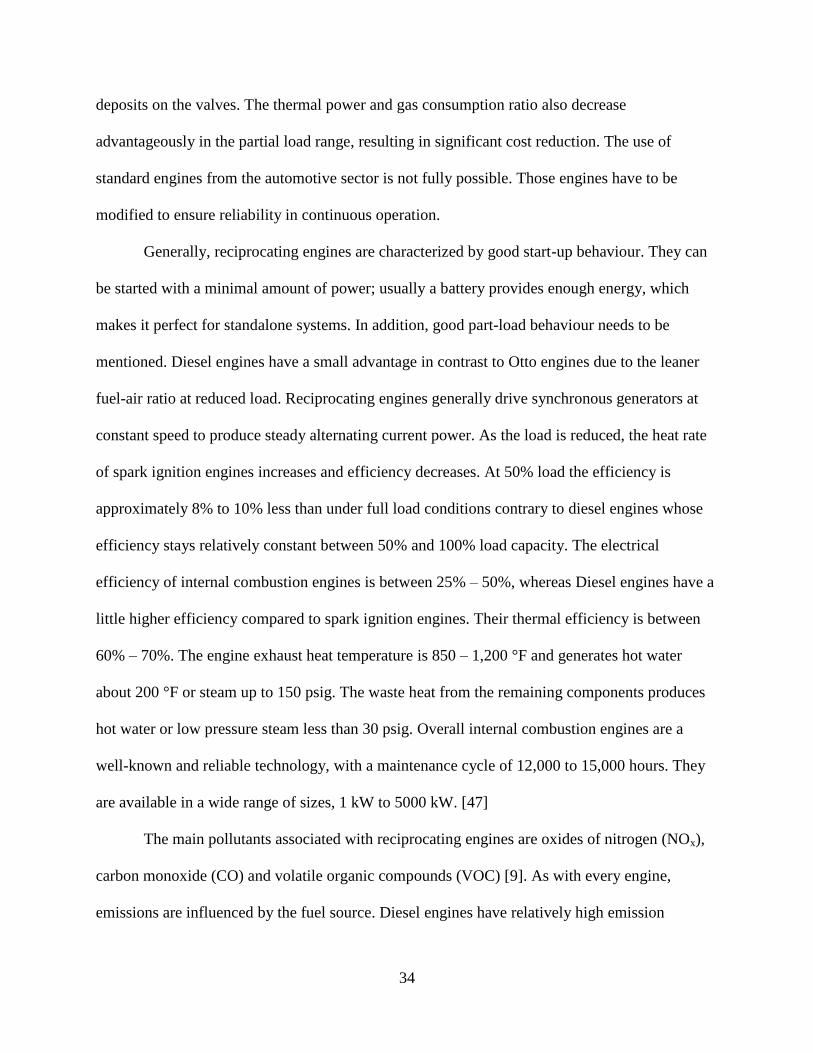
Steam engine:
The steam engine is an external combustion engine. For CHP this technology is matured,
but it is not implemented in great numbers yet. In Figure 11 the process is shown in a schematic
and described below.
A furnace fuel is burned, and the resulting flue gas flows through a steam boiler, which
generates the steam. The steam then flows into the steam-engine, pressurizes the piston, and the
steam pressure is reduced. The mechanical movement of the piston is then converted into
electrical energy in the generator. After leaving the steam engine, the steam is directed into the
condenser where the waste heat of condensation can be used to provide heat. The feed water
pump brings the water to operating pressure and then into the boiler. The regulator shaft controls
the amount of heat entering the piston. The principle corresponds to the control of the steam
turbine process, where a piston engine is used instead of a turbine. Power production is possible
from 20 kW upwards, which allows decentralized applications.
36
Figure 11 Steam Engine Process
Steam piston engines are characterized by their robustness and durability. They also have
very good partial load behavior, and the modular design of the engine allows for very good
adaptation to the given operating conditions, and to the required demand for electricity and heat.
Steam piston engines can also process steam quality fluctuations of temperature and steam flow
better than turbines. These fluctuations can occur in the combustion of biomass due to the
differing water content of the fuel. Basically, the operation of the steam engine with each fuel is
possible. For this reason, usage of renewable energy sources is particularly interesting. Wood
chips, energy crops, wood residues and other residues are used. However, the disadvantage is the
low electrical efficiency in the range of 6% to 20%. Furthermore, the steam engine is relatively
maintenance-intensive, and it reaches a high noise level (up to 95 dB(A)). An application without
very good noise protection is not feasible especially for residential buildings.
Stirling engine
The Stirling engine was an invention of Robert Stirling in 1816. After it was sidelined for
years by the internal combustion engine, Stirling engines are gaining back significance in recent
years. The reason is the suitability for combined heat and power systems especially for small,
decentralized modules.
37
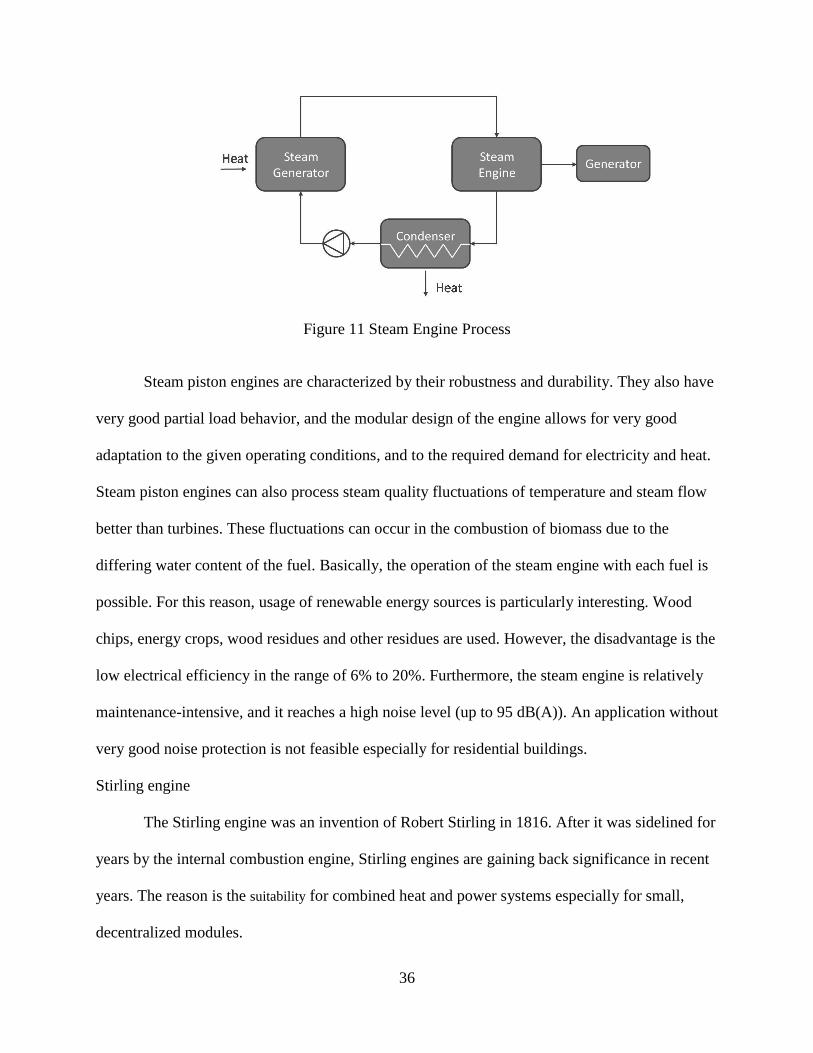
The Stirling engine is based on external combustion, while the working fluid is trapped
inside cylinders and the energy input is done by an external heat source. Figure 12 illustrates the
application of the Stirling engine in a CHP system. Generally a fuel is burned in a combustion
chamber producing hot gases. These flue gases flow through the boiler heat exchanger and
release part of the heat energy to the working gas, e.g. air, nitrogen, helium or hydrogen. The
residual heat of the exhaust gas is used via an additional heat exchanger for further heat demand.
The cooling of the Stirling engine is done by the return of the heat supply system for a cooler
heat exchanger. The movement of the piston creates mechanical shaft work, which is directly
coupled to a generator to produce electricity.
Figure 12 Stirling Engine Process
The thermodynamic cycle is based on isothermal compression, isochore heating,
isothermal expansion and isochore cooling. Two types of Stirling engines exist: piston engines
and linear free piston engines. First, the piston engine is explained. Inside the Stirling engine the
following operating principle occurs, as shown in Figure 13.
38
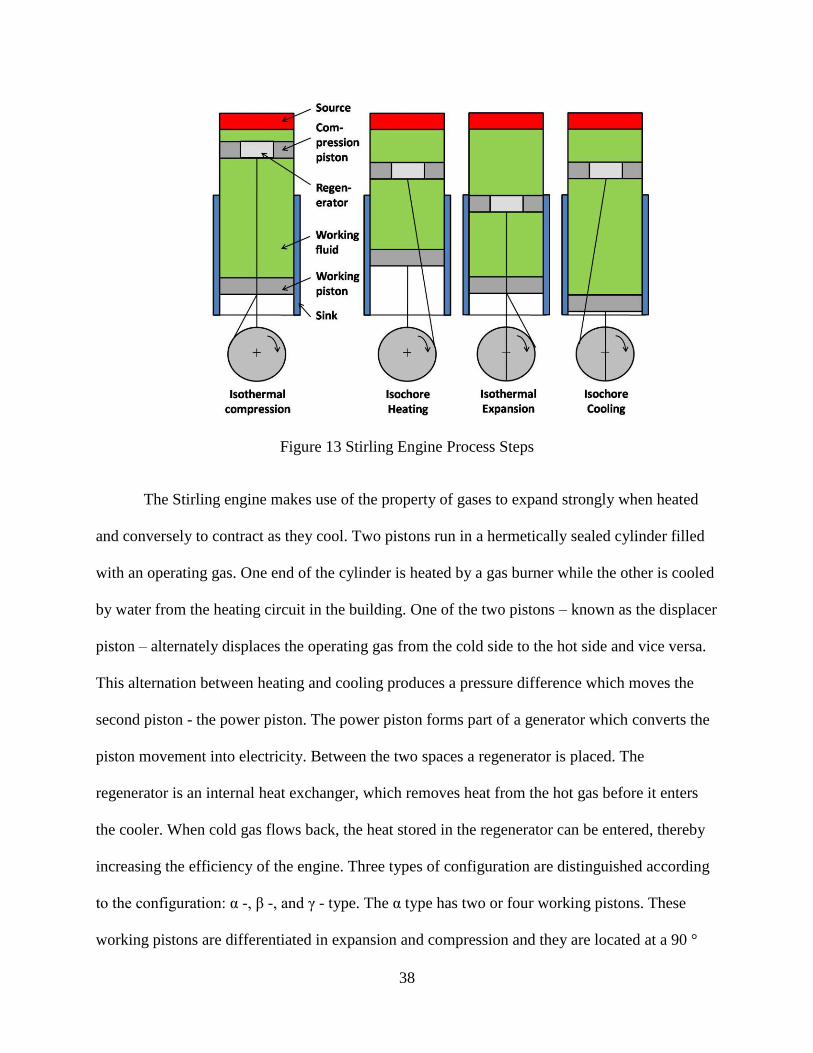
Figure 13 Stirling Engine Process Steps
The Stirling engine makes use of the property of gases to expand strongly when heated
and conversely to contract as they cool. Two pistons run in a hermetically sealed cylinder filled
with an operating gas. One end of the cylinder is heated by a gas burner while the other is cooled
by water from the heating circuit in the building. One of the two pistons – known as the displacer
piston – alternately displaces the operating gas from the cold side to the hot side and vice versa.
This alternation between heating and cooling produces a pressure difference which moves the
second piston - the power piston. The power piston forms part of a generator which converts the
piston movement into electricity. Between the two spaces a regenerator is placed. The
regenerator is an internal heat exchanger, which removes heat from the hot gas before it enters
the cooler. When cold gas flows back, the heat stored in the regenerator can be entered, thereby
increasing the efficiency of the engine. Three types of configuration are distinguished according
n n: α -, β -, n γ - type. The α type has two or four working pistons. These
working pistons are differentiated in expansion and compression and they are located at a 90 °

39
n . I w v . In β – type engine, the working and compression
pistons are located in one cylinder, as shown in Figure 13. The piston rods are located so that the
n n b z . γ –type engines have working and compression pistons,
too. However, in contrast to the β – type engine they are located in two different cylinders.
Linear free piston engines work under the same principles as piston engines. The
difference comes as the working fluid is transformed and converted into to electrical power, e.g.
springs, crankshafts, etc., by the mechanical working piston.
The Stirling engine has several advantages. As mentioned before, it is well suited for
small power units up to 100 kW and with its compact design is perfect for smaller decentralized
CHP systems. It also features extremely low noise emission and low vibration operation
compared to internal combustion engines. Furthermore, the external combustion can be
optimized with respect to a large choice of usable fuels and better emissions values than the
internal combustion engines. Therefore, the Stirling engine achieves lower emission values. The
Stirling engine itself is very easy to maintain and is characterized by low maintenance and repair
costs. By the external combustion, there are no carbon deposits on the actual engine, and thus no
lubrication problems. The maintenance intervals are assumed to be 5,000-7,000 hours, and are
generally higher than those of internal combustion engines. A critical interface, especially in the
use of biomass applications, is the contact between flue gas and the boiler heat exchanger, as
well as the sealing of the working fluid area. The overall efficiency of the Stirling CHP is in the
range of 75% to 95%. The disadvantage is the low electrical efficiency of 15% to 30%, which is
a result of the low temperature gradient.

40
Fuel Cells
Fuel cells were invented by William Grove in 1839. During the last decades research on
this technology has been continued, and especially used as an energy source for space
applications. It still belongs to the emerging technologies and is not mature yet. In contrast to all
other introduced technologies, energy generation in fuel cells is not based on combustion, but on
an electrochemical reaction. Five types of fuel cells exist: proton exchange membrane fuel cell
(PEMFC), alkaline fuel cells (AFC), phosphoric acid fuel cells (PAFC), molten carbonate fuel
cells (MCFC), and solid oxide fuel cells (SOFC). Table 3 displays a comparison of these
different fuel cell technologies. It can be seen, that solid oxide fuel cells have by far the best
performance data.
Table 3 Comparison of Fuel Cell Technologies by NREL and [11]
Fuel Cell Type PEMFC AFC PAFC MCFC SOFC
Electrolyte Membrane Liquid Acid Liquid Ceramic
Temperature Low Medium Medium High Highest
Precious Metals Yes No Yes No No
Fuel Flexible No No No No Yes
CO2 Emissions [lbs/MWh] 1200 1200 1200 1000 750
Electrical Efficiency [%] 32 35 37 44 58
Availability 95 95 95 95 99
Each fuel cell system is composed of three primary subsystems: 1) the fuel processor that
converts the natural gas into a hydrogen-rich feed stream, 2) the fuel cell stack that generates
direct current electricity, and 3) the power conditioner that processes the electric energy into
alternating current or regulated direct current [47]. Inside, the fuel cell is divided into anode,
cathode, and electrode. In detail the following process takes place: Hydrogen (H2) is generated in
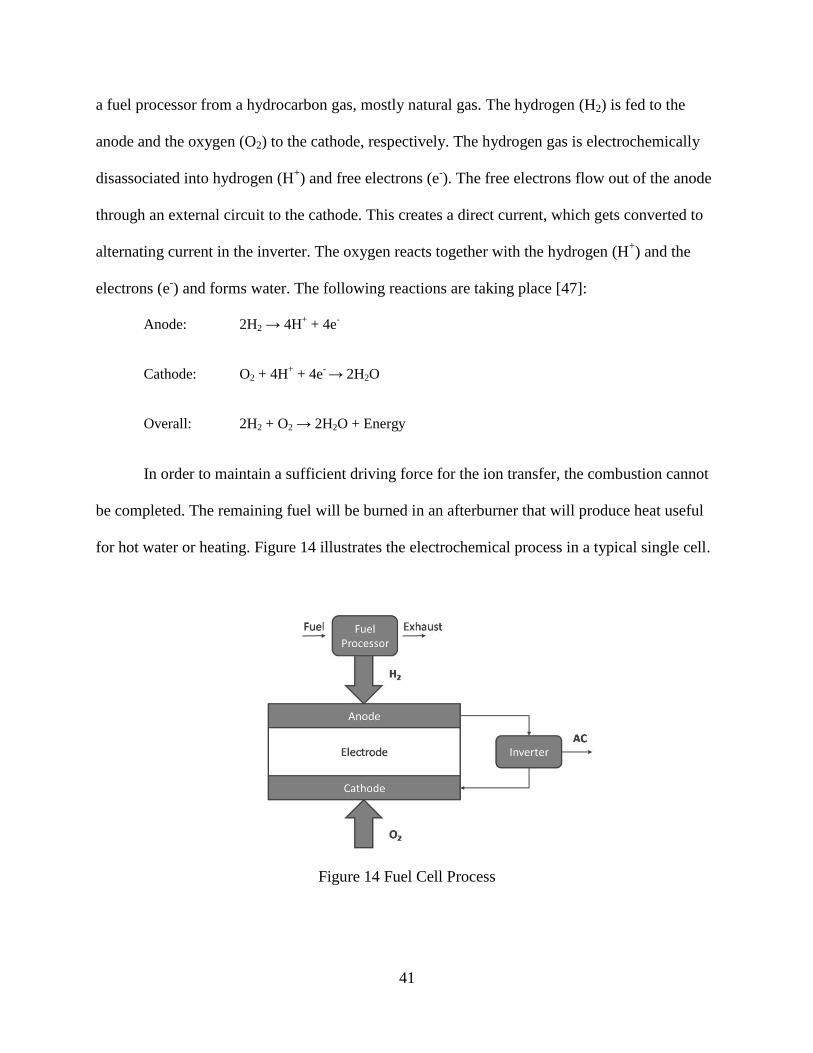
41
a fuel processor from a hydrocarbon gas, mostly natural gas. The hydrogen (H2) is fed to the
anode and the oxygen (O2) to the cathode, respectively. The hydrogen gas is electrochemically
disassociated into hydrogen (H+) and free electrons (e
-). The free electrons flow out of the anode
through an external circuit to the cathode. This creates a direct current, which gets converted to
alternating current in the inverter. The oxygen reacts together with the hydrogen (H+) and the
electrons (e-) and forms water. The following reactions are taking place [47]:
Anode: 2H2 → 4H+ + 4e
-
Cathode: O2 + 4H+ + 4e
- → 2H2O
Overall: 2H2 + O2 → 2H2O + Energy
In order to maintain a sufficient driving force for the ion transfer, the combustion cannot
be completed. The remaining fuel will be burned in an afterburner that will produce heat useful
for hot water or heating. Figure 14 illustrates the electrochemical process in a typical single cell.
Figure 14 Fuel Cell Process
42
Fuel cell CHP systems have many advantages including low emissions, low noise level,
low maintenance, excellent part-load behavior, and high efficiency [9]. Because of the indirect
reaction of hydrogen and oxygen, combustion does not take place. Thus the typical byproducts of
the combustion process such as CO or NOx are not produced. The only source of emission is the
fuel processing subsystem. This makes it an extremely low emitter and environmentally friendly
process. The hydrogen can be produced from natural gas, propane, coal, or through the
electrolysis of water. Maintenance expenditures for fuel cells are low compared to other CHP
systems, because they have fewer moving parts, and thus higher availability and reliability can
be expected. Fuel stacks need to be replaced between 4 to 8 years, and routine maintenance
should take place every 2,000 to 4,000 hours.
The main purpose for a fuel cell is the decentralized generation of power, but the reaction
creates high grade heat energy. Together with the exhaust gas out of the fuel processor the heat is
used for process heating. Generally a thermal efficiency of 36% can be established and an overall
efficiency of 65% to 90%. Application for constant demand ratings are available from 200 to
1,200 kW for commercial and industrial applications, 1 to 10 kW for residential buildings, and
0.5 to 5 kW for portable power systems [47]. It can be seen that a broad range of applications is
possible. A further advantage of the fuel cell is that the efficiency is independent of module size,
and that they are very efficient even at part-load. Beneficially, the system has also a low noise
level (<45 dBA). This makes the fuel cells even for indoor installations is suitable. Thus, fuel
cells offer clean, quiet, and efficient power generation.
However, fuel cells have some drawbacks. The technology requires expensive materials.
Together with the system’ complexity, acquisition costs for fuel cell systems are very high.
Another disadvantage is the relatively long start up times, usually a couple of hours.
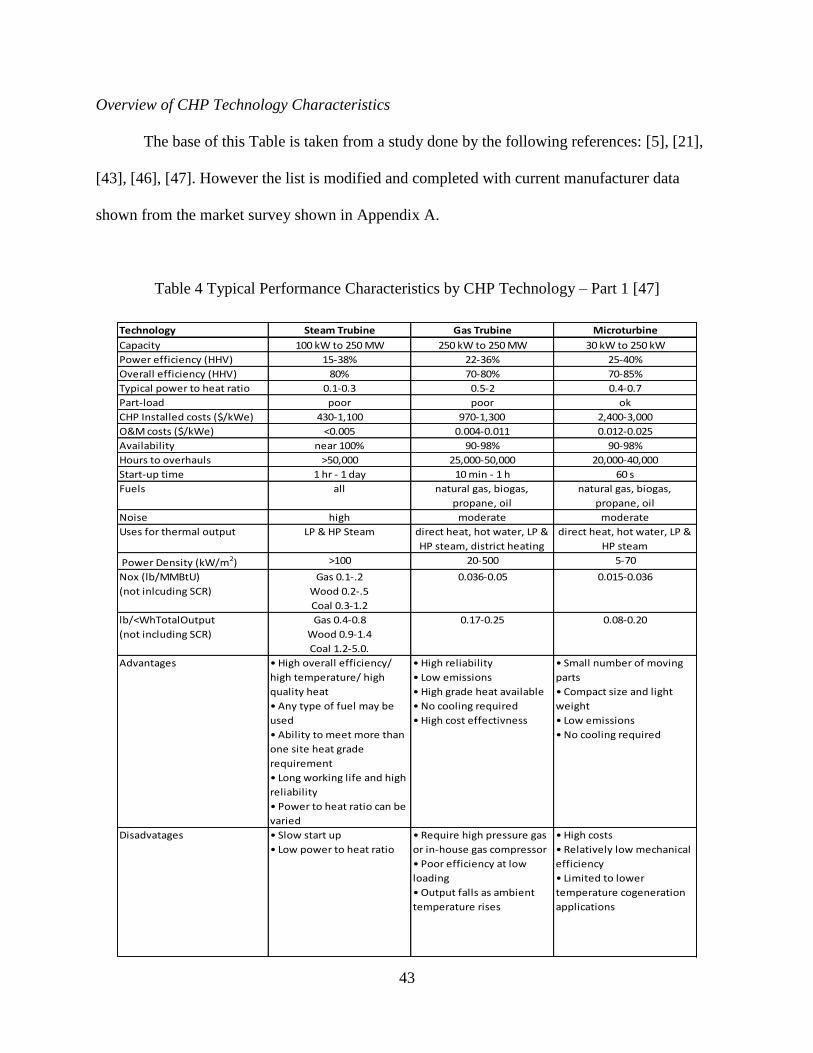
43
Overview of CHP Technology Characteristics
The base of this Table is taken from a study done by the following references: [5], [21],
[43], [46], [47]. However the list is modified and completed with current manufacturer data
shown from the market survey shown in Appendix A.
Table 4 Typical Performance Characteristics by CHP Technology – Part 1 [47]
Technology Steam Trubine Gas Trubine Microturbine
Capacity 100 kW to 250 MW 250 kW to 250 MW 30 kW to 250 kW
Power efficiency (HHV) 15-38% 22-36% 25-40%
Overall efficiency (HHV) 80% 70-80% 70-85%
Typical power to heat ratio 0.1-0.3 0.5-2 0.4-0.7
Part-load poor poor ok
CHP Installed costs ($/kWe) 430-1,100 970-1,300 2,400-3,000
O&M costs ($/kWe) <0.005 0.004-0.011 0.012-0.025
Availability near 100% 90-98% 90-98%
Hours to overhauls >50,000 25,000-50,000 20,000-40,000
Start-up time 1 hr - 1 day 10 min - 1 h 60 s
Fuels all natural gas, biogas,
propane, oil
natural gas, biogas,
propane, oil
Noise high moderate moderate
Uses for thermal output LP & HP Steam direct heat, hot water, LP &
HP steam, district heating
direct heat, hot water, LP &
HP steam
Power Density (kW/m2) >100 20-500 5-70
Nox (lb/MMBtU)
(not inlcuding SCR)
Gas 0.1-.2
Wood 0.2-.5
Coal 0.3-1.2
0.036-0.05 0.015-0.036
lb/<WhTotalOutput
(not including SCR)
Gas 0.4-0.8
Wood 0.9-1.4
Coal 1.2-5.0.
0.17-0.25 0.08-0.20
Advantages • High overall efficiency/
high temperature/ high
quality heat
• Any type of fuel may be
used
• Ability to meet more than
one site heat grade
requirement
• Long working life and high
reliability
• Power to heat ratio can be
varied
• High reliability
• Low emissions
• High grade heat available
• No cooling required
• High cost effectivness
• Small number of moving
parts
• Compact size and light
weight
• Low emissions
• No cooling required
Disadvatages • Slow start up
• Low power to heat ratio
• Require high pressure gas
or in-house gas compressor
• Poor efficiency at low
loading
• Output falls as ambient
temperature rises
• High costs
• Relatively low mechanical
efficiency
• Limited to lower
temperature cogeneration
applications

44
Table 5 Typical Performance Characteristics by CHP Technology – Part 2 [47]
Technology Reciprocating Engine Stirling Engine Fuel Cell
Capacity 0.5 kW to 5MW 2 kW to 1250 kW 0.5 to 2 MW
Power efficiency (HHV) 26-40% 15-30% 30-63%
Overall efficiency (HHV) 70-92% 75-95% 80-90%
Typical power to heat ratio 0.5-1 1-2
Part-load ok ok good
CHP Installed costs ($/kWe) 800-2,200 1,100-2,600 5,000-6,500
O&M costs ($/kWe) 0.009-0.022 0.009-0.013 0.0098-0.0147
Availability 92-97% >95%
Hours to overhauls 25,000-50,000 >50,000 32,000-64,000
Start-up time 10 s 3 h - 2 days
Fuels natural gas, biogas, propane,
landfill gas, diesel
natural gas, biogas, propane,
landfill gas
hydrogen, natural gas,
propane
Noise high low low
Uses for thermal output hot water, LP steam, district
heating
hot water, LP steam, district
heating
hot water, LP & HP steam
Power Density (kW/m2) 35-50 5-20
Nox (lb/MMBtU)
(not inlcuding SCR)
0.013 rich burn 3-way cat.
0.17 lean burn
0.0025-.0040
lb/<WhTotalOutput
(not including SCR)
0.06 rich burn 3-way cat.
0.8 lean burn
0.011-0.016
Advantages • High power efficiency with part-
load operational flexibility
• Fast start-up
• Relatively low investment cost
• Can be used in standalone mode
and have good load following
capability
• Can be overhauled on site with
normal operators
• Operate on low-pressure gas
• Fuel flexibility
• Low emission
• Low noise/ vibration level
• Good performance at partial
load
• Relative easy to maintain
• Low emissions
• Low noise
• High efficiency
• Good part load behavior
• Low maintenance
Disadvatages • High maintenance costs
• Limited to lower temperature
cogeneration applications
• Relatively high air emissions
• Must be cooled even if recovered
heat is not used
• High levels of low frequency
noise
• No high grade heat available
• Low electrical efficiency • High costs
• Low durability
• Fuels requiring processing
unless pure hydrogen is
used
• Start-up time
45
Efficiency of CHP Systems
n n η n v n n . T b
applies also for combined heat and power systems, while the fraction of useful energy consists of
power and heat. The remaining energy is lost as low temperature heat within the exhaust gases
and as radiation and convention losses from the engine and generator. The calculation of the
efficiency is based on the following equations:
Electrical efficiency η
P ,
P , n
Thermal efficiency η
P ,
P , n
Overall efficiency η
P , ( ) P ,
P , n
The overall efficiency of a CHP system depends on the prime mover, its size, and the
temperature at which the recovered heat can be utilized. The overall efficiency is, however, a
first law efficiency that does not represent the quality of the electrical and heat production. For
CHP systems it is worth considering the exergy efficiency of the system, i.e. the availability or
capacity of the system to perform useful work. The exergy efficiency is expressed as the ratio
between the exergy delivered by the system and the exergy entering with the fuel. Usually, the
quality and value of electric energy is higher relative to the heat output. Further, it is easier to
transmit electricity over long distances or convert it into other forms of energy. For this reason,
the Public Utilities Regulation Regulatory Policies Act of 1978 (PURPA) introduces the
calculation of the efficiency standard EffFERC [47]. This basic change is that the thermal output
only counts half. Another useful measure for a CHP system is the fuel utilization effectiveness
(FUE). The FUE describes effective electrical efficiency, where the portion of useful heat is
excluded. A third calculation, and by the EPA considered as the most appropriate one, is the
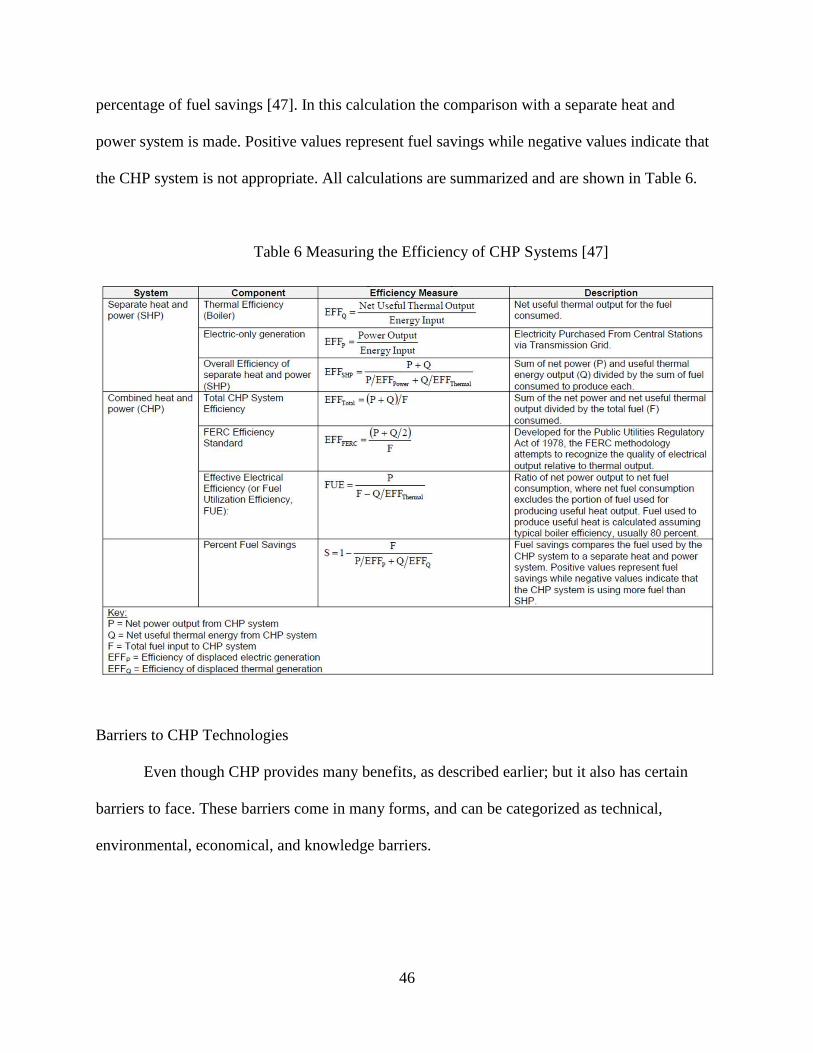
46
percentage of fuel savings [47]. In this calculation the comparison with a separate heat and
power system is made. Positive values represent fuel savings while negative values indicate that
the CHP system is not appropriate. All calculations are summarized and are shown in Table 6.
Table 6 Measuring the Efficiency of CHP Systems [47]
Barriers to CHP Technologies
Even though CHP provides many benefits, as described earlier; but it also has certain
barriers to face. These barriers come in many forms, and can be categorized as technical,
environmental, economical, and knowledge barriers.
47
Technical Barriers:
One of the technical barriers is the grid interconnection. CHP systems, which are
operating parallel to the grid, need a safe and reliable connection to it. The current existing grid
is not fully designed for back and forth electricity transactions, and the current lack of standards
makes it difficult for grid operators and manufacturers to provide uniform solutions. However,
the International Electrical and Electronics Engineers (IEEE) developed a standard for
interconnecting distributed resources with electric power systems, which is already adopted by
several states [25]. But the process to adjust the grid takes time.
Another technical aspect is that some technologies, e.g. Stirling engines, have not reached
fully marketability, yet. Consequently, there are still only a few concrete practical evaluations
over their lifetimes, as to their need of maintenance and repair, and thus the efficiency of these
units.
Environmental Barriers:
According to the International Energy Agency (IEA) there is still a lack of recognition of
CHP in environmental regulations. Most U.S. environmental regulation established emission
limits based on heat input (kg/kWh) or exhaust concentration (ppm), in order to account for the
efficiency benefits of recovering waste heat or savings due to the eliminated transmission losses.
Using output-based calculation standards (kg/kWh of total output) can be a way to recognize the
benefits of CHP systems. However, a federal procedure for issuing permits is still missing. [26]
Economic Barriers:
The economic barriers carry the highest potential of improvement for CHP, because the
systems are measured, e.g. at their cost. Companies are faced with the question of whether
profitable investments in alternative energy supply are reasonable, or an investment in their core
48
business is better than the construction and operation of a CHP plant. The idea that CHP is not
necessary to maintain the supply of electricity and heat, but "only" brings energy savings and
thus protects the climate, can also have influence on this decision.
First, costly standby and backup charges can come to the operator. Back up rates are
intended to allow utilities to recover the cost of developing and maintaining capacity to provide
service for generation, transmission, or distribution of capacity. In general, rate structures have a
large influence on the economic feasibility of a CHP system. Rising demand charges, as well as
rate structures that recover the majority of the cost by fixed service charges, reduce the economic
savings potential of CHP [26].
Another issue is tax policy. CHP systems do not fall into a specific tax depreciation
category. As a result, the depreciation period can range from 5 to 39 years [26]. This
circumstance might make it more difficult for some owners to recover acquisition costs.
A third economic barrier could be that the energy costs on the market effect the economic
feasibility of CHP systems. Depending on which fuel the CHP system uses the purchase of this
fuel source has to be cheaper than the price for electricity. If the fuel is expensive relative to
electricity, it does not make sense to purchase it to produce electricity. In most cases natural gas
is used to operate the CHP system. Thus, it should be noted, that the price for natural gas must be
cheaper than the price for electricity. In general, a low electricity price, a lack of compensation
or surcharges for electricity fed into the grid, and a high fuel cost, are economic barriers for the
use of CHP. This especially influences small scale CHP operations.
Another influence factor is especially important for small scale CHP systems: the
electrical efficiency decreases with the size of the plant. In return, however, higher investment
costs and higher maintenance costs must be paid for smaller plants. This can also present a
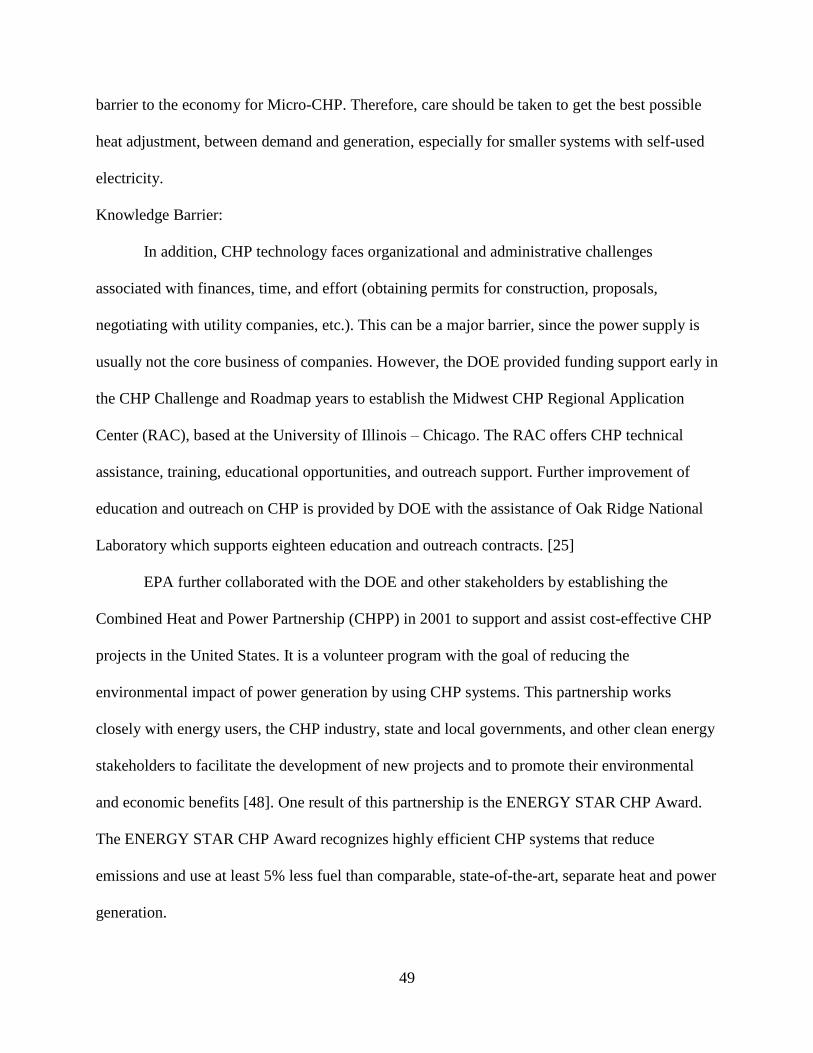
49
barrier to the economy for Micro-CHP. Therefore, care should be taken to get the best possible
heat adjustment, between demand and generation, especially for smaller systems with self-used
electricity.
Knowledge Barrier:
In addition, CHP technology faces organizational and administrative challenges
associated with finances, time, and effort (obtaining permits for construction, proposals,
negotiating with utility companies, etc.). This can be a major barrier, since the power supply is
usually not the core business of companies. However, the DOE provided funding support early in
the CHP Challenge and Roadmap years to establish the Midwest CHP Regional Application
Center (RAC), based at the University of Illinois – Chicago. The RAC offers CHP technical
assistance, training, educational opportunities, and outreach support. Further improvement of
education and outreach on CHP is provided by DOE with the assistance of Oak Ridge National
Laboratory which supports eighteen education and outreach contracts. [25]
EPA further collaborated with the DOE and other stakeholders by establishing the
Combined Heat and Power Partnership (CHPP) in 2001 to support and assist cost-effective CHP
projects in the United States. It is a volunteer program with the goal of reducing the
environmental impact of power generation by using CHP systems. This partnership works
closely with energy users, the CHP industry, state and local governments, and other clean energy
stakeholders to facilitate the development of new projects and to promote their environmental
and economic benefits [48]. One result of this partnership is the ENERGY STAR CHP Award.
The ENERGY STAR CHP Award recognizes highly efficient CHP systems that reduce
emissions and use at least 5% less fuel than comparable, state-of-the-art, separate heat and power
generation.

50
CHAPTER V
V. RESULTS OF CHP APPLICATION FOR A RESIDENTIAL BUILDING
In the second part of this paper, the applicability of a Micro-CHP system for residential
buildings in the USA is investigated. In Europe, especially in Germany, the UK and the
Netherlands, as well as in Japan, Micro-CHP is already a more or less established technology.
But those countries are characterized by a widely available gas network, reasonable long heating
seasons, and high electricity prices. In contrast, the U.S. residential building energy concept is
still based on a conventional power supply. This analysis will give an idea of the usability for
small, decentralized CHP systems. Therefore, a typical single family house (two adults, two
children) is modeled to generate load distributions for electricity, hot water, space heating and
space cooling.
First a conventional supply system is described. Typical systems in the U.S. are boilers
and furnaces, based almost entirely on natural gas, or electricity. The separate heat and power
generation is used as a reference calculation. Next, combined heat and power technologies are
investigated. Residential buildings have demand smaller than 4 kWel. Due to this limited range
only a few technologies are suitable: reciprocating internal combustion engines, fuel cells, and
external combustion/ Stirling engines. For this case study one unit is selected for each
technology for the calculations.
The calculations of heating and cooling loads are based on TRNSYS; for all further
calculation the CHP simulation software BHKW Plan is used. This analysis is focused on site

51
energy consumption, emissions, as well as resulting economics. The effect of different fuel types
is not investigated, and only one fuel source is considered to simplify calculations and to make
the different systems comparable to each other. Natural gas is chosen, due to the fact that it is
cheap, widely available in residential areas, and CHP units are usually designed for it.
Building Loads
The building loads are composed of the heating and cooling loads of the building, the hot
water demand, and the electricity demand. These loads arise from the building envelope, the
weather, and the people living in the building. Details are described in the next chapters.
Building Description
The heating and cooling loads are mainly influenced by the design of the building and the
weather conditions. Northern regions have a higher heating demand and southern regions a
higher cooling demand, which influences the building design. The EIA divides the U.S. into four
climatic regions, while this study concentrates only on the far north and far south region, taking
Chicago, IL and Atlanta, GA as example. The building description is based on different studies
in this area [2], [16], as well as ASHREA Guidelines. In Table 7 the dimensions as well as the
thermal resistance values of walls, ceiling and floor are described for both buildings. These data
are the basics for the TRNSYS model. Additional drawings for the buildings can be found in
Appendix B.
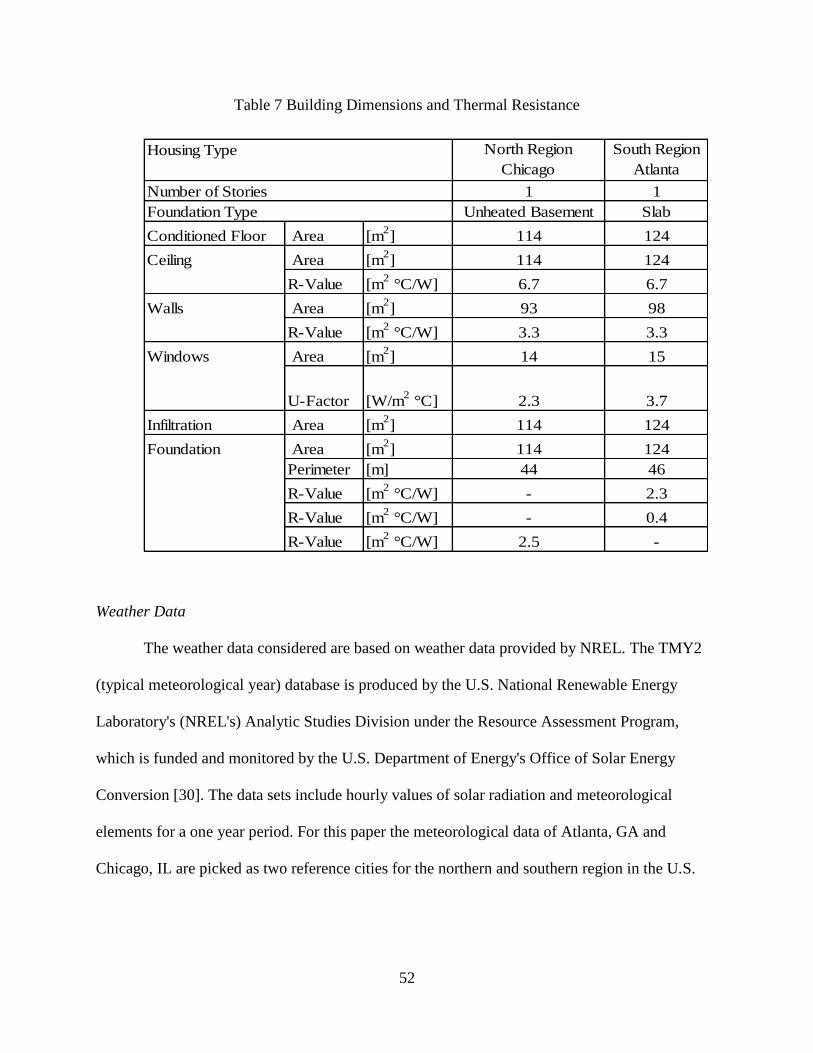
52
Table 7 Building Dimensions and Thermal Resistance
Housing Type North Region
Chicago
South Region
Atlanta
Number of Stories 1 1
Foundation Type Unheated Basement Slab
Conditioned Floor Area [m2] 114 124
Ceiling Area [m2] 114 124
R-Value [m2 °C/W] 6.7 6.7
Walls Area [m2] 93 98
R-Value [m2 °C/W] 3.3 3.3
Windows Area [m2] 14 15
U-Factor [W/m2 °C] 2.3 3.7
Infiltration Area [m2] 114 124
Foundation Area [m2] 114 124
Perimeter [m] 44 46
R-Value [m2 °C/W] - 2.3
R-Value [m2 °C/W] - 0.4
R-Value [m2 °C/W] 2.5 -
Weather Data
The weather data considered are based on weather data provided by NREL. The TMY2
(typical meteorological year) database is produced by the U.S. National Renewable Energy
Laboratory's (NREL's) Analytic Studies Division under the Resource Assessment Program,
which is funded and monitored by the U.S. Department of Energy's Office of Solar Energy
Conversion [30]. The data sets include hourly values of solar radiation and meteorological
elements for a one year period. For this paper the meteorological data of Atlanta, GA and
Chicago, IL are picked as two reference cities for the northern and southern region in the U.S.
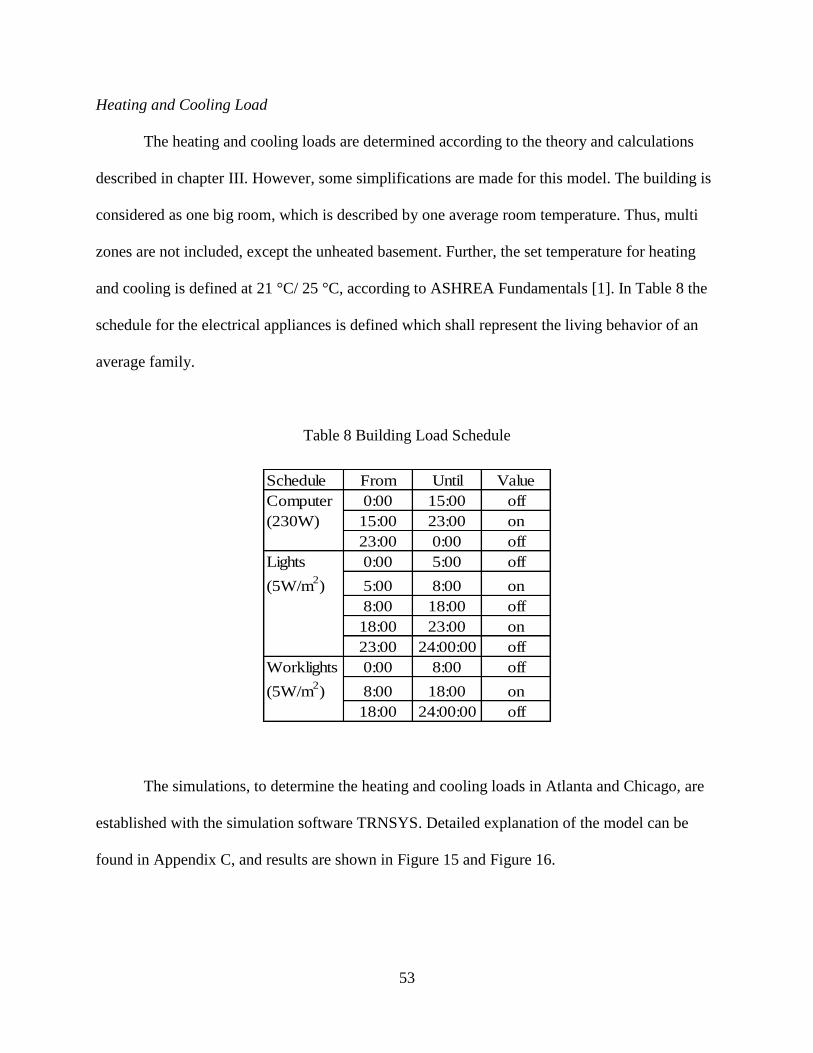
53
Heating and Cooling Load
The heating and cooling loads are determined according to the theory and calculations
described in chapter III. However, some simplifications are made for this model. The building is
considered as one big room, which is described by one average room temperature. Thus, multi
zones are not included, except the unheated basement. Further, the set temperature for heating
and cooling is defined at 21 °C/ 25 °C, according to ASHREA Fundamentals [1]. In Table 8 the
schedule for the electrical appliances is defined which shall represent the living behavior of an
average family.
Table 8 Building Load Schedule
Schedule From Until Value
Computer 0:00 15:00 off
(230W) 15:00 23:00 on
23:00 0:00 off
Lights 0:00 5:00 off
(5W/m2) 5:00 8:00 on
8:00 18:00 off
18:00 23:00 on
23:00 24:00:00 off
Worklights 0:00 8:00 off
(5W/m2) 8:00 18:00 on
18:00 24:00:00 off
The simulations, to determine the heating and cooling loads in Atlanta and Chicago, are
established with the simulation software TRNSYS. Detailed explanation of the model can be
found in Appendix C, and results are shown in Figure 15 and Figure 16.
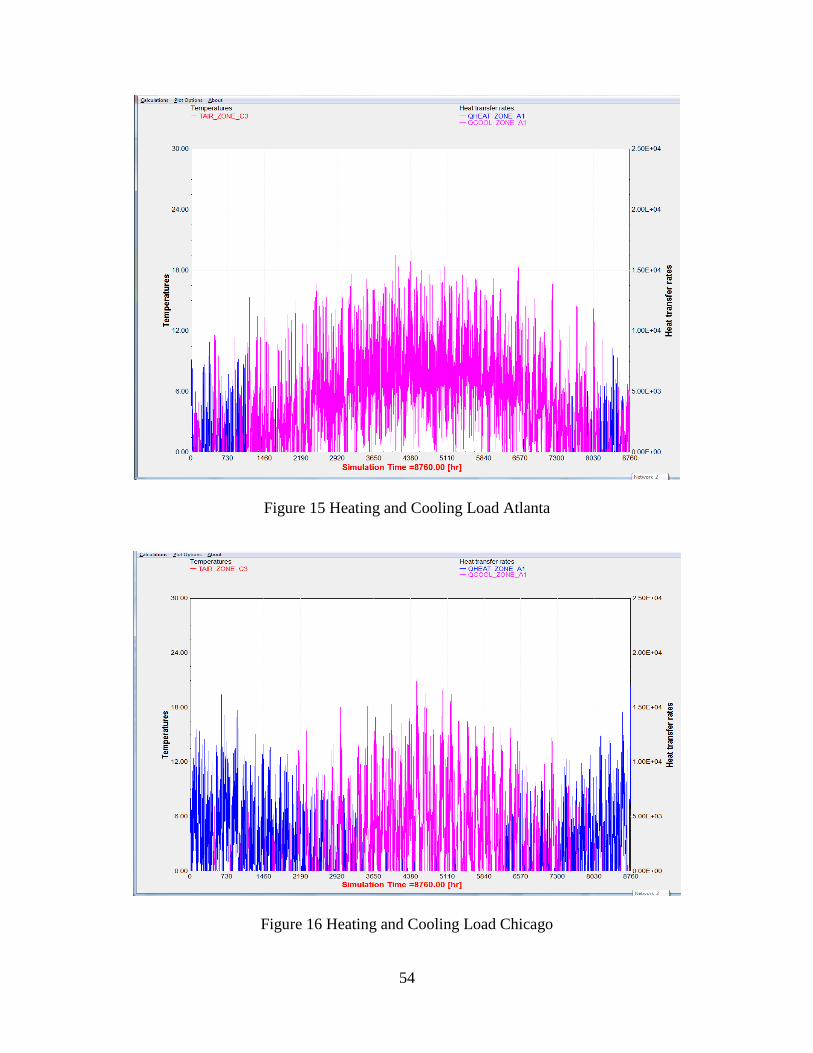
54
Figure 15 Heating and Cooling Load Atlanta
Figure 16 Heating and Cooling Load Chicago

55
Hot Water
The hot water demand is, after building heating, the second highest consumer of thermal
heat. The amount and distribution of the hot water demand is composed of the number of
bathrooms, toilets, showers, the number of people who use them, as well as hot water equipment
such as dishwashers, and washing machines. Different studies are published presenting the hot
water demand in the U.S., e.g. University of Central Florida [15], Department of Energy [40], or
Becker and Stogsdill [4]. However, all studies show average values for the U.S. and do not give
more precise disclosures for specific cities or regions. For this reason, no difference in
consumption is made based on the locality. The usage distribution is developed based on the
named literature and is shown in Figure 17.
The second factor for the hot water demand calculation is the temperature requirement.
The Pacific Gas and Electric Company provides monthly ground water temperatures for different
climate zones [15]. This analysis is based on the values shown in Table 9. The water supply
temperature is set to 60 °C, as recommended by ASHREA [1].
Table 9 Monthly Average Supply Temperatures in [°C] [15]
January February March April May June
Atlanta, GA 15.6 14.9 14.8 15.1 16.4 17.7
Chicago, IL 15.1 14.5 14.4 14.7 15.8 16.9
July August September October November December
Atlanta, GA 18.9 19.6 19.7 19.1 17.9 16.7
Chicago, IL 17.8 18.4 18.4 17.9 17.1 16.0
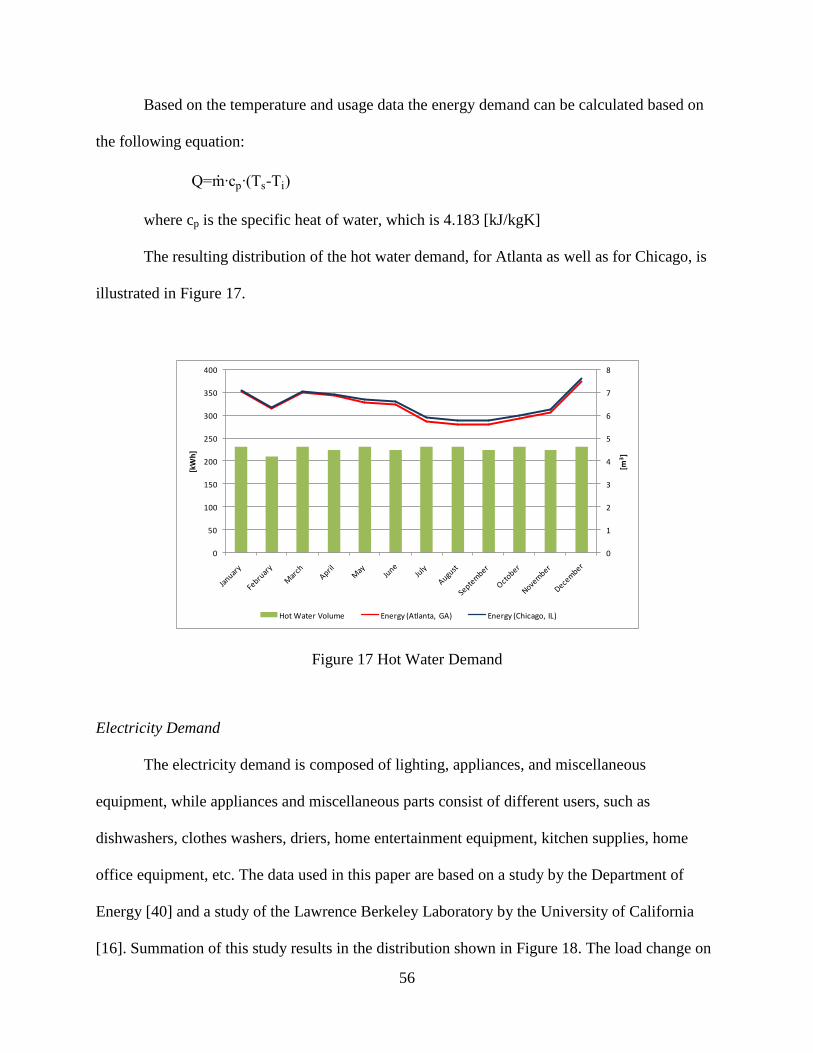
56
Based on the temperature and usage data the energy demand can be calculated based on
the following equation:
T -T
where cp is the specific heat of water, which is 4.183 [kJ/kgK]
The resulting distribution of the hot water demand, for Atlanta as well as for Chicago, is
illustrated in Figure 17.
0
1
2
3
4
5
6
7
8
0
50
100
150
200
250
300
350
400
[m3]
[kW
h]
Hot Water Volume Energy (Atlanta, GA) Energy (Chicago, IL)
Figure 17 Hot Water Demand
Electricity Demand
The electricity demand is composed of lighting, appliances, and miscellaneous
equipment, while appliances and miscellaneous parts consist of different users, such as
dishwashers, clothes washers, driers, home entertainment equipment, kitchen supplies, home
office equipment, etc. The data used in this paper are based on a study by the Department of
Energy [40] and a study of the Lawrence Berkeley Laboratory by the University of California
[16]. Summation of this study results in the distribution shown in Figure 18. The load change on
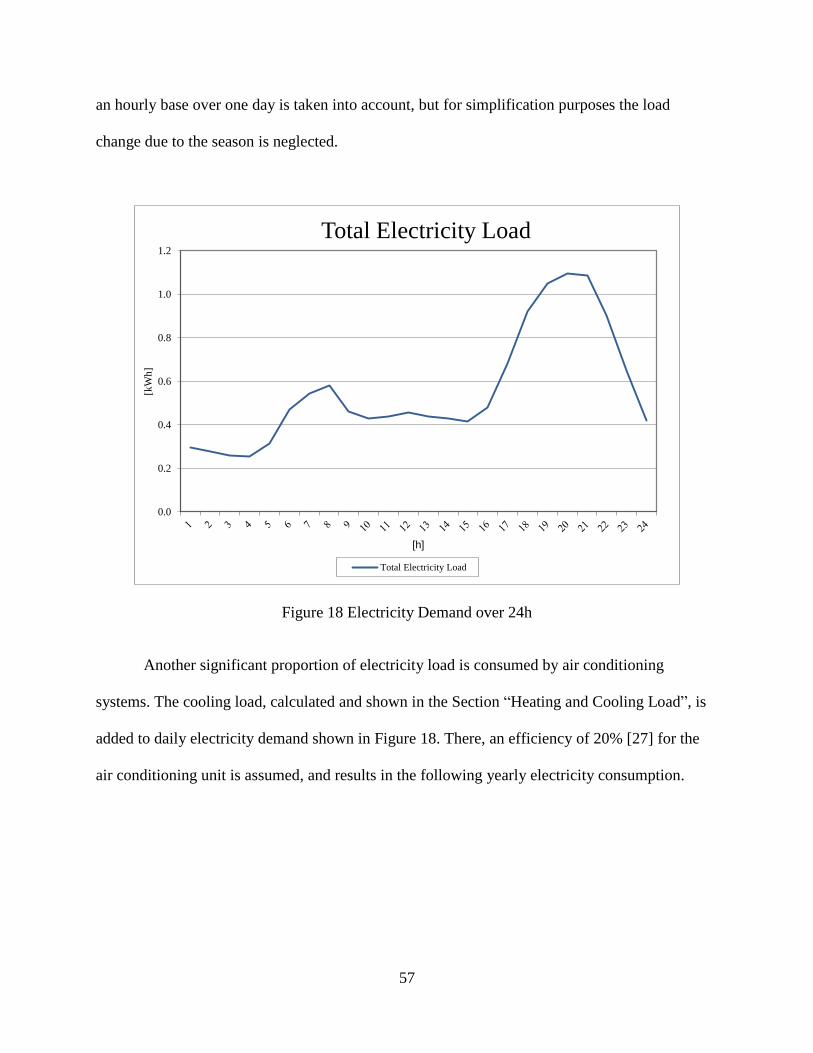
57
an hourly base over one day is taken into account, but for simplification purposes the load
change due to the season is neglected.
Figure 18 Electricity Demand over 24h
Another significant proportion of electricity load is consumed by air conditioning
systems. The cooling load, calculated and shown in the Section “Heating and Cooling Load”, is
added to daily electricity demand shown in Figure 18. There, an efficiency of 20% [27] for the
air conditioning unit is assumed, and results in the following yearly electricity consumption.
0.0
0.2
0.4
0.6
0.8
1.0
1.2
[kW
h]
[h]
Total Electricity Load
Total Electricity Load

58
0
1
2
3
4
5
6
7
12
84
56
78
50
11
33
14
16
16
99
19
82
22
65
25
48
28
31
31
14
33
97
36
80
39
63
42
46
45
29
48
12
50
95
53
78
56
61
59
44
62
27
65
10
67
93
70
76
73
59
76
42
79
25
82
08
84
91
[kW
h]
[hours]
Atlanta
Chicago
Figure 19 Annual Electricity Consumption for Atlanta and Chicago
Energy Requirements for Residential Buildings
The load distribution affects the equipment design. Especially the heating load will have
an effect on the thermal storage system and the CHP system, since the usage of heat is the key
factor for CHP systems. By counting the different heat and electricity demands together, the
annual demand is established, as shown in Table 10. The heating demand in Chicago is
significantly higher than in Atlanta, which is a result of the colder and longer winters in Chicago.
Conversely, for the electrical demand, Atlanta’ w n 14.1 MWh/a higher than
’ , due to the hot summers, where temperatures are cooled down by electric air
conditioners.

59
Table 10 Total Heat and Power Demand
Atlanta Chicago
Heat Demand [MWh/a] 4.7 7.5
Power Demand [MWh/a] 14.1 10
Supply Systems
The most common Micro-CHP systems for residential applications are internal
combustion engines, Stirling engines, and fuel cells. They can be built in small scale, and can
operate silently. For this reason, these three technologies are investigated in this case study.
Additionally, a conventional system with separate heat and power generation is described for
comparison. It needs to be noted that for all systems only natural gas is considered as fuel source.
There are two reasons for this: First natural gas is a cheap and easily available fuel source, and
most CHP system can be operated with it. Further, the capability of Micro-CHP for residential
buildings is the focus of this case study; thus the influence of the fuel source is kept fixed.
Separate Seat and Power System
Conventional heat and power is provided by separate systems. Today, most homes built in
the United States use a forced air system to provide cooling. For further calculations, a Lennox
HVAC system with 20% efficiency is considered. For heating and hot water generation a natural
gas boiler from Viessmann with 94% efficiency is used. A sketch of a typical separate heat and
power supply system is shown in Figure 20. All involved heat processes are shown in red,
cooling in blue, and electricity in yellow.
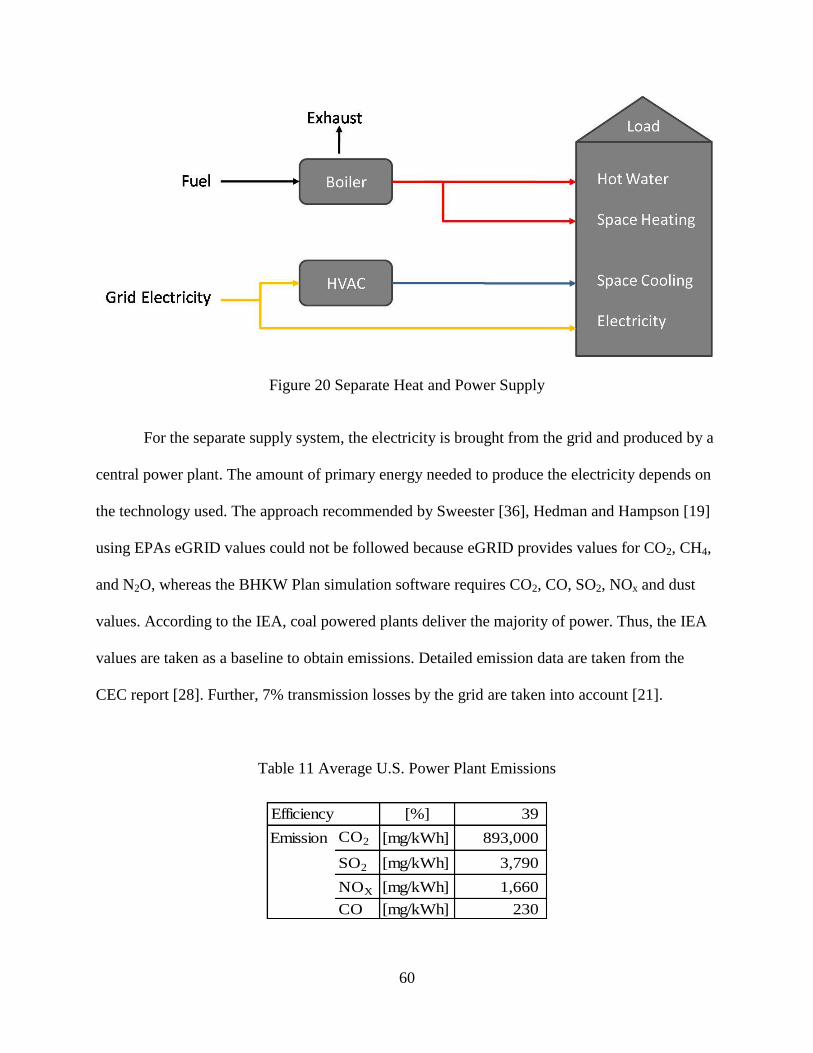
60
Figure 20 Separate Heat and Power Supply
For the separate supply system, the electricity is brought from the grid and produced by a
central power plant. The amount of primary energy needed to produce the electricity depends on
the technology used. The approach recommended by Sweester [36], Hedman and Hampson [19]
using EPAs eGRID values could not be followed because eGRID provides values for CO2, CH4,
and N2O, whereas the BHKW Plan simulation software requires CO2, CO, SO2, NOx and dust
values. According to the IEA, coal powered plants deliver the majority of power. Thus, the IEA
values are taken as a baseline to obtain emissions. Detailed emission data are taken from the
CEC report [28]. Further, 7% transmission losses by the grid are taken into account [21].
Table 11 Average U.S. Power Plant Emissions
Efficiency [%] 39
Emission CO2 [mg/kWh] 893,000
SO2 [mg/kWh] 3,790
NOX [mg/kWh] 1,660
CO [mg/kWh] 230

61
Integration of Combined Heat and Power
The implementation of a CHP system is shown in Figure 21. Since Micro-CHP systems
run most efficiently under constant conditions, the system has to run for a certain amount of
time. To adjust to the varying electricity demand, a battery is sometimes placed as a buffer
between the building load and the electric output of the CHP system. With those batteries stand-
alone systems are possible. Batteries, however, are still very expensive, and are not required as
long as the system is not placed in a very isolated area. In general a direct connection to the grid
makes more sense, and thus the battery option is not considered in this case study. For a varying
heating load, a thermal tank is integrated into the supply system. In general, those tanks are
already included in the CHP unit, like in the chosen units for this study. In addition, an auxiliary
boiler/ peak boiler is employed in case the demand exceeds the heat generation or the CHP fails.
As described in the Section “Principles of Combined Heat and Power”, CHP systems can be
operated in power or heat-oriented mode. In this case study only the heat-oriented operation is
considered, since for residential buildings it is easier to adjust the electricity, and focus on heat
generation. Thus, only the heat-oriented interpretation guarantees the highest possible utilization
of the fuel, and with that the technically highest achievable overall efficiency. Space cooling is
still provided by an electric air conditioning system with 20% efficiency. Absorption chillers are
not applicable for this size, because the acquisition costs are too high. Thus, there are only a few
manufacturers in the market.
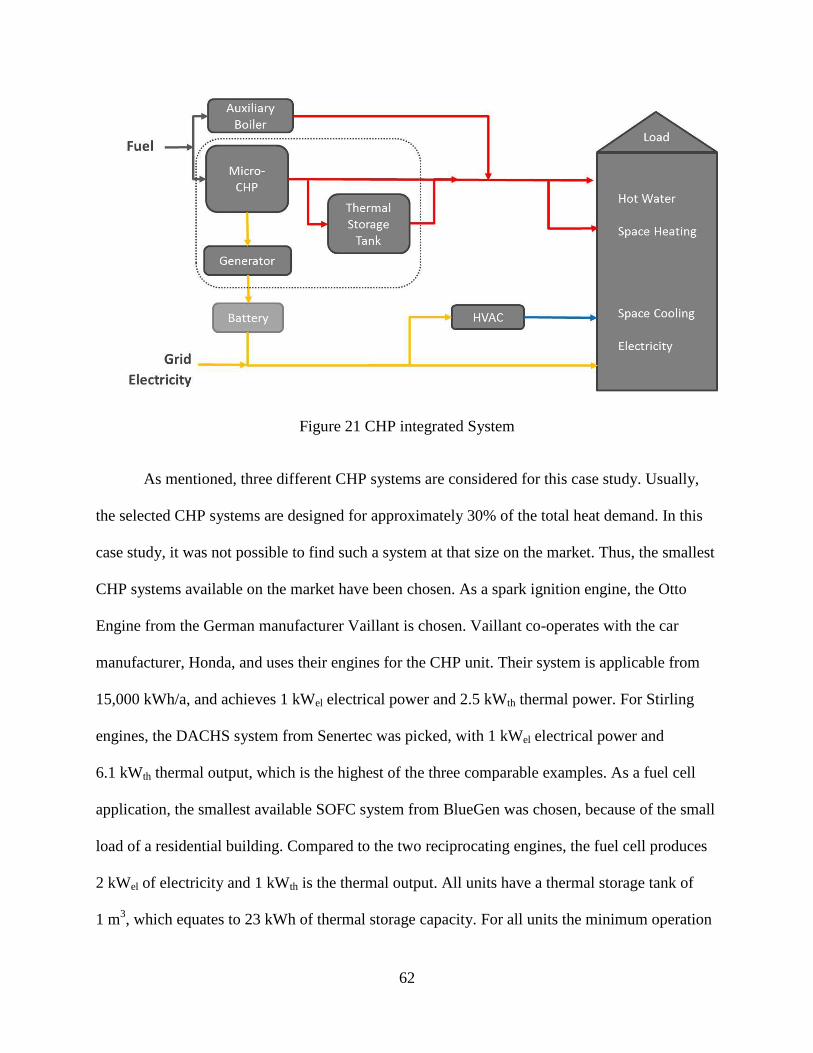
62
Figure 21 CHP integrated System
As mentioned, three different CHP systems are considered for this case study. Usually,
the selected CHP systems are designed for approximately 30% of the total heat demand. In this
case study, it was not possible to find such a system at that size on the market. Thus, the smallest
CHP systems available on the market have been chosen. As a spark ignition engine, the Otto
Engine from the German manufacturer Vaillant is chosen. Vaillant co-operates with the car
manufacturer, Honda, and uses their engines for the CHP unit. Their system is applicable from
15,000 kWh/a, and achieves 1 kWel electrical power and 2.5 kWth thermal power. For Stirling
engines, the DACHS system from Senertec was picked, with 1 kWel electrical power and
6.1 kWth thermal output, which is the highest of the three comparable examples. As a fuel cell
application, the smallest available SOFC system from BlueGen was chosen, because of the small
load of a residential building. Compared to the two reciprocating engines, the fuel cell produces
2 kWel of electricity and 1 kWth is the thermal output. All units have a thermal storage tank of
1 m3, which equates to 23 kWh of thermal storage capacity. For all units the minimum operation

63
set point is 50% of the design value of the CHP system. If the demand is below that value, the
system will be shut down, because the system will not operate efficiently enough. The size and
the noise level for all three systems are nearly the same. Table 12 shows the manufactured units
with their performance data.
Table 12 Performance Data Micro-CHP System
Micro-CHP Model Pel Pth ηel ηth ηtotal Fuel Noise Level Dimensions Weight
Technology [kW] [kW] [%] [%] [%] [dB(A)] [m] [kg]
Otto Engine ecoPOWER 1.0 1 2.5 26.3 65.7 92 natural gas 46 1.132/1.18/0.32 100
Stirling Engine DACHS 1 6.1 13 79 92 natural gas 45 1.9/0.86/1.34 -
Solid oxide fuel cell BlueGen 2 1 60 25 85 natural gas 45 1.1/0.6/0.66 195
Economic Data
Besides performance data, economic analysis is another key factor for the decision to
adopt CHP systems. The costs of implementing a Micro-CHP system include the capital cost of
equipment, installation, maintenance and fuel cost. The capital cost of Micro-CHP systems arises
between $20,000 for the reciprocating engines and $30,600 for the fuel cell. For those
investments, the U.S. government gives a Business Energy Investment Tax Credit (ITC) for CHP
systems. Credits of 10% for the combustion engines and 30% for fuel cells are available [42].
The incentives for fuel cells are limited to a maximum of $1,500 per 0.5 kW. If biomass were
used as a fuel source even further incentives would be possible. Since, for this case study the
influence of biomass is not considered, therefore those incentives cannot be applied.
Furthermore, natural gas and electricity prices are a significant factor for CHP application. In the
USA the prices for natural gas and electricity are relatively low. The employed rate structure is
taken from the following references: [17],[18],[44]. All calculations are performed with a fixed
rate structure, special demand rates, or day and night rates are not considered. But, the revenues

64
for sold excess electricity are taken into account. For Atlanta the rate for sold electricity is even
higher, than the purchased electricity. From an economic perspective it would make sense to sell
all generated electricity and purchase the demand. Because the acquisition of CHP systems is an
investment which is usually not paid for in cash, an interest rate of 3.656% is considered for the
dynamic payback calculation. The interest rate is defined by Treasury Direct [38]. All detailed
economic data are illustrated in Table 13 and Table 14.
Table 13 Economic Data of Micro-CHP Units in Atlanta
Variante Atlanta
Otto Engine
Atlanta
Stirling Engine
Atlanta
Fuel Cell
Micro-CHP [$] 19222 20214 30627.5
Peak Boiler [$] 3444 3444 3444
purchased electricity [$/kWh] 0.0619 0.0619 0.0619
sold electricity [$/kWh] 0.077 0.077 0.077
Interest [%] 0.03656 0.03656 0.03656
Incentives [$] 1922 2021.4 6000
Sum of Investments [$] 20744 21637 28072
Maintanance CHP [$/kWh] 0.05 0.05 0.07
Maintanance Boiler [$/kWh] 0.03 0.03 0.03
Fuel Cost [$/kWh] 0.023 0.023 0.023
Table 14 Economic Data of Micro-CHP Units in Chicago
Variante Chicago
Otto Engine
Chicago
Stirling Engine
Chicago
Fuel Cell
Micro-CHP [$] 19222 20214 30627.5
Peak Boiler [$] 3444 3444 3444
purchased electricity [$/kWh] 0.152 0.152 0.152
sold electricity [$/kWh] 0.152 0.152 0.152
Interest [%] 0.03656 0.03656 0.03656
Incentives [$] 1922.2 2021.4 6000
Sum of Investments [$] 20744 21637 28072
Maintanance CHP [$/kWh] 0.05 0.05 0.07
Maintanance Boiler [$/kWh] 0.03 0.03 0.03
Fuel Cost [$/kWh] 0.029 0.029 0.029
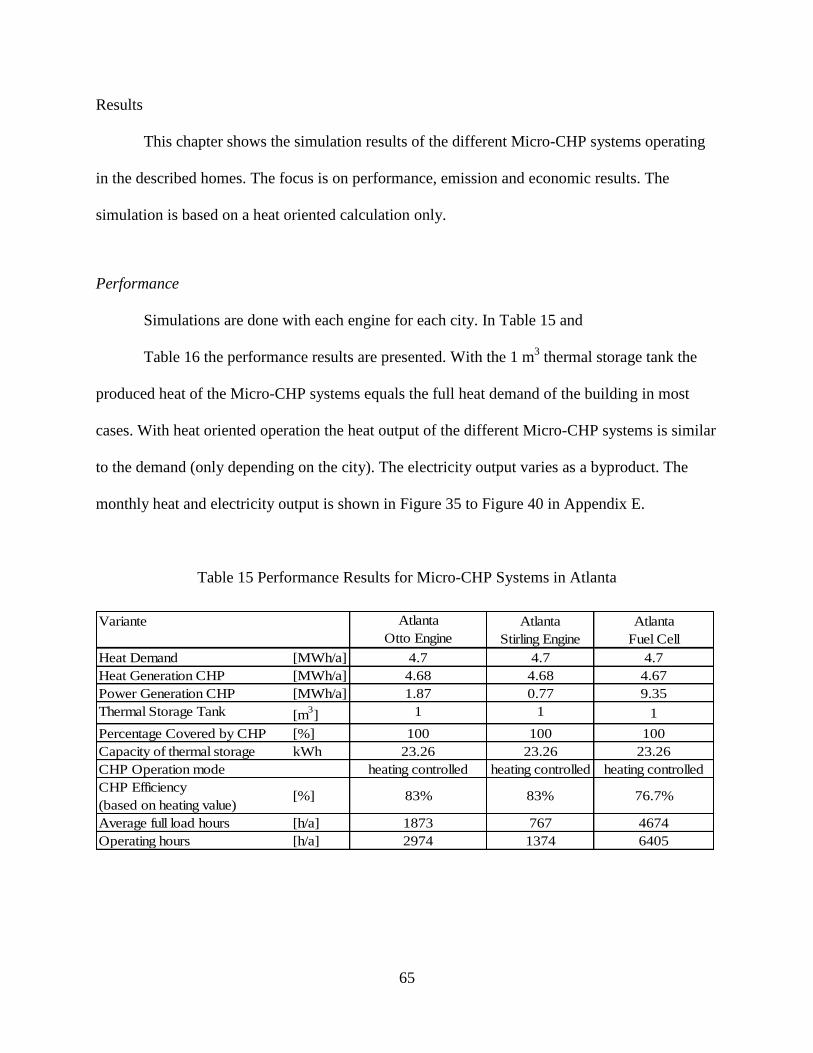
65
Results
This chapter shows the simulation results of the different Micro-CHP systems operating
in the described homes. The focus is on performance, emission and economic results. The
simulation is based on a heat oriented calculation only.
Performance
Simulations are done with each engine for each city. In Table 15 and
Table 16 the performance results are presented. With the 1 m3 thermal storage tank the
produced heat of the Micro-CHP systems equals the full heat demand of the building in most
cases. With heat oriented operation the heat output of the different Micro-CHP systems is similar
to the demand (only depending on the city). The electricity output varies as a byproduct. The
monthly heat and electricity output is shown in Figure 35 to Figure 40 in Appendix E.
Table 15 Performance Results for Micro-CHP Systems in Atlanta
Variante Atlanta
Otto Engine
Atlanta
Stirling Engine
Atlanta
Fuel Cell
Heat Demand [MWh/a] 4.7 4.7 4.7
Heat Generation CHP [MWh/a] 4.68 4.68 4.67
Power Generation CHP [MWh/a] 1.87 0.77 9.35
Thermal Storage Tank [m3] 1 1 1
Percentage Covered by CHP [%] 100 100 100
Capacity of thermal storage kWh 23.26 23.26 23.26
CHP Operation mode heating controlled heating controlled heating controlled
CHP Efficiency
(based on heating value)[%] 83% 83% 76.7%
Average full load hours [h/a] 1873 767 4674
Operating hours [h/a] 2974 1374 6405
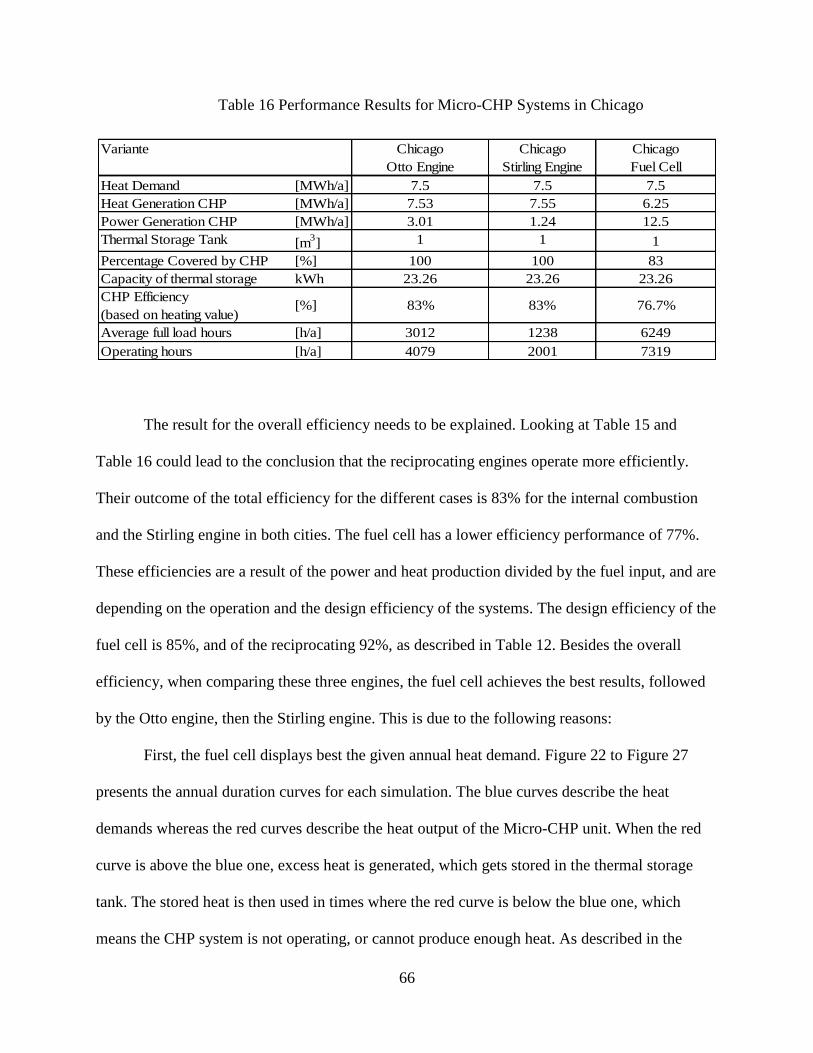
66
Table 16 Performance Results for Micro-CHP Systems in Chicago
Variante Chicago
Otto Engine
Chicago
Stirling Engine
Chicago
Fuel Cell
Heat Demand [MWh/a] 7.5 7.5 7.5
Heat Generation CHP [MWh/a] 7.53 7.55 6.25
Power Generation CHP [MWh/a] 3.01 1.24 12.5
Thermal Storage Tank [m3] 1 1 1
Percentage Covered by CHP [%] 100 100 83
Capacity of thermal storage kWh 23.26 23.26 23.26
CHP Efficiency
(based on heating value)[%] 83% 83% 76.7%
Average full load hours [h/a] 3012 1238 6249
Operating hours [h/a] 4079 2001 7319
The result for the overall efficiency needs to be explained. Looking at Table 15 and
Table 16 could lead to the conclusion that the reciprocating engines operate more efficiently.
Their outcome of the total efficiency for the different cases is 83% for the internal combustion
and the Stirling engine in both cities. The fuel cell has a lower efficiency performance of 77%.
These efficiencies are a result of the power and heat production divided by the fuel input, and are
depending on the operation and the design efficiency of the systems. The design efficiency of the
fuel cell is 85%, and of the reciprocating 92%, as described in Table 12. Besides the overall
efficiency, when comparing these three engines, the fuel cell achieves the best results, followed
by the Otto engine, then the Stirling engine. This is due to the following reasons:
First, the fuel cell displays best the given annual heat demand. Figure 22 to Figure 27
presents the annual duration curves for each simulation. The blue curves describe the heat
demands whereas the red curves describe the heat output of the Micro-CHP unit. When the red
curve is above the blue one, excess heat is generated, which gets stored in the thermal storage
tank. The stored heat is then used in times where the red curve is below the blue one, which
means the CHP system is not operating, or cannot produce enough heat. As described in the

67
Section “supply concepts“, n s of the chosen CHP systems are on the
minimum edge of what is available on the market. Thus, the maximum heat output is often
higher than the recommended 30% of the maximum. The fuel cell, however, follows this
criterion and thus follows the demand very well. Hence, only a little excess heat is produced
which needs to be stored in the thermal storage tank. The overproduction of excess heat is
greatest with the Stirling engine. As is seen in Figure 24 and Figure 25, the thermal output is
higher than the highest demand of the building. Thus, the system only operates 1,374 hours per
year in Atlanta and 2,001 hours per year in Chicago. Recommended hours for sufficient
operation are around 6,000 hours per year. The same is true for the Otto engine which also does
not meet this requirement. With 2,974 hours per year in Atlanta and 4,079 hours per year in
Chicago the values are better, but not satisfying. The question arises if the thermal storage tank
can hold the generated excess heat until it is really needed. Unfortunately, this aspect could not
be analyzed with the BHKW Plan program, because the function is not available. The fuel cell,
however, covers a percentage between 20% and 30% of the maximum demand, as
recommended, and it is able to operate for a long time on maximum load (about 10 months), thus
resulting at maximum efficiency.

68
Figure 22 Annual Heat Load Duration Curve: Atlanta - Otto Engine
Figure 23 Annual Heat Load Duration Curve: Chicago - Otto Engine
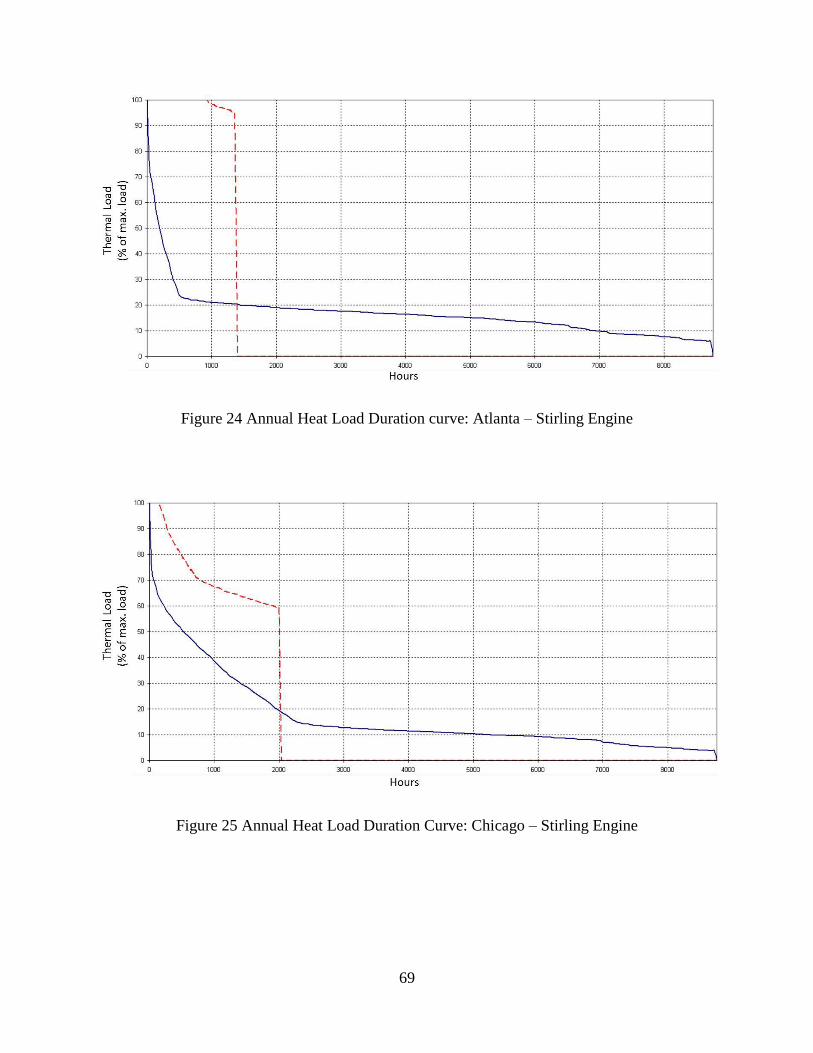
69
Figure 24 Annual Heat Load Duration curve: Atlanta – Stirling Engine
Figure 25 Annual Heat Load Duration Curve: Chicago – Stirling Engine
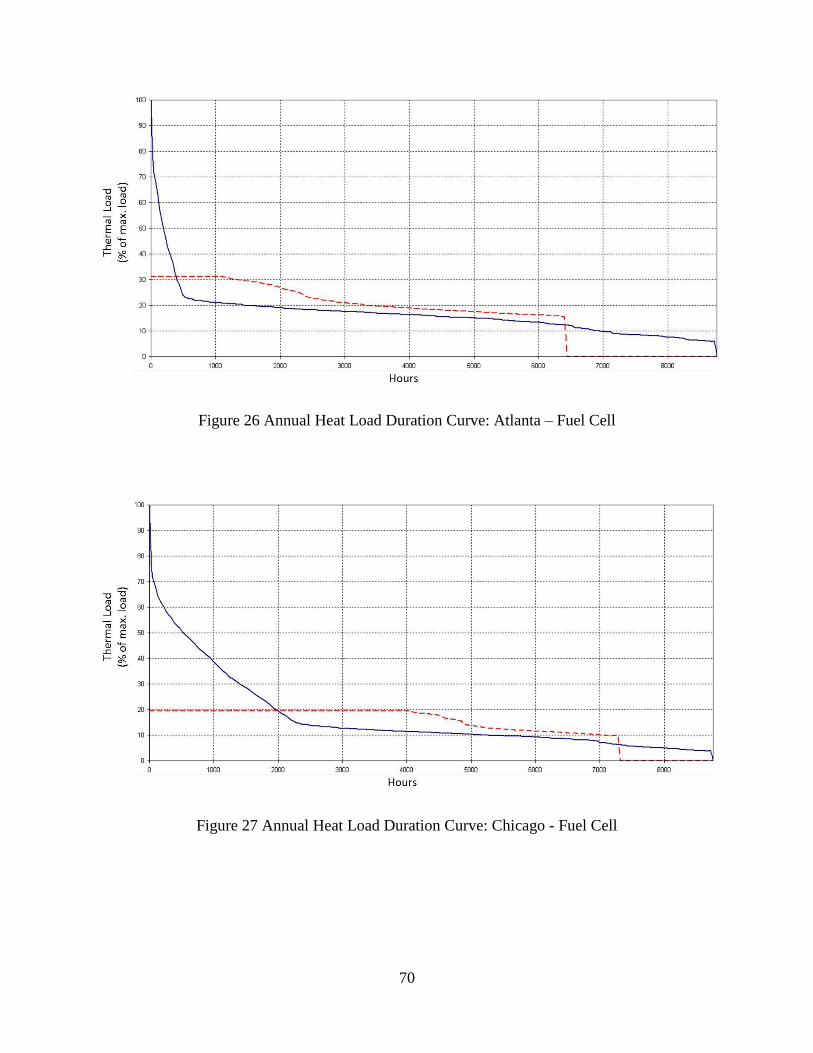
70
Figure 26 Annual Heat Load Duration Curve: Atlanta – Fuel Cell
Figure 27 Annual Heat Load Duration Curve: Chicago - Fuel Cell
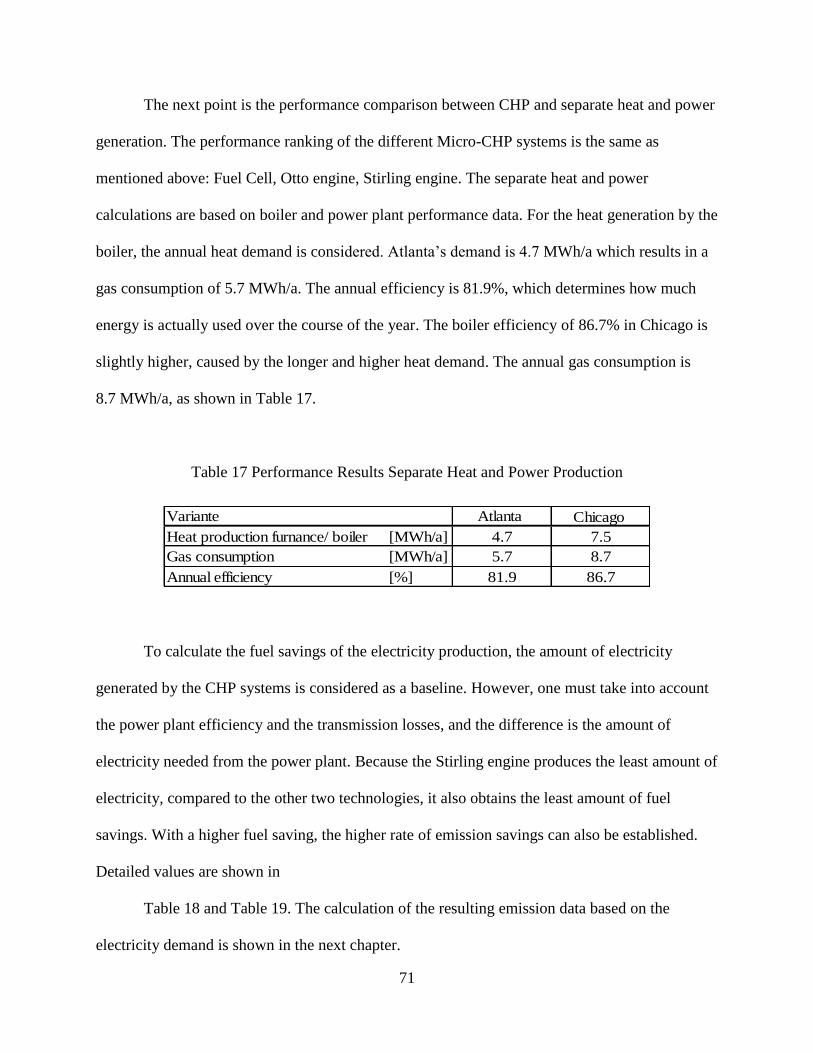
71
The next point is the performance comparison between CHP and separate heat and power
generation. The performance ranking of the different Micro-CHP systems is the same as
mentioned above: Fuel Cell, Otto engine, Stirling engine. The separate heat and power
calculations are based on boiler and power plant performance data. For the heat generation by the
boiler, the annual heat demand is cons . A n ’ n .7 MWh/a which results in a
gas consumption of 5.7 MWh/a. The annual efficiency is 81.9%, which determines how much
energy is actually used over the course of the year. The boiler efficiency of 86.7% in Chicago is
slightly higher, caused by the longer and higher heat demand. The annual gas consumption is
8.7 MWh/a, as shown in Table 17.
Table 17 Performance Results Separate Heat and Power Production
Variante Atlanta Chicago
Heat production furnance/ boiler [MWh/a] 4.7 7.5
Gas consumption [MWh/a] 5.7 8.7
Annual efficiency [%] 81.9 86.7
To calculate the fuel savings of the electricity production, the amount of electricity
generated by the CHP systems is considered as a baseline. However, one must take into account
the power plant efficiency and the transmission losses, and the difference is the amount of
electricity needed from the power plant. Because the Stirling engine produces the least amount of
electricity, compared to the other two technologies, it also obtains the least amount of fuel
savings. With a higher fuel saving, the higher rate of emission savings can also be established.
Detailed values are shown in
Table 18 and Table 19. The calculation of the resulting emission data based on the
electricity demand is shown in the next chapter.
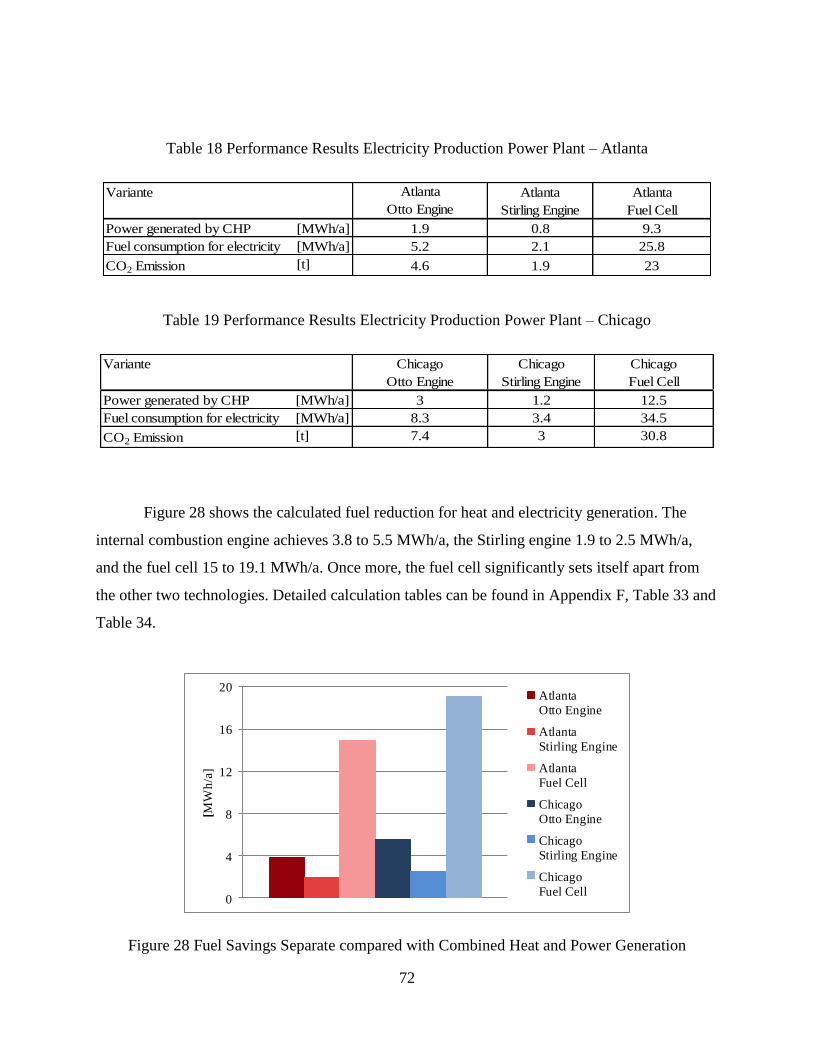
72
Table 18 Performance Results Electricity Production Power Plant – Atlanta
Variante Atlanta
Otto Engine
Atlanta
Stirling Engine
Atlanta
Fuel Cell
Power generated by CHP [MWh/a] 1.9 0.8 9.3
Fuel consumption for electricity [MWh/a] 5.2 2.1 25.8
CO2 Emission [t] 4.6 1.9 23
Table 19 Performance Results Electricity Production Power Plant – Chicago
Variante Chicago
Otto Engine
Chicago
Stirling Engine
Chicago
Fuel Cell
Power generated by CHP [MWh/a] 3 1.2 12.5
Fuel consumption for electricity [MWh/a] 8.3 3.4 34.5
CO2 Emission [t] 7.4 3 30.8
Figure 28 shows the calculated fuel reduction for heat and electricity generation. The
internal combustion engine achieves 3.8 to 5.5 MWh/a, the Stirling engine 1.9 to 2.5 MWh/a,
and the fuel cell 15 to 19.1 MWh/a. Once more, the fuel cell significantly sets itself apart from
the other two technologies. Detailed calculation tables can be found in Appendix F, Table 33 and
Table 34.
0
4
8
12
16
20
[MW
h/a
]
Atlanta
Otto Engine
Atlanta
Stirling Engine
Atlanta
Fuel Cell
Chicago
Otto Engine
Chicago
Stirling Engine
Chicago
Fuel Cell
Figure 28 Fuel Savings Separate compared with Combined Heat and Power Generation

73
Emission
The fuel savings directly lead to the next criterion: the emission results. In a century
where global warming is a genuine problem, the emission evaluation is of high importance. The
emission values are a combination of the reduced fuel consumption, and the fuel combustion
process. Power generation in fuel cells is not produced by combustion, but through a chemical
reaction. However, the pre and post process of hydrogen generation does create emissions. The
emission values for fuel cells are significantly lower than emissions from the common
combustion process, as described in the ch “Fuel Cells.”
The most important and well known measure is the carbon dioxide (CO2) discharge. In
Figure 29, the CO2 reduction of each case is illustrated. Here, the combination of fuel
consumption and the fuel combustion process is considered. Calculations are based on the fuel
for the heat demand for Micro-CHP system and boiler, as well as for the power plant based on
the amount of electricity produced by the CHP system, as described in the previous chapter. It
can be seen that the Stirling engine shows the lowest reduction with 58% and 60%, the internal
combustion engine is placed in the middle with 75%, and the fuel cell eliminates with 99% of all
CO2 emissions. It is surprising that the Otto engine achieves better results than the Stirling
engine because the combustion process takes place outside of the prime mover. Thus, it can be
better controlled and should achieve better values. However, even if the fuel cell CHP system is
a clear winner, it needs be noted that with each system a CO2 reduction over 50% is possible.
This is very positive for all CHP systems.
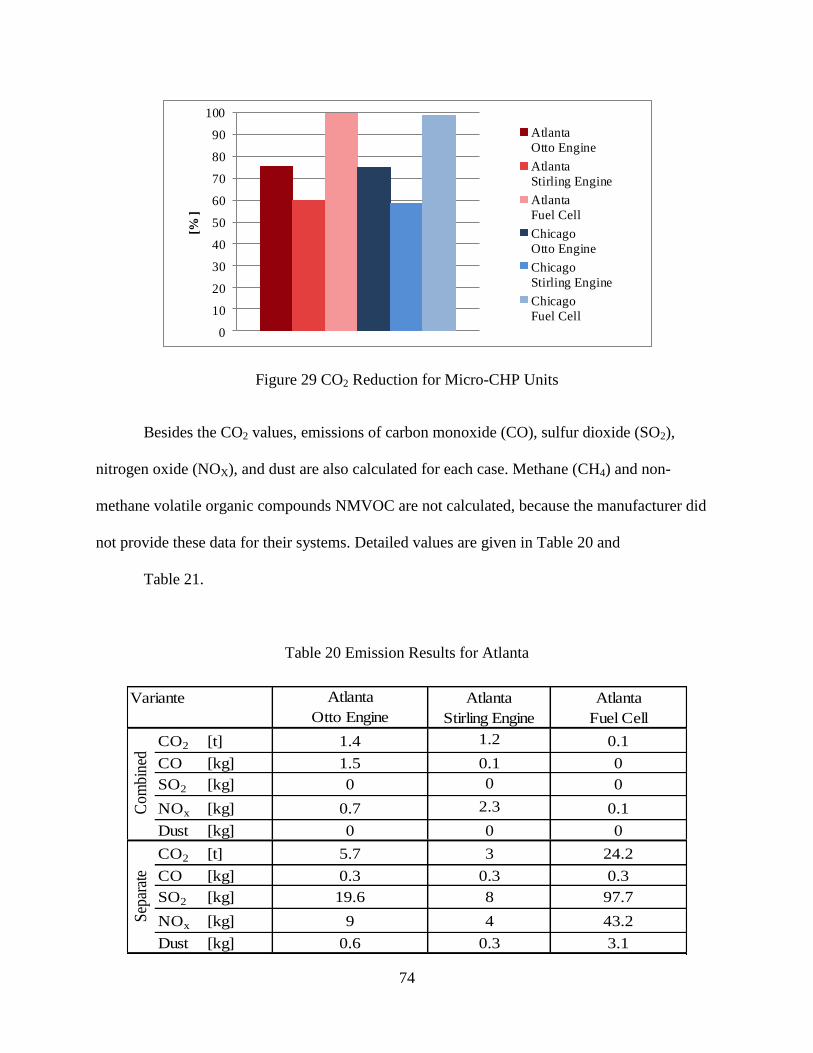
74
0
10
20
30
40
50
60
70
80
90
100
[%]
Atlanta
Otto Engine
Atlanta
Stirling Engine
Atlanta
Fuel Cell
Chicago
Otto Engine
Chicago
Stirling Engine
Chicago
Fuel Cell
Figure 29 CO2 Reduction for Micro-CHP Units
Besides the CO2 values, emissions of carbon monoxide (CO), sulfur dioxide (SO2),
nitrogen oxide (NOX), and dust are also calculated for each case. Methane (CH4) and non-
methane volatile organic compounds NMVOC are not calculated, because the manufacturer did
not provide these data for their systems. Detailed values are given in Table 20 and
Table 21.
Table 20 Emission Results for Atlanta
Atlanta
Otto Engine
Atlanta
Stirling Engine
Atlanta
Fuel Cell
CO2 [t] 1.4 1.2 0.1
CO [kg] 1.5 0.1 0
SO2 [kg] 0 0 0
NOx [kg] 0.7 2.3 0.1
Dust [kg] 0 0 0
CO2 [t] 5.7 3 24.2
CO [kg] 0.3 0.3 0.3
SO2 [kg] 19.6 8 97.7
NOx [kg] 9 4 43.2
Dust [kg] 0.6 0.3 3.1
Variante
Com
bine
dS
epar
ate
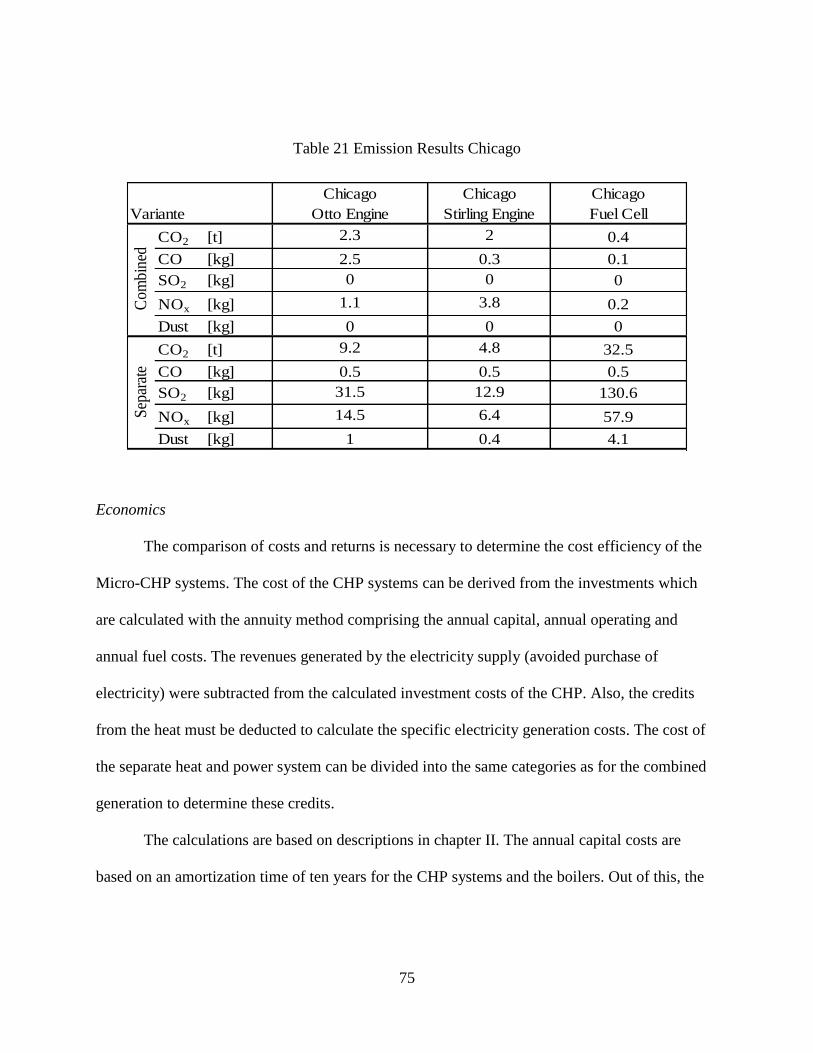
75
Table 21 Emission Results Chicago
Chicago
Otto Engine
Chicago
Stirling Engine
Chicago
Fuel Cell
CO2 [t] 2.3 2 0.4
CO [kg] 2.5 0.3 0.1
SO2 [kg] 0 0 0
NOx [kg] 1.1 3.8 0.2
Dust [kg] 0 0 0
CO2 [t] 9.2 4.8 32.5
CO [kg] 0.5 0.5 0.5
SO2 [kg] 31.5 12.9 130.6
NOx [kg] 14.5 6.4 57.9
Dust [kg] 1 0.4 4.1
Com
bine
dS
epar
ate
Variante
Economics
The comparison of costs and returns is necessary to determine the cost efficiency of the
Micro-CHP systems. The cost of the CHP systems can be derived from the investments which
are calculated with the annuity method comprising the annual capital, annual operating and
annual fuel costs. The revenues generated by the electricity supply (avoided purchase of
electricity) were subtracted from the calculated investment costs of the CHP. Also, the credits
from the heat must be deducted to calculate the specific electricity generation costs. The cost of
the separate heat and power system can be divided into the same categories as for the combined
generation to determine these credits.
The calculations are based on descriptions in chapter II. The annual capital costs are
based on an amortization time of ten years for the CHP systems and the boilers. Out of this, the
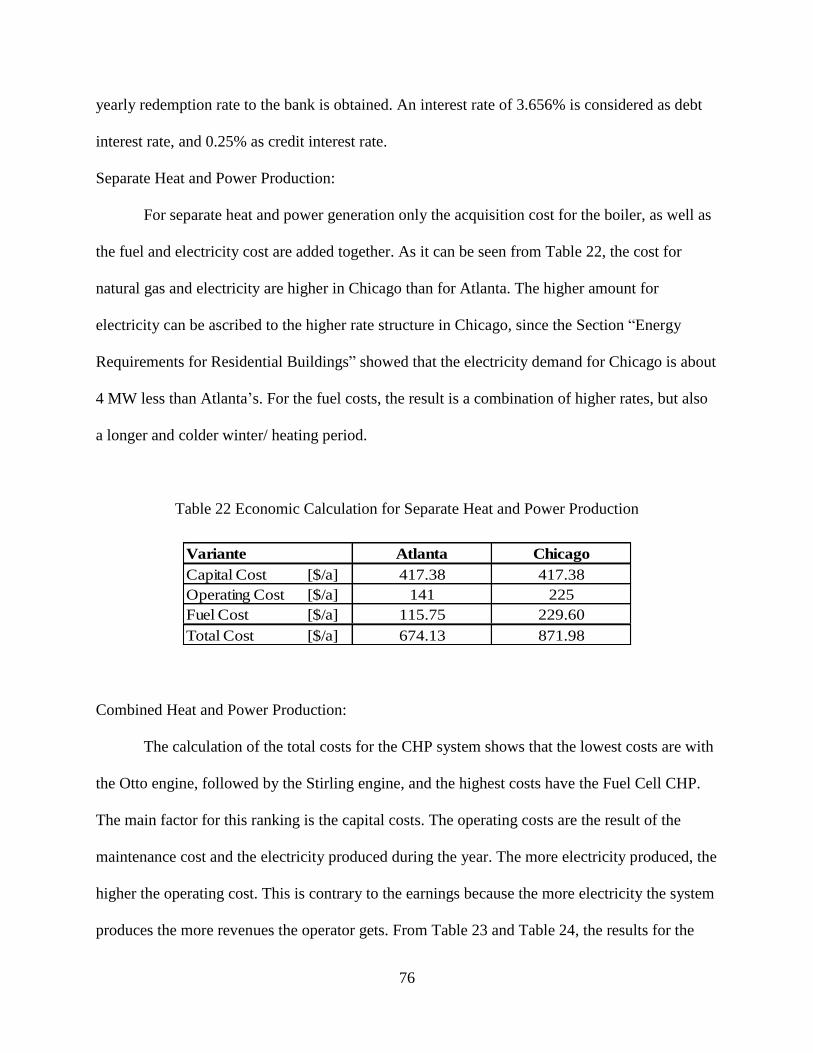
76
yearly redemption rate to the bank is obtained. An interest rate of 3.656% is considered as debt
interest rate, and 0.25% as credit interest rate.
Separate Heat and Power Production:
For separate heat and power generation only the acquisition cost for the boiler, as well as
the fuel and electricity cost are added together. As it can be seen from Table 22, the cost for
natural gas and electricity are higher in Chicago than for Atlanta. The higher amount for
electricity can be ascribed to the higher rate structure in Chicago, since the Section “Energy
Requirements for Residential Buildings” showed that the electricity demand for Chicago is about
4 MW less than Atlanta’s. For the fuel costs, the result is a combination of higher rates, but also
a longer and colder winter/ heating period.
Table 22 Economic Calculation for Separate Heat and Power Production
Variante Atlanta Chicago
Capital Cost [$/a] 417.38 417.38
Operating Cost [$/a] 141 225
Fuel Cost [$/a] 115.75 229.60
Total Cost [$/a] 674.13 871.98
Combined Heat and Power Production:
The calculation of the total costs for the CHP system shows that the lowest costs are with
the Otto engine, followed by the Stirling engine, and the highest costs have the Fuel Cell CHP.
The main factor for this ranking is the capital costs. The operating costs are the result of the
maintenance cost and the electricity produced during the year. The more electricity produced, the
higher the operating cost. This is contrary to the earnings because the more electricity the system
produces the more revenues the operator gets. From Table 23 and Table 24, the results for the
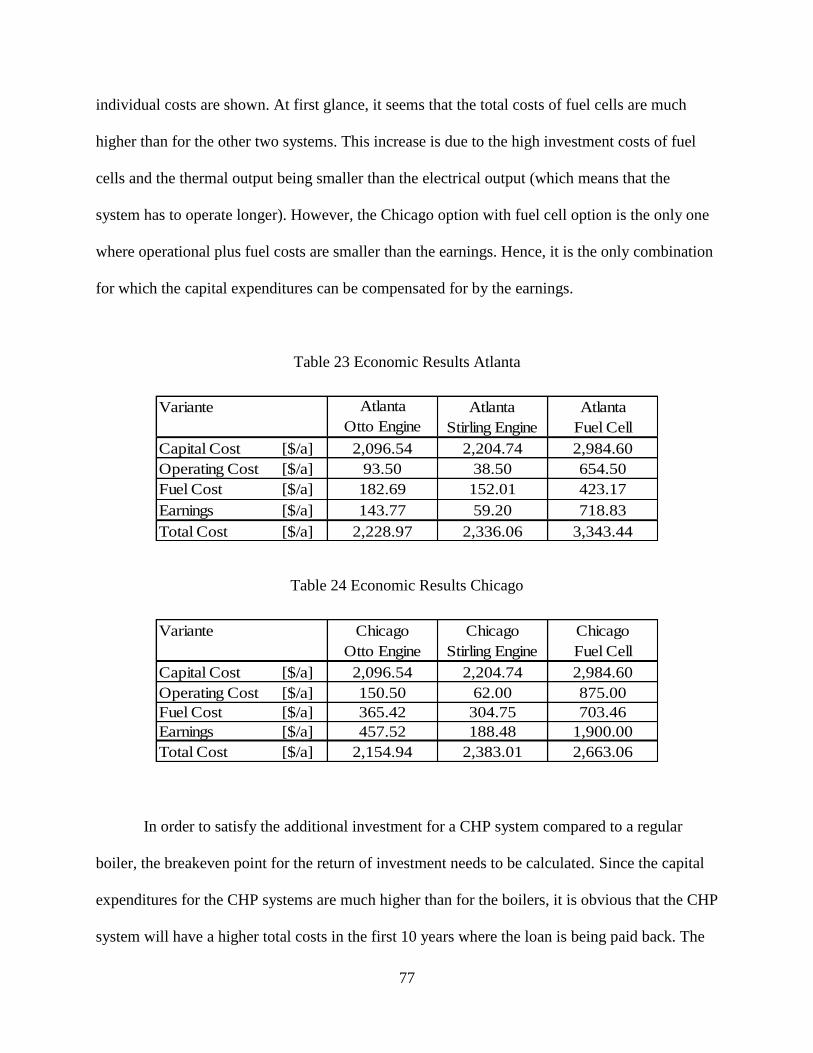
77
individual costs are shown. At first glance, it seems that the total costs of fuel cells are much
higher than for the other two systems. This increase is due to the high investment costs of fuel
cells and the thermal output being smaller than the electrical output (which means that the
system has to operate longer). However, the Chicago option with fuel cell option is the only one
where operational plus fuel costs are smaller than the earnings. Hence, it is the only combination
for which the capital expenditures can be compensated for by the earnings.
Table 23 Economic Results Atlanta
Variante Atlanta
Otto Engine
Atlanta
Stirling Engine
Atlanta
Fuel Cell
Capital Cost [$/a] 2,096.54 2,204.74 2,984.60
Operating Cost [$/a] 93.50 38.50 654.50
Fuel Cost [$/a] 182.69 152.01 423.17
Earnings [$/a] 143.77 59.20 718.83
Total Cost [$/a] 2,228.97 2,336.06 3,343.44
Table 24 Economic Results Chicago
Variante Chicago
Otto Engine
Chicago
Stirling Engine
Chicago
Fuel Cell
Capital Cost [$/a] 2,096.54 2,204.74 2,984.60
Operating Cost [$/a] 150.50 62.00 875.00
Fuel Cost [$/a] 365.42 304.75 703.46
Earnings [$/a] 457.52 188.48 1,900.00
Total Cost [$/a] 2,154.94 2,383.01 2,663.06
In order to satisfy the additional investment for a CHP system compared to a regular
boiler, the breakeven point for the return of investment needs to be calculated. Since the capital
expenditures for the CHP systems are much higher than for the boilers, it is obvious that the CHP
system will have a higher total costs in the first 10 years where the loan is being paid back. The
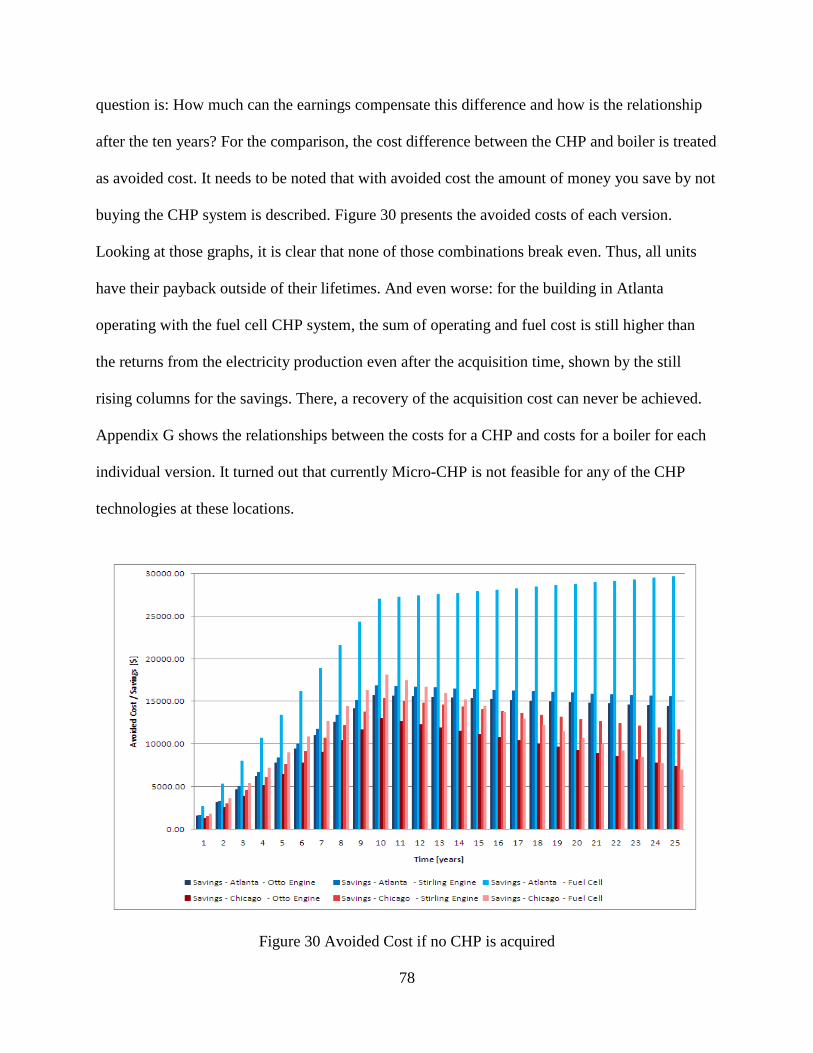
78
question is: How much can the earnings compensate this difference and how is the relationship
after the ten years? For the comparison, the cost difference between the CHP and boiler is treated
as avoided cost. It needs to be noted that with avoided cost the amount of money you save by not
buying the CHP system is described. Figure 30 presents the avoided costs of each version.
Looking at those graphs, it is clear that none of those combinations break even. Thus, all units
have their payback outside of their lifetimes. And even worse: for the building in Atlanta
operating with the fuel cell CHP system, the sum of operating and fuel cost is still higher than
the returns from the electricity production even after the acquisition time, shown by the still
rising columns for the savings. There, a recovery of the acquisition cost can never be achieved.
Appendix G shows the relationships between the costs for a CHP and costs for a boiler for each
individual version. It turned out that currently Micro-CHP is not feasible for any of the CHP
technologies at these locations.
Figure 30 Avoided Cost if no CHP is acquired
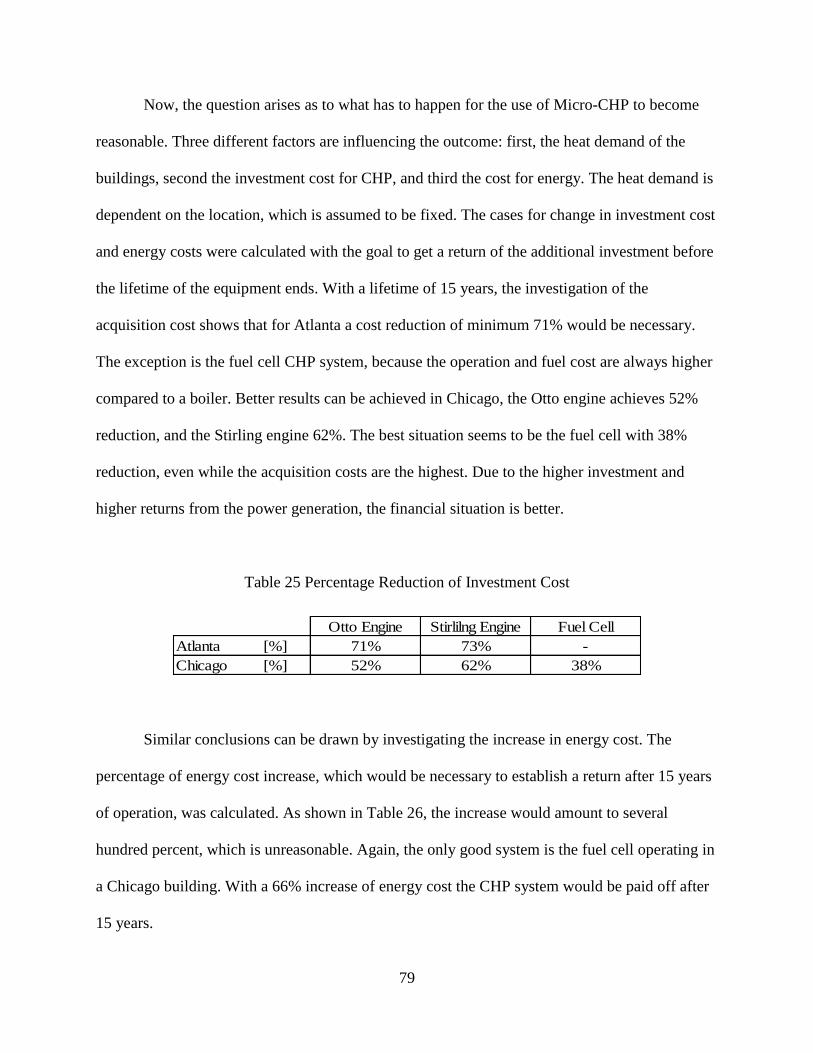
79
Now, the question arises as to what has to happen for the use of Micro-CHP to become
reasonable. Three different factors are influencing the outcome: first, the heat demand of the
buildings, second the investment cost for CHP, and third the cost for energy. The heat demand is
dependent on the location, which is assumed to be fixed. The cases for change in investment cost
and energy costs were calculated with the goal to get a return of the additional investment before
the lifetime of the equipment ends. With a lifetime of 15 years, the investigation of the
acquisition cost shows that for Atlanta a cost reduction of minimum 71% would be necessary.
The exception is the fuel cell CHP system, because the operation and fuel cost are always higher
compared to a boiler. Better results can be achieved in Chicago, the Otto engine achieves 52%
reduction, and the Stirling engine 62%. The best situation seems to be the fuel cell with 38%
reduction, even while the acquisition costs are the highest. Due to the higher investment and
higher returns from the power generation, the financial situation is better.
Table 25 Percentage Reduction of Investment Cost
Otto Engine Stirlilng Engine Fuel Cell
Atlanta [%] 71% 73% -
Chicago [%] 52% 62% 38%
Similar conclusions can be drawn by investigating the increase in energy cost. The
percentage of energy cost increase, which would be necessary to establish a return after 15 years
of operation, was calculated. As shown in Table 26, the increase would amount to several
hundred percent, which is unreasonable. Again, the only good system is the fuel cell operating in
a Chicago building. With a 66% increase of energy cost the CHP system would be paid off after
15 years.
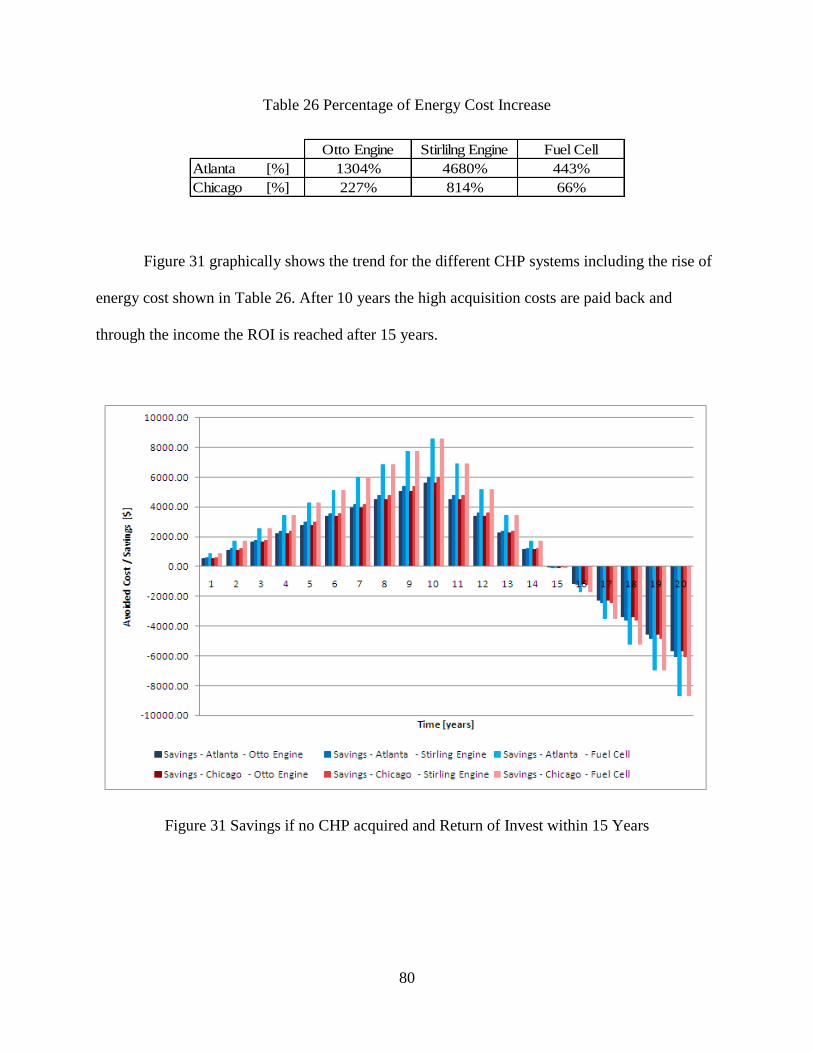
80
Table 26 Percentage of Energy Cost Increase
Otto Engine Stirlilng Engine Fuel Cell
Atlanta [%] 1304% 4680% 443%
Chicago [%] 227% 814% 66%
Figure 31 graphically shows the trend for the different CHP systems including the rise of
energy cost shown in Table 26. After 10 years the high acquisition costs are paid back and
through the income the ROI is reached after 15 years.
Figure 31 Savings if no CHP acquired and Return of Invest within 15 Years

81
CHAPTER VI
VI. TECHNIQUES TO IMPROVE ECONOMIC BENEFITS
CHP displays an important role in the Smart Grid application. The term Smart Grid
encompasses communication network, control of power generators, storage, electrical consumer,
and main power equipment for power transmission and distribution networks of electricity
supply, from major power plants all the way to residential homes. Smart Grid employs
innovative products and services together with intelligent monitoring, control, communication,
and self-healing technologies. In its application micro-CHP helps to balance supply and demand,
operating as a source of electricity that can be dispatched remotely and modulated to meet the
needs of the network and the consumer. The output of micro-CHP units can be aggregated and
used as a source of electricity output to supplement shortfalls in demand from centralized
generation.
Micro- HP w n v “ ” n new grid. In
times of rapidly falling electrical output from renewables it can start to supply the local
electricity network and using heat storage temporarily store the heat to supply later. This also
keeps the electricity supply local hence minimizing grid losses. In times of falling demand CHP
can switch off supplying heat from storage. This functionality can be controlled by suitable
balancing and demand response markets signaling the appropriate action. Such deployment
maximizes the value of the appliance for both end-user and distribution utility.

82
T n “ ” operation of micro-CHP can enable load-
shifting for end users, by decoupling end-user peak demand from traditional peaks in network
demand, which are also associated with the operation of high cost peak generation. This load-
shifting from peak periods has numerous benefits.
Demand and supply are better balanced
Wholesale price volatility is reduced, leading to customer price benefits
Distribution losses from central plant are avoided through local production and use
Reserve generating capacity is available to the utility network operator to meet its
obligations to respond to frequency variations and maintain network integrity
Micro-CHP is a flexible and controllable player in the new smart grid low carbon
electricity market offering services to the grid and the opportunity to bring a whole new group of
citizens into a new relationship with the energy market.

83
CHAPTER VII
VII. DISCUSSIONS AND CONCLUSIONS
This thesis shows the various aspects in the field of Combined Heat and Power. First, the
term of the CHP was defined and the various technologies classified. This was followed by a
detailed consideration of the stage of development. CHP is a well proven technology, recognized
worldwide as a cleaner alternative to traditional centralized power generation. The highest level
of development and the highest penetration have been achieved by CHP systems with
combustion engines. However, there are already alternative and innovative systems like Stirling
CHP, micro turbines, and CHP systems with process steam operations ready for commercializa-
tion. The work includes further manufacturers directories for the various technologies. Attention
should be paid to the different investment costs and the sometimes very different (electrical)
efficiencies of each technology. This requires a detailed examination of the usage, to determine
which system best fits the given requirements. Besides all the advantages for CHP some barriers
remain, but the U.S. government is working on reducing, or maybe eliminating those barriers.
In the second part of this thesis, a case study is analyzed for residential application. The
technical, environmental and economical feasibility of using Micro-CHP systems in the north
and south of the USA were investigated. The following conclusions can be deduced: Looking
from the perspective of performance and emissions, the CHP system based on the fuel cell
achieved the best results. The reason for this is the lower heat-to-power ratio of the system. The
thermal output best fits to the heat demand of the buildings. Thus, fuel cell systems can be
84
operated better in the optimum efficiency range compared to the combustion engines. This also
decreases the fuel consumption of the system. The fuel cell system uses between 15% and 19%
less fuel compared to a separate heat and power system, while the reduction for the combustion
engines is significantly less and lies between 2% and 5.5%. The fuel reduction as well as the way
power is generated leads to the very high emission reductions for the fuel cell. Prevention of over
90% of the CO2 emissions is possible. But also for the combustion engines, a significant drop
can be achieved (60% for Stirling and 75% for Otto engine). Fuel cell operation may result in
zero emissions with a hydrogen production using electrolysis. With these results a major
reduction in greenhouse gases can be achieved. This makes the emission factor of the highest
benefit for combined heat and power generation. However, hydrogen generation by electrolysis
is more cost intensive.
From an economic point of view, Micro-CHP for residential buildings in the U.S. is
currently not attractive. The annual savings turned out to be too low to return the investment cost
in a reasonable time. The operation in Atlanta with the fuel cell CHP system shows even higher
operation costs than for the boiler. Several reasons can be deduced: First, the heat demand is not
high enough for systems available on the market, reducing the efficiency. Also the acquisition
costs are too high and electricity cost too low. Further, federal or state incentives could help to
reduce the investment cost. However, the analysis of a decrease in investment cost and an
increase in energy cost showed that too high price changes would be necessary which cannot be
expected in future. The only viable combination is the fuel cell application in Chicago, for future
use, which confirms that Micro-CHP is of more value for cold climates. It therefore can be
concluded that currently there is no economic potential of CHP in the U.S. However, the effects
of global warming, and the environmental benefits of CHP should be considered. With possibly

85
higher incentives, Micro-CHP systems could become more attractive for home owners and thus
more competitive to conventional heating systems.
Based on these findings further studies can be recommended based on bigger CHP
systems, e.g. for light commercial buildings, hospitals, or residential communities which have a
higher advantage of using the heat energy. The systems could better match the demand and
would operate more continuously and thus more efficiently. Also promising would also be
applications where a tri-generation with absorption chillers would be possible. This further
application could help increase efficiency and reduce cost. Determining the appropriate sizing on
a regional basis with various climates would provide valuable information for the feasibility.
Another promising investigation would be the implementation of other renewable energy
sources, such as solar systems or different bio fuels. Solar systems could have a positive effect
on adjusting the power and heat production based on a sustainable energy source. The usage of
bio fuels can bring various environmental benefits. The economic solution could be very
uncertain, since bio fuels are in general more expensive than natural gas, however, special
incentives could be applied.
86
REFERENCES
[1] American Society of Heating, Refrigeration and Air-Conditioning, ASHREA Handbook -
Fundamentals, Atlanta 1997
[2] Arasteh D., Huang J., Mitchell R., Clear B., Kohler C., A Database of Window Annual
Energy Use in Typical North American Single Family Houses, ASHRAE Transactions,
Vol. 106, Part 1, August 1999
[3] Barr R., NBC News, Oil and Energy, June 2011, www.msnbc.msn.com/id/43327793/ns/
business-oil_and_energy/t/china-surpasses-us-top-energy-consumer/#.T9y6aBSYNok,
June 2012
[4] Becker B.R., Stogsdill K.E., Development of a Hot Water Database, ASHRAE
Transactions, 1990 Part2 V96
[5] Bundesminesterium für Verkehr, Innovation und Technologie, Technologieportrait Kraft-
Wärme- Kopplung, Institute for Thermal Turbomachinery and Machine Dynamics, Graz
University of Technology, Wien, May 2002
[6] Cengel Y., Boles M., Thermodynamics: An Engineering Approach, Sith Edition, Mc
Graw Hill, New York 2008
[7] Cogeneration at Small Scale, Simultaneous Production of Electricity and Heat,
http://www.erec.org/fileadmin/erec_docs/Projcet_Documents/RESTMAC/Brochure4_Co
generation_low_res.pdf, May 2012
[8] Däumler K.-D., Grundlagen der Investitions- und Wirtschaftlichkeitsrechnung. 11.
edition, Verlag Neue Wirtschafts-Briefe, Berlin, 2003
[9] Department of Natural Resources Canada, Residential Cogeneration Systems: A review
of the current technologies, Canada, June 2005
[10] Dhamshala P., Modern Practice in Design of Air Conditioning and Refrigeration
Systems, The University of Tennessee, Chattanooga, 2011
[11] Energy Solution Center, 2002, http://www.poweronsite.org/AppGuide/Chapters/Chap4/4-
4_Fuel_Cells.htm, May 2012
87
[12] Energy Solution Center, 2002,
http://www.poweronsite.org/AppGuide/Manufacturers.htm May 2012
[13] E-quad Power Systems GbR: Einsatzgebiete von Mikrogasturbinen,
http://www.microturbine.de/cms/index.php?option=com_content&view=article&id=49&
Itemid=54, May 2012
[14] Fachinformationszentrum Karlsruhe: Blockheizkraftwerke - Ein Leitfaden für den
Anwender, 6. aktualisierte Auflage, TÜV-Verlag, Köln, 2005
[15] Fairey P., Parker D., A Review of Hot Water Draw Profiles Used in Performance
Analysis of Residential Domestic Hot Water Systems, Institute of the University of
Central Florida, July 2004
[16] Francis X. Johnson, Richard E. Brown, James W. Hanford, Alan H. Sanstad, Jonathan G.
Koomey. Residential HVAC Data, Assumptions and Methodology for End-Use
Forecasting with EPRI-REEPS 2.1, Lawrence Berkeley Laboratory, University of
California, 1994
[17] Gas Georgia, http://www.gasgeorgia.com/compare-natural-gas.html, June 2012
[18] Georgia Power, http://www.georgiapower.com/pricing/residential/pricing/standard-
service-plan.asp, June 2012
[19] Hedman B.A., Hampson A.C., Fuel and CO2 Emissions Savings Calculations
Methodology for Combined Heat and Power (CHP) Systems, ASHRAE Transactions,
Volume 117, Part 1, February 2011
[20] Hendron R. Burch J., Development of Standardized Domestic Hot Water Event
Schedules for Residential Buildings, National Renewable Energy Laboratory, California,
June 2007
[21] Hodge B.K., Alternative Energy Systems and Applications, John Wiley & Sons Inc.,
Danvers, USA 2010
[22] Hutchingson A., "The New Energy Fixes: 10 Fixes, Popular Mechanics, 73. Print, June
2011
[23] Institute for Thermal Turbo machinery and Machine Dynamics – TU Graz, Cogeneration
(CHP) a Technology Portrait, 34/2010
[24] Investopedia, http://www.investopedia.com/terms/s/sparkspread.asp#axzz2ARhndYEB,
October 2012
[25] Kerr T., CHP U.S. Federal Partnership: The Road to 92 GW, International Energy
Agency, 2008
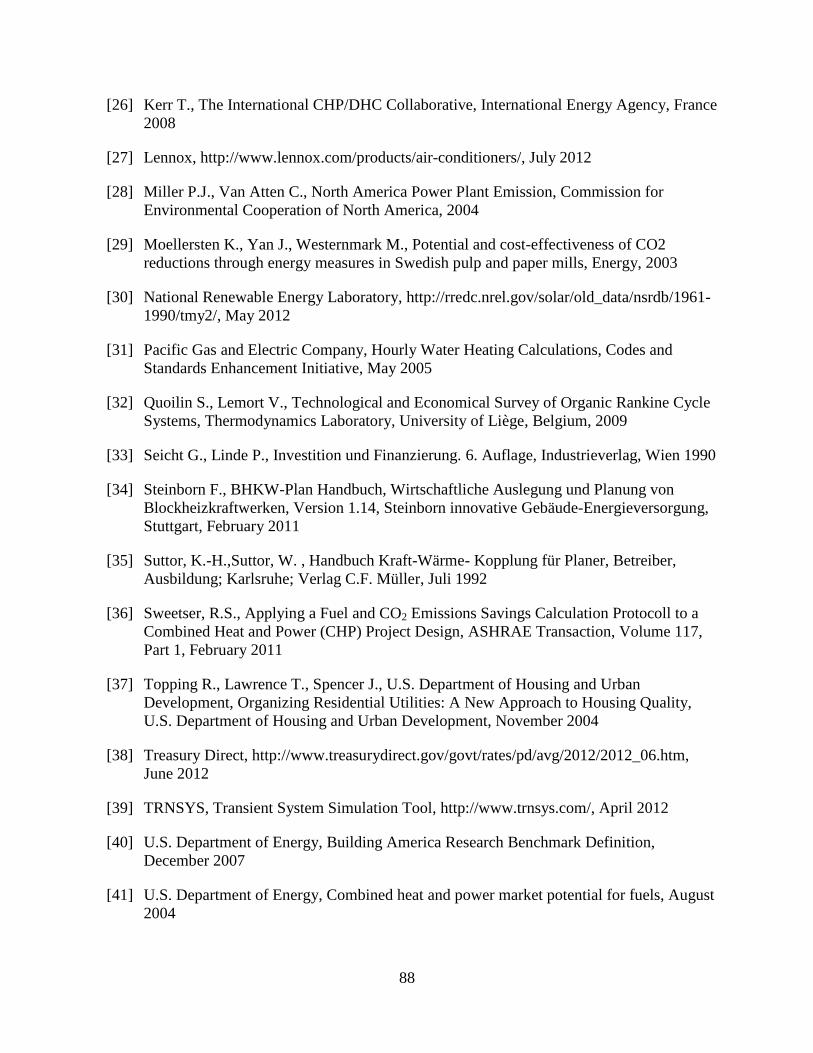
88
[26] Kerr T., The International CHP/DHC Collaborative, International Energy Agency, France
2008
[27] Lennox, http://www.lennox.com/products/air-conditioners/, July 2012
[28] Miller P.J., Van Atten C., North America Power Plant Emission, Commission for
Environmental Cooperation of North America, 2004
[29] Moellersten K., Yan J., Westernmark M., Potential and cost-effectiveness of CO2
reductions through energy measures in Swedish pulp and paper mills, Energy, 2003
[30] National Renewable Energy Laboratory, http://rredc.nrel.gov/solar/old_data/nsrdb/1961-
1990/tmy2/, May 2012
[31] Pacific Gas and Electric Company, Hourly Water Heating Calculations, Codes and
Standards Enhancement Initiative, May 2005
[32] Quoilin S., Lemort V., Technological and Economical Survey of Organic Rankine Cycle
Systems, Thermodynamics Laboratory, University of Liège, Belgium, 2009
[33] Seicht G., Linde P., Investition und Finanzierung. 6. Auflage, Industrieverlag, Wien 1990
[34] Steinborn F., BHKW-Plan Handbuch, Wirtschaftliche Auslegung und Planung von
Blockheizkraftwerken, Version 1.14, Steinborn innovative Gebäude-Energieversorgung,
Stuttgart, February 2011
[35] Suttor, K.-H.,Suttor, W. , Handbuch Kraft-Wärme- Kopplung für Planer, Betreiber,
Ausbildung; Karlsruhe; Verlag C.F. Müller, Juli 1992
[36] Sweetser, R.S., Applying a Fuel and CO2 Emissions Savings Calculation Protocoll to a
Combined Heat and Power (CHP) Project Design, ASHRAE Transaction, Volume 117,
Part 1, February 2011
[37] Topping R., Lawrence T., Spencer J., U.S. Department of Housing and Urban
Development, Organizing Residential Utilities: A New Approach to Housing Quality,
U.S. Department of Housing and Urban Development, November 2004
[38] Treasury Direct, http://www.treasurydirect.gov/govt/rates/pd/avg/2012/2012_06.htm,
June 2012
[39] TRNSYS, Transient System Simulation Tool, http://www.trnsys.com/, April 2012
[40] U.S. Department of Energy, Building America Research Benchmark Definition,
December 2007
[41] U.S. Department of Energy, Combined heat and power market potential for fuels, August
2004

89
[42] U.S. Department of Energy, Database of State Incentives for Renewables & Efficiency,
http://www.dsireusa.org/incentives/incentive.cfm?Incentive_Code=US02F, June 2012
[43] U.S. Department of Energy, Review of combined heat and power technologies, October
1998
[44] United States Department of Labor, Bureau of Labor Statistics,
http://www.bls.gov/ro5/aepchi.htm, June 2012
[45] U.S. Energy Information Administration,
http://www.eia.gov/tools/faqs/faq.cfm?id=97&t=3 June 2012
[46] U.S. Environmental Protection Agency, Combined Heat and Power Partnership, Biomass
Combined Heat and Power, September 2007
[47] U.S. Environmental Protection Agency, Combined Heat and Power Partnership, Catalog
of CHP Technologies, December 2008
[48] U.S. Environmental Protection Agency, Combined Heat and Power Partnership,
http://www.epa.gov/chp/, August 2012
[49] U.S. Environmental Protection Agency, http://www.epa.gov/cleanenergy/energy-and-
you/affect/air-emissions.html, May 2012
[50] Wikipedia, http://en.wikipedia.org/wiki/Heat_of_combustion, July 2012

90
APPENDIX
APPENDIX A
A. MARKET SURVEY – MANUFACTURER LISTS

91
Steam Turbine
Table 27 Technical Data for Steam Turbine Manufactures
Manufacturer Pel Pth ηel ηth ηtotal Fuel
[kW] [kW] [%] [%] [%]
Adoratec GmbH 300 1350 Biomass
Breite Seite 1 625 2665
74889 Sinsheim 1000 4270
Germany
+49 (0) 431/5708924
http://www.adoratec.com/
Pratt & Whitney 968 4081 18.8 Wood biomass: sawdust, wood chips,
400 Main Street bark, treated wood
East Hartford, CT 06108 Other biomass: dried sewage sludge,
United States straw, green cuttings, rice husks, etc.
+1 860-565-4321 Waste material
http://www.pw.utc.com/
Steam Systems Pty Ltd 140 1100 Wood Chips/Sawdust
Campbellfield, Victoria 1050 7000
03 9357 1030
Australia
www.steamsystems.com.au/
Gas Turbine
Table 28 Technical Data for Gas Turbine Manufacturers
Manufacturer Pel Pth ηel ηth ηtotal Fuel
[kW] [kW] [%] [%] [%]
2G - CENERGY Power Systems 100-1060 36-39 47-53 86-90 biogas
Technologies Inc. 100-1060 35-41 48-54 88-89 natural gas
151 College Drive - 15
Orange Park, FL 32065
USA
+1 904 579 3217
http://www.2g-cenergy.com/
CAPSTONE TURBINE CORPORATION 30-1000 26-33 natural gas
21211 Nordhoff Street landfillgas
Chatsworth, CA 91311 digester gas
USA propane
Tel: +1 818.734.5300 29-65 25-29 diesel
www.capstoneturbine.com aviation
kerosene
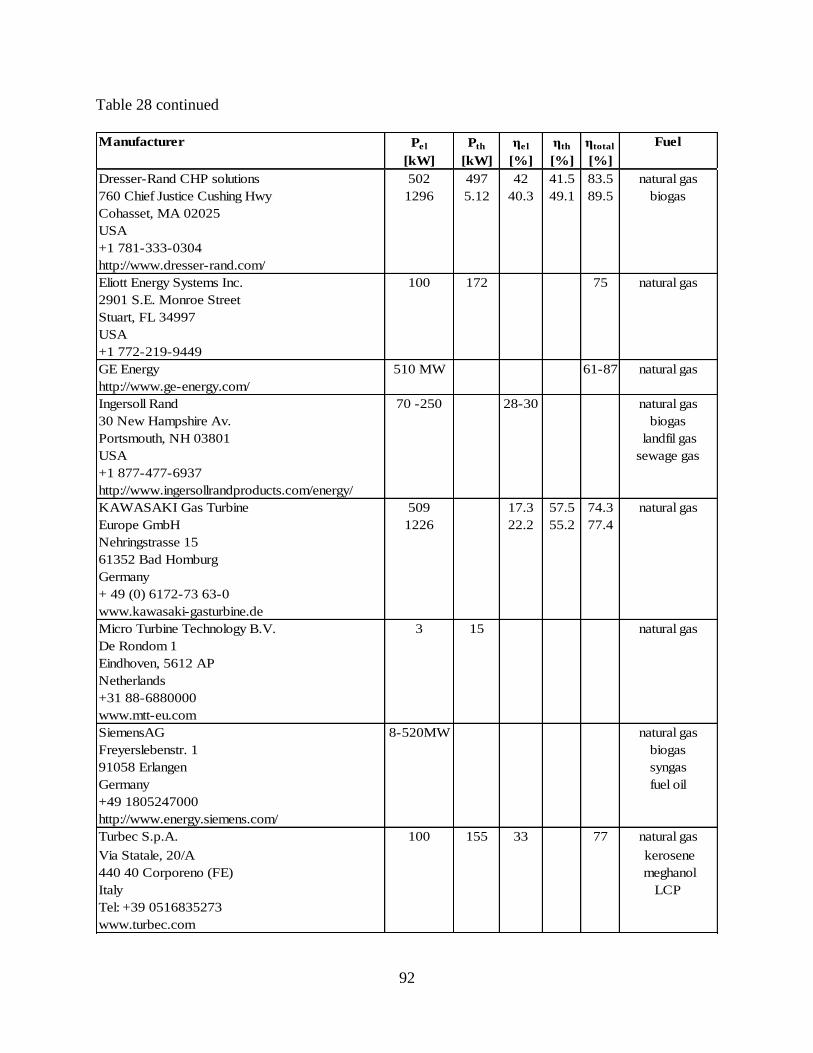
92
Table 28 continued
Manufacturer Pel Pth ηel ηth ηtotal Fuel
[kW] [kW] [%] [%] [%]
Dresser-Rand CHP solutions 502 497 42 41.5 83.5 natural gas
760 Chief Justice Cushing Hwy 1296 5.12 40.3 49.1 89.5 biogas
Cohasset, MA 02025
USA
+1 781-333-0304
http://www.dresser-rand.com/
Eliott Energy Systems Inc. 100 172 75 natural gas
2901 S.E. Monroe Street
Stuart, FL 34997
USA
+1 772-219-9449
GE Energy 510 MW 61-87 natural gas
http://www.ge-energy.com/
Ingersoll Rand 70 -250 28-30 natural gas
30 New Hampshire Av. biogas
Portsmouth, NH 03801 landfil gas
USA sewage gas
+1 877-477-6937
http://www.ingersollrandproducts.com/energy/
KAWASAKI Gas Turbine 509 17.3 57.5 74.3 natural gas
Europe GmbH 1226 22.2 55.2 77.4
Nehringstrasse 15
61352 Bad Homburg
Germany
+ 49 (0) 6172-73 63-0
www.kawasaki-gasturbine.de
Micro Turbine Technology B.V. 3 15 natural gas
De Rondom 1
Eindhoven, 5612 AP
Netherlands
+31 88-6880000
www.mtt-eu.com
SiemensAG 8-520MW natural gas
Freyerslebenstr. 1 biogas
91058 Erlangen syngas
Germany fuel oil
+49 1805247000
http://www.energy.siemens.com/
Turbec S.p.A. 100 155 33 77 natural gas
biogas, diesel,Via Statale, 20/A kerosene
440 40 Corporeno (FE) meghanol
Italy LCP
Tel: +39 0516835273
www.turbec.com
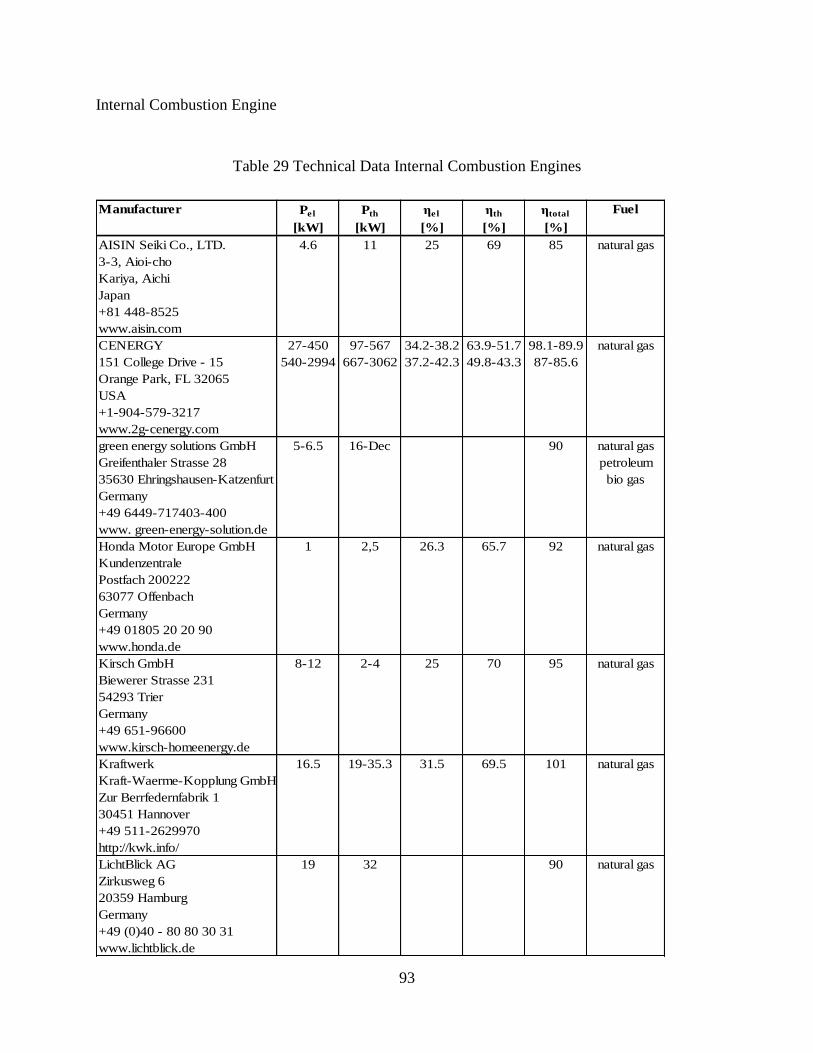
93
Internal Combustion Engine
Table 29 Technical Data Internal Combustion Engines
Manufacturer Pel Pth ηel ηth ηtotal Fuel
[kW] [kW] [%] [%] [%]
AISIN Seiki Co., LTD. 4.6 11 25 69 85 natural gas
3-3, Aioi-cho
Kariya, Aichi
Japan
+81 448-8525
www.aisin.com
CENERGY 27-450 97-567 34.2-38.2 63.9-51.7 98.1-89.9 natural gas
151 College Drive - 15 540-2994 667-3062 37.2-42.3 49.8-43.3 87-85.6
Orange Park, FL 32065
USA
+1-904-579-3217
www.2g-cenergy.com
green energy solutions GmbH 5-6.5 16-Dec 90 natural gas
Greifenthaler Strasse 28 petroleum
35630 Ehringshausen-Katzenfurt bio gas
Germany
+49 6449-717403-400
www. green-energy-solution.de
Honda Motor Europe GmbH 1 2,5 26.3 65.7 92 natural gas
Kundenzentrale
Postfach 200222
63077 Offenbach
Germany
+49 01805 20 20 90
www.honda.de
Kirsch GmbH 8-12 2-4 25 70 95 natural gas
Biewerer Strasse 231
54293 Trier
Germany
+49 651-96600
www.kirsch-homeenergy.de
Kraftwerk 16.5 19-35.3 31.5 69.5 101 natural gas
Kraft-Waerme-Kopplung GmbH
Zur Berrfedernfabrik 1
30451 Hannover
+49 511-2629970
http://kwk.info/
LichtBlick AG 19 32 90 natural gas
Zirkusweg 6
20359 Hamburg
Germany
+49 (0)40 - 80 80 30 31
www.lichtblick.de

94
Table 29 continued
Manufacturer Pel Pth ηel ηth ηtotal Fuel
[kW] [kW] [%] [%] [%]
MTU onsite solution natural gas
Maybackplatz 1 bio gas
88040 Friedrichshafen
Germany
+49 7541 900
SenerTec 5-5.5 10.512.5 26-30 59-61 88-89 natural gas
Carl-Zeiss-Strasse 18 petroleum
97424 Schweinfurt bio diesel
Germany fuel oil
+49 (0)9721 6510
Tecogen Inc. 60 135 26.4 67.3 93.7 natural gas
45 First Avenue 75 150 27.1 64.5 91.6
Waltham, MA 02451
USA
+1 781-466-6400
http://www.tecogen.com/
Vaillant Group 1-4.7 2.5-13.8 26.3 65.7 92 natural gas
42850 Remscheid 1-4.7 2.5-13.8 26.3 65.7 92
+49 (0)2191 - 18 2754
www.vaillant-group.com
Steam Engine
The market share for steam engines in conjunction with CHP is relatively low. In the
following table, producers only from Australia and Germany are presented. Unfortunately, the
amount of available data is also very low.
Table 30 Technical Data for Steam Engine Manufacturers
Manufacturer Pel Pth ηel ηth ηtotal Fuel
[kW] [kW] [%] [%] [%]
lion energy GmbH & Co. KG 0.3 - 2 16.3 94 natural gas, petroleum
Zur Hammerbrücke 9 wood chips, fuel oil
59939 Olsberg
Germany
+49 (0)2962 88 13 39
http://www.powerblock.eu/
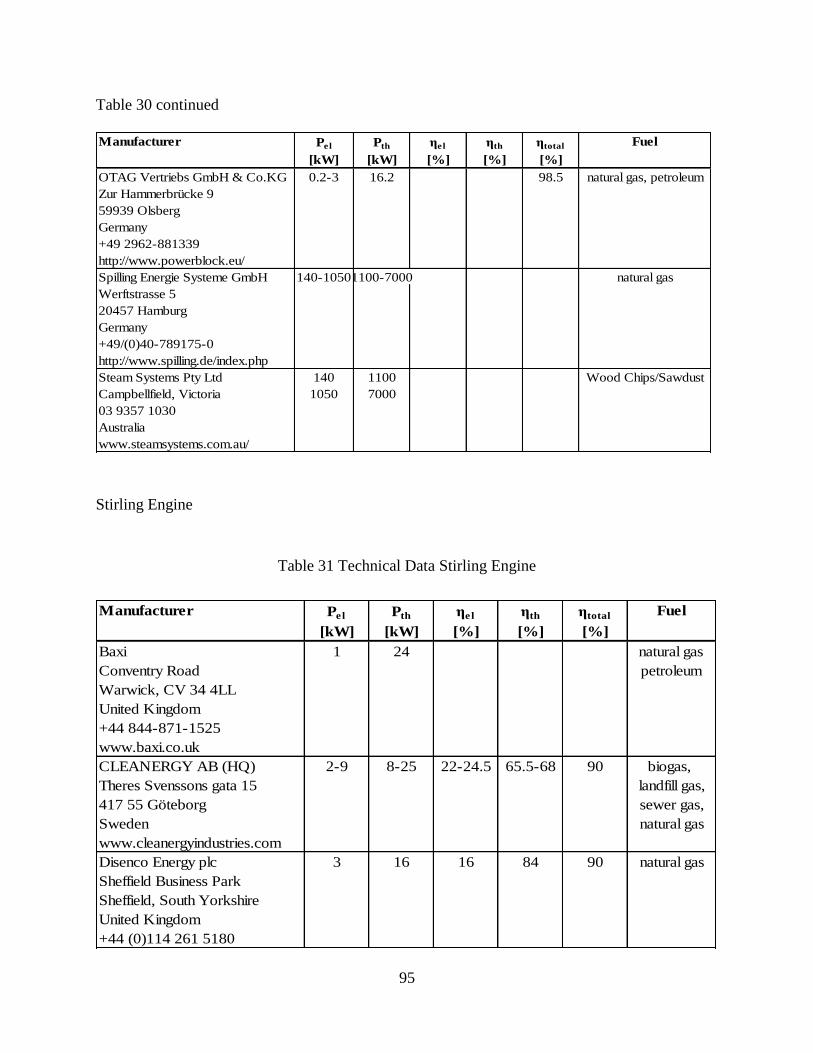
95
Table 30 continued
Manufacturer Pel Pth ηel ηth ηtotal Fuel
[kW] [kW] [%] [%] [%]
OTAG Vertriebs GmbH & Co.KG 0.2-3 16.2 98.5 natural gas, petroleum
Zur Hammerbrücke 9
59939 Olsberg
Germany
+49 2962-881339
http://www.powerblock.eu/
Spilling Energie Systeme GmbH 140-10501100-7000 natural gas
Werftstrasse 5
20457 Hamburg
Germany
+49/(0)40-789175-0
http://www.spilling.de/index.php
Steam Systems Pty Ltd 140 1100 Wood Chips/Sawdust
Campbellfield, Victoria 1050 7000
03 9357 1030
Australia
www.steamsystems.com.au/
Stirling Engine
Table 31 Technical Data Stirling Engine
Manufacturer Pel Pth ηel ηth ηtotal Fuel
[kW] [kW] [%] [%] [%]
Baxi 1 24 natural gas
Conventry Road petroleum
Warwick, CV 34 4LL
United Kingdom
+44 844-871-1525
www.baxi.co.uk
CLEANERGY AB (HQ) 2-9 8-25 22-24.5 65.5-68 90 biogas,
Theres Svenssons gata 15 landfill gas,
417 55 Göteborg sewer gas,
Sweden natural gas
www.cleanergyindustries.com
Disenco Energy plc 3 16 16 84 90 natural gas
Sheffield Business Park
Sheffield, South Yorkshire
United Kingdom
+44 (0)114 261 5180
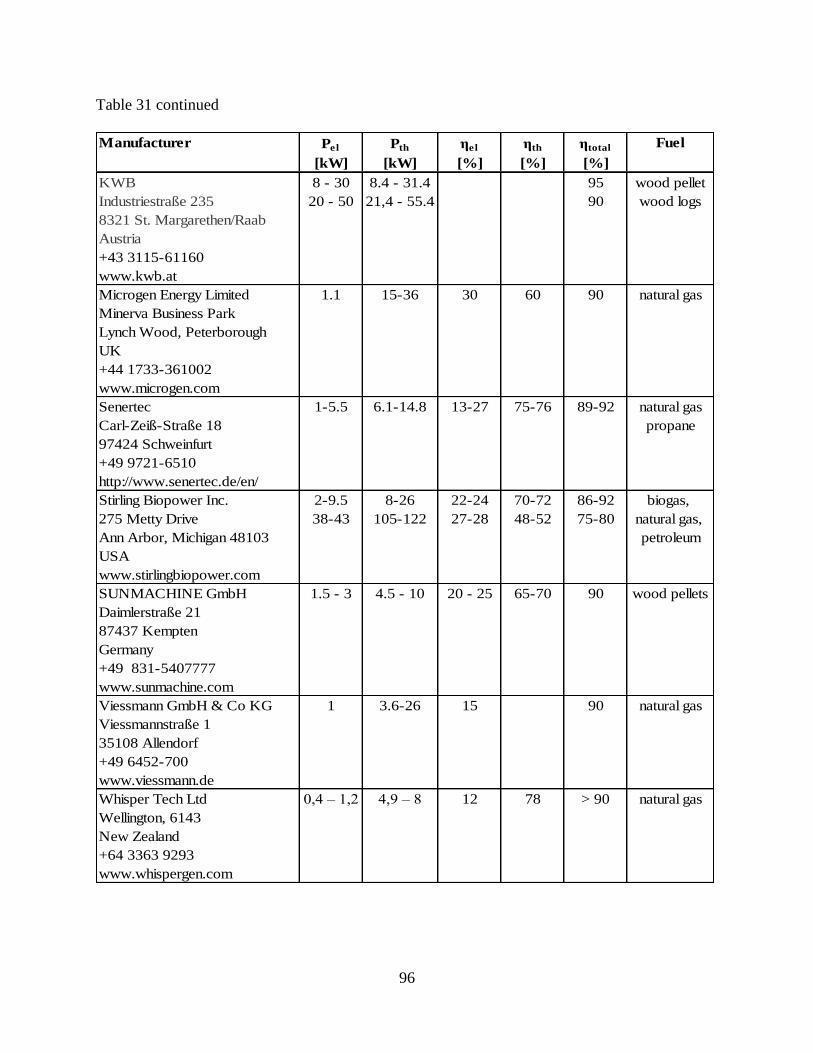
96
Table 31 continued
Manufacturer Pel Pth ηel ηth ηtotal Fuel
[kW] [kW] [%] [%] [%]
KWB 8 - 30 8.4 - 31.4 95 wood pellet
Industriestraße 235 20 - 50 21,4 - 55.4 90 wood logs
8321 St. Margarethen/Raab
Austria
+43 3115-61160
www.kwb.at
Microgen Energy Limited 1.1 15-36 30 60 90 natural gas
Minerva Business Park
Lynch Wood, Peterborough
UK
+44 1733-361002
www.microgen.com
Senertec 1-5.5 6.1-14.8 13-27 75-76 89-92 natural gas
Carl-Zeiß-Straße 18 propane
97424 Schweinfurt
+49 9721-6510
http://www.senertec.de/en/
Stirling Biopower Inc. 2-9.5 8-26 22-24 70-72 86-92 biogas,
275 Metty Drive 38-43 105-122 27-28 48-52 75-80 natural gas,
Ann Arbor, Michigan 48103 petroleum
USA
www.stirlingbiopower.com
SUNMACHINE GmbH 1.5 - 3 4.5 - 10 20 - 25 65-70 90 wood pellets
Daimlerstraße 21
87437 Kempten
Germany
+49 831-5407777
www.sunmachine.com
Viessmann GmbH & Co KG 1 3.6-26 15 90 natural gas
Viessmannstraße 1
35108 Allendorf
+49 6452-700
www.viessmann.de
Whisper Tech Ltd , – , ,9 – 12 78 > 90 natural gas
Wellington, 6143
New Zealand
+64 3363 9293
www.whispergen.com

97
Fuel Cell
Table 32 Technical Data for Fuel Cell
Manufacturer Technology Pel Pth (250°F) ηel ηth ηtotal Fuel
[kW] [kW] [%] [%] [%]
Baxi Innotech PEM 1 1.8 32 59 97
Ausschläger Elbdeich 127
20539 Hamburg
Germany
+49 40-236676-00
www.baxi-innotech.de
Bloom Energy SOFC 105 50 natural gas
1299 Orleans Drive 210 50
Sunnyvale, California 94089
USA
+1 408-543-1500
http://www.bloomenergy.com/
CSIRO SOFC 2 1 60 25 85 natural gas
170 Browns Road
Noble Park, Victoria, 3174
Australia
+61 39554-2300
http://www.csiro.au/
Ceramic Fuel Cells Ltd. SOFC 0-2000 300-1000 60 25 85 natural gas
Unit 8, Candy Park, Hardknott Road
Bromborough,Wirral
CH62 3QB, United Kingdom
+44 (0)151-334-8880
http://www.bluegen.info/
Clear Edge Power SOFC 5 5.8 90 natural gas
7175 NW Evergreen Parkway
Hillsboro, OR 97124
USA
+1 877-257-3343
http://www.clearedgepower.com/
FuelCell Energy 300 140668 natural gas
3 Great Pasture Road 1400 649415
Danbury, CT 06813
USA
+1 203-825-6000
www.fuelcellenergy.com
HEXIS AG SOFC 1 2 30 66 95 natural gas
Zum Park 5 bio methane
Postfach 3068
8404 Winterthur
Switzerland
+41 52-262-6311
www.hexis.com

98
Table 32 continued
Manufacturer Technology Pel Pth (250°F) ηel ηth ηtotal Fuel
[kW] [kW] [%] [%] [%]
Mitsubishi SOFC 55 coal
http://www.mhi.co.jp/en/ 65 natural gas
UTC Power SOFC 400 280 42 48 90 natural gas
195 Governor's Hwy
South Windsor, CT 06074
USA
http://www.utcpower.com/
Vaillant Group SOFC 2 1 30-34 50-51 80-85 natural gas
42850 Remscheid
+49 (0)2191 - 18 2754
www.vaillant-group.com

99
APPENDIX B
B. BUILDING DIMENSIONS
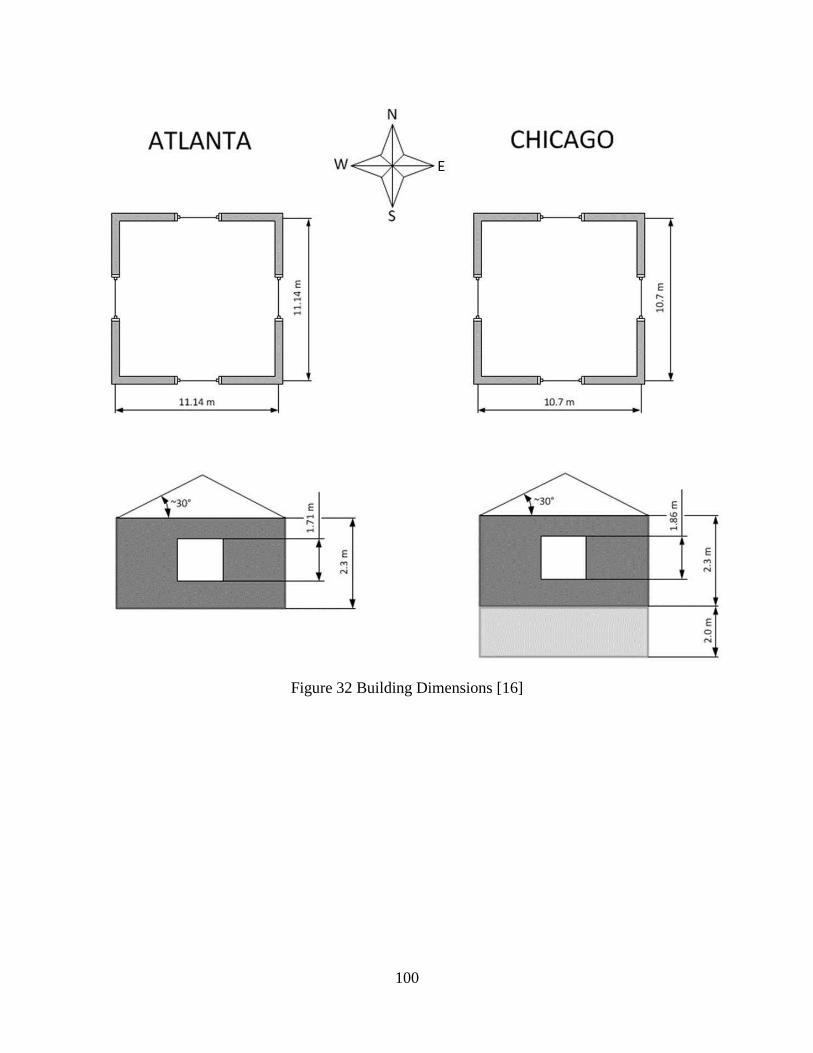
100
Figure 32 Building Dimensions [16]

101
APPENDIX C
C. BUILDING LOAD SIMULATION WITH TRNSYS
102
TRNSYS is a transient simulation program developed at the University of Wisconsin-
Madison in 1975. The program package includes calculations for the thermal performance of a
building including active and passive components for the power supply (e.g. boilers, heat
distribution system, collector systems) and the evaluation of the occurring time-dependent
energy flows. TRNSYS was originally developed for the detailed analysis of buildings designed
with active solar technology. Today, passive solar components as well as conventional heating
and cooling equipment models are available. The advantage of TRNSYS is its flexibility and the
ability to simulate a system in great detail. TRNSYS is based on a modular structure. It contains
a large number of standard components; these so called types can be tied together as required to
simulate the real system. The open structure of the program allows the user to incorporate
material-created types and to modify existing standard components. Each type describes a
particular system component, while the actual performance of the components is simulated with
mathematical algorithms. TRNSYS uses different solution algorithms to solve the equations
arising from the individual components and their logical connections in the entire system. The
simulated time step size and accuracy is selectable by the user. In principle, all input and output
variables of each component are displayed. The output values can also be integrated over defined
time intervals (days, months, years).
In this case study TRNSYS is used to develop the heating and cooling loads of the
building. Figure 33 illustrates the structural configuration of the building model. The design is
the same for both locations, only the parameters are different. All parameters are included as
described in the Section “Building Loads”.
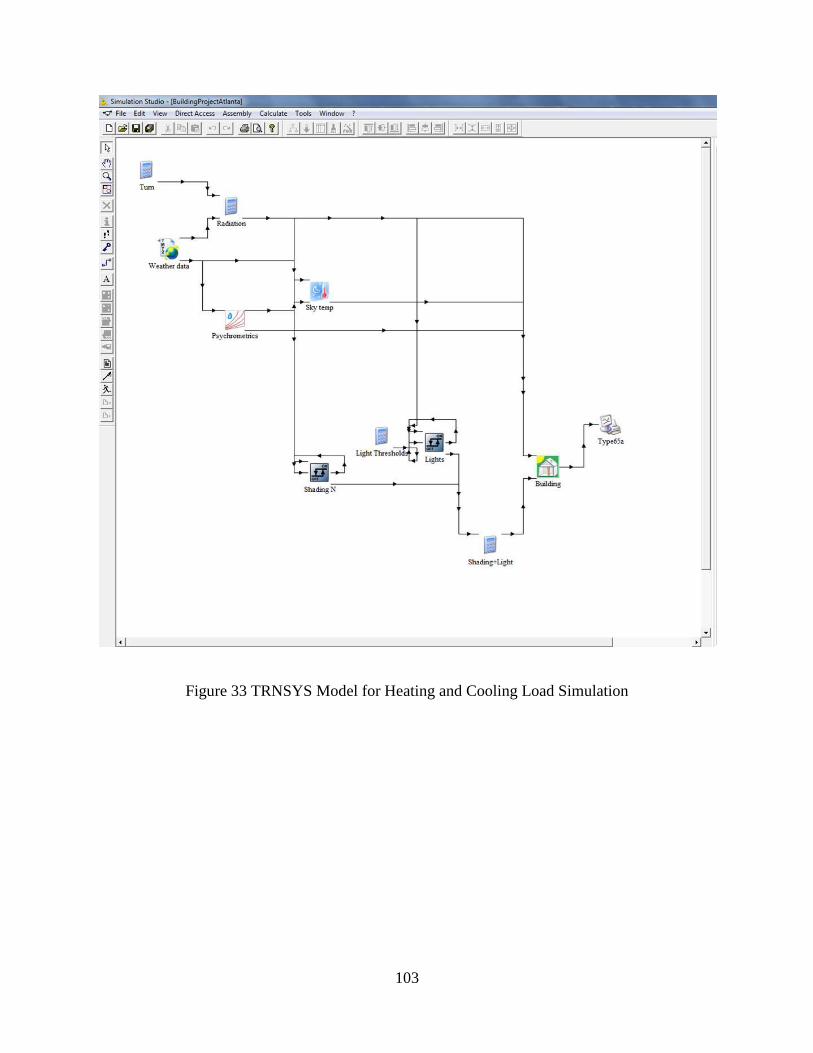
103
Figure 33 TRNSYS Model for Heating and Cooling Load Simulation

104
APPENDIX D
D. BHKW PLAN SOFTWARE

105
BHKW-Plan is software for the design of CHP plants. It is based on the research project
“ n n b n b n d heat and power in Baden- ü b ” n
by the Department of Commerce and was developed by the Center for Solar Energy and
Hydrogen Research Baden-Wuerttemberg, Germany, and the Institute of Technical
Thermodynamics at the German Research Institute of Aeronautics and Astronautics, supported
by the Ministry of Economic Affairs Baden-Wuerttemberg, Germany. Since 2003 the program
was developed and marketed by the company “Steinborn Innovative Building-Energy Supply”.
BHKW-Plan is an Excel interface based program. The basic components are the heat and
power demand calculations, the interpretation of the CHP plant, and comparison of alternative
heating systems. Based on the simulation of the hourly operating data over one year, all relevant
results for heat and electricity, cost and recoverable revenue, energy balance and emissions are
calculated for separate and combined production. In addition, the program includes a complete
reporting system, with all the results, tables and graphics. The program interface is shown in the
Figure below.

106
Figure 34 BHKW Plan Program
Evaluation of CHP calculation software: BHKW Plan
Because BHKW Plan is not a worldwide known program, an evaluation is made in this
chapter to explain the handling of the program, as well as its pros and cons.
The difficulty encountered in the planning of combined heat and power is to create a
proper annual heat and electricity demand curve, where empirical data and estimates are often
applied. In addition, an hourly accounting of electricity and heat requirements is almost
impossible without computer assistance. Here are the major benefits of simulation software.
The heat and power requirements can either be simulated by building modeling, an
extensive database of consumers (e.g. buildings, process heat, and electricity consumers). A
variety of building types, process types and current consumer types is available to determine the
hourly load curves. On the other hand, it is also possible to integrate hourly data as a file, e.g.

107
existing data from an older building or, as in this case, a different program is used to simulate
heating and cooling loads. This flexibility is a plus for the software.
The CHP module and boiler database has a lot of choices with different performance data
and fuels. There is a possibility to edit or re-create CHP and boiler units, where new created data
bases require very specific vendor information. The selection of an operating mode and a CHP
module, together with a buffer memory and a peak boiler, allows a number of possible
combinations. However, a disadvantage is that a power-oriented operation is not possible, if the
heating and cooling loads are uploaded from a separate file. The company Steinborn Innovative
Building Energy Supply was contacted and is currently working on that issue. However, the
hourly simulation of heat and power production and the associated adjustment to the hourly
demand is certainly the main strength of the program. Another disadvantage is the relatively
rigid concept of the operating mode. There is no possibility to vary the schedule when the CHP
module shall operate or not, or to change operation mode within a year. Furthermore, it is
important to note that the program does not provide suggestions for the selection of a
cogeneration plant, which meets the thermal and electrical energy situation best. It does not offer
optimization calculations; this remains the task of the planner to select a fitting CHP module
even with the help of the subsequent economic analysis. However, due to the component data
base a fairly rapid comparison can be achieved.
The economic analysis of the program proved to be circuitous. This has several reasons:
First, the breakdown of capital costs was very detailed. The program also includes the taxation of
electrical energy, in terms of the fuel tax refund, the registration of grants, and funding schemes
designed to German standards and regulations. Overall, to achieve the required ratio of the
results, a relatively large effort is necessary to determine the data that are needed for the

108
economic calculation, especially to adjust it to U.S. regulations. Second, the economic analysis
can only compare CHP systems consisting of a power supply system designed from a boiler and
electricity supplied by the grid. The influence of reducing the acquisition or energy cost cannot
be calculated by the program. It only calculates the economic situation based on the cost data,
which have been put into the system.
The program is not suitable for interpretation by the CHP for stand-alone operation.
Although it is possible to simulate a power controlled operation and thus coverage of the entire
electrical energy needs by the CHP, the stand alone system operating with a required battery
backup system cannot be taken into account.
Another advantage is the possibility of solar system integration in the calculation. In this
case study, this aspect was not investigated, so that no detailed analysis about the ease of
application can be made.
In summary, the BHKW Plan software can be described as a very useful tool that can be
of great help for technicians, in the design of systems. The complexity of a CHP design requires
an intensive analysis of the program itself and the underlying theory. However, the application
itself is much more persuasive than other simulation programs such as TRNSYS. Furthermore, it
should be noted that the program is currently only available in German on the market. A
translation for an international version needs to be discussed with the owner.

109
APPENDIX E
E. MONTHLY BALANCE OF HEAT AND ELECTRICITY GENERATION
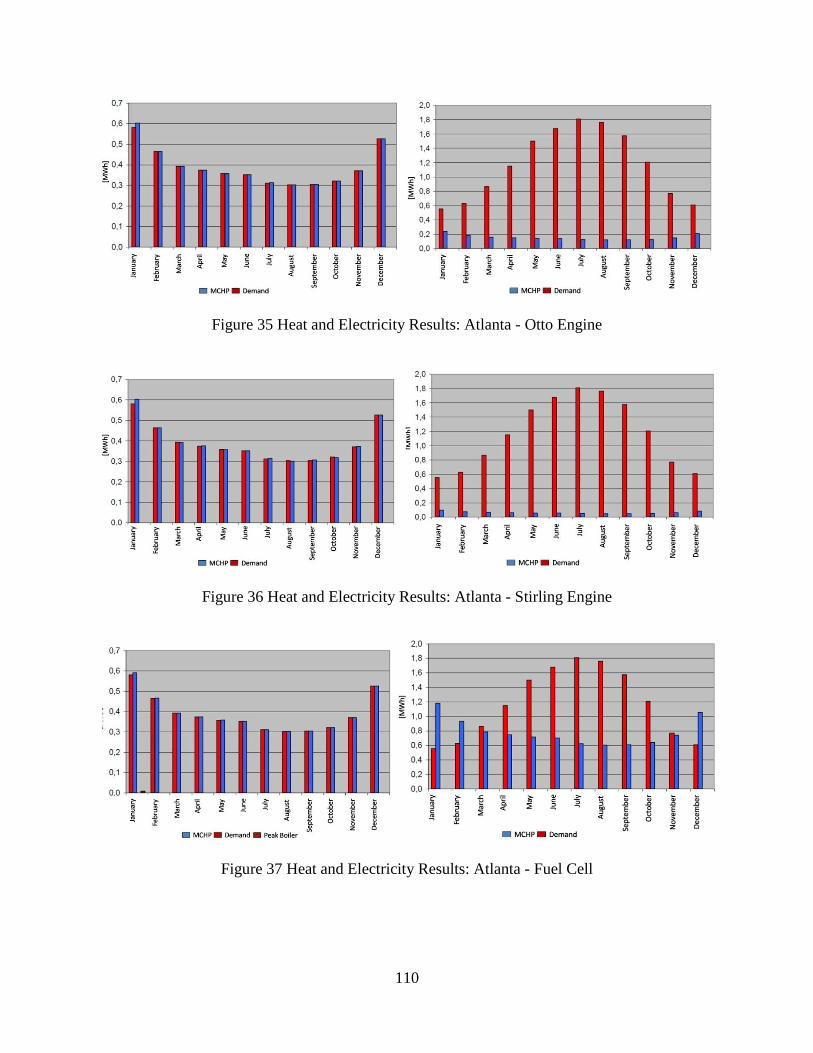
110
Figure 35 Heat and Electricity Results: Atlanta - Otto Engine
Figure 36 Heat and Electricity Results: Atlanta - Stirling Engine
Figure 37 Heat and Electricity Results: Atlanta - Fuel Cell
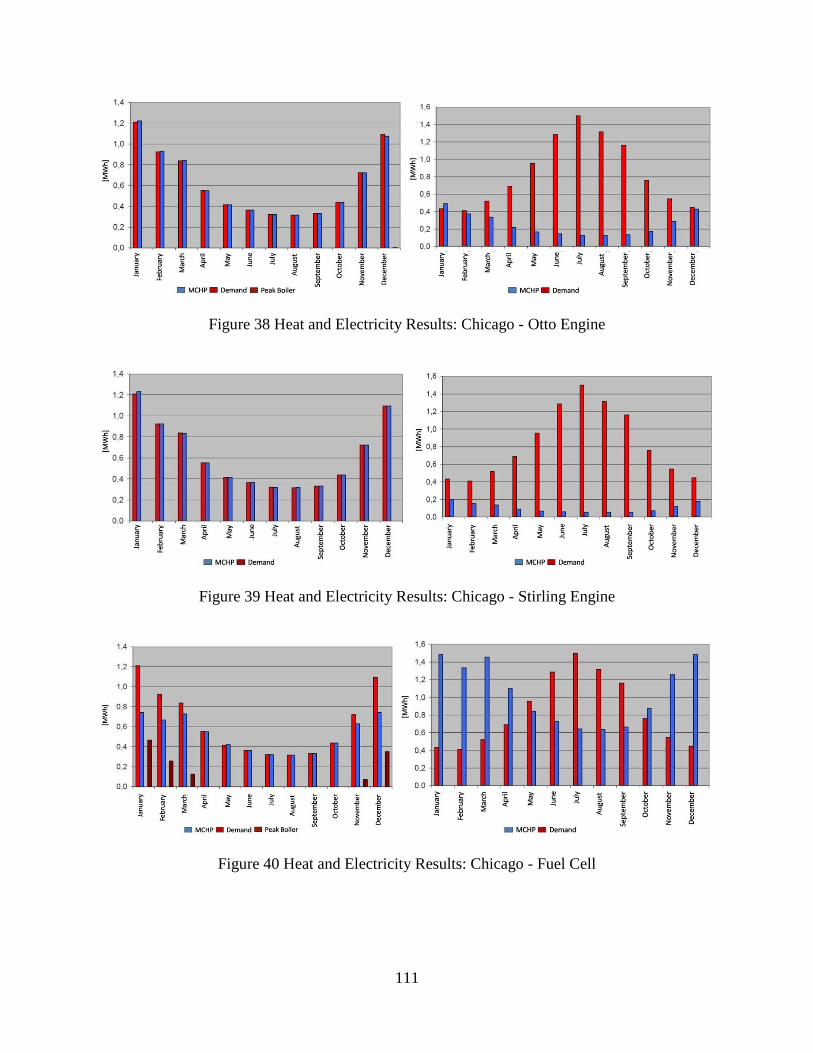
111
Figure 38 Heat and Electricity Results: Chicago - Otto Engine
Figure 39 Heat and Electricity Results: Chicago - Stirling Engine
Figure 40 Heat and Electricity Results: Chicago - Fuel Cell

112
APPENDIX F
F. FUEL BALANCE: SEPARATE AND COMBINED HEAT AND POWER
GENERATION
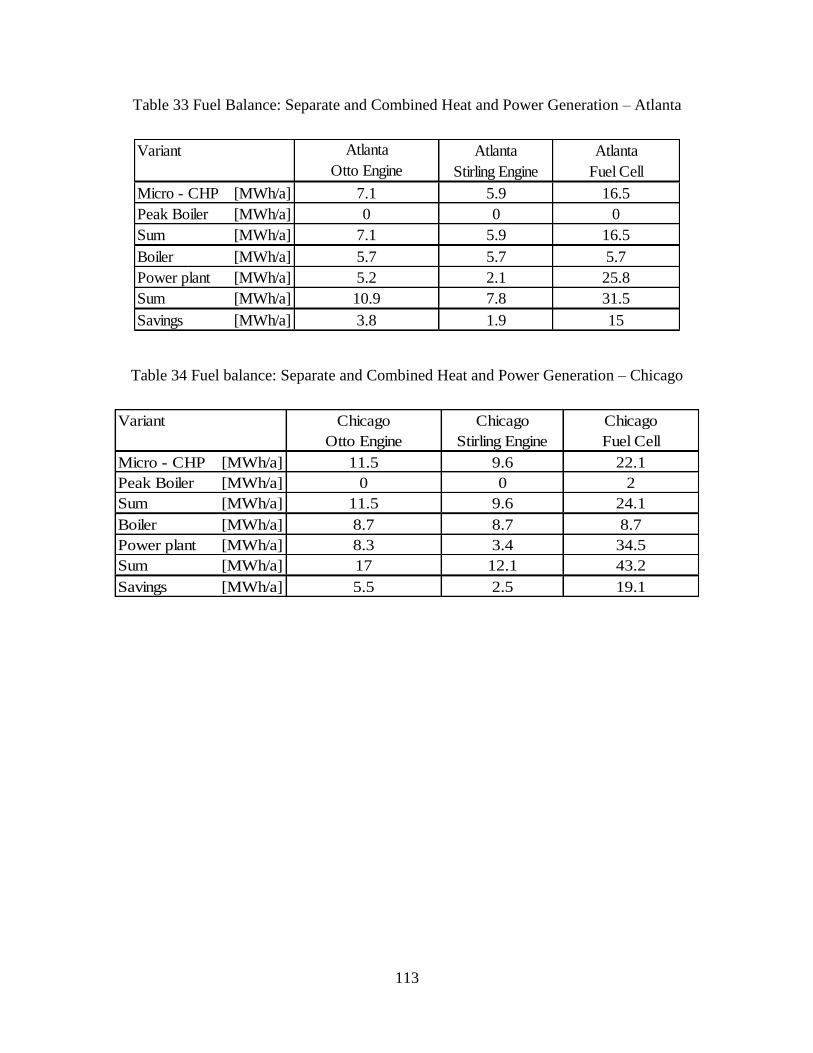
113
Table 33 Fuel Balance: Separate and Combined Heat and Power Generation – Atlanta
Variant Atlanta
Otto Engine
Atlanta
Stirling Engine
Atlanta
Fuel Cell
Micro - CHP [MWh/a] 7.1 5.9 16.5
Peak Boiler [MWh/a] 0 0 0
Sum [MWh/a] 7.1 5.9 16.5
Boiler [MWh/a] 5.7 5.7 5.7
Power plant [MWh/a] 5.2 2.1 25.8
Sum [MWh/a] 10.9 7.8 31.5
Savings [MWh/a] 3.8 1.9 15
Table 34 Fuel balance: Separate and Combined Heat and Power Generation – Chicago
Variant Chicago
Otto Engine
Chicago
Stirling Engine
Chicago
Fuel Cell
Micro - CHP [MWh/a] 11.5 9.6 22.1
Peak Boiler [MWh/a] 0 0 2
Sum [MWh/a] 11.5 9.6 24.1
Boiler [MWh/a] 8.7 8.7 8.7
Power plant [MWh/a] 8.3 3.4 34.5
Sum [MWh/a] 17 12.1 43.2
Savings [MWh/a] 5.5 2.5 19.1

114
APPENDIX G
G. COST PROGRESSION OF CHP UNITS

115
0.00
2000.00
4000.00
6000.00
8000.00
10000.00
12000.00
14000.00
16000.00
18000.00
1 2 3 4 5 6 7 8 9 10 11 12 13 14 15 16 17 18 19 20 21 22 23 24 25
Savi
ngs
[$
]
Time [years]
Annual Cost Boiler Atlanta Annual Cost MCHP Savings
Figure 41 Economic Calculation Atlanta - Otto Engine
0.00
2000.00
4000.00
6000.00
8000.00
10000.00
12000.00
14000.00
16000.00
18000.00
1 2 3 4 5 6 7 8 9 10 11 12 13 14 15 16 17 18 19 20 21 22 23 24 25
Savi
ngs
[$
]
Time [years]
Annual Cost Boiler Atlanta Annual Cost MCHP Savings
Figure 42 Economic Calculation Atlanta - Stirling Engine

116
0.00
5000.00
10000.00
15000.00
20000.00
25000.00
30000.00
35000.00
1 2 3 4 5 6 7 8 9 10 11 12 13 14 15 16 17 18 19 20 21 22 23 24 25
Savi
ngs
[$
]
Time [years]
Annual Cost Boiler Atlanta Annual Cost MCHP Savings
Figure 43 Economic Calculation Atlanta - Fuel Cell
0.00
2000.00
4000.00
6000.00
8000.00
10000.00
12000.00
14000.00
1 2 3 4 5 6 7 8 9 10 11 12 13 14 15 16 17 18 19 20 21 22 23 24 25
Savi
ngs
[$
]
Time [years]
Annual Cost Boiler Chicago Annual Cost MCHP Savings
Figure 44 Economic Calculation Chicago - Otto Engine
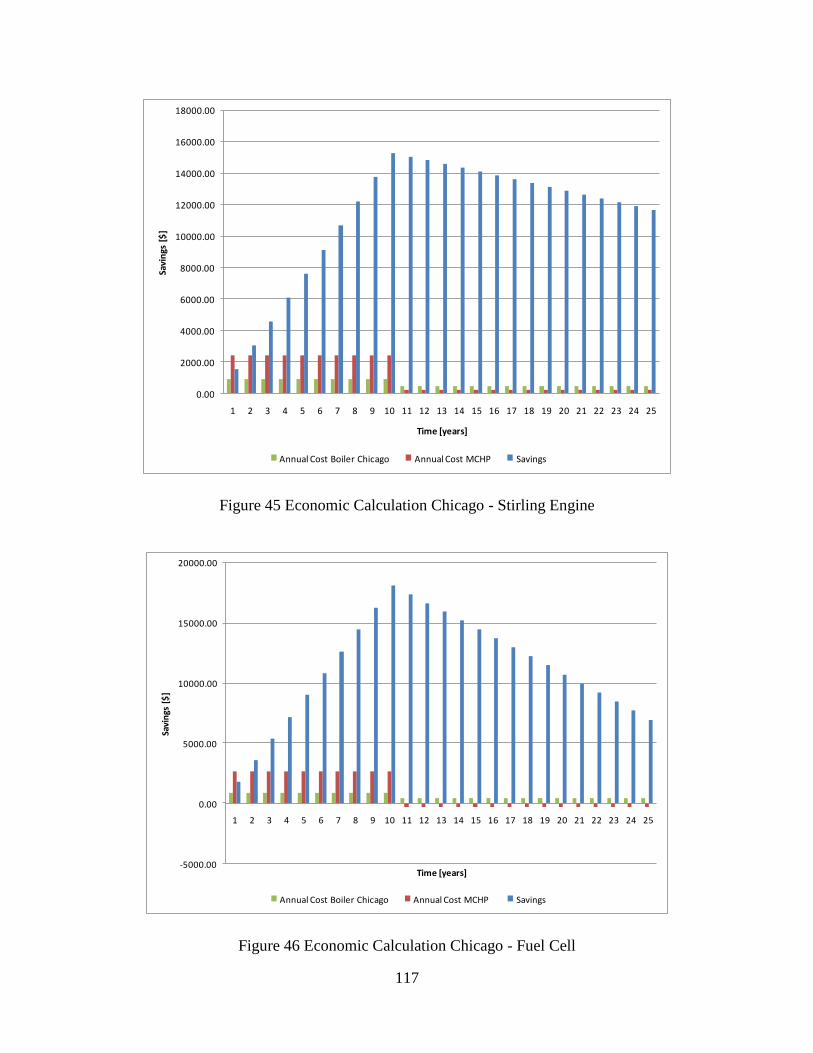
117
0.00
2000.00
4000.00
6000.00
8000.00
10000.00
12000.00
14000.00
16000.00
18000.00
1 2 3 4 5 6 7 8 9 10 11 12 13 14 15 16 17 18 19 20 21 22 23 24 25
Savi
ngs
[$
]
Time [years]
Annual Cost Boiler Chicago Annual Cost MCHP Savings
Figure 45 Economic Calculation Chicago - Stirling Engine
-5000.00
0.00
5000.00
10000.00
15000.00
20000.00
1 2 3 4 5 6 7 8 9 10 11 12 13 14 15 16 17 18 19 20 21 22 23 24 25
Savi
ngs
[$
]
Time [years]
Annual Cost Boiler Chicago Annual Cost MCHP Savings
Figure 46 Economic Calculation Chicago - Fuel Cell

118
VITA
Nadine Reinert was born in Stadthagen, Germany, as second of two children. She
attended the Wilhelm-Busch-Gymnasium in Stadthagen, Germany. After Graduation, she went
to the University of Applied Science and Arts in Hannover and worked at the same time for the
Joh. Heinr. Bornemann GmbH as draftsman. When she received her Diplom, she took over a
position as design engineer for the same company. After one and a half years she got promoted
to the system engineering department. In 2010, she relocated with her husband to the USA and
started the Graduate Program in Mechanical Engineering at the University of Tennessee at
Chattanooga. During that time she accepted a graduate assistant program at UTC. Nadine is
currently working in the Environmental Department of Volkswagen Group of America,
Chattanooga Operations, LLC.