Embed Size (px)
Citation preview

DRAFT – PRE-DECISIONAL – DRAFT
1
Combined Heat and Power 1
Technology Assessment 2
Contents 3
1. Introduction to the Technology/System ............................................................................................... 2 4
1.1 Combined Heat and Power overview ........................................................................................... 2 5
1.2 Benefits of CHP for the Nation ...................................................................................................... 4 6
1.3 Benefits of CHP for U.S. businesses .............................................................................................. 5 7
1.4 Status of CHP Market .................................................................................................................... 5 8
1.5 Challenges, Policy, and Regulatory ............................................................................................... 5 9
1.6 Opportunity ................................................................................................................................... 6 10
1.7 Options for CHP on the Electric Side ............................................................................................. 6 11
1.8 CHP in Grid Integration Scenario .................................................................................................. 7 12
2. Technology Assessment and Potential ................................................................................................. 7 13
2.1 Past CHP R&D Portfolio ................................................................................................................. 7 14
3. Program Considerations to Support R&D ........................................................................................... 10 15
3.1 Theoretical Feasibility of Ultra-High Generation technologies ................................................... 10 16
4. Risk and Uncertainty, and Other Considerations ................................................................................ 12 17
4.1 Barriers and unknowns ............................................................................................................... 12 18
5. Sidebars and Case Studies................................................................................................................... 13 19
5.1 CHP in Food Processing Industry – Frito-Lay Demonstration ..................................................... 13 20
5.1.1 Converting Waste Heat into Steam .................................................................................... 13 21
5.1.2 Running in Island Mode ...................................................................................................... 14 22
23
24
25

DRAFT – PRE-DECISIONAL – DRAFT
2
1. Introduction to the Technology/System 26
1.1 Combined Heat and Power overview 27
28
CHP is the concurrent production of electricity or mechanical power and useful thermal energy (heating 29 and/or cooling) from a single source of energy. CHP technologies provide manufacturing facilities, 30 commercial buildings, institutional facilities, and communities with ways to reduce energy costs and 31 emissions while also providing more resilient and reliable electric power and thermal energy1. CHP 32 systems combine the production of heat (for both heating and cooling) and electric power into one 33 process, using much less fuel than 34 when heat and power are produced 35 separately. CHP can operate in one of 36 two ways: either a “topping” cycle, 37 where engines, turbines, or fuel cells 38 generate electricity and the waste 39 heat is used for either heating or 40 cooling, or a “bottoming” cycle, 41 where waste heat from an industrial 42 or other source is used to drive an 43 electricity generator, frequently a 44 steam turbine. 45 46 The efficiency of CHP is most 47 commonly calculated by dividing the total usable output (electrical and thermal), by the total fuel input 48 to the system. Today’s CHP systems are generally designed to meet the thermal demand of the energy 49 user – whether at building, plant or city-wide levels – because it maximizes system efficiency and costs 50 less to transport surplus electricity than to pipe surplus heat from a CHP plant2. CHP systems can achieve 51 energy efficiencies of 75 percent or more, compared to producing heat and power separately, which is 52 on average less than 50 percent efficient (Figure 1). )3. 53 54 The U.S. currently has an installed co-generation capacity of 82.9 gigawatts (GW) of electric capacity at 55 over 4,300 facilities, which represents 8% of current U.S. electricity generating capacity (by MW)45. More 56
1 Combined Heat and Power: Pathway to Lower Energy Costs, Reduced Emissions, Secure and Resilient Energy Supply, Fact
Sheet, Environmental and Energy Study Institute, May 2013. Available at - http://www.eesi.org/files/FactSheet_CHP_052113.pdf.
2 Combined Heat and Power – Evaluating the Benefits of Greater Global Investment, IEA 2008. Available at -
http://www.iea.org/publications/freepublications/publication/chp_report.pdf.
3 U.S. Department of Energy (DOE) and U.S. Environmental Protection Agency (EPA). Combined Heat and Power: A Clean
Energy Solution. DOE/EE-0779. August 2012. Available at - http://www.epa.gov/chp/documents/clean_energy_solution.pdf.
4 ICF Combined Heat and Power database (funded by US DOE and Oak Ridge National Laboratory). http://www.eea-
inc.com/chpdata/

DRAFT – PRE-DECISIONAL – DRAFT
3
than two-thirds are fueled with natural gas, but renewable biomass, and process wastes are also used. 57 CHP capacity growth has been slow since the early 2000s; however, 2012 had the most new installed 58 capacity since 2005, with 955 MW of installed CHP capacity6. Interest in CHP in the U.S. is rising due to 59 low natural gas prices, the increasing return of manufacturing to the U.S., and growing awareness of the 60 value of energy resiliency. 61 62
63 Source: ICF Combined Heat and Power Installation Database 64 65 66 67 CHP systems can be used in many different settings and many different scales, ranging from the micro, 68 residential scale producing as low as 60 kW to large-scale industrial systems that produce more than 20 69 megawatts (MW) of power. Applications include7: 70
Manufacturing (chemicals, refineries, pulp and paper, food processing, pharmaceuticals, 71 biorefineries, etc.) 72
5 The ICF Combined Heat and Power database contains information on all known CHP systems in operation today.
It the best estimate we have of the complete CHP market, but still only an estimate due to the constantly changing numbers (new additions, existing capacity either shut down or put on standby, or changes in operation (e.g., less hours per year)). These numbers may differ somewhat from the estimates in the Manufacturing Energy Consumption Survey (MECS). MECS data does not include 3
rd party owned and operated CHP. The MECS
estimates also only include manufacturing industries, and as such does not include commercial/institutional CHP, agricultural CHP and mining CHP. 6 ICF Combined Heat and Power database (funded by US DOE and Oak Ridge National Laboratory). http://www.eea-
inc.com/chpdata/ 7 Combined Heat and Power: Pathway to Lower Energy Costs, Reduced Emissions, Secure and Resilient Energy Supply, Fact
Sheet, Environmental and Energy Study Institute, May 2013. Available at - http://www.eesi.org/files/FactSheet_CHP_052113.pdf.
0
200
400
600
800
1,000
1,200
1,400
1,600
1,800
2,000
2005 2006 2007 2008 2009 2010 2011 2012 2013 2014*
Cap
acit
y (M
W)
Annual CHP Capacity Additions (MW)
* preliminary

DRAFT – PRE-DECISIONAL – DRAFT
4
Critical infrastructure (emergency services facilities, hospitals, water and wastewater treatment 73 plants, etc.) 74
Institutional (retirement homes, research institutions, government buildings) 75
Commercial (hotels, airports, office buildings) 76
District energy (colleges and university campuses, urban centers, military bases) 77
Residential (large multi-family units and a small number of individual homes) 78 79 The greatest use of CHP is in the manufacturing sector, with approximately 86% of the CHP capacity (see 80 Figure 2). 81
82 83 The International District Energy Association (IDEA) has identified 601 district energy systems in the US, 84 289 of which are currently district energy-only systems8 . CHP installed as part of district energy systems 85 has grown in recent years – there is currently 6.6 GW of CHP generating capacity at district energy sites, 86 spread across 55 downtown systems and 153 university campus district energy systems. 87 88 The U.S. Federal government has set a target of 40 GW of additional CHP capacity by 2020, an increase 89 of nearly 50% above the 2012 baseline of installed capacity of 82 GW. Additionally, 34 states and the 90 District of Columbia have incentives or regulations encouraging the deployment of CHP and district 91 energy, though the approach is not integrated at the national level9 . 92 93
1.2 Benefits of CHP for the Nation 94
95
Improves U.S. manufacturing competitiveness by lowering energy operating costs to 96 manufacturers 97
Offers a low-cost approach to new electricity generation capacity 98
Improves resiliency to the local electrical power allowing for business continuity in the event of 99 a man-made or natural disaster 100
8 The IEA CHP and DHC Collaborative – CHP/DHC Country Scorecard: United States. Available at
http://www.iea.org/publications/insights/insightpublications/US_CountryScorecard_FINAL.pdf 9 Ibid
Figure 2 – Existing CHP capacity in the U.S. by sector, 2012 6.

DRAFT – PRE-DECISIONAL – DRAFT
5
Provides an immediate path to lower GHG emissions through increased energy efficiency - use 101 of CHP currently avoids 248 million metric tons of carbon dioxide per year 102
Lessens the need for new transmission and distribution (T&D) infrastructure and enhances 103 power grid security 104
Uses abundant clean domestic energy sources – over 83% of CHP capacity is fueled by natural 105 gas, biomass, or waste fuels 106
Uses highly skilled American labor. 107 108
1.3 Benefits of CHP for U.S. businesses 109
110
Combined heat and power systems provide effective, efficient, reliable, and less costly power to 111 businesses across the nation. CHP has proven to: 112
Increase production efficiency, reducing business costs 113
Reduces risk of electric grid disruptions, enhances energy reliability and lessens potential 114 impacts on business operations 115
Provides stability in the face of uncertain electricity prices 116
In many parts of the country, CHP provides not only operating savings for the user, but also 117
represents a cost-effective supply of new power generation capacity. As an example, Figure 3 118
compares the cost of electricity generated from small, medium, and large sized CHP projects 119
with delivered electricity costs in New Jersey and the cost of electricity from new central power 120
generation10 . 121
122
1.4 Status of CHP Market 123
124
CHP is considered by many to be a “mature” technology. There is significant deployment of the 125
technology in the large industrial and large commercial/institutional sectors. The economies of scale 126
allow CHP to be cost-effective for high-thermal demand applications in the size range above 5MW. 1-5 127
MW systems are typically cost-effective when sized for thermal demand, but can face significant barriers 128
when interconnecting with their electric utility regarding interconnection standards; utility rates, such as 129
stand-by; and opportunities to sell electricity back to the grid, such as in net-metering. These barriers 130
can influence the systems overall cost-effectiveness. 131
1.5 Challenges, Policy, and Regulatory 132
133
While current thermally-sized CHP technologies are cost-effective and broadly deployed in the medium 134
to large size ranges (>5 MW), there are a host of policy and regulatory barriers that limit its deployment 135
in the marketplace. These barriers limit the ability for CHP to succeed in energy services markets. 136
10 ORNL. Combined Heat and Power, Effective Energy Solutions for a Sustainable Future. 2008. Available at - http://www.energy.gov/sites/prod/files/2013/11/f4/chp_report_12-08.pdf.

DRAFT – PRE-DECISIONAL – DRAFT
6
Improvements in the following areas have been proposed to maximize the cost-effective penetration of 137
CHP technologies: 138
Design of standby rates 139 Interconnection standards for CHP with no electricity export 140 Excess power sales 141 Clean energy portfolio standards (CEPS) 142 Emerging market opportunities—CHP in critical infrastructure and utility participation in CHP 143
markets. 144
1.6 Opportunity 145
146
While existing thermally-driven CHP systems sized to fill 100% of a facility thermal demand (low power 147
to heat ratio (𝑃
𝐻), typically below 0.75) are currently cost effective in many markets and applications, 148
there still remains a vast unserved market with smaller thermal demand relative to electrical (𝑃
𝐻 up to 149
1.5) in the industrial, commercial/institutional, and residential sectors. By increasing 𝑃
𝐻 while 150
maintaining the high efficiencies that thermally-sized CHP systems enjoy an enormous energy and cost 151
savings opportunity would be untapped (the potential is examined in later sections of this document). 152
Increasing 𝑃
𝐻 without loss of efficiency would entail the development of ultra-high efficient generating 153
technologies. Ultra-efficient electricity generation could be a transformative technology leap for 154
providing power to end-use customers. Combined with increased use of renewables, 70% efficient 155
power generation (an effective doubling of current U.S. average electricity generation efficiency), could 156
lead the U.S. down the path of 80% carbon reductions by 205011. Meeting these aggressive goals will 157
require a transformation both in how energy is produced and consumed. A proposed R&D activity 158
focused on ultra-efficient electricity generation technologies will focus on increasing the CHP electricity 159
generation efficiency. 160
1.7 Options for CHP on the Electric Side 161
162
A rough analysis of the opportunities of deploying highly-efficient CHP to applications that fall outside of 163
the traditional thermally-driven systems was carried out (details in the following sections). The analysis 164
examined how much increased technical potential and energy savings could be captured if CHP systems 165
could be deployed in applications with a power to heat ratio of up to 1.5 (current power to heat ratios in 166
existing CHP systems are closer to 0.75). 167
168
This analysis showed that expanding the market applications for CHP systems to those driven more by 169
electrical rather than thermal output could save an additional 1.3 Quads of energy more than existing 170
CHP technologies alone. 171
11
The White House, Remarks by the President at the Morning Plenary Session of the United Nations Climate
Change Conference (Dec. 18, 2009) (online at www.whitehouse.gov/the-press-office/remarks-president-morning-
plenary-session-united-nations-climate-change-conference).

DRAFT – PRE-DECISIONAL – DRAFT
7
172
1.8 CHP in Grid Integration Scenario 173
174
CHP has the potential to play a larger and significant role in the modern smart grid. Integrating 175
manufacturing operations and resources (including CHP) into the modern grid system will allow 176
manufacturers to enjoy the cost savings from reduced on-site fuel consumption and will also provide the 177
potential for the realization of additional revenue streams. In a truly integrated and smart grid, a 178
manufacturer may be able to participate in ancillary services markets, enhanced demand-response 179
programs, and other alternate revenue-generating schemes. The end result of grid integration of 180
electric-driven CHP distributed generation will be stronger, more profitable, and more resilient 181
operations for both the utility and end-use sectors. Additional end-user benefits would include 182
avoidance of lost revenues due to a more reliable, and resilient grid. 183
2. Technology Assessment and Potential 184
2.1 Past CHP R&D Portfolio 185
186
The DOE CHP R&D Portfolio has included: 187
188
Advanced Reciprocating Engine Systems (ARES): The goal of the ARES program was to deliver a 189 technologically advanced engine/generator system that combines high specific power output 190 and low exhaust emissions with world-class overall efficiency, while maintaining excellent 191 durability, all provided at a low installed cost. This program resulted in demonstrated engine 192 efficiencies that increase from ~35% at project start to 50%, a nearly 50% increase in efficiency. 193
194
Packaged CHP Systems: The development of packaged CHP systems suitable for smaller 195 industrial facilities can enable users to avoid complicated and costly system integration and 196 installation but still maximize performance and increase efficiency. The projects included: 197
198 - High Efficiency Micro-turbine with Integral Heat Recovery 199 - Flexible CHP System with Low NOx, CO and VOC Emissions 200 - Low-Cost Packaged Combined Heat and Power System 201 - Combined Heat and Power Integrated with Burners for Packaged Boilers 202
203
High Value Applications: New high-value CHP technologies and applications can offer attractive 204 end-user economics, significant energy savings, and with reproducible results. 205
- Flexible Distributed Energy and Water from Waste for the Food and Beverage Industry 206 - Microchannel High-Temperature Recuperator for Fuel Cell Systems 207 - Novel Controls for Economic Dispatch of Combined Cooling, Heating and Power (CCHP) 208
Systems 209 - Residential Multi-Function Gas Heat Pump 210 - Ultra Efficient Combined Heat, Hydrogen, and Power System 211
212
DRAFT – PRE-DECISIONAL – DRAFT
8
Fuel-Flexible CHP: Accelerating market adoption of emerging technology and fuel options can 213 improve industry competitiveness through more stable energy prices, cost savings, and 214 decreased emissions. Examples of these technology and fuel options include a biomass gasifiers, 215 gas turbines utilizing opportunity fuels, landfill gas cleanup and removal systems, and 216 desulfurization sorbents for fuel cell CHP. 217
- Adapting On-site Electrical Generation Platforms for Producer Gas 218 - Development of an Advanced Combined Heat and Power (CHP) System Utilizing Off-Gas 219
from Coke Calcination 220 - Development of Fuel-Flexible Combustion Systems Utilizing Opportunity Fuels in Gas 221
Turbines 222 - Integrated Combined Heat and Power/Advanced Reciprocating Internal Combustion 223
Engine System for Landfill Gas to Power Applications 224 - Fuel-Flexible Microturbine and Gasifier System for Combined Heat and Power 225 - Low-NOx Gas Turbine Injectors Utilizing Hydrogen-Rich Opportunity Fuels 226 - Novel Sorbent to Clean Biogas for Fuel Cell Combined Heat and Power 227
228
Demonstrations: The installation of innovative technologies and applications that offer the 229 greatest potential for replication can provide compelling data and information to foster market 230 uptake in manufacturing and other applications. 231
- ArcelorMittal USA Blast Furnace Gas Flare Capture 232 - BroadRock Renewables Combined Cycle Electric Generating Plants Fueled by Waste 233
Landfill Gas 234 - Combustion Turbine CHP System for Food Processing Industry 235 - Texas A&M University CHP System 236 - Thermal Energy Corporation Combined Heat and Power Project 237
238
239
Technology Needs 240
Highly-efficient CHP systems (~90%) are currently possible and deployed in limited applications with 241
very high thermal and low electrical demands (low power to heat ratio (𝑃
𝐻). A key area for expanding the 242
market for CHP, while also creating real, tangible thermodynamic improvements, is in pushing the 𝑃
𝐻 243
ratio while maintaining high efficiencies. This would involve the development of ultra-high efficient 244
distributed generation technologies. 245
246
Ultra-efficient electricity generation technologies (70% efficient power generation on an electric-only 247
basis, an effective doubling of current U.S. average electricity generation efficiency) focus on increasing 248
the CHP electricity generation efficiency. 249
250
Several technology configurations are being examined for thermodynamic maximum efficiencies: 251
combine cycle system in the 1 MW range, using natural gas fuel, whose product is AC electricity. These 252
include: 253
Fuel cell as topping cycle, reciprocating engine as bottoming cycle. 254
Reciprocating engine as topping cycle and Stirling engine as bottoming cycle 255

DRAFT – PRE-DECISIONAL – DRAFT
9
Stirling engine as topping cycle and ORC cycle as bottoming 256
Fuel cell as topping cycle and small gas turbine as bottoming cycle 257
(See analysis in following section for more detail on theoretical efficiencies) 258
259
A rough analysis of the opportunities of deploying highly-efficient CHP to applications that fall outside of 260
the traditional thermally-driven systems was carried out.12 The analysis examined how much increased 261
technical potential and energy savings could be captured if CHP systems could be deployed in 262
applications with a power to heat ratio of up to 1.5 (current power to heat ratios in existing CHP systems 263
are closer to 0.75). The analysis examined how much increased technical potential and energy savings 264
could be captured if CHP systems could be deployed in applications with a power to heat ratio of up to 265
1.5 (current power to heat ratios in existing CHP systems are closer to 0.75). The following system 266
characteristics were assumed: 267
• For 50-1,000 KW systems : 30.5% electrical efficiency and 79.6% overall efficiency 268
• For 1-5 MW systems : 34.8% electrical efficiency and 77.7% overall efficiency 269
270
The following sectors were included in the analysis13: 271
272
Manufacturing:
Commercial/Institutional:
• Textiles
• Plastics
• Fabricated Metals
• Machinery, Electrical, Computers
and Electronic Equipment
• Transportation Equipment
• Commercial Buildings (NEC)
• Schools
• Retail Stores
• Restaurants
• Food Stores
• Government Buildings
• Prisons
• Wastewater Treatment
• Refrigerated Warehouses
• Airports
• Post Offices
• Museums
273
This analysis showed that expanding the market applications for CHP systems to those driven more by 274
electrical rather than thermal output could save an additional 1.3 Quads of energy more than existing 275
CHP technologies alone. 276
277
12
This was an internal DOE analysis done to estimate impact of expanded CHP market applications. 13
The sectors in this analysis include those that typically have higher electrical loads, relative to thermal loads.
Markets like pulp and paper, chemicals, refineries, hospitals, and universities were not included, since they are
already well-served by CHP technologies.
DRAFT – PRE-DECISIONAL – DRAFT
10
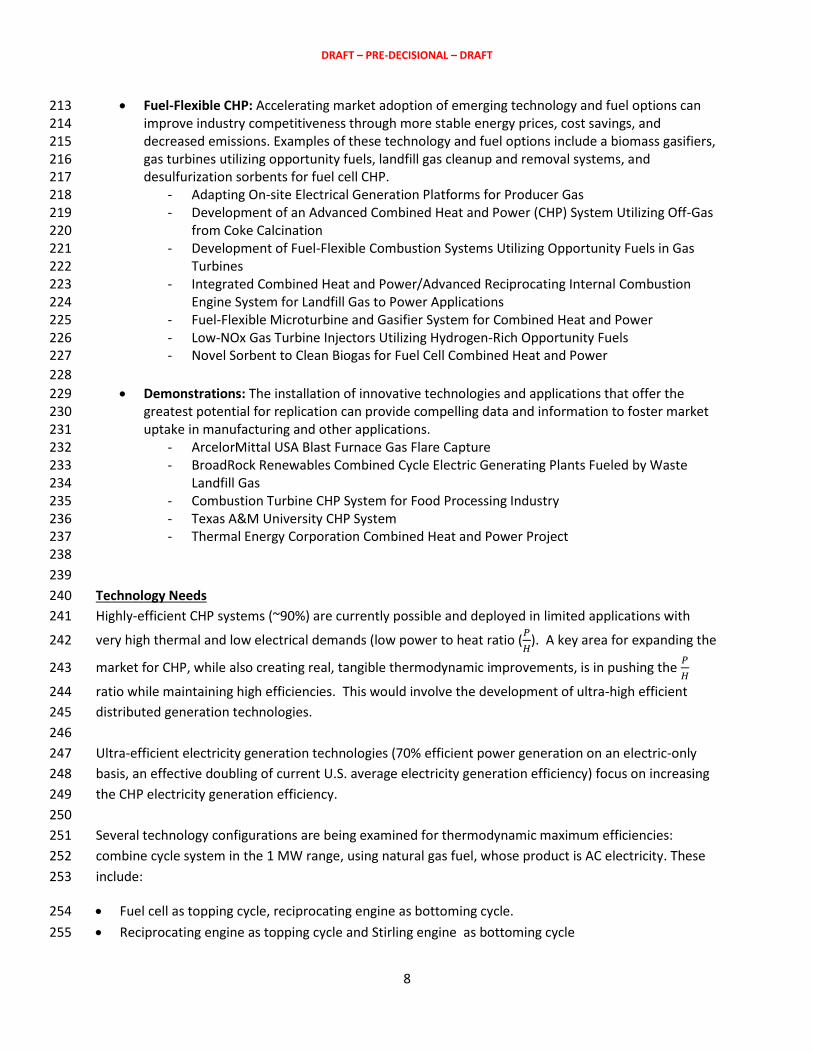
Benefits Manufacturing Sector
Commercial/ Institutional Sector
Total
Incremental MW Potential (based on 𝑷
𝑯 ratio up to 1.5)
4,739 MW 45,128 MW 52,867 MW
Incremental Primary Energy Savings (TBtu) – Assuming 33% average grid efficiency
144 TBtu 1,164 TBtu 1,308 TBtu
User Incremental Energy Cost Savings ($ Millions)
$1,316 Million $8,660 Million $9,976 Million
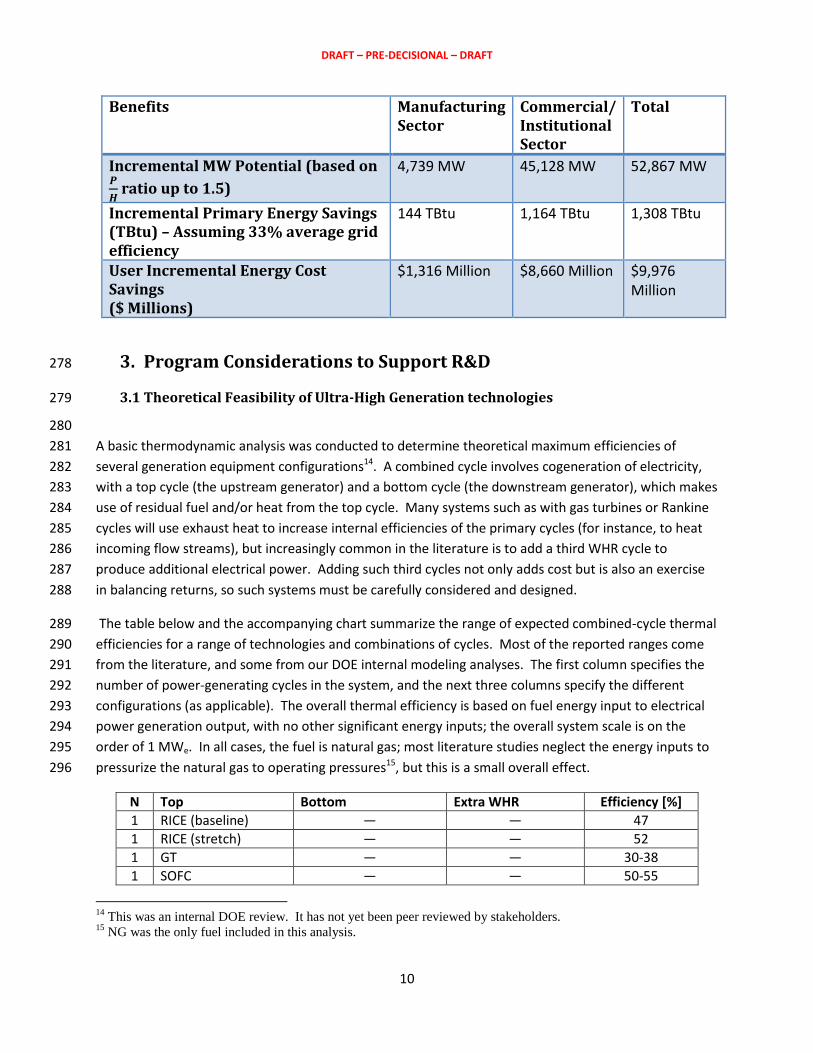
3. Program Considerations to Support R&D 278
3.1 Theoretical Feasibility of Ultra-High Generation technologies 279
280
A basic thermodynamic analysis was conducted to determine theoretical maximum efficiencies of 281
several generation equipment configurations14. A combined cycle involves cogeneration of electricity, 282
with a top cycle (the upstream generator) and a bottom cycle (the downstream generator), which makes 283
use of residual fuel and/or heat from the top cycle. Many systems such as with gas turbines or Rankine 284
cycles will use exhaust heat to increase internal efficiencies of the primary cycles (for instance, to heat 285
incoming flow streams), but increasingly common in the literature is to add a third WHR cycle to 286
produce additional electrical power. Adding such third cycles not only adds cost but is also an exercise 287
in balancing returns, so such systems must be carefully considered and designed. 288
The table below and the accompanying chart summarize the range of expected combined-cycle thermal 289
efficiencies for a range of technologies and combinations of cycles. Most of the reported ranges come 290
from the literature, and some from our DOE internal modeling analyses. The first column specifies the 291
number of power-generating cycles in the system, and the next three columns specify the different 292
configurations (as applicable). The overall thermal efficiency is based on fuel energy input to electrical 293
power generation output, with no other significant energy inputs; the overall system scale is on the 294
order of 1 MWe. In all cases, the fuel is natural gas; most literature studies neglect the energy inputs to 295
pressurize the natural gas to operating pressures15, but this is a small overall effect. 296
N Top Bottom Extra WHR Efficiency [%]
1 RICE (baseline) — — 47
1 RICE (stretch) — — 52
1 GT — — 30-38
1 SOFC — — 50-55
14
This was an internal DOE review. It has not yet been peer reviewed by stakeholders. 15
NG was the only fuel included in this analysis.

DRAFT – PRE-DECISIONAL – DRAFT
11
2 RICE Rankine — 51-57
RICE Stirling — 51-59
2 GT Rankine — 40-45
2 SOFC GT — 58-64
2 SOFC Stirling — 60
2 SOFC RICE — 65
2 SOFC Rankine — 62-67
3 SOFC GT Rankine 63-78
3 SOFC RICE Rankine 69-71
297
298
299
Key: GT = gas turbine; RICE = reciprocating internal combustion engine; SOFC = solid oxide fuel cell; 300
Rankine = Rankine cycle using either water or refrigerants (for organic Rankine cycle); Stirling = Stirling 301
cycle engine. 302
30
35
40
45
50
55
60
65
70
75
80
The
rmal
Eff
icie
ncy
, %
(e
lect
rica
l ge
ne
rati
on
on
ly)
Single generation Cogeneration Trigeneration

DRAFT – PRE-DECISIONAL – DRAFT
12
Based on this preliminary analysis, it would appear that an aggressive and theoretically possible initial 303
target efficiency for ultra-high efficiency generation is 70%%. . Initial tentative target price of 304
generation is $1/W16. Details on milestones, timeline, and metrics are still being developed. 305
306
Three main technical areas for development of ultra-high-efficient generation include component 307
development, systems development, and technology validation. 308
Technology Improvement Areas
Component Development Prime Mover Technology (engines, turbines, micro-turbines, fuel cells)
Heat Recovery, Heat Exchanger Materials, and Thermally-Activated Utilization
Combustion - including fuel compression and temperature
Fuel Collection, Handling, Composition Monitoring & Treatment
Materials – capable of withstanding extreme temperatures and pressures
Systems Development Thermodynamic Cycles
System Engineering/Packaged Design
Process, Facility, and Utility Integration
Technology Validation Full-Scale Evaluation
Pre-Commercial Demonstration
Innovative Applications and Performance Monitoring
4. 309
Risk and Uncertainty, and Other Considerations 310
4.1 Barriers and unknowns 311
312
While traditional CHP is a fairly mature technology, it remains underutilized for both technical and policy 313
reasons, as well as lack of understanding of CHP. Improving the technology to apply to a broader 314
market will help bring down costs to existing markets as well, making the technology more attractive 315
than it is currently, but will do little to address the policy and regulatory barriers to CHP and other 316
distributed generation technologies. 317
318
Additional market uncertainties include the cost escalation of various fuels as well as electricity, effects 319
of GHG reductions and the “greening” of the grid, impacts of policy on the US economy and revitalizing 320
our industrial base. 321
322
16
This is still tentative, pending a more detailed stakeholder reviews

DRAFT – PRE-DECISIONAL – DRAFT
13
The activities of the DOE CHP Deployment program, through the DOE CHP Technical Assistance 323
Partnerships (CHP TAPS), are key to continuing to ensure that the benefits of highly-efficient CHP are 324
realized. 325
5. Sidebars and Case Studies 326
5.1 CHP in Food Processing Industry – Frito-Lay Demonstration 327
328 Frito-Lay North America, Inc. installed a combined heat and power (CHP) system at its food processing 329 plant in Killingly, Connecticut, in April 2009. The installation was supported by funds from the U.S. 330 Department of Energy (DOE) in partnership with the Energy Solutions Center1 as well as incentives from 331 the State of Connecticut. 332
In order to reduce the energy costs and environmental impact of the Killingly plant while easing 333 congestion on the constrained Northeast power grid, Frito-Lay installed: 334
A 4.6 megawatt (MW) Solar Turbines Centaur® 50 natural gas combustion turbine; 335
A Rentech heat recovery steam generator (HRSG) equipped with supplemental duct firing; 336 337
Combustion air inlet chilling to increase power generation in warm weather; and 338
A selective catalytic emission reduction system. 339 340
The CHP system, designed to be electric load following, has the capacity to meet 100% of the plant’s 341 electrical power needs and provide a majority of the facility’s annual steam needs. 342 343
5.1.1 Converting Waste Heat into Steam 344
Before the installation of the CHP system, the Killingly plant steam requirements were provided by three 345 dual-fired (natural gas and residual oil) boilers. The three boilers were over thirty years old, and if one 346 boiler needed service, the remaining two boilers could no longer meet the plant’s peak steam load. The 347 CHP system can now provide about 80% of the steam load for the Killingly facility. The unfired steam 348 production from the gas turbine exhaust is approximately 24,000 lb/hour, and maximum supplementary 349 fired steam production is as high as 60,000 lb/hour. 350
351
Estimated Benefits of CHP System
Efficiency 70% overall CHP efficiency
Emissions Reduction 93% reduction in overall NOx emissions 89% reduction in site NOx emissions 99% reduction in SO2 emissions 12% reduction in CO2 emissions

DRAFT – PRE-DECISIONAL – DRAFT
14
Cost Savings $1 million annually
Reliability Provides over 90% of the electrical demand and 80% of the steam load for the facility, with an operating availability of 96.4%
352
353
5.1.2 Running in Island Mode 354
The Killingly plant—a 24/7 operation—has the capability to run in island mode using the CHP system if 355 the power grid goes down. In 2009 and 2010, flying squirrels shorted out local service, leaving the entire 356 area without power for hours. However, Frito Lay’s CHP system continued operating—for six hours in 357 the first incident and eight hours in the second—allowing the plant to maintain production. This added 358 power reliability avoided product losses and prevented the need for food safety re-inspections, resulting 359 in significant cost savings. 360
361 The ability to run in island mode also means that the plant is less susceptible to outages caused by 362
severe storms. The Killingly plant was intentionally powered down one day prior to Tropical Storm Irene 363
in 2011. Three days after the storm, more than 60% of Killingly remained without power, but with the 364
CHP system, Frito-Lay was quickly able to resume production less than 24 hours after the storm had 365
passed.3 The Killingly plant also remained operational during a late October 2011 snowstorm that had 366
knocked out power to nearby areas. The plant would also have continued operating during Superstorm 367
Sandy in October 2012 and a blizzard in February 2013 if the roads had not been shut down by the 368
governor. 369