Embed Size (px)
Citation preview
6 September 2021
Cobram Estate Olives (CBO)
First press
Recommendation
Buy (Initiation) Price
$2.00 Target (12 months)
$2.30 (Initiation)
Analyst
Jonathan Snape 613 9235 1601
Authorisation
Chris Savage 612 8224 2835
GICS Sector
Food Beverage and Tobacco
Expected Return
Capital growth 15.0%
Dividend yield 1.7%
Total expected return 16.7%
Company Data & Ratios
Enterprise value $948.5m
Market cap $774.9m
Issued capital 387.4m
Free float 67%
Avg. daily val. (52wk) $3.2m
12 month price range $1.81-2.21
Price Performance
BELL POTTER SECURITIES LIMITED ABN 25 006 390 772 AFSL 243480
DISCLAIMER: THIS REPORT MUST BE READ WITH THE DISCLAIMER ON PAGE 24 THAT FORMS PART OF IT. DISCLOSURE: BELL POTTER SECURITIES ACTED AS A FINANCIAL ADVISOR TO COBRAM’S COMPLIANCE LISTING IN AUGUST 2021 AND RECEIVED FEES FOR THAT SERVICE.
Page 1
Company background
Cobram Estate Olives (Cobram) is a vertically integrated producer and marketer of
olive oil products with operations in Australia and USA and export customers in ~17
counties. Established in 1998, today Cobram owns or leases ~6,889Ha (~99%
company owned) of maturing olive groves across Australia (6,584Ha) and California
(305Ha), with ~3,182Ha of olive suitable land for expansion, and packaged olive oil
sales reaching $123.2m in FY21.
Fast growing brand with maturing orchard assets
Market leading Australian brands: Cobram has developed and owns two market
leading Australian olive oil brands in Cobram Estates and Red Island which combined
account for ~45% of the Australian Extra Virgin Olive Oil (EVOO) market, a segment
which has seen retail sales value has grown by +37% since FY17.
Exposure to a maturing orchard asset base in Australia: ~39% of the Australian
orchards have yet to reach maturity and ~15% have yet to reach first harvest. Maturing
company orchards combined with access to additional fruit from immature third party
plantings provide access to a step change in olive oil volumes over the next decade.
Exposure to a North American development asset: Since FY14 Cobram has grown
to be the third largest producer and second largest Californian olive oil brand in the
US. The transition from bulk to branded producer should benefit margins in the long
run, while providing an outlet for any surplus oil inventory from the Australian groves.
Investment view: Initiate coverage with an Buy rating
We initiate coverage on Cobram with a Buy rating and $2.30ps target price. Cobram
offers exposure to a premium FMCG brand in a fast growing market. In addition the
business should benefit from an expanding orchard asset base lifting oil supply and
through the cycle earnings. As a compliance listing that provides a liquidity event,
there is the potential of a near term stock overhang. However, we would see liquidity in
an off production year as likely to provide buying opportunities.
Absolute Price Earnings Forecast
Year end June 2021 2022e 2023e 2024e
Revenue ($m) 207.2 184.8 258.5 223.8
EBITDA ($m) 70.3 24.3 85.5 36.3
NPAT (reported) ($m) 32.6 0.4 43.2 8.9
NPAT (adjusted) ($m) 32.6 0.4 43.2 8.9
EPS (adjusted) (cps) 8.0 0.1 10.6 2.2
EPS growth (%) n.a. n.a. n.a. n.a.
PER (x) 25.0 1,919.8 18.9 91.2
FCF Yield (%) (0.3) 1.5 (1.0) 3.6
EV/EBITDA (x) 13.5 39.0 11.1 26.1
Dividend (¢ps) - 3.3 3.3 3.3
Franking (%) - - - -
Yield (%) - 1.7 1.7 1.7
ROE (%) 17.1 0.2 20.7 4.4
SOURCE: IRESS SOURCE: BELL POTTER SECURITIES ESTIMATES

Page 2
Cobram Estate Olives (CBO) 6 September 2021
Contents
Background and Investment highlights ....................................... 3 Investment risks ............................................................................. 5 Target price determination ............................................................ 8 Olive oil basics ............................................................................. 11
Industry backdrop ........................................................................ 12 Financial overview ....................................................................... 16 Management and board ............................................................... 20
Major shareholders ...................................................................... 22
Page 3
Cobram Estate Olives (CBO) 6 September 2021
Background and Investment highlights
COMPANY BACKGROUND
Cobram Estate Olives (Cobram) is a vertically integrated producer and marketer of olive oil
products with operations in Australia and California and export customers in ~17 counties.
Established in 1998, today Cobram is Australia’s largest producer of extra virgin olive oil
(accounting for ~70% of Australia annual oil production) and owner of the two largest retail
brands in Cobram Estates and Red Island. In 2014 a beachhead was established in
California, which today is the number three olive oil processor in California and number 10
ranked olive oil brand (at ~1.3% EVOO share). Today Cobram owns or leases ~6,889Ha of
maturing olive groves across Australia (6,584Ha) and California (305Ha), with ~3,182Ha of
olive suitable land for expansion. A brief overview and description of Cobram is detailed
below:
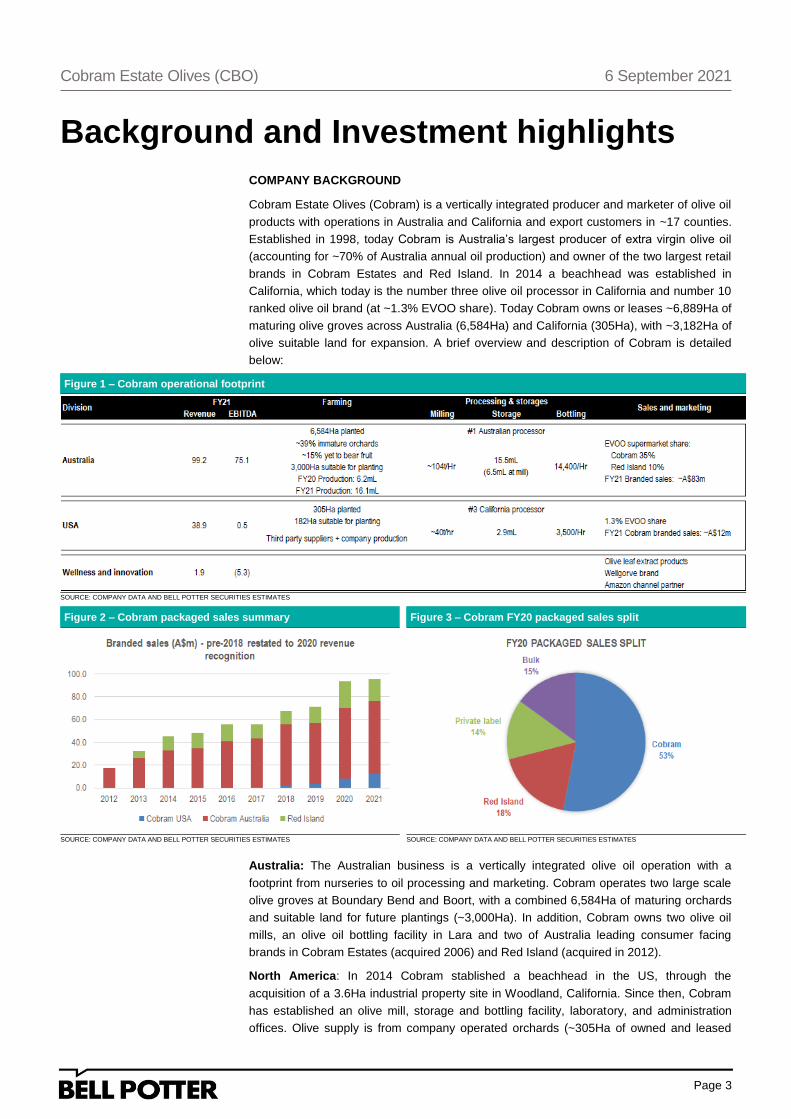
Figure 1 – Cobram operational footprint
SOURCE: COMPANY DATA AND BELL POTTER SECURITIES ESTIMATES
Figure 2 – Cobram packaged sales summary Figure 3 – Cobram FY20 packaged sales split
SOURCE: COMPANY DATA AND BELL POTTER SECURITIES ESTIMATES SOURCE: COMPANY DATA AND BELL POTTER SECURITIES ESTIMATES
Australia: The Australian business is a vertically integrated olive oil operation with a
footprint from nurseries to oil processing and marketing. Cobram operates two large scale
olive groves at Boundary Bend and Boort, with a combined 6,584Ha of maturing orchards
and suitable land for future plantings (~3,000Ha). In addition, Cobram owns two olive oil
mills, an olive oil bottling facility in Lara and two of Australia leading consumer facing
brands in Cobram Estates (acquired 2006) and Red Island (acquired in 2012).
North America: In 2014 Cobram stablished a beachhead in the US, through the
acquisition of a 3.6Ha industrial property site in Woodland, California. Since then, Cobram
has established an olive mill, storage and bottling facility, laboratory, and administration
offices. Olive supply is from company operated orchards (~305Ha of owned and leased

Page 4
Cobram Estate Olives (CBO) 6 September 2021
groves) and olive supply contracts with Californian growers, with the latter accounting for
the majority of supply. Product is sold under the Cobram brand with in excess of 13,000
retail distribution points.
Wellness division: In 2017 Cobram established its Wellness division, which is responsible
for the research, development and sale of products leftover from olive oil production. The
primary focus of this division has been on the use of biomass for bioenergy and soil
amendment, the extraction of antioxidants from olive by-products (including leaves and
pomace), and more recently on the commercialisation of health and wellness products
through the launch of the Wellgrove brand in the USA and Australia.
INVESTMENT HIGHLIGHTS
Key highlights of an investment in Cobram include:
Exposure to a fast-growing consumer brand: Cobram owns two market leading
Australian olive oil brands in Cobram Estates and Red Island, which combined account for
~45% of the EVOO market. Cobram brands are positioned in the premium Australian Extra
Virgin Olive Oil (EVOO) category, where segment retail sales value has grown by +37%
since FY17.
Cobram brands achieving pricing gains: Since FY14 the NSR derived from Cobram’s
core brands has grown 70%. Price per litre has been a principal driver of top line growth,
with price increases announced in Jul’19 (+15% prices increase across the portfolio) and
Feb’21 (+19% in Cobram branded product and a +12% uplift in pricing of Red Island and
private label volumes).
Exposure to a maturing orchard asset base in Australia: ~39% of the Australian
orchards are yet to reach maturity and ~15% has yet to reach first harvest. Maturing
company orchards combined with access to additional fruit from third party plantings (in
excess of >1,000Ha planted in recent years) provide Cobram access to a step change in
olive oil supply over the next decade. In addition Cobram has a further ~3,000Ha of land
suitable for olive plantings, which could further add to the oil supply base.
Exposure to a North American development asset: Like Australia, the US market is
heavily reliant on olive oil imports from Europe, which offers the opportunity for import
substitution and the development of premium local brands. Since FY14 Cobram has grown
to be the third largest producer and second largest Californian olive oil brand in the US.
The transition from bulk to branded producer has seen the business reach EBITDA
profitability in FY21, with branded sales reaching ~34% of the revenue mix.
Opportunities to internalise the US supply chain: Cobram planted its first US orchards
in FY15, with subsequent plantings in FY19 and FY21. In FY20 internal oil accounted for
~1% of processed volumes lifting to ~14% in FY21. As orchards mature internal supply of
oil should expand generating additional earnings opportunities. At the time of this report,
Cobram had 305Ha of maturing US orchards with a further ~182Ha of land suitable for
planting.
Lower water costs: Cobram does not own material water entitlement positions in Australia
and as such is exposed to movements in water allocation prices on the southern MDB. The
rapid acceleration in water prices in FY18-20 resulted in a material escalation in water
costs, lifting from $3.7m in FY18 to $20.5m in FY20. This has now unwound in FY21
providing a tailwind to earnings.
Consideration should be given to biennial nature: The one element of the earnings that
investors need to consider is the biennial nature of the olive harvest. Historically, the
material variance of the crop size has resulted in material EBITDA volatility between
reporting periods. In addition, given the lack of visibility in crop estimates, the majority of
EBITDA take-up is in 2H again leading to material volatility through the half year reporting
window.

Page 5
Cobram Estate Olives (CBO) 6 September 2021
Investment risks
Key risks of an investment in Cobram include but are not limited to:
Weather variability impacting crop yield: As a horticultural business, Cobram, is
affected by weather and climate issues. Variable weather conditions and severe weather
events may cause fluctuations in market supply or lead to severe crop damage and crop
yield volatility, which may negatively impact Cobram’s financial results. The nature of the
potential impact on Cobram results may vary by region, and by the weather condition or
event. Drought, frost, hail, flood, wind, extreme heat, bushfire, or a combination of these
events can impact the health of the olive tree and the crop yield. The geographical
dispersion of the Company’s asset base, being groves in three locations in Australia, and
three locations in USA, provides some mitigation against severe weather conditions or
events. The crop is particularly vulnerable to weather impacts during flowering, fruit
development, and harvest, when adverse weather conditions can have a detrimental effect
on fruit set, fruit growth, oil accumulation, and fruit quality, reducing the fruit yield, oil yield,
and/or oil quality. In Cobram’s groves, drought, frost, hail, flood, wind, extreme heat,
bushfire, or a combination of these events can impact the health of the olive tree and the
crop yield. The geographical dispersion of the Company’s asset base, being groves in
three locations in Australia, and three locations in USA, provides some mitigation against
severe weather conditions or events.
Cobram’s groves are located in agricultural areas which can be subject to high risk of
damage by fire. It is not uncommon for total fire bans to be declared in these regions
during periods of extreme hot weather. Fire could cause damage to the groves, impacting
the health of impacted trees and or the yield of impacted trees. Fire may also cause
damage to olive oil in storage. To mitigate the risk of fire damage on any particular site, the
Company maintains suitable firefighting equipment on site, provides regular firefighting
training, and implements various bushfire preparedness measures. In the future, weather
and climate issues that could adversely impact Cobram Estate Olives may arise with
greater frequency or may be less predictable due to the effects of climate change.
Fluctuations in NPAT due to the biennial bearing nature of olive crops: Olive crops,
as with many agricultural crops, exhibit biennial bearing, whereby a low-yield crop one year
will be followed by a high-yield crop in the next year. Due to the accounting standards
applicable to horticultural producers, Cobram is required to value the olive crop in the year
the crop is harvested, not when the produced olive oil is sold, and as such the reported
annual accounting profit or loss results may exhibit material movements from year to year.
Operationally, to mitigate the impact of potentially large variations in oil volumes between
high and low yielding seasons, the Company manages the fluctuating olive crop yield by
delivering to market average oil supply quantities over a 24-month period. Through a
coordinated supply chain effort, the Company extends the supply period of high yield
seasons across 14-16mths whilst reducing the supply period for the low yield seasons to 8-
10mths.
Water availability and cost: Water is a key input to the production of olives. Cobram has
no direct ownership of entitlement in Australia and uses ~35.8GL annually, purchasing its
water requirements progressively during the year. The financial performance of Cobram is
influenced by both its ability to source sufficient water and the cost of acquiring that water.
Prolonged periods of drought in the Sothern Murray Darling Basin can influence Cobram’s
ability to both source water and the cost at which water can be acquired.
Pests and Disease: Pests and diseases can have a detrimental effect on the quality
and/or yield of the olive tree and crop. Cobram is susceptible to disease risk, including
insect infestation. The five potentially riskier pests and diseases which affect olive groves

Page 6
Cobram Estate Olives (CBO) 6 September 2021
are: Verticillium wilt, olive knot, Xylella, olive moth and olive fly. Xylella, olive fly and olive
moth, whilst not currently present or established in Australia, could pose major threats. The
USA olive groves are subject to identical management practices as for the Australian
groves and are exposed to a similar level of risk with the only exception that the presence
of olive fly has been documented in California.
Customer concentration risk: In Australia, Cobram sells its product to a number of large
customers, including the two largest supermarket chains in Australia as well as other
retailers. 50-55% of FY21 went to the top two customer accounts (Woolworths, Coles).
Brand and reputation risk: Cobram product is sold under a number of brands which are
owned by Cobram, as well as through Private Label and Bulk sales channels. Those
brands and their image, as well as Cobram reputation as a grower, are key assets of the
Company. The reputation and value associated these brands has the scope to be
impacted by a number of factors, including quality issues associated, product recall,
product contamination or other public health issues, disputes or litigation with third parties
such as partnership or joint venture partners, distributors, employees or third party
growers, or adverse media coverage. Should Cobram’s brands or their image be damaged
in any way or lose their market appeal, this may have a material adverse impact on the
financial performance,
Loss of product in storage: From time to time the Company will have material volumes of
olive oil stored at various locations awaiting further processing or onward distribution.
During this stage there is a risk of loss of such product caused by fire, engineering failure,
or sabotage to or involving the storage vessels or facilities.
Reliance on third-party suppliers of olive fruit in the USA: In Cobram’s USA
operations, the company is dependent upon the supply of olive fruit from over 20
contracted growers, with contract terms ranging from one to four years. These growers
accounted for approximately 99% of the company’s Californian extra virgin olive oil supply
in FY20. This reliance on external fruit supply may impact the Company’s ability to supply
products to key customers and may limit the Company’s ability to grow its USA business.
The progressive development of the Company’s own groves in the USA will, over time,
reduce but not eliminate the Company’s supply risk for Californian extra virgin olive oil.
Ability to retain and attract key personnel: Cobram’s performance is dependent to a
large extent on the efforts and abilities of the Joint-Chief Executive Officers and other
members of the senior management team. While each of these executives is party to an
employment contract, under the terms of the employment contract each individual is
permitted to terminate the contract by giving a specified period of written notice. The loss of
one or more of the Joint-Chief Executive Officers or other members of the senior
management team may have a material adverse impact on the operating and financial
performance of Cobram. Cobram’s operations and financial performance is also dependent
upon its ability to hire additional key personnel as necessary to meet its management,
administration, and other needs, including additional suitably qualified workers during the
harvest period. The loss of a number of key personnel or inability to attract additional
personnel, especially during the harvest period, may have an adverse impact on the
operating and financial performance of Cobram.
General regulatory risks: Cobram is required to comply with a range of laws and
regulations. Regulatory areas which are of particular significance to Cobram include food
standards, labelling and packaging, fair trading and consumer protection, employment,
property, and the environment (including water), quarantine, customs and tariffs, foreign
investment, taxation, and climate change. The introduction of any new laws or changes to
existing laws, codes (or government policies), such as changes to food standards, food
labelling or climate change regulations, could result in increased costs being incurred by

Page 7
Cobram Estate Olives (CBO) 6 September 2021
Cobram and therefore have a material adverse impact on the financial performance and
prospects of Cobram.

Page 8
Cobram Estate Olives (CBO) 6 September 2021
Target price determination
Cobram has elements of both a traditional farming entity with a large installed orchard base
and a high growth FMCG entity, with embryonic business in the US and wellness. Our
target price of $2.30ps is approximately the midpoint of our fair value range determined by
our SOP model, which is summarised below with a more detailed analysis to follow.
Figure 4 – Cobram SOP target price
SOURCE: COMPANY DATAAND BELL POTER ESTIMATES
Australian valuation range: Given the finite life of the orchard assets we have utilised a
blend of an NPV against the farming assets and an EV/EBITDA capitalisation against
identifiable brand returns in excess of farmgate prices. We arrive at a value of $852-865m
for the Australian business, with main drivers identified below:
Figure 5 – Cobram Australian valuation summary
SOURCE: COMPANY DATAAND BELL POTER ESTIMATES
NPV drivers: In determining an NPV value for the farming assets we have utilised a
discount rate of 8.1% reflecting the assumption of an asset beta of 0.63x, a risk-free rate of
3.5% and an MRP of 6.0%. The asset beta used in Cobram is consistent with that we apply
to the orchard assets of SHV, which we recently reduced to reflect the movement in
unlevered betas for farming and FMCG assets.
Capitalisation multiples on brand value: We have apportioned residual earnings within
the Australian business (i.e. those not captured at the farmgate) to the branded portfolio of
Cobram and capitalised earnings at 13.0-14.0x EBITDA. This range is determined having
regard for peer group comparisons, observing the domestic average is 13.9x FY22e
EBITDA and that international peers are trading at 13.5x FY22e EBITDA. For a full list of
multiple derivation see page 15.
The midpoint of our value range for the Australian business represents 16.8x average
FY21-22e EBITDA, the upper end of the domestic peer group at 7.0-16.8x FY22e EBITDA,
with an average of 13.9x FY22e EBITDA, yet reflective of the value of through the cycle
supply growth that is yet to be realised in FY21-22e.

Page 9
Cobram Estate Olives (CBO) 6 September 2021
Figure 6 - ProForma water adjusted FY20-21e Australian EBITDA
SOURCE: COMPANY DATA AND BELL POTTER SECURITIES ESTIMATES
USA business: In determining a value range for the US business we have utilised a sum
of the parts approach, which looks at asset replacement values and EV/Revenue multiples
for the developing brand portfolio. Major components of this are: (1) a cost to develop an
acre at US$15,000-25,000/acre as per UC Davis estimates at AUDUSD of 0.73; (2) $20m
mill replacement costs referencing announcements at the time of the asset development;
(3) a 5.0-6.0x revenue multiple for the brand comparable with sector averages; and (4) a
2.0-3.0x for the non-branded business. Multiples are based on our analysis of junior ASX
listed FMCG entities. For a full list of peer multiples see page 14.
Figure 7 – Cobram US valuation summary
SOURCE: COMPANY DATA
Wellness: Given the embryonic nature of the business and large losses, we have utilised
the EV/Revenue of 5.0-6.0, which is comparable to other small cap FMCG entities on the
ASX which trade at 5.4-6.5x T12M and annualised June quarter revenues. We note the
derived value is a discount to the cumulative cash investment in developing the Wellness
division to date, with ~$28.6m invested since FY17.
PEER GROUP COMPARISON
When looking at emerging FMCG entities, we have looked at T12M EV/Revenue multiples
for other listed entities and annualised 4Q21 run rates. This would infer an EV/Revenue
range of 5.4-6.5x, with a wide spread of 0.8-19.1x. We note there is a material premium
paid for branded business, which is why we apportion a higher multiple to branded vs. non-
branded sales.
Figure 8 - Domestic emerging FMCG entities (as of 03/09/21)
SOURCE: COMPANY DATA AND BELL POTTER SECURITIES ESTIMATES
The table below looks at domestic and international FMCG and farming entities. We note
the domestic average is 13.9x FY22e. We also note that international peers are trading at
13.5x FY22e EBITDA and EV/Revenue averages of 3.0x FY22e for international FMCG
and 5.0x FY22e for domestic peers.

Page 10
Cobram Estate Olives (CBO) 6 September 2021
Figure 9 - International and domestic farming & FMCG entities (as of 03/09/21 and in local currency unless stated)
SOURCE: BLOOMBERG AND BELL POTTER ESTIMATES WHERE COVERED
Page 11
Cobram Estate Olives (CBO) 6 September 2021
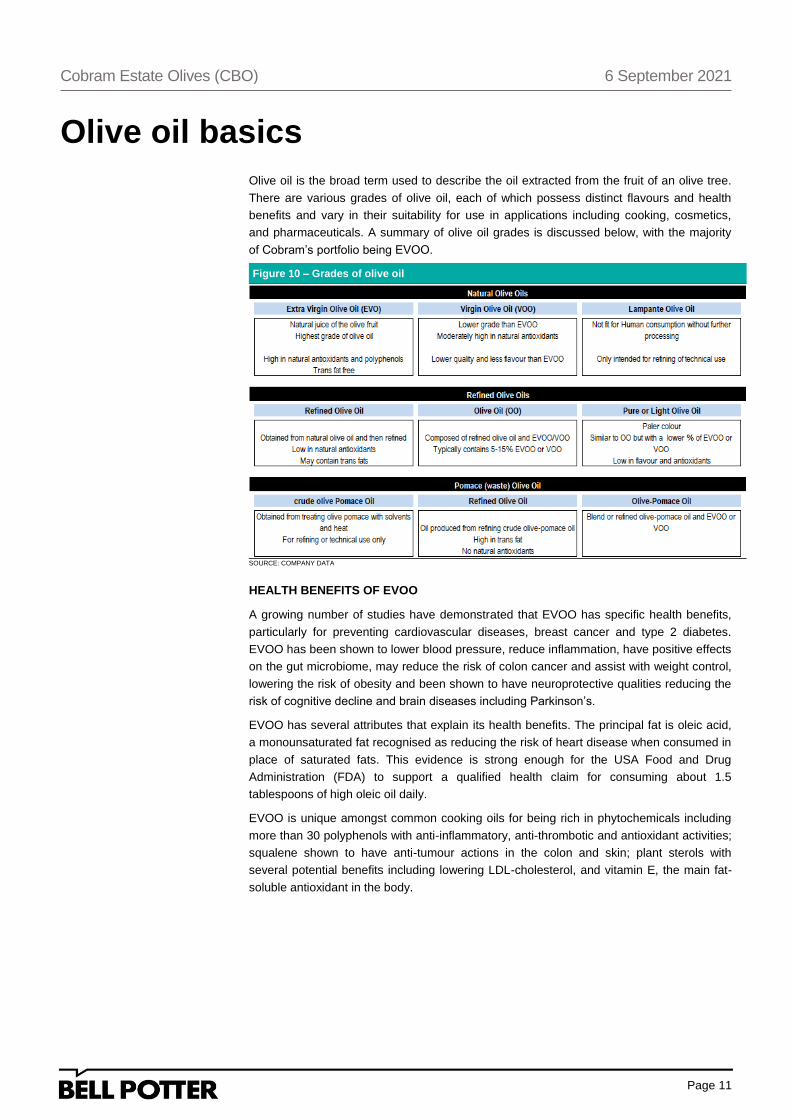
Olive oil basics
Olive oil is the broad term used to describe the oil extracted from the fruit of an olive tree.
There are various grades of olive oil, each of which possess distinct flavours and health
benefits and vary in their suitability for use in applications including cooking, cosmetics,
and pharmaceuticals. A summary of olive oil grades is discussed below, with the majority
of Cobram’s portfolio being EVOO.
Figure 10 – Grades of olive oil
SOURCE: COMPANY DATA
HEALTH BENEFITS OF EVOO
A growing number of studies have demonstrated that EVOO has specific health benefits,
particularly for preventing cardiovascular diseases, breast cancer and type 2 diabetes.
EVOO has been shown to lower blood pressure, reduce inflammation, have positive effects
on the gut microbiome, may reduce the risk of colon cancer and assist with weight control,
lowering the risk of obesity and been shown to have neuroprotective qualities reducing the
risk of cognitive decline and brain diseases including Parkinson’s.
EVOO has several attributes that explain its health benefits. The principal fat is oleic acid,
a monounsaturated fat recognised as reducing the risk of heart disease when consumed in
place of saturated fats. This evidence is strong enough for the USA Food and Drug
Administration (FDA) to support a qualified health claim for consuming about 1.5
tablespoons of high oleic oil daily.
EVOO is unique amongst common cooking oils for being rich in phytochemicals including
more than 30 polyphenols with anti-inflammatory, anti-thrombotic and antioxidant activities;
squalene shown to have anti-tumour actions in the colon and skin; plant sterols with
several potential benefits including lowering LDL-cholesterol, and vitamin E, the main fat-
soluble antioxidant in the body.

Page 12
Cobram Estate Olives (CBO) 6 September 2021
Industry backdrop
GLOBAL BACKDROP IN OLIVE OIL
Since 2014 global consumption of vegetable oils has grown at a compound rate of +3.4%
pa, with the majority of this growth achieved in soybean, palm and sunflower (CAGR of
3.6-5.2% pa). Olive oil consumption has experienced modest growth over this time frame
up +1.3% pa, with limited supply growth the biggest constraint on olive oil consumption,
with negligible supply side growth since FY18.
Figure 11 – Global vegetable oil consumption(‘000t) Figure 12 – Global olive oil supply (t)
SOURCE: STATISTA SOURCE: IOOC
The EU is the largest global supplier of olive oil, accounting for ~70-75% of annual global
exports, with the majority of production in Spain and Italy (combined account for 60-65% of
global exports). The largest importer of olive oil is the US accounting for ~36% of average
volume traded in the past six years and reflective of growing consumption against a
relatively small domestic supply base, which has shown negligible growth.
Figure 13 – largest exporters - 2021 Figure 14 – largest importers – 6yr average
SOURCE: IOOCA SOURCE: IOOC
There are three principal grades in olive oil trade: Extra Virgin olive oil (EVOO), Virgin Olive
Oil (VOO) and Pomace Oil. In a simplistic sense, EVOO & VOO are essentially
unadulterated products with limited flavour imperfections, while Pomace oil is processed oil
used for lower priced product (typically labelled as pure or light olive oil). Cobram is
focused on EVOO.
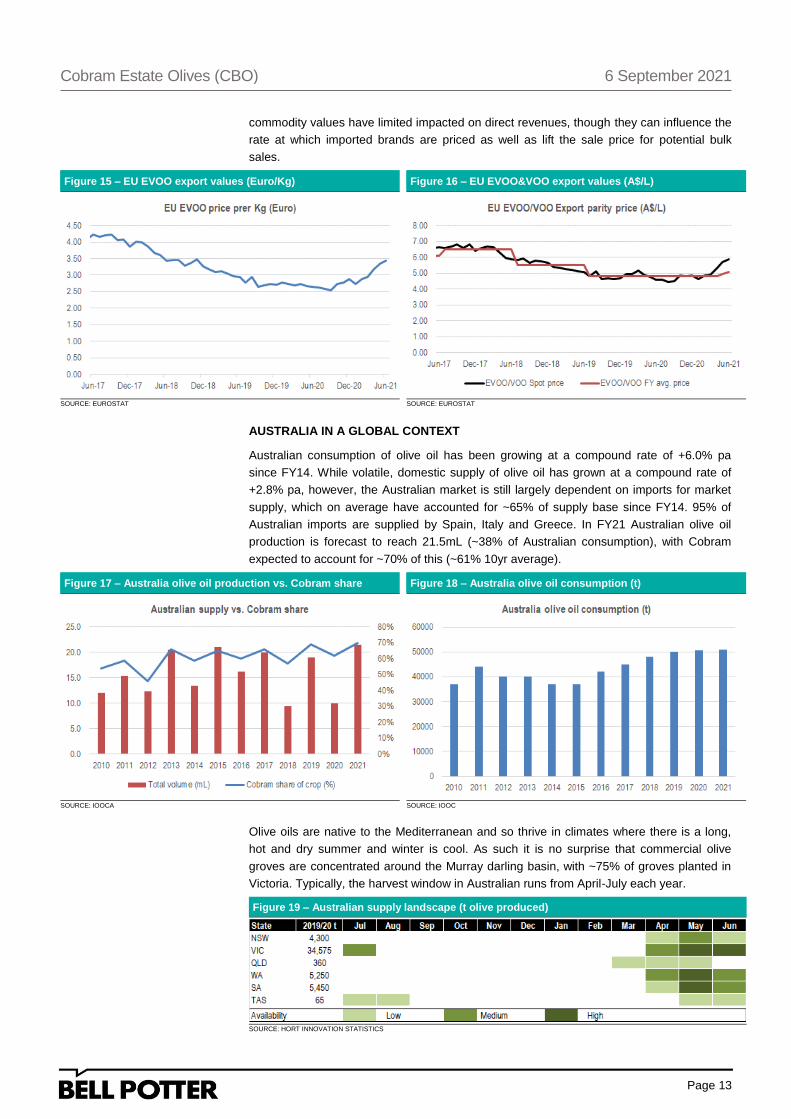
With the EU dominating the supply of EVOO and VOO we can track monthly exports of the
product from the EU to identify a price per Kg. In Euro terms pricing has reached the
highest level since 2018, with EVOO prices up +30% YOY, with this translating to AUD
also up +26% YOY. With the majority of Cobram revenues destined for branded sales
Page 13
Cobram Estate Olives (CBO) 6 September 2021
commodity values have limited impacted on direct revenues, though they can influence the
rate at which imported brands are priced as well as lift the sale price for potential bulk
sales.
Figure 15 – EU EVOO export values (Euro/Kg) Figure 16 – EU EVOO&VOO export values (A$/L)
SOURCE: EUROSTAT SOURCE: EUROSTAT
AUSTRALIA IN A GLOBAL CONTEXT
Australian consumption of olive oil has been growing at a compound rate of +6.0% pa
since FY14. While volatile, domestic supply of olive oil has grown at a compound rate of
+2.8% pa, however, the Australian market is still largely dependent on imports for market
supply, which on average have accounted for ~65% of supply base since FY14. 95% of
Australian imports are supplied by Spain, Italy and Greece. In FY21 Australian olive oil
production is forecast to reach 21.5mL (~38% of Australian consumption), with Cobram
expected to account for ~70% of this (~61% 10yr average).
Figure 17 – Australia olive oil production vs. Cobram share Figure 18 – Australia olive oil consumption (t)
SOURCE: IOOCA SOURCE: IOOC
Olive oils are native to the Mediterranean and so thrive in climates where there is a long,
hot and dry summer and winter is cool. As such it is no surprise that commercial olive
groves are concentrated around the Murray darling basin, with ~75% of groves planted in
Victoria. Typically, the harvest window in Australian runs from April-July each year.
Figure 19 – Australian supply landscape (t olive produced)
SOURCE: HORT INNOVATION STATISTICS

Page 14
Cobram Estate Olives (CBO) 6 September 2021
The majority of Australia’s olive oil consumption occurs at home and is acquired from
Australian grocery stores. Olive oil retail sales totalled $387m in FY20, accounting for
~66% of total the value of the cooking oils segment, compared to only ~43% of the volume.
EVOO accounted for ~73% of olive oil retail sales value in FY20 and Australian EVOO
sales have grown at ~10% pa since FY17 having grown from $115.2m to $157.3m. This is
the segment Cobram is most exposed to.
USA IN A GLOBAL CONTEXT
Consumption of olive oil in the USA has been growing at a compound rate of +4.3% pa
since FY14, with the majority of supply coming from imports which have grown at a
compound rate of +3.5% pa over the same time frame. Olive cultivation is largely
concentrated in California (~99% of domestic supply), however, there has been limited
acreage development, with ~36,000 acres planted to olives in 2020 producing ~67,700t of
fruit. There are 45 mills operating in California with the three largest (of which Cobram is
one) accounting for the majority of the State’s production.
Figure 20 – USA consumption vs. imports (t) Figure 21 – domestic oil supply growth
SOURCE: EUROSTAT SOURCE: EUROSTAT
Total olive oil consumption fell slightly in 2020 due to the impact of the COVID-19
pandemic, however, olive oil sales in supermarkets grew substantially, up +30% YOY in
value terms and +27% YOY in volume terms, reaching total sales of US$1.6Bn. Given the
fairly static growth the industry had experienced prior to FY20, there would seem a fair
degree of panic COVID-19 linked buying inherent in the growth.
Supermarket sales in the USA are dominated by four brands, which have a combined
~50% market share (MAT to Mar’21). Private Label sales in the USA are also significant,
accounting for ~28% of total sales of olive oil. California grown EVOO has carved out a
niche reaching US$37.8m in sales (MAT to Mar’21), equivalent to approximately 4.2% of
USA supermarket and speciality store sales of EVOO. As highlighted above the limiting
factor to growth of Californian EVOO is acreage development.
GLOBAL COST CURVE AND SUPPLY
There is large variability in annual production rates of olive oil stemming from the biennial
nature of the crop. A heavy crop year which produces large volumes of fruit and oil is
typically followed by a light crop year which can see a material fall in production volumes.
This is clearly defined in the small market data pool for Australia and the USA where there
is material variability of oil supply and hence large variability in import volumes year-to-
year. A review of major regional studies across the region would suggest that the cost of
growing and producing olive oil for a vertically integrated producer on irrigated properties
would be in the region of ~A$3/L in Australia and Europe, but materially higher in
California. The four main studies on cost structure we can identify are detailed below:
International Olive Oil Council (2015): This report was a benchmarking tool across a
number of geographies and differing farming styles. On average the global cost of

Page 15
Cobram Estate Olives (CBO) 6 September 2021
production was estimated at Euro3.44/Kg of oil, with Spain the largest producer having an
average cost of Euro2.75/Kg. The average cost for irrigated farming, which is a more
realistic comparison for Cobram, was estimated at Euro2.91/Kg, with a weighted average
of Euro2.63/Kg and Spain at Euro2.07/Kg.
Hort Innovation 2019 benchmarks: This sampling of costs was run across a number of
small to large operators and as such we have only focused on farms >84Ha. Our analysis
of the data would suggest that operating costs (ex-processing) at ~A$5,385/Ha, harvesting
and labour costs at ~A$5,468/Ha and processing costs estimated at A$325/t (implied on
the average of the 4.8t/Ha). Water costs were estimated to account for ~16% of the cost
structure. This would equate to a cost of production of ~A$2.80/Kg to the farmgate.
UC Davis 2016 Sacramento drip irrigation: UC Davis estimated an upfront investment of
~US$39,040/acre, with an annual cost of production of ~US$1.00/Kg at a yield of 5t/acre. If
we assumed an oil extraction rate of 18% then this would imply a cost of ~US$5.55/L of oil
equivalent for the olive, assuming contract extraction at ~US$300/t would imply a cost
structure approaching US$6.00/L
UC Davis 2011 Olive oil North and Central coasts: This study looked at the cost to
bottling. It estimated total cash costs to produce olive oil at the farmgate at US$7.51/Kg,
with total cash costs to bottling estimated at US$10.32/Kg.

Page 16
Cobram Estate Olives (CBO) 6 September 2021
Financial overview
Profit and Loss
Historically there has been high levels of volatility in reported NPAT within Cobram
reflecting the adoption of SGARA accounting. Accounting standards require the oil
produced to be valued at fair value less the anticipated selling costs. With the harvest
completed in June each year, most of the oil from the harvest is on hand at balance date,
meaning that all the profit forecast to be earned from selling the oil is recorded in the year
of harvest, rather than the year of sale (which is the next financial year). Given the biennial
nature of the olive harvest there is material variability through the years in profit and this is
clearly visible in our forecasts below. FY21 was a high production year and as such we
would expect a material reduction in volumes in FY22e and SGARA based earnings.
Figure 22 - Cobram Summary Profit & Loss
SOURCE: COMPANY DATA AND BELL POTTER SECURITIES ESTIMATES
Volatility in earnings is mostly on display in the Australian business given the large orchard
asset base and internal supply of olive oil. The US business, which sources 99% of oil from
third party growers has been less volatile though still emerging. Major determinants of
earnings for each region are covered below.
AUSTRALIA
Major factors which influence the reported earnings of Cobram in Australia include:
Volume of oil produced: Access to olive oil is determined by three primary drivers;
orchard age and maturity, the biennial nature of the crop and seasonal factors, each are
touched on below:
1. Biennial nature of olive trees: Trees naturally have a year with heavy production
followed by a year with low production. Average oil production since FY14 has been
~10.5mL pa, with large variability in the year-to-year production values. FY21 was a high
year (16.1mL of oil production forecast), which we expect to be followed by a light year in
FY22e (8.9mL of oil produced). Our FY22e forecast compares to FY20 production of
6.7mL, though this was originally forecast at 9.7mL.
2. Major adverse climatic or agricultural events: Historically three events stand out as
having an impact on oil yields: frost; excessive rainfall and excessive heat. In recent years
the most notable agricultural event has been frost, which resulted in yield losses of 20% in
2018 and 6% in 2019 yields. Lower yields had a direct impact on farmgate profitability, but
also reduced oil availability for sales into FY19.

Page 17
Cobram Estate Olives (CBO) 6 September 2021
3. Orchard maturity: Olive trees begin producing fruit at 3 years and reach maturity at ~9
years. Cobram has highlighted that ~15% of the acreage is yet to have a commercial
harvest and ~39% of the acreage is yet to reach maturity. As orchards mature, oil
production should increase providing a tail of supply growth over the next decade. Our
forecasts continue to assume a material contraction in off years, with production ~40%
below theoretical levels.
Figure 23 – Historic and forecast oil production Figure 24 – Cobram orchard maturity profile
SOURCE: COMPANY DATA SOURCE: COMPANY DATA
In addition to its own orchards, Cobram secures additional oil volumes from AAP (with the
farmgate price linked back to the value extracted from the Red Island brand) and a third
party managed estate (~1,000Ha developed in the past two years). In FY15 AAP
commenced a replanting program, with ~123Ha replanted over 2018-19 AAP and a further
~56Ha due for re-plant. In aggregate access to third party oil from a maturing ~1,179Ha of
orchards should complement company supply expansion.
Farmgate costs: Outside of the cost of temporary water, orchards and processing costs
are largely fixed. Cobram does not own material water entitlement positions in Australia
and as such is exposed to movements in temporary water prices on the southern MDB.
The rapid acceleration in water prices in FY19-20 resulted in a material escalation in water
costs lifting from $3.7m in FY18 to $20.5m in FY20. This was largely unwound in FY21,
with water pricing below historical averages at $168/ML.
Figure 25 – Southern MDB water allocation pricing Figure 26 – Historical water usage and water costs ($m)
SOURCE: BOM SOURCE: COMPANY DATA
At maturity management has estimated that a +/-$100/ML movement in water prices would
result in a +/-$4.2m movement in EBITDA and operating cashflow.
Selling prices: The value at which oil is brought to account is highly correlated to the
selling price that can be realised for the olive oil. Since FY14 Cobram has achieved 11%
pa average growth in NSR against a back drop of limited supply growth. Pricing per litre
0.0
2.0
4.0
6.0
8.0
10.0
12.0
14.0
16.0
18.0
20.0
2010 2011 2012 2013 2014 2015 2016 2017 2018 2019 2020 2021 2022e2023e2024e
Cobram actual crop yield (mL)
Crop (mL)

Page 18
Cobram Estate Olives (CBO) 6 September 2021
has been a principal driver of top line growth, with price increases announced in Jul’19
(+15% prices increase across the portfolio) and Feb’21 (+19% in Cobram branded product
and a +12% uplift in pricing of Red Island and private label volumes). The uplift in NSR can
be seen in the relative movements in Cobram’s share of EVOO sales by value and volume
between FY17-20. Our forecastst assume no material uplift in selling prices of crop values
in outward years given the requirement to sell larger oil crops and the potential for this
volume to be moved through lower price point brands.
Figure 27 – Cobram + Red Island Aus. NSR ($m) Figure 28 – Cobram and Red Island value and volume share
SOURCE: COMPANY DATA SOURCE: COMPANY DATA
NORTH AMERICA
The US operations of Cobram are largely dependent on third party oil supply, with 99% of
oil supply in FY20 sourced from third parties. In FY21 EBITDA Cobram US generated a
modest EBITDA positive result, reflecting the continued transition in sales mix from bulk to
consumer branded revenues, non-recurrence of customer start-up costs and lower
marketing expenditures. A driver of the transition in sales mix is the establishment of
distribution, with the number of retailer stockists expanding from ~3,000 in FY17 to in
excess of 13,000 today.
Figure 29 – USA sales mix (A$m) Figure 30 – US Consumer packaged sales mix (A$m)
SOURCE: COMPANY DATA SOURCE: COMPANY DATA
The internalisation of the oil supply chain also provides additional EBITDA opportunities.
As Cobram operates ~305Ha of orchards in the US, with the first olive groves planted in
FY15 and subsequent plantings in FY19 and FY21. In FY20 third party oil accounted for
99% of processed volumes, with this falling to 86% in FY21.
WELLNESS DIVISION
The wellness division is in its infancy, with its primary focus being on the extraction of
antioxidants from olive by-products (i.e. leaves and pomace) and the commercialisation of
these products, through the launch of new health and wellness brands. In FY21 the

Page 19
Cobram Estate Olives (CBO) 6 September 2021
division reported revenues of $1.9m, with Australia accounting for ~70% of revenue and
the Wellgrove brand accounting for ~75% of revenues. The major channel partner in the
US is Amazon and in Australia are Chemist Warehouse and Coles. The division also
houses the Olive Wellness Institute, which is largely an education based platform to
promote the benefits of EVOO and olive leaf extracts to healthcare professionals.
Balance sheet and cashflow
Historically there is less volatility in operating cashflows than in earnings, reflecting the
more linear sales trajectory in the branded business. The major driver of year-to-year
changes in operating cashflow, is the level of investment in working capital with ~$20m in
variability between a heavy and a light year.
Capex since FY15 has totalled ~$151m with the most material investments being in the US
($40.5m over FY17-20) and orchard redevelopment in Australia, following a major replant
of the Boort acreage. We expect capex to be modestly higher in FY22e and largely in
biological asset development.
Figure 31 – Cobram balance sheet and cashflow summary
SOURCE: COMPANY DATA AND BELL POTTER SECURITIES ESTIMATES
Cobram’s has four financing facilities provided by CBA that have an Oct’24 expiry as
detailed below. Banking covenants have not been disclosed.
Figure 32 – Cobram debt facilities
SOURCE: COMPANY DATA
It should be noted that there is ~$12.4m in director ESP loans that are outstanding,
effectively a receivable for Cobram.
Dividend policy
Cobram has announced the intention to pay a dividend of 3.3ֶ¢ps in November/December
2021. This dividend has not been formally declared, but is expected to be announced it the
021 AGM. It is the intention of the Board to maintain an annual final dividend payment, but
this is subject to the performance of the Company, with no firm guidance on payout ratio.
We note that Cobram had an immaterial franking balance in its FY20 annual accounts.

Page 20
Cobram Estate Olives (CBO) 6 September 2021
Management and board
Robert McGavin (Chairman)
Rob is a co-founder of the Cobram Estate Olives and has extensive experience in the
agribusiness sector. He is directly involved in a large-scale vineyard in South Australia, a
grazing operation in Western Queensland, a cropping and grazing operation in South
Western Victoria, as well as Cobram Estate Olives’ development and management. Rob is
also a board member of Marcus Oldham Agricultural College. Rob was also the Executive
Chair and CEO of Cobram Estate Olives until 20 April 2021.
Paul Riordan (Executive Director)
Paul Riordan has extensive experience in the olive industry having worked in the industry
since 1996 and is a co-founder of the Cobram Estate Olives Group. Paul was a Non-
Executive Director of Select Harvests Limited from October 2012 until June 2018 when he
moved to the USA. Paul is an Executive Director of Cobram Estate Olives and currently
oversees the company’s USA operations.
Tim Jonas (Non-Executive Director)
Tim is a former Managing Partner and National Chairman of Pitcher Partners, a national
association of independent accounting firms across Adelaide, Brisbane, Melbourne,
Newcastle and Hunter, Perth, and Sydney. His qualifications include a Master of Business
Administration (University of Melbourne), Bachelor of Commerce (University of Melbourne)
and Fellow of the Institute of Chartered Accountants in Australia. Tim is currently the
Chairman of Yarra Valley Caviar Pty Ltd (fish farms and caviar production); Chairman of
Daniel Roberson Pty Ltd (property holdings); and Director and Treasurer of Australian
Stockman’s Hall of Fame and Heritage Centre Ltd (Longreach, Queensland). Tim was
formerly a Director of Silvan Australia Pty Ltd and a Director and Treasurer of Essendon
AFL Football Club Ltd. Tim has been involved with Cobram Estate Olives since its
inception and has been a Non-Executive Director since 2005. He is the Chairman of the
Audit and Risk Committee and a member of the Remuneration Committee.
Craig Ball (Non-Executive Director)
Craig is an Executive Director of stockbrokers Taylor Collison Limited, responsible for
corporate finance in equity capital markets. He became a director of Taylor Collison in
1992 and has extensive experience in the Australian equity capital markets. Craig holds a
Bachelor of Economics degree from the University of Adelaide. He worked for a decade
with Chartered Accounting firms before joining the stockbroking industry in 1987. Craig is
a Director of numerous private companies and was formerly a Director of ASX-listed
Southern Titanium Limited. Craig has been involved with Cobram Estate Olives since
1998, assisting with its formation and development, and a Non-Executive Director since
2005. Craig is a member of the Audit and Risk Committee and the Chairman of the
Remuneration Committee.
Joanna McMillan (Non-Executive Director)
Scottish born and raised, Joanna McMillan has spent the last 22 years living in Australia
where she is one of the country’s favourite and most trusted health and wellbeing experts.
She is a PhD qualified nutrition scientist, Accredited Practising Dietitian, Adjunct Senior
Research Fellow with La Trobe University, guest lecturer at The University of Sydney and
Fellow of the Australasian Society of Lifestyle Medicine. A regular on television, Joanna
has presented on the Today Show for over 15 years, is a host on ABC’s science show
Catalyst, and is a regular on radio and in print media. She is a TEDx and international
keynote speaker and has authored eight books including her latest The Feel-Good Family
Food Plan and her first Audible Original, Gutfull, What to Eat for a Happy Gut. Joanna has

Page 21
Cobram Estate Olives (CBO) 6 September 2021
been involved with Cobram Estate Olives since 2015 and the Australian olive industry
since 2013. Joanna has been a member of the Company’s scientific committee since 2018
and was appointed Non-Executive Director in May 2021.
Professor Jonathan West (Non-Executive Director)
Professor Jonathan West founded the Australian Innovation Research Centre. Prior to that
role, Professor West spent 18 years at Harvard University, where he was Associate
Professor in the Graduate School of Business Administration. He gained his Doctoral and
Master’s degrees in Economics at Harvard University, following a Bachelor of Arts majoring
in history and philosophy of science at the University of Sydney, and more recently gained
a PhD in Ancient Greek Philology. Jonathan has served as consultant to, and a Board
member of, major corporations around the world and as an advisor to several
governments, particularly in the fields of agribusiness, innovation policy, and economic
development. He currently serves as a Board member and Chairman of ASX-listed
Hexima Limited, a medical biotechnology company; a Board member and Chairman of the
ASX-listed Gowing Brothers Investment Fund; a Board member of Hydralyte, a
dehydration-therapy provider; and a Board member of the Three Valleys Food Company in
Tasmania. Jonathan has been involved with Cobram Estate Olives since joining the Board
in 2008 and is a member of the Remuneration Committee and the Audit and Risk
Committee.
Leandro Ravetti – Joint-Chief Executive Officer (Technical and Production) and
Executive Director
Leandro Ravetti graduated as an Agricultural Engineer in Argentina and worked for the
National Institute of Agricultural Technology in olive production research from 1995 until he
moved to Australia in 2001 to join the Cobram Estate Olives. Leandro has studied and
worked as an invited researcher at the Olive Growing Research Institute of Perugia, Italy
and at different Governmental Olive Institutes in Andalusia, Spain where he completed a
postgraduate degree on olive growing and olive oil processing. Leandro was appointed
Executive Director in 2005. As part of his role, Leandro has overseen all technical aspects
of production, developing the Oliv.iQ® growing system. Leandro was an alternate director
of the Australian Olive Association between 2009 and 2012 and was the Drafting Leader
for the new Australian Standard for Olive Oil (AS 5264-2011). Leandro has also received
a Meritorious lifetime award from the Australian Olive Association for his outstanding
contribution to the Australian olive industry and he was also the recipient of an award in the
Master Milling/Chemical Engineering Category in the inaugural “Health & Food, Extra
Virgin Olive Oil Awards” announced in Spain in 2017. Leandro was appointed Joint-CEO
(Technical and Production) of Cobram Estate Olives on 20 April 2021 and formerly held the
role of Technical Director.
Sam Beaton – Joint-Chief Executive Officer (Finance and Commercial), Executive
Director and Company Secretary
Sam joined the Company in August 2009. Sam has over 21 years’ experience in
commercial, corporate and finance roles. Sam began his career with KPMG, where he
qualified as a Chartered Accountant and since then has held senior management roles.
Sam has wide experience in financial modelling and analysis, management of corporate
debt, capital raising, business planning and execution and strategy. Sam has a Bachelor of
Commerce (Accounting and Finance) and a Bachelor of Science (Industrial Organic
Chemistry) from the University of Melbourne. Sam was appointed Joint-CEO (Finance and
Commercial) of Cobram Estate Olives on 20 April 2021 and formerly held the role of Chief
Financial Officer and Chief Operating Officer.
Page 22
Cobram Estate Olives (CBO) 6 September 2021
Major shareholders
At the time of listing the Top 20 shareholders in Cobram held 50.8% of the company, with
Chairman Rob McGavin the only substantial shareholder with an effective 18.6% interest in
the company. Directors at this time had either direct or indirect relevant interest in ~33% of
the issued capital. In addition there are 20.45m options on issue with strike prices of $1.42-
1.50ps and expiries from 2021-2028.

Page 23
Cobram Estate Olives (CBO) 6 September 2021
Cobram Estate Olives as at 6 September 2021
Recommendation Buy
Price $2.00
Target (12 months) $2.30
Table 1 - Financial summary
SOURCE: BELL POTTER SECURITIES ESTIMATES
June year end 2017 2018 2019 2020 2021 2022e 2023e 2024e Price (A$ps) $2.00
Profit & Loss (A$m) Recommendation Buy
Sales revenue 139.8 113.1 151.7 131.8 207.2 184.8 258.5 223.8 Target Price (A$ps) $2.30
. . . Change -19.1% 34.1% -13.1% 57.2% -10.8% 39.9% -13.4% Diluted issued capital (m) 387.4
EBITDA 35.2 1.7 33.2 (19.7) 70.3 24.3 85.5 36.3 Market cap ($m) 774.9
Depreciation & amortisation (10.8) (10.9) (12.0) (15.2) (16.2) (16.9) (17.1) (17.4) Enterprise Value ($m) 948.5
EBIT 24.4 (9.2) 21.2 (34.9) 54.1 7.4 68.3 19.0 Free Float (% ) ~67%
Interest expense (3.4) (3.9) (4.6) (5.4) (4.7) (4.6) (4.5) (4.2) *Net det trailing R12M
Pre-tax profit 21.0 (13.1) 16.6 (40.2) 49.4 2.9 63.8 14.8 June year end 2017 2018 2019 2020 2021 2022e 2023e 2024e
Tax expense (8.1) (0.1) (7.9) 7.5 (16.7) (2.4) (20.7) (5.9) Valuation Ratios
. . . tax rate 39% -1% 47% 19% 34% 85% 32% 40% Core EPS (¢ps) 8.0 0.1 10.6 2.2
Minorities - - - - - - - - Change (% ) n.a. n.a. n.a. n.a.
Net Profit 12.8 (13.3) 8.8 (32.7) 32.6 0.4 43.2 8.9 PE (x) 25.0 1,919.8 18.9 91.2
Abs. & extras. - - - - - - - - EV/EBITDA (x) 13.5 39.0 11.1 26.1
Reported Profit 12.8 (13.3) 8.8 (32.7) 32.6 0.4 43.2 8.9 EV/T24M EBITDA (x) 37.4 20.0 17.3 15.6
EV/EBIT (x) 17.5 127.6 13.9 50.0
Cashflow (A$m) NTA ($ps) 0.45 0.42 0.50 0.49
EBITDA 35.2 1.7 33.2 (19.7) 70.3 24.3 85.5 36.3 P/NTA (x) 4.43 4.75 4.04 4.12
Net Interest Expense (3.7) (3.9) (4.9) (6.0) (5.6) (4.6) (4.5) (4.2) DPS (¢ps) - 3.3 3.3 3.3
Tax Paid (0.0) (0.1) (0.0) (0.0) (0.2) (0.2) (11.5) (13.3) Payout (% ) 0.0% 3167.6% 31.2% 150.5%
Change in Wkg Capital (13.0) 20.4 (23.9) 25.7 (41.8) 20.6 (38.6) 24.9 Yield (% ) 0.0% 1.7% 1.7% 1.7%
Other (2.7) 0.7 (4.3) 6.7 (6.6) 6.8 (7.6) 23.7 Franking (% ) 0% 0% 0% 0%
Operating Cash Flow 15.8 18.8 0.1 6.7 16.1 46.9 23.2 67.5
Dividends paid (5.7) (5.3) (6.0) - - (12.8) (12.8) (12.8) Performance Ratios
Capex (20.2) (31.5) (31.4) (25.0) (19.1) (20.2) (20.2) (20.2) EBITDA/sales (% ) 25.2% 1.5% 21.9% -14.9% 34.0% 13.2% 33.1% 16.2%
Free Cash Flow (10.0) (18.0) (37.3) (18.3) (3.0) 14.0 (9.7) 34.5 EBITA/sales (% ) 17.5% -8.2% 14.0% -26.5% 26.1% 4.0% 26.4% 8.5%
Asset Sales 0.4 0.4 0.3 0.7 0.1 - - - OCF Realisation (% ) 67.0% -806.2% 0.6% -38.4% 33.0% 270.7% 38.5% 256.5%
Aquisitions (0.0) - - - - - - - FCF Realisation (% ) -78.3% 135.7% -425.8% 55.9% -9.1% 3287.2% -22.5% 386.1%
Other (1.8) (4.4) (10.9) (8.5) (1.7) - - - ROE (% ) 8.3% -8.2% 4.9% -22.4% 17.1% 0.2% 20.7% 4.4%
Equity Issues(Reduction) 3.7 25.7 1.2 1.5 - - - - ROIC (% ) 9.9% -3.7% 7.5% -11.2% 16.4% 2.2% 19.6% 5.4%
(Inc.) /dec. in net debt (7.7) 3.7 (46.6) (24.5) (4.6) 14.0 (9.7) 34.5 Asset turn (years) 3.27 0.16 2.76 (1.29) 4.34 1.44 4.99 2.09
Capex/Depn (x) 1.87 2.88 2.61 1.64 1.18 1.19 1.18 1.16
Balance Sheet (A$m) Interest cover (x) 7.08 (2.38) 4.66 (6.51) 11.41 1.62 15.13 4.55
Cash & near cash 2.1 1.0 2.7 3.8 1.2 1.2 1.2 1.2 Net debt/EBITDA 2.63 52.25 4.07 (8.13) 2.34 6.18 1.87 3.46
Receivables 13.7 15.3 17.5 14.6 24.8 17.1 18.7 20.6 Net debt/equity (% ) 59.9% 55.1% 75.3% 109.5% 86.3% 84.4% 76.8% 61.4%
Inventories & WIP 76.6 56.7 86.7 62.8 104.7 85.9 125.7 102.1
Other Current assets 5.6 3.7 8.9 4.8 5.1 4.5 5.7 5.0 Drivers and divisionals
Current assets 98.0 76.8 115.8 86.0 135.8 108.8 151.3 128.8 Australia 89.8 93.5 86.5 108.6 99.2 121.0 132.7 146.0
Fixed assets 108.7 127.7 180.2 184.0 176.9 172.3 168.0 163.9 North America 9.1 13.3 24.5 29.9 38.9 42.4 45.7 49.5
Biological assets 83.8 90.0 99.8 108.2 114.0 122.2 129.8 137.0 Innovation & value add 0.0 0.0 1.3 2.2 1.9 2.5 3.2 4.2
Right of use asset - - - 5.5 4.9 4.9 4.9 4.9 Other 2.3 2.2 3.8 2.2 2.2 2.2 2.2 2.2
Intangibles 6.7 6.7 6.7 6.7 6.7 6.7 6.7 6.7 Net change agricultural produces 38.6 4.1 35.7 (11.1) 65.0 16.7 74.6 22.0
Other assets 0.1 0.1 0.1 0.2 10.4 10.4 10.4 10.4 Revenue 139.8 113.1 151.7 131.8 207.2 184.8 258.5 223.8
Non current assets 199.3 224.5 286.8 304.6 312.8 316.4 319.8 322.9
Total assets 297.2 301.3 402.5 390.6 448.6 425.2 471.1 451.7 Australia 44.2 12.0 42.7 (2.9) 75.1 28.6 89.0 38.9
Creditors 15.8 17.9 26.2 25.0 24.9 29.4 32.2 35.3 North America (6.8) (6.4) (4.4) (8.1) 0.5 1.0 1.6 2.2
Current borrowings 3.1 3.8 11.1 4.9 3.8 3.8 3.8 3.8 Innovation & value add (2.5) (3.9) (4.9) (8.6) (5.3) (5.2) (5.0) (4.7)
Lease liabilities - - - 0.2 0.2 0.2 0.2 0.2 Corporate 0.2 0.1 (0.2) - - - - -
Other current liabilities 3.1 3.7 10.5 8.9 5.2 3.6 6.6 22.5 EBITDA 35.2 1.7 33.2 (19.7) 70.3 24.3 85.5 36.3
Current liabilities 22.0 25.4 47.8 38.8 33.8 36.8 42.6 61.6
Non-current borrowings 91.5 86.0 126.9 158.8 161.8 147.9 157.6 123.1 Australian crop (mL) 13.2 5.4 13.1 6.2 16.1 8.9 18.2 10.0
Lease liabilities - - - 5.4 4.9 4.9 4.9 4.9
Other liabilities 29.6 28.9 48.1 41.6 57.4 57.4 57.4 57.4
Non-current liabilities 121.0 114.9 175.0 205.7 224.1 210.2 219.9 185.4
Total liabilities 143.0 140.2 222.8 244.5 258.0 246.9 262.5 246.9
Net assets 154.2 161.0 179.8 146.1 190.6 178.3 208.6 204.8
Share capital 82.3 109.9 112.5 114.2 127.7 127.7 127.7 127.7
Reserves (1.4) (1.9) 12.7 10.3 8.4 8.4 8.4 8.4
Retained earnings 73.2 53.1 54.5 21.6 54.5 42.1 72.5 68.6
Outside equity Interests - - - - - - - -
S/holders' funds 154.2 161.0 179.8 146.1 190.6 178.3 208.6 204.8
Net Debt (Cash) 92.4 88.8 135.4 159.9 164.5 150.5 160.2 125.7

Page 24
Cobram Estate Olives (CBO) 6 September 2021
Recommendation structure
Buy: Expect >15% total return on a
12 month view. For stocks regarded
as ‘Speculative’ a return of >30% is
expected.
Hold: Expect total return between -5%
and 15% on a 12 month view
Sell: Expect <-5% total return on a
12 month view
Speculative Investments are either start-up
enterprises with nil or only prospective
operations or recently commenced
operations with only forecast cash flows, or
companies that have commenced
operations or have been in operation for
some time but have only forecast cash
flows and/or a stressed balance sheet.
Such investments may carry an
exceptionally high level of capital risk and
volatility of returns.
Research Team
Staff Member
Chris Savage
Analysts
TS Lim
John Hester
Tanushree Jain
Elyse Shapiro
Steven Anastasiou
Sam Brandwood
James Filius
Sam Haddad
Hamish Murray
Jonathan Snape
David Coates
Stuart Howe
Brad Watson
Joseph House
Associates
Olivia Hagglund
Michael Ardrey
Title/Sector
Head of Research/Industrials
Banks
Healthcare
Healthcare
Healthcare
Industrials
Industrials
Industrials
Industrials
Industrials
Industrials
Resources
Resources
Resources
Resources
Associate Analyst
Associate Analyst
Phone
612 8224 2835
612 8224 2810
612 8224 2871
612 8224 2849
613 9235 1877
613 9235 1952
612 8224 2850
613 9235 1612
612 8224 2819
613 9235 1813
613 9235 1601
612 8224 2887
613 9235 1856
618 9326 7672
613 9235 1624
612 8224 2813
613 9256 8782
@bellpotter.com.au
csavage
tslim
jhester
tnjain
eshapiro
sanastasiou
sbrandwood
jfilius
shaddad
hmurray
jsnape
dcoates
showe
bwatson
jhouse
ohagglund
mardrey
Bell Potter Securities Limited ABN 25 006 390 772 Level 29, 101 Collins Street Melbourne, Victoria, 3000 Telephone +61 3 9256 8700 www.bellpotter.com.au
Bell Potter Securities (HK) Limited Room 1701, 17/F Prosperity Tower, 39 Queens Road Central, Hong Kong, 0000 Telephone +852 3750 8400
Bell Potter Securities (US) LLC Floor 39 444 Madison Avenue, New York NY 10022, U.S.A Telephone +1 917 819 1410
Bell Potter Securities (UK) Limited 16 Berkeley Street London, England W1J 8DZ, United Kingdom Telephone +44 7734 2929
The following may affect your legal rights. Important Disclaimer:
This document is a private communication to clients and is not intended for public circulation or for the use of any third party, without the prior approval of Bell Potter Securities
Limited. In the USA and the UK this research is only for institutional investors. It is not for release, publication or distribution in whole or in part to any persons in the two specified
countries. In Hong Kong, this research is being distributed by Bell Potter Securities (HK) Limited which is licensed and regulated by the Securities and Futures Commission,
Hong Kong. In the United States, this research is issued and distributed by Bell Potter Securities (US) LLC which is a registered broker-dealer and member of FINRA. Any
person receiving this report from Bell Potter Securities (US) LLC and wishing to transact in any security described herein should do so with Bell Potter Securities (US) LLC.
This is general investment advice only and does not constitute personal advice to any person. Because this document has been prepared without consideration of any specific
client’s financial situation, particular needs and investment objectives (‘relevant personal circumstances’), a Bell Potter Securities Limited investment adviser (or the financial
services licensee, or the representative of such licensee, who has provided you with this report by arrangement with Bell Potter Securities Limited) should be made aware of
your relevant personal circumstances and consulted before any investment decision is made on the basis of this document.
While this document is based on information from sources which are considered reliable, Bell Potter Securities Limited has not verified independently the information contained
in the document and Bell Potter Securities Limited and its directors, employees and consultants do not represent, warrant or guarantee, expressly or impliedly, that the
information contained in this document is complete or accurate. Nor does Bell Potter Securities Limited accept any responsibility for updating any advice, views opinions, or
recommendations contained in this document or for correcting any error or omission which may become apparent after the document has been issued.
Except insofar as liability under any statute cannot be excluded. Bell Potter Securities Limited and its directors, employees and consultants do not accept any liability (whether
arising in contract, in tort or negligence or otherwise) for any error or omission in this document or for any resulting loss or damage (whether direct, indirect, consequential or
otherwise) suffered by the recipient of this document or any other person.
Research Policies:
For Bell Potter’s Research Coverage Decision Making Process and Research Independence Policy, please refer to our company website:
https://bellpotter.com.au/research-independence-policy/
Disclosure of interest:
Bell Potter Securities Limited, its employees, consultants and its associates within the meaning of Chapter 7 of the Corporations Law may receive commissions, underwriting
and management fees from transactions involving securities referred to in this document (which its representatives may directly share) and may from time to time hold interests
in the securities referred to in this document.
Disclosure: Bell Potter Securities acted as a Financial Advisor to Cobram’s compliance listing in August 2021 and received fees for that service.
ANALYST CERTIFICATION
Each research analyst primarily responsible for the content of this research report, in whole or in part, certifies that with respect to each security or issuer that the analyst
covered in this report: (1) all of the views expressed accurately reflect his or her personal views about those securities or issuers and were prepared in an independent manner
and (2) no part of his or her compensation was, is, or will be, directly or indirectly, related to the specific recommendations or views expressed by that research analyst in the
research report.