Embed Size (px)
Citation preview

This thesis comprises 30 ECTS credits and is a compulsory part in the Master of Science with a Major in Chemical Engineering – Environmental Engineering, 181 – 300 ECTS credits
No. kmag8/2007
CO2-flue gas separation for a conventional coal-fired
power plant (first approach)
Syed Muzaffar Ali

2
CO2-flue gas separation for a conventional coal-fired power plant (first approach)
Syed Muzaffar Ali
Master thesis
Subject Category: Environmental Engineering
Series and Number No kmag8/2007
University College of Borås School of EngineeringSE-501 90 BORÅSTelephone +46 033 435 4640
Examiner: Prof. Peter Therning
Supervisor: Prof. Peter Therning, School of Engineering, University of Boras, SE-50190 Boras, Sweden
Client: LUAT (Chair for Environmental Process Engineering and Plant Design)Leimkugelstr. 10, 45141 Essen, Germany.
Date: 25/10/2007.
Keywords: CO2 separation

3
Abstract
In order to mitigate climate change, there is a desperate need to reduce CO2 emissions
from different sources. CO2 capture and sequestration will play an important role in these
reductions. This report is focused on the capture of CO2 from flue gas emitted by a coal
fired power plant, which is also described in this report. From the available technologies,
post combustion capture with chemical absorption is chosen. It is already been shown by
previous work that it is possible to capture CO2 by this method; this report goes a step
ahead to simulate this process. Various methods available are described briefly along
with the justification why 30% (wt) MEA is used as solvent for this kind of process. A
first approach is made towards the simulation of the process using Aspen Plus 2006. The
mass balance and the energy required for the process have been calculated. For
simulation the help was taken from Aspen Plus 2006 documentation, also previous work
assisted in performing it. The results obtained can be used as the base for optimizing the
simulation.

4
Table of contents
1 Introduction 04
Motivation 05
Signification of fossil fuel for power generation 05
Conventional steam power plants 07
Considerations regarding CO2 capture from flue gas 11
Objective 16
2 Carbon capture technologies 18
Pre-combustion capture 19
Oxy-fuel (integrated) 20
Post combustion capture 20
Adsorption 22
Cryogenic separation 23
Membrane separation 23
Absorption 24
3 Chemistry principles of CO2 absorption 28
4 Carbon dioxide capture process using MEA as solvent 32
Simulation of MEA process with Aspen Plus 33
Introduction to Aspen Plus 34
Description of the reference MEA process simulation 35
Property method 36
Specifications for streams 39
Specifications for blocks 40
4.3 Calculation example of the first run 43
5 Results and Discussion 46
6 Summary 51
7 Bibliography 52
8 Annexure 1 54

5
1. Introduction
As for today 90% of the world’s primary energy demand is satisfied by fossil fuel
resources. The use of these resources increases greenhouse gas emissions and provokes
global warming, which is one of the reasons for change in climate. As mentioned by
Murlidhar Gupta, et al. “Carbon dioxide is one of the important greenhouse gases
responsible for 64% of the enhanced greenhouse effect” [1].
According to the Intergovernmental Panel of Climate Change (IPCC), if we compare
today’s situation with the one before industrialization, there is an increase in CO2
concentration by 30% in the atmosphere. 70% of that accounts the use of fossil fuel for
energy production [2]. Table 1 shows CO2 emissions from different type of industries
worldwide. If predictions are to be believed then even if we put more emphasis on
development of renewable energy sources, we will still remain dependent on fossil fuels
for the next 4-5 decades. Thus it will be essential to use near zero emissions technologies
in the power generation sector.
Table 1. CO2 emissions by different industries worldwide [2]

6
According to the Kyoto Protocol, developed nations should reduce 5.2% of all types of
greenhouse gases during the period 2008-2012 compared to the values in 1990. Nations
in the EU committed themselves to achieve an 8% reduction in greenhouse gas emissions
so that they can follow the protocol. The EU nations follow an agreement of “Burden
Sharing”, which considers the environmental burden accounted by different countries.
Countries emitting more greenhouse gases should reduce them more to meet the target
[2].
Motivation
1.1.1 Signification of fossil fuel for power generation
At the beginning of the 20th century, the coal industry was developed mainly in Western
Europe. Most of the coal mines were located in West Germany, Belgium and France.
Currently the situation has changed; non-European countries became the largest
producers of coal. Some mines in Europe are left with limited amount of coal and many
mines are very deep under the ground. Table 2 shows the number of reserves available
for different fuels along with their production rate.
Reserves Production (years) R/P
(Reserves/Production)
Coal 486 2.2 218
Oil 143 3.5 41
Gas 132 2.0 63
Uranium (light
water reactor)
33 0.6
Table 2. 1998 world’s energy reserves in billion (109) tons of oil equivalent (Gtoe) [3]
From Table 1 it can be seen that the coal reserves are higher compare to other fuels and
therefore it can be used for a longer period. Oil and gas reserves are much lower than.

7
Figure 1 shows the amount of carbon dioxide emissions from different fossil fuels and
their trend over the years. In this case oil and coal account for the highest CO2 emissions
with 42.6% and 38% respectively.
Figure 1. World’s CO2 emissions by different fuels [3]
There are basically four types of coal: lignite, bituminous, subbitminous and anthracite.
Lignite is often regarded as brown coal. The carbon content is between 25-35%, it is the
lowest rank coal, contains more moisture and ash compared to the other ones. The heat
content of lignite is lower than other kinds of coal. Subbitminous type containes more
carbon (35-45%) compared to lignite, it is also called black lignite.Bituminous coal is an
intermediate quality coal. It is black or dark brown in color. It has an energy density
greater than lignite but less than anthracite. The carbon content is between 60-80% and
the rest is moisture, air, hydrogen and sulfur. Anthracite is the best quality coal. It is also
called hard coal. It contains 92-98% carbon [4].
Table 3 shows the components of the coal that was used for the simulation of the
combution process for this report. The composition in water and ash free basis. The main
components are shown with their respective weight %. All the components which has
very small weight % are included in ‘Rest’.

8
Components Weight %
c 83.4
h 4.5
o 9.4
n 1.91
c 1.91
s 0.76
Rest 0.03
Table 3. Components of coal (water and ash free)
1.1.2 Conventional steam power plants
The main task of power plants is to transform the primary energy from fuels like hard
coal or lignite into electricity. For this, the chemical stored energy of the fuel has to be
converted into thermal energy by combustion. In the power plant the thermal energy is
converted into mechanical energy and then to electricity by means of a generator [8]. The
energy transformation in a steam power plant is shown in Figure 2.
Figure 2. Energy flow in a steam power plant
Every transformation stage has a significant effect on the overall efficiency of the power
plant. In general the efficiency is defined as the ratio of the benefit to the expenditure [5].
η = eExpenditur
Benefit (1)
For coal-fired power plants, the efficiency is the ratio of the net electrical power output to
the fuel energy of the coal [5].
Stored chemical
energy of the fuel
Thermal energy
Mechanical energy
Electrical energy

9
Fuel
.
el,net
Q
P=η (2)
1.1.2.1 Main components of a power plant cycle
Every coal fired power plant basically consists of four main components which are
shown in Figure 3.
Figure 3. Main components of a steam power plant [5]
Coal is used to obtain energy. It is fired in the furnace of the boiler. The heat produced is
transferred from combustion chamber to the water. In the steam generator the water is
converted completely into superheated steam. This superheated steam with high pressure
then flows to the turbine. Considering ideal cycle, the steam expands isentropically by
rotating turbine. The Energy of steam is converted into the mechanical energy and
ultimately electrical energy is obtained with the help of the generator. After the turbine,
the steam flows into the condenser and is transformed into water again. The water is
pumped back to the turbine by increasing pressure isentropically [6].

10
The best process for generating electricity by means of thermal energy is the Carnot
cycle. The Carnot cycle performs follows four changes of state as shown in figure 4.
1-2 Isothermal expansion by means of heating
2-3 Isentropic expansion
3-4 Isothermal compression by means of cooling
4-1 Isentropic compression
Figure 4. T-s diagram of a Carnot cycle [5]
Although the Carnot cycle has the highest efficiency, it is not technically feasible. For
coal fired steam power the Clausius- Rankine- cycle is the ideal thermodynamic model.
The Clausius Rankine cycle has four changes of state as shown in Figure 5.
1-2 Isentropic expansion in turbine
2-3 Constant pressure heat rejection in a condenser
3-4 Isentropic pressure increase
4-1 Constant pressure heat addition in a boiler
The superheated steam from the boiler comes to the turbine at state 1. In the turbine the
steam expands isentropically, which leads to power generation by rotating the shaft. The
expansion causes a drop in pressure and temperature. At state 2 the steam flows into the

11
condenser. At this state steam is in the form of vapor and liquid mixture. After the
condensation process at constant pressure the water flows to the pump [5].
The water enters the pump at state 3 in a liquid phase, the pressure is increased by the
pump by increasing the temperature a bit. This increase in temperature can be seen in
Figure 4 at state 4 [5].
At state 4, the water enters the boiler as pressurized liquid; at state 1 the water leaves the
boiler as superheated steam. The boiler is basically a large heat exchanger where the heat
is produced by fuel combustion. The heating process can be divided into three main parts.
In the first part the water is heated up to the saturation line. In the second part the
saturated water is converted into steam at constant temperature and pressure. In the third
part the saturated steam is heated by increasing the temperature into superheated steam
[5].
Figure 5. Ideal Rankine Cycle of a subcritical water/steam process [5]
If the pressure out of the pump is higher than the critical pressure (pcritical = 220.4 bar) the
subcritical cycle turns into a supercritical cycle which is shown in Figure 6. The main
advantage of the supercritical Clausius- Rankine- cycle is the efficiency increase of the
power plant cycle by increasing the superheated steam parameters. But the increase of the
steam parameters is closely linked with the improvement of the material used in the pipes
of the steam generator and by reheating of the working fluid.

12
Figure 6. Supercritical Clausius- Rankine- cycle [5]
1.1.3 Considerations regarding CO2 Capture from flue gas
The CO2 capture technology was not originally developed to control greenhouse gases
but for commercial reasons. Back then the captured CO2 was used to increase the
mobility of oil to facilitate its extraction from the ground, which is still being practiced.
Nowadays this technology can also be used to limit the concentration of CO2 in the
atmosphere.
Figure 7 shows the emissions for different power plants without capture units. The
specific emissions of CO2 are lower for natural gas compared to hard coal and lignite due
to lower carbon content.

13
0.0
0.2
0.4
0.6
0.8
1.0
1.2
1.4
1.6
30 35 40 45 50 55 60 65
Efficiency [%]
Sp
ecif
ic C
O2
emis
sio
ns
[kg
CO
2/kW
he]
Hard Coal
Lignite
Natural Gas
Figure 7. CO2 emissions as a function of the efficiency of power plants for different kinds
of fuels [9]
Conventional power plants do not capture CO2. Figures 8 and 9 compare two types of
power plants, one as a reference and the other one with Carbon dioxide Capture and
Sequestration (CCS) [7].
Figure 8. Comparison between reference and CCS power plants [7, 8].
For the power plants having capture units, there is still a small amount of CO2 emissions,
as the efficiency of capture is not 100 percent. Figure 8 shows, that the amount of CO2 in
kg/kWh from the power plant with CCS is actually higher than the reference. The reason

14
for this is that based on the same amount of coal input, less electricity will be delivered to
the grid in order to provide the required energy for CCS. The example shown in Figure 9
explains this more precisely.
Figure 9. Comparison of a hard coal fired power plant with and without CCS [8].
The power plant without capture has specific emissions of 0.74 kg CO2/kWhe, while the
ones from the plant with capture are 0.095 kg CO2/kWhe. In the second case 0.856
kgCO2/kWhe were also produced, however, these were captured. Considering that both
plants are of the same size and with the same original efficiency, there would be a penalty
of 0.82 kWhe (22.3%) in the second one, due to the capture of CO2 [8]. Figure 10 gives a
CO2 to
Power output =
CO2 to
CO22.71 kg CO2
(0.74 kg CO2/kWhe)
0.27 kg CO2
(0.095 kg CO2/kWhe)
2.44 kg CO2
(0.856 kg CO2/kWhe)
Power output =
90% CO2 capture
29.3 MJ/kg
29.3 MJ/kg

15
more detailed idea about the CO2 emissions without capture unit, CO2captured with
capture unit and the actual reduction in CO2 emissions due to capture unit.
Figure 10. Comparison of CO2 emissions for different power plants [9].
Figure 9 compares CO2 emissions of different power plants using lignite, hard coal and
natural gas. For example, if we compare the CO2 emissions for a hard coal power plant
running at an efficiency of 45%, we can see that the amount of CO2 captured is higher
than the actual CO2 emissions without a capture unit. This is due to fact that the CO2
production of the power plant increased in order to provide the capture unit with the
necessary energy for the capture process.

16
As described earlier in Figure 7, due to use of CO2 capture unit there will be reduction in
energy obtained. This reduction will decrease the efficiency of the power plant. The
reduction in efficiency is different for different power plants. Figure 11 shows the
efficiency decline for different base power plants.
0
2
4
6
8
10
12
14
16
18
40 45 50 55 60
Efficiency [%]
Red
uct
ion
in
eff
icie
ncy
du
e to
C
O2
cap
ture
un
it [
%]
Lignite
Hard coal
Natural gas
Figure 11. Decline in the efficiency due to CO2 capture technology [9]
The Figure shows the reduction in efficiency due to installation of CO2 capture unit for
different power plants and fuels. These curves are obtained with basic efficiency of 45%
for a hard coal fired power plant, after installing a CO2 capture unit, the efficiency for this
power plant is assumed to fall by 10%. The efficiency of CO2 capture is considered as
90%, moreover the energy required per kg of CO2 captured is assumed to be the same for
all power plants. For natural gas the energy demand for the CO2 capture will be little bit
higher due to the lower CO2 concentration in the flue gas. From Figure 11 it can be seen
that for the power plants having high base efficiency there will be less decline in
efficiency after CO2 capture. The reduction in the efficiency for lignite power plants is the
highest compared to hard coal and natural gas. Therefore to get high efficiency after CO2
capture the efficiency of the base power plant should be as high as possible. The
efficiency is defined in equation 2.
The challenge of capturing CO2 from flue gases consists in reducing the CO2 emissions to
the atmosphere, while guarantying that the efficiency of the power plants will not be

17
dramatically affected, as explained in the previous examples (see Figures 8 and 9). Under
the actual conditions the capture of CO2 from flue gases represents an expensive
alternative to protect the environment. Therefore it is necessary to do research on this
topic, in order to improve the existing technologies and make CO2 capture a feasible
option for conventional steam power plants.
Objective
From the various methods available for CO2 capture, this report focuses on post
combustion capture of CO2 using chemical absorption with Monoethanolamine (MEA) as
solvent.
The chemical process starts in an absorption tower. CO2will get absorbed from the flue
gases and leave the column with the rich MEA at the bottom; whereas the remaining
gases are exhausted from the top of it. CO2and MEA are separated in a stripper. The lean
MEA is collected at the bottom of the stripper and recycled back to the absorption tower,
while CO2 is collected at the top of the column and lead to a compressor to be prepared
for its transport and sequestration.
Some reasons to use MEA in an absorption process are: it has high reactivity towards
CO2 and it can be regenerated and recycled back to the process. This minimizes the
amount of needed solvent. The efficiency of the absorption process can be affected in
several ways. The choice of solvent is only one aspect to consider. The selection of the
proper columns also has a positive effect on the efficiency.
Aspen Plus is used to simulate the CO2 capture process. It helps to optimize equipment
configurations, operating conditions and the energy requirements. Aspen Plus also helps
in determining the effect of different input variables on the output of the process.

18
Simulation of the process is performed to achieve 85% CO2 recovery. This will be the
first approach towards simulation. The objective is to make a basic simulation so that it
can be used for optimization and further research.

19
2. Carbon capture technologies
In the previous chapter it was mentioned that we are going to be dependent on fossil fuels
for the upcoming decades, as described in the IPCC report. This means that CO2
emissions will continue to rise and with them, their interference with the climate. These
emissions from different sources have increased its concentration in the atmosphere. It
has to be stabilized so that anthropogenic disturbance in the climate system can be
prevented. To reduce the emissions of CO2, it can be captured with different technologies
and sequestered in number of ways (see Figure 12). It can be disposed deep under the see
using a long pipe line or with the help of ships. It can be stored geologically deep under
the ground. This kind of storage is also used commercially to enhance the flow of crude
oil from its sources and is therefore not restrained from the atmosphere. Captured CO2
can also be used for some industrial purposes. It is used in gaseous or liquefied state as
feedstock in chemical processes that produce valuable carbon containing products.
However the potential for such use is limited by around 1% of anthropogenic CO2 [7].
Figure 12. CO2 sequestration examples [7].

20
CO2 capture technologies can be classified in three different categories, depending on the
location where the capture actually takes place (see Figure 13):
1. Pre-combustion capture
2. Oxy-fuel combustion
3. Post-combustion capture
Figure 13. Comparison between different types of CO2 capture methods [7].
2.1 Pre-combustion capture
As the name suggests, in this case the carbon is captured before the fuel is combusted. In
this process coal is gasified to produce a synthesis gas, consisting of carbon monoxide
and hydrogen. This gas undergoes a water-gas shift reaction to produce a concentrated
stream of CO2 and hydrogen. The obtained hydrogen is used in a power plant to produce
electricity. IGCC plant with CO2 capture unit is a good example of this kind of process
[1].

21
2.2 Oxy-fuel (Integrated)
This method is based on the use of oxygen instead of air for the combustion of fuel. As a
result the flue gas is a concentrated stream of CO2. An Air Separation Unit (ASU) is used
to separate the oxygen from other components of air before it can be used for the
combustion. The ASU requires a lot of energy to separate oxygen. Just oxygen separation
consumes to 15% of the electrical energy produced by a power plant, the actual capture
process require more energy [10].
2.3 Post combustion Capture
The capture of carbon dioxide after the combustion of carbonaceous fuel (coal) is better
known as post combustion capture. It actually does not even disturb the process
configuration of a power plant, which is the reason why this option seems to be favorized
for conventional coal-fired power stations by means of retrofitting.
Compared to the other CO2 capture methods, the post combustion is the only one which
seems to be ready for retrofitting. However, if we take a closer look at the investment
costs in Figure 14, we will notice that the post combustion capture also represents the
worst case of the three presented options regarding efficiency, investment and cost of
electricity. The explanation as to why post combustion would still be used is that the
process configuration of a conventional power plant would not have to be disturbed. The
necessary changes that would have to be made would rather apply to the DeNOx and
Desulphurization plants, to maintain new emission rates that would avoid an interference
with a CO2 capture plant. Besides, under the actual circumstances there are still some
problems from plants like the Oxy-fuel ones that have yet to be solved, like the
optimization of the ASU.

22
Figure 14. Comparison between different power plant technologies with and without CO2
capture [11]
The post combustion offers a number of technologies theoretically available to capture
carbon dioxide as shown in Figure 15, for instance:
1. Adsorption.
2. Cryogenic separation (Low temperature distillation).
3. Membrane separation.
4. Physical and chemical absorption.

23
Figure 15. Types of post combustion CO2 capture methods [1]
2.3.1 Adsorption
The process depends upon the intermolecular forces between adsorbent and the carbon
dioxide. Solid adsorbent is set in the form of a bed in a column and carbon dioxide is then
assimilated. Once the bed is saturated with carbon dioxide, another bed is used. There are
different techniques to desorb (regenerate) the saturated bed. It can be done by Pressure
Swing Adsorption (PSA), Temperature Swing Adsorption (TSA) or the Electrical Swing
Adsorption (ESA) depending upon the method used [1, 12]. However due to very less
pressure of flue gas, PSA is not a favorable method.

24
2.3.2 Cryogenic separation
This method is also known as low temperature distillation. In this case flue gas
containing high concentration of carbon dioxide (>50%) is cooled and liquefied. The
temperature is set such that only carbon dioxide gets liquefied [1].
There are still a few points that have to be considered in this method. The flue gas
entering the process should have a high concentration of carbon dioxide (>50%)
otherwise it will take a lot of energy to liquefy it. Other impurities such as nitrogen oxide
and sulfur dioxide should be removed before the flue gas gets in the distillation column.
These impurities lead to a high consumption of energy if allowed to enter the distillation
column [1].
2.3.3 Membrane separation
This is another option of carbon dioxide separation. Here a semi permeable wall is put in
the way of the flue gas flow and the carbon dioxide is separated by applying specific
operating conditions to the flow.
The membrane separation can be classified in two categories:
i. Gas separation membrane
In this case the membrane is installed in the flue gas flow. This separation is
based on differences in physical and chemical interactions of different gases
with the membrane material, hence allowing one of the gases to pass through
faster than others. The separation relies on solubility or diffusivity of the gas
molecules in the membrane, also on the difference in partial pressure on both
sides of the membrane.
ii. Gas absorption membrane
This membrane is installed between parallel flows of flue gas and an
absorbing liquid. The membrane is prepared such that carbon dioxide gets
attached with the membrane and the liquid flowing on other side absorbs
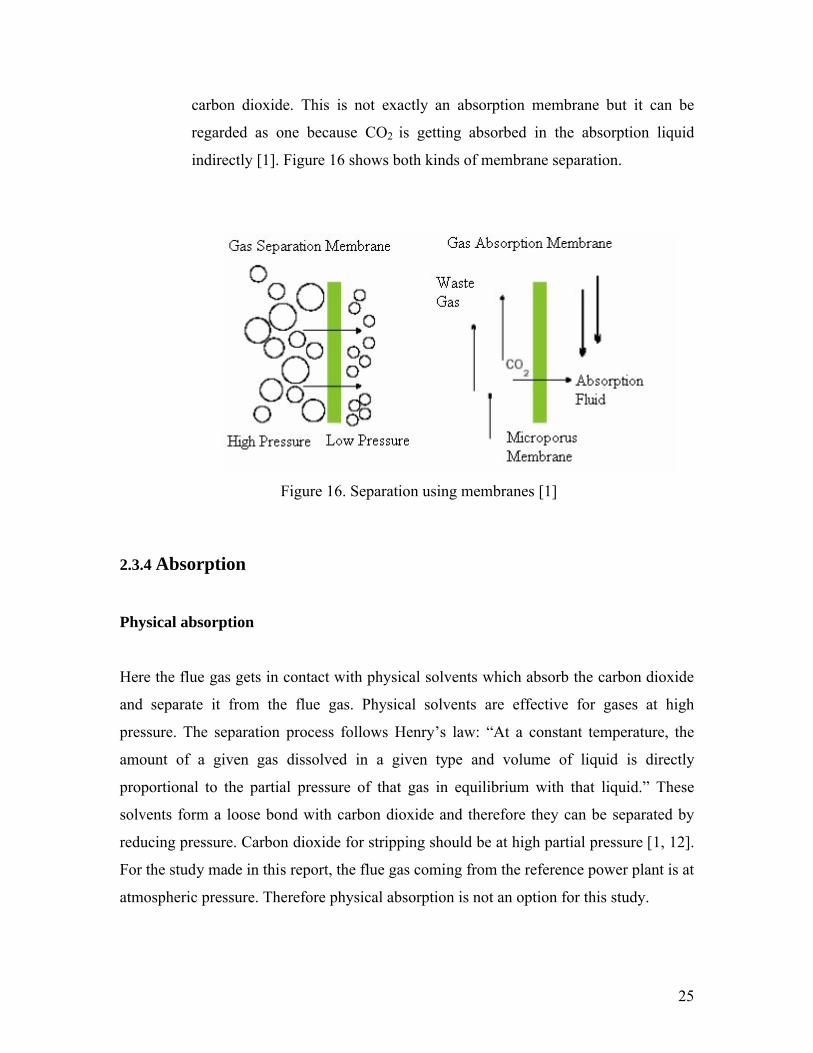
25
carbon dioxide. This is not exactly an absorption membrane but it can be
regarded as one because CO2 is getting absorbed in the absorption liquid
indirectly [1]. Figure 16 shows both kinds of membrane separation.
Figure 16. Separation using membranes [1]
2.3.4 Absorption
Physical absorption
Here the flue gas gets in contact with physical solvents which absorb the carbon dioxide
and separate it from the flue gas. Physical solvents are effective for gases at high
pressure. The separation process follows Henry’s law: “At a constant temperature, the
amount of a given gas dissolved in a given type and volume of liquid is directly
proportional to the partial pressure of that gas in equilibrium with that liquid.” These
solvents form a loose bond with carbon dioxide and therefore they can be separated by
reducing pressure. Carbon dioxide for stripping should be at high partial pressure [1, 12].
For the study made in this report, the flue gas coming from the reference power plant is at
atmospheric pressure. Therefore physical absorption is not an option for this study.

26
Chemical absorption
In this method the flue gas is cooled and cleaned from impurities. It then goes to an
absorption column where it comes in contact with a solvent. CO2in the flue gas reacts
with the solvent in use and gets absorbed in it. The stream at the bottom of the absorber
containing the rich solvent is transferred to another column where the absorption process
gets reversed in the presence of heat. The lean solvent is then recycled back to the
absorber, whereas the captured CO2 gets compressed and prepared for its transportation
and storage [1, 12].
Chemicals used as solvents can be categorized in organic and inorganic. The first ones
can once again be classified in two main groups: amines and sterically hindered amines.
i. Organic solvent
a. Amines
There are three classes of amines (primary, secondary and tertiary amines)
which can be used as solvents. Primary amines such as Monoethanol
amines have more reactivity towards carbon and that is why they are
comparatively superior to other amines for this process [1, 12]. However
there are a few drawbacks associated with amines. Their degradation rates
are high when they come in contact with sulfur dioxide and nitrogen oxide
from flue gases, the amount of energy required for the regeneration of
MEA is high. Approximately 80% of the energy used in the absorption
process is consumed in the regeneration of such amines [1].
b. Sterically hindered amines.
In this case, big alkyl groups are attached to the amino groups. These
amines have more reactivity than MEA. Moreover, their thermal
degradation starts after 205oC [1].
ii. Inorganic solvents
Solvents such as potassium, sodium carbonate and aqueous ammonia belong
to this category. Due to the fact that potassium carbonate can be used in
different configurations, it is better suited as a solvent than other inorganic

27
solvents. In comparison with other inorganic solvents, potassium carbonate
can work at higher temperatures such as 70-120°C and a small increment in
temperature can result in carbon dioxide stripping from it. This property of
potassium carbonate saves lot of heat required for the regeneration of a
solvent [1].
2.3.4.1 Selection of columns and expected size of a CO2-flue gas scrubber
They also play along with solvents, an important part to increase the efficiency of the
absorption process. The column used for mass transfer should be such that, there is a
maximum mass transfer with a minimum pressure loss, which reflects on a reduced
consumption of energy. A variety of columns can be used for absorption. Figure 19
shows some of the columns, which can be used for this process.
Figure 19 compares different types of columns with respect to their absorption capability
and consumed energy. Note that the energy requirement increases from right to left
whereas the mass transfer increases from bottom to top. The ellipse at the centre of the
figure encircles some columns which are suited to be used as an absorber. The ideal
columns for this process would be ones which follow the arrow (pointing diagonally
away from ellipse). These columns would be able to absorb more CO2 and at the same
time require less energy for the process [14]. For a process in practice there are many
columns used. Figure 18 shows the CO2 unit and the area required for the process of
separation. The capture unit is one of the biggest one in the power plant having capture
facility. Figure 18 represents a power plant of 500 MW capacity and 14000 m3/h MEA
flow rate [15].

28
Figure 17. Types of column used for absorption [14]
Figure 18. An overview of equipment size for CO2 capture process by chemical
absorption [15]
66 DDeessoorrppttiioonn uunniittss
66 DDeessoorrppttiioonn uunniittss
CCOO22 DDrryyiinngg aannddccoommpprreessssiioonn uunniitt
BBooiilleerrhhoouussiinngg DDeessuullffuurriizz----
aattiioonn uunniitt
CCOO22
AAbbssoorrppttiioonnuunniitt ((66 uunniittssiinn ppaarraalllleell))
:: AAlltteerraattiioonn NNeewwccoonnssttrruuccttiioonn

29
3. Chemistry principles of CO2 absorption
There has been great interest in the chemistry of CO2 absorption from flue gases since
many years to develop the best suitable solvent to be used to improve the process
conditions. Amines are the most common solvents used for CO2 absorption and therefore
different possible reactions for absorbing CO2 in amines are studied. For simple amines,
reaction mechanisms are explained and product species are known. However, some
mechanisms are not certain because they have not been confirmed by experiments. From
last many years different amines are studied for CO2 absorption. Mechanism, kinetic and
equilibrium data have been explained for many reactions. However there is limited
understand of molecular structure of solvent and chemical equilibrium.
Among different reaction mechanisms available for CO2 absorption in amines, some are
discussed here.
a. Bicarbonate formation
In the process of carbon capture by absorption using amine as solvent, CO2 reacts with
aqueous amine to form either carbamate or bicarbonate. Figure19 shows the structure of
these intermediates, The R group in NR2 can be a proton or any form of substituent
group.
Figure 19. Species formed in the solution during the process [13]
CO2 can react with water in three mechanisms as follows:

30
CO2 + H2O H2CO3 (4)
CO2 + OH- HCO3 (5)
H2CO3 + OH- HCO3- + H2O (6)
Bicarbonate can again react with one available base molecule B, such as an amine
molecule or any other hydroxyl group. The reaction can be as follows,
HCO3- + B CO3-2 + BH+ (7)
Bicarbonate reaction is very slow one. When it comes in contact with the amine, the
reaction gets faster. The calculations for the mechanism shown in reactions (8) were
performed using one molecule of CO2, one molecule of water and one molecule of
ethanolamine. The structure for transition state for this reaction can be seen in the Figure
20.
CO2 + H2O + B HCO3- + BH+ (8)
Figure 20. Structure of transition state for bicarbonate formation [13]
b. Carbamate formation
This is another important reaction for CO2 absorption. For this, there are a couple of
mechanisms available. As proposed by Caplow, Zwitterion mechanism has two steps
[13]. In first step CO2 forms a bond with the amine while in the second one an amine-

31
proton is transferred to a base molecule; in this case a water molecule acts as base
molecule for second step (see Figure 21).
Figure 21. Zwitterion mechanism [13]
In another mechanism for carbamate formation proposed by Donnellan [13], carbamate is
formed in a single step as shown in Figure 22:
Figure 22. Mechanism for carbamate formation in single step [13]
In this mechanism B is the base molecule. Amine- CO2 bonding and proton transfer are
part of the single reaction.
c. Carbamate as reaction intermediate
Smith and Quinn [13], suggested that there is a direct hydrolysis of carbamate, which
means that carbamate reacts with water to form bicarbonate and amine. Figure 23 shows,
how carbamate interacts with water molecule. The general conclusion after considering
other interaction is that, a carbamate- CO2 group carbon is unlikely to participate in any
reaction except to go back to the CO2 and the amine.

32
Figure 23. Geometry of ethanol amine carbamate interaction with a water molecule [13]
Reaction kinetics
For selecting a suitable solvent for absorption process, kinetics of CO2 in aqueous amine
play important role. Fast kinetic will always be preferred as separation of CO2 can be
achieved faster than the slow kinetics. Thus the size of column required for absorption
will be smallest. Therefore knowing the kinetics of different amines helps in solvent
selection. Carbamate and carbonate formation are two main absorption reactions. There
exists a correlation between the absorption reaction and its kinetics. The kinetic of the
carbamate formation reaction is faster as compared to the kinetic of bicarbonate
formation. Figure 24 shows the correlation between carbamate formation reaction and the
free energy of the reaction.
Figure 24. Correlation between reaction rate and carbamate stability [13]
33
4. Carbon dioxide capture process using MEA as a solvent
As previously mentioned MEA is favorized over other type of solvents due to some
advantages, for example in comparison to other types, MEA has the lowest molecular
weight and that is the reason why it has higher reactivity towards carbon and more
absorption capacity for carbon dioxide [12].
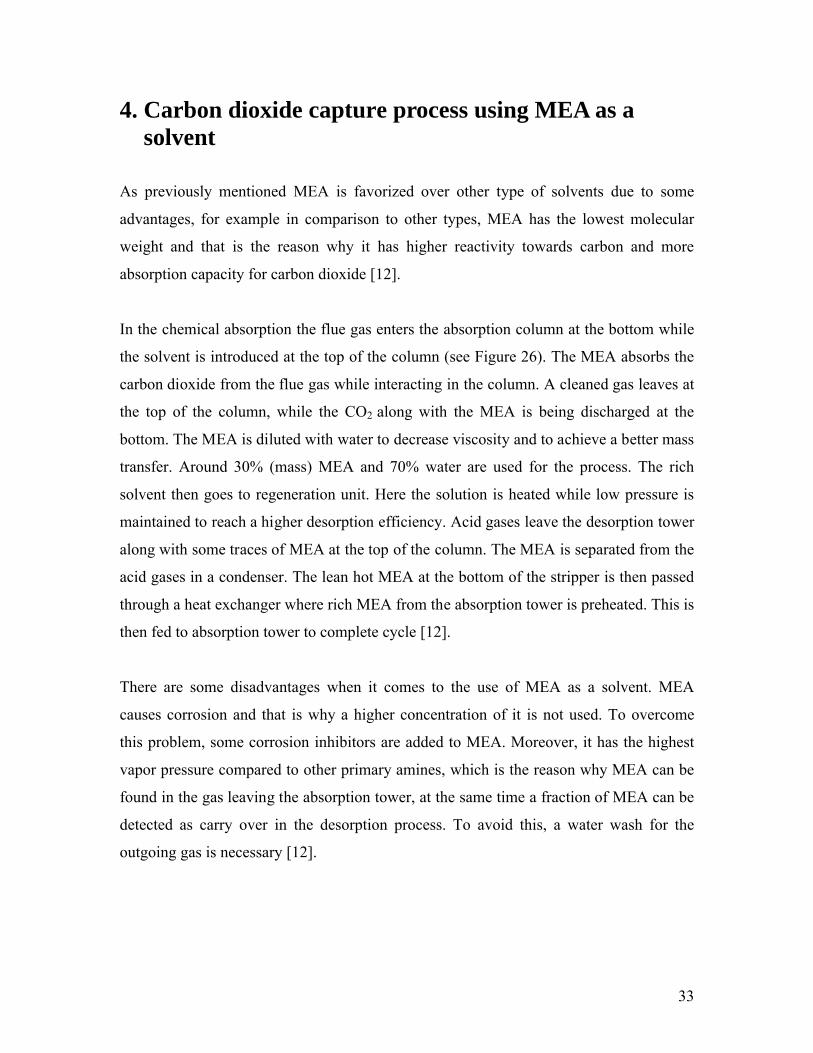
In the chemical absorption the flue gas enters the absorption column at the bottom while
the solvent is introduced at the top of the column (see Figure 26). The MEA absorbs the
carbon dioxide from the flue gas while interacting in the column. A cleaned gas leaves at
the top of the column, while the CO2 along with the MEA is being discharged at the
bottom. The MEA is diluted with water to decrease viscosity and to achieve a better mass
transfer. Around 30% (mass) MEA and 70% water are used for the process. The rich
solvent then goes to regeneration unit. Here the solution is heated while low pressure is
maintained to reach a higher desorption efficiency. Acid gases leave the desorption tower
along with some traces of MEA at the top of the column. The MEA is separated from the
acid gases in a condenser. The lean hot MEA at the bottom of the stripper is then passed
through a heat exchanger where rich MEA from the absorption tower is preheated. This is
then fed to absorption tower to complete cycle [12].
There are some disadvantages when it comes to the use of MEA as a solvent. MEA
causes corrosion and that is why a higher concentration of it is not used. To overcome
this problem, some corrosion inhibitors are added to MEA. Moreover, it has the highest
vapor pressure compared to other primary amines, which is the reason why MEA can be
found in the gas leaving the absorption tower, at the same time a fraction of MEA can be
detected as carry over in the desorption process. To avoid this, a water wash for the
outgoing gas is necessary [12].

34
Figure 26. Process flow diagram for CO2 capture [12]
4.1 Simulation of MEA process with Aspen Plus
The CO2 capture process can be divided into two parts: absorption and desorption. Coal is
combusted to obtain the composition of the flue gas, which should be cleaned before
being submitted to the desorption process. The actual cleaning process in the DeNOX and
Desulphurization plant were not simulated. However, the values were fixed to the ones
from the “Law” in order to prevent any malfunction due to impurities from the flue gas in
the CO2 capture process [16]. Therefore starting point of the process is a typical flue gas
composition of a hard coal power plant as shown in table 4.
CCOO22 ttoo
CCOO22 ––RRiicchhAAmmiinnee PPuummpp

35
Flue gas (Stoichiometric
combustion)
Flue gas (After humidification,
entering the absorber)
Components
vol% wt% vol% wt%
CO2 15.8 23.2 15.7 23.2
H2O 6.3 3.8 6.9 4.2
O2 0.0 0.0 0.0 0.0
N2 77.9 73.0 77.4 72.7
SO2 0.0 0.0 0.0 0.0
Rest 0.0 0.0 0.0 0.0
Table 4. Composition of flue gas from hard coal fired power plant
Before coming to the absorber, flue gas passed through humidifier. Here the flue gas
comes in direct contact with water, hence its composition alters. Important change is that,
the amount of water in flue gas increases whereas nitrogen decreases by small amount.
4.1.1. Introduction to aspen plus
Due to pollution and adverse effects caused by industries, governments are upgrading
their rules and regulations constantly. These regulations along with changing market
conditions pose a competitive environment for all chemical and process industries.
Chemical and process engineers are the ones who deal with these kinds of problems.
They have to design, model and simulate the new processes to meet an environmental
friendly output. They have to modify the existing processes to keep the emissions well
within the range of regulations. Just having experience in process design is not enough to
face problems. Moreover processes made to get the required results on the basis of trail
and error are more risky to apply and they require much more time and money. In these
cases industries need an efficient tool to identify the problems and give their solutions.
The tool used in this project is Aspen Plus.
Aspen Plus uses mass, energy transfer, chemical equilibrium and reaction kinetics to
perform simulations. It works for a practical process by involving possible

36
thermodynamic data and actual operating conditions. Aspen Plus is used in research and
development, production and engineering, providing steady state process simulations
with effective modeling [17].
During the process of absorption and stripping of CO2, there are chemical reactions
between the components of flue gas and MEA. For the simulation of this process an
electrolyte system is used. “In Aspen Plus an electrolyte is defined as the one in which
some of the molecular species dissociate partially or completely into ions in liquid.
Solvent and/or some of the molecular species precipitate as salts” [18]. The process of
dissociation and precipitation are very fast so that the reactions can be considered to be at
chemical equilibrium. These types of equilibrium reactions in liquid phase are called
solution chemistry [18].
The simulation of an electrolyte system is greatly influenced by solution chemistry. It
also impacts physical property and phase equilibrium calculations. Due to dissociation of
species there are ions in liquid phase which are responsible for non-ideal thermodynamic
behavior of the liquid phase. To overcome this situation, Aspen Plus provides specialized
thermodynamics models and built in data to represent non-ideal behavior of the liquid
phas. All the unit operation models (UOM) in Aspen Plus can work with the electrolyte
system [18].
4.2 Description of the reference MEA process simulation
This is a general approach towards simulation of a CO2 capture process. A CO2 recovery
of 85% is aspired. To avoid undesired difficulties while simulating the process, only H2O,
N2 and CO2 are considered as the components of the flue gas. This chapter describes the
property method used for the simulation, specifications for the streams and the blocks
used.

37
4.2.1 Property method
A property method is defined as a collection of property calculation routes [17]. These
routes differ for different property methods. The properties are required by the unit
operation models to perform the calculations. These properties may be classified as
energy (eg: enthalpy) and transport (eg: viscosity).
The solution chemistry involved during the absorption and stripping process is shown in
equilibrium reactions 8 to 12 [19].
2H2O OH- + H3O+ (8)
CO2 + 2H2O HCO3- + H3O
+ (9)
HCO3 + H2O CO32- + H3O
+ (10)
RNH3 + H2O RNH2 + H3O+ (11)
RNHCOO- + H2O RNH2 + HCO3- (12)
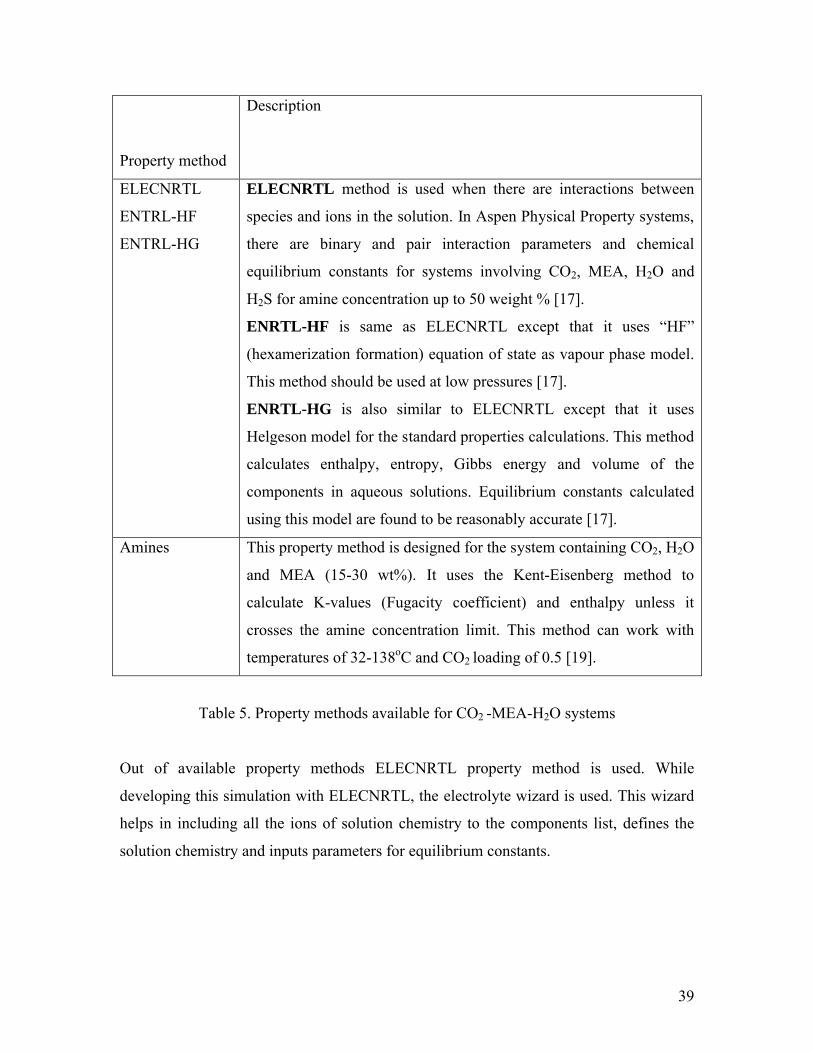
For this kind of process where CO2, water and MEA are involved, some property
methods are available in Aspen Plus (see Table 5).

38
39
Property method
Description
ELECNRTL
ENTRL-HF
ENTRL-HG
ELECNRTL method is used when there are interactions between
species and ions in the solution. In Aspen Physical Property systems,
there are binary and pair interaction parameters and chemical
equilibrium constants for systems involving CO2, MEA, H2O and
H2S for amine concentration up to 50 weight % [17].
ENRTL-HF is same as ELECNRTL except that it uses “HF”
(hexamerization formation) equation of state as vapour phase model.
This method should be used at low pressures [17].
ENRTL-HG is also similar to ELECNRTL except that it uses
Helgeson model for the standard properties calculations. This method
calculates enthalpy, entropy, Gibbs energy and volume of the
components in aqueous solutions. Equilibrium constants calculated
using this model are found to be reasonably accurate [17].
Amines This property method is designed for the system containing CO2, H2O
and MEA (15-30 wt%). It uses the Kent-Eisenberg method to
calculate K-values (Fugacity coefficient) and enthalpy unless it
crosses the amine concentration limit. This method can work with
temperatures of 32-138oC and CO2 loading of 0.5 [19].
Table 5. Property methods available for CO2 -MEA-H2O systems
Out of available property methods ELECNRTL property method is used. While
developing this simulation with ELECNRTL, the electrolyte wizard is used. This wizard
helps in including all the ions of solution chemistry to the components list, defines the
solution chemistry and inputs parameters for equilibrium constants.

40
4.2.2 Specification for streams
For simulating this process, minimum three streams must be specified. These streams are
FLUE-BLO, H2O-PUMP and MAKE-UP (see Figure 27).
4.2.2.1 FLUE-BLO
The flow rate and the composition of the flue gas are taken from the reference power
plant, NRW (introduced in chapter 1). For the simulation purpose, the flue gas is
considered to be consisting of H2O, N2 and CO2. As mentioned before this is the first
approach towards this kind of simulation. Moreover including all components would add
convergence problems due to complex calculations. The composition of the flue gas can
be seen in Table 4.
4.2.2.2 H2O-PUMP
This stream consists of 100% water, assumed to be at a temperature of 15oC and the
atmospheric pressure. This stream comes in contact with FLUE-BLO in a humidifier
where heat is transferred from the flue gas to the water. The flow rate of the water is
adjusted to reach the desired inlet temperature for absorber (see Figure 25). The process
in the absorber does not require a high temperature; the inlet temperature of the flue gas
is 46.85oC. High pressure can increase the CO2 absorption rate, but that would increase
the energy demand due to compression. The change in composition of the flue gas after
interaction with water in the humidifier can be seen in Table 4.
4.2.2.3 MAKE-UP
There are losses of MEA from top of the absorber (STACK) and from the top of the
stripper (CO2-COMP). Moreover MEA undergoes a degradation process. To compensate
all these losses, a part of the solvent is added continuously to the recycled stream before
it enters the absorber. The added solvent is assumed to be at atmospheric pressure.

41
4.2.3 Specifications for blocks
A block is nothing but a unit operation model. The arrangement of blocks in the process
can be seen in Figure 27. Table 8 shows the blocks used in this process and their
respective Aspen Unit Operation Models (UOM) used for simulation. In this section only
the main blocks are specified.
4.2.3.1 Absorber and Stripper
RadFrac is the only active UOM for vapor liquid absorber and stripper provided by
Aspen Plus. There are few reasons why RadFrac is chosen for this simulation:
a. As mentioned before, it is the first approach to such kind of simulation. RadFrac
can work with the property methods and data available, that is why it is chosen for
absorber and stripper.
b. It is not complex with respect to computations, which means that it will not need
much time for the simulation. Moreover it will not create convergence problems.
i. Column configuration
Absorber is a simple RadFrac column, whereas the stripper column has a condenser at the
top and a reboiler at the bottom. For both the columns feed enters at the center, except
that the MEA enters from the top of the absorber. To capture 85% CO2 from that in the
flue gas, the bottoms to feed ratio (B:F) of the stripper is adjusted. These columns are
fixed with sieve trays (stages). As the number of stages in the absorber increases the
solvent required to achieve a specific absorption rate will decrease. The number of trays
are fixed such that, they do not get dry with MEA. When number of stages in the stripper
increases, the total holdup time for the solution increases, which results in a higher
desorption rate. The CO2/MEA ratio influences the reboiler duty. CO2 content in the
recycle stream increases continuously, hence increasing the CO2 content in solvent stream
to the absorber continuously. For a fixed recovery process thus the reboiler duty will
decrease continuously.

42
Block UOM
Absorber RadFrac
This column can work with direct interacation between liquid and
gas stream where chemical reaction occurs. Mass transfer takes
place between the streams.
Stripper RadFrac
Blower COMPR
It is used for increasing pressure of gas stream.
Pump-water PUMP
It used to increase the pressure in liquid stream.
Pump (rich MEA) PUMP
Heat exchanger HeatX
In this equipment heat transfer takes place between one high
temperature liquid/gas stream and another low temperature liquid
stream by indirect interaction. Both the stream involved here are
process streams
Cooler Heater
It is type of heat exchanger where heat transfer takes place
between two streams. In this case the process stream is cooled or
heated using another utility stream. It also determines the phase
condition of the outlet stream.
Humidifier Flash
It is a column used to separate or mix liquid and gas stream
without chemical reactions.
Mixer Mixer
It is used to mix two liquid or gas streams to make a uniform
single stream.
Table 6. UOM’s used in CO2 absorption process using MEA
43
ii. Column temperature and pressure
To the reactions to get started, the absorber temperature should be more than 30oC. As
the process of absorption is exothermic, the heat will evolve and the temperature inside
the column will rise. Therefore to control the temperature, the upper temperature limit is
fixed around 60oC. The absorber operates at atmospheric pressure; there is no need of a
high pressure inside. However the pressure losses at absorber must be low, because for
higher pressure loss, blower has to create a higher pressure ratio and therefore the energy
requirement of the process will increase with pressure ratio. In case of stripper, increasing
the pressure increases the temperature inside the column and it results in decreasing the
heat required from reboiler. However above 122oC thermal degradation of 30 wt% starts,
therefore conditions are specified such that the temperature does not cross 122oC [19].
Blower
COMPR UOM is used for the blower. It is used to overcome the pressure losses in
humidifier. When there will be interaction between the water and the flue gas in
humidifier, there will be a pressure loss. If flue gas is at atmospheric pressure then it
would not be at desired pressure while entering absorber. It is required to specify the
pressure output of the stream as well as the isentropic and mechanical efficiencies of the
blower.
Humidifier
This equipment used for the separation or the mixing of liquid and gas takes place. Flash
is used UOM for the humidifier. Its task is to reduce the temperature of the flue gas to the
desired temperature of the absorber by interacting flue gas with water. It has the option to
fix the temperature of outgoing flue gas. This temperature can be achieved by adjusting
the flow rate of water.
HEATX
A shell and tube type heat exchanger is used between absorber and stripper. The recycled
lean MEA stream from stripper is interacted indirectly with comparatively lower

44
temperature rich MEA stream. Heat transfer takes place from lean to rich MEA. This
process reduces the energy demand. During this process the temperature of rich MEA is
increased to stripper conditions and on the other hand the temperature of lean MEA is
reduced.
4.3 Calculation example of the first run
There are numerous calculations which have been performed by Aspen Plus for the
simulation. These calculations include mass balance, energy balance, entropy calculations
etc. A set of data of the first run can be seen in the annexure 1. The stripper and the heat
exchanger (HeatX) are the main components in terms of energy during the process. In the
desorption process the temperature is close to 120oC. To maintain the temperature, the
heat inptu has to be more than 1 GW for a 600 MW power plant. For this kind of heat
processing, up to 12 parallel scrubbing units will be necessary (see Figure 18). For
design and optimization of the column more detailed information of the complex
reactions taking place in the stripper are necessary. Some results of the simulation and
their relations are discussed in next chapter.
To make use of the enthalpy of lean MEA flow coming out of the stripper, it is used for
preheating the rich MEA stream before entering the stripper. Due to the high MEA mass
flow of the internal cycle the HeatX will have a size of more than 400 MW, which means
a high heat transfer area is needed in case that the difference in temperature is kept low.
Table 1 shows the relevant data of the streams of the HeatX.
The thermodynamic average temperatures for the streams are calculated using the
equation:
ΔS
ΔH=Tm
Using the data from Table 7, the thermodynamic average temperature of the lean MEA
flow has been calculated to Tm1 = 393 K and Tm2 = 341 K for the rich MEA flow.
In this case the exergy losses are:

45
Exergy losses = u).T.TT
TTQ.(
m2m1
m2m1
where, Q: heat transfer capacity 400 MW
Tu: Ambient temperature 293.15 K
The exergy losses of HeatX are calculated to be 45 MW.
Streams Water
kg/sec
Total
mass
flow rate
kg/sec
Specific
enthalpy
J/kg
Entropy
J/kg K
Enthalpy
GW
Entropy
MW/K
RICH-
HX
1262.186 2073.783 1.19E+07 12166.26 2.46E+01 2.52E+01
LEAN-
HX
1248.292 1957.562 1.17E+07 9350.217 2.28E+01 1.83E+01
Input
Total 4.74E+01 4.35E+01
RICH-
STR
1261.133 2073.783 1.17E+07 11579.67 2.42E+01 2.40E+01
LEAN-
MIX
1248.44 1957.562 1.19E+07 9858.55 2.32E+01 1.93E+01
Output
Total 4.74E+01 4.33E+01
Table 7. Energy and mass flow across HeatX
The process captures 101.229 kg/sec CO2; this means that the specific exergy losses to
capture one kg of CO2 will be 0.44 MJ/kg CO2 or 0.12 kWh/kg CO2. If we compare this
value with power plant at 45% efficiency, it is around 9% of the electricity generated
(1.33 kWhel/kg CO2).

46
Above calculations show that, the exergy losses at HeatX can not be neglected. If we
compare the energy generated by the reference power plant NRW, the exergy loss of
HeatX is relatively high. The calculations indicate that there is a scope for improvements
for making the capture process economically feasible.

47
5. Results and Discussion
Within the last chapters the boundary conditions for the simulation of a CO2 capture
process with MEA scrubbing were presented. After the developed model converged, the
obtained results had to be analyzed, to determine whether they would be reliable and
given the case ready for implementation, or whether more simulations are required, in
order to optimize the existing model. This chapter will discuss precisely those points.
For this thesis, the first converged version of the Aspen Plus model is considered to be
the base case. The model retrieves 85% of the CO2 present in the flue gases coming from
the Reference Power Plant NRW (introduced in chapter 1). From previous studies [19,20]
it is known that the stripper reboiler is the biggest energy consumer in a scrubbing
process, since the solvent used for absorption does not only have to be heated to a
temperature close to 120°C, but also because the temperature in the column decreases
during the separation of CO2 from the rich solvent (endothermic process). Moreover the
high mass flow rate in the stripper also consumes a high amount of energy to operate on.
This would not be a problem for a small absorption process, but given the fact that 120
kg/s CO2 have to be separated from a mass flow of approximately 530 kg/s, keeping the
solvent at 120°C represents a heat transfer problem. Therefore it seems more than logical
to take a look at this factor.
The simulation of the base case delivered a reboiler duty of 2.05 GWth (at 120°C). This is
as expected a huge amount of energy, above all, if this value is compared with the
thermal energy required from the Reference Power Plant NRW. The minimum theoretical
value of the heat demand at 120°C for the separation of CO2 (calculated by the reversible
work) is presented in Figure 28. This would definitely be the lowest possible heat
requirement needed for this capture process and should therefore be the ideal goal to
reach from any simulation. The obtained model, however, was not expected to be a
perfect model working properly from the beginning; hence more simulations have to be
conducted to optimize it.

48
A sensitivity analysis represents a common way to study the behaviour of different model
parameters, in order to establish dependencies among them. This was also the case for
several variables like the solvent mass flow, the pressure along the columns, the
stripper’s bottom to feed ratio (B:F), the mass fraction of CO2and water at the top of the
stripper column, etc. The variation of most factors seemed to have an almost negligible
effect on the reboiler duty and is therefore not presented in this work. There was however
one variable that showed a great impact on the stripper energy consumption, as can be
seen in Figure 28.
0
0,5
1
1,5
2
2,5
0 0,05 0,1 0,15 0,2 0,25 0,3
CO2 in flue gas [Vol.-%](for flue gas at atmospheric pressure equal to CO2 partial pressure [bar])
rev
ersi
ble
wo
rk a
s h
eat
dem
an
d a
t 12
0°C
[MJ/
kg C
O2]
Figure 28. Reversible work expressed as heat demand at 120°C required for CO2
desorption
In Figure 29 the base case is represented with 100%. The mass flow of the solvent was
originally varied from 14% to 300%, but the model only converged for the range from
87% to 117%. The reason for this is that the capture of 85% CO2 can only be achieved in
this range considering the actual settings of the simulation. It is possible to make the
CO2 in flue gas [Vol. %](for flue gas at atmospheric pressure equal to CO2 partial pressure [bar])

49
model converge in the original range, but therefore the CO2 recovery would have to be
different than 85%. Figure 29 shows the dramatic fall of the specific heat demand from
47 MJ/kgCO2 to 34 MJ/kgCO2, the curve declines the most for the first two points (87%
and 88% solvent flow). The lowest specific heat demand is 12 MJ/kgCO2 at 117% solvent
flow rate.
It seems strange that with an increasing value of solvent flow rate, the specific heat
demand will decrease. It actually would also be expected to increase, since more solvent
would have to get reboiled. In previous publications [19,20] it is mentioned that the
amount of CO2 present in the lean solvent leaving the stripper has a notorious impact on
the stripper’s energy consumption. It was hence decided to take a closer look at this
behaviour, again with the help of a sensitivity analysis. The CO2 loading is defined as the
ratio of CO2 to MEA in the solvent. The results can be seen in Figure 30.
85% CO2 capture rate
0
5
10
15
20
25
30
35
40
45
50
85 90 95 100 105 110 115 120
solvent flow [%]
Sp
ecif
ic h
eat
dem
and
per
kg
CO
2 c
aptu
red
[MJ/
kg C
O2]
Figure 29. Specific heat demand as a function of solvent flow in the scrubbing process

50
85% CO2 capture rate
0.00
0.02
0.04
0.06
0.08
0.10
0.12
0.14
0.16
85 90 95 100 105 110 115 120
Solvent flow [%]
CO
2 lo
adin
g in
lean
so
lven
t
Figure 30. CO2 loading as a function of solvent flow rate
In Figure 30 the loading seems to be proportional to the amount of solvent used. The
highest value of solvent also shows the highest value of the loading. Considering that the
values for the solvent are the same used in Figure 29, then we can conclude, that the
specific heat demand for the separation of CO2 decreases with a growing value of solvent
flow rate, but only because the higher values of solvent flow rate also present the highest
values of CO2 loading. If we take a new look at the two first points of Figure 30 and
compare them with Figure 28, then we also will notice that in this case the difference in
CO2 loading increases the most. This is the explanation to the marked decrease in specific
heat demand shown in Figure 29. The highest value for the CO2 loading is 0.14. Seeing
that for a solvent flow rate value of 117% the so far best results have been achieved, it
would be recommendable to take this point as the new base and keep on optimizing the
process with it. The studies previously mentioned [19,20] suggest a CO2 loading from
0.25. This value appears to be an optimum between the tolerable amount of CO2 present
in the solvent and the amount of solvent itself, given that the more solvent that will be
used, the more solvent will have to get reboiled. A loading of 0.25 was not used in this
thesis, but it definitely would be the next step to take in the optimization process. Since

51
the increase in loading from 0.045 to 0.14 shows a good development with respect to the
stripper’s reboiler duty, it would be advisable to try to reach a value of CO2 /MEA of
0.25.

52
6. Summary
The reference power plant (NRW) is made with state of the art technology. This study
came in existence with the aim of replacing old power plants with new state of art the
technology. With increasing pressure from government to reduce the CO2 emissions, this
plant is chosen to be equipped with CO2 capture unit. The real concern of employing such
unit is the energy demand to operate. For this plant where chemical energy of hard coal is
converted to electrical, the efficiency after CO2 capture is expected to be reduced by 10%
points.
From the technologies available for CO2 capture, post combustion capture is discussed.
By looking the status all available technologies, post combustion looks to be ready for
retrofitting in the power plant. Other advantage of this method is that, it can be installed
at the end of power generation process; it does not disturb the power plant configuration.
On the other hand the investment required seems to be very high.
Method of chemical absorption is used for capturing CO2 with MEA as a solvent. MEA
has the high reactivity towards CO2, moreover solvent can be recovered back in this
process, and hence this method is chosen over. CO2 gets absorbed in the solvent in an
absorber where as it is recovered in a stripper. The loaded solvent is regenerated in the
stripper and recycled back to the process.
The simulation of the process is done using Aspen Plus with the objective of 85% CO2
recovery. The results obtained were not feasible for the power plant because of high
energy demand. Sensitivity analysis was performed for the simulation by varying the
solvent flow rate, because it is the main influential parameter for reboiler heat duty.
However the simulation needs more investigation to improve it. The new base case
obtained can be used for further work for optimizing the process.

53
7. Bibliography
1. Murlidhar Gupta, Irene Coyle and Kelly Thambimuthu. “CO2 Capture
Technologies and Opportunities in Canada, Strawman Document for CO2 capture
and Storage (CC&S) Technology Roadmap.” CANMET Energy Technology
Centre Natural Resources Canada, September 2003.
2. “The Intergovernmental Panel ClimateChange(IPCC)”
http://ec.europa.eu/research/energy/nn/nn_rt/nn_rt_co/article_1150_en.htm
3. Boris Alpern, M.J. Lemos de Sousa, Documented international enquiry on solid
sedimentary fossil fuels; coal: definitions, classifications, reserves-resources, and
energy potential, International Journal of Coal Geology 50 (2002) 3-41.
4. U.S.Department of Energy. A brief overview of coal.
5. Yunus A. Cengel, Michael Boles. “Thermodynamics: An Engineering approach.”
ISBN-10: 0073107689.
6. M.M.El-Wakil. “Power plant Technology.” ISBN: 0-07-Y66274-6.
7. “The Intergovernmental Panel ClimateChange(IPCC)”
http://ec.europa.eu/research/energy/nn/nn_rt/nn_rt_co/article_1150_en.htm
8. Howard Herzog. “An Introduction to CO2 Separation and Capture Technologies”.
MIT Energy Laboratory, August1999
9. F. Brandt, Brennstoffe und Verbrennungsrechnung 2. Auflage, FDBR-
Fachbuchreihe Bandi FDBR. Fachverband Dampfkessselbehälter- und
Rohrleitungsbau e.V.
10. Howard Herzog and Dan Golomb. “Carbon capture and storage from fossil use”.
Laboratory of energy and environment, Massachusetts institute of technology.
Encyclopedia of energy 2004
11. “power:perspektiven 2005- Innovationen zur Klimavorsorge in der fossil
gefeuerten Kraftwerkstechnik.“ RWE Power.
www.rwe.com/generator.aspx/konzern/fue/property=Data/id=332482/download1
0.pdf

54
12. Sam Wong and Rob Bioletti, Carbon Dioxide Separation Technologies, Carbon &
Energy Management Alberta Research Council Edmonton, Alberta, T6N 1E4,
Canada, 2002.
13. Eirik F. da Silva, Hallvard F. Svendsen, Computational chemistry study of
reactions, equilibrium and kinetics of chemical CO2 absorption, International
Journal of Greenhouse Gas Control I (2007) 151-157.
14. Prof. Dr.-Ing. Klaus Görner, presentation on Chemical Absorption Processes for
CO2 Separation From Flue Gases, Presented at Jülich, April 2007.
15. Lurgi
16. Thirteenth Ordinance on the Implementation of the Federal Emission Control Act
(Ordinance on Large Combustion plants and Gas Turbines Plants-13. BlmSchV)
of 20 July 2004 (Federal Law Gazette l p. 1717), corrected on 15 November 2004
(Federal Law Gayette l p. 2847).
17. Aspen Technology Inc. Aspen Plus 2006 Documentation, Aspen physical
property methods 2006
18. Aspen Technology Inc. Aspen Plus 2006 Documentation, Aspen Plus Electrolytes
2006-start.
19. Colin F. Alie. “CO2 Capture with MEA: Integrating the Absorption Process and
Steam Cycle of an Existing Coal-Fired Power Plant”, A thesis presented to the
University of Waterloo in fulfillment of the thesis requirement for the degree of
Master of Applied Science in Chemical Engineering. Waterloo, Ontario, Canada,
2004.
20. “Integrating MEA regeneration with CO2 compression and peaking to reduce CO2
capture costs”. A final report of ‘work performed under grant number DE-FG02-
04ER84111’for U.S. Department of Energy, National Energy Technology
Laboratory. Report submitted on June 2005.

55
Annexure 1
Mass transfer, heat flow and entropy in different streams of the process are shown in the following table.
Name of streamCO2-COMP FLUE-ABS
FLUE-BLO
H20-PUMP LEAN-ABS LEAN-HX
LEAN-MIX RICH-HX STACK
Coming from ABSORBER BLOWERPUMP-H20 ABSORBER HEATX COOLER HEATX
Going to STRIPPER HUMIDIFY MAKE-UP STRIPPER HEATX PUMP ABSORBERPhase VAPOR VAPOR VAPOR LIQUID LIQUID LIQUID LIQUID LIQUID VAPOR
Substream: MIXED Mole Flow kmol/sec H20 0.832804 1.187114 1.082466 10.36736 72.46926 69.29071 69.29897 70.06198 3.533809 MEA 4.13E-07 0 0 0 7.424128 7.451859 7.427 2.884964 2.31E-03 H2S 0 0 0 0 0 4.19E-22 0 0 1.06E-24 CO2 2.300001 2.70768 2.708616 0 1.45E-06 6.02E-04 8.47E-06 8.61E-05 0.407534 N2 3.87E-04 13.38134 13.38145 0 0 2.31E-34 0 3.87E-04 13.38095 MEA+ 0 0 0 0 1.574285 1.543828 1.559754 3.872175 0 H3O+ 0 0 0 1.26E-08 2.57E-10 1.24E-08 8.85E-10 2.36E-09 0 MEACOO- 0 0 0 0 1.49254 1.492951 1.501884 3.731501 0 HCO3- 0 0 0 0 0.012674 0.041716 0.018123 0.075431 0 HS- 0 0 0 0 0 2.59E-20 0 0 0 OH- 0 0 0 1.26E-08 6.24E-04 5.56E-04 6.34E-04 1.07E-04 0 CO3-- 0 0 0 0 0.034224 4.30E-03 0.019557 0.032568 0 S-- 0 0 0 0 0 2.07E-25 0 0 0Mole Frac H20 0.2658 0.068714 0.063035 1 0.873042 0.868016 0.868126 0.868617 0.203976 MEA 1.32E-07 0 0 0 0.089439 0.093351 0.09304 0.035767 1.34E-04 H2S 0 0 0 0 0 5.25E-24 0 0 6.14E-26 CO2 0.734076 0.15673 0.15773 0 1.74E-08 7.55E-06 1.06E-07 1.07E-06 0.023523

56
N2 1.24E-04 0.774556 0.779236 0 0 2.89E-35 0 4.80E-06 0.772367 MEA+ 0 0 0 0 0.018966 0.01934 0.019539 0.048007 0 H3O+ 0 0 0 1.21E-09 3.10E-12 1.55E-10 1.11E-11 2.92E-11 0 MEACOO- 0 0 0 0 0.017981 0.018702 0.018814 0.046263 0 HCO3- 0 0 0 0 1.53E-04 5.23E-04 2.27E-04 9.35E-04 0 HS- 0 0 0 0 0 3.24E-22 0 0 0 OH- 0 0 0 1.21E-09 7.52E-06 6.97E-06 7.94E-06 1.33E-06 0 CO3-- 0 0 0 0 4.12E-04 5.39E-05 2.45E-04 4.04E-04 0 S-- 0 0 0 0 0 2.59E-27 0 0 0Mass Flow kg/sec H20 15.00319 21.38619 19.50093 186.7708 1305.554 1248.292 1248.44 1262.186 63.66255 MEA 2.52E-05 0 0 0 453.4934 455.1873 453.6688 176.2243 0.141386 H2S 0 0 0 0 0 1.43E-20 0 0 3.62E-23 CO2 101.2226 119.1645 119.2057 0 6.37E-05 0.026512 3.73E-04 3.79E-03 17.93547 N2 0.010848 374.8578 374.8611 0 0 6.47E-33 0 0.010848 374.847 MEA+ 0 0 0 0 97.74422 95.85319 96.84203 240.4156 0 H3O+ 0 0 0 2.39E-07 4.89E-09 2.35E-07 1.68E-08 4.48E-08 0 MEACOO- 0 0 0 0 155.3471 155.3899 156.3197 388.3835 0 HCO3- 0 0 0 0 0.773349 2.545428 1.1058 4.602611 0 HS- 0 0 0 0 0 8.55E-19 0 0 0 OH- 0 0 0 2.14E-07 0.010612 9.46E-03 0.010782 1.82E-03 0 CO3-- 0 0 0 0 2.053774 0.258188 1.17363 1.954431 0 S-- 0 0 0 0 0 6.63E-24 0 0 0Mass Frac H20 0.129075 0.041494 0.037971 1 0.647925 0.637677 0.637753 0.608639 0.139432 MEA 2.17E-07 0 0 0 0.225061 0.232528 0.231752 0.084977 3.10E-04 H2S 0 0 0 0 0 7.29E-24 0 0 7.94E-26 CO2 0.870832 0.231204 0.232113 0 3.16E-08 1.35E-05 1.90E-07 1.83E-06 0.039282 N2 9.33E-05 0.727302 0.729916 0 0 3.31E-35 0 5.23E-06 0.820977 MEA+ 0 0 0 0 0.048509 0.048966 0.049471 0.115931 0 H3O+ 0 0 0 1.28E-09 2.43E-12 1.20E-10 8.60E-12 2.16E-11 0 MEACOO- 0 0 0 0 0.077096 0.079379 0.079854 0.187283 0

57
HCO3- 0 0 0 0 3.84E-04 1.30E-03 5.65E-04 2.22E-03 0 HS- 0 0 0 0 0 4.37E-22 0 0 0 OH- 0 0 0 1.14E-09 5.27E-06 4.83E-06 5.51E-06 8.77E-07 0 CO3-- 0 0 0 0 1.02E-03 1.32E-04 6.00E-04 9.42E-04 0 S-- 0 0 0 0 0 3.39E-27 0 0 0Total Flow kmol/sec 3.133192 17.27613 17.17254 10.36736 83.00773 79.82653 79.82594 80.65919 17.32461Total Flow kg/sec 116.2366 515.4085 513.5677 186.7708 2014.976 1957.562 1957.562 2073.783 456.5864Total Flow cum/sec 77.25375 292.9739 450.764 0.186916 2.060657 2.135371 2.032312 2.195065 479.2593Temperature K 342.531 320.15 320.15 288.15 313.2176 390.0668 334.4809 324.4813 337.4947Pressure N/sqm 1.15E+05 1.57E+05 1.01E+05 1.01E+05 1.01E+05 1.55E+05 1.55E+05 1.57E+05 1.01E+05Vapor Frac 1 1 1 0 0 0 0 0 1Liquid Frac 0 0 0 1 1 1 1 1 0Solid Frac 0 0 0 0 0 0 0 0 0
Enthalpy J/kmol -3.52E+08 -7.77E+07-
7.67E+07-
2.87E+08 -2.92E+08 -2.86E+08-
2.91E+08-
3.05E+08 -5.75E+07
Enthalpy J/kg -9.48E+06 -2.60E+06-
2.56E+06-
1.59E+07 -1.20E+07 -1.17E+07-
1.19E+07-
1.19E+07 -2.18E+06
Enthalpy Watt -1.10E+09 -1.34E+09-
1.32E+09-
2.97E+09 -2.43E+10 -2.28E+10-
2.32E+10-
2.46E+10 -9.96E+08
Entropy J/kmol-K -801.8955 1530.905 5323.31-
1.66E+05 -2.44E+05 -2.29E+05-
2.42E+05-
3.13E+05 -198.919
Entropy J/kg-K -21.61532 51.31487 177.9994-
9199.563 -10042.26 -9350.217 -9858.55-
12166.26 -7.547737