Embed Size (px)
Citation preview

1
This manuscript was accepted and published by Energy & Fuels, a journal of the American Chemical
Society. DOI: 10.1021/ef800739m ( http://dx.doi.org/10.1021/ef800739m ).
This manuscript was placed into the present public repository with the consent of the Editor of Energy &
Fuels. Publication data of the final, corrected work:
Khalil, R.; Várhegyi, G.; Jäschke, S.; Grønli, M. G.; Hustad, J.: CO2 gasification of biomass
chars. A kinetic study. Energy Fuels 2009, 23, 94-100. doi: 10.1021/ef800739m
CO2 Gasification of Biomass Chars. A Kinetic Study
Roger Khalil†, Gábor Várhegyi‡*, Susanne Jäschke§,//, Morten G. Grønli†, and Johan Hustad†
† Norwegian University of Science and Technology, Department of Energy and Process Engineering,
Trondheim, 7034 Norway; ‡ Hungarian Academy of Science, Chemical Research Center, Institute of
Materials and Environmental Chemistry, P. O. Box 17, Budapest 1525, Hungary; and § Rheinisch-
Westfälische Technische Hochschule Aachen, Chemische Verfahrenstechnik, Turmstr. 46, 52064
Aachen, Germany
TITLE RUNNING HEAD: CO2 Gasification of Biomass Chars
* To whom correspondence should be addressed. E-mail address: [email protected]
// Present affiliation: Energos AS, Vikelvfaret 4, 7054 Ranheim, Norway
ABSTRACT. The CO2 gasification of pine and birch charcoals was studied by TGA at CO2 partial
pressures of 51 and 101 kPa. Linear and stepwise heating programs were employed to increase the
information content of the experimental data sets. Low sample masses were used due to the high
enthalpy change. Seven experiments with different experimental conditions were evaluated
simultaneously for each sample. The method of least squares was employed. Three reactions appeared
in the temperature domain evaluated (600 - 1000°C). The first and second reactions were due to the
devolatilization and did not show a significant dependence on the CO2 concentration. They were
approximated by first order kinetics. The 3rd reaction corresponded to the gasification. Its modeling

2
was based on an empirical approximation of the change of the reaction surface during the gasification
and by a formal reaction order with respect to the CO2 concentration. Very close results were obtained
for the two charcoals. The dependence on the conversion could be well approximated by power law
kinetics. In the next step of the evaluation, the experiments of the two samples (14 experiments
combined) were evaluated together, assuming common activation energy values and a common reaction
order with respect to the CO2 concentration. This process led to nearly the same fit as the separate
evaluation of the two samples. The activation energy of the gasification step was 262 kJ/mol. The
reaction order of CO2 was 0.40.
KEYWORDS: Biomass, charcoal, char, kinetics, thermogravimetry.
1. Introduction
The Boudouard reaction plays a crucial role in several industrial processes. When biomass is gasified
with CO2, the first step is the devolatilization forming chars and volatiles (during the heat up of the
biomass to the high temperatures needed CO2 gasification). This step is followed by the reaction of the
char with CO2. The charcoal gasification may become a separate technological process in the future.
The development of the charcoal production methods, especially the emerging of the high-yield charcoal
technology1 made charcoal an attractive form for the transportation and storage of renewable biomass
energy. The gasification of the charcoal can be an advantageous way in the production of mechanical
and electric energy. Compared to the direct biomass gasification, one of its advantages is the lack of the
tar production. As contrasted with coals, renewable biocarbons (i.e. charcoal) have low ash, nitrogen
and sulfur contents. Moreover, because of their pore structure and the presence of dangling bonds,
biocarbons are much more reactive than fossil carbons.2
There are several papers dealing with the kinetics of the CO2 gasification of biomass chars, as shown
by a recent, extensive review.3 When the experimental conditions allow the C + CO2 2 CO reaction
to proceed in both directions, the Langmuir-Hinshelwood kinetics is employed usually.4-8 If the reaction
3
is far from the equilibrium, then the kinetics usually can be well described by the following type of
equations:6,9-11
d/dt A exp(-E/RT) f() PCO2 (1)
where is the reacted fraction, function f() approximates the reactivity changes as the gasification
proceeds, PCO2 is the partial pressure of oxygen, and is a formal reaction order. (See also the
Nomenclature at the end of the paper.) A is the preexponential factor. We added as a subscript to
indicate that the dimension of this quantity varies with : if PCO2 is expressed in kPa then the dimension
of A is s-1 kPa-.12 Equations of type 1 are also used for other char gasification reactions, replacing PCO2
by the partial pressure of O2 or H2O.
There are theoretical models for the f() function in eq 1 which describes the change of the reactive
surface area as the reaction proceeds.13,14 The simple shrinking core model, f()=(1-)2/3, also falls into
this category.15 The theoretical f() models were deduced for pure, homogeneous carbons. The real
charcoals, however, inherit chemical and structural inhomogeneities from their biomass feedstocks.2,16
Among others, mineral matter is known to catalyze the gasification and its distribution in the char is also
uneven. Another approach is the use of empirical approximations for f(). The nth order kinetics,
f()(1-)n gives frequently good results, where n is an adjustable non-negative parameter.10,11,17-19
Várhegyi et al. have used an empirical formula with three empirical parameters for the char + O2 reaction
that can have a wide variety of shapes, including shapes similar to those derived from the random pore
models.12,20,21 Recently Zhang et al. proposed a semi-empirical model for that purpose.22
The Arrhenius parameters can obviously be calculated without the determination of f() from data
belonging to the same values in different experiments. Nevertheless, we cannot use the kinetics for
modeling if we do not have an f(). Among others we cannot check the validity of the model by a
comparison between the simulated and the experimental data without an f(). One can obtain empirical
f() functions by interpolating the experimental reactivity values in the case of isothermal experiments.11

4
However, if the kinetics is based only on the isothermal sections of the experiments, we do not get
information on the part of the reaction that takes place before reaching the isothermal conditions.
In the present work we studied a birch and a pine charcoal. We aimed finding reliable kinetics by a
way that differed from the other studies of the field in the following points:
(i) Series of TGA experiments with linear and stepwise temperature programs were evaluated
simultaneously by the method of least squares;
(ii) All parts of the experiments were used in the kinetic evaluation (contrary to the isothermal
studies where the section before the stabilization of the experimental conditions is lost) ;
(iii) Care was taken to ensure true kinetic control by employing lower sample masses than it is
usual in TGA studies of this field;
(iv) Two samples from different woods were evaluated by partly identical kinetic parameters to
reveal the common features of their gasification behavior. In this way 14 experiments were
fitted simultaneously by the model.
The employed experimental conditions helped to get reliable information on the char + CO2 reaction
alone. The results are hopped to inspire and assist further researches in this field.
2. Experimental
2.1. Samples. Two chars were prepared from bark-free birch (silver birch, Betula Pendula) and pine
(Scots pine, Pinus sylvestris) grown in Norway. Cubic wood pieces of 10 mm were used for the
charcoal preparation. After a drying of 24 hours at 105°C, they were dropped into a reactor preheated to
500°C and kept there for 150 minutes. The charcoals prepared in this way were ground and sieved to
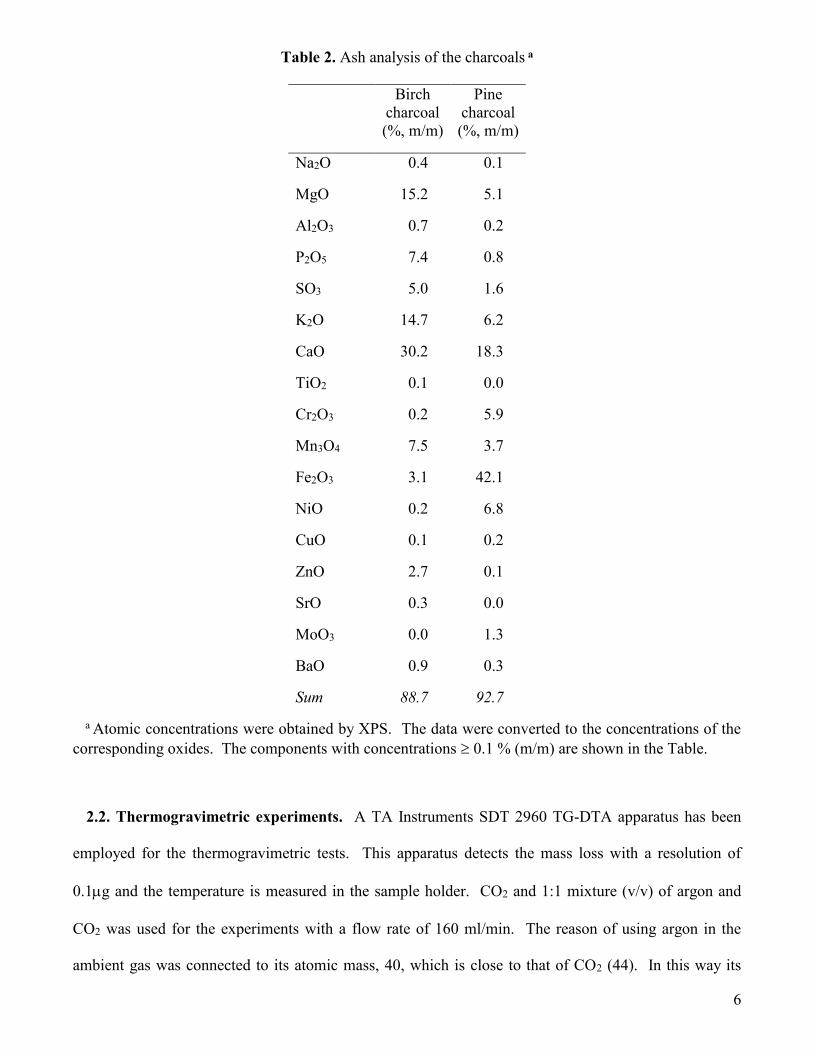
get particles of a size of 45-63 μm. The proximate analysis and the ash analysis of the samples are
presented in Tables 1 and 2. As these data show, the mineral matter content of these chars is low,
around 1%. The potassium concentration in the ash is considerable lower than those in the agricultural
products and wastes. The pine charcoal contains particularly high iron content, while the manganese
and zinc contents of the birch charcoal are also worth mentioning. These type of metallic ions may have
catalytic effects on the gasification.9

5
The BET specific surface areas of the charcoals were 7 and 6 m2/g for the birch and pine charcoals,
respectively. The amount of pores below 5 nm was negligible. The birch charcoal was found to be
mesoporous; 58% of its volume was found to be in pores below 50 nm. This value was less, 26% in the
pine charcoal. The specific surface areas of the samples were lower than the usual values for charcoals.
This may be due to the fast heating during the preparation. Various studies on charcoals and chars with
similar and lower specific surface areas have appeared in the literature. Among others, Várhegyi et al.12
studied the combustion kinetics of a corncob charcoal produced by a modern, high-yield charcoal
fabrication process. Its specific surface was 9 m2/g and its internal surfaces affected markedly the
combustion kinetics.12
Table 1. Proximate analysis of the charcoals and their raw materials
Birch
wood
Pine
wood
Birch
charcoal
Pine
charcoal
Volatiles / % db 87.9 86.8 19.2 20.4
Fixed carbon / % db 11.8 13.0 79.9 78.6
Ash / % db 0.3 0.2 1.0 1.1
6
Table 2. Ash analysis of the charcoals a
Birch
charcoal
(%, m/m)
Pine
charcoal
(%, m/m)
Na2O 0.4 0.1
MgO 15.2 5.1
Al2O3 0.7 0.2
P2O5 7.4 0.8
SO3 5.0 1.6
K2O 14.7 6.2
CaO 30.2 18.3
TiO2 0.1 0.0
Cr2O3 0.2 5.9
Mn3O4 7.5 3.7
Fe2O3 3.1 42.1
NiO 0.2 6.8
CuO 0.1 0.2
ZnO 2.7 0.1
SrO 0.3 0.0
MoO3 0.0 1.3
BaO 0.9 0.3
Sum 88.7 92.7
a Atomic concentrations were obtained by XPS. The data were converted to the concentrations of the
corresponding oxides. The components with concentrations 0.1 % (m/m) are shown in the Table.
2.2. Thermogravimetric experiments. A TA Instruments SDT 2960 TG-DTA apparatus has been
employed for the thermogravimetric tests. This apparatus detects the mass loss with a resolution of
0.1g and the temperature is measured in the sample holder. CO2 and 1:1 mixture (v/v) of argon and
CO2 was used for the experiments with a flow rate of 160 ml/min. The reason of using argon in the
ambient gas was connected to its atomic mass, 40, which is close to that of CO2 (44). In this way its
7
diffusion properties are also close to those of CO2. Particular care was taken to avoid the presence of
oxygen traces since the char + O2 reaction would influence the TGA curves. The TGA furnace was
purged before the heating program by the reactant gas for 20 min. Each TGA experiment started with a
30 min drying section at 110°C which provided an additional purge by the reactant gas. The CO2
gasification has a high endothermic reaction heat, 172.5 kJ/mol. Accordingly care was taken to exclude
the usual heat transfer problems. For this reason, low sample masses (1 – 2 mg) and relatively slow
heating rates (5 – 20°C/min) were employed.
Following our earlier work on the kinetics of the char + O2 reaction,12,20,21 we wished to base the work
on constant heating rate experiments as well as on temperature programs containing isothermal sections.
Such series of experiments contains more information for the determination of the unknown parameters
and for the verification of the model.23 As Figure 1 illustrates, the two charcoals have somewhat
different reactivity. Accordingly, different stepwise heating programs were planned for the two samples.
The temperature programs are shown in Figure 2. The isothermal sections were selected at 823 and
873°C for the birch charcoals and at 767 and 840°C for the pine charcoal. As the thin vertical lines
indicate in Figure 1, the reaction rate was high enough for accurate measurements at the lower selected
temperatures (823 and 767°C) and the reaction was still in the accelerating period at the higher selected
temperatures (873 and 840°C).

8
Temperature (°C)
Ma
ss lo
ss r
ate
(%
/min
)
400 500 600 700 800 900 1000
Birch charcoal
- - - Pine charcoal
0
1
2
3
4
5
6
7
8
9
Figure 1. Comparison of the mass loss rate curves of the Birch and Pine charcoals in 50% CO2 at
10°C/min. The thin vertical lines indicate the temperatures of the isothermal sections in the stepwise
heating programs shown in Figure 2.
Time (min)
Te
mp
era
ture
(°
C)
(a)
20°C/min with steps
20°C/min with steps
10°C/min
5°C/min
5°C/min with steps
0 50 100 150 200 250 300
200
300
400
500
600
700
800
900
1000
1100
Time (min)
Te
mp
era
ture
(°
C)
(b)
20°C/min with steps
10°C/min
10°C/min with steps
5°C/min
5°C/min with steps
0 50 100 150 200 250 300
200
300
400
500
600
700
800
900
1000
1100
Figure 2. Temperature programs for the birch (a) and the pine (b) charcoals. The linear heating
programs (- - -, - - -) were employed at both CO2 concentrations. The stepwise programs denoted by
circles (o o o) and solid lines (—, —) were used in the 50 and 100% CO2 experiments, respectively.
9
3. Modeling and Evaluation
Branca and Di Blasi proposed a 3 parallel reactions to describe the combustion of wood chars in air.19
The 1st and 2nd reactions referred to devolatilization steps while the 3rd reaction described the char
burn-off. The devolatilization steps were assumed to be simple 1st order reactions independent of the
oxygen concentration:
dj/dt = Aj exp(–Ej/RT) (1-j) (j=1 and 2) (2)
where j is the reacted fraction of the volatiles released in reaction j. The char burn-off reaction was
described by a variant of eq 1:
d3/dt = A’3 exp(-E3/RT) (1-3)n3 (3)
where the A’3 preexponential factor incorporates the dependence on the oxygen concentration. In the
present work we shall follow this way of modeling with two modifications.
(i) For the present work an explicit formula was needed to describe the dependence of the gasification
reaction on the CO2 concentration. We used the dimensionless relative CO2 concentration (V/V), CCO2
to ensure a proper dimension for A3 and employed the usual power law approximation:
d3/dt = A3 exp(-E3/RT) (1-3)n3 CCO2
(4)
(ii) We cannot exclude the possibilities of growing internal surfaces as predicted by the models
deduced for ideal carbons.13,14 To check this possibility we carried out the evaluation with an empirical
f() function that can mimic a wide variety of shapes:12,20,21,24
d3/dt = A3 exp(–E3/RT) f3(3) CCO2 (5)
f3(3) = normfactor (3 +z3)a3 (1-3)
n3 (6)
where a3, z3 and n3 are adjustable parameters and normfactor is a normalizing factor ensuring that
max f3(3) = 1. Equations 5 - 6 will be called “3-parameter f() function” in the treatment while eq 4
will be referred as power law f(). Note that equations 5 - 6 are identical with eq 4 when a3=0.
In this model, the overall reaction rate is a linear combination of the rates of the partial processes:
10
-dm/dt =
3
1
/j
jj dtdc (7)
where m(t) is the sample mass divided by the initial sample mass. Since the reacted fractions j run
from 0 to 1, cj equals to the normalized mass loss of the jth partial reaction. The unknown parameters of
the model are determined from a series of experiments by the method of least squares. The following
sum is minimized:
S =
exp
1 1
N
k
N
i
k
[ )( i
obs
k
tdt
dm
– )( i
calc
k
tdt
dm
]2
/ Nk / hk
2 (8)
Here subscript k indicates the experiments differing in CO2 partial pressure and/or heating program.
Nexp is the number of experiments evaluated simultaneously, ti denotes the time values in which the
digitized (dm/dt)obs values were taken, and Nk is the number of the ti points in a given experiment. hk
denotes the heights of the evaluated curves that strongly depend on the experimental conditions . The
division by hk2 serves for normalization. The obtained fit was characterized by the following quantity:
fit (%) = 100 S0.5 (9)
Eq 9 is also employed to express the fit of a subgroup within the evaluated experiments. In such cases
S is written for the given subgroup. A subgroup may be a single experiment, too.
4. Results and discussion
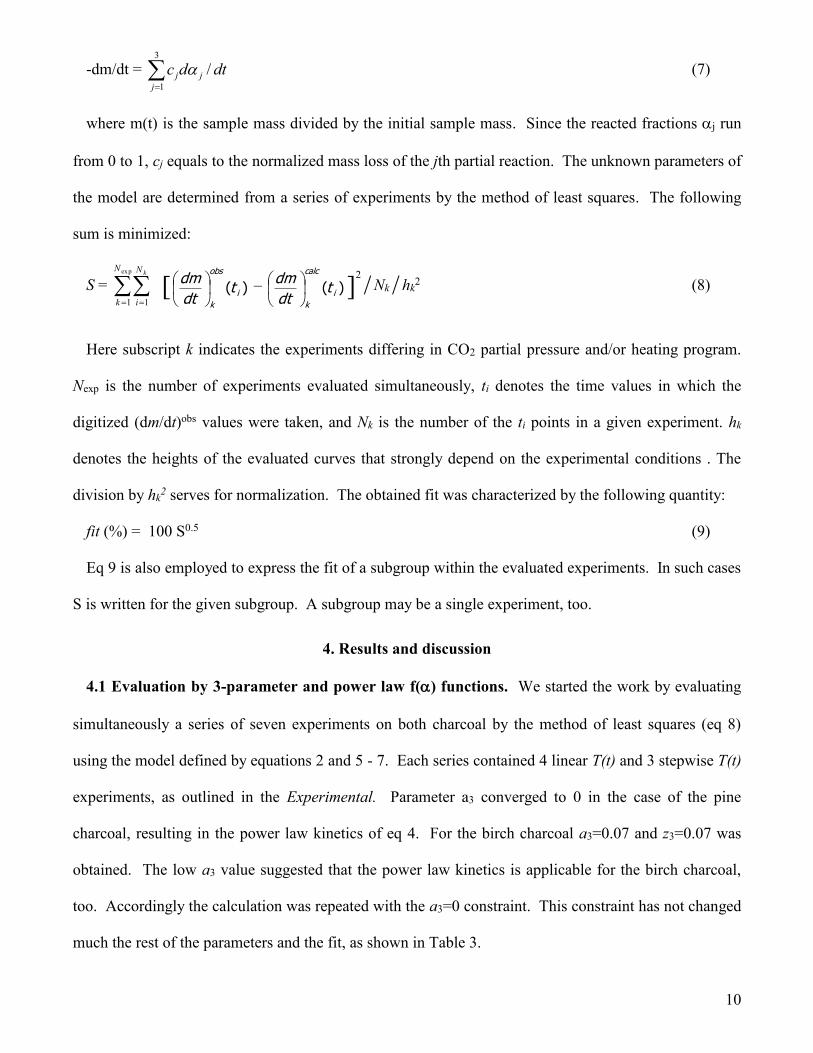
4.1 Evaluation by 3-parameter and power law f() functions. We started the work by evaluating
simultaneously a series of seven experiments on both charcoal by the method of least squares (eq 8)
using the model defined by equations 2 and 5 - 7. Each series contained 4 linear T(t) and 3 stepwise T(t)
experiments, as outlined in the Experimental. Parameter a3 converged to 0 in the case of the pine
charcoal, resulting in the power law kinetics of eq 4. For the birch charcoal a3=0.07 and z3=0.07 was
obtained. The low a3 value suggested that the power law kinetics is applicable for the birch charcoal,
too. Accordingly the calculation was repeated with the a3=0 constraint. This constraint has not changed
much the rest of the parameters and the fit, as shown in Table 3.

11
Table 3. The obtained kinetic parameters a
Evaluation 7 experiments of a sample
14 experiments
on both
samples
Sample Birch Birch Pine c Birch Pine
Model b
3-para-
meter
f()
Power
law
f()
3-para-
meter
f()
Power law f()
Fit (%) 5.01 5.06 5.56 5.11 5.66
E1 / kJ mol-1 125 130 100 118 118
E2 / kJ mol-1 166 170 143 149 149
E3 / kJ mol-1 262 262 263 262 262
log10 A1/s-1 4.99 5.30 3.38 4.62 4.47
log10 A2/s-1 5.77 6.06 4.47 5.00 4.82
log10 A3/s-1 8.94 8.99 9.28 9.02 9.25
n3 0.47 0.44 0.74 0.44 0.75
a3 0.07 0 0 0 0
z3 0.07 - - - -
3 0.37 0.36 0.49 0.40 0.40
c1 0.08 0.08 0.09 0.08 0.08
c2 0.10 0.09 0.13 0.10 0.13
c3 0.82 0.83 0.78 0.83 0.78
a The partial reactions are visualized in Figures 3 and 4 where line styles , — and - - - belong to
partial reactions 1, 2 and 3, respectively.
b “3-parameter f()” and “Power law f()” refer to equations 5 - 6 and 4, respectively.
c The evaluation of the pine experiment by equations 5-6 resulted in the power law model (a3=0).
Note that z3 is undefined if a3=0.
The shapes of the obtained f3(3) functions are presented in Fig 3. One can see that the f3(3) of birch
charcoal has higher curvature while that of the pine charcoal is closer to the shrinking core model. This
may be due to the higher pore volume in the birch charcoal, as outlined in the Experimental.

12
3
f 3(
3)
+ +
+
+ Birch, f()=
(+0.07)0.07
(1-)0.47
/ 0.99
Birch, f()=(1-)0.44
- - - Pine, f()=(1-)0.74
Shrinking core model, f()=(1-)2/3
0.0 0.2 0.4 0.6 0.8 1.0
0.0
0.1
0.2
0.3
0.4
0.5
0.6
0.7
0.8
0.9
1.0
Figure 3. The obtained empirical f() functions for the 3rd reaction (gasification). The shrinking core
model, f()=(1-)2/3 is indicated for comparison.
4.2 Evaluation of both charcoals assuming common activation energies and . As Table 3 shows,
we obtained practically the same activation energies for the gasification step of the two charcoals. The
activation energies of the devolatilization steps, E1 and E2 were different. However, these reactions
belong to low, flat peaks with a high degree of overlap, as it will be shown later, in Figures 4 and 5.
Test calculations revealed that the least squares sum is not sensitive on the values of E1 and E2: if their
values are altered, the remaining parameters can compensate the change. Accordingly, one can find
common values for E1 and E2 without a noticeable worsening of the fit. In another test calculation we
checked the variance of the least squares sum on , and found that the assumption of a common for
both charcoals only slightly changes the fit. In this way we obtained a model in which E1, E2, E3 and
was common for both charcoals. Parameters A1, A2 and A3 expressed the reactivity differences between
the charcoals, since the rate constants are proportional to the corresponding preexponential factors.
Parameter n3 determines the shape of the corresponding f3(3) that may be different in the two charcoals
due to the differences in their pore distribution while c1, c2 and c3 can describe the compositional
differences between the charcoals. Accordingly the 14 experiments of the two charcoals were evaluated
together with these assumptions. In this evaluation 18 unknown parameters were determined from the
14 experiments by the method of least squares: common values for Ej and (4 parameters) and
13
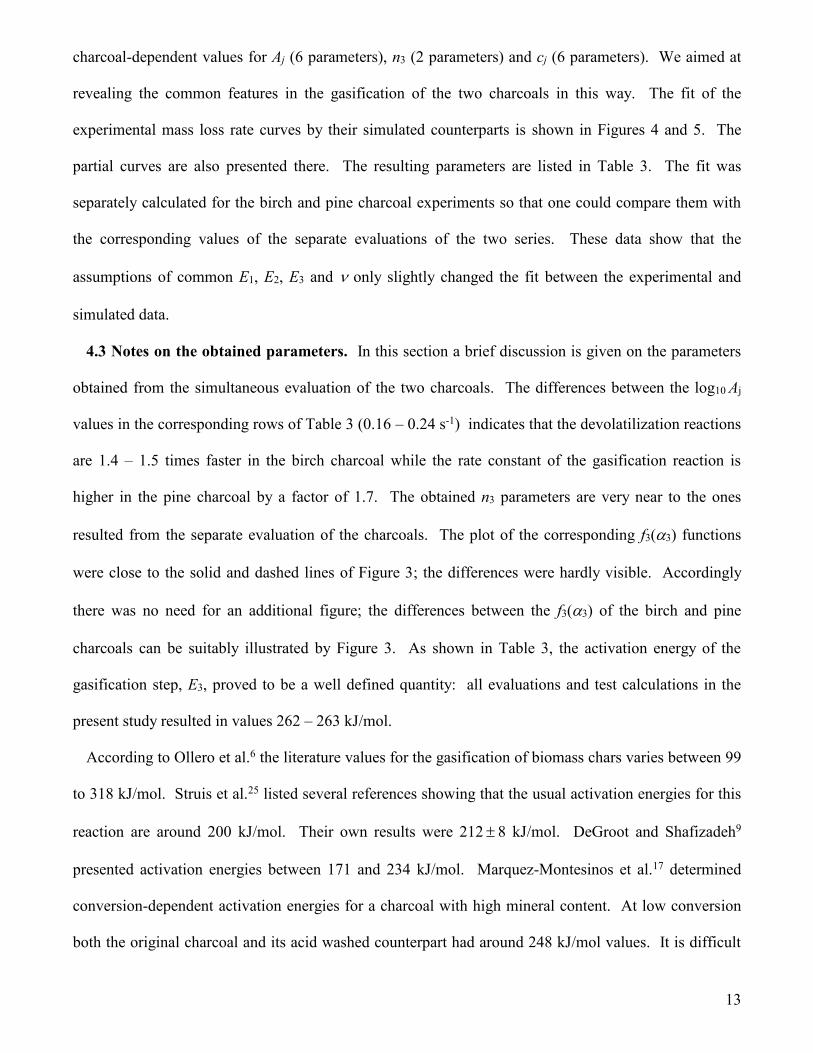
charcoal-dependent values for Aj (6 parameters), n3 (2 parameters) and cj (6 parameters). We aimed at
revealing the common features in the gasification of the two charcoals in this way. The fit of the
experimental mass loss rate curves by their simulated counterparts is shown in Figures 4 and 5. The
partial curves are also presented there. The resulting parameters are listed in Table 3. The fit was
separately calculated for the birch and pine charcoal experiments so that one could compare them with
the corresponding values of the separate evaluations of the two series. These data show that the
assumptions of common E1, E2, E3 and only slightly changed the fit between the experimental and
simulated data.
4.3 Notes on the obtained parameters. In this section a brief discussion is given on the parameters
obtained from the simultaneous evaluation of the two charcoals. The differences between the log10 Aj
values in the corresponding rows of Table 3 (0.16 – 0.24 s-1) indicates that the devolatilization reactions
are 1.4 – 1.5 times faster in the birch charcoal while the rate constant of the gasification reaction is
higher in the pine charcoal by a factor of 1.7. The obtained n3 parameters are very near to the ones
resulted from the separate evaluation of the charcoals. The plot of the corresponding f3(3) functions
were close to the solid and dashed lines of Figure 3; the differences were hardly visible. Accordingly
there was no need for an additional figure; the differences between the f3(3) of the birch and pine
charcoals can be suitably illustrated by Figure 3. As shown in Table 3, the activation energy of the
gasification step, E3, proved to be a well defined quantity: all evaluations and test calculations in the
present study resulted in values 262 – 263 kJ/mol.
According to Ollero et al.6 the literature values for the gasification of biomass chars varies between 99
to 318 kJ/mol. Struis et al.25 listed several references showing that the usual activation energies for this
reaction are around 200 kJ/mol. Their own results were 212 8 kJ/mol. DeGroot and Shafizadeh9
presented activation energies between 171 and 234 kJ/mol. Marquez-Montesinos et al.17 determined
conversion-dependent activation energies for a charcoal with high mineral content. At low conversion
both the original charcoal and its acid washed counterpart had around 248 kJ/mol values. It is difficult
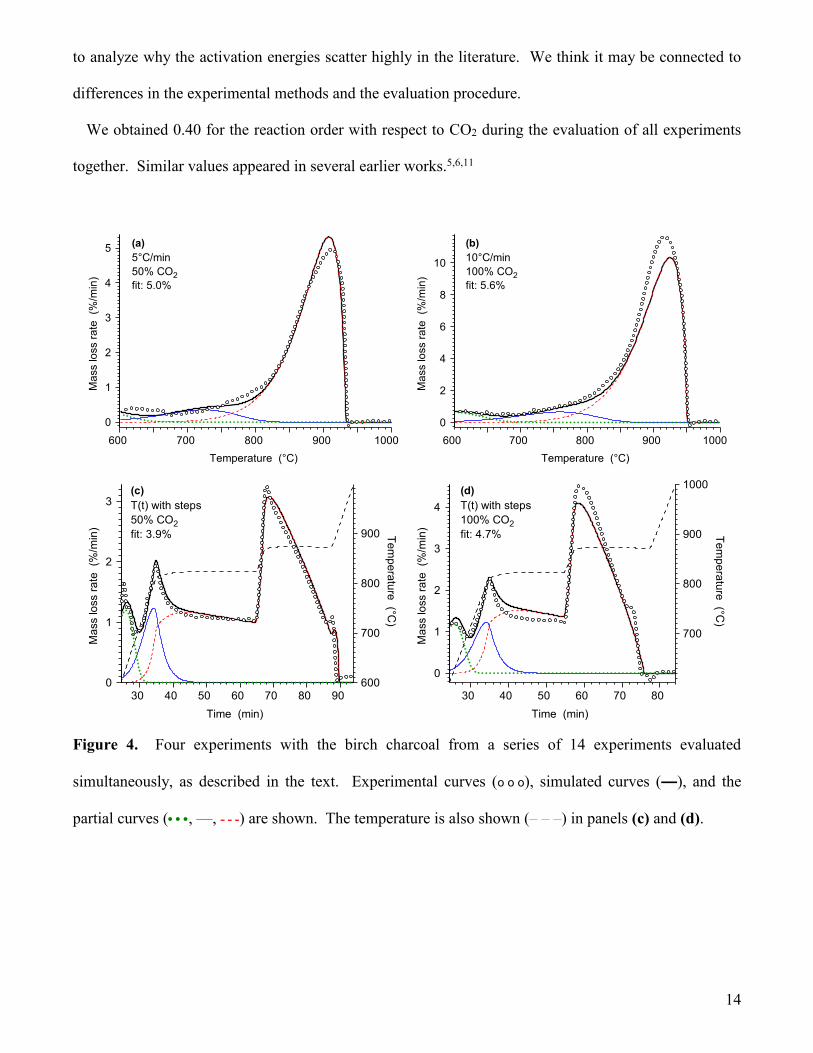
14
to analyze why the activation energies scatter highly in the literature. We think it may be connected to
differences in the experimental methods and the evaluation procedure.
We obtained 0.40 for the reaction order with respect to CO2 during the evaluation of all experiments
together. Similar values appeared in several earlier works.5,6,11
Temperature (°C)
Ma
ss lo
ss r
ate
(%
/min
)
600 700 800 900 1000
(a)
5°C/min
50% CO2
fit: 5.0%
0
1
2
3
4
5
Temperature (°C)
Ma
ss lo
ss r
ate
(%
/min
)
600 700 800 900 1000
(b)
10°C/min
100% CO2
fit: 5.6%
0
2
4
6
8
10
Time (min)
Ma
ss lo
ss r
ate
(%
/min
) Te
mp
era
ture
(°C)
30 40 50 60 70 80 90
(c)
T(t) with steps
50% CO2
fit: 3.9%
0
1
2
3
600
700
800
900
Time (min)
Ma
ss lo
ss r
ate
(%
/min
) Te
mp
era
ture
(°C)
30 40 50 60 70 80
(d)
T(t) with steps
100% CO2
fit: 4.7%
0
1
2
3
4
700
800
900
1000
Figure 4. Four experiments with the birch charcoal from a series of 14 experiments evaluated
simultaneously, as described in the text. Experimental curves (o o o), simulated curves (—), and the
partial curves ( , —, - - -) are shown. The temperature is also shown (– – –) in panels (c) and (d).

15
Temperature (°C)
Ma
ss lo
ss r
ate
(%
/min
)
600 700 800 900 1000
(a)
5°C/min
50% CO2
fit: 7.6%
0
1
2
3
4
Temperature (°C)
Ma
ss lo
ss r
ate
(%
/min
)
600 700 800 900 1000
(b)
10°C/min
100% CO2
fit: 5.0%
0
1
2
3
4
5
6
7
8
Time (min)
Ma
ss lo
ss r
ate
(%
/min
) Te
mp
era
ture
(°C)
40 60 80 100 120
(c)
T(t) with steps
50% CO2
fit: 3.4%
0
1
2
600
700
800
Time (min)
Ma
ss lo
ss r
ate
(%
/min
) Te
mp
era
ture
(°C)
100 125 150 175 200 225 250 275
(d)
T(t) with steps
100% CO2
fit: 4.0%
0
1
2
700
800
900
Figure 5. Four experiments with pine charcoals from a series of 14 experiments evaluated
simultaneously, as described in the text. (See the notation at Figure 3.)
5. Conclusions.
The gasification kinetics of two charcoals were determined using TGA experiments with linear and
stepwise T(t) programs. The method of least squares was used. Contrary to the isothermal studies when
one has to wait for the stabilization of the experimental conditions, we studied the whole gasification
process. A particular care was given to ensure a true kinetic control by employing much lower sample
masses than it is usual in the TGA studies on the gasification of biomass chars. The results were
justified by the fit between the experimental and calculated data in series of 7 and 14 experiments.
The devolatilization of the charcoal was described by the way proposed earlier by Branca and Di
Blasi19 for charcoal combustion. The dependence of the gasification on the conversion was examined
16
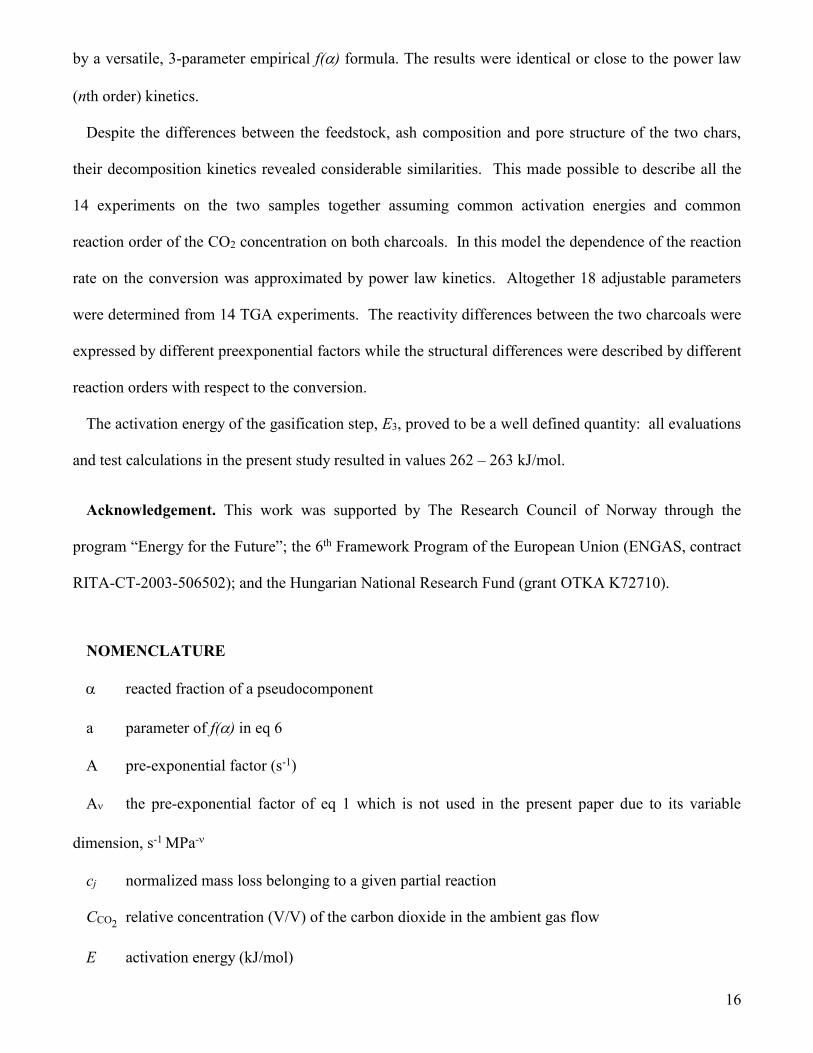
by a versatile, 3-parameter empirical f() formula. The results were identical or close to the power law
(nth order) kinetics.
Despite the differences between the feedstock, ash composition and pore structure of the two chars,
their decomposition kinetics revealed considerable similarities. This made possible to describe all the
14 experiments on the two samples together assuming common activation energies and common
reaction order of the CO2 concentration on both charcoals. In this model the dependence of the reaction
rate on the conversion was approximated by power law kinetics. Altogether 18 adjustable parameters
were determined from 14 TGA experiments. The reactivity differences between the two charcoals were
expressed by different preexponential factors while the structural differences were described by different
reaction orders with respect to the conversion.
The activation energy of the gasification step, E3, proved to be a well defined quantity: all evaluations
and test calculations in the present study resulted in values 262 – 263 kJ/mol.
Acknowledgement. This work was supported by The Research Council of Norway through the
program “Energy for the Future”; the 6th Framework Program of the European Union (ENGAS, contract
RITA-CT-2003-506502); and the Hungarian National Research Fund (grant OTKA K72710).
NOMENCLATURE
reacted fraction of a pseudocomponent
a parameter of f() in eq 6
A pre-exponential factor (s-1)
A the pre-exponential factor of eq 1 which is not used in the present paper due to its variable
dimension, s-1 MPa-
cj normalized mass loss belonging to a given partial reaction
CCO2 relative concentration (V/V) of the carbon dioxide in the ambient gas flow
E activation energy (kJ/mol)

17
f() a function expressing the dependence of the reaction rate on the conversion
fit 100 S0.5 (%)
h height of a -dmobs/dt curve
m normalized sample mass (dimensionless)
mcalc(t) normalized sample mass calculated from a model
mobs(t) mass of the sample divided by the initial sample mass
formal reaction order with respect to PCO2 or CCO2
in equations 1, 4, 5
n formal reaction order with respect to (1-) in equations 3, 4, 6.
Nexp number of experiments evaluated simultaneously
Nk number of evaluated data on the kth experimental curve
PCO2 partial pressure of CO2 (kPa)
R gas constant (8.3143×10⁻³ kJ mol-1 K-1)
S least squares sum
t time (s)
T temperature (°C, K)
z parameter of f() in eq 6
Subscripts:
i digitized point on an experimental curve
j pseudocomponent
k experiment

18
REFERENCES
(1) Antal, M. J.; Mochidzuki, K.; Paredes, L. S. Flash carbonization of biomass. Ind. Eng. Chem.
Res. 2003, 42, 3690.
(2) Antal, M. J.; Grønli, M. G. The art, science, and technology of charcoal production. Ind. Eng.
Chem. Res. 2003, 42, 1919.
(3) Di Blasi, C. Combustion and gasification rates of lignocellulosic chars. Progr. Energy Combust.
Sci. 2008, doi:10.1016/j.pecs.2008.08.001.
(4) Laurendeau, N. M. Heterogeneous kinetics of coal char gasification and combustion. Prog.
Energy Combust. Sci. 1978, 4, 221–270.
(5) Barrio, M.; Hustad, J. E. CO2 gasification of birch and the effect of CO inhibition on the
calculation of chemical kinetics. In Progress in Thermochemical Biomass Conversion;
Bridgwater, A. V., Ed.; Blackwell Science Ltd., p. 47-60.
(6) Ollero, P; Serrera, A.; Arjona, R.; Alcantarilla, S. The CO2 gasification kinetics of olive residue.
Biomass Bioenergy 2003; 24, 151-161.
(7) Klose, W; Wölki, M. On the intrinsic reaction rate of biomass char gasification with carbon
dioxide and steam. Fuel 2005, 84, 885-892.
(8) Scott, S. A.; Davidson, J. F.; Dennis, J. S.; Fennell, P. S.; Hayhurst, A. N. The rate of
gasification by CO2 of chars from waste. Proc. Combust. Inst. 2005, 30, 2151–2159.
(9) De Groot, W. F.; Shafizadeh, F. Kinetics of Douglas fir and cottonwood chars by carbon
dioxide. Fuel 1984, 63, 210-216.
(10) Cozzani, V. Reactivity in oxygen and carbon dioxide of char formed in the pyrolysis of refuse-
derived fuel. Ind. Eng. Chem. Res. 2000, 39, 864-872.
(11) Gómez-Barea, A.; Ollero, P.; Fernández-Baco, C. Diffusional effects in CO2 gasification
experiments with single biomass char particles. 1. Experimental investigation. Energy & Fuels
2006, 20, 2202-2210.
(12) Várhegyi, G.; Mészáros, E.; Antal, M. J., Jr.; Bourke, J.; Jakab, E. Combustion kinetics of
corncob charcoal and partially demineralized corncob charcoal in the kinetic regime. Ind. Eng.
Chem. Res. 2006, 45, 4962-4970.
(13) Bhatia; S. K; Perlmutter, D. D. A random pore model for fluid–solid reactions: I. Isothermal
kinetic control. AIChE J. 1980, 26, 379.

19
(14) Gavalas, G. R. A random capillary model with application to char gasification at chemically
controlled rates. AIChE J. 1980, 26, 577.
(15) Sun, Zh. Q; Wu, J. H; Zhang, D. CO2 and H2O gasification kinetics of a coal char in the
presence of methane. Energy Fuels 2008, 22, 2160–2165.
(16) Zolin, A.; Jensen, A.; Jensen, P.A.;, Frandsen, F.; Dam-Johansen, K. The influence of inorganic
materials on the thermal deactivation of fuel chars. Energy Fuels 2001, 15, 1110-1122
(17) Marquez-Montesinos, F.; Cordero, T.; Rodriguez-Mirasol, J.; Rodriguez, J. J. CO2 and steam
gasification of a grapefruit skin char. Fuel 2002, 81, 423-429.
(18) Di Blasi, C.; Buonanno, F.; Branca, C. Reactivities of some biomass chars in air. Carbon 1999,
37, 1227.
(19) Branca, C.; Di Blasi, C. Global kinetics of wood char devolatilization and combustion. Energy
Fuels 2003, 17, 1609.
(20) Várhegyi, G.; Szabó, P.; Jakab, E.; Till, F.; Richard J-R. Mathematical modeling of char
reactivity in Ar-O2 and CO2-O2 mixtures. Energy Fuels 1996, 10, 1208.
(21) Várhegyi, G.; Szabó, P.; Jakab, E.; Till, F. Least squares criteria for the kinetic evaluation of
thermoanalytical experiments. Examples from a char reactivity study. J. Anal. Appl. Pyrolysis
2001, 57, 203.
(22) Zhang, Y.; Ashizawa, M.; Kajitani, S.; Miura K. Proposal of a semi-empirical kinetic model to
reconcile with gasification reactivity profiles of biomass chars. Fuel 2008, 87, 475-481.
(23) Várhegyi, G. Aims and methods in non-isothermal reaction kinetics. J. Anal. Appl. Pyrolysis
2007, 79, 278-288.
(24) Várhegyi, G.; Pöppl, L.; Földvári, I. Kinetics of the oxidation of bismuth tellurite, Bi2TeO5:
Empirical model and least squares evaluation strategies to obtain reliable kinetic information.
Thermochim. Acta 2003, 399, 225.
(25) Struis, R. P. W. J.; von Scala, C.; Stucki, S.; Prins, R. Gasification reactivity of charcoal with
CO2. Part I: conversion and structural phenomena. Chem. Eng. Sci. 2002, 57, 3581-3592.

![SW MATM through ZONE - Cisco · %SW_MATM-4-MACFLAP_NOTIF:Host[enet]in[chars][dec]isflappingbetweenport[chars]andport [chars] Recommended Checkthenetworkforpossibleloops. Action %SW_MATM-4-WIRELESS](https://img.dokumen.tips/doc/110x75/5f7c820f9a0d1f3f5c674488/sw-matm-through-zone-cisco-swmatm-4-macflapnotifhostenetincharsdecisflappingbetweenportcharsandport.jpg)


![Kinetic models comparison for non-isothermal steam gasification … · 2016. 6. 11. · There are several studies on coal gasification kinetics [15-17] and some on biomass gasification](https://img.dokumen.tips/doc/110x75/60bf86a58ef8a32d554618f3/kinetic-models-comparison-for-non-isothermal-steam-gasification-2016-6-11-there.jpg)