Embed Size (px)
Citation preview
CMAQ Evaluation Preliminary 2002 version C
WRAP 2002 Visibility Modeling:Annual CMAQ Performance Evaluation using
Preliminary 2002 version C Emissions
Gail Tonnesen, Bo Wang, Chao-Jung Chien, Zion Wang, Mohammad OmaryUniversity of California, Riverside
Zac Adelman, Andy HollandUniversity of North Carolina
Ralph Morris et al.ENVIRON Corporation Int., Novato, CA

CMAQ Evaluation Preliminary 2002 version C
Summary of RMC 2002 Modeling
• Annual MM5 Simulations run at the RMC in December 2003 (additional MM5 testing in progress)
• Emissions processed with SMOKE– Preliminary 2002 Scenario C used here.
• CMAQ version 4.3 (released October 2003)
• Data summaries, QA, results are posted on the RMC web page: www.cert.ucr.edu/aqm/308
CMAQ Evaluation Preliminary 2002 version C
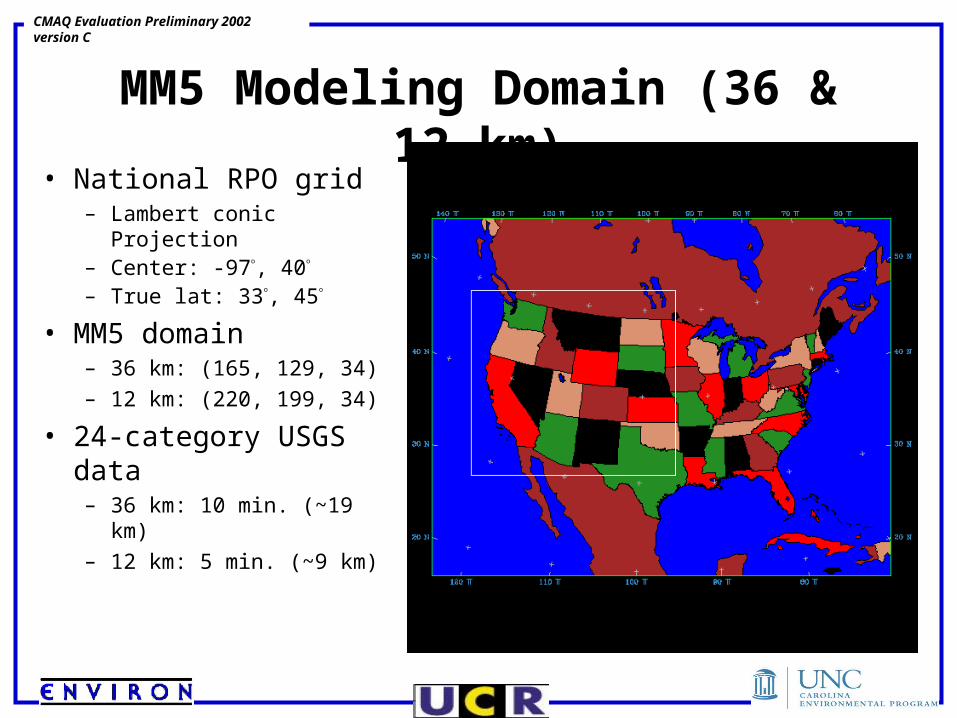
MM5 Modeling Domain (36 & 12 km)
• National RPO grid– Lambert conic Projection– Center: -97o, 40o
– True lat: 33o, 45o
• MM5 domain– 36 km: (165, 129, 34)
– 12 km: (220, 199, 34)
• 24-category USGS data– 36 km: 10 min. (~19 km)
– 12 km: 5 min. (~9 km)
CMAQ Evaluation Preliminary 2002 version C
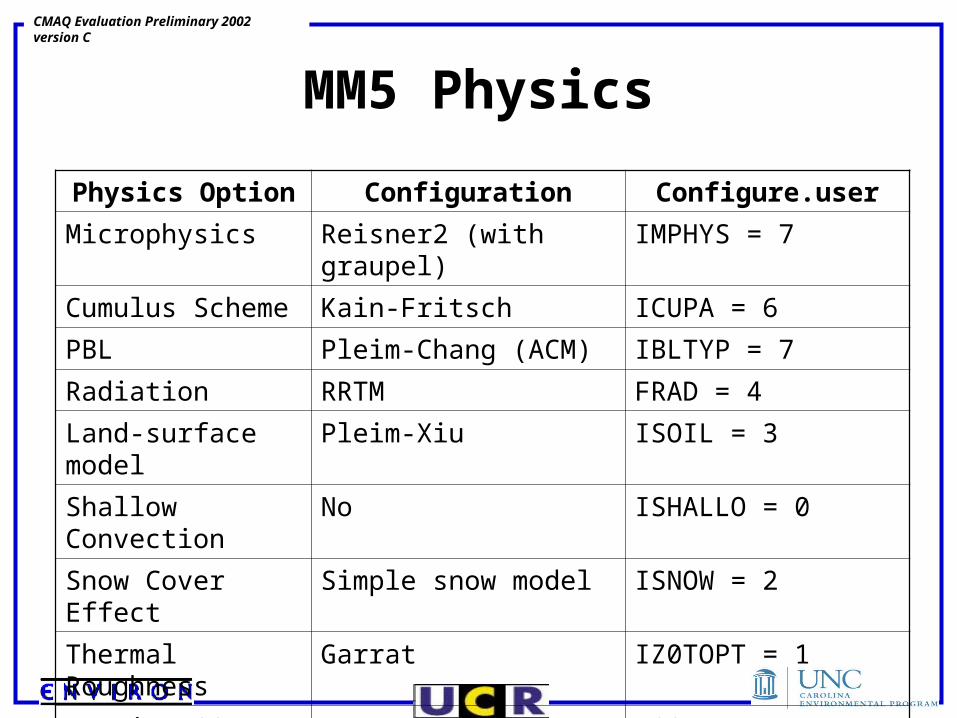
MM5 Physics
Physics Option Configuration Configure.user
Microphysics Reisner2 (with graupel) IMPHYS = 7
Cumulus Scheme Kain-Fritsch ICUPA = 6
PBL Pleim-Chang (ACM) IBLTYP = 7
Radiation RRTM FRAD = 4
Land-surface model Pleim-Xiu ISOIL = 3
Shallow Convection No ISHALLO = 0
Snow Cover Effect Simple snow model ISNOW = 2
Thermal Roughness Garrat IZ0TOPT = 1
Varying SST Yes ISSTVAR = 1
Time step 90 seconds (PX uses an internal timestep of 40 seconds)
CMAQ Evaluation Preliminary 2002 version C
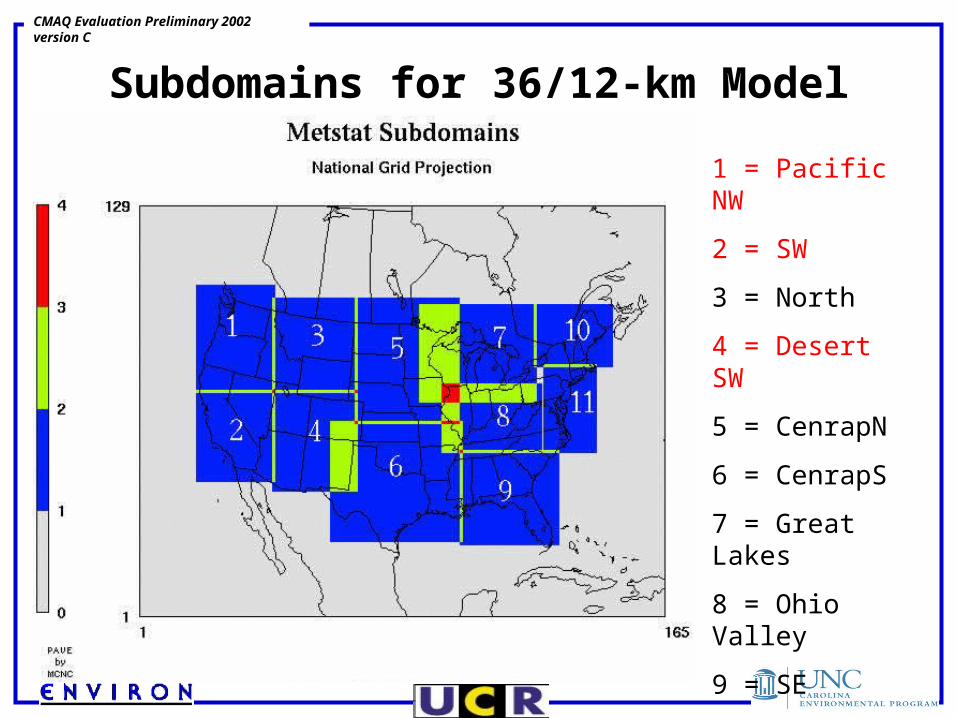
Subdomains for 36/12-km Model Evaluation
1 = Pacific NW
2 = SW
3 = North
4 = Desert SW
5 = CenrapN
6 = CenrapS
7 = Great Lakes
8 = Ohio Valley
9 = SE
10 = NE
11 = MidAtlantic

CMAQ Evaluation Preliminary 2002 version C
Evaluation Review
• Evaluation Methodology– Synoptic Evaluation– Statistical Evaluation using METSTAT and surface data
• WS, WD, T, RH– Evaluation against upper-air obs
• Statistics:– Absolute Bias and Error, RMSE, IOA (Index of Agreement)
• Evaluation Datasets:– NCAR dataset ds472 airport surface met observations– Twice-Daily Upper-Air Profile Obs (~120 in US)
• Temperature• Moisture

CMAQ Evaluation Preliminary 2002 version C
METSTAT Evaluation Package
• Statistics:– Absolute Bias and Error, RMSE, IOA
• Daily and, where appropriate, hourly evaluation• Statistical Performance Benchmarks
– Based on an analysis of > 30 MM5 and RAMS runs – Not meant as a pass/fail test, but to put modeling results
into perspective Wind Speed Wind Direction Temperature Humidity RMSE 2 m/s Mean Bias 0.5m/s 10 0.5K 1g/kg Index of Agreement 0.6 0.8 0.6 Gross Error 30 2K 2g/kg

CMAQ Evaluation Preliminary 2002 version C
Evaluation of 36-km WRAP MM5 Results
• Model performed reasonably well for eastern subdomains, but not the west (WRAP region)– General cool moist bias in Western US– Difficulty with resolving Western US orography?
• May get better performance with higher resolution– Pleim-Xiu scheme optimized more for eastern US?
• More optimization needed for desert and rocky ground?
• MM5 performs better in winter than in summer– Weaker forcing in summer
• July 2002 Desert SW subdomain exhibits low temperature and high humidity bias
2002 MM5 Model Evaluation 12 vs. 36 km Results Chris Emery, Yiqin Jia, Sue Kemball-Cook, and Ralph Morris (ENVIRON International Corporation) & Zion Wang (UCR CE-CERT), Western Regional Air Partnership (WRAP) National RPO Meeting, May 25, 2004
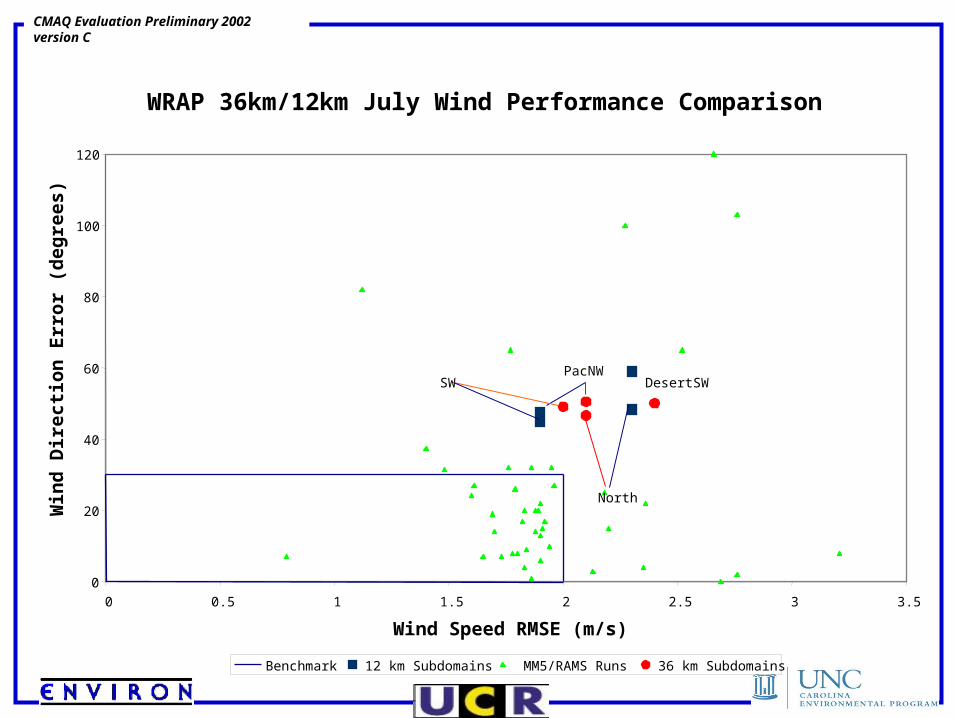
CMAQ Evaluation Preliminary 2002 version C
WRAP 36km/12km July Wind Performance Comparison
0
20
40
60
80
100
120
0 0.5 1 1.5 2 2.5 3 3.5
Wind Speed RMSE (m/s)
Win
d D
irec
tio
n E
rro
r (d
egre
es)
Benchmark 12 km Subdomains MM5/RAMS Runs 36 km Subdomains
DesertSW
North
SWPacNW
CMAQ Evaluation Preliminary 2002 version C
CMAQ Evaluation Preliminary 2002 version C
WRAP 36km/12km July Temperature Performance Comparison
0
0.5
1
1.5
2
2.5
3
3.5
4
4.5
-2 -1.5 -1 -0.5 0 0.5 1 1.5 2
Temperature Bias (K)
Tem
ep
ratu
re E
rro
r (K
)
Benchmark 12 km Subdomain MM5/RAMS Runs 36 km Subdomains
DesertSW
SW
North
PacNW
Desert SW
SWNorth
PacNW

CMAQ Evaluation Preliminary 2002 version C
WRAP 36km/12km July Humidity Performance Comparison
0
1
2
3
4
5
-3 -2 -1 0 1 2 3
Humidity Bias (g/kg)
Hu
mid
ity
Err
or
(g/k
g)
Benchmark 12km Subdomains MM5/RAMS Runs 36 km Subdomains
DesertSW
NorthSWPacNW

CMAQ Evaluation Preliminary 2002 version C
Additional MM5 Testing
• The RMC is continuing to test alternative MM5 configurations – to be completed at the end of 2004.
• Final MM5 results will be used with final 2002 emissions inventory, beginning early 2005.

CMAQ Evaluation Preliminary 2002 version C
Emissions Inventory Summary
• Preliminary 2002 Scenario C based on the 1996 NEI, grown to 2002, with many updates by WRAP contractors and other RPOs.
• Processed for CMAQ using SMOKE.
• Extensive QA plots on the web page– Both SMOKE QA and post-SMOKE QA
CMAQ Evaluation Preliminary 2002 version C
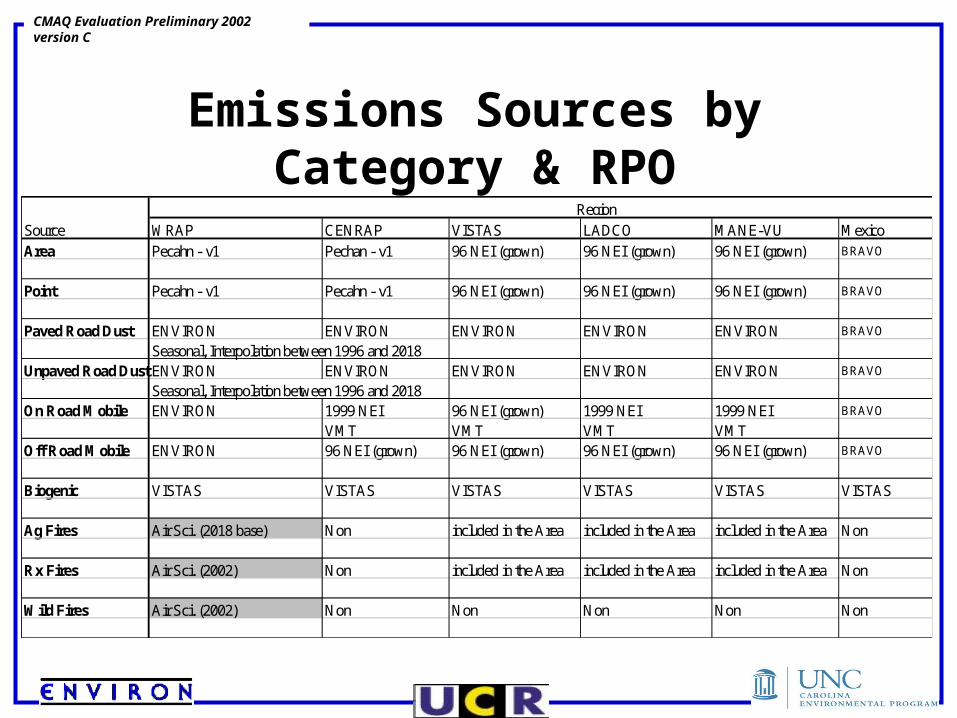
Emissions Sources by Category & RPO
WRAP CENRAP VISTAS LADCO MANE-VU MexicoArea Pecahn - v1 Pechan - v1 96 NEI (grown) 96 NEI (grown) 96 NEI (grown) BRAVO
Point Pecahn - v1 Pecahn - v1 96 NEI (grown) 96 NEI (grown) 96 NEI (grown) BRAVO
Paved Road Dust ENVIRON ENVIRON ENVIRON ENVIRON ENVIRON BRAVO
Seasonal, Interpolation between 1996 and 2018Unpaved Road Dust ENVIRON ENVIRON ENVIRON ENVIRON ENVIRON BRAVO
Seasonal, Interpolation between 1996 and 2018On Road Mobile ENVIRON 1999 NEI 96 NEI (grown) 1999 NEI 1999 NEI BRAVO
VMT VMT VMT VMTOff Road Mobile ENVIRON 96 NEI (grown) 96 NEI (grown) 96 NEI (grown) 96 NEI (grown) BRAVO
Biogenic VISTAS VISTAS VISTAS VISTAS VISTAS VISTAS
Ag Fires Air Sci. (2018 base) Non included in the Area included in the Area included in the Area Non
Rx Fires Air Sci. (2002) Non included in the Area included in the Area included in the Area Non
Wild Fires Air Sci. (2002) Non Non Non Non Non
SourceRegion

CMAQ Evaluation Preliminary 2002 version C
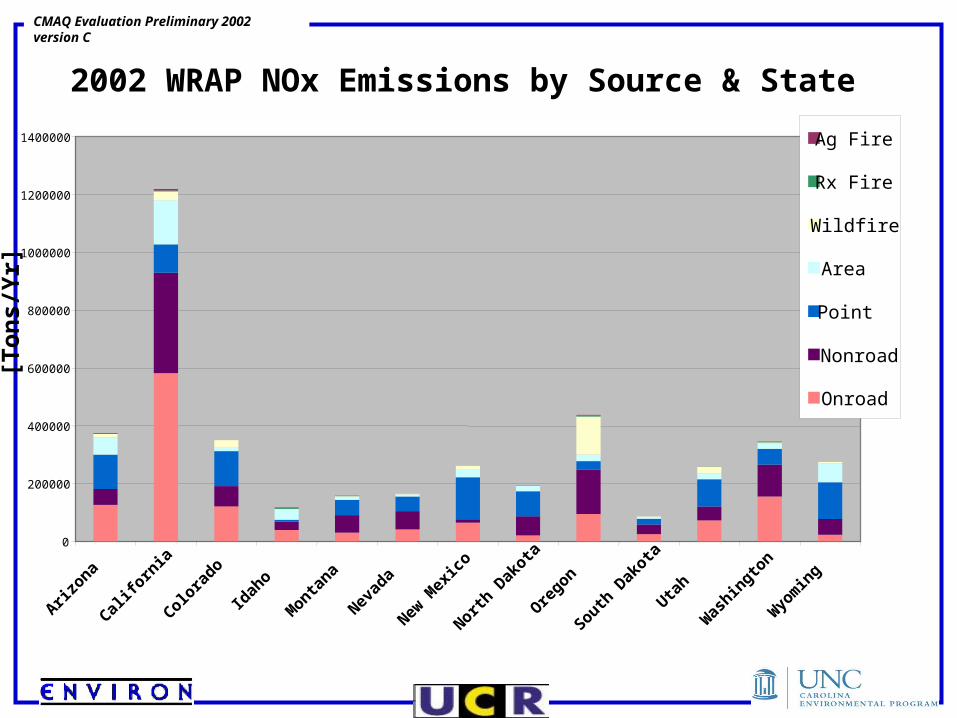
WRAP 2002 Annual NOx Emissions
AreaBiogenicOn RoadNon RoadRoad DustPointRx FireAg FireWildfireOffshore
CMAQ Evaluation Preliminary 2002 version C
2002 WRAP NOx Emissions by Source & State
0
200000
400000
600000
800000
1000000
1200000
1400000
Ariz
ona
Cal
iforn
ia
Colo
rado
Idah
o
Monta
na
Nev
ada
New
Mex
ico
North
Dak
ota
Ore
gon
South
Dak
ota
Uta
h
Was
hingto
n
Wyo
min
g
[To
ns/
Yr]
Ag Fire
Rx Fire
Wildfire
Area
Point
Nonroad
Onroad
CMAQ Evaluation Preliminary 2002 version C
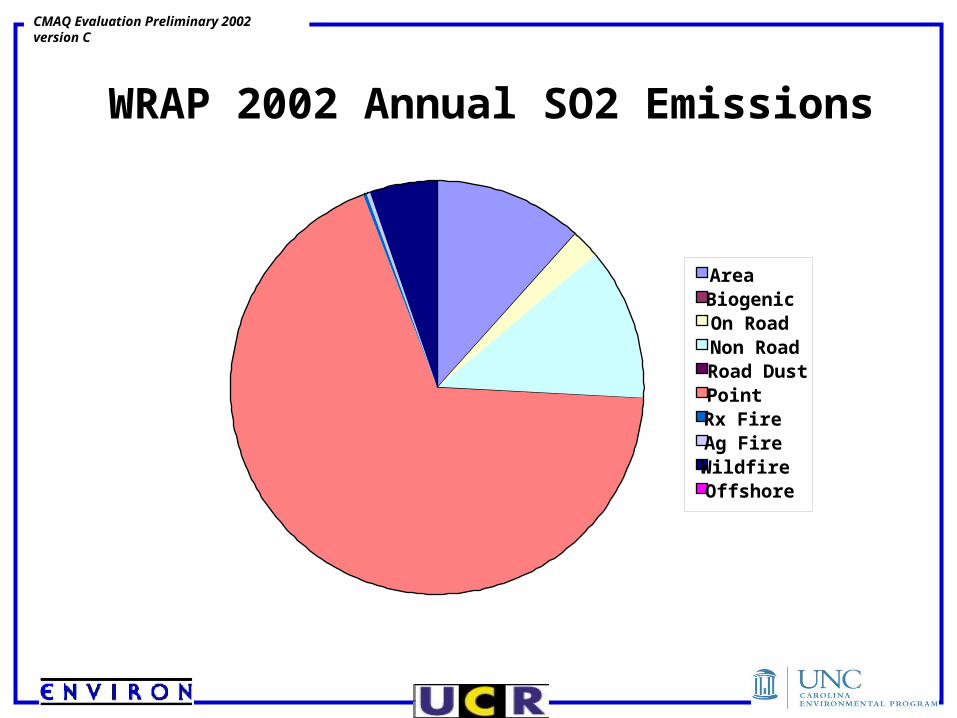
WRAP 2002 Annual SO2 Emissions
AreaBiogenicOn RoadNon RoadRoad DustPointRx FireAg FireWildfireOffshore

CMAQ Evaluation Preliminary 2002 version C
2002 WRAP SO2 Emissions by Source & State
0.00E+00
5.00E+04
1.00E+05
1.50E+05
2.00E+05
2.50E+05
3.00E+05
Ariz
ona
Cal
iforn
ia
Colo
rado
Idah
o
Monta
na
Nev
ada
New
Mex
ico
North
Dak
ota
Ore
gon
South
Dak
ota
Uta
h
Was
hingto
n
Wyo
min
g
[To
ns
/Yr]
Onroad
Ag Fire
Rx Fire
Wildfire
Area
Nonroad
Point
CMAQ Evaluation Preliminary 2002 version C
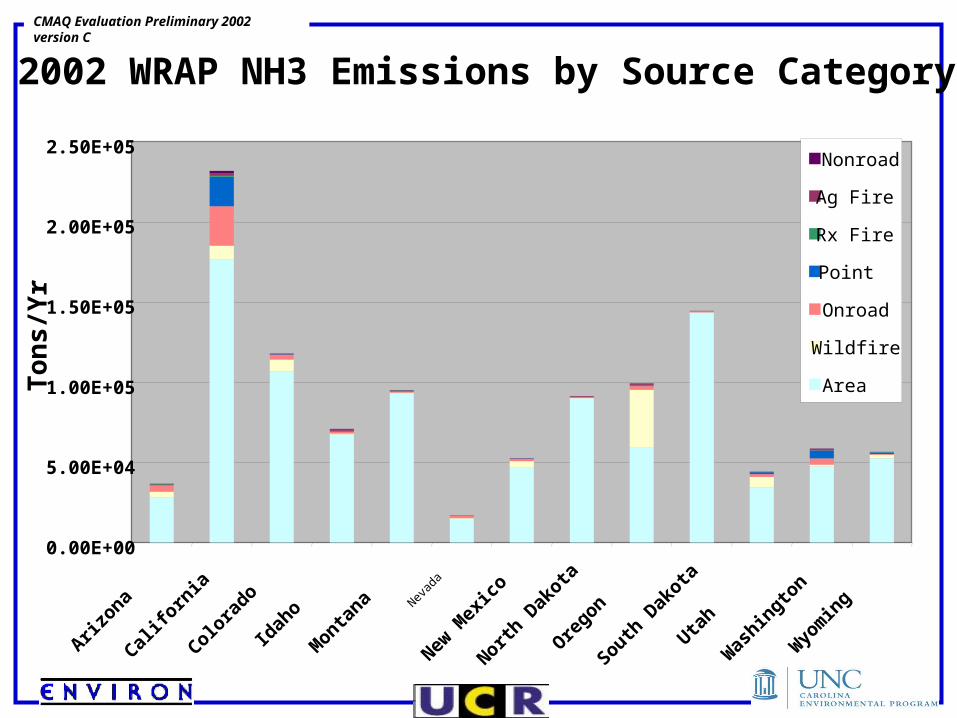
2002 WRAP NH3 Emissions by Source Category
0.00E+00
5.00E+04
1.00E+05
1.50E+05
2.00E+05
2.50E+05
Ariz
ona
Cal
iforn
ia
Colo
rado
Idah
o
Monta
na
Nev
ada
New
Mex
ico
North
Dak
ota
Ore
gon
South
Dak
ota
Uta
h
Was
hingto
n
Wyo
min
g
To
ns
/Yr
Nonroad
Ag Fire
Rx Fire
Point
Onroad
Wildfire
Area

CMAQ Evaluation Preliminary 2002 version C
Emissions Summary• Preliminary 2002 version C EI Used here.• Next iteration is version D, will include:
– New EI data from other RPOs. – New NH3 EI– Fugitive Dust Model
• Final 2002 EI will include:– 2002 NEI– Reprocess in SMOKE using final MM5– Canada point source emissions.

CMAQ Evaluation Preliminary 2002 version C
CMAQ Simulations• CMAQ v4.3• 36-km grid,
112x148x19• Annual Run• CB4 chemistry• Evaluated using:
IMPROVE, CASTNet, NADP, STN, AIR/AQS
• BC from 2001 GEOS-CHEM global model (Jacob et al)

CMAQ Evaluation Preliminary 2002 version C
PM Performance Criteria
• Guidance from EPA not yet ready:– Difficult to assert that model is adequate.– Therefore, we use a variety of ad hoc
performance goals and benchmarks to display CMAQ results.

CMAQ Evaluation Preliminary 2002 version C
Goal of Model Evaluation
• We completed a variety of analyses:– Compute over 20 performance metrics
– Scatter-plots & time-series plots
– Soccer plots
– Bugle plots
• Goal is to decide whether we have enough confidence to use the model designing emissions control strategies:– Is this a valid application of the model?

CMAQ Evaluation Preliminary 2002 version C
Soccer Goal Plots
• Plot error as as a function of bias.• Ad hoc performance goal:
– 15% bias, 35% error based on O3 modeling goals.
– Too demanding for PM and clean for western conditions?
– Larger error & bias are observed can exist among different PM data methods and monitoring networks.
• Performance benchmark:– 30% bias, 70% error (2x performance goals)
– PM models can achieve this level in many cases.

CMAQ Evaluation Preliminary 2002 version C
CMAQ vs. IMPROVE Summary
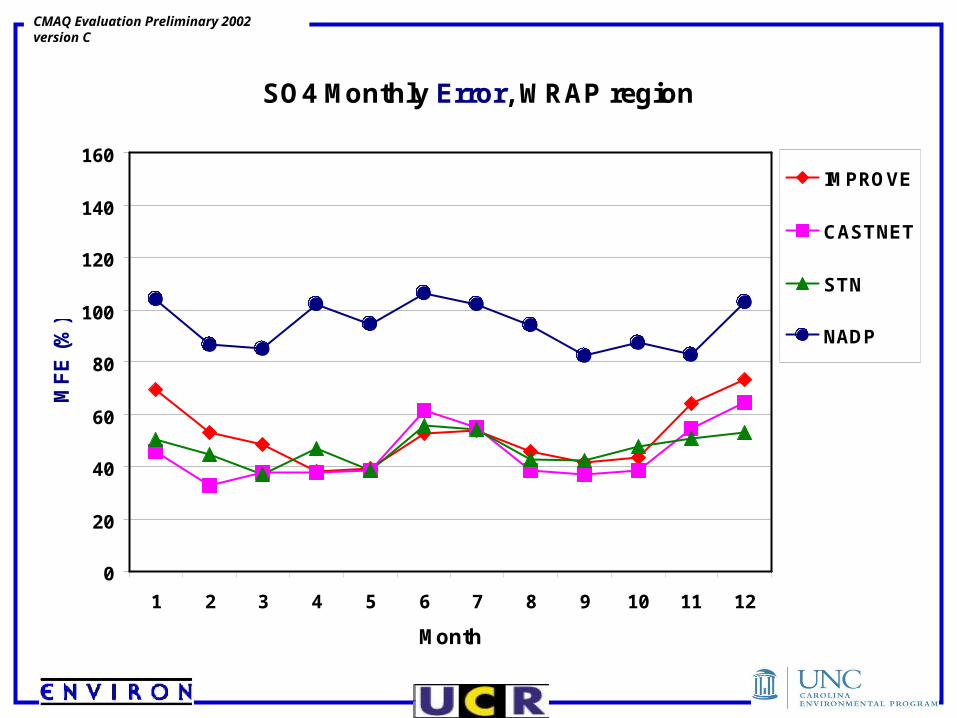
• SO4: negative bias in summer, and positive bias in winter, good performance in spring and fall.
• NO3: large negative bias in summer, large positive bias in winter, and small bias but large error in March and October.
• OC: large negative bias in summer, small positive bias in winter.
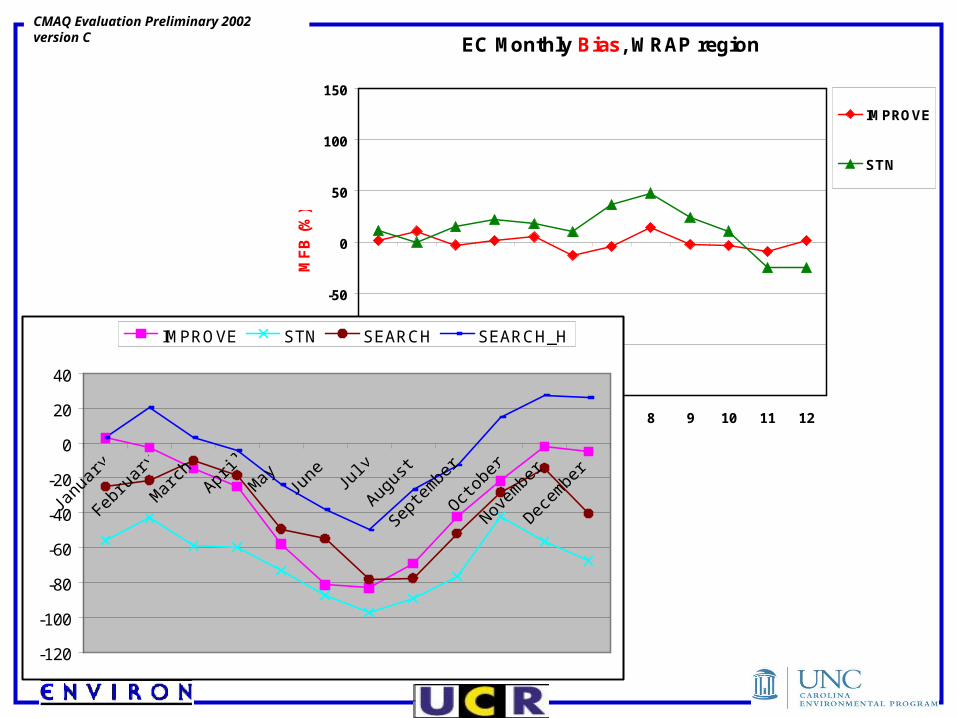
• EC: Good performance each month.
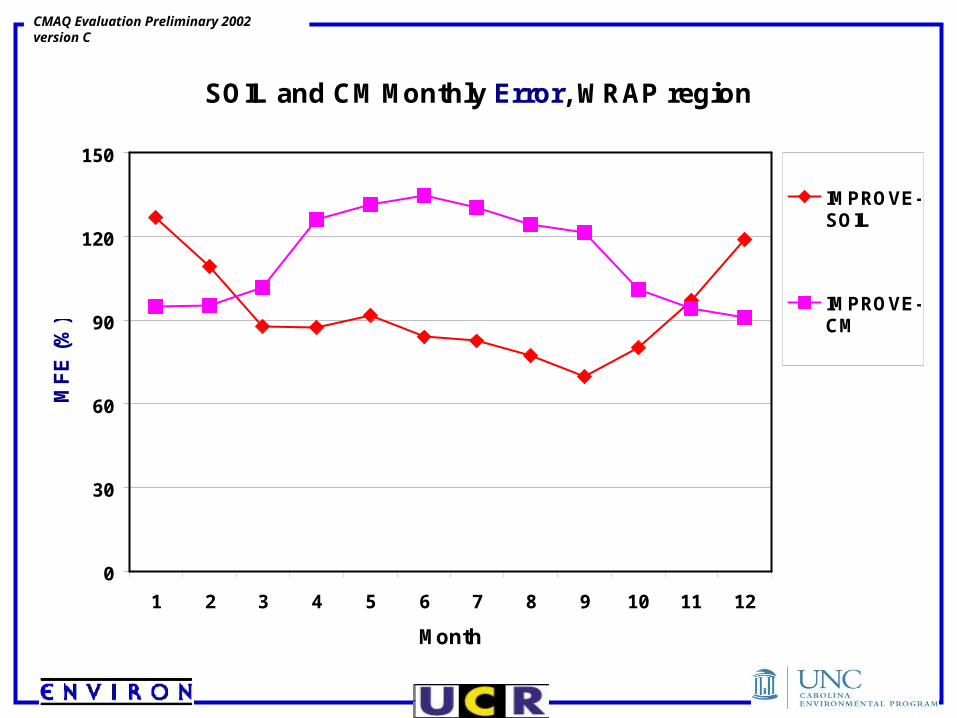
• Coarse Mass: generally large negative bias
• Soil: Small bias most months, except large positive bias in winter
• PM2.5 and PM10: CMAQ over predicts in winter, under predicts in summer, small bias in spring and fall.

CMAQ Evaluation Preliminary 2002 version C
CMAQ vs. CASTNet Summary
• CMAQ performance is better for CASTNet (longer averaging period helps) but has same trend as IMPROVE: over prediction in winter and under prediction in summer.
• SO4 & NO3: large negative bias in summer, large positive bias in winter.
• In summer both SO2 and SO4 are under predicted, in winter both are over predicted (thus problem is not in partitioning)
• Total Nitrate (NO3+HNO3) is much better than aerosol nitrate performance, probably reflects errors in sampling.

CMAQ Evaluation Preliminary 2002 version C
CMAQ vs. STN Summary
• NO3: Large negative bias each month.
• SO4: Negative bias in winter.
• EC: Positive bias in summer.
• Generally good performance for other species, within performance benchmarks.

CMAQ Evaluation Preliminary 2002 version C
CMAQ vs. NADP Summary
• CMAQ over predicts wet dep for SO4, NO3 and NH4.
• Generally small positive bias but large error terms.
• Largest positive bias is in summer (opposite of other networks)

CMAQ Evaluation Preliminary 2002 version C
Annual Average metrics: CMAQ vs IMPROVE

CMAQ Evaluation Preliminary 2002 version C
Spring Summer
Fall Winter

CMAQ Evaluation Preliminary 2002 version C
Annual Average Metrics: CMAQ vs CASTNet

CMAQ Evaluation Preliminary 2002 version C
Spring Summer
Fall Winter

CMAQ Evaluation Preliminary 2002 version C
Annual CMAQ vs STN

CMAQ Evaluation Preliminary 2002 version C
Spring Summer
Fall Winter

CMAQ Evaluation Preliminary 2002 version C
Annual CMAQ vs NADP

CMAQ Evaluation Preliminary 2002 version C
Spring Summer
Fall Winter
CMAQ Evaluation Preliminary 2002 version C
WRAP 2002 CMAQ Pre02c RunMonthly Analysis

CMAQ Evaluation Preliminary 2002 version C
SO4 Monthly Bias, WRAP region
-150
-100
-50
0
50
100
150
1 2 3 4 5 6 7 8 9 10 11 12
Month
MF
B (
%)
IMPROVE
CASTNET
STN
NADP
CMAQ Evaluation Preliminary 2002 version C
SO4 Monthly Error, WRAP region
0
20
40
60
80
100
120
140
160
1 2 3 4 5 6 7 8 9 10 11 12
Month
MF
E (
%)
IMPROVE
CASTNET
STN
NADP

CMAQ Evaluation Preliminary 2002 version C
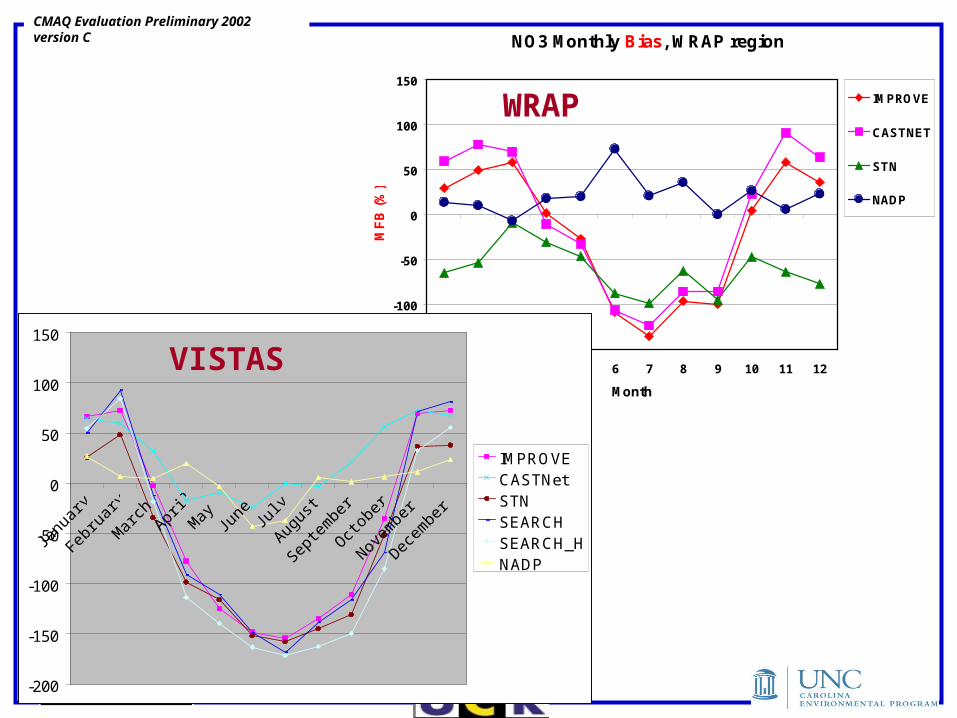
NO3 Monthly Bias, WRAP region
-150
-100
-50
0
50
100
150
1 2 3 4 5 6 7 8 9 10 11 12
Month
MF
B (
%)
IMPROVE
CASTNET
STN
NADP

CMAQ Evaluation Preliminary 2002 version C
NO3 Monthly Error, WRAP region
0
20
40
60
80
100
120
140
160
1 2 3 4 5 6 7 8 9 10 11 12
Month
MF
E (
%)
IMPROVE
CASTNET
STN
NADP

CMAQ Evaluation Preliminary 2002 version C
NH4 Monthly Bias, WRAP region
-150
-100
-50
0
50
100
150
1 2 3 4 5 6 7 8 9 10 11 12
Month
MF
B (
%)
CASTNET
STN
NADP

CMAQ Evaluation Preliminary 2002 version C
NH4 Monthly Error, WRAP region
0
20
40
60
80
100
120
140
160
1 2 3 4 5 6 7 8 9 10 11 12
Month
MF
E (
%)
CASTNET
STN
NADP

CMAQ Evaluation Preliminary 2002 version C
OC Monthly Bias, WRAP region
-150
-100
-50
0
50
100
150
1 2 3 4 5 6 7 8 9 10 11 12
Month
MF
B (
%)
IMPROVE
STN

CMAQ Evaluation Preliminary 2002 version C
OC Monthly Error, WRAP region
0
30
60
90
120
150
1 2 3 4 5 6 7 8 9 10 11 12
Month
MF
E (
%)
IMPROVE
STN

CMAQ Evaluation Preliminary 2002 version C
EC Monthly Bias, WRAP region
-150
-100
-50
0
50
100
150
1 2 3 4 5 6 7 8 9 10 11 12
Month
MF
B (
%)
IMPROVE
STN

CMAQ Evaluation Preliminary 2002 version C
EC Monthly Error, WRAP region
0
30
60
90
120
150
1 2 3 4 5 6 7 8 9 10 11 12
Month
MF
E (
%)
IMPROVE
STN

CMAQ Evaluation Preliminary 2002 version C
SOIL and CM Monthly Bias, WRAP region
-150
-100
-50
0
50
100
150
1 2 3 4 5 6 7 8 9 10 11 12
Month
MF
B (
%)
IMPROVE-SOIL
IMPROVE-CM
CMAQ Evaluation Preliminary 2002 version C
SOIL and CM Monthly Error, WRAP region
0
30
60
90
120
150
1 2 3 4 5 6 7 8 9 10 11 12
Month
MF
E (
%)
IMPROVE-SOIL
IMPROVE-CM

CMAQ Evaluation Preliminary 2002 version C
PM25 and PM10 Monthly Bias, WRAP region
-80
-60
-40
-20
0
20
40
60
80
1 2 3 4 5 6 7 8 9 10 11 12
Month
MF
B (
%)
IMPROVE-PM25
IMPROVE-PM10
STN-PM25

CMAQ Evaluation Preliminary 2002 version C
PM25 and PM10 Monthly Error, WRAP region
0
30
60
90
120
150
1 2 3 4 5 6 7 8 9 10 11 12
Month
MF
E (
%)
IMPROVE-PM25
IMPROVE-PM10
STN-PM25

CMAQ Evaluation Preliminary 2002 version C
Comparison of VISTAS CMAQ in VISTAS states to
WRAP CMAQ in WRAP States
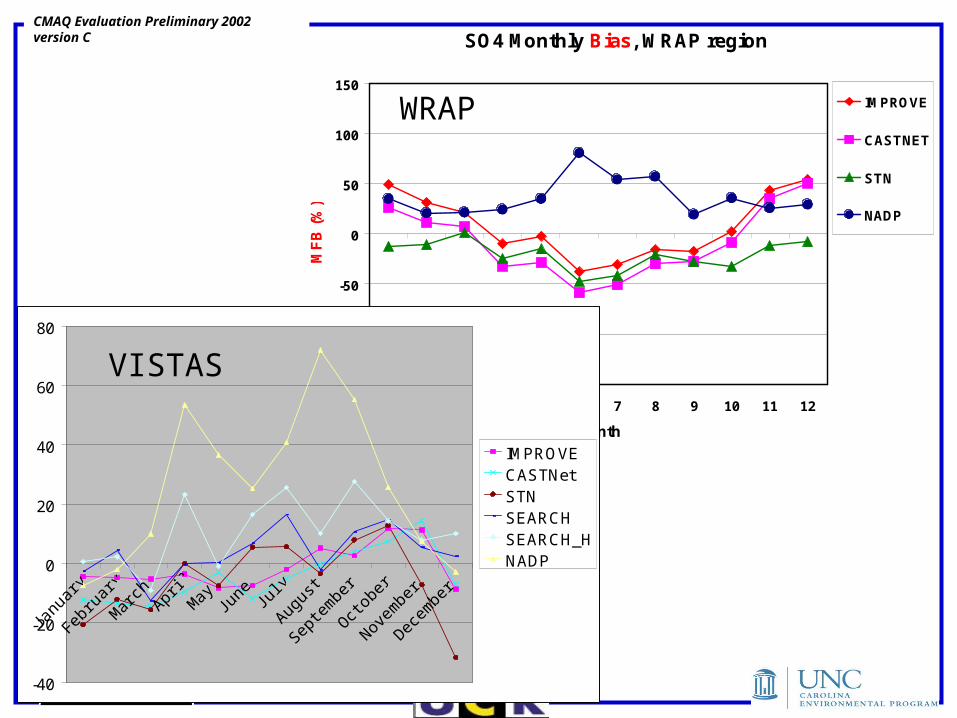
CMAQ Evaluation Preliminary 2002 version CSO4 Monthly Bias, WRAP region
-150
-100
-50
0
50
100
150
1 2 3 4 5 6 7 8 9 10 11 12
Month
MF
B (
%)
IMPROVE
CASTNET
STN
NADP
-40
-20
0
20
40
60
80
Janu
ary
Febru
ary
Mar
chApr
ilM
ayJu
ne July
Augus
t
Septe
mbe
r
Oct
ober
Novem
ber
Decem
ber
IMPROVECASTNetSTNSEARCHSEARCH_HNADP
VISTAS
WRAP
CMAQ Evaluation Preliminary 2002 version C
NO3 Monthly Bias, WRAP region
-150
-100
-50
0
50
100
150
1 2 3 4 5 6 7 8 9 10 11 12
MonthM
FB
(%
)
IMPROVE
CASTNET
STN
NADP
-200
-150
-100
-50
0
50
100
150
Janu
ary
Febru
ary
Mar
chApr
ilM
ayJu
ne July
Augus
t
Septe
mbe
r
Octobe
r
Novem
ber
Decem
ber
IMPROVECASTNetSTNSEARCHSEARCH_HNADP
VISTAS
WRAP

CMAQ Evaluation Preliminary 2002 version C
OC Monthly Bias, WRAP region
-150
-100
-50
0
50
100
150
1 2 3 4 5 6 7 8 9 10 11 12
Month
MF
B (
%)
IMPROVE
STN
-120
-100
-80
-60
-40
-20
0
20
40
Janu
ary
Febru
ary
Mar
chApr
ilM
ayJu
ne July
Augus
t
Septe
mbe
r
Oct
ober
Novem
ber
Decem
ber
IMPROVE STN SEARCH SEARCH_H
CMAQ Evaluation Preliminary 2002 version C
EC Monthly Bias, WRAP region
-150
-100
-50
0
50
100
150
1 2 3 4 5 6 7 8 9 10 11 12
Month
MF
B (
%)
IMPROVE
STN
-120
-100
-80
-60
-40
-20
0
20
40
Janu
ary
Febru
ary
Mar
chApr
ilM
ayJu
ne July
Augus
t
Septe
mbe
r
Oct
ober
Novem
ber
Decem
ber
IMPROVE STN SEARCH SEARCH_H

CMAQ Evaluation Preliminary 2002 version C
SOIL and CM Monthly Bias, WRAP region
-150
-100
-50
0
50
100
150
1 2 3 4 5 6 7 8 9 10 11 12
Month
MF
B (
%)
IMPROVE-SOIL
IMPROVE-CM
-50
0
50
100
150
200
Janu
ary
Febru
ary
Mar
chApr
ilM
ayJu
ne July
Augus
t
Septe
mbe
r
Octo
ber
Novem
ber
Decem
ber
Soil-IMPSoil-SECM-IMP

CMAQ Evaluation Preliminary 2002 version C

CMAQ Evaluation Preliminary 2002 version C
Summary of WRAP & VISTAS
• VISTAS Sulfate performance much better:– Southeast SO4 levels are much higher than
WRAP
• WRAP EC performance is better:– Order of EC reversed for IMPROVE and STN.
• Coarse mass lower in WRAP
• Similar performance for other species.

CMAQ Evaluation Preliminary 2002 version C
Performance Goals and Criteria- Proposed by Jim Boylan
• Based on MFE and MFB calculations
• Vary as a function of species concentrations– Goals: FE +50% and FB ±30%
– Criteria: FE +75% and FB ±60%
– Less abundant species should have less stringent performance goals and criteria

CMAQ Evaluation Preliminary 2002 version C
Performance Goals and Criteria- Proposed by Jim Boylan
• PM Performance Goals
• Proposed PM Performance Criteria
501503/75.0
)(5.0
mg
CC mo
eFE
301703/5.0
)(5.0
mg
CC mo
eFB
751253/75.0
)(5.0
mg
CC mo
eFE
601403/5.0
)(5.0
mg
CC mo
eFB

CMAQ Evaluation Preliminary 2002 version C
Monthly SO4 Fractional Bias
SO4
-200
-150
-100
-50
0
50
100
150
200
0 2 4 6 8 10
Average Concentration (ug/m3)
Fra
ctio
nal
Bia
s (%
)
IMPROVE
CASTNet
STN
(+) Goal
(-) Goal
(+) Criteria
(-) Criteria

CMAQ Evaluation Preliminary 2002 version C
Monthly SO4 Fractional Error
SO4
0
50
100
150
200
0 2 4 6 8 10
Average Concentration (ug/m3)
Fra
ctio
na
l E
rro
r (%
)
IMPROVE
CASTNet
STN
Goal
Criteria

CMAQ Evaluation Preliminary 2002 version C
Monthly NO3 Fractional Bias
NO3
-200
-150
-100
-50
0
50
100
150
200
0 2 4 6 8 10
Average Concentration (ug/m3)
Fra
ctio
na
l B
ias
(%
)
IMPROVE
CASTNet
STN
(+) Goal
(-) Goal
(+) Criteria
(-) Criteria

CMAQ Evaluation Preliminary 2002 version C
Monthly NO3 Fractional Error
NO3
0
50
100
150
200
0 2 4 6 8 10
Average Concentration (ug/m3)
Fra
cti
on
al E
rro
r (%
)
IMPROVE
CASTNet
STN
Goal
Criteria

CMAQ Evaluation Preliminary 2002 version C
Monthly NH4 Fractional Bias
NH4
-200
-150
-100
-50
0
50
100
150
200
0 2 4 6 8
Average Concentration (ug/m3)
Fra
ctio
na
l B
ias
(%
)
CASTNet
STN
(+) Goal
(-) Goal
(+) Criteria
(-) Criteria

CMAQ Evaluation Preliminary 2002 version C
Monthly NH4 Fractional Error
NH4
0
50
100
150
200
0 2 4 6 8
Average Concentration (ug/m3)
Fra
ctio
na
l E
rro
r (%
)
CASTNet
STN
Goal
Criteria

CMAQ Evaluation Preliminary 2002 version C
Monthly OC Fractional Bias
OC
-200
-150
-100
-50
0
50
100
150
200
0 2 4 6 8 10 12 14 16
Average Concentration (ug/m3)
Fra
ctio
nal
Bia
s (%
)
IMPROVE
STN
(+) Goal
(-) Goal
(+) Criteria
(-) Criteria

CMAQ Evaluation Preliminary 2002 version C
Monthly OC Fractional Error
OC
0
50
100
150
200
0 2 4 6 8 10 12 14 16
Average Concentration (ug/m3)
Fra
cti
on
al E
rro
r (%
)
IMPROVE
STN
Goal
Criteria

CMAQ Evaluation Preliminary 2002 version C
Monthly EC Fractional Bias
EC
-200
-150
-100
-50
0
50
100
150
200
0 2 4 6 8
Average Concentration (ug/m3)
Fra
ctio
na
l B
ias
(%
)
IMPROVE
STN
(+) Goal
(-) Goal
(+) Criteria
(-) Criteria

CMAQ Evaluation Preliminary 2002 version C
Monthly EC Fractional Error
EC
0
50
100
150
200
0 2 4 6 8
Average Concentration (ug/m3)
Fra
cti
on
al E
rro
r (%
)
IMPROVE
STN
Goal
Criteria

CMAQ Evaluation Preliminary 2002 version C
Monthly PM25 Fractional Bias
PM25
-200
-150
-100
-50
0
50
100
150
200
0 8 16 24 32 40
Average Concentration (ug/m3)
Fra
ctio
na
l B
ias
(%
)
IMPROVE
STN
(+) Goal
(-) Goal
(+) Criteria
(-) Criteria

CMAQ Evaluation Preliminary 2002 version C
Monthly PM25 Fractional Error
PM25
0
50
100
150
200
0 8 16 24 32 40
Average Concentration (ug/m3)
Fra
cti
on
al E
rro
r (%
)
IMPROVE
STN
Goal
Criteria

CMAQ Evaluation Preliminary 2002 version C
CMAQ Versions & EI Versions
• Performance evaluation used CMAQ 4.3
• Previous CMAQ runs used CMAQ 4.3 with Preliminary 2002 B emissions (no fires)
• January & July test case using CMAQ v4.4beta with emissions version Preliminary 2002 C
CMAQ Evaluation Preliminary 2002 version C
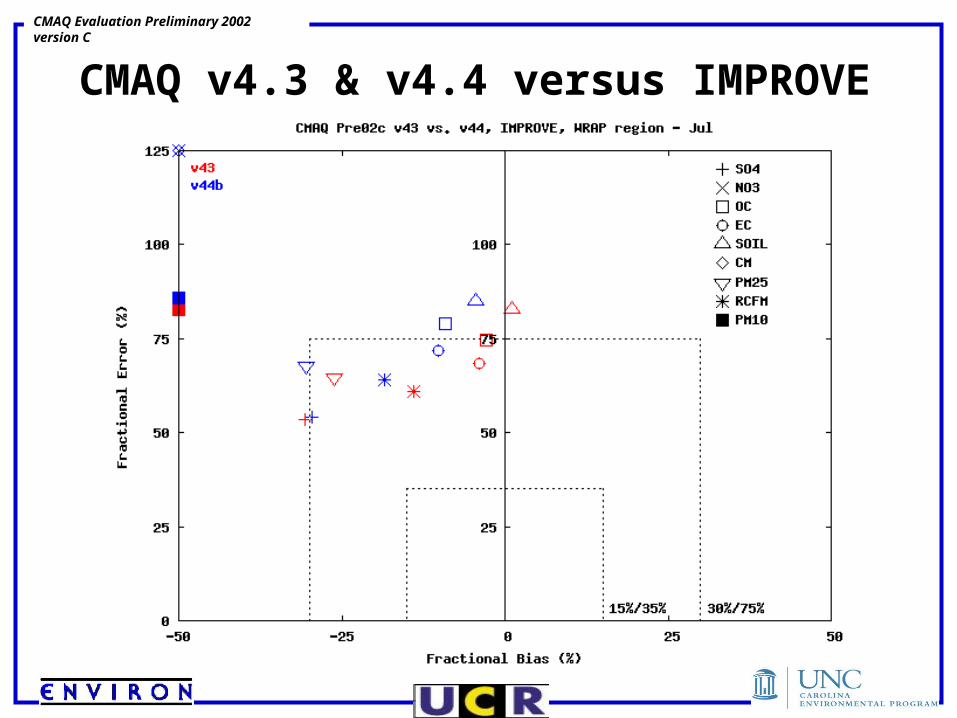
CMAQ v4.3 & v4.4 versus IMPROVE
July

CMAQ Evaluation Preliminary 2002 version C
CMAQ Ozone Performance
• CMAQ v4.3 Mean fractional bias (no filter)January +25% MFBJuly –20% mean MFB
• Slightly worse January O3 performance in CMAQ v4.4beta

CMAQ Evaluation Preliminary 2002 version C
CMAQ Emissions B & C versus IMPROVE
Summer
CMAQ Evaluation Preliminary 2002 version C
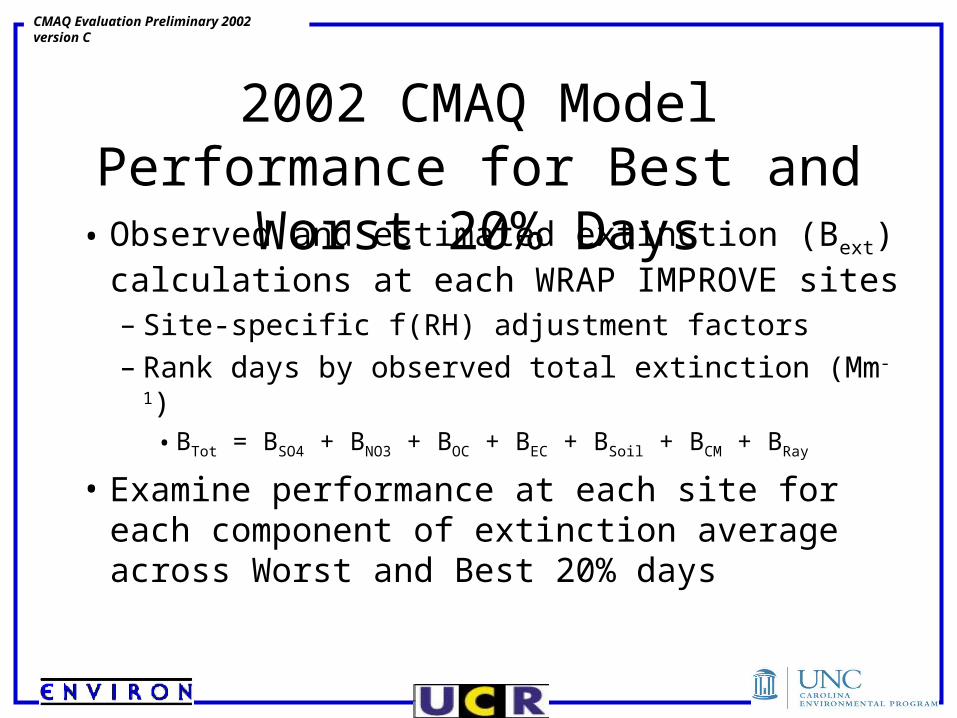
2002 CMAQ Model Performance for Best and Worst 20% Days
• Observed and estimated extinction (Bext) calculations at each WRAP IMPROVE sites– Site-specific f(RH) adjustment factors– Rank days by observed total extinction (Mm-1)
• BTot = BSO4 + BNO3 + BOC + BEC + BSoil + BCM + BRay
• Examine performance at each site for each component of extinction average across Worst and Best 20% days
CMAQ Evaluation Preliminary 2002 version C
bNO3 (US)
0
10
20
30
40
50
60
70
80
90
100
0 10 20 30 40 50 60 70 80 90 100
Obs (bEXT 1/Mm)
CM
AQ
(b
EX
T 1
/Mm
)
bSO4 (US)
0
10
20
30
40
50
0 10 20 30 40 50
Obs (bEXT 1/Mm)
CM
AQ
(b
EX
T 1
/Mm
)
bOC (US)
0
80
160
240
320
400
0 80 160 240 320 400
Obs (bEXT 1/Mm)
CM
AQ
(b
EX
T 1
/Mm
)
bEC (US)
0
40
80
120
160
0 40 80 120 160
Obs (bEXT 1/Mm)
CM
AQ
(b
EX
T 1
/Mm
)
Kalmiopsis
Kalmiopsis
Model Performance for Average
of Worst 20% Days at
WRAP IMPROVE
Sites
Preliminary 2002 CMAQ Simulation
SO4
NO3
OC
EC

CMAQ Evaluation Preliminary 2002 version C
bCM (US)
0
5
10
15
20
25
0 5 10 15 20 25
Obs (bEXT 1/Mm)
CM
AQ
(b
EX
T 1
/Mm
)
bSOIL (US)
0
4
8
12
16
20
24
28
32
36
40
0 4 8 12 16 20 24 28 32 36 40
Obs (bEXT 1/Mm)
CM
AQ
(b
EX
T 1
/Mm
)
Kalmiopsis
Kalmiopsis
Phoenix
Saguro
Model Performance for Average of Worst 20% Days at WRAP IMPROVE Sites
Preliminary 2002 CMAQ Simulation
Coarse Matter (CM) and Soil

CMAQ Evaluation Preliminary 2002 version C
bSO4 (US)
0
3
6
9
12
15
0 3 6 9 12 15
Obs (bEXT 1/Mm)
CM
AQ
(bE
XT
1/M
m)
bNO3 (US)
0
2
4
6
8
10
12
14
0 5 10 15
Obs (bEXT 1/Mm)
CM
AQ
(bE
XT
1/M
m)
bOC (US)
0
5
10
15
20
25
0 5 10 15 20 25
Obs (bEXT 1/Mm)
CM
AQ
(bE
XT
1/M
m)
bEC (US)
0
3
6
9
12
15
0 3 6 9 12 15
Obs (bEXT 1/Mm)
CM
AQ
(bE
XT
1/M
m)
Model Performance
for Average of Best 20%
Days at WRAP IMPROVE Sites
Preliminary 2002 CMAQ Simulation
SO4
NO3
OC
EC

CMAQ Evaluation Preliminary 2002 version C
bCM (US)
0
3
6
9
12
0 3 6 9 12
Obs (bEXT 1/Mm)
CM
AQ
(bE
XT
1/M
m)
bSOIL (US)
0
2
4
6
8
10
0 2 4 6 8 10
Obs (bEXT 1/Mm)
CM
AQ
(bE
XT
1/M
m)
Model Performance for Average of Best 20% Days at WRAP IMPROVE Sites
Preliminary 2002 CMAQ Simulation
Coarse Matter (CM) and Soil

CMAQ Evaluation Preliminary 2002 version C
0
5
10
15
20
25
Obs CMAQ
bEX
T (
1/M
m) bCM
bSOILbECbOCbNO3bSO4
0
5
10
15
20
25
30
35
40
Obs CMAQ
bEX
T (
1/M
m) bCM
bSOILbECbOCbNO3bSO4
Grand Canyon NP, AZ
Chiricahua NM, AZ
Extinction (Mm-1) model performance
for average of Worst 20%
observed days
Grand Canyon
Chiricahua
CMAQ Evaluation Preliminary 2002 version C
0
5
10
15
20
25
30
Obs CMAQ
bEX
T (
1/M
m) bCM
bSOILbECbOCbNO3bSO4
0
5
10
15
20
25
30
35
40
45
50
Obs CMAQ
bEX
T (
1/M
m) bCM
bSOILbECbOCbNO3bSO4
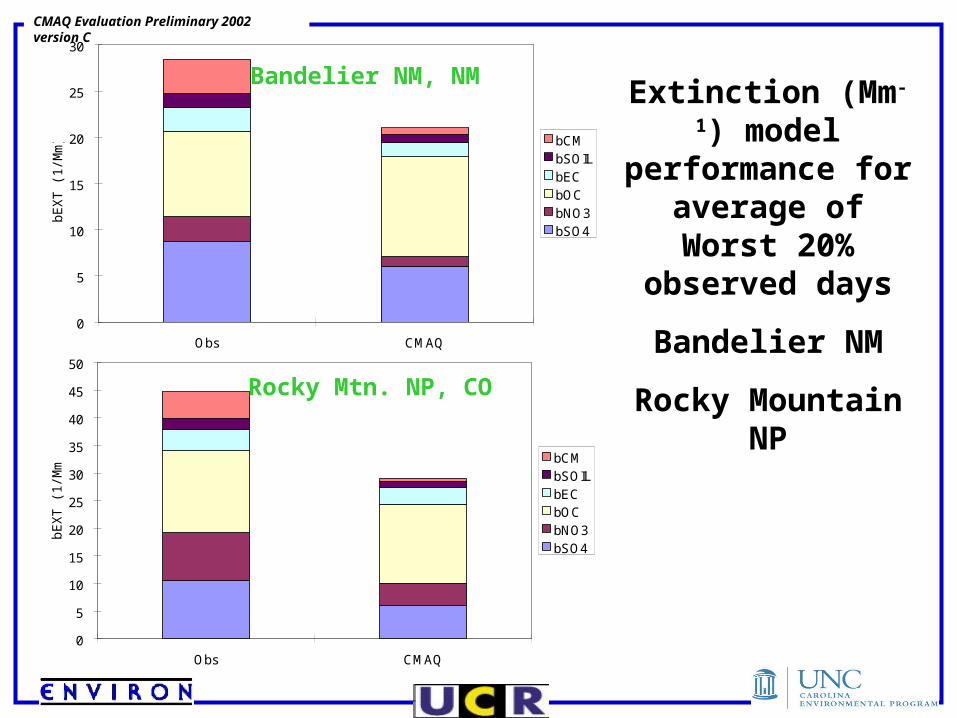
Bandelier NM, NM
Rocky Mtn. NP, CO
Extinction (Mm-1) model performance
for average of Worst 20%
observed days
Bandelier NM
Rocky Mountain NP
CMAQ Evaluation Preliminary 2002 version C
0
10
20
30
40
50
60
Obs CMAQ
bEX
T (
1/M
m) bCM
bSOILbECbOCbNO3bSO4
0
10
20
30
40
50
60
Obs CMAQ
bEX
T (
1/M
m) bCM
bSOILbECbOCbNO3bSO4
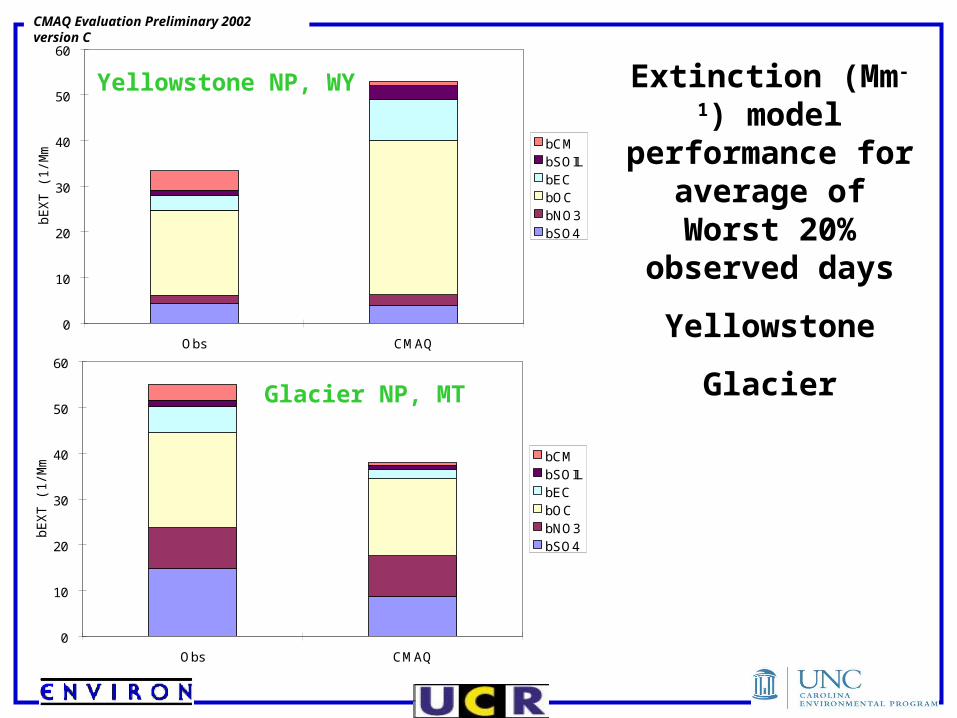
Yellowstone NP, WY
Glacier NP, MT
Extinction (Mm-1) model performance
for average of Worst 20%
observed days
Yellowstone
Glacier

CMAQ Evaluation Preliminary 2002 version C
0
10
20
30
40
50
60
70
80
90
Obs CMAQ
bEX
T (
1/M
m) bCM
bSOILbECbOCbNO3bSO4
0
100
200
300
400
500
600
700
Obs CMAQ
bEX
T (
1/M
m) bCM
bSOILbECbOCbNO3bSO4
Mount Ranier NP, WA
Kalmiopsis, OR
Extinction (Mm-1) model
performance for average of Worst
20% observed days
Mount Ranier
Kalmiopsis

CMAQ Evaluation Preliminary 2002 version C
0
20
40
60
80
100
120
Obs CMAQ
bEX
T (
1/M
m) bCM
bSOILbECbOCbNO3bSO4
0
10
20
30
40
50
60
70
80
90
100
Obs CMAQ
bEX
T (
1/M
m) bCM
bSOILbECbOCbNO3bSO4
Point Reyes, CA
San Gorgoinio, CA
Extinction (Mm-1) model
performance for average of Worst
20% observed days
Point Reyes
San Gorgonio
CMAQ Evaluation Preliminary 2002 version C
0
2
4
6
8
10
12
Obs CMAQ
bEX
T (
1/M
m)
bCMbSOILbECbOCbNO3bSO4
0
1
2
3
4
5
6
7
8
9
10
Obs CMAQ
bEX
T (
1/M
m)
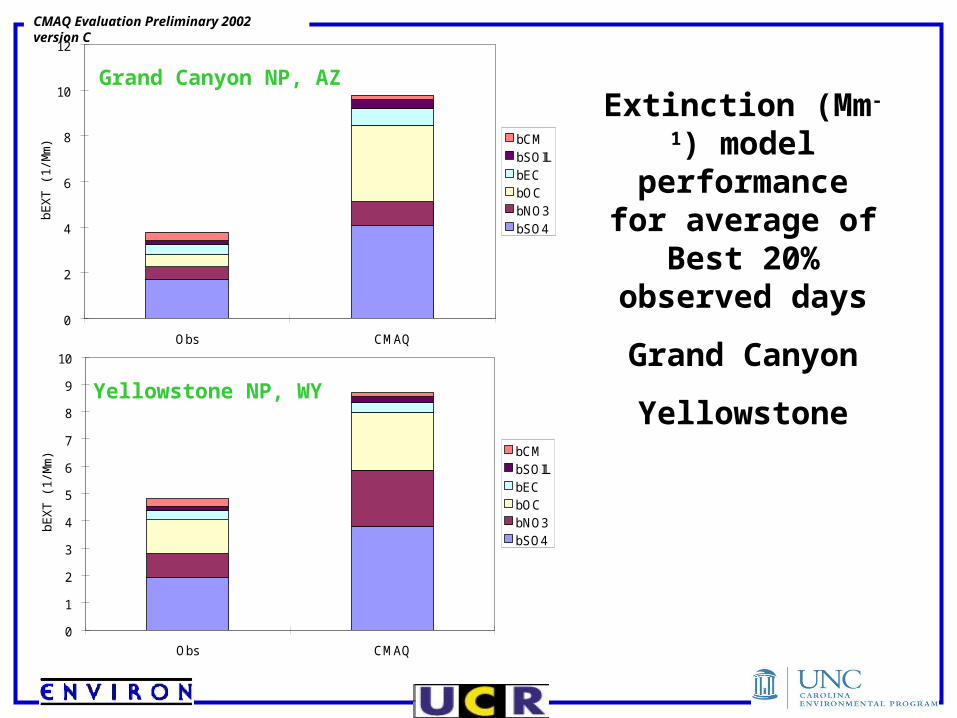
bCMbSOILbECbOCbNO3bSO4
Yellowstone NP, WY
Grand Canyon NP, AZ
Extinction (Mm-1) model
performance for average of Best 20% observed
days
Grand Canyon
Yellowstone

CMAQ Evaluation Preliminary 2002 version C
Conclusions
• Positive bias in winter, negative bias in summer.
• CMAQ meets “benchmark” goals for most species and networks.
• Disagreements among different monitoring networks.
• Negative bias for summer O3 might contribute to negative PM bias.

CMAQ Evaluation Preliminary 2002 version C
Next Steps• Analysis of CMAQ performance on best & worst days
still in progress: – However, we expect CMAQ will tend to over predict lows
& under predict highs.– Recommend using CMAQ results unpaired in time for each
month or season.
• Is this set of Emissions/MM5/CMAQ adequate for developing emissions control strategies?
• Will we get performance improvements with new MM5 and new EI?
• New NH3 EI and might improve performance.