Embed Size (px)
Citation preview

CAMx-to-CMAQ Converter
Air Quality Division
Jim SmithSr. Photochemical Modeler,
Air Modeling and Data Analysis
Presented to Southeast TexasPhotochemical Modeling Technical Committee
April 13, 2015

Air Quality Division • CAMx2CMAQ • JHS • April 13, 2015 • Page 2
Background
• The TCEQ uses the Comprehensive Air Quality Model with Extensions (CAMx) to support ozone attainment demonstrations and related State Implementation Plan (SIP) activities. CAMx is supported and maintained by ENVIRON, Inc.
• The Community Model for Air Quality (CMAQ) is a model similar to CAMx, supported and maintained by the U.S. Environmental Protection Agency (EPA).
• Both CAMx and CMAQ are regional-scale photochemical models, and both are widely-used and accepted by EPA for SIP submittals. A number of researchers interested in modeling Texas favor CMAQ.

Air Quality Division • CAMx2CMAQ • JHS • April 13, 2015 • Page 3
Background
• CMAQ and CAMx input files are not compatible, and researchers have not been successful in processing some of the TCEQ’s emissions data into CMAQ format.– Specifically, the TCEQ’s on-road emissions data are too detailed to
be processed using the CMAQ emissions pre-processor without first significantly degrading its resolution.
• Because it is in the best interest of both the scientific and regulatory communities to use the highest quality model input data available, the TCEQ commissioned ENVIRON, Inc. to build a converter to transform the TCEQ’s CAMx inputs directly into the format required by CMAQ.

Air Quality Division • CAMx2CMAQ • JHS • April 13, 2015 • Page 4
Important Differences Between CAMx and CMAQ
• Both CMAQ and CAMx are capable of modeling particulate formation and transport, but, unlike CMAQ, CAMx can be run without particulate chemistry.
• CAMx and CMAQ emissions input formats are different:
– CMAQ emissions are generally prepared using the Sparse Matrix Operator Kernel Emissions (SMOKE) processor. CMAQ inputs are all in Network–Common Data Form Input/Output Application Program Interface (Net-CDF IOAPI).
– CAMx inputs are FORTRAN binary files and can be prepared using SMOKE. However, the TCEQ uses a customized version of the Emissions Processing System, Version 3 (EPS-3), which is integrated into our processing stream and allows for higher temporal, spatial, and chemical resolution than SMOKE.

Air Quality Division • CAMx2CMAQ • JHS • April 13, 2015 • Page 5
Important Differences Between CAMx and CMAQ
• CAMx and CMAQ meteorology input formats are different:
– Both CAMx and CMAQ use meteorology generated using the Weather Research and Forecasting (WRF) meteorological model.
– CAMx inputs are FORTRAN binary files processed through the WRF2CAMx utility. CMAQ Net-CDF IOAPI files are processed through the Meteorology-Chemistry Interface Program (MCIP).
– Note that CMAQ requires some information not contained in the CAMx meteorological input stream (e.g. planetary boundary layer), so it is not possible to convert CAMx meteorological input directly to CMAQ format.
• CAMx and CMAQ boundary and initial condition (BC/IC) input formats are different (FORTRAN binary vs. Net-CDF IOAPI).

Air Quality Division • CAMx2CMAQ • JHS • April 13, 2015 • Page 6
Important Differences Between CAMx and CMAQ
• CMAQ is always run in Universal Time Coordinates (UTC) while CAMx can be run in any time zone, usually Local Standard Time (LST).
• CMAQ calculates on-the-hour concentrations (25 per day) while CAMx calculates 24 hourly-averages per day.
• CMAQ vertical structure always extends to 50 millibars; CAMx top is defined by users (usually lower).
• CAMx adds dummy rows and columns surrounding each grid to interface with boundary concentrations. CMAQ does not include these cells within the model arrays.

Air Quality Division • CAMx2CMAQ • JHS • April 13, 2015 • Page 7
Important Differences Between CAMx and CMAQ
• CAMx supports both Carbon Bond 05 (CB05) and CB6 chemistry processors. CMAQ only supports CB05.
• Internal differences not relevant to conversion of inputs are not listed here. For further discussion on the differences between the two models (as of May, 2012) see:
http://www.cleanairinfo.com/regionalstatelocalmodelingworkshop/archive/2012/presentations/Wed/6-6_Baker_CMAQ_CMAX.pdf

Air Quality Division • CAMx2CMAQ • JHS • April 13, 2015 • Page 8
CAMx2CMAQ Modules
WINDOW Modify the size and/or resolution of the CAMx low‐level emission input grid
X2QEMIS Convert the CAMx low‐level/elevated emission input file to the CMAQ 2‐D/inline‐point emission input file
ICBC2IOAPI Convert the CAMx IC/BC input file to the CMAQ ICON/BCON input file
SPCMAP Map the CAMx model species to the CMAQ model species
STITCHIOAPI Stitch multiple I/O API files to a single file for a user‐specified time period

Air Quality Division • CAMx2CMAQ • JHS • April 13, 2015 • Page 9
CAMx ProcessingEmissions
Inventory Data
WRF Output
EPS‐3
WRF2CAMx
Regional Met.Model (WRF)
MeteorologicalInputs
CAMx EmissionInput
(FORTRAN binary)
GEOS2CAMx
CAMx IC/BC(FORTRAN binary)
CAMx Met. Input (FORTRAN binary)
CAMx
CAMx Output (FORTRAN Binary)
Global Model (e.g. GEOS‐Chem)
Output

Air Quality Division • CAMx2CMAQ • JHS • April 13, 2015 • Page 10
CMAQ ProcessingEmissions
Inventory Data
WRF Output
SMOKE
MCIP
Regional Met.Model (WRF)
MeteorologicalInputs
CMAQ EmissionInputs
(net‐CDF IOAPI)
GEOS2CMAQ
CMAQ IC/BC(net‐CDF IOAPI)
CMAQ Met. Input (net‐CDF IOAPI)
CMAQ
CMAQ Output (net‐CDF IOAPI)
Global Model (e.g. GEOS‐Chem)
Output
Air Quality Division • CAMx2CMAQ • JHS • April 13, 2015 • Page 11
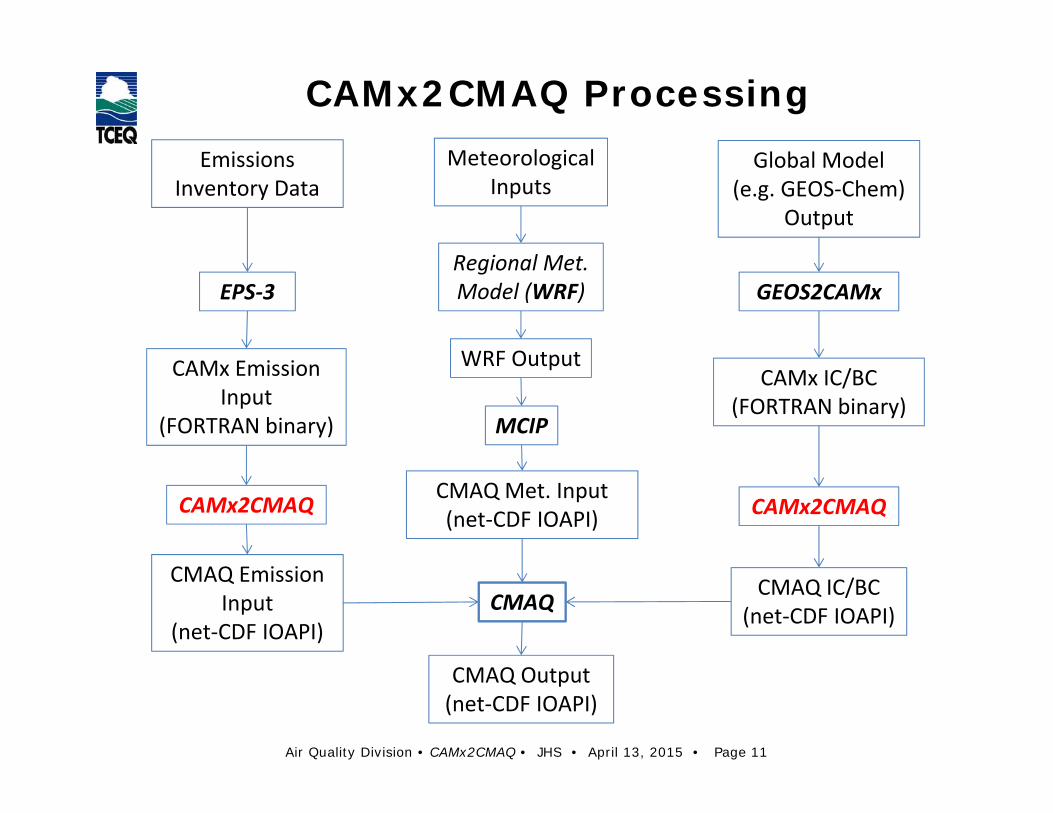
CAMx2CMAQ ProcessingEmissions
Inventory Data
WRF Output
EPS‐3
MCIP
Regional Met.Model (WRF)
MeteorologicalInputs
CMAQ EmissionInput
(net‐CDF IOAPI)
GEOS2CAMx
CMAQ IC/BC(net‐CDF IOAPI)
CMAQ Met. Input (net‐CDF IOAPI)
CMAQ
CMAQ Output (net‐CDF IOAPI)
Global Model (e.g. GEOS‐Chem)
Output
CAMx EmissionInput
(FORTRAN binary)
CAMx2CMAQ
CAMx IC/BC(FORTRAN binary)
CAMx2CMAQ

Air Quality Division • CAMx2CMAQ • JHS • April 13, 2015 • Page 12
Test Case
• May 31 – June 6, 2006 test period
• Rider 8 files from TCEQ ftp server– WRF meteorology– Emissions– Boundary conditions (GEOS-Chem)
• Nested 36/12/4 km domains centered on eastern Texas
• 28 vertical layers

Air Quality Division • CAMx2CMAQ • JHS • April 13, 2015 • Page 13
Test Case

Air Quality Division • CAMx2CMAQ • JHS • April 13, 2015 • Page 14
Test Case - Emissions
VERDI visualization showing input CAMx-format and output CMAQ-format as time series bar plots. Average grid cell nitrogen oxide (NO) emission rate over the 36 km domain.
VERDI = Visualization Environment for Rich Data Interpretation

Air Quality Division • CAMx2CMAQ • JHS • April 13, 2015 • Page 15
Test Case - Emissions
VERDI spatial plot showing unit conversion for matched time zone for nitrogen dioxide (NO2).

Air Quality Division • CAMx2CMAQ • JHS • April 13, 2015 • Page 16
Test Case – Initial & Boundary Conditions
Vertical profiles plot showing matched CAMx and CMAQ ICs (left) and BCs (right) for ozone.
0.00
2.00
4.00
6.00
8.00
10.00
12.00
14.00
16.00
0 100 200 300
Layer C
enter (km
AGL)
O3 (ppb)
CAMx
CMAQ
0.00
2.00
4.00
6.00
8.00
10.00
12.00
14.00
16.00
0 20 40 60 80 100
Layer C
enter (km
AGL)
O3 (ppb)
CAMx
CMAQ

Air Quality Division • CAMx2CMAQ • JHS • April 13, 2015 • Page 17
Test Case – CMAQ & CAMx
June 1-3, 2006 36 km grid Maximum Daily Average 8-hour (MDA8) Ozone Concentrations
Note: CAMx was run with CB6, CMAQ with CB05. Also some difference in meteorology between runs.

Air Quality Division • CAMx2CMAQ • JHS • April 13, 2015 • Page 18
Test Case – CMAQ & CAMx
June 1-3, 2006 4 km grid MDA8 Ozone Concentrations
Note: CAMx was run with CB6, CMAQ with CB05. Also some difference in meteorology between runs.

Air Quality Division • CAMx2CMAQ • JHS • April 13, 2015 • Page 19
Comparative Performance Evaluation
• New CAMx run at the TCEQ designed to more closely align with the CMAQ test case:
– CB05 chemistry
– New WRF run with subgrid cloud diagnostics turned off

Air Quality Division • CAMx2CMAQ • JHS • April 13, 2015 • Page 20
Daily MDA8 Ozone Concentration
CAMx CMAQ
June 3, 2006

Air Quality Division • CAMx2CMAQ • JHS • April 13, 2015 • Page 21
Daily MDA8 Ozone Concentration
CAMx CMAQ
June 6, 2006

Air Quality Division • CAMx2CMAQ • JHS • April 13, 2015 • Page 22
Site MDA8 Ozone ConcentrationD
ento
n C
56K
elle
r C17
Obs
erve
d
CM
AQ
CA
Mx
Obs
erve
dC
AM
xC
MA
Q

Air Quality Division • CAMx2CMAQ • JHS • April 13, 2015 • Page 23
Site MDA8 Ozone ConcentrationD
eer P
ark
C35
Man
vel C
roix
C84
Obs
erve
d
CM
AQ
CA
Mx
Obs
erve
dC
AM
xC
MA
Q

Air Quality Division • CAMx2CMAQ • JHS • April 13, 2015 • Page 24
MDA8 Ozone Bias by AreaD
FWH
GB
CA
Mx
CM
AQ
CA
Mx
CM
AQ

Air Quality Division • CAMx2CMAQ • JHS • April 13, 2015 • Page 25
MDA8 Ozone Bias by AreaB
PASA
N
CA
Mx
CM
AQ
CA
Mx
CM
AQ

Air Quality Division • CAMx2CMAQ • JHS • April 13, 2015 • Page 26
MDA8 Ozone Bias by AreaA
RR
NET
X
CA
Mx
CM
AQ
CA
Mx
CM
AQ

Air Quality Division • CAMx2CMAQ • JHS • April 13, 2015 • Page 27
Conclusions
• A program is now available that converts FORTRAN binary CAMx inputs to Net-CDF IOAPI CMAQ inputs.
• Meteorological inputs must still be processed separately for the two systems.
• The conversion was tested and CMAQ was successfully executed using the converted inputs.
• When run with similar meteorology and chemistry, CMAQ and CAMx produce spatially similar ozone plumes.

Air Quality Division • CAMx2CMAQ • JHS • April 13, 2015 • Page 28
Conclusions
• CAMx generally produced higher ozone concentrations than CMAQ in the test case.
• Both models performed well in DFW and San Antonio.
• Both models over-predict MDA8 ozone in the HGB area. Because it produced higher ozone concentrations, CAMx performed slightly worse in the test case in HGB.
• Performance in the other areas was mixed.

Air Quality Division • CAMx2CMAQ • JHS • April 13, 2015 • Page 29
Notes
• Project final report and User Guide are ready to be posted on TCEQ external web site.
• TCEQ modeling staff are continuing to investigate why CAMx produced higher ozone concentrations than CMAQ.
• Further research is needed to see how the two models respond to emissions changes.
• It may be useful to install CMAQ on the TCEQ modeling computers to further investigate differences in model performance.