Embed Size (px)
Citation preview

Journal of Manufacturing Systems Volume 12/No. 5
Clustering Effectiveness of Permutation Generation Heuristics for Machine-Part Matrix Clustering
Charu Chandra, Shahrukh A. Irani, and Sant R. Arora, University of Minnesota, Minneapolis
Abstract The first step in the design of a cellular manufactur-
ing system (CMS) is the clustering of the binary machine-part matrix. This provides a visual basis for matching the machine groups to the part families they produce. Essentially, this requires that the orders of the machines and parts in the initial matrix be permuted independently a finite number of times. If machine-part clusters exist, they will appear as blocks of l 's along the diagonal of the matrix.
Our study focuses on identifying a generic measure for the compactness of a good block diagonal form (BDF) in the final matrix produced by any heuristic. A difficult matrix in the literature known to have cluster overlap in both dimensions was solved using various graph theoretic heuristics for permutation generation. The compactness of the BDF in each of the final matrixes was evaluated using a new measure of BDF compactness developed by the authors. Comparisons were made with other measures of clustering effective- ness. The paper concludes with a discussion on how these measures could help to identify near-optimal BDFS to simplify machine grouping for detailed cell formation analyses.
Keywords: Group Technology, Cellular Manufac- turing Systems, Block Diagonalization of Machine- Part Matrix, Cluster Analysis, Clustering Effectiveness
Introduction A special application of group technology (GT) is
the design of a cellular manufacturing system (CMS) where parts having similar (or identical) machine requirements and operation sequences are grouped into families and the complete set of machines in their routings are grouped into machine groups or cells. Any cell formation method must address the critical issues of (1) part family formation, (2) machine grouping, (3) machine sharing between cells, (4) intracell layout, and (5) intercell layout to
meet the organizational and operational goals of a company. 1-7 The machine-part matrix clustering technique for cell formation seeks to identify machine groups and part families by rearranging the random initial 0-1 matrix into a block diagonal form (BDF). Each block of l ' s in the BDF represents a machine group that can perform all the operations for a particular part family.
This paper evaluates a measure for characterizing a good BDF, addressing issues (1) and (2) listed above. Issues (3), (4), and (5) have a broader implication on CMS design and are not addressed as part of this research effort; they require a detailed knowledge of equipment categories for machine duplication analyses, the size and shape of individ- ual cells, intercell layout and material flows, and so on, as in Burbidge's production flow analysis procedure.a Here a broad definition of the problem of obtaining the best BDF is presented. Then a solution strategy is outlined to identify the best BDF, and a literature survey gives some of the graph theoretic clustering heuristics. Next is an analysis of the BDF for each of the machine-part matrixes obtained using these heuristics, and a final section provides conclusions and implications of this research for the cell design problem.
Problem Definition A machine group and its part family together
constitute a block along the diagonal of the final matrix. A block is visually identified as an area defined by a certain number of rows and columns in the matrix within which a large proportion of entries consists of l 's . Rows (or columns) of identical or similar strings of l ' s and O's are placed consecu- tively in the final matrix. A quantitative expression for this "ease of visual identification" should
388
Journal of Manufacturing Systems Volume 12/No. 5
quantify the "total bond energy" between opera- tions within a matrix (measure of effectiveness or ME), 9'1° intercell movement of operations (group- ing efficacy or GE), 11 and congestion cost associ- ated with "nonoperat ions" (or O's) within the boundaries of a block. This is necessary because the ME (unlike the GE) cannot evaluate user-specified partition points along the diagonal to get the optimal number of blocks in the final matrix. The GE (unlike the ME) does not recognize the vertical and hori- zontal adjacencies necessary for visual recognition of the boundaries for each block. And both of these measures do not account for congestion due to the nonoperations that are present in the blocks in the final matrix.
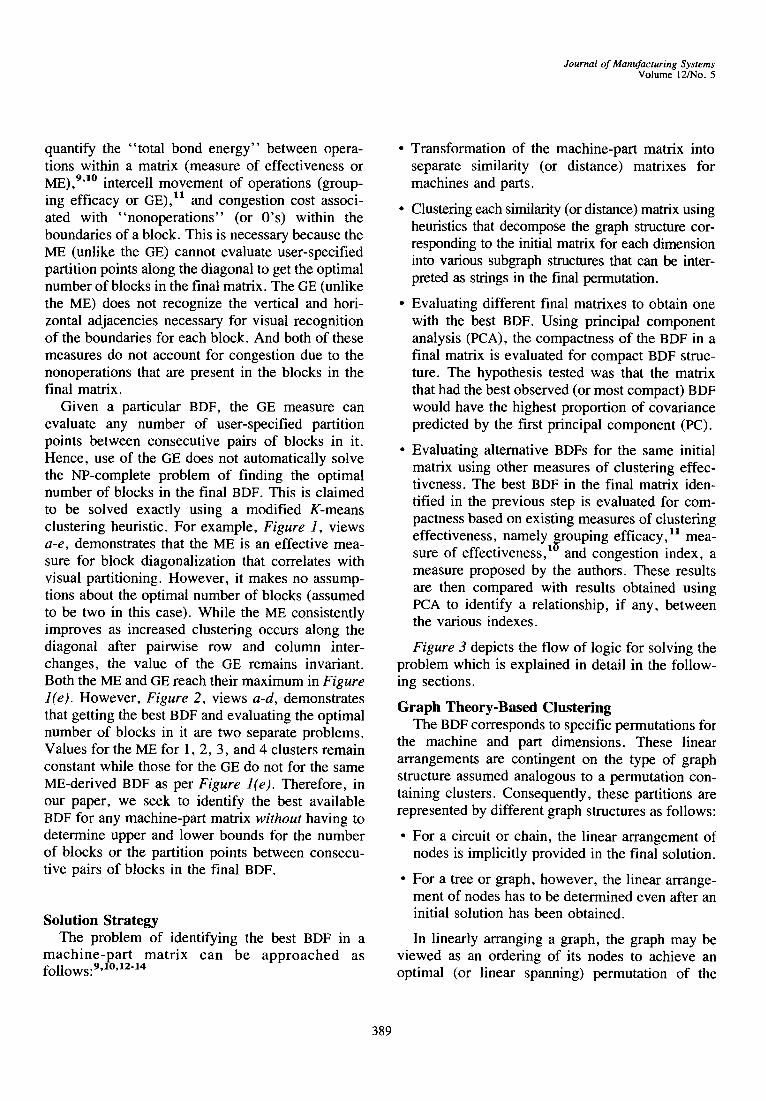
Given a particular BDF, the GE measure can evaluate any number of user-specified partition points between consecutive pairs of blocks in it. Hence, use of the GE does not automatically solve the NP-complete problem of finding the optimal number of blocks in the final BDF. This is claimed to be solved exactly using a modified K-means clustering heuristic. For example, Figure 1, views a-e, demonstrates that the ME is an effective mea- sure for block diagonalization that correlates with visual partitioning. However, it makes no assump- tions about the optimal number of blocks (assumed to be two in this case). While the ME consistently improves as increased clustering occurs along the diagonal after pairwise row and column inter- changes, the value of the GE remains invariant. Both the ME and GE reach their maximum in Figure l(e). However, Figure 2, views a-d, demonstrates that getting the best BDF and evaluating the optimal number of blocks in it are two separate problems. Values for the ME for 1, 2, 3, and 4 clusters remain constant while those for the GE do not for the same ME-derived BDF as per Figure l(e). Therefore, in our paper, we seek to identify the best available BDF for any machine-part matrix without having to determine upper and lower bounds for the number of blocks or the partition points between consecu- tive pairs of blocks in the final BDF.
Solution Strategy The problem of identifying the best BDF in a
mach ine -pa r t matr ix can be approached as follows:9,10,12"14
• Transformation of the machine-part matrix into separate similarity (or distance) matrixes for machines and parts.
• Clustering each similarity (or distance) matrix using heuristics that decompose the graph structure cor- responding to the initial matrix for each dimension into various subgraph structures that can be inter- preted as strings in the final permutation.
• Evaluating different final matrixes to obtain one with the best BDF. Using principal component analysis (PCA), the compactness of the BDF in a final matrix is evaluated for compact BDF struc- ture. The hypothesis tested was that the matrix that had the best observed (or most compact) BDF would have the highest proportion of covariance predicted by the first principal component (PC).
• Evaluating alternative BDFs for the same initial matrix using other measures of clustering effec- tiveness. The best BDF in the final matrix iden- tified in the previous step is evaluated for com- pactness based on existing measures of clustering effectiveness, namely grouping efficacy, 1~ mea- sure of effectiveness, ~° and congestion index, a measure proposed by the authors. These results are then compared with results obtained using PCA to identify a relationship, if any, between the various indexes.
Figure 3 depicts the flow of logic for solving the problem which is explained in detail in the follow- ing sections.
Graph Theory-Based Clustering The BDF corresponds to specific permutations for
the machine and part dimensions. These linear arrangements are contingent on the type of graph structure assumed analogous to a permutation con- taining clusters. Consequently, these partitions are represented by different graph structures as follows:
• For a circuit or chain, the linear arrangement of nodes is implicitly provided in the final solution.
• For a tree or graph, however, the linear arrange- ment of nodes has to be determined even after an initial solution has been obtained.
In linearly arranging a graph, the graph may be viewed as an ordering of its nodes to achieve an optimal (or linear spanning) permutation of the
389
Journal of Manufacturing Systems Volume 12/No. 5
1 1
1 1
1 1
I 1
(K=2) ME=O GE=I/3
(a)
1 1
t , t l
1 I
(K=2) ME=2 GE=I/3
(b)
A 1
I
I S 'u 8
1 1
(K=2) ME=4 6E=1/3
(c)
[1 1 I
I I
I 1
I 1 i
(K=2) ME=6 GE=I/3
1 1
1 1
v
t 1 1
(K=2) ME=8 GE=I
(d) (e)
1
I
w
LEGEND:
K=Number of Clusters(Blocks) ME=Measure of Effectiveness [McC072]
GE=Grouping E fficacy[Sure90 ]
=Horizontal AssociaLivity between c ijs
t =Vertical AssociaUvity between cij's
Figure 1 Clustering to Obtain the Best BDF l° (ME from Reference 10, GE from Reference 27)
machines and parts. Each cluster of machines or parts is reduced to a sequence within the complete permutation for the corresponding dimension of the matrix. A block in the BDF corresponds to a combination of a pair of machine and part strings contained in the respective permutations. If there are n blocks in the BDF, then the pth block in the BDF will form only if its machine and part strings also have the pth position in both of their corre- sponding permutations.
Grouping with similarity coefficient matrixes relies on clustering using graph theory. This is because if objects (machines or parts) are points in
an object space, distances or similarities can be computed between all pairs of objects. A graph is constructed whose nodes represent the nodes to be clustered and whose edges represent relationships between pairs of nodes. Graph theoretic clustering algorithms decompose the graphs into various sub- graph structures by identifying and deleting "incon- sistent" edges. ~s These structures that are analo- gous to clusters are summarized below and depicted in Figure 4:
• Figure 4, view a, depicts objects (machines or parts) connected in the form of a graph.
390

Journal of Manufacturing Systems Volume 12/No. 5
I C
1 1 B
I
1 I I D i
K-4. ME=B. GE=I
(a)
= '~ P s
1 C
1 D
K=5, ME=8, GE=0.75
(b)
1 1
1 I
I I
} I
K=2. P1E-8. GE =I
(c)
LEGEND:
K- N u m b e r of C l u s L e r s (Blocks)
ME = M e a s u r e o f E f f e c t i v e n e s s [McC0721
GE = G r o u p i n g E f f i c a c y [SuregO]
a • p ,S
1 I
I I
1 1
I 1
K=I, ME-8. GE-O.5
(d)
Figure 2 Problem with Poor Choice of K
(ME from Reference 10, GE from Reference 27)
• Minimum spanning tree (MST) 16"1a is a minimal acyclic, connected graph where each node has at least one edge incident to it (Figure 4, view b). The MST is a lower bound to the TSP and builds clusters based on the "nearest neighbor prop- erty" between points in an object space. 19 A single linkage cluster analysis (SLCA) dendro- gram can be reduced to a minimum spanning tree (tree). 16,20
• Traveling salesman problem ( T S P ) 9'12 i s a tour of minimum weight extracted from a completely connected graph passing through each node exactly once (Figure 4, view c). Lenstra and Kan 9 have proposed that the clustering problem
• for a p-dimensional array can be solved as p TSPs. Accordingly, the machine-part matrix clus- tering problem can be solved as two independent
/ / In#ial Machine Part
0-1 k~tdx
I, ............. I ,t / " .o . , . . - .ao . , . 2 I t.usr 'l
. . . . . ; y ; imilarity Aalrix /
CiuiIering ]
> L..s, 7 l ~ ~ I I
I ,,~ V I I / y . . . . . . . . Machine-Part (o-1) Mal f i x
PCA Evaluat~n for b u t BDF
/-..! Final MachiCI-Pllrt (0-I) Maldx
Figure 3 Identification of the Best BDF for a Machine-Part Matrix
problems using similarity (or distance) matrixes for machines and parts, respectively.
• Hamiltonian chain (or an open TSP-tour) (HC) zt-22 is a tour of a graph that has a chain passing through every node of the graph exactly once (a TSP circuit minus one edge). The shortest spanning path problem (SSPP) 23 is an example of an HC. If the link joining the two end nodes of an HC is added, the resulting circuit is called a Hamiltonian circuit (Figure 4, view d).
• Assignment model (AM) (subtours or nonoptimal TSP solutions) ~ is a disconnected graph or non- Hamiltonian circuit. Instead of a single circuit, there are p subtours (p<--n/2) where n is the number of nodes in the graph (Figure 4, view e). The constraint that the solution must form a tour makes the AM a lower bound on the TSP.
• Strong components for hierarchical clustering 2s are a maximal set of vertices in which there is a path from any one node in the set to any other node in the set (Figure 4, view J).
391

Journal of Manufacturing Systems Volume 12/No. 5
i l l i l l l I~11~11
t_t_Lq_LL~ ( , ) (b) (c)
Poinlz in • lwo A Mlnim~ Spannlflg A Closed Ckcult dirrteflliOfml m Tt'ee cofmc~-ts I l l connecting ~ v l r l~el
(Graph) b'lese po~ts gives • TSP-tour
C~3,.CH / IX I Y'C~] [ I
1.)
sub-tours cc~necting the Verlices
(Allignmenl problem)
(d)
An ec~n TSP.taur of the ver~..** hi s
Hau~il~nlan Chain
(r) (g)
Slrong ~ n t s measure Clique pcovides • Maxk~d Reachability between all ~ Subgraph of Verlicell in * lint:din1 of Vetoes in • Graph Verlio~ of It~ Gr~h
(h) (i) ( j )
Linelr ~ r s n ~ m ~ of • Graph Uni-direcli~lal Arrangement Bi-directiomd Arringement of a Tml of a Tme
Figure 4 Graph Structures Used to Interpret Clusters
• Cliques of a graph 26 represent clusters because a clique is a maximal complete subgraph such that each pair of its nodes is connected by an edge of minimum specified weight (Figure 4, view g).
• In the case of linear arrangement of a graph or a tree, the nodes of the tree are ordered in some linear fashion (Figure 4, view h). For a tree structure (for example, MST), the linear embed- ding for its nodes can either be unidirectional (Figure 4, view i) or bidirectional (Figure 4, view j). ~3 For a chain structure, the order of the nodes is implicit in the final linear solution. A variation of this is the linear placement problem (LPP), 27 which obtains a linear embedding for a graph that minimizes the sum of the product of edge length and weight for all edges in the graph. Complete linkage cluster analysis (CLCA) uses complete subgraphs to represent clusters. Unlike the LPP, it considers only the edge weights for all pairs of vertices when forming the clusters.
Table 1 summarizes the characteristics of the above methods. The common approach employed by these methods is that:
Table 1 Classification of Graph Theoretic Algorithms for Clustering
Clusta*~ng Graph Permutation Search Computation Graph Quality of Method Structure Generation Technique Time Size Solution MST Tree No Depth.First (n 2 ) (n- 1) edges Optimal
SLCA Tree No Depth-First O(n 2) (n- 1 ) edges Optimal
TSP Circuit Yes Generate and O(n 3) n edges Local Improve Optimum
HC Chain Yes Generate and .O(n 4) (n- i ) edges Local Improve Optimum
AM Circuits Yes Hungatum O(N 2) n ed8¢5 Optimal Method
Strong Graph Yes Depth-First O(M Log N) All edges Optimal Components
CLCA Graph No Enumerative O(N 2) All edges Local Optimum
LPP Graph yes Steepest .0(n 4) All odges Local Descent Optimum
• Each one decomposes the graph into one of the following three basic structures:
• Chain or circuit.
• Tree.
• Graph.
• The decomposition is in the form of cluster(s) representing a relat ionship between nodes (objects) represented by the weights of the edges connecting these nodes.
• All methods are based on the spanning property of a graph. In the context of the machine-part grouping problem, the difference between the heuristics lies in how they obtain the linear spanning (or permutation) structure. This has an important bearing on the (1) quality and (2) complexity (or computation time) of the solution method used. The Hamiltonian chain or circuit (HC) and linear arrangement of a graph (LPP) methods assure the final linear spanning solution to the problem, whereas for the tree structure the linear embedding of the nodes has to be subse- quently derived.
• All methods employ heuristics ranging from the simple "nearest neighbor" to the more complex "steepest descent" to obtain the permutation.
Table 2 summarizes how some of the graph struc- tures measure up to the above evaluation criteria.
From the above comparison, it is evident that the choice of a method will have to depend on the tradeoffs that are acceptable between the quality ot the solution and the computation time.
392

Journal of Manufacturing Systems Volume 12/No. 5
Table 2 Graph Structures for Permutat ion Generat ion
Criteria
Computation Time
Type of Objective Function
MST
O(n 2)
Minimize ~wij V(id) tT
Description of Sum of the Objective Function 'weights of (n-l)
edges
Linear Spanning No Solution
Clustering Hemistiea
TSP LPP
O(n 3) O(n 4)
Minimize Minimize Y-wijdij 5~wijdij V(i,j) eC V(i,j) s,O i=l....n.l j=i+l d~i=l V(i,j)
Sum of the Sum of the weights of n goduct of edges, when: length and each edge has a weight of all length of 1 ' edges
Yes ! Yes
Evaluation of Different Block Diagonal Forms The two permutations, one each for machines and
parts, generated by each clustering heuristic will combine to generate a different BDF which, in turn, could have a large number of alternative partitions. Therefore, if we use the existing measures of clustering effectiveness ~°-~ then, prior to compar- ing these BDFs, we will have to solve the NP- complete problem of finding the best partition for each of them. Such a strategy is definitely not recommended.
Another disadvantage of using these heuristics for permutation generation is the assumption that the best BDF corresponds to two independently derived permutations. The objective functions they use are based on the similarity coefficients com- puted for all pairs of rows or columns. Unfortu- nately, each row or column is already a cluster of points. Hence, each point is not being treated as an object during the distance computations. The dis- tances between individual pairs of points are being forcibly absorbed into the similarity coefficients for pairs of rows and columns that, in turn, forces characterization of the BDF based on two unrelated objective functions, such as the cost for each of the two permutations. But if we treat the BDF as several clusters of points in two-dimensional space, then it becomes possible to characterize the BDF in one dimension using a dimensionality reduction tech- nique such as principal componen t analysis
(PCA), 28 treating each operation (or " 1 " ) in the matrix as an object.
This research used PCA to characterize the most compact BDF for any machine-part matrix without having to determine upper and lower bounds for the number of blocks or the partition points between consecutive pairs of blocks. PCA requires a two- dimensional (x,y) coordinate representation for the BDF in each final matrix. This representation offers a simple visual means of either detecting or verify- ing the existence of clusters when most of the variation in the original x,y coordinates of the 1 's in the BDF is predicted by the first PC.
The BDF obtained by various heuristics is trans- formed into a two-dimensional (x,y) spatial repre- sentation for its operations (C•= 1). PCA for this representation finds a one-dimensional subspace representing the best possible fit of a line to the set of points in the problem space. This is illustrated in Figure 5. The new coordinates (Xl,Yl) are obtained by rotating the original (x,y) coordinate frame by an angle 0 such that x I = x(cos 0) + y(sin 0) and Yl = -x ( s in 0) + y(cos 0).
The projection OH 1 of vector OM l on the one-dimensional subspace defined by U~ is the scalar product of OM 1 and UI (a unit vector). To fit a one-dimensional subspace, U~, to a spread of n points, the sum of squares of the distances (or least squares) is minimized:
n
~ , (MiH2i ) i = l
Similarly, a q-dimensional subspace can be found for q < p (p->2) or iginal d imens ions (or variables). 29
In the general case, the q-dimensional subspace that is the best fit in terms of the least squares criterion to the points in the original p-dimensional space is generated by the first q eigenvectors (U 1, U 2 . . . . . Uq) of the symmetric matrix CC r corre- sponding to the q largest eigenvalues (h 1, ~'2 . . . . . hq) where ht>-- h2>-...>-- kq.
PCA can fit at most two PCs--PC 1 and PCz--to the original two-dimensional data, where PC~ is a pseudodiagonal for the BDF and PC z is orthogonal to it. Essentially, the same points can be plotted with PC 1 and PC 2 as the new horizontal and vertical
393

Journal of Manufacturing Systems V o l u m e 12/No. 5
YI ,y
B
R F e
= DM1 + AB 0 Y~ = - X S i n O + Y C o s O
= B O - BF
X , Y = Original Variables X1,Y 1 = Transformed Variables
R = Original Problem Space U 1 = O n e Dimensional Sub-Space
Xl
o Hj *
Figure 5 Orthogonal Projections of Points Onto a One-Dimensional
S u b s p a e e z9
axes, respectively. When the points fall into well- defined clusters as in a compact BDF, then PC 1 would explain a significant proportion of the cova- fiance. We have proposed that, given several BDFs, the most compact BDF would correspond to the one whose PC1 predicts the highest covariance for the x,y coordinates for the final BDF.
It can be observed that, in general, a "compact" BDF corresponds to a rectangle (L>>W) that is inclined at some angle 0 to the orthogonal directions (~ --* ) in which the row and column permutations are performed. Pairs of points in different blocks will be separated by a larger distance along the diagonal than in the direction at right angles to the diagonal, as shown in Figure 6. Points projected onto PC~ will be separated by greater distances compared to the values for PC2, especially if these points belong to different blocks in the final BDF.
The matrix for which PC~ predicts the largest proportion of covariance is adjudged the best BDF among the matrixes evaluated.
Other Measures for Evaluation of BDFs To obtain a BDF, the final machine-part matrix C
needs to be partitioned into, say, a maximum of k clusters. This gives a total of B=(k-1) cluster partition peripheries (CPPs) for the entire BDF (Figure 7).
X
Figure 6 BDF with Principal Components
Each CPP in turn has F(Q,Q+ l)= (MQ x PQ) partition points, where
MQ = potential partition points along the machine dimension at Qth CPP and
PQ = potential partition points along the part dimension at Qth CPP
Thus the total number of partitions of the BDF to be evaluated to get an optimal BDF for a given matrix is
k - I
I-I F(Q,Q+ 1)
Q = I
where F(Q,Q + 1) is the number of potential partition points that could separate the Qth and (Q+ l)st consecutive blocks. Because the number of poten- tial partition points can quickly increase as the number of clusters increases, the problem of finding an optimal partition of the BDF is clearly a combi- natofially explosive problem.
394

Journal of Manufacturing Systems Volume 12/No. 5
Blocks
. / MACHINES
i
J
\
Cluster j Partition
Periphery
\ Potential Partition Points (M ox PQ )
Figure 7 Alternative Partitions of BDF in Final Machine-Part Matrix
In the light of the above problem, the approach taken in this paper is to adopt a strategy that, while ensuring the compactness of the BDF, eliminates the evaluation of partition points based on blocks that are visually defined. The steps suggested are as follows:
• For each final machine-part matrix derived using a given heuristic, the CPPs are identified on the basis of the weakest link (when using a similarity matrix) and longest link (when using a distance matrix) between consecutive blocks.
• For each CPP, partition points are chosen ran- domly in each of the machine and part dimen- sions. This results in alternative partitions of the same BDF, each of which will have a unique set of intercell flows, machine groups, and part families.
• Each of these BDFs is then evaluated for com- pactness by the methods discussed later in this section.
• The clustering method that offers the best possi- ble BDF has the following:
(a) The highest proportion of covariance in the original x,y distance matrix explained by PC~.
(b) Displays the highest clustering effectiveness index value for various compactness mea- sures among all alternative partitions evalu- ated in the final machine-part matrixes.
An obvious measure of the quality of a BDF is the relative ease with which blocks in a final machine- part matrix can be discerned visually. Thus, any index for clustering effectiveness or compactness must recognize the following:
• Bond between operations within a matrix.
• Intercell movement of parts between cells.
• Congestion cost associated with "nonopera- t ions" (or O's) within the boundaries of a block.
A discussion on each of the above issues follows.
Bond Between Operations Within a Matrix The bond energy (BE) approach to measuring
BDF compactness works on the premise that, in a machine-part matrix, a bond exists between the elements of each pair of adjoining rows or columns. The measure of effectiveness (ME) (or total bond energy) of an input array C is the sum of the product of each element Co( = 0,1) with its four adjacent neighbors,
g N
ME= Z i= l j = l
Ci j~Ci j+ l Jr- C i j_ I q -Ci+ i j - q - C i _ l j )
where C~/ = 0 or 1
i = 1 to M (number of machines) j = 1 to N (number of parts)
This measure incorporates the bonds within each cell as well as among different cells. 3°-32
Intercell Movement Between Cells This measure of compactness recognizes the
inefficiencies due to voids (a " 0 " element appear- ing in a diagonal block) and exceptions (a " 1 " element appearing in the off-diagonal blocks) in defining the compactness of a BDF.
395

Journal of Manufacturing Systems Volume 12/No. 5
The expression for GE 1 is as follows:
( l - q , ) GE = F - - -
(1 +0)
where
xF =
O =
Number of exception elements
Total number of operations
Number of voids in the diagonal blocks
Total number of operations
Congestion Cost Associated with Nonoperat ions
Any definition of compactness of a BDF requires a definition of a "perfect system." The GE measure is based on the premise that the perfect block diagonal structure is a structure where elements in any block in the BDF are all l 's. This implies that every part in a cell is routed to every machine in that cell. From a manufacturing perspective, this is not necessarily the best system. There may be parts in a cell that do not require processing on certain machines in that cell. In other words, there may be some O's in the blocks along the diagonal and yet it may be the best structure for any given matrix.
The current system (the initial machine-part matrix) is used as the reference point and efficiency is defined as the fractional reduction in the cost with reference to that system.
In comparing different block diagonal structures for a given machine-part matrix, four main costs are considered:
• Operations cost associated with 1 's inside blocks.
• Machine duplication/divisibility cost.
• Intercell transportation cost associated with l 's outside blocks.
• Congestion cost inside blocks associated with O's.
Assumptions:
• In this pre-analysis stage, machine duplication or divisibility is not allowed in the BDF. Hence these costs are assumed to be " 0 " . This condi- tion will need to be relaxed while considering exception operations in the next phase of cell
design--developing the intracell layout for each machine group and the intercell layout for all the groups.
• For a given matrix, total operation cost associated with 1 's inside blocks has been assumed constant.
Explanation o f Cost Associated With O's in the Matrix:
• A " 0 " for a part in a block simply states that the part does not require any processing on that machine. It will not consume any available capacity on the machine.
• The O's within blocks are a measure of some sort of congestion due to an increase in the number of dissimilar parts that must now be scheduled in a larger cell to eliminate intercell operations. This congestion in a block depends on the number of parts and machines included in the block. An increase in the number of parts within a cell is likely to increase the number of O's associated with the machine-part pairs.
As the number of parts increases, the number of O's in the block will increase. Due to the dissimilar machine requirements of the cell, the complexity of the intracell group scheduling problem will increase. Implicitly, the work- in-process levels, sequence-dependent setup changeover times, and average throughput time per part will also increase.
• Based on the above argument, in the effective- ness index, the cost for an intercell move corre- sponding to a " 1 " outside the BDF should be weighed differently than when the same " 1 " is absorbed into a block. This is because merging of two or more smaller blocks will result in a larger cell with correspondingly larger intracell delay times.
We propose the following index for effective- ness:
q' _ v 1 ( O i - O 2 ) --1- v2(Zl-Z2)
N T + v1(O2) + •2(Z2)
where
O 1 -- number of l 's (or operations) outsid~ blocks in the existing system
396

Journal of Manufacturing Systems Volume 12/No. 5
02 = number of l ' s (or operations) outside blocks in the proposed system
Z z = number of O's (or voids) inside blocks in the existing system
Z z = number of O's (or voids) inside blocks in the proposed system
N r = number of l ' s in the matrix v I and v 2 are weights assigned by the analyst (in
this study, they have both been assigned a value of 0.5).
Analysis of Results The example analyzed in this study is an 18 × 24
machine-part matrix obtained from an industrial case study, 33 as shown in Figure 8. This matrix is transformed into separate similarity coefficient m a t r i x e s , u s i n g t he J a c c a r d s i m i l a r i t y coefficient. ]7,34
Cluster ing in Each D i m e n s i o n The algorithms used in this study force a linear
spanning structure for the clusters in the graph representing the matrix of similarity coefficients.
J 1 2 3 4 $ I I 7 8 9 10 11 12 13 14 15 16 17 ] 111
1 1 1 I
2 1 1 1 1 1 2
3 1 1 1 3
4 1 1 1 1 4
5 1 1 1 1 1 1 5
6 I 1 1 6
7 1 1 1 7
e ? 1 1 t 1 o
o 1 1 1 1 1 9
10 1 1 1 1 10
11 1 1 I1
12 1 1 1 1 1 12
13 1 1 1 13
14 1 1 1 14
15 I I I I I 15
1 6 1 1 1 6
17 1 1 ' 1 1 1 17
l O I 1 1 i 1 0
19 I 1 1 19
20 1 1 2 0
21 1 1 1 21
2 2 1 1 1 2 2
2 3 I 1 1 1 1 2 3
124 1 1 1 1 24
1 2 3 4 5 6 7 8 9 10111 ]12 13 14 15 16 17 18
8j j . 1, if p i l l i visits machir~ } for processing
I~ j . 0 , if part i dc4s not visit machine } for procec~ing
Figure 8 Initial Machine-Part Matrix 33
The STORM 35 and SAS 36 software packages for an IBM PC were used because they provide efficient implementations for the algorithms listed in Table 3.
As can be seen from the output in Figure 9, views a and b, for a tree structure, the order of the nodes in the permutation can only be determined after its linear embedding is obtained. The linearization of the tree can be effected from any of the 7 pendant nodes 2, 17, 9, 18, 10, 14, and 15 for MST m, and 10 pendant nodes 20, 17, 9, 12, 23, 16, 4, 22, 19, and 21 for MST e, uni- or bidirectionally. This will yield at least 70 (7 × 10) alternative final machine- part matrixes. We studied the three final matrixes obtained using the unidirectional tree linearization strategies developed by Chen and Irani. ~3
A visual inspection of the final matrixes gener- ated by the different heuristics reveals that all matrixes, except for those obtained using the SLCA and CLCA heuristics, display distinct blocks along the diagonal. These methods, for the most part, obtain the same groups of nodes for each of the clusters observed in the different matrixes, as follows:
Common Nodes Common Nodes Block Location on the on the
in the BDF Machine Axis Part Axis
North-West 1,2,8,9,16,17 Center 3,7,10 South-East 11,12,13,14,15
1,3,4,10,20,23,24
2,5,8,9,12,15,17
6,7,13,14,18,19,21,22
Table 3 Heuristics Evaluated for Clustering Effectiveness
Clustering Algorithm Sohwaze Input Data Output Method Package
MST* P~n'sAIgorithm ;TORM D i ~ Tree Prim57] (Figs. 9.a,b)
SLCA Sheath's STORM Distances Deodmgram Algorithm [SAS88] (l~gs. 10-a.b)
TSP Lin and Ke~ighan. STORM Disumces Ckcui[ Algorithm [Lin73] (Figs. I I-a,b)
LPP Modified Steepest STORM Similmity Chain Descent Algorithm Coefficients (Figs. 12-a.b) [Anno63. Vo1168]
Lpp B! Modified Steepest STORM Similmity Linear I)escem Algorithm Coeffidents Embedding of
MST ~iles. 12-a,bl
CLCA Sorensen's SAS Distances Dendrogr~ Algorithm [SAS88] (Figs. 13-a,b)
* The matrices obtained using the three strategies for unidirectin~al linearizafion of the MST ) ~ by Chen m~l lrani [Chen91] were evaluated.
TUe LPP method was odapted to obtain the bi-direcUonal lineanzation of the MST (Figm'es 16a and I ~ ) .
397

Journal of Manufacturing Systems Volume 12/No. 5
.3
.75
,7
I) Tnm
i) Tree
II) Uni-DJrectlOnal Llnea~allen
C
-Ok'e¢ tlc.sal "J) ~1,,,,,~,,~
1.0
[
I 75
__- 5C
~ 0
Figure 10 (a). Dendrogram of Machines from SLCA
Figure lO(a) Dendrogram of Machines from SLCA
Figure 9(a) Minimal Spanning Tree for Machines
1 I
ii) Uni-cliroclicmal linotrization iii) Bi-dimcliorml iinearilalior
Figure 9(b) Minimal Spanning Tree for Parts
.75 .8(
.5O
. 4 (
.3.'
. 2 5 . 2 (
I I
Figure lO(b) Dendrogram of Parts from SLCA
However, it is the permutation within each group of nodes that makes the blocks appear either visu- ally compact or sparse in their respective matrixes. In addition, some of the nodes are being misas- signed by the methods away from their logical groups, depending on the clustering properties of the search algorithms and objective functions.
For example, in the matrixes obtained by the MST linearization methods (Figures 14-16), the significant dispersion due to poor linearization occurs only in the northwest cluster. The improper
398

Journal of Manufacturing Systems Volume 12/No. 5
2 3.s
i ~ 13"5
,i 1t7
1.333
4.S
i) Unbiased Solution li) Biased SoluIion
Figure 11 TSP-Tour Representations for Final Matrix
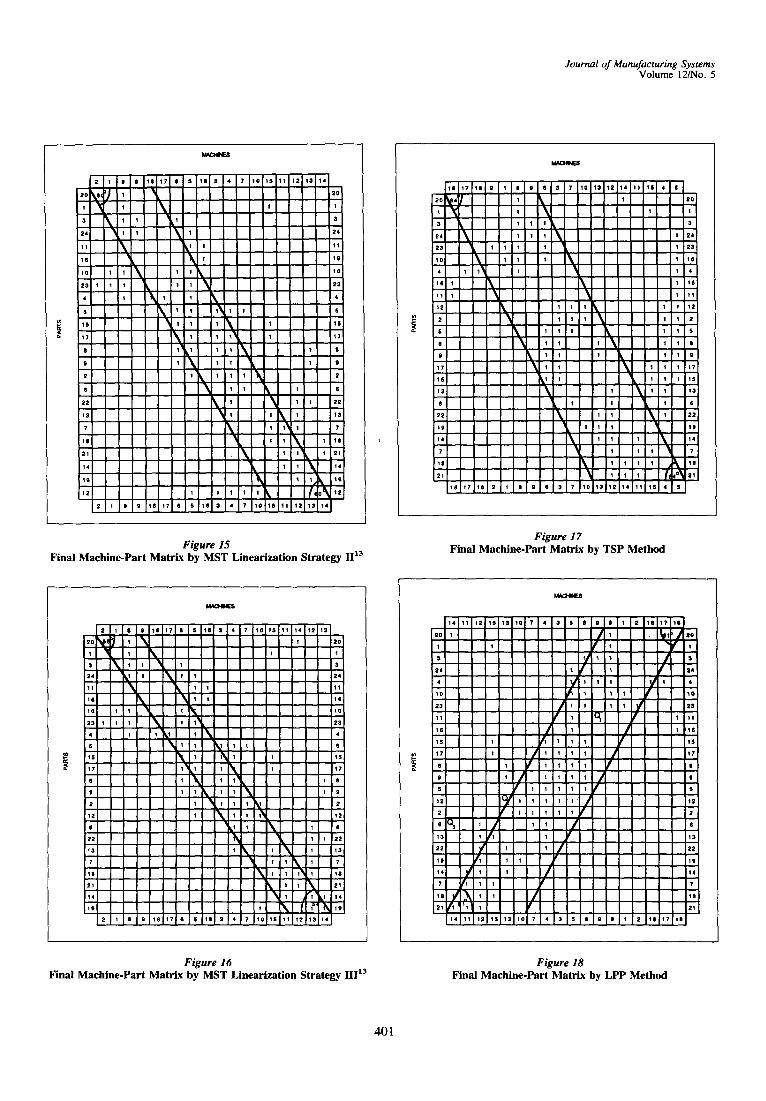
placement of nodes 16 and 17 on the machine axis and nodes 1, 3, 4, 10, 20, 23, and 24 on the part axis jointly contribute to the problem. On the contrary, nodes 16 and 17 on the machine axis have been pushed to the end by the LPP and TSP methods so that nodes that have stronger bonds are placed next to each other. Thus, the cluster appears more compact visually. This is evident by the manner in which nodes 5, 6, 9, 8, 1, and 2 for the LPP method and 2, 1, 8, 9, and 6 for the TSP method are placed in their respective BDFs.
In the center cluster, a similar situation as above can be attributed to the location of node 18 on the machine axis by the MST, LPP, and TSP methods. In this cluster, the LPP method has placed nodes 10, 7, 4, 3, 5, and 6 displaying close bonds next to each other. The TSP method, however, has placed nodes 4 and 5 in a comer, thus rendering the BDF sparse.
In comparing the BDFs in Figures 17 and 18, we can observe that in the machines dimension, the relative grouping of machines into three clusters is consistent except for machines 4 and 5. In the TSP solution, they have been misclassified, that is instead of being grouped with machines 3, 6, and 7, they have been positioned adjacent to the cluster defined by machines 11, 12, 14, and 15. Hence, the
I~) Pans
I) Biased Solution
C
C
(
( (,
.(
ii) Un-blued Solution
Figure 12(a) Figure 12(b) LPP for Machines LPP for Parts
BDF of Figure 17 shows cluster dispersion com- pared to the BDF of Figure 18. Both methods yield similar permutations in the parts dimension.
A comparison of the BDFs in Figures 18 and 19 confirms that both BDFs are identical in the machine and parts dimensions and match to create each block in the BDF. The only misclassification observed was that of machine 18 in Figure 19, incorrectly grouped with machines 3-7 instead of being grouped with machines 1, 8, 9, 16, and 14.
The reordered matrixes obtained using the SLCA and CLCA algorithms contain dispersed clusters that failed to produce even a block checkerboard form (BCF). :° This dispersion is primarily due to the machine permutation produced by either heuristic. Compared to BDFs obtained using other heuristics, strings of machines that should appear consecu- tively are now split over two or more nonconsecu-
399

Journal of Manufacturing Systems Volume 12/No. 5
1 . 0
.75
. 5 0
1 3 45
Figure 13(a) Dendrogram of Machines from CLCA
.75
) j .so
L
1.o
. ; '5
.SO
.2S
0
Figure 13(b) D e n d r o g r a m of Pa r t s f rom C L C A
i . 0 I
i
i 75
50
i
25 I
i
tive locations in the permutation. For example, with reference to Figure 21, machines {1, 2}, {8, 9}, and {16, 17} should have appeared together. Similarly, {3, 4, 5, 6}, {7, 10}, and {18} should have appeared consecutively. Likewise, with reference to Figure 20, machines {1,2}, {6}, {8, 9}, and {16, 17} should have appeared together, and machines {3, 4, 5}, {7, 10}, and {18} should have appeared consecu- tively. This is contrary to the approach proposed by Seifoddini 4] who used the permutations of nodes at the base of the machine and part dendrograms to obtain a BDF. His approach will work only when the input matrix anyway has almost machine groups (and part families) that will naturally result in a perfect BDF.
20
i
$
4
10
23
11
l a
S
iS
11
e
0
2
i;Z
e
2 )
13
?
se
21
14
I 0
] U U U ~ W U O ~ O B U N W N W D H ~ n l d a i l l i m i i N a g l l ~ l g i i l i i t i i l i | U l t l I o n g n o g l i l i l i l H l l l |iaumiaulimmmmilil im muu uimmmmmmumn nnmamin~immmmmmiai a m l ~ m m n ¢ i mimmmmmm i i n ~ l l l i
\ , \ I l
\ , , ¢ ,I 1,1, i
~ "! '1 1~ I 1 !
' \ ' i ,u s L!
I I :
I l l l U l l l l l l m m n l m l n m n l i l i l l l l l l | B R D ~ N D O m [
~ | i l l m l u | g m i | l n u u ~ u w q i IWWm~KU| ) l i U ~ i H l I ~ i g o ~ m i I ~ l O O ~ i i l u i n u ~ n
I m U ~ i R R [ I m ~ m l m ~ o
Figure 14 Final Machine-Part Matrix by MST Linearization Strategy I La
Selecting the Best BDF To identify the matrix with the most compact
BDF from those presented in Figures 14-21, Chan- drasekharan and Rajagopalan 43 first decide on the number of clusters and also select the cutoff points between adjacent pairs of blocks. But, as explained in the Problem Definition section, these assump- tions are effectively the end results that we seek for this problem.
To overcome this problem, PCA was performed using the PC version of the SAS package. ~ This was done to measure the compactness of the BDFs in the final matrixes in one dimension (equivalent to the diagonal of the matrix) without having to define the upper and lower bounds on the number of clusters as well as the cutoff points between consecutive blocks. Each final matrix was transformed into a two-dimensional spatial representation of opera- tions (if Cu= 1, then X= i and Y=j). Thus, for the BDF obtained by the LPP method (Figure 18), the
400
Journal of Manufacturing Systems Volume 12/No. 5
M4CHNSS
2 1 ; 0 ° 1~ 17 O ° II I $ 4 7 I 0 lS i l 12 13 14
'°~ k°, ') I ~
24 ~ 1
lO 1 1
23 1 1 1
4 i
S
l °
17
l°
°
2
S
22
1 3
7
21
141
\ k'
\,
k , , \ ,~'
k ' I i
\ llkl
,\
, k,
i i i l
I I l
,'kl, 1,\
\,
\
k
I
i
I
I
k '
1 I ) k 1
i o o a o = m a o m a a o = = m m m o
Figure 15 Final Machine-Part Matr ix by MST Linearization Strategy II ~3
6 ~ 7 10 13 12 I : 11 IS 4 ~ 20
l~mmmmum~mmmmmmmumm lmlmmmunnammmmmmmmm umpmnmunnpmmmmmmmmuu ammauuumnmammmmmmin~
nmn~mmammm~mmmmmmmn| anii~mmmmmi~mmmmmmuu unmm~mmmmmm~mmmmmmum amimm~mmmumn~mmmmunu ammmm~mmmann~mmmmauu Immmmm~mnaumm~mmmum wmmnm~mnammn~mmmnm mmmmmm~nuimnmammunm n m m m m m m ~ n n m m m m o m n u m nmmmmmmmagimnillaaa| ummimmmm~mmnmuipuumN mimmmmimanmmumsanmm nmmmmmmmnammnummanm~ nmmmmmmmm~aumnmm~im ammmimmmmmamnnmnmam mmmmmmmmnm~mmamnu~mm ammmmmmmmmm~moonum~ ammmmmmmmmm~mnnam~
, , i , , l ' . i ' I , I . I0 I° I , I , I , . I , 31 , , I , , I , , I , °1 , I °
Figure 17 Final Machine-Part Matrix by TSP Method
i n n n n n n a n m a a n n n n n n n i a~n~mlimmmmmmmmnlmn mNunm~mmmmmimiummmm nm~nnNunmmmmmimmmmm mmaumounmmmmiimmmmn ani~mmmanummmmimmmmn :mmm~mm~aummmmmmmmmn nmuu~amn~mmmmmmmmmmm a n n n m p i n ~ o m m n m m m m m m ~ lnmnma3mnpmmmmmlmim| lmmmmm~unmaunmmmmmmt wimmim~ni~umnummmmm
nmmmmmmnn~un~mmmmmR
m i i m m m m n m a n n ~ i m m m m m
ammmmimmmmm~mmigmunu ummmmmmmnimu~mm~mumm nmimmmmmmmim~amnNumm )mmmnimmmmmmmpnn~umu :mmmmimmmmmmmm~nuame smmmmmmimmmmm~ng~am mmmmimmmmmmmnm~ua~u m u u a a m m a a m u a u m = m m m m m
M ~
m m n m m m m n a a n a o a n a n = ~ =mmmmmmmmmm~nmmm~T mmmmammnmmmm~nmmmm) mmmmmmmmmm~uummm~m mmmmmmmmma~mammm~m mmmmmmmmm~noomm~m mmnmmmmmm~nmunm~mm mmmmmmmm~mamma~mmm )mmmmmmmm~nm~mm~mmm mmnmmnnmmlmmm~mmmm mmmammm~maammmmmmm mmmomm~onmam~mmmmm )mmmmnm~onnnm~mmmmm mmmmo~monna~mmmmmm mnmmm~uuumn~mnmmmm ummmm~nnnun~mmmmmmm ammmm~nnunn~mmmmmmm )~mn~mmunm~mmmmmmmm nmmu~mmmnmmmmmmmmmm nmm~mnmmu~mmmmmmmmm nmm~nnnmmammmmmmmmm um~nmomm~mmmmmmmmmm m~unmnmmmmmmmmmmmm a~nmmm~mmmmmmmmmmm nlmnmmmlmmmmmmmmmmm m m m m m m m u a a o a a a u a = m a
Figure 16 Final Machine-Part Matr ix by MST Linearization Strategy III t3
Figure 18 Final Machine-Part Matrix by LPP Method
401

Journal of Manufacturing Systems Volume 12/No. 5
I~$IIIIiIIIIIIIiiIl O[UIUidilIIIIIIIllI IldIIiIlllIllIlillI BIIIIIIPIIIIIIIIIII ]II~IIIIlIIIIIIIIII IInIIIiI~IIllIllllI BIIU~UllllllllllllI IIUIl]nIl[lllllllli llnIIIllII~IIilllli IniIil]iIIIIIiiiiii IiIIIl[IIIl~Illllli DiiiUli~IIiigiiiIii O l i u n u n l g n m n ~ i i i i i n Inilinuu~IiIn11Iiil ommimmuuD]iIl[nlill IiIIIlIll[iIII]Illl IllllllllIlIII[Inln Illlilllll[iIll~nll IiiiiiiIini~IiiIiII OIIIIIIIIII[IIII~II IlllllllllII~lllllI IIllIIIIIlllIllII[I IIIIniiiiIiii~iIi[~ DIUIIIIIIIIIIIlIII[I
"11 '1 '=1 "1 "1 ' *1 ' I " I ' I "1 = I " 1= I ' 101°1 "1 '
coordinates of each of the 1 's in the final matrix will be represented as follows:
Machine (~) Part (j') X ( = ~ Y ( = j )
14 20 1 1
8 20 13 1
5 24 10 4
From Table 4, it may be noted that PCA for the BDF obtained by the MST linearization strategy I gave the highest proportion of covariance (0.891). Also to be noted is the highest correlation of 0.7601 between variables x and y in the same matrix. This explains the fact that the chances of getting a higher proportion of covariance are improved when the variables are highly correlated because they corre- spond to the most compact BDF. Hence, this method produced the best BDF of the eight matrixes evaluated.
Figure 19 Final Machine-Part Matrix by LPP Method Biased
with MST Solution
• I I 4 I , 2 I ' ' ' 6 , , , , 1 1 12 14 13 15 10 16 17
1 1 1 II
1 1 1 11
l 1 1 1 1 1
I I 1 1
1 1 1 1
1 1 1 1
I 1 1 1
1 I
I
I
I
I
I I
I I
I I
I
I , I ,
Ii
f ~ | 20
12
S
I 8
I 9
I 15
I I ,
1 6
1 I 13
1 I 7
I I I 10
I l 21
I l 14
l I 19
I I 22
i
1 I ~ 24 I
i
t / 10
I 25
l I t | 4 i
, t,d,6 I N H H R N H H u | [] m ~ f l H H I I
MACHINES
' I i , 213 , o ,o,o 9 .,2,51, ,6 i, ,8 I " 7~ I I i \
20 ~'~ • ' .. I t
4 ~ 1 I 1 ! 1 1
3 I t 1
~., ~ , , I , , \
\ 10 I I I [ I t
2 3 1 I~ 1 1 I
- \ 2 I I I I t
0 I I I 1
15 1 ~ I I I 1 \ I 17 1 I I 1
,, i I I ,6 ~, ~ "
6 lllU~lUIillUIlniIl ,~ iniuiiiniliinnuiln 22 iuinIilgiiiiigiiiiu , , InIiILlgIInIUnIIII1 ,o, IIIinIIIgniIniIIll , iIiiiiginnIunnini1 , . IIIIIIIIIIIIUgngIII 2," InllllIlnlllHDillnff
t
l i l l l l H I I n n u I I l n e ! i n n n u n m n n n n m n n m n m u
Figure 20 Final Machine-Part Matrix by SLCA Method
Figure 21 Final Machine-Part Matrix by CLCA Method
402

Journal of Manufacturing Systems Volume 12/No. 5
Other Measures of Clustering Effectiveness To validate the conclusions on the best BDF
arrived at using PCA, the clustering effectiveness of all eight heuristics was evaluated using other known
Table 4 P r i n c i p a l C o m p o n e n t A n a l y s i s I n d e x o f C l u s t e r e d M a t r i x e s
Clustering tleuristies
SLCA
MST-I
MST-II
MST-III
TSP
CLCA
LPP
LPr~
Index
0.72200
0.89100
0.85200
0.87800
0.74027
0.72800
0.88914
0.86993
Spearman Rank Co~relation
Between x, y Coordinates
0.2102
0.7601
0.6793
0.7438
0.3589
0.2213
0.7551
0.7045
Index = Proportion of covarianee explained by first PC
Table 5 (a) C l u s t e r i n g Ef f e c t i ve ne s s M e a s u r e m e n t , M S T L i n e a r i z a t i o n
S t r a t e g y I
BDF Iteration ME GE (21
Initial Cut-off 86 0.423300 0.925926
Partition i - M/c. ~ 0387878 0.877256
Partition 2 - M/c. djm~n~on 0.424242 0.918819
Partition 3 - M/c. ~ o n 0.407186 0.890909
0 . 4 2 3 3 6 0.933085
measures. For this purpose, the matrixes were partitioned at edges with the lowest weight (for similarity coefficients) and the highest weight (for distances) between clusters that are visually discern- ible to force CPPs. Then, for each of the CPPs, extra cutoff points were selected as the immediately adjacent nodes to the fight and left of this point in both dimensions. Different points were drawn and a BDF corresponding to each of the partition points selected. The above process is illustrated below for the final matrix obtained using the LPP method of Figure 18:
Alternative Partition Lowest Partition
Dimension Edge Edge Weight Blocks Edge
Machine 15-13 0.000 Q2-Q3 13-10, 12-15
6-9 0.220 Q1-Q2 8-9, 5-6
Part 6-2 0.330 Q3-Q2 13-6, 2-12
15-16 0.166 Q2-Q1 17-15, 16-11
The clustering effectiveness values for different partitions of each of the eight BDFs are given in Tables 5-10. The range of values for different measures is rather small across the BDFs produced
Table 5(b) Clustering Effectiveness Measurement, MST Linearization
Strategy II
Partition 4 - M/c. dimension
Partition I - Part dimension 0.403614 0.890909
Partition 2 - Pm~ dimension 0.400000 0.890909
Partition 3 - Part dimension 0.412121 0.904762
Partition 4 - Part dimension 0A17178 0.918819
Minimum Val~ 0.387178 0.877256
Maximum Value 0.424242 0.933085
Principal Cumponont Analysis Eigenvnctors
PCI PC2
X 0.5484 0.8362
Y 0.8362 " -0.5484
¢ffiCos" 1(.5484)ffi SIO'1(.8362)=56.74 *
BDFlteJation
Initial Cut-off
Partition 1 - M/c. dimcnsion
Partition 2 - M/c. dimension
Partition 3 - M/c. dimension
Partition 4 - M/c. dimension
Partitioa 1 - Part dimension
Partition 2 - Part dimension
CI
0.799308
ME GE
85 0346821
0342857
0358823
0.34104
0352601
0322034
0333333
0337143
0.34104
0322034
0358823
0.786941
0.824561
0.793103
0.805555
0.756757
Panidon 3 - P m dimension 0.780822
Partition 4 - Pm't dimension 0.793103
Minimum Value 0.756757
Maximum Val~ 0.824561
Principal Comimt~.nt Analysis Eigenvectors
PCl PC2
X 0.5068 0.8621
Y 0.8621 -0.5068
~-C~" 1(.5068)= 8in-1(.8621).59.55 *
403

Journal of Manufacturing Systems V o l u m e 12 /No. 5
using different clustering heuristics. This may sug- gest that if blocks are fairly visible, the choice of partition points within the CPP will not adversely impact the measures or compositions of the machine-part groups.
Table 5(c) Clustering Effectiveness Measurement, MST Linearization
Strategy III
BDF Iteration ME GE CI
Initial Cut-off 85 0388235 0.857143
Partition 1 - M/c. dimension 0.331461 0.762712
Partition 2 - M/c. dimensim 0.3744269 0.837456
Partition 3 - M/c. dimension 0.377g07 0.837436
Partition 4 - M/c. dimemion 0.382353 0.850531
Partition 1 - Pan dimension 0.369318 0.811487
Partition 2 - Part dimension 0.366864 0.837456
Partition 3 - Part dimension 0.382353 0.850531
Partition 4 - Part dimension 0.377907 0.837436
Minimum Value 0.331461 0.762712
Maximum Value, 0.388235 0.857143
Principal Component Analysis FARe~'tvectors
PC1 1~2
X 0.5536 0.8328
Y 0.8328 -0.5536
~C~°1(.5536) = Sin°1(.8328)~56.39 °
Table 9 provides a comparison of the clustering effectiveness of the eight matrix clustering heuris- tics evaluated. It may be noted that MST lineariza- tion strategy I scored higher than the other heuristics on PC, GE, and CI measures adopted in the study,
Table 7 Clustering Effectiveness Measurement, LPP
BDF Iteration ME GE CI
Initial Cut-off 94 0.39759 0.884058
Partition 1 - M/c. dimension 0385542 0.870503
Partition 2 - M/c. dimension 0384615 0.857143
Partition 3 - M/c. dimension 0391566 0.877256
Partition 4 - M/c. dimension 0.403614 0.890909
Partition ! - Part dimension 039759 0.884058
Partition 2 - Pan dimension 0364706 0.830986
0.363095 0.837436 Partition 3 - Part dimension
Partition 4 - Part dimension
Minimum Value 0.363095 0.830986
Maximum Value 0.403614 0.890909
P ~ c i p a l Componont Analysis Eigenve(:ton;
PCl PC2
X -0.4787 0.878
Y 0.878 0.4787
~Cos-1(.4787) = Sin'1(.8780)=61.40 °
Table 8 C l u s t e r i n g E f f e c t i v e n e s s M e a s u r e m e n t , L P P n
BDF Iteration ME GE (21
Initial Cut-off 85 03915~6 0.877256
Partition 1 - M/c. dimension 0385542 0.870503
Partition 2 - M/c. dimension 0.380952 0.857143
Table 6 C l u s t e r i n g E f f e c t i v e n e s s M e a s u r e m e n t , T S P
BDF Iteration
I Initial Cut-off
Partition 1 - M/c. ¢timension
Partition 2 - M/c. dimension
Partition 3 - M/c. dimension
Partition 4 - M/c . dimension
Partition 1 - ~ d imemina
Partition 2 - Pan dimension
Partition 3 - Pan dimeminn
Partition 4 - Pan dimenalon
Min imum Value
Max imum Value
ME GE Ca
88 0312849 0.73913
0.310676 0.727575
0302198 0.716172
0.3O3867 0.721854
0307262 0.733333
0.286486 0.688312
0310734 0.744966
0296089 0.721854
0314917 0.733333 i
0.286486 0.688312
0314917 0.744966
PrincipalComponemAnaly~s ~g~vectm-s
PCI PC2
X 0.445363 0 . ~ 5 ~ 1
Y 0 . ~ 5 ~ 1 -0.445563
1 1 ~Cos" (.4455653) = Sin- (.895251)=63.54 °
0.850531 Partition 3 - M/c. dimension 0378698
Partition 4 - M/c. dimension 0.387878 0.877256
Partition i - Part dimension 0371257 0.850534
Partition 2 - Part dimea~lon 0378698
Partition 3 - Pan dimension
Partition 4 - Pan dimension 0352941 0.818182
Minimum Value 0.352941 0.818182
Maximum Value 0391566 0.877256
Principal Component Analy~.is EiRenvecttxs
PC1 PC2
X 0.515724 0.856755
Y 0.856755 -0.515724
~--Cos'1(.515724) = Sin'1(.8567555) =58.95 °
404

Journal of Manufacturing Systems V o l u m e 12/No. 5
whereas the LPP method scored higher on the ME index. This is to be expected because the ME index favors permutations that have the strict connectivity properties of the TSP. Also to be noted is the fact that among the clustering methods evaluated, the MST linearization strategy I placed the least number of operations in the off-diagonal blocks.
From the above results, the following may be inferred about the compactness of the BDFs gener- ated by the various graph theoretic clustering methods:
Table 9 Clustering Effectiveness Measurement, S L C A
BDF Iteration ME GE 121
Initial Cut-off 82 0.25 I OA A. A. A. ~. A. I
Parbtion 1 - M/c. dimeasion 0.240816 0A36464
Pardtion 2 - M/c. dimension 0.239216 0.405405
Partition 3 - M/c. dimemion 0.257143 0.452514
Partition 4 - M/c. dimen~rlon 0.233201 0.405405
Minimum Value 0.233201 0.405405
Maximum Value 0.257143 0.452514
Component Analy~ Eigenvectors
PC! PC2
X 0.2066 0.9784
Y 0.9784 -0.2066
is=Cos'l(.21)66) = Sin-1(.9784)=78.07 *
Table 10 C l u s t e r i n g E f f e c t i v e n e s s M e a s u r e m e n t , C L C A
BDF It~mtion ME C~ e l
Initial Cnt-off 84 0.3 0.511628
Partition I - M/c. dimension 0.274193 0.460674
]Partition 2 - M/c. dimon~on 0.294118 0.511628
I Partition 3 - M/c. dimension 0.295082 0.494253
Partition 4 - M/c. dimension 0.288703 0.50289
Minimum Value 0.274193 0.460674
Maximum Value 0.300000 0.511628
l~incipal Component Analysis Eigenvectt3ts
PCI
X 0.295 0.9555
Y 0.9555 -0.295
~Cos'I(.2950) ,: Sin- 1 (.9555)=72.84 *
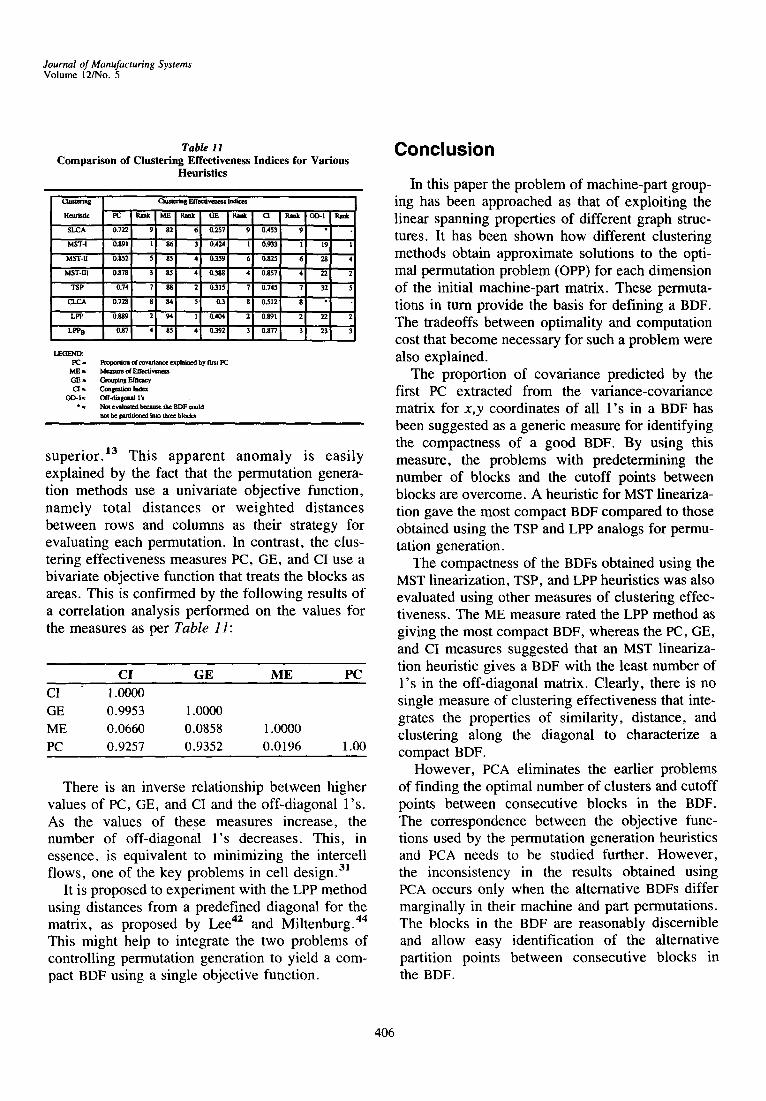
1. Choice of Heuristic Significantly Affects the Compactness of the Final BDF Obtained
For a particular BDF, the range of values for the GE and CI indexes computed for different partitions is low. However, if all 64 alternative partitions of the different BDFs are considered as a single sample (Tables 5-10), then this range is significantly larger, as per the following table:
GE CI Minimum Maximum Minimum Maximum 0.2332 0.4242 0.4054 0.9331
The heuristics fared from very poor in the case of SLCA and CLCA to very good in the case of the LPP and MST linearization strategies.
2. The Most Compact BDF, Measured in a Two- Dimensional Sense, Need Not Necessarily Corre- spond to the Combination of the Best Machine and Part Permutations as Claimed Earlier 12"13
That is
LPP~INULPPPzN :/:Best BDF M P TSPMI N UTSPr~u~ :/:Best BDF
This is because the objective function value for either permutation is minimized independently of the other dimension. Merely bringing them together does not guarantee the desired two-dimensional BDF structure. In the case of the LPP, combining the best permutation for each dimension of the matrix may give a BCF because the strings of nodes in the two dimensions may not be coordinated. Likewise, the MST linearization heuristics that do not give TSP-optimal permutations yielded a more compact BDF than obtained by merging the TSP-optimal permutations. This shows from the ranking for the PC, GE, CI, and OD-1 measures shown in Table 11.
3. There is No One-to-One Correspondence Between the Objective Functions Used by the TSP, MST Linearization, and LPP Methods for Permutation Generation and the PCA Method for Evaluation of BDF Structure
From Table 11, according to PCA, MST linear- ization strategy I gave a slightly (0.22%) more compact BDF than that obtained using the LPP method that had been claimed earlier to be
405
Journal of Manufacturing Systems Volume 12/No. 5
Table 11 Comparison of Clustering Effectiveness Indices for Various
Heuristics
Cluste~ I Cltmednz Effeclivea¢~
He~s[ic PC P.za~ ME Rank [ GE IRank
SI.,CA 0.722 9 S2 61 o.~7 9
MST-I 0.891 I 86 31 0.4241 I
Ms'r-If 0.852 5 85 ,4 | 0.359 6 i
MST-lll 0.878 3 85 4 | 0.388 ; 4
TSP 0.74 7 88 21 0.315 7
CLCA 0.728 8 84 5 [ 0.3 8
t.PP 0.889 2 94 l [ 0.404 2
LPlP B 0.87 4 85 41 0.392 3
L~GHq'D: PC~ P ~ o u of c o v ~ i ~ ezplaincd by Fm~t PC
M]E~ Me.4mm~ of F . f f~ t iv¢~ G E . C, m u ~ l l F.l'fi~'y Cl* Coagm, t i~ Index
OD-I* Off-diqoma rs * ~ ~ evaluated because the BDF could
not be l~tit iceed into ~fee blocks
w l l i m W l i l m wm, m [ ] m l l l l l i / l l m i i | l l l [ ] | | m
superior. ~3 This apparent anomaly is easily explained by the fact that the permutation genera- tion methods use a univariate objective function, namely total distances or weighted distances between rows and columns as their strategy for evaluating each permutation. In contrast, the clus- tering effectiveness measures PC, GE, and CI use a bivariate objective function that treats the blocks as areas. This is confirmed by the following results of a correlation analysis performed on the values for the measures as per Table 11:
C I G E M E P C
CI 1.0000 GE 0.9953 1.0000 ME 0.0660 0.0858 1.0000 PC 0.9257 0.9352 0.0196 1.00
There is an inverse relationship between higher values of PC, GE, and CI and the off-diagonal l 's. As the values of these measures increase, the number of off-diagonal l ' s decreases. This, in essence, is equivalent to minimizing the intercell flows, one of the key problems in cell design. 3]
It is proposed to experiment with the LPP method using distances from a predefined diagonal for the matrix, as proposed by Lee 42 and Miltenburg. 44 This might help to integrate the two problems of controlling permutation generation to yield a com- pact BDF using a single objective function.
Conclusion
In this paper the problem of machine-part group- ing has been approached as that of exploiting the linear spanning properties of different graph struc- tures. It has been shown how different clustering methods obtain approximate solutions to the opti- mal permutation problem (OPP) for each dimension of the initial machine-part matrix. These permuta- tions in turn provide the basis for defining a BDF. The tradeoffs between optimality and computation cost that become necessary for such a problem were also explained.
The proportion of covariance predicted by the first PC extracted from the variance-covariance matrix for x,y coordinates of all l ' s in a BDF has been suggested as a generic measure for identifying the compactness of a good BDF. By using this measure, the problems with predetermining the number of blocks and the cutoff points between blocks are overcome. A heuristic for MST lineariza- tion gave the most compact BDF compared to those obtained using the TSP and LPP analogs for permu- tation generation.
The compactness of the BDFs obtained using the MST linearization, TSP, and LPP heuristics was also evaluated using other measures of clustering effec- tiveness. The ME measure rated the LPP method as giving the most compact BDF, whereas the PC, GE, and CI measures suggested that an MST lineariza- tion heuristic gives a BDF with the least number of l ' s in the off-diagonal matrix. Clearly, there is no single measure of clustering effectiveness that inte- grates the properties of similarity, distance, and clustering along the diagonal to characterize a compact BDF.
However, PCA eliminates the earlier problems of finding the optimal number of clusters and cutoff points between consecutive blocks in the BDF. The correspondence between the objective func- tions used by the permutation generation heuristics and PCA needs to be studied further. However, the inconsistency in the results obtained using PCA occurs only when the alternative BDFs differ marginally in their machine and part permutations. The blocks in the BDF are reasonably discernible and allow easy identification of the alternative partition points between consecutive blocks in the BDF.
406

Journal of Manufacturing Systems Volume 12/No. 5
References
1. Warren J. Boe and Chun Hung Chang, "A Close Neighbor Algorithm for Designing Cellular Manufacturing Systems," Interna- tional Journal of Production Research (vol. 29, no. 10, 1991), pp. 2097-2116.
2. F. Choobineh, " A Framework for the Design of Cellular Manu- facturing Systems," International Journal of Production Research (vol. 26, no. 7, 1988), pp. 1161-1172.
3. Henry C. Co and Abdelaziz Araar, "Configuring Cellular Man- ufacturing Systems," International Journal of Production Research (vol. 26, no. 9, 1988), pp. 1511-1522.
4. Tarun Gupta and Hamid Seifoddini, "Production Data Based Similarity Coefficient for Machine-component Grouping Decisions in the Design of a Cellular Manufacturing System," International Journal of Production Research (vol. 28, no. 7, 1990), pp. 1247- 1269. 5. S.A. Irani, "A Flow Decomposition Approach for Integrated
Layout Design of Virtual Group Techology Flowlines," PhD Disser- tation (University Park, PA: Pennsylvania State University, December 1990). 6. Asoo J. Vakharia, "Methods of Cell Formation in Group Tech-
nology: A Framework for Evaluation," Journal of Opeiations Man- agement (vol. 6, no. 3, 1986), pp. 257-271.
7. Urban Wemmerlov and Nancy Lea Hyer, "Procedures for the Part Family/Machine Group Identification Problem in Cellular Man- ufacturing," Journal of Operations Management (vol. 9, no. 2, 1990), pp. 125-147. 8. J.L. Burbidge "Production Flow Analysis for Planning Group
Technology," Journal of Operations Management (vol. 10, no. I, 1991), pp. 5-27. 9. J.K. Lenstra and A.H.G. Rinnooy Kan, "Some Simple Applica-
tions of the Travelling Salesman Problem," Operational Research Quarterly (vol. 26, no. 4, 1975), pp. 717-733. 10. William T. McCormick, Jr., Paul J. Schweitzer, and Thomas W. White, "Problem Decomposition and Data Reorganization by a Clustering Technique," Operations Research (vol. 20, no. 5, 1972), pp. 993-1009. 1 I. C. Suresh Kumar and M.P. Chandrasekharan, "Grouping Effi- cacy: A Quantitative Criterion for Goodness of Block Diagonal Forms of Binary Matrices in Group Technology," International Journal of Production Research (vol. 28, no. 2, 1990), pp. 233-243. 12. Ronald G. Askin, Steven H. Cresswell, Jeffrey B. Goldberg, and Asoo J. Vakharia, "A Hamiltonian Path Approach to Reordering the Part-machine Matrix for Cellular Manufacturing," International Jour- nal of Production Research (vol. 29, no. 6, 1991), pp. 1081-1100. 13. C.Y. Chen and S.A. lrani, "A Cluster First-Sequence Last Heuristic for Machine-Part Grouping," Working Paper (University of Minnesota Department of Mechanical Engineering, 1991 ) (Submitted for review to the International Journal of Production Research). 14. Scott M. Shafer and Jack R. Meredith, "A Comparison of Selected Manufacturing Cell Formation Techniques," International Journal of Production Research (vol. 28, no. 4, 1990), pp. 661-673. 15. A.K. Jain and Richard C. Dubes, Algorithms for Clustering Data (Englewood Cliffs, NJ: Prentice Hall, 1988), pp. 120-121. 16. J.C. Gower and G.J.S. Ross, "Minimum Spanning Trees and Single Linkage Cluster Analysis," Applied Statistics (vol. 18, no. 1, 1969), pp. 54-64. 17. John McAuley, "Machine Grouping for Efficient Production," The Production Engineer (1972), pp. 53-57. 18. Charles T. Zahn, "Graph Theoretical Methods for Detecting and Describing Gestalt Clusters," IEEE Transactions on Computers (C-20, no. 1, 1971), pp. 68-86. 19. J.B. Kruskal, "On the Shortest Spanning Subtree of a Graph and the Travelling Salesman Problem," Proceedings of the American Mathematical Society (no. 7, 1956), p. 48. 20. M. Tarsuslugil and J. Bloor, "'The Use of Similarity Coefficients and Cluster Analysis in Production Flow Analysis," Proceedings of the 20th International Machine Tool Design and Research Conference, September 1979 (London: Macmillan), pp. 525-531. 21. Nicos Christofides, "The Shortest Hamiltonian Chain of a Graph," SIAM Journal of Applied Mathematics (vol. 19, no. 4, 1970), pp. 689-696.
22. Michael Held and Richard M. Karp, "The Travelling-Salesman Problem and Minimum Spanning Trees," Operations Research (vol. 18, no. 6, 1970), p. 1138. 23. J.R. Slagle, C.L. Chang, and R.C.T. Lee, "A Clustering and Data Reorganizing Algorithm," IEEE Transactions on Systems, Man and Cybernetics (SMC-5, no. 1, 1975), pp. 126-128. 24. Nicos Christofides, "Bounds for the Travelling Salesman Prob- lem," Operations Research (vol. 20, no. 5, 1972), pp. 1044-1055. 25. Robert Tarjan, "Depth-first Search and Linear Graph Algo- rithms," SlAM Journal of Computing (vol. t, no. 2, 1972), pp, 146-160. 26. R. Rajagopalan and J. Batra, "Design of Cellular Production Systems: A Graph Theoretic Approach," International Journal of Production Research (vol. 13, no. 6, 1975), pp. 567-579. 27. J.K. Suryanarayanan, B.L. Golden, and Q. Wang, " A New Heuristic for the Linear Placement Problem," Computers in Opera- tions Research (vol. 18, no. 3, 1991), pp. 255-262. 28. T. Joliffe, Principal Component Analysis (Springer-Vedag, 1986), pp. 27-31. 29. Ludovic Lebart, Alain Martineau, and Keneth M. Warwick, Multivariate Descriptive Statistical Analysis (New York: John Wiley & Sons, 1984), pp. 124-125. 30. Chao-Hsien Chu, "The Use of Clustering Techniques in Manu- facturing Cell Formation," Proceedings of the 1988 International Industrial Engineering Conference (Institute of Industrial Engineers, 1988), pp. 495-500. 31. J.R. King, "Machine-component Grouping in Production Flow Analysis: An Approach Using a Rank Order Clustering Algorithm," International Journal of Production Research (vol. 18, no. 2, 1980), pp. 213-232. 32. Shu Ming Ng, "Bond Energy, Rectilinear Distances and a Worst-case Bound for the Group Technology Problem," Operations Research (vol. 42, no. 7, 1991), pp. 571-578. 33. A.S. Carrie, "Numerical Taxonomy Applied to Group Technol- ogy and Plant Layout," International Journal of Production Research (vol. 11, no. 4, 1973), pp. 399-416. 34. Charles T. Mosier, "An Experiment Investigating the Applica- tion of Clustering Procedures and Similarity Coefficients to the GT Machine Cell Formation Problem," International Journal of Produc- tion Research (vol. 27, no. 10, 1989), pp. 1811-1835. 35. Hamilton Emmons, A. Dale Flowers, Chandrashekhar M. Khot, and Kamlesh Mathur, "STORM Personal Version 2.0: Quantitative Modeling for Decision Suppport" (Holden-Day, 1989). 36. "SAS/STAT User's Guide," Release 6.03 Edition (Cary, NC: SAS Institute Inc.) 37. R.C. Prim, "Shortest Connection Matrix Network and Some Generalizations," Bell System Technical Journal (no. 36, 1957), pp. 1389-1401. 38. S. Lin and B.W. Kernighan, "An Effective Heuristic Algorthim for the Traveling-Salesman Problem," Operations Research (vol. 21, 1973), pp. 498-516. 39. G.C. Armour and E.S. Buffa, "'A Heuristic Algorithm and Simulation Approach to the Relative Location of Facilities," Man- agement Science (vol. 9, no. 2, 1963), pp. 294-309. 40. T.E. Vollmann, C.E. Nugent, and R.L. Zartler, "A Computer- ized Model for Office Layout," Industrial Engineering (vol. 19, no. 7, 1968), pp. 321-329. 41. Hamid Seifoddini, "Machine-Component Group Analysis Versus the Similarity Coefficient Method in Cellular Manufacturing Applica- tions," Computers and Industrial Engineering (vol. 18, no. 3, 1990), pp. 333-339. 42. S. Lee, Chun Zhang, and Hsu-Pin Wang, "Fuzzy Set-Based Procedures for Machine Cell Formation," Proceedings on the Design, Analysis and Control of Manufacturing Cells (New York: American Society of Mechanical Engineers, 1991), pp. 31-45. 43. M.P. Chandrasekharan and R. Rajagopalan, "An Ideal Seed Non-hierarchical Clustering Algorithm for Cellular Manufacturing," International Journal of Production Research (vol. 24, no. 2, 1986), pp. 451-464. 44. J. Miltenberg and W. Zhang, "A Comparative Evaluation of Nine Well-known Algorithms for Solving the Cell Formation Problem in Group Technology," Journal of Operations Management (vol. 10, no. 1, 1991), pp. 44-72.
407

Journal of Manufacturing Systems Volume 12/No. 5
Authors' Biographies Charu Chandra is a doctoral candidate in the Department of
Industrial Engineering and Management Systems at Arizona State University. He received his MS in industrial engineering from the University of Minnesota and has extensive industrial experience in marketing and management information systems. His current research interests are cellular manufacturing and database d~sign for concurrent engineering.
Shahrukh A. Irani is assistant professor of mechanical engineering at the University of Minnesota. He received his PhD from Pennsyl- vania State University and MS from the University of South Florida, both in industrial engineering, and his Bachelor of Technology from
the Indian Institute of Technology, Madras, India. His current research focuses on the design, layout, and scheduling of cellular manufacturing systems; a parallel interest is the integration of computer-aided process planning with the sequence-dependent job shop scheduling problem. He is a member of SME, ASME, and liE.
Sant Ram Arora is professor of mechanical engineering at the University of Minnesota. He received his PhD in industrial engineer- ing from Johns Hopkins University. His major research interests are optimization concepts applied to resource allocation, capacity sizing, specification of quality dimensions, logistics support and material flow in the design and management of operations in production systems. Current research involves development of databases for CAD/CAM applications and computer-aided decision support systems.
408