Embed Size (px)
Citation preview

SpeciesDCBASites112911111812
101061310901041082105270106
1
Cluster Analysis
12
34
56Can we organize
sampling entities intodiscrete classes, such thatwithin-group similarity ismaximized and among-group similarity isminimized according tosome objective criterion?
2
Important Characteristics ofCluster Analysis Techniques
P Family of techniques with similar goals.
P Operate on data sets for which pre-specified, well-definedgroups do "not" exist; characteristics of the data are usedto assign entities into artificial groups.
P Summarize data redundancy by reducing the informationon the whole set of say N entities to informationabout say g groups of nearly similar entities (wherehopefully g is very much smaller than N).

3
P Identify outliers by leaving them solitary or in smallclusters, which may then be omitted from furtheranalyses.
P Eliminate noise from a multivariate data set byclustering nearly similar entities without requiringexact similarity.
P Assess relationships within a single set of variables; noattempt is made to define the relationship betweena set of independent variables and one or moredependent variables.
Important Characteristics ofCluster Analysis Techniques
4
What’s a Cluster?
A B
C D
E
F

5
Cluster Analysis: The Data Set
P Single set of variables; no distinctionbetween independent and dependentvariables.
P Continuous, categorical, or countvariables; usually all the same scale.
P Every sample entity must be measuredon the same set of variables.
P There can be fewer samples (rows)than number of variables (columns)[i.e., data matrix does not have to be offull rank].
Variables Sample x1 x2 x3 ... xp
1 x11 x12 x13 ... x1p
2 x21 x22 x23 ... x2p
3 x31 x32 x33 ... x3p
. . . . ... .
. . . . ... .n xn1 xn2 xn3 ... xnp
6
P Common 2-way ecological data:
< Sites-by-environmental Parameters
< Species-by-niche parameters
< Species-by-behavioralCharacteristics
< Samples-by-species
< Specimens-by-characterisitcs
Variables Sample x1 x2 x3 ... xp
1 x11 x12 x13 ... x1p
2 x21 x22 x23 ... x2p
3 x31 x32 x33 ... x3p
. . . . ... .
. . . . ... .n xn1 xn2 xn3 ... xnp
Cluster Analysis: The Data Set

7
Cluster Analysis: The Data Set
1 AMRO 15.31 31.42 64.28 20.71 47.14 0.00 0.28 0.14 . . . 1.45 2 BHGR 5.76 24.77 73.18 22.95 61.59 0.00 0.00 1.09 . . . 1.28 3 BRCR 4.78 64.13 30.85 12.03 63.60 0.44 0.44 2.08 . . . 1.18 4 CBCH 3.08 58.52 39.69 15.47 62.19 0.31 0.28 1.52 . . . 1.21 5 DEJU 13.90 60.78 36.50 13.81 62.89 0.23 0.31 1.23 . . . 1.23 . . . . . . . . . . . . . . . . . . . . . . . . . . . . . . . . . . . . . . . . . .
19 WIWR 8.05 41.09 55.00 18.62 53.77 0.09 0.18 0.81 . . . 1.36
8
Cluster Techniques
Exclusive Each entity inone cluster only
Nonexclusive Each entity inone or more clusters
Sequential Simultaneous
Nonhierarchical Hierarchical
Agglomerative Divisive
Polythetic Monothetic
Recursive sequenceof operations
Single nonrecursiveoperation
Achieve maximumwithin-culsterhomogeneity
Arrange clusters inhierarchy;
relationships amongclusters defined
Build groups Break into groups
Consider allvariables
Consider onevariable
Agglomerative DivisiveBuild groups Break into groups
Polythetic MonotheticConsider all
variablesConsider one
variable

9
P NHC techniques merely assign each entity to acluster, placing similar entities together.
P NHC is, of all cluster techniques, conceptually thesimplest. Maximizing within-cluster homogeneity is thebasic property to be achieved in all NHCtechniques.
P Within-cluster homogeneity makes possibleinference about an entities' properties based on itscluster membership. This one property makesNHC useful for mitigating noise, summarizingredundancy, and identifying outliers.
Nonhierarchical Clustering
10
P NHC primary purpose is to summarize redundantentities into fewer groups for subsequent analysis (e.g., forsubsequent hierarchical clustering to elucidaterelationships among “groups”.)
Several different algorithms available that differ invarious details. In all cases, the single criterionachieved is within-cluster homogeneity, and theresults are, in general, similar.
Nonhierarchical Clustering
++
+?
?

11
K-means Clustering (KMEANS)
++
+?
SeedsGroupCentroids
?
++
+
P Specify number ofrandom seeds (kernals)or provide seeds.
P Assign samples to‘nearest’ seed.
P Iteratively reassignsamples to groups inorder to minimize withingroup variabilitiy (i.e.,assigned to group with‘closest’ centroid).
Nonhierarchical Clustering
12
Composite Clustering (COMPCLUS)
P Select a seed at random.
P Assign samples to seed ifwithin specified distance(radius) of seed.
P Pick a second seed and repeatprocess until all samples areclassified.
P Groups smaller than specifiednumber are dissolved andsamples reassigned to closestcentroid, providing it is withinspecified maximum distance.
12
3
4 5
6
7
12
4
6
Nonhierarchical Clustering

L f xi ii
i
n
, ,
1
13
Minimum Variance PartitioningP Compute standardized distances
between each sample andoverall centroid.
P Select sample w/ largestdistance as new cluster centroid.
P Assign samples to nearestcluster centroid.
P Select sample w/ largestdistance from its clustercentroid to initiate new cluster.
P Assign samples to nearestcluster centroid.
+1
+2+
P Continue until desirednumber of clusters created.
Nonhierarchical Clustering
14
Maximum Likelihood ClusteringP Model-based method.
P Assume the samples consist ofc subpopulations eachcorresponding to a cluster, andthat the density function of aq-dimensional observationfrom the jth subpopulation isfj(x,θ j) for some unknownvector of parameters, θ j.
P Assume that γ = (γ1,...,γn) givesthe labels of the subpopulationto which each sample belongs.
Nonhierarchical Clustering
P Choose θ = (θ 1,...,θ c) and γto maximize the likelihood:
P If fj(x,θ j) is taken as themultivariate normal densitywith mean vector μj andcovariance matrix Σj, a MLsolution can be foundbased on varyingassumptions about thecovariance matrix.
L f xi ii
i
n
, ,
1
15
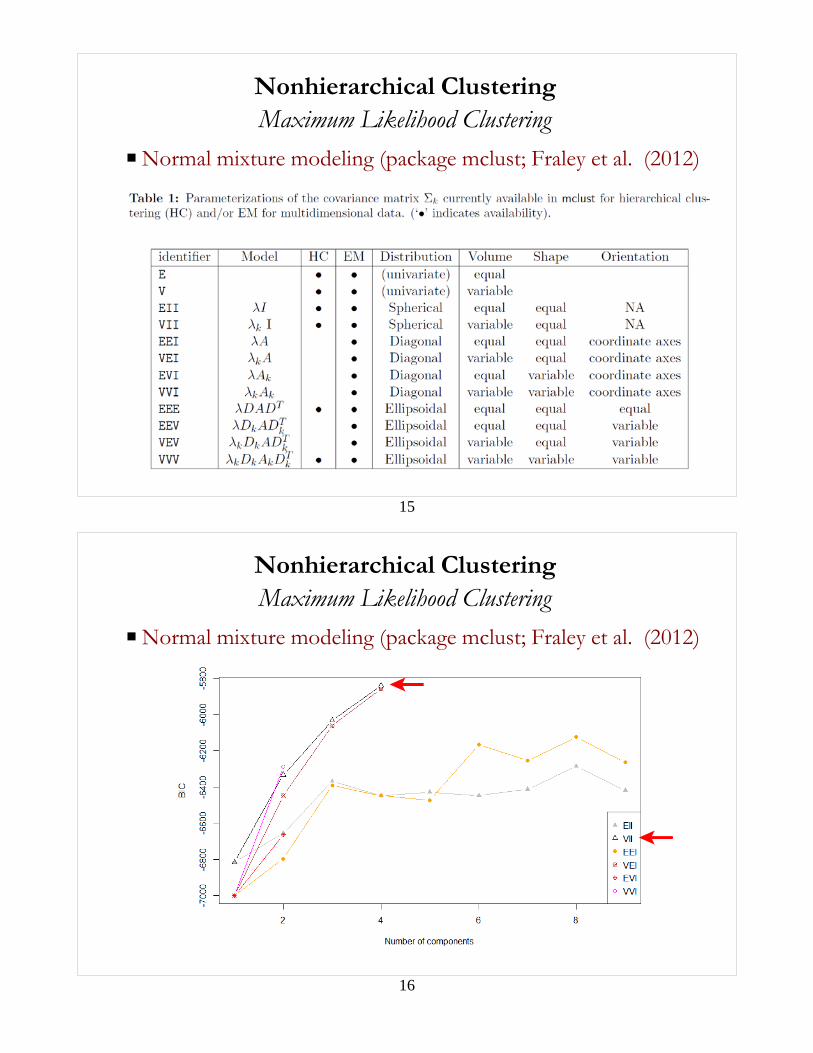
Maximum Likelihood ClusteringNonhierarchical Clustering
P Normal mixture modeling (package mclust; Fraley et al. (2012)
16
Maximum Likelihood ClusteringNonhierarchical Clustering
P Normal mixture modeling (package mclust; Fraley et al. (2012)

17
P NHC procedures involve variousassumptions about the form of theunderlying population from which thesample is drawn. These assumptionsoften include the typical parametricmultivariate assumptions, e.g., equalcovariance matrices among clusters.
P Most NHC techniques are stronglybiased towards finding elliptical andspherical clusters.
LimitationsNonhierarchical Clustering
18
P NHC is not effective for elucidatingrelationships because there is nointeresting structure within clusters andno definition of relationships amongclusters derived.
P Regardless of the NHC procedure used,it is best to have a reasonable guess onhow many groups to expect in the data.
LimitationsNonhierarchical Clustering

sb a
b ai
i i
i i
max( , )
sb a
b aii i
i i
max( , )
b d
d
ni i
ijj
n
i
i
min 1
a
a
ni
jj
n
i
i
1
19
Choosing the ‘Right’ Number of ClustersNonhierarchical Clustering
P Scree plot of clusterproperties:
< Sum of within-cluster dissimilarities to thecluster medoids.
< Average samplesilhouette width (si)
ai = ave dist to all others in ith clusterbi = min dist to neighboring cluster
20
Choosing the ‘Right’ Number of ClustersNonhierarchical Clustering
P Silhouette width (si)
** **
***
**
*
*
*
*
a2
a1
a3
d1(1) d1(2)
d1(3)
d2(2)
d2(1)
d2(3)
d2(4)d2(5)
Si 6 1, very well clusteredSi 6 0, in between clustersSi < 0, placed in wrong cluster

21
Testing the ‘Significance’ of the ClustersNonhierarchical Clustering
P Are groups significantly different? (How valid arethe groups?)
< Multivariate Analysis of Variance (MANOVA)
< Multi-Response Permutation Procedures (MRPP)
< Analysis of Group Similarities (ANOSIM)
< Mantel’s Test (MANTEL)
We will cover these procedures inthe next section of the course.
22
Evaluating the ClustersNonhierarchical Clustering
Cluster Plot Silhouette Plot

23
Hierarchical Clustering
P HC combines similar entities into classes or groups andarranges these groups into a hierarchy.
P HC reveals relationships expressed among the entitiesclassified.
Limitations:
P For large data sets hierarchies are problematic,because a hierarchy with > 50 entities is difficultto display or interpret.
P HC techniques have a general disadvantagesince they contain no provision for reallocationof entities who may have been poorly classifiedat an early stage in the analysis.
24
P HC is ideal for small data sets and NHC for largedata sets.
P HC helps reveal relationships in the data while NHCdoes not.
P NHC can be used initially to summarize a large dataset by producing far fewer composite samples, whichthen makes HC feasible and effective for depictingrelationships.
Complementary Use of NHC and HC
++
+?
?

25
P PAHC techniques use theinformation on all the variables (i.e.,polythetic).
P Each entity is initially assigned as anindividual cluster. PAHCagglomerates these in a hierarchy oflarger and larger clusters until finally asingle cluster contains all entities.
P There are numerous differentresemblance measures and fusionalgorithms; consequently, there existsa profusion of PAHC techniques.
1 2 3 4 5 6 7 8 9 10
Fusion
Polythetic Agglomerative Hierarchical Clustering
26
P Basically none! Hence, the purpose of PAHC is generallypurely descriptive.
P However, some "assume" spherical shaped clusters.
P Certain resemblance measures (e.g., Euclidean distance)assume that the variables are uncorrelated within clusters.
1 2 3 4 5 6 7 8 9 10
Assumptions:
Sample Size Requirements:
P Basically none!
Polythetic Agglomerative Hierarchical Clustering

Step 1: Sites
Sites 1 2 3 4 5 6
1 0
2 1.4 0
3 9.7 9.3 0
4 15.9 15.2 10.9 0
5 15.1 14.4 10.0 2.2 0
6 13.7 12.7 13.8 8.2 8.3 0
Step 2: Sites
Sites 1-2 3 4 5 6
1-2 0
3 9.3 0
4 15.2 10.9 0
5 14.4 10.0 2.2 0
6 12.7 13.8 8.2 8.3 0
27
P The first step is to compute a dissimilarity/distancematrix from the original data matrix.
1. Resemblance Matrix
2. Fusion StrategyP The second step is to agglomerate entities successively to
build up a hierarchy of increasingly large clusters.
P The choice of a particular fusion strategy will dependalmost entirely on the objectives of the investigator.
P All fusion strategies cluster the two most similar (or leastdissimilar) entities first. Strategies differ with respect tohow they fuse subsequent entities (or clusters).
Two-Stage ProcessPolythetic Agglomerative Hierarchical Clustering
28
The Fusion Process(Nearest Neighbor--Euclidean Distance)
Combine sites 1 and 2Combine sites 4 and 5
Polythetic Agglomerative Hierarchical Clustering

Step 3: Si tes
Sites 1-2 3 4-5 6
1-2 0
3 9.3 0
4-5 14.4 10.0 0
6 12.7 13.8 8.2 0
Step 4: Sites
Sites 1-2 3 4-5-6
1-2 0
3 9.3 0
4-5-6 12.7 10.0 0
Step 5: Sites
Sites 1-2-3 4-5-6
1-2-3 0
4-5-6 10.0 0
Number of Clusters Fusion Minimum Distance
5 Sites 1 and 2 1.4
4 Sites 4 and 5 2.2
3 Site 6 and Cluster 4-5 8.2
2 Site 3 and Cluster 1-2 9.3
1 Cluster 1-2 and Cluster 4-5 10.0
29
Combine site 6and cluster 4-5
Combine site 4and cluster 1-2
Combine cluster 1-2-3and cluster 4-5-6
The Fusion Process(Nearest Neighbor--Euclidean Distance)
Polythetic Agglomerative Hierarchical Clustering
30
Agglomeration Table
P Shows the agglomeration sequence and the correspondingdissimilarity values at which entities and clusters combine toform new clusters.
P Note that dissimilarity values will vary depending on thefusion strategy and resemblance measure used.
Polythetic Agglomerative Hierarchical Clustering

Number of Clusters Fusion Minimum Distance
5 Sites 1 and 2 1.4
4 Sites 4 and 5 2.2
3 Site 6 and Cluster 4-5 8.2
2 Site 3 and Cluster 1-2 9.3
1 Cluster 1-2 and Cluster 4-5 10.0
31
Dendrogram
P Tree-like plot depicting theagglomeration sequence inwhich entities are enumerated(identified) along one axis andthe dissimilarity level at whicheach fusion of clusters occurson the other axis.
Polythetic Agglomerative Hierarchical Clustering
32
Polythetic Agglomerative Hierarchical ClusteringCluster Membership Table & Icicle Plot
P Cluster Membership Table --identifies which cluster eachentity belongs to for anyspecified number of clusters.
P Icicle Plot – is a histogram-likeplot depicting clustermembership in relation to thenumber of clusters, in whichentities are enumerated(identified) along one axis andthe number of clusters (clusterlevel) along the other axis.

33
Fusion Properties
A. Space-conserving
B. Space-contracting
C. Space-dialating
P Space conserving –fusion process preservesthe properties of theoriginal inter-entityresemblance space.
P Space distorting –fusion process distortsthe properties of theoriginal inter-entityresemblance space.
Polythetic Agglomerative Hierarchical Clustering
Distance between clusters
34
Distance between clusters
P Space-Contracting – groups appear, onformation, to move nearer to some or allof the remaining entities; the chance thatan individual entity will add to a pre-existing cluster rather than act as thenucleus of a new group is increased, andthe system is said to “chain.”
P Space-Dialating – groups appear to recedeon formation and growth; individualentities not yet in groups are more likely toform nuclei of new groups.
Fusion PropertiesPolythetic Agglomerative Hierarchical Clustering

35
Fusion Strategies
P An entities' dissimilarity to a cluster isdefined to be equal to its dissimilarityto the closest entity in that cluster;when two clusters agglomerate, theirdissimilarity is equal to the smallestdissimilarity for any pair of entitieswith one in each cluster.
P Space-contracting strategy: tends toproduce straggly clusters, whichquickly agglomerate very dissimilarsamples.
Single-Linkage (Nearest Neighbor):
3
12
Polythetic Agglomerative Hierarchical Clustering
36
P An entities' dissimilarity to a cluster isdefined to be equal to its dissimilarityto the furthest entity in that cluster;when two clusters agglomerate, theirdissimilarity is equal to the greatestdissimilarity for any pair of entitieswith one in each cluster.
P Space-dilating strategy: produces clustersof very similar samples whichagglomerate slowly. As clustersagglomerate, groups are moved awayfrom each other.
Complete-Linkage (Furthest Neighbor):
3
12
Fusion StrategiesPolythetic Agglomerative Hierarchical Clustering

37
P Valid only with metric data. An entities'dissimilarity to a cluster is equal to itsdissimilarity to the cluster centroid;when 2 clusters fuse, their dissimilarityis equal to the dissimilarity betweencluster centroids.
P Space-conserving strategy; but ‘reversals’ canoccur in which a fusion takes place at alower dissimilarity than a prior fusion;group-size distortions occur becausecentroid of 2 fused clusters is weightedtoward larger group.
Centroid-Linkage (Unweighted Pair-Group Centroid):
3
12
Fusion StrategiesPolythetic Agglomerative Hierarchical Clustering
38
P Similar to centroid-linkage exceptthat the "centroids" of newlyfused groups are positioned at themedian between old groupcentroids.
P Space-conserving strategy; but ‘reversals’still can occur, although no group-size dependency.
Median-Linkage (Weighted Pair-Group Centroid):
3
12
Fusion StrategiesPolythetic Agglomerative Hierarchical Clustering

39
P An entities' dissimilarity to a cluster isdefined to be equal to the average of thedistances between the entity and eachpoint in the cluster; when two clustersfuse, their dissimilarity is equal to theaverage of the distances between eachentity in one cluster with each entity inthe other cluster.
P Space-conserving strategy; maximizes thecophenetic correlation, no reversals andeliminates group-size dependency.
Average-Linkage (Unweighted Pair-Group Average):
3
12
Fusion StrategiesPolythetic Agglomerative Hierarchical Clustering
40
P Agglomerates clusters, provided thatthe increase in within-groupdispersion (variance) is less than itwould be if either of the twoclusters were joined with any othercluster.
P Space-conserving strategy similar toaverage-linkage fusion, except thatinstead of minimizing an averagedistance, it minimizes a squareddistance weighted by cluster size.
Ward's Minimum-Variance-Linkage:
Fusion StrategiesPolythetic Agglomerative Hierarchical Clustering
3
12
?

41
Fusion Strategies
42
Fusion Strategies

43
Fusion Strategies
44
Deciding on the Number of Significant Clusters
P Should each successive linkage in an agglomerativehierarchical clustering be accepted?
< Null hypothesis: the two entities or clusters that are linkedare sufficiently alike that they can be considered torepresent a single cluster (i.e., accept the linkage).
< Alternative hypothesis: the two entities or clusters aredistinctly different and should be retained as separateentities or clusters (i.e., reject the linkage).
P Once a linkage has been rejected, the linkages (at greaterlevels of dissimilarity) that depend on the rejected linkageare no longer defined and therefore do not need to beconsidered.
Polythetic Agglomerative Hierarchical Clustering

45
Monte Carlo Randomization Test to Determine theNumber of Clusters
1 2 3 4 5 6 7 8 9 10
?
8 6 5 9 7 3 4 10
b1
8 10 6 4 3 7 5 9
b2
3 9 5 7 4 8 6 10
bn
bmeanbobs
PermutedDistance
DistributionDistribution
under Ho
If bobs > 95% of the permuteddistribution, then reject Ho
Polythetic Agglomerative Hierarchical Clustering
46
Examining the Dendrogram & Scree PlotPolythetic Agglomerative Hierarchical Clustering

47
Polythetic Agglomerative Hierarchical ClusteringTesting the ‘Significance’ of the Clusters
P Are groups significantly different? (How valid arethe groups?)
< Multivariate Analysis of Variance (MANOVA)
< Multi-Response Permutation Procedures (MRPP)
< Analysis of Group Similarities (ANOSIM)
< Mantel’s Test (MANTEL)
We will cover these procedures inthe next section of the course.
48
Evaluating the Cluster Solution
P Agglomerative coefficient (clusterlibrary) is a measure of theclustering structure of thedataset.
P For each observation i, denoteby m(i) its dissimilarity to thefirst cluster it is merged with,divided by the dissimilarity ofthe merger in the final step ofthe algorithm. The AC is theaverage of all 1 - m(i).
Agglomeration Coefficient
Polythetic Agglomerative Hierarchical Clustering
Agglomerative coefficient = .57

Input Dissimilarities
Sites
Sites 1 2 3 4 5 6
1 0
2 1.4 0
3 9.7 9.3 0
4 15.9 15.2 10.9 0
5 15.1 14.4 10.0 2.2 0
6 13.7 12.7 13.8 8.2 8.3 0
Output Dissimilarities
Sites
Sites 1 2 3 4 5 6
1 0
2 1.4 0
3 9.3 9.3 0
4 10.0 10.0 10.0 0
5 10.0 10.0 10.0 2.2 0
6 10.0 10.0 10.0 8.2 8.2 0
49
Evaluating the Cluster Solution
P Multiple correlation between input dissimilarities(in the dissimilarity matrix) and the outputdissimilarities implied by the resulting dendrogram(using the lowest level required to join any givenentity pair in the dendrogram).
P Measures how well the final number of clusters(usually depicted by the dendrogram) portrays theoriginal data structure.
P Values >0.75 are considered good.
Cophenetic Correlation
Polythetic Agglomerative Hierarchical Clustering
50
rc = .89 (based on Euclidean distanceand nearest-neighbor linkage)
Evaluating the Cluster Solution
Polythetic Agglomerative Hierarchical Clustering
Cophenetic Correlation

51
Evaluating the Cluster Solution
Polythetic Agglomerative Hierarchical Clustering
Cophenetic Correlation
52
Polythetic Agglomerative Hierarchical Clustering
Describing Clusters
P Compare the clusterswith respect to theirmeans/medians andvariances on the variousvariables.
P Univariate ANOVA orKruskal-Wallis rank sumtest can be employed tocompare the differencesbetween cluster means(or medians) for eachvariable.

53
P Compare the clusterswith respect to theirmeans/medians andvariances on the variousvariables.
P Coefficient of variation canbe employed toqualitatively determinewhich variables bestdescribe each cluster
Polythetic Agglomerative Hierarchical Clustering
Describing Clusters
54
P Compare the clusterswith respect to theirmeans/medians andvariances on the variousvariables.
P Box-and-whisker plots canbe employed to comparethe differences betweencluster means (ormedians) for eachvariable.
Polythetic Agglomerative Hierarchical Clustering
Describing Clusters

55
P Display clusters on anordination plot producedfrom an ordinationprocedure (e.g., PCA,NMDS), allowing entitiesto be clustered whilesimultaneously providingan ecological interpretationof how clusters differ.
Polythetic Agglomerative Hierarchical Clustering
Describing Clusters
56
P Cluster entities usingordination scores producedfrom an ordinationprocedure (e.g., PCA,NMDS), allowing entitiesto be clustered whilesimultaneously providingan ecologicalinterpretation.
Polythetic Agglomerative Hierarchical Clustering
Describing Clusters

TotalFEDCBASite111331111220664222
10303030201010314011233460100005
260200000616116140271616Total
654321Site01
00.40200.670.843
00.820.470.50400.820.980.900.825
00.900.930.670.700.806
57
Polythetic Agglomerative Hierarchical ClusteringStandardizing Data
P Standardization (row or col) is often recommended insample-by-species data when the objective is to clustersamples based on relative abundance profiles. Columnstandardization (z-score) is essential when the variables havedifferent measurement scales.
P Standardizing data can have the serious effect of diluting thedifferences between groups on the variables (species) whichare the best discriminators.
P The choice of whether to standardize or not largely dependson the data set involved, the resemblance measure to beused, and whether or not you want each variable (species)to receive equal weight in the cluster analysis.
58
Average Distance Between Clusters
1.0 0.9 0.8 0.7 0.6 0.5 0.4 0.3 0.2 0.1 0.0
5
6
3
4
2
1
RawData
Average Distance Between Clusters
0.8 0.7 0.6 0.5 0.4 0.3 0.2 0.1 0.0
6
5
4
3
2
1
PercentDissimilarity
Polythetic Agglomerative Hierarchical ClusteringStandardizing Data