Embed Size (px)
Citation preview
Clinical Sciences
Association Between VEGF Polymorphisms andHomocysteine Levels in Patients With Ischemic Stroke and
Silent Brain InfarctionOk Joon Kim, MD, PhD; Seung Ho Hong, PhD; Seung Hun Oh, MD; Tae Gon Kim, MD, PhD;
Kyung Tae Min, MSc; Doyeun Oh, MD, PhD; Nam Keun Kim, PhD
Background and Purpose—Vascular endothelial growth factor (VEGF) plays a role in atherosclerosis-related diseasessuch as cerebrovascular or cardiovascular diseases. However, the effect of VEGF -2578C�A, -1154G�A, -634G�C,and 936C�T polymorphisms on the susceptibility to stroke and silent brain infarction has not been reported.
Methods—Using polymerase chain reaction-amplified DNA, VEGF polymorphisms were analyzed in 615 patients withischemic stroke, 376 patients with silent brain infarction, and 494 control subjects.
Results—The AA and CC�CA (C allele bearing) genotype frequencies of the -2578C�A polymorphism and the CT�TT(T allele-bearing) genotype frequency of the 936C�T polymorphism were significantly different between the stroke andcontrol groups (false discovery rate-adjusted probability values of 0.016, 0.044, and 0.044, respectively). When stratifiedby the size of the occluded vessel, the VEGF polymorphisms were associated with patients with multiple small-arteryocclusions. Several haplotypes of the VEGF polymorphisms were significantly different between the control and strokegroups. With respect to silent brain infarction, the difference in the frequency of the -634G�C polymorphism betweenthe GC�CC (C allele-bearing) genotype and the controls was marginally significant (false discovery rate-adjustedprobability value of 0.056). On the other hand, the -634G�C and 936C�T polymorphisms were associated with plasmahomocysteine levels of patients with multiple or single small-artery occlusions, respectively.
Conclusions—This study suggests that VEGF polymorphisms and haplotypes are possible genetic determinants for the riskof ischemic stroke, particularly in patients with multiple small-artery occlusions. However, VEGF polymorphisms hadonly a weak association with plasma homocysteine levels in the Korean population. (Stroke. 2011;42:2393-2402.)
Key Words: polymorphism � silent brain infarction � stroke � vascular endothelial growth factor
Stroke is the third most common cause of death in manydeveloped countries. Approximately 80% of strokes are
ischemic in origin.1–3 In South Korea, stroke is the mostfrequent cause of death after cancer and is more frequent thanheart disease.4 Multiple factors, including hypertension, dia-betes, smoking, hyperlipidemia, and hyperhomocysteinemia,are associated with a higher risk of stroke.3
Silent brain infarction (SBI) is defined as a cerebralinfarction evident by brain imaging but without a clinicalsyndrome. SBI is characterized by the rapid development ofclinical syndromes and signs of focal and, at times, globalloss of brain function. SBIs are common with advancedage.5,6 Although the clinical significance of SBI remainscontroversial, its presence can predict widespread vasculardamage such as a clinically overt stroke.7–9 Based on severallines of evidence, hyperhomocysteinemia is thought to be anindependent risk factor for SBI.10,11 Other metabolic syn-
dromes, including hypertension and impaired fasting glucose,are also common risk factors for SBI.5,12–14
Vascular endothelial growth factor (VEGF) is a majorangiogenic factor and a prime regulator of endothelial cellproliferation.15 The gene that encodes VEGF is comprised ofa 14-kb coding region with 8 exons and 7 introns located onchromosome 6.16 VEGF undergoes transcriptional and post-transcriptional induction by hypoxia in the vicinity of tumornecrosis and in various models of ischemia.17,18 Moreover,VEGF couples hypoxia to angiogenesis in diverse tissues,including the brain.18,19 Because ischemia stimulates VEGFexpression in the brain, VEGF may be important for thevascular response to cerebral ischemia.20–22 Several singlenucleotide polymorphisms (SNPs) have been described in theVEGF gene (National Center for Biotechnology Information,Gene association no: NT 007592). The VEGF gene includesat least 4 relatively common polymorphisms, -2578C�A
Received November 8, 2010; final revision received February 23, 2011; accepted March 15, 2011.From the Department of Neurology (O.J.K., S.O.), The Institute for Clinical Research (K.T.M., D.O., N.K.K.), and the Department of Neurosurgery
(T.G.K.), School of Medicine, CHA University, Seongnam, South Korea; and the Department of Science Education (S.H.H.), Teachers College, JejuNational University, Jeju, South Korea.
The online-only Data Supplement is available at http://stroke.ahajournals.org/cgi/content/full/STROKEAHA.110.607739/DC1.Correspondence to Nam Keun Kim, PhD, Institute for Clinical Research, School of Medicine, CHA University, 351, Yatap-dong, Bundang-gu,
Seongnam 463-712, South Korea. E-mail [email protected] or [email protected]© 2011 American Heart Association, Inc.
Stroke is available at http://stroke.ahajournals.org DOI: 10.1161/STROKEAHA.110.607739
2393
by guest on July 1, 2018http://stroke.ahajournals.org/
Dow
nloaded from
by guest on July 1, 2018http://stroke.ahajournals.org/
Dow
nloaded from
by guest on July 1, 2018http://stroke.ahajournals.org/
Dow
nloaded from
by guest on July 1, 2018http://stroke.ahajournals.org/
Dow
nloaded from
by guest on July 1, 2018http://stroke.ahajournals.org/
Dow
nloaded from
by guest on July 1, 2018http://stroke.ahajournals.org/
Dow
nloaded from
by guest on July 1, 2018http://stroke.ahajournals.org/
Dow
nloaded from
by guest on July 1, 2018http://stroke.ahajournals.org/
Dow
nloaded from
by guest on July 1, 2018http://stroke.ahajournals.org/
Dow
nloaded from
by guest on July 1, 2018http://stroke.ahajournals.org/
Dow
nloaded from
by guest on July 1, 2018http://stroke.ahajournals.org/
Dow
nloaded from
by guest on July 1, 2018http://stroke.ahajournals.org/
Dow
nloaded from
by guest on July 1, 2018http://stroke.ahajournals.org/
Dow
nloaded from
(rs699947), -1154G�A (rs1570360), -634G�C (rs2010963),and 936C�T (rs3025039) SNPs that may influence VEGFexpression.23–25 Three of these polymorphisms are located inthe promoter region at -2578C�A, -1154G�A, and-634G�C relative to the translation start site. The -2578A,-1154A, and -634G alleles are all associated with decreasedVEGF expression.23,24 In addition to promoter region poly-morphisms, the T allele of the common 936C�T poly-morphism in the 3�-untranslated region is associated withsignificantly decreased serum VEGF levels.25 These VEGFpolymorphisms are associated with various diseases, includ-ing recurrent abortion, pre-eclampsia, Alzheimer disease,colon cancer, breast cancer, and gastric cancer.26–32 Recently,Yang et al33 reported therapeutic effects of different doses ofintranasal VEGF on angiogenesis and functional recovery ofischemic brains in adult rats. The VEGF -1154G�A(rs1570360) and -634G�C (rs2010963) polymorphisms inpatients with ischemic stroke alone have been studied in theChinese population,34 although no significant findings weredemonstrated. However, to our knowledge, the effects of theVEGF -2578C�A (rs699947) and 936C�T (rs3025039)polymorphisms on the risk of stroke and SBI have not beenevaluated previously.
Hyperhomocysteinemia has been implicated as a riskfactor for a number of vascular diseases, including ischemicstroke and SBI. Increased homocysteine (Hcy) concentrationsare found in 40% of patients with coronary, cerebral, orperipheral artery diseases and only in 15% of healthy indi-viduals.35 Hcy inhibits endothelial cell proliferation andmigration resulting in decreased angiogenesis.36 However,the mechanism by which hyperhomocysteinemia induces thedevelopment of vascular lesions is still obscure.37 The aims ofthis study were to evaluate the frequencies of VEGF-2578C�A, -1154G�A, -634G�C, and 936C�T polymor-phisms in Korean patients with ischemic stroke and SBI andto determine the relationship between VEGF polymorphismsand plasma total Hcy (tHcy) levels.
Materials and MethodsStudy PopulationThe study subjects were recruited between 2000 and 2008 from theSeoul and Kyeonggi-do provinces of South Korea. The InstitutionalReview Board of CHA Bundang Medical Center approved thisgenetic study in June 2000. We studied 615 consecutive patients withischemic stroke referred from the Department of Neurology at CHABundang Medical Center, CHA University. Ischemic stroke wasdefined as a stroke (a clinical syndrome characterized by rapidlydeveloping clinical symptoms and signs of focal and/or global loss ofbrain function) with evidence of a cerebral infarction in clinicallyrelevant areas of the brain according to brain imaging by MRI scanand electrocardiography. Based on the clinical manifestations andneuroimaging data, 2 neurologists classified all ischemic strokes into4 etiologic subtypes using the criteria from the Trial of Org 10172 inAcute Stroke Treatment (TOAST)38 as follows: (1) large-arterydisease, an infarction lesion �15 mm in diameter by MRI, andsignificant (�50%) stenosis of a major brain artery or a branchcortical artery by cerebral angiography with symptoms associatedwith that arterial territory; (2) small-artery occlusion (SAO), aninfarction lesion �15 mm and �5 mm in diameter by MRI, andclassic lacunar syndrome without evidence of a cerebral corticaldysfunction or potentially detectable cardiac sources for embolism;(3) cardioembolism, arterial occlusions presumably due to an em-
bolus arising in the heart, as detected by cardiac evaluation; and (4)undetermined etiology, the cause of stroke could not be determinedwith any degree of confidence or involved �2 etiologies. Thefrequencies of stroke subtype were 40% (n�247) large-arterydisease, 35% (n�214) SAO, 8% (n�47) cardioembolism, and 17%(n�107) undetermined etiology, respectively. These proportions aresimilar to reported values for the Korean population.39 Our researchfocused on patients with small-artery disease. Single and multiple(�2 lesions) SAOs were distinguished by brain MRI scan. The sizeand site of cerebral infarction were documented only by MRI.
We selected 376 patients with SBI (170 men and 206 women; agerange, 40 to 88 years) who visited the CHA Bundang MedicalCenter. The diagnoses were made by MRI examination and byagreement between 2 independent experienced neurologists. Allpatients underwent a brain MRI scan and electrocardiography. Thecriteria for SBI were as follows: (1) spotted areas �3 mm in diameterin areas supplied by deep perforating arteries showing highintensity in the T2 and fluid-attenuated inversion recovery imagesand low intensity in the T1 image; (2) the absence of neurologicalsigns and symptoms that could be explained by lesions observed byMRI; and (3) no history of clinical stroke, including transientischemic attacks. Small punctate hyperintensities (1 to 2 mm indiameter) were likely to represent dilated perivascular spaces andwere not considered in the present study. A SBI was excluded whenan agreement could not be reached and patients with cerebralhemorrhage were excluded in advance. All examinations wereperformed according to the methods described previously.27,40
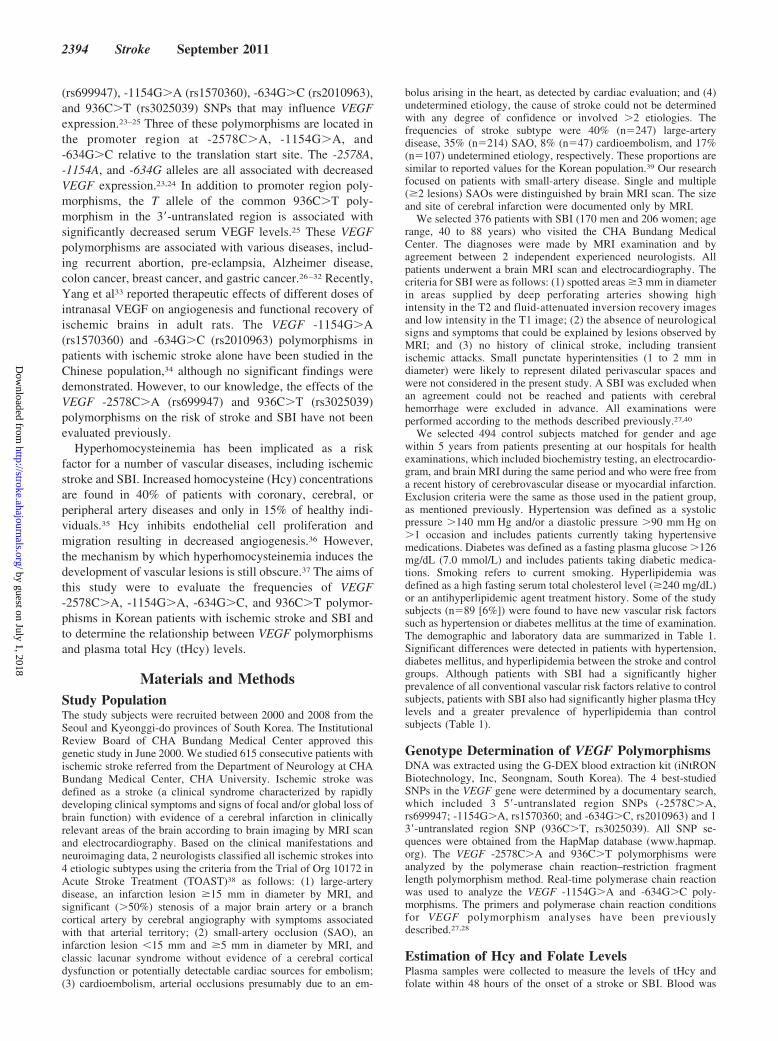
We selected 494 control subjects matched for gender and agewithin 5 years from patients presenting at our hospitals for healthexaminations, which included biochemistry testing, an electrocardio-gram, and brain MRI during the same period and who were free froma recent history of cerebrovascular disease or myocardial infarction.Exclusion criteria were the same as those used in the patient group,as mentioned previously. Hypertension was defined as a systolicpressure �140 mm Hg and/or a diastolic pressure �90 mm Hg on�1 occasion and includes patients currently taking hypertensivemedications. Diabetes was defined as a fasting plasma glucose �126mg/dL (7.0 mmol/L) and includes patients taking diabetic medica-tions. Smoking refers to current smoking. Hyperlipidemia wasdefined as a high fasting serum total cholesterol level (�240 mg/dL)or an antihyperlipidemic agent treatment history. Some of the studysubjects (n�89 [6%]) were found to have new vascular risk factorssuch as hypertension or diabetes mellitus at the time of examination.The demographic and laboratory data are summarized in Table 1.Significant differences were detected in patients with hypertension,diabetes mellitus, and hyperlipidemia between the stroke and controlgroups. Although patients with SBI had a significantly higherprevalence of all conventional vascular risk factors relative to controlsubjects, patients with SBI also had significantly higher plasma tHcylevels and a greater prevalence of hyperlipidemia than controlsubjects (Table 1).
Genotype Determination of VEGF PolymorphismsDNA was extracted using the G-DEX blood extraction kit (iNtRONBiotechnology, Inc, Seongnam, South Korea). The 4 best-studiedSNPs in the VEGF gene were determined by a documentary search,which included 3 5�-untranslated region SNPs (-2578C�A,rs699947; -1154G�A, rs1570360; and -634G�C, rs2010963) and 13�-untranslated region SNP (936C�T, rs3025039). All SNP se-quences were obtained from the HapMap database (www.hapmap.org). The VEGF -2578C�A and 936C�T polymorphisms wereanalyzed by the polymerase chain reaction–restriction fragmentlength polymorphism method. Real-time polymerase chain reactionwas used to analyze the VEGF -1154G�A and -634G�C poly-morphisms. The primers and polymerase chain reaction conditionsfor VEGF polymorphism analyses have been previouslydescribed.27,28
Estimation of Hcy and Folate LevelsPlasma samples were collected to measure the levels of tHcy andfolate within 48 hours of the onset of a stroke or SBI. Blood was
2394 Stroke September 2011
by guest on July 1, 2018http://stroke.ahajournals.org/
Dow
nloaded from
collected in a tube containing anticoagulant 12 hours after a patient’sprevious meal. The tube was centrifuged for 15 minutes at 1000 g,and the plasma was separated. The concentration of Hcy in theplasma was measured by fluorescent polarizing immunoassay withIMx (Abbott Laboratories, Chicago, IL). The plasma concentrationof folate was determined using a radioassay kit (ACS 180; Bayer,Tarrytown, NY).
Statistical AnalysisThe associations among ischemic stroke, SBI, and VEGF genotypeswere estimated by computing the ORs and 95% CIs from Fisherexact test. The adjusted ORs for VEGF polymorphisms weredetermined from multiple logistic regression analysis using gender,age, diabetes mellitus, hypertension, hyperlipidemia, and smoking.Stratification analysis was used to stroke subgroups according to thesize of the occluded vessel. One-way analysis of variance wasperformed to compare the mean levels of Hcy concentrations amongdifferent genotypes. We carried out multiple hypotheses testingusing the Benjamini-Hochberg method to control for false discoveryrate (FDR) in the unconditional logistic regression analysis.41 Cal-culation of the FDR is a way to address the problems associated withmultiple comparisons and provides a measure of the expectedproportion of false-positives among data. Statistical significance wasaccepted at the P�0.05 level. StatsDirect Statistical Software (Ver-sion 2.4.4; StatsDirect Ltd, Altrincham, UK) was used to calculatethe adjusted AOR and 95% CI. The linkage disequilibrium betweenloci was measured using the absolute value of Lewontin D�.42
Haplotype frequencies for multiple loci were estimated using theexpectation-maximization algorithm with SNPAlyze (Version 5.1;DYNACOM Co, Ltd, Yokohama, Japan).
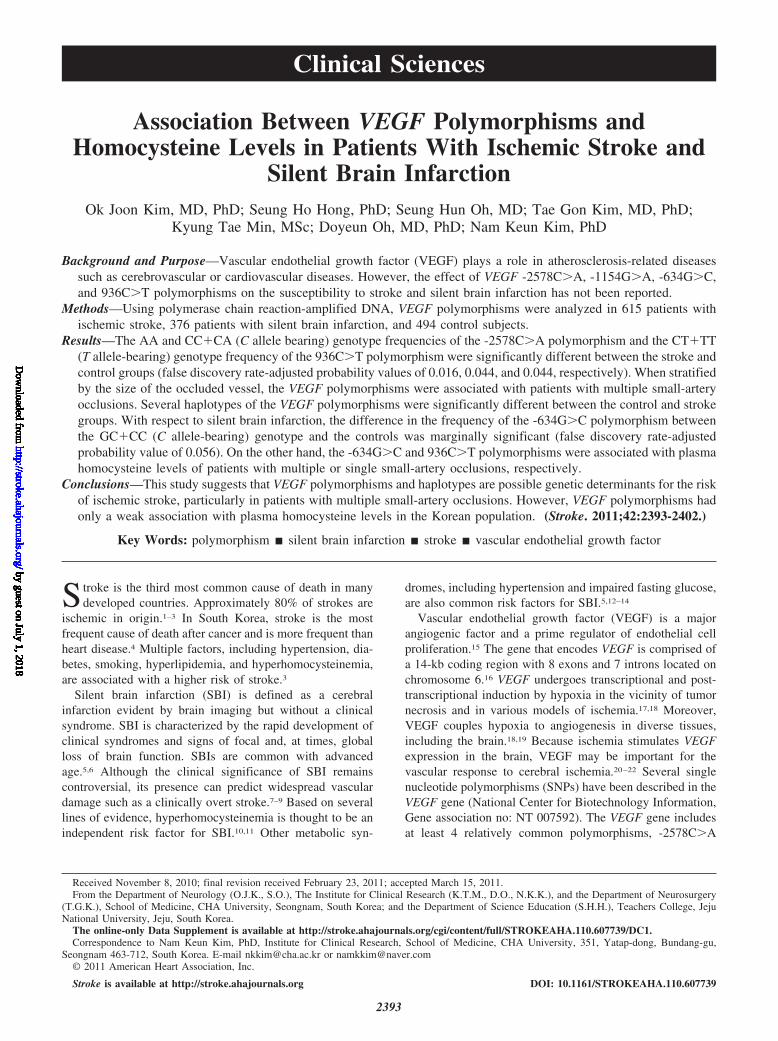
ResultsA comparison of genotype frequencies of the VEGF-2578C�A, -1154G�A, -634G�C, and 936C�T polymor-phisms between the patients with stroke and those with SBIand control groups is shown in Table 2. Genotype distribu-tions of each polymorphism did not deviate from thoseexpected based on the Hardy-Weinberg equilibrium in the3 groups. The linkage disequilibrium of the VEGFpolymorphisms at loci -2578(rs699947)/-1154(rs1570360)/-634(rs2010963)/936(rs3025039) in patients with ischemicstroke and those with SBI is shown in the Figure. There wasstrong linkage disequilibrium between loci -1154 and -634
(D��0.819) and -2578 and -634 (D��0.807) in patients withischemic stroke (Figure 1A). Polymorphisms -2578C�A and-634G�C were in strong linkage disequilibrium in thepatients with SBI (D��0.880; Figure 1B).
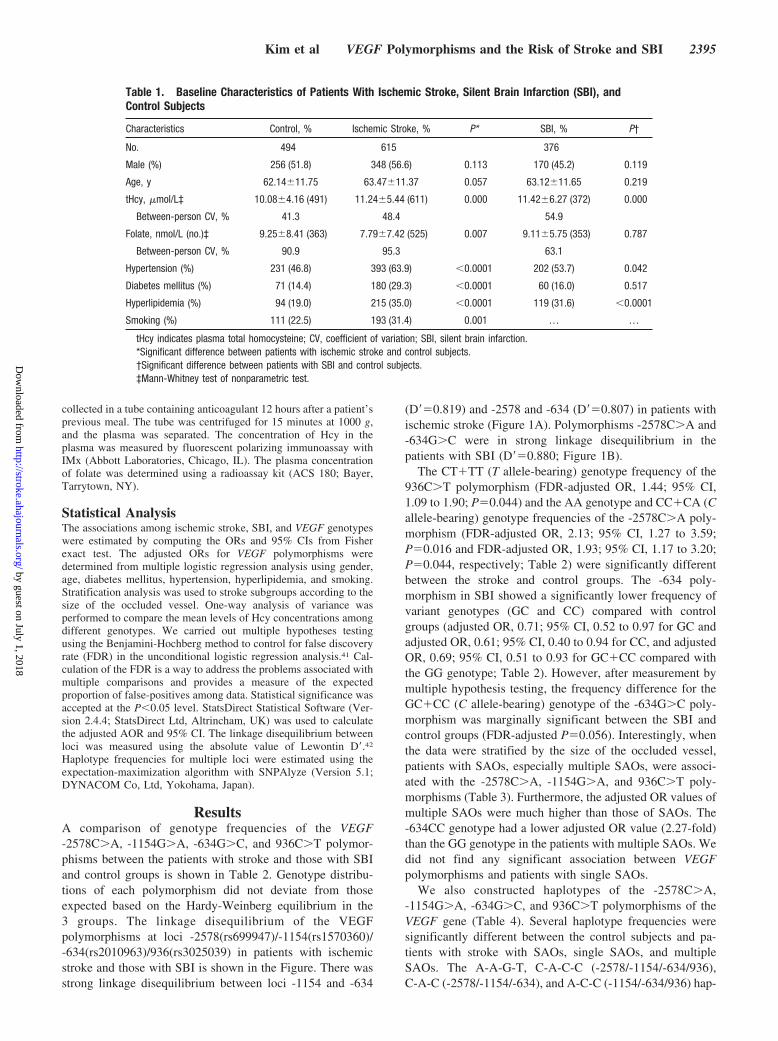
The CT�TT (T allele-bearing) genotype frequency of the936C�T polymorphism (FDR-adjusted OR, 1.44; 95% CI,1.09 to 1.90; P�0.044) and the AA genotype and CC�CA (Callele-bearing) genotype frequencies of the -2578C�A poly-morphism (FDR-adjusted OR, 2.13; 95% CI, 1.27 to 3.59;P�0.016 and FDR-adjusted OR, 1.93; 95% CI, 1.17 to 3.20;P�0.044, respectively; Table 2) were significantly differentbetween the stroke and control groups. The -634 poly-morphism in SBI showed a significantly lower frequency ofvariant genotypes (GC and CC) compared with controlgroups (adjusted OR, 0.71; 95% CI, 0.52 to 0.97 for GC andadjusted OR, 0.61; 95% CI, 0.40 to 0.94 for CC, and adjustedOR, 0.69; 95% CI, 0.51 to 0.93 for GC�CC compared withthe GG genotype; Table 2). However, after measurement bymultiple hypothesis testing, the frequency difference for theGC�CC (C allele-bearing) genotype of the -634G�C poly-morphism was marginally significant between the SBI andcontrol groups (FDR-adjusted P�0.056). Interestingly, whenthe data were stratified by the size of the occluded vessel,patients with SAOs, especially multiple SAOs, were associ-ated with the -2578C�A, -1154G�A, and 936C�T poly-morphisms (Table 3). Furthermore, the adjusted OR values ofmultiple SAOs were much higher than those of SAOs. The-634CC genotype had a lower adjusted OR value (2.27-fold)than the GG genotype in the patients with multiple SAOs. Wedid not find any significant association between VEGFpolymorphisms and patients with single SAOs.
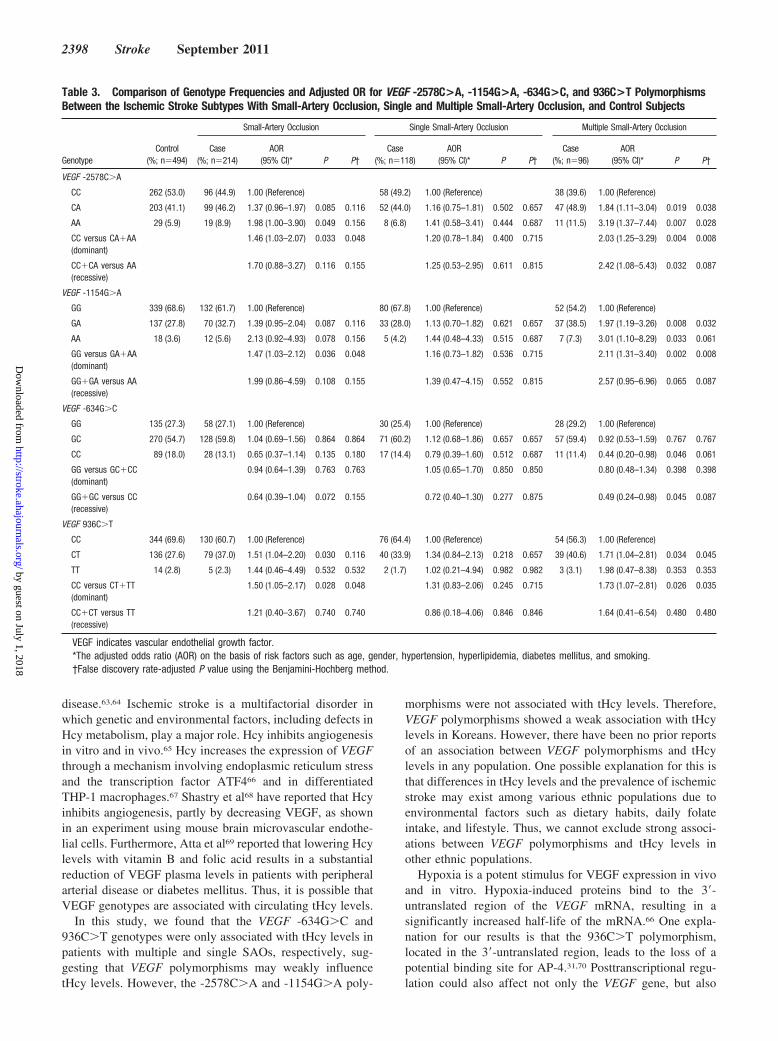
We also constructed haplotypes of the -2578C�A,-1154G�A, -634G�C, and 936C�T polymorphisms of theVEGF gene (Table 4). Several haplotype frequencies weresignificantly different between the control subjects and pa-tients with stroke with SAOs, single SAOs, and multipleSAOs. The A-A-G-T, C-A-C-C (-2578/-1154/-634/936),C-A-C (-2578/-1154/-634), and A-C-C (-1154/-634/936) hap-
Table 1. Baseline Characteristics of Patients With Ischemic Stroke, Silent Brain Infarction (SBI), andControl Subjects
Characteristics Control, % Ischemic Stroke, % P* SBI, % P†
No. 494 615 376
Male (%) 256 (51.8) 348 (56.6) 0.113 170 (45.2) 0.119
Age, y 62.14�11.75 63.47�11.37 0.057 63.12�11.65 0.219
tHcy, �mol/L‡ 10.08�4.16 (491) 11.24�5.44 (611) 0.000 11.42�6.27 (372) 0.000
Between-person CV, % 41.3 48.4 54.9
Folate, nmol/L (no.)‡ 9.25�8.41 (363) 7.79�7.42 (525) 0.007 9.11�5.75 (353) 0.787
Between-person CV, % 90.9 95.3 63.1
Hypertension (%) 231 (46.8) 393 (63.9) �0.0001 202 (53.7) 0.042
Diabetes mellitus (%) 71 (14.4) 180 (29.3) �0.0001 60 (16.0) 0.517
Hyperlipidemia (%) 94 (19.0) 215 (35.0) �0.0001 119 (31.6) �0.0001
Smoking (%) 111 (22.5) 193 (31.4) 0.001 … …
tHcy indicates plasma total homocysteine; CV, coefficient of variation; SBI, silent brain infarction.*Significant difference between patients with ischemic stroke and control subjects.†Significant difference between patients with SBI and control subjects.‡Mann-Whitney test of nonparametric test.
Kim et al VEGF Polymorphisms and the Risk of Stroke and SBI 2395
by guest on July 1, 2018http://stroke.ahajournals.org/
Dow
nloaded from

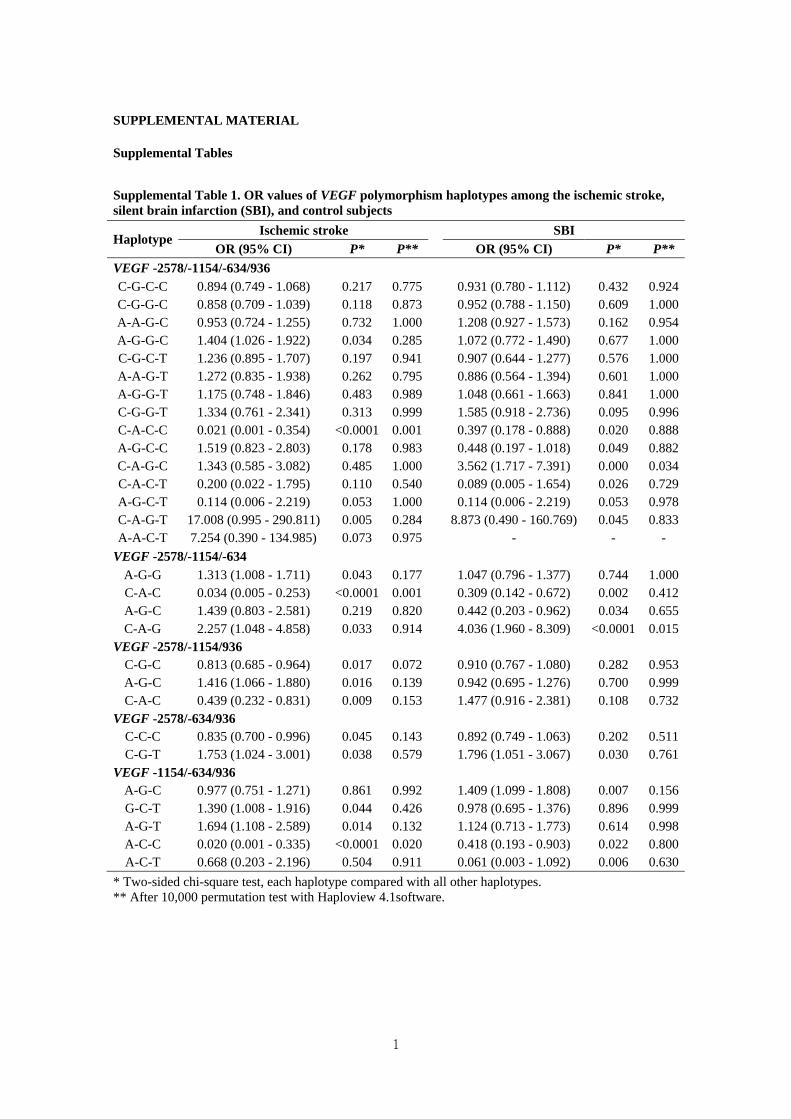
lotypes had significant differences in the 3 SAO groups.Several haplotype frequencies were also significantly differ-ent between the SBI patient and control groups. The ORvalues of VEGF haplotypes between the patients with strokeand those with SBI and the control subjects are shown inSupplemental Table I (http://stroke.ahajournals.org). The ORvalues of the VEGF haplotypes among the stroke subtypesand control subjects are presented in Supplemental Table II.A comparison of genotype frequency and adjusted OR ofVEGF polymorphisms between the stroke subtypes andpatients with SBI is shown in Supplemental Table III. Thefrequency differences for the -2578C�A, -1154G�A, and936C�T polymorphisms were marginally significant be-tween the multiple SAO subtypes and the patients with SBI.
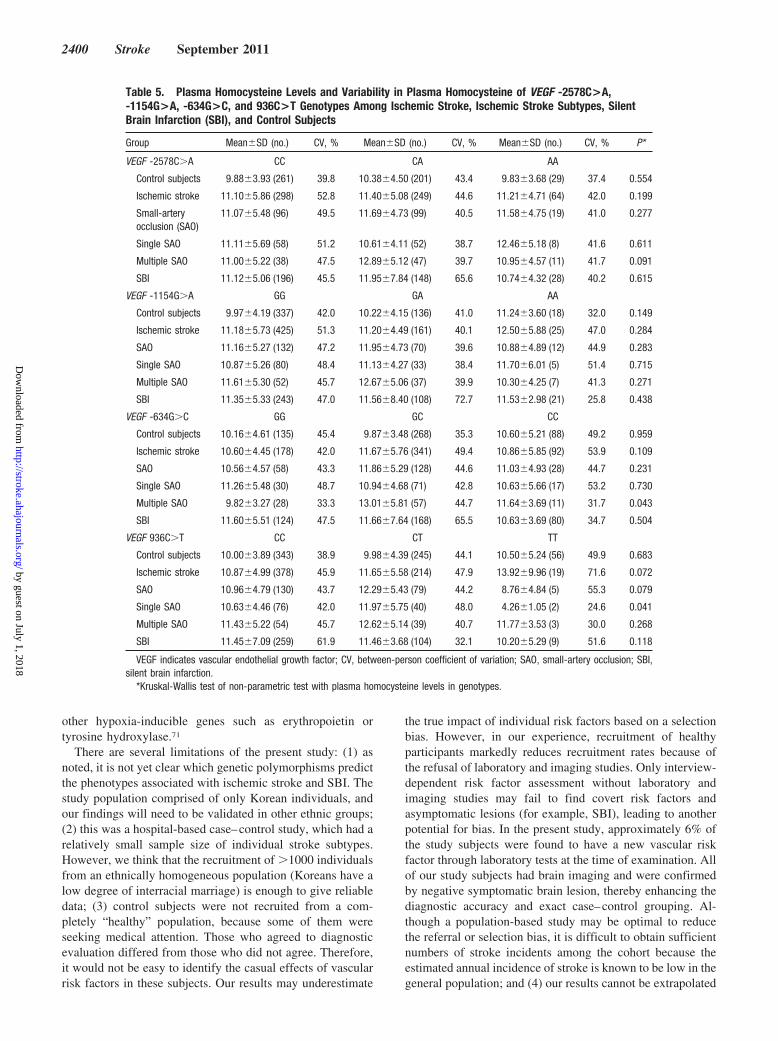
We sought to determine whether VEGF polymorphismswere associated with plasma tHcy levels (Table 5). The-634G�C and 936C�T polymorphisms were associated withtHcy levels in patients with multiple and single SAOs,respectively. However, the VEGF polymorphisms did notshow any association with tHcy levels in the SBI group.Plasma tHcy levels of the VEGF -2578C�A, -1154G�A,-634G�C, and 936C�T haplotypes among the patients withstroke, patients with SBI, stroke subtypes, and control sub-jects are shown in Supplemental Table IV. The plasma tHcylevels of the VEGF haplotypes between the ischemic strokesubtypes and control subjects are presented in SupplementalTable V. Some haplotypes showed significant differencesbetween the groups.
Table 2. Comparison of Genotype Frequencies and Adjusted OR Values for VEGF -2578C>A, -1154G>A, -634G>C, and 936C>TPolymorphisms in the Patients With Ischemic Stroke, Silent Brain Infarction (SBI), and Control Subjects
Ischemic Stroke SBI
GenotypeControl
(%; n�494)Case
(%; n�615)AOR
(95% CI)* P P‡Case
(%; n�376)AOR
(95% CI)† P P‡
VEGF -2578C�A
CC 262 (53.0) 301 (48.9) 1.00 (Reference) 199 (52.9) 1.00 (Reference)
CA 203 (41.1) 250 (40.7) 1.13 (0.86–1.49) 0.368 0.491 149 (39.7) 1.00 (0.75–1.33) 0.994 0.994
AA 29 (5.9) 64 (10.4) 2.13 (1.27–3.59) 0.004 0.016 28 (7.4) 1.33 (0.76–2.32) 0.326 0.435
CC versus CA�AA(dominant)
1.25 (0.97–1.62) 0.090 0.180 1.05 (0.79–1.38) 0.754 0.918
CC�CA versus AA(recessive)
1.93 (1.17–3.20) 0.011 0.044 1.39 (0.81–2.40) 0.238 0.317
VEGF -1154G�A
GG 339 (68.6) 428 (69.6) 1.00 (Reference) 246 (65.4) 1.00 (Reference)
GA 137 (27.8) 162 (26.3) 0.98 (0.73–1.31) 0.881 0.881 109 (29.0) 1.09 (0.81–1.48) 0.572 0.994
AA 18 (3.6) 25 (4.1) 1.44 (0.72–2.92) 0.306 0.347 21 (5.6) 1.65 (0.85–3.19) 0.141 0.282
GG versus GA�AA(dominant)
1.03 (0.78–1.36) 0.864 0.864 1.16 (0.87–1.55) 0.320 0.640
GG�GA versus AA(recessive)
1.46 (0.73–2.95) 0.288 0.384 1.66 (0.86–3.19) 0.131 0.317
VEGF -634G�C
GG 135 (27.3) 178 (28.9) 1.00 (Reference) 128 (34.0) 1.00 (Reference)
GC 270 (54.7) 345 (56.1) 0.86 (0.64–1.17) 0.346 0.491 191 (50.8) 0.71 (0.52–0.97) 0.031 0.124
CC 89 (18.0) 92 (15.0) 0.68 (0.45–1.01) 0.056 0.112 57 (15.2) 0.61 (0.40–0.94) 0.024 0.096
GG versus GC�CC(dominant)
0.82 (0.62–1.10) 0.186 0.248 0.69 (0.51–0.93) 0.014 0.056
GG�GC versus CC(recessive)
0.71 (0.50–1.01) 0.055 0.110 0.77 (0.53–1.12) 0.171 0.317
VEGF 936C�T
CC 344 (69.6) 381 (62.0) 1.00 (Reference) 261 (69.4) 1.00 (Reference)
CT 136 (27.6) 214 (34.7) 1.43 (1.08–1.91) 0.014 0.056 106 (28.2) 1.04 (0.76–1.41) 0.823 0.994
TT 14 (2.8) 20 (3.3) 1.46 (0.66–3.24) 0.347 0.347 9 (2.4) 0.81 (0.34–1.94) 0.641 0.641
CC versus CT�TT(dominant)
1.44 (1.09–1.90) 0.011 0.044 1.02 (0.75–1.37) 0.918 0.918
CC�CT versus TT(recessive)
1.33 (0.61–2.89) 0.477 0.477 0.84 (0.35–1.97) 0.682 0.682
VEGF indicates vascular endothelial growth factor; SBI, silent brain infarction.*The adjusted odds ratio (AOR) on the basis of risk factors such as age, gender, hypertension, hyperlipidemia, diabetes mellitus, and smoking.†The AOR on the basis of risk factors such as age, gender, hypertension, hyperlipidemia, and diabetes mellitus.‡False discovery rate-adjusted P value for multiple hypothesis testing using the Benjamini-Hochberg method.
2396 Stroke September 2011
by guest on July 1, 2018http://stroke.ahajournals.org/
Dow
nloaded from

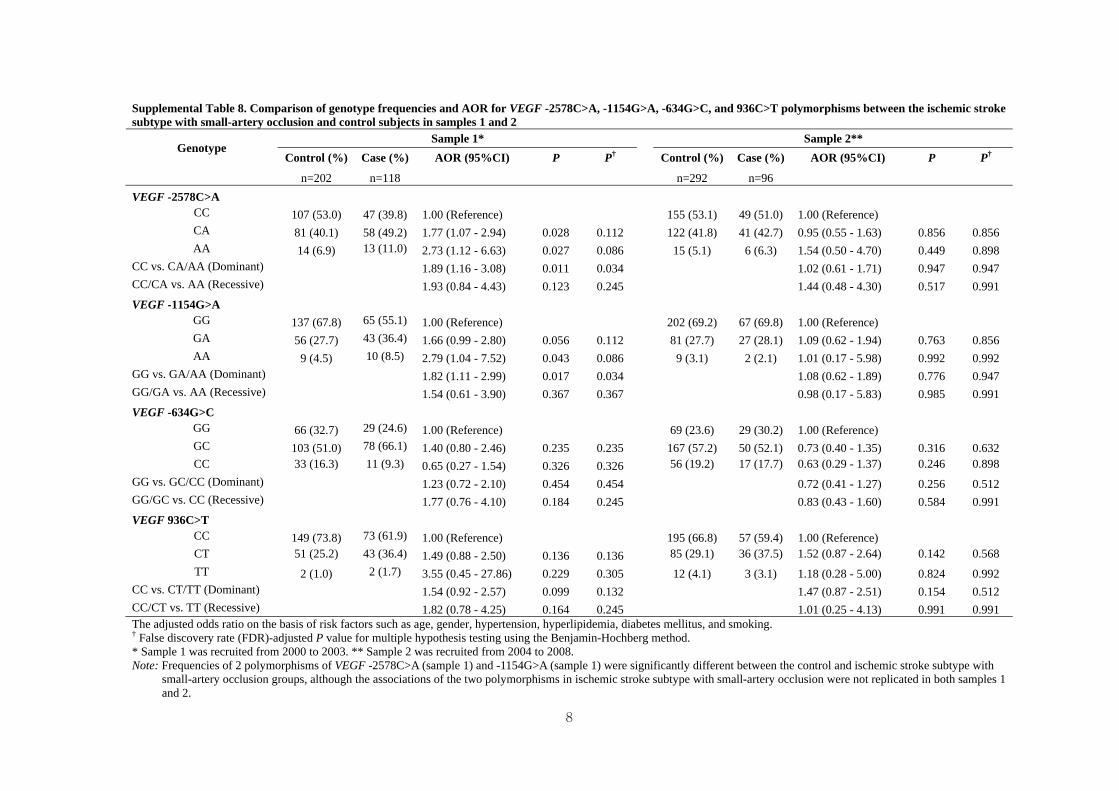
A total of 1485 individuals (615 patients with stroke, 376patients with SBI, and 494 control subjects) from 2 differentcase–control samples, Sample 1 and Sample 2, were analyzedaccording to recruitment duration (Supplemental Table VI).The genotype frequencies of the VEGF polymorphisms weresignificantly different between the control, ischemic stroke,and SBI groups in Samples 1 and 2 (Supplemental Tables VIIto XI). These results suggest that VEGF is also a candidatesusceptibility gene of ischemic stroke, although the associa-tion of VEGF -2578C�A, 936C�T, and ischemic stroke wasnot replicated in subjects from Sample 1 and Sample 2 bymultivariable logistic regression analysis.
DiscussionAngiogenesis is critical to the progression of atherogenesis,collateral vessel development in ischemia, and plaque insta-bility.43,44 VEGF is believed to be important for initiatingangiogenesis and is a major mediator of the progression ofatherothrombotic vascular disease, including ischemic stroke.The effects of VEGF on the risk of stroke have beensuggested in a number of biological and pathological studies.For example, it has been suggested that the VEGF/VEGFreceptor system, which is induced by hypoxia, leads togrowth of new vessels after cerebral ischemia. Exogenoussupport of this natural protective mechanism might lead toenhanced survival after stroke.45 Sun et al46 have suggestedthat, in the ischemic brain, VEGF exerts an acute neuropro-tective effect as well as longer-lasting effects on the survivalof new neurons and on angiogenesis and that these effectsmay operate independently. Verheul et al47 reported thatVEGF-stimulated human umbilical endothelial cells promotethe adhesion and activation of platelets. They also found thatactivated platelets are present in the microvessels of VEGF-producing soft tissue sarcomas.48 There is strong evidence tosupport a close relationship between VEGF and ischemicstroke. Intranasal administration of VEGF may induce angio-
genesis in the ischemic boundary and improve behavioralrecovery after cerebral ischemia in rats.49 Astrocytes, whichmorphologically resemble injury-induced VEGF-positivecells, also react to injury by increasing VEGF expression,indicating that VEGF might participate in the central nervoussystem response to injury.50 Therefore, VEGF may improvethe histological and functional outcomes of stroke throughmultiple mechanisms.
SBI is a kind of cerebral infarction event. Despite thefunctional studies of VEGF described here, the effect ofVEGF polymorphisms on the risk of stroke and SBI has notbeen reported. Recently, several investigators performedgenomewide association studies and meta-analysis of thegenetic susceptibility to stroke in Asian populations51–54;however, they did not find an association with VEGF in Asianpopulations. Based on the known biological and pathologicalsignificance of VEGF, it is reasonable to hypothesize thatVEGF is a good candidate for determining the risk ofdeveloping a stroke and SBI. In the present study, althoughonly the VEGF -2578C�A and 936C�T polymorphismswere associated with the risk of ischemic stroke, the-2578C�A, -1154G�A, and 936C�T polymorphisms wereassociated with SAOs when the data were stratified by thesize of the occluded vessel. Moreover, when patients withSAOs were divided into single and multiple SAOs by brainMRI, variant alleles of the -2578C�A, -1154G�A, and936C�T polymorphisms were only significantly different inpatients with multiple SAOs compared with control subjects.Although we do not know the exact causes of stroke, researchon the etiologic heterogeneity and subtypes of stroke has beenperformed.55–57 Some evidence suggests that there are differ-ent pathophysiological mechanisms for single and multipleSAOs.58,59 Therefore, despite the heterogeneity of ischemicstrokes, our data suggest that VEGF polymorphisms are anindependent risk factor for multiple SAOs. Several articleshave shown that the MTHFR 677C�T polymorphisms areassociated with multiple infarctions.60–62
Haplotype analysis in this study revealed that the frequen-cies of several haplotypes were significantly different be-tween the control subjects and patients with subtypes ofstroke (SAOs, single SAOs, and multiple SAOs) and SBI.Thus, the haplotypes of VEGF polymorphisms provide datafor susceptibility to stroke and SBI.
SBI shares a close similarity with pathophysiologicalaspects of single SAOs. Thus, we can expect that their geneticcompositions are also similar. As shown in SupplementalTable III, there were no significant differences in the-2578C�A, -1154G�A, -634G�C, and 936C�T polymor-phisms between SBI and SAOs and single SAO subtypes.However, the genotype frequencies of VEGF polymorphisms,except for -634G�C in SBI, were only marginally differentfrom ones in multiple SAOs, suggesting a difference in thepathophysiological mechanisms of SBI and multiple SAOs.
Angiogenesis is regulated by a balance of various cyto-kines and biological molecules. The final outcome does notoccur through the independent actions of these factors, butrather depends on the relative input of each factor. Hcy andVEGF have been implicated in angiogenesis and in thedevelopment and progression of atherothrombotic vascular
Figure. Linkage disequilibrium (LD) patterns of VEGF SNPs.Values in squares are LD between single markers. A, Therewere strong LDs between loci -1154G�A (rs1570360) and-634G�C (rs2010963; D��0.819), and -2578C�A (rs699947)and -634G�C (rs2010963; D��0.807) in ischemic stroke sub-jects. B, There was strong LD between loci -2578C�A and-634G�C (D��0.880) in patients with silent brain infarctionsubjects. Dark squares indicate high r2 and bright squaresindicate low r2 values.
Kim et al VEGF Polymorphisms and the Risk of Stroke and SBI 2397
by guest on July 1, 2018http://stroke.ahajournals.org/
Dow
nloaded from
disease.63,64 Ischemic stroke is a multifactorial disorder inwhich genetic and environmental factors, including defects inHcy metabolism, play a major role. Hcy inhibits angiogenesisin vitro and in vivo.65 Hcy increases the expression of VEGFthrough a mechanism involving endoplasmic reticulum stressand the transcription factor ATF466 and in differentiatedTHP-1 macrophages.67 Shastry et al68 have reported that Hcyinhibits angiogenesis, partly by decreasing VEGF, as shownin an experiment using mouse brain microvascular endothe-lial cells. Furthermore, Atta et al69 reported that lowering Hcylevels with vitamin B and folic acid results in a substantialreduction of VEGF plasma levels in patients with peripheralarterial disease or diabetes mellitus. Thus, it is possible thatVEGF genotypes are associated with circulating tHcy levels.
In this study, we found that the VEGF -634G�C and936C�T genotypes were only associated with tHcy levels inpatients with multiple and single SAOs, respectively, sug-gesting that VEGF polymorphisms may weakly influencetHcy levels. However, the -2578C�A and -1154G�A poly-
morphisms were not associated with tHcy levels. Therefore,VEGF polymorphisms showed a weak association with tHcylevels in Koreans. However, there have been no prior reportsof an association between VEGF polymorphisms and tHcylevels in any population. One possible explanation for this isthat differences in tHcy levels and the prevalence of ischemicstroke may exist among various ethnic populations due toenvironmental factors such as dietary habits, daily folateintake, and lifestyle. Thus, we cannot exclude strong associ-ations between VEGF polymorphisms and tHcy levels inother ethnic populations.
Hypoxia is a potent stimulus for VEGF expression in vivoand in vitro. Hypoxia-induced proteins bind to the 3�-untranslated region of the VEGF mRNA, resulting in asignificantly increased half-life of the mRNA.66 One expla-nation for our results is that the 936C�T polymorphism,located in the 3�-untranslated region, leads to the loss of apotential binding site for AP-4.31,70 Posttranscriptional regu-lation could also affect not only the VEGF gene, but also
Table 3. Comparison of Genotype Frequencies and Adjusted OR for VEGF -2578C>A, -1154G>A, -634G>C, and 936C>T PolymorphismsBetween the Ischemic Stroke Subtypes With Small-Artery Occlusion, Single and Multiple Small-Artery Occlusion, and Control Subjects
GenotypeControl
(%; n�494)
Small-Artery Occlusion Single Small-Artery Occlusion Multiple Small-Artery Occlusion
Case(%; n�214)
AOR(95% CI)* P P†
Case(%; n�118)
AOR(95% CI)* P P†
Case(%; n�96)
AOR(95% CI)* P P†
VEGF -2578C�A
CC 262 (53.0) 96 (44.9) 1.00 (Reference) 58 (49.2) 1.00 (Reference) 38 (39.6) 1.00 (Reference)
CA 203 (41.1) 99 (46.2) 1.37 (0.96–1.97) 0.085 0.116 52 (44.0) 1.16 (0.75–1.81) 0.502 0.657 47 (48.9) 1.84 (1.11–3.04) 0.019 0.038
AA 29 (5.9) 19 (8.9) 1.98 (1.00–3.90) 0.049 0.156 8 (6.8) 1.41 (0.58–3.41) 0.444 0.687 11 (11.5) 3.19 (1.37–7.44) 0.007 0.028
CC versus CA�AA(dominant)
1.46 (1.03–2.07) 0.033 0.048 1.20 (0.78–1.84) 0.400 0.715 2.03 (1.25–3.29) 0.004 0.008
CC�CA versus AA(recessive)
1.70 (0.88–3.27) 0.116 0.155 1.25 (0.53–2.95) 0.611 0.815 2.42 (1.08–5.43) 0.032 0.087
VEGF -1154G�A
GG 339 (68.6) 132 (61.7) 1.00 (Reference) 80 (67.8) 1.00 (Reference) 52 (54.2) 1.00 (Reference)
GA 137 (27.8) 70 (32.7) 1.39 (0.95–2.04) 0.087 0.116 33 (28.0) 1.13 (0.70–1.82) 0.621 0.657 37 (38.5) 1.97 (1.19–3.26) 0.008 0.032
AA 18 (3.6) 12 (5.6) 2.13 (0.92–4.93) 0.078 0.156 5 (4.2) 1.44 (0.48–4.33) 0.515 0.687 7 (7.3) 3.01 (1.10–8.29) 0.033 0.061
GG versus GA�AA(dominant)
1.47 (1.03–2.12) 0.036 0.048 1.16 (0.73–1.82) 0.536 0.715 2.11 (1.31–3.40) 0.002 0.008
GG�GA versus AA(recessive)
1.99 (0.86–4.59) 0.108 0.155 1.39 (0.47–4.15) 0.552 0.815 2.57 (0.95–6.96) 0.065 0.087
VEGF -634G�C
GG 135 (27.3) 58 (27.1) 1.00 (Reference) 30 (25.4) 1.00 (Reference) 28 (29.2) 1.00 (Reference)
GC 270 (54.7) 128 (59.8) 1.04 (0.69–1.56) 0.864 0.864 71 (60.2) 1.12 (0.68–1.86) 0.657 0.657 57 (59.4) 0.92 (0.53–1.59) 0.767 0.767
CC 89 (18.0) 28 (13.1) 0.65 (0.37–1.14) 0.135 0.180 17 (14.4) 0.79 (0.39–1.60) 0.512 0.687 11 (11.4) 0.44 (0.20–0.98) 0.046 0.061
GG versus GC�CC(dominant)
0.94 (0.64–1.39) 0.763 0.763 1.05 (0.65–1.70) 0.850 0.850 0.80 (0.48–1.34) 0.398 0.398
GG�GC versus CC(recessive)
0.64 (0.39–1.04) 0.072 0.155 0.72 (0.40–1.30) 0.277 0.875 0.49 (0.24–0.98) 0.045 0.087
VEGF 936C�T
CC 344 (69.6) 130 (60.7) 1.00 (Reference) 76 (64.4) 1.00 (Reference) 54 (56.3) 1.00 (Reference)
CT 136 (27.6) 79 (37.0) 1.51 (1.04–2.20) 0.030 0.116 40 (33.9) 1.34 (0.84–2.13) 0.218 0.657 39 (40.6) 1.71 (1.04–2.81) 0.034 0.045
TT 14 (2.8) 5 (2.3) 1.44 (0.46–4.49) 0.532 0.532 2 (1.7) 1.02 (0.21–4.94) 0.982 0.982 3 (3.1) 1.98 (0.47–8.38) 0.353 0.353
CC versus CT�TT(dominant)
1.50 (1.05–2.17) 0.028 0.048 1.31 (0.83–2.06) 0.245 0.715 1.73 (1.07–2.81) 0.026 0.035
CC�CT versus TT(recessive)
1.21 (0.40–3.67) 0.740 0.740 0.86 (0.18–4.06) 0.846 0.846 1.64 (0.41–6.54) 0.480 0.480
VEGF indicates vascular endothelial growth factor.*The adjusted odds ratio (AOR) on the basis of risk factors such as age, gender, hypertension, hyperlipidemia, diabetes mellitus, and smoking.†False discovery rate-adjusted P value using the Benjamini-Hochberg method.
2398 Stroke September 2011
by guest on July 1, 2018http://stroke.ahajournals.org/
Dow
nloaded from
Table 4. The Haplotype Analysis of VEGF -2578C>A, -1154G>A, -634G>C, and 936C>T PolymorphismsAmong the Patients With Ischemic Stroke, Silent Brain Infarction (SBI), and Control Subjects
Haplotype Control
Patients With Ischemic Stroke
SBITotal SAO Single SAO Multiple SAO
VEGF -2578/-1154/-634/936
C-G-C-C 0.3448 0.3204 0.3430 0.3608 0.3213 0.3293
C-G-G-C 0.2719 0.2429 0.2275* 0.2501 0.1988† 0.2623
A-A-G-C 0.1054 0.1010 0.1138 0.0899 0.1233 0.1247
A-G-G-C 0.0679 0.0926* 0.0736 0.0866 0.0638 0.0722
C-G-C-T 0.0670 0.0814 0.0640 0.0720 0.0539 0.0613
A-A-G-T 0.0378 0.0469 0.0765† 0.0662† 0.1071† 0.0332
A-G-G-T 0.0339 0.0391 0.0348 0.0334 0.0358 0.0348
C-G-G-T 0.0202 0.0269 0.0222 0.0148 0.0314 0.0315
C-A-C-C 0.0183 0.0000† 0.0000† 0.0000† 0.0069* 0.0073*
A-G-C-C 0.0162 0.0243 0.0125 0.0000† 0.0232 0.0077*
C-A-G-C 0.0095 0.0123 0.0217 0.0140 0.0283† 0.0316†
C-A-C-T 0.0041 0.0006 0.0015 0.0000 0.0000* 0.0000*
A-G-C-T 0.0030 0.0001 0.0028 0.0000 0.0061 0.0000
C-A-G-T 0.0000 0.0083† 0.0000 0.0000 0.0000 0.0040*
A-A-C-C 0.0000 0.0000 0.0000 0.0120† 0.0000 0.0000
A-A-C-T 0.0000 0.0033 0.0061* 0.0000 0.0000 0.0000
Overall‡ �0.0001 �0.0001 �0.0001 �0.0001 0.0001
VEGF -2578/-1154/-634
C-G-G 0.2916 0.2713 0.2500* 0.2662 0.2295† 0.2939
A-A-G 0.1431 0.1480 0.1910† 0.1553 0.2302† 0.1576
A-G-G 0.1027 0.1302* 0.1084 0.1198 0.1002 0.1069
C-A-C 0.0228 0.0006† 0.0026† 0.0000† 0.0068† 0.0072†
A-G-C 0.0183 0.0258 0.0155 0.0000† 0.0290 0.0081*
C-A-G 0.0091 0.0205* 0.0208 0.0139 0.0287† 0.0360†
A-A-C 0.0000 0.0034 0.0052* 0.0131† 0.0000 0.0000
VEGF -2578/-1154/936
C-G-C 0.6146 0.5643* 0.5730* 0.6157 0.5192† 0.5919
A-G-C 0.0847 0.1163* 0.0851 0.0836 0.0872 0.0803
A-A-T 0.0354 0.0507 0.0856† 0.0679† 0.1064† 0.0342
C-A-C 0.0274 0.0126† 0.0243 0.0145* 0.0367 0.0399
C-A-T 0.0050 0.0088 0.0000* 0.0000* 0.0000 0.0037
VEGF -2578/-634/936
C-C-C 0.3633 0.3226* 0.3450 0.3582 0.3228* 0.3370
C-G-C 0.2810 0.2565 0.2479 0.2644 0.2279† 0.2939
A-G-T 0.0715 0.0930 0.1162 0.0937 0.1382† 0.0684
C-G-T 0.0201 0.0348* 0.0230 0.0150 0.0336 0.0357*
VEGF -1154/-634/936
G-G-C 0.3363 0.3417 0.3039 0.3436 0.2582† 0.3380
A-G-C 0.1156 0.1133 0.1425 0.1241 0.1708† 0.1549†
G-C-T 0.0648 0.0876* 0.0756 0.0882* 0.0668 0.0634
G-G-T 0.0612 0.0598 0.0552 0.0401* 0.0727 0.0641
A-G-T 0.0335 0.0551* 0.0685† 0.0472 0.0869† 0.0373
A-C-C 0.0195 0.0000† 0.0000† 0.0000† 0.0000† 0.0085*
A-C-T 0.0065 0.0040 0.0086 0.0109 0.0080 0.0000**
Two-sided �2 test, each haplotype compared with all other haplotypes.VEGF indicates vascular endothelial growth factor; SAO, small-artery occlusion.*P�0.05.†P�0.01.‡P value was calculated using the omnibus �2 test.
Kim et al VEGF Polymorphisms and the Risk of Stroke and SBI 2399
by guest on July 1, 2018http://stroke.ahajournals.org/
Dow
nloaded from
other hypoxia-inducible genes such as erythropoietin ortyrosine hydroxylase.71
There are several limitations of the present study: (1) asnoted, it is not yet clear which genetic polymorphisms predictthe phenotypes associated with ischemic stroke and SBI. Thestudy population comprised of only Korean individuals, andour findings will need to be validated in other ethnic groups;(2) this was a hospital-based case–control study, which had arelatively small sample size of individual stroke subtypes.However, we think that the recruitment of �1000 individualsfrom an ethnically homogeneous population (Koreans have alow degree of interracial marriage) is enough to give reliabledata; (3) control subjects were not recruited from a com-pletely “healthy” population, because some of them wereseeking medical attention. Those who agreed to diagnosticevaluation differed from those who did not agree. Therefore,it would not be easy to identify the casual effects of vascularrisk factors in these subjects. Our results may underestimate
the true impact of individual risk factors based on a selectionbias. However, in our experience, recruitment of healthyparticipants markedly reduces recruitment rates because ofthe refusal of laboratory and imaging studies. Only interview-dependent risk factor assessment without laboratory andimaging studies may fail to find covert risk factors andasymptomatic lesions (for example, SBI), leading to anotherpotential for bias. In the present study, approximately 6% ofthe study subjects were found to have a new vascular riskfactor through laboratory tests at the time of examination. Allof our study subjects had brain imaging and were confirmedby negative symptomatic brain lesion, thereby enhancing thediagnostic accuracy and exact case–control grouping. Al-though a population-based study may be optimal to reducethe referral or selection bias, it is difficult to obtain sufficientnumbers of stroke incidents among the cohort because theestimated annual incidence of stroke is known to be low in thegeneral population; and (4) our results cannot be extrapolated
Table 5. Plasma Homocysteine Levels and Variability in Plasma Homocysteine of VEGF -2578C>A,-1154G>A, -634G>C, and 936C>T Genotypes Among Ischemic Stroke, Ischemic Stroke Subtypes, SilentBrain Infarction (SBI), and Control Subjects
Group Mean�SD (no.) CV, % Mean�SD (no.) CV, % Mean�SD (no.) CV, % P*
VEGF -2578C�A CC CA AA
Control subjects 9.88�3.93 (261) 39.8 10.38�4.50 (201) 43.4 9.83�3.68 (29) 37.4 0.554
Ischemic stroke 11.10�5.86 (298) 52.8 11.40�5.08 (249) 44.6 11.21�4.71 (64) 42.0 0.199
Small-arteryocclusion (SAO)
11.07�5.48 (96) 49.5 11.69�4.73 (99) 40.5 11.58�4.75 (19) 41.0 0.277
Single SAO 11.11�5.69 (58) 51.2 10.61�4.11 (52) 38.7 12.46�5.18 (8) 41.6 0.611
Multiple SAO 11.00�5.22 (38) 47.5 12.89�5.12 (47) 39.7 10.95�4.57 (11) 41.7 0.091
SBI 11.12�5.06 (196) 45.5 11.95�7.84 (148) 65.6 10.74�4.32 (28) 40.2 0.615
VEGF -1154G�A GG GA AA
Control subjects 9.97�4.19 (337) 42.0 10.22�4.15 (136) 41.0 11.24�3.60 (18) 32.0 0.149
Ischemic stroke 11.18�5.73 (425) 51.3 11.20�4.49 (161) 40.1 12.50�5.88 (25) 47.0 0.284
SAO 11.16�5.27 (132) 47.2 11.95�4.73 (70) 39.6 10.88�4.89 (12) 44.9 0.283
Single SAO 10.87�5.26 (80) 48.4 11.13�4.27 (33) 38.4 11.70�6.01 (5) 51.4 0.715
Multiple SAO 11.61�5.30 (52) 45.7 12.67�5.06 (37) 39.9 10.30�4.25 (7) 41.3 0.271
SBI 11.35�5.33 (243) 47.0 11.56�8.40 (108) 72.7 11.53�2.98 (21) 25.8 0.438
VEGF -634G�C GG GC CC
Control subjects 10.16�4.61 (135) 45.4 9.87�3.48 (268) 35.3 10.60�5.21 (88) 49.2 0.959
Ischemic stroke 10.60�4.45 (178) 42.0 11.67�5.76 (341) 49.4 10.86�5.85 (92) 53.9 0.109
SAO 10.56�4.57 (58) 43.3 11.86�5.29 (128) 44.6 11.03�4.93 (28) 44.7 0.231
Single SAO 11.26�5.48 (30) 48.7 10.94�4.68 (71) 42.8 10.63�5.66 (17) 53.2 0.730
Multiple SAO 9.82�3.27 (28) 33.3 13.01�5.81 (57) 44.7 11.64�3.69 (11) 31.7 0.043
SBI 11.60�5.51 (124) 47.5 11.66�7.64 (168) 65.5 10.63�3.69 (80) 34.7 0.504
VEGF 936C�T CC CT TT
Control subjects 10.00�3.89 (343) 38.9 9.98�4.39 (245) 44.1 10.50�5.24 (56) 49.9 0.683
Ischemic stroke 10.87�4.99 (378) 45.9 11.65�5.58 (214) 47.9 13.92�9.96 (19) 71.6 0.072
SAO 10.96�4.79 (130) 43.7 12.29�5.43 (79) 44.2 8.76�4.84 (5) 55.3 0.079
Single SAO 10.63�4.46 (76) 42.0 11.97�5.75 (40) 48.0 4.26�1.05 (2) 24.6 0.041
Multiple SAO 11.43�5.22 (54) 45.7 12.62�5.14 (39) 40.7 11.77�3.53 (3) 30.0 0.268
SBI 11.45�7.09 (259) 61.9 11.46�3.68 (104) 32.1 10.20�5.29 (9) 51.6 0.118
VEGF indicates vascular endothelial growth factor; CV, between-person coefficient of variation; SAO, small-artery occlusion; SBI,silent brain infarction.
*Kruskal-Wallis test of non-parametric test with plasma homocysteine levels in genotypes.
2400 Stroke September 2011
by guest on July 1, 2018http://stroke.ahajournals.org/
Dow
nloaded from

to other races because interethnic variability in frequencies ofstroke subtypes and genotypes may produce different results.
The genotype and allele frequencies of the VEGF poly-morphisms may vary among different populations. For exam-ple, Park et al29 reported a comparison of VEGF poly-morphism data in healthy populations obtained from variousstudies, finding that the frequency of the VEGF -2578A allelewas 0.378 to 0.504 in whites and 0.276 to 0.280 in Asians.For the VEGF -1154A allele, the frequencies were 0.30 to0.32 in whites and 0.18 in Koreans,26 suggesting that there isa racial difference in the allele frequencies of the -2578C�Aand -1154G�A polymorphisms. Therefore, additional studiesinvolving different racial or ethnic groups or samples ofpopulations of homogeneous origin are needed to confirm ourresults.
In conclusion, the VEGF polymorphisms were associatedwith the risk of ischemic stroke, particularly in patients withmultiple SAOs. The adjusted OR values of the -2578A,-1154A, -634G, and 936T alleles, which are related toabnormal VEGF expression levels, were much higher inmultiple SAO patients than in the single SAO group. TheVEGF polymorphisms were significantly different betweenpatients with SBI and multiple SAOs. These findings suggestthat VEGF polymorphisms are a genetic determinant for therisk of multiple SAOs in the Korean population. Furtherstudies of other racial or ethnic populations and of thebiological functions of VEGF are needed to fully understandthe role of VEGF polymorphisms in the risk of multipleSAOs in patients with ischemic stroke and patients with SBI.
Sources of FundingThis work was partly supported by National Research Foundation ofKorea Grant funded by the Korean Government (2009-0070341) andpartly supported by Priority Centers Program through the NationalResearch Foundation of Korea (NRF) funded by the Ministry ofEducation, Science and Technology (2009-0093821).
DisclosuresNone.
References1. World Health Organization. The World Health Report 2002: reducing
risks, promoting healthy life. Geneva: WHO; 2002. Available at:www.who.int/whr/2002/en/. Accessed October 4, 2003.
2. Warlow CP. Epidemiology of stroke. Lancet. 1998;352:SIII1–SIII4.3. Goldstein LB, Adams R, Becker K, Furberg CD, Gorelick PB,
Hademenos G, et al. Primary prevention of ischemic stroke: a statementfor healthcare professionals from the Stroke Council of the AmericanHeart Association. Stroke. 2001;32:280–299.
4. Korea National Statistical Office. Change in leading causes of death(1999–2009). 2009. Available at: kosis.kr/ups3/service/ch_file_down.jsp?PUBCODE�YD&FILE_NAME�/ups3/upload/101/YD/VD0005.xls&SEQ�8. Accessed June 26, 2011.
5. Vermeer SE, Koudstaal PJ, Oudkerk M, Hofman MM. Prevalence andrisk factors of silent brain infarcts in the population-based RotterdamScan Study. Stroke. 2002;33:21–25.
6. Kase CS, Wolf PA, Chodosh EH, Zacker HB, Kelly-Hayes M, KannelWB, et al. Prevalence of silent stroke in patients presenting with initialstroke: the Framingham Study. Stroke. 1989;20:850–852.
7. Malinow MR. Homocyst(e)ine and arterial occlusive disease. J InternMed. 1994;236:603–617.
8. Durand P, Lussier-Cacan S, Blache D. Acute methionine load-inducedhyperhomocysteinemia enhances platelet aggregation, thromboxane bio-synthesis, and macrophage-derived tissue factor activity in rats. FASEB.1997;11:1157–1168.
9. Duell PB, Malinow MR. Homocyst(e)ine: an important risk factor foratherosclerotic vascular disease. Curr Opin Lipidol. 1997;8:28–34.
10. Matsui T, Arai H, Yuzuriha T, Yao H, Miura H, Hashimoto S, et al.Elevated plasma homocysteine levels and risk of silent brain infarction inelderly people. Stroke. 2001;32:1116–1119.
11. Vermeer SE, van Dijk EJ, Koudstaal PJ, Oudkerk M, Hofman A, ClarkeR, et al. Homocysteine, silent brain infarcts, and white matter lesions: theRotterdam Scan Study. Ann Neurol. 2002;51:285–289.
12. Howard G, Wagenknecht LE, Cai J, Cooper L, Kraut MA, Toole JF.Cigarette smoking and other risk factors for silent cerebral infarction inthe general population. Stroke. 1998;29:913–917.
13. Kobayashi S, Okada K, Koide H, Bokura H, Yamaguchi S. Subcorticalsilent brain infarction as a risk factor for clinical stroke. Stroke. 1997;28:1932–1939.
14. Kwon HM, Kim BI, Lee SH, Choi SH, Oh BH, Yoon BW. Metabolicsyndrome as an independent risk factor of silent brain infarction inhealthy people. Stroke. 2006;37:466–470.
15. La Rosa S, Uccella S, Finzi G, Albarello L, Sessa F, Capella C. Local-ization of vascular endothelial growth factor and its receptors in digestiveendocrine tumors: correlation with microvessel density and clinicopath-ologic features. Hum Pathol. 2003;34:18–27.
16. Vincenti V, Cassano C, Rocchi M, Persico G. Assignment of the vascularendothelial growth factor gene to human chromosome 6p21.3. Circulation.1996;93:1493–1495.
17. Leung DW, Cachianes G. Kuang WJ, Goeddel DV, Ferrara N. Vascularendothelial growth factor is a secreted angiogenic mitogen. Science.1989;246:1306–1309.
18. Shweiki D, Itin A, Soffer D, Keshet E. Vascular endothelial growth factorinduced by hypoxia may mediate hypoxia-initiated angiogenesis. Nature.1992;359:843–845.
19. Ogunshola OO, Stewart WB, Mihalcik V, Solli T, Madri JA, Ment LR.Neuronal VEGF expression correlates with angiogenesis in postnataldeveloping rat brain. Brain Res. 2000;119:139–153.
20. Kovacs Z, Ikezaki K, Samoto K, Inamura T, Fukui M. VEGF and Flt.Expression time kinetics in rat brain infarct. Stroke. 1996;27:1865–1872.
21. Hayashi T, Abe K, Suzuki H, Itoyama Y. Rapid induction of vascularendothelial growth factor gene expression after transient middle cerebralartery occlusion in rats. Stroke. 1997;28:2039–2044.
22. Lennmyr F, Ata KA, Funa K, Olsson Y, Terent A. Expression of vascularendothelial growth factor (VEGF) and its receptors (Flt-1 and Flk-1)following permanent and transient occlusion of the middle cerebral arteryin the rat. J Neuropathol Exp Neurol. 1998;57:874–882.
23. Brogan IJ, Khan N, Isaac K, Hutchinson JA, Pravica V, Hutchinson IV.Novel polymorphisms in the promoter and 5�UTR regions of the humanvascular endothelial growth factor gene. Hum Immunol. 1999;60:1245–1249.
24. Watson CJ, Webb NJ, Bottomley MJ, Brenchley PE. Identification ofpolymorphisms within the vascular endothelial growth factor (VEGF)gene: correlation with variation in VEGF protein production. Cytokine.2000;12:1232–1235.
25. Renner W, Kotschan S, Hoffmann C, Obermayer-Pietsch B, Pilger E. Acommon 936 C/T mutation in the gene for vascular endothelial growthfactor is associated with vascular endothelial growth factor plasma levels.J Vasc Res. 2000;37:443–448.
26. Lee HH, Hong SH, Shin SJ, Ko JJ, Oh D, Kim NK. Association study ofvascular endothelial growth factor polymorphisms with the risk ofrecurrent spontaneous abortion. Fertil Steril. 2010;93:1244–1247.
27. Papazoglou D, Galazios G, Koukourakis MI, Panagopoulos I, Konto-manolis EN, Papatheodorou K, et al. Vascular endothelial growth factorgene polymorphisms and pre-eclampsia. Mol Hum Reprod. 2004;10:321–324.
28. Del Bo R, Scarlato M, Ghezzi S, Martinelli F, Boneschi M, Fenoglio C,et al. Vascular endothelial growth factor gene variability is associatedwith increased risk for AD. Ann Neurol. 2005;57:373–380.
29. Park HM, Hong SH, Kim JW, Oh D, Hwang SG, An HJ, et al. Gender-specific association of the VEGF -2578C�A polymorphism in Koreanpatients with colon cancer. Anticancer Res. 2007;27:2535–2539.
30. Jin Q, Hemminki K, Enquist K, Lenner P, Grzybowska E, Klaes R, et al.Vascular endothelial growth factor polymorphisms in relation to breastcancer development and prognosis. Clin Cancer Res. 2005;11:3647–3653.
31. Bae SJ, Kim JW, Kang H, Hwang SG, Oh D, Kim NK. Gender-specificassociation between polymorphism of vascular endothelial growth factor(VEGF 936C�T) gene and colon cancer in Korea. Anticancer Res.2008;28:1271–1276.
Kim et al VEGF Polymorphisms and the Risk of Stroke and SBI 2401
by guest on July 1, 2018http://stroke.ahajournals.org/
Dow
nloaded from

32. Bae SJ, Ahn DH, Hong SP, Kang H, Hwang SG, Oh D, et al. Gender-specific association between polymorphism of vascular endothelialgrowth factor (VEGF 936C�T) gene and patients with stomach cancer.Yonsei Med J. 2008;49:783–791.
33. Yang JP, Liu HJ, Wang ZL, Cheng SM, Cheng X, Xu GL, et al. Thedose-effectiveness of intranasal VEGF in treatment of experimentalstroke. Neurosci Lett. 2009;461:212–216.
34. Zhang W, Sun K, Zhen Y, Wang D. Wang Y, Chen J, et al. VEGFreceptor-2 variants are associated with susceptibility to stroke and recur-rence. Stroke. 2009;40:2720–2726.
35. Welch GN, Upchurch GJR, Loscalzo J. Hyperhomocyst(e)inemia andatherothrombosis. Ann NY Acad Sci. 1997;811:48–58.
36. Nagai Y, Tasaki H, Takatsu H, Nihei S, Yamashita K, Nakashima Y.Homocysteine inhibits angiogenesis in vitro and in vivo. Biochem BiophysRes Commun. 2001;281:726–731.
37. Guerzoni AR, Biselli PM, Godoy MF, Souza DR, Haddad R, Eberlin MN,et al. Homocysteine and MTHFR and VEGF gene polymorphisms:impact on coronary artery disease. Arq Bras Cardiol. 2009;92:249–254.
38. Adams HP Jr, Bendixen BH, Kappelle LJ, Biller J, Love BB, Gordon DL,et al. Classification of subtype of acute ischemic stroke. Definitions foruse in a multicenter trial. TOAST. Trial of Org 10172 in Acute StrokeTreatment. Stroke. 1993;24:35–41.
39. Lee BC, Roh JK. International experience in stroke registries: KoreanStroke Registry. Am J Prev Med. 2006;31:S243–S245.
40. Kim NK, Choi BO, Jung WS, Choi YJ, Choi KG. Hyperhomocysteinemiaas an independent risk factor for silent brain infarction. Neurology.2003;61:1595–1599.
41. Benjamini Y, Hochberg Y. Controlling the false discovery rate: apractical and powerful approach to multiple testing. J Royal Stat Soc SerB. 1995;57:289–300.
42. Hedrick PW. Gametic disequilibrium measures: proceed with caution.Genetics. 1987;117:331–341.
43. Simmons M. Angiogenesis. Where do we stand now? Circulation. 2005;111:1556–1566.
44. Losordo DW, Dimmeler S. Therapeutic angiogenesis and vasculogenesisfor ischemic disease part I: angiogenic cytokines. Circulation. 2004;109:2487–2491.
45. Marti HJ, Bernaudin M, Bellail A, Schoch H, Euler M, Petit E, et al.Hypoxia-induced vascular endothelial growth factor expression precedesneovascularization after cerebral ischemia. Am J Pathol. 2000;156:965–976.
46. Sun Y, Jin K, Xie L, Childs J, Mao XO, Mogvinova A, et al. VEGF-induced neuroprotection, neurogenesis, and angiogenesis after focalcerebral ischemia. J Clin Invest. 2003;111:1843–1851.
47. Verheul HMW, Jorna AS, Hoekman K, Broxterman HJ, Gebbink MF,Pinedo HM. Vascular endothelial growth factor-stimulated endothelialcells promote adhesion and activation of platelets. Blood. 2000;96:4216–4221.
48. Verheul HMW, Hoekman K, Lupu F, Broxterman HJ, Kakkar AK,Pinedo HM. High VEGF concentration and activation of coagulationpathway, including platelets, in aspirated fluids of soft tissue sarcomas.Clin Cancer Res. 2000;6:166–171.
49. Yang JP, Liu HJ, Liu XF. VEGF promotes angiogenesis and functionalrecovery in stroke rats. J Invest Surg. 2010;23:149–155.
50. Papavassiliou E, Gegate N, Proescholdt M, Heiss JD, Walbridge S,Edwards NA, et al. Vascular endothelial growth factor (vascular perme-ability factor) expression in injured rat brain. J Neurosci Res. 1997;49:451–460.
51. Kubo M. Genetic risk factors of ischemic stroke identified by agenome-wide association study Brain Nerve. 2008;60:1339–1344.
52. Yamada Y, Fuku N, Tanaka M, Aoyagi Y, Sawabe M, Metoki N, et al.Identification of CELSR1 as a susceptibility gene for ischemic stroke inJapanese individuals by a genome-wide association study. Atherosclerosis.2009;207:144–149.
53. Ding H, Wu B, Wang H, Lu Z, Yan J, Wang X, et al. A novel loss-of-function DDAH1 promoter polymorphism is associated with increasedsusceptibility to thrombosis stroke and coronary heart disease. Stroke.2010;41:177–180.
54. Banerjee I, Gupta V, Ganesh S. Association of gene polymorphism withgenetic susceptibility to stroke in Asian populations: a meta-analysis.J Hum Genet. 2007;52:205–219.
55. Eikelboom JW, Hankey GJ, Anand SS, Lofthouse E, Staples N, Baker RI.Association between high homocyst(e)ine and ischemic stroke due tolarge- and small-artery disease but not other etiologic subtypes of ische-mic stroke. Stroke. 2003;31:1069–1075.
56. Markus HS, Ali S, Swaminathan R, Sankaralingam A, Mollo J, Powell J.A common polymorphism in the methylenetetrahydrofolate reductasegene, homocysteine, and ischemic cerebrovascular disease. Stroke. 1997;28:1739–1743.
57. Szolnoki Z, Somogyvari F, Kondacs A, Szabo M, Fodor L. Evaluation ofthe interactions of common genetic mutations in stroke subtypes.J Neurol. 2002;249:1391–1397.
58. Roman GC, Erkinjuntti T, Wallin A, Oantoni L, Chui HC. Subcorticalischemic vascular dementia. Lancet Neurol. 2002;1:426–436.
59. O’Brien JT, Erkinjuntti T, Reisberg B, Roman G, Saewada T, Pantoni L,et al. Vascular cognitive impairment. Lancet Neurol. 2003;2:89–98.
60. Choi BO, Kim NK, Kim SH, Kang MS, Lee S, Ahn JY, et al.Homozygous C677T mutation in the MTHFR gene as an independent riskfactor for multiple small-artery occlusions. Thromb Res. 2003;111:39–44.
61. Morita H, Kurihara H, Tsubaki S, Sugiyama T, Hamada C, Kurihara Y,et al. Methylene-tetrahydrofolate reductase gene polymorphism and is-chemic stroke in Japanese. Arterioscler Thromb Vasc Biol. 1998;18:1465–1469.
62. Yoo JH, Choi GD, Kang SS. Pathogenicity of thermolabile methylene-tetrahydrofolate reductase for vascular dementia. Arterioscler ThrombVasc Biol. 2000;20:1921–1925.
63. Makin AJ, Chung NAY, Silverman SH, Lip GY. Vascular endothelialgrowth factor and tissue factor in patients with established peripheralartery disease: a link between angiogenesis and thrombogenesis? Clin Sci.2003;104:397–404.
64. Inoue M, Itoh H, Ueda M, Naruko T, Kojima A, Komatsu R, et al.Vascular endothelial growth factor (VEGF) expression in humancoronary atherosclerotic lesions: possible pathophysiological significanceof VEGF in progression of atherosclerosis. Circulation. 1998;98:2108–2116.
65. Roybal CN, Yang S, Sun CW, Hurtado D, Jagt DLV, Townes TM, et al.Homocysteine increases the expression of VEGF by a mechanisminvolving endoplasmic reticulum stress and transcription factor ATF4.J Biol Chem. 2004;279:14844–14852.
66. Maeda M, Yamamoto I, Fujio Y, Azuma J. Homocysteine inducesvascular endothelial growth factor expression in differentiated THP-1macrophages. Biochim Biophys Acta. 2003;1623:41–46.
67. Mazure NM, Chen EY, Yeh P, Laderoute KR, Giaccia AJ. Oncogenictransformation and hypoxia synergistically act to modulate vascular en-dothelial growth factor expression. Cancer Res. 1996;56:3436–3440.
68. Shastry S, Tyagi N, Hayden MR, Tyagi SC. Proteomic analysis ofhomocysteine inhibition of microvascular endothelial cell angiogenesis.Cell Mol Biol. 2004;50:932–937.
69. Atta HM, El-Rehani MA, Raheim SA, Galal AMF. Lowering homo-cysteine decreases levels and expression of VEGF165 and endostatin.J Surg Res. 2008;146:202–210.
70. Krippl P, Langsenlehner U, Renner W, Yazdani-Biuki B, Wascher TC,Paulweber B, et al. A common 936C/T gene polymorphism of vascularendothelial growth factor is associated with decreased breast cancer risk.Int J Cancer. 2003;106:468–471.
71. Scandurro AB, Beckman BS. Common proteins bind mRNAs encodingerythropoietin, tyrosine hydroxylase, and vascular endothelial growthfactor. Biochem Biophys Res Commun. 1998;246:436–440.
2402 Stroke September 2011
by guest on July 1, 2018http://stroke.ahajournals.org/
Dow
nloaded from

Nam Keun KimOk Joon Kim, Seung Ho Hong, Seung Hun Oh, Tae Gon Kim, Kyung Tae Min, Doyeun Oh and
Ischemic Stroke and Silent Brain Infarction Polymorphisms and Homocysteine Levels in Patients WithVEGFAssociation Between
Print ISSN: 0039-2499. Online ISSN: 1524-4628 Copyright © 2011 American Heart Association, Inc. All rights reserved.
is published by the American Heart Association, 7272 Greenville Avenue, Dallas, TX 75231Stroke doi: 10.1161/STROKEAHA.110.607739
2011;42:2393-2402; originally published online July 7, 2011;Stroke.
http://stroke.ahajournals.org/content/42/9/2393World Wide Web at:
The online version of this article, along with updated information and services, is located on the
http://stroke.ahajournals.org/content/suppl/2011/07/07/STROKEAHA.110.607739.DC1Data Supplement (unedited) at:
http://stroke.ahajournals.org//subscriptions/
is online at: Stroke Information about subscribing to Subscriptions:
http://www.lww.com/reprints Information about reprints can be found online at: Reprints:
document. Permissions and Rights Question and Answer process is available in the
Request Permissions in the middle column of the Web page under Services. Further information about thisOnce the online version of the published article for which permission is being requested is located, click
can be obtained via RightsLink, a service of the Copyright Clearance Center, not the Editorial Office.Strokein Requests for permissions to reproduce figures, tables, or portions of articles originally publishedPermissions:
by guest on July 1, 2018http://stroke.ahajournals.org/
Dow
nloaded from
SUPPLEMENTAL MATERIAL Supplemental Tables
Supplemental Table 1. OR values of VEGF polymorphism haplotypes among the ischemic stroke, silent brain infarction (SBI), and control subjects
Ischemic stroke SBI Haplotype
OR (95% CI) P* P** OR (95% CI) P* P**
VEGF -2578/-1154/-634/936 C-G-C-C 0.894 (0.749 - 1.068) 0.217 0.775 0.931 (0.780 - 1.112) 0.432 0.924 C-G-G-C 0.858 (0.709 - 1.039) 0.118 0.873 0.952 (0.788 - 1.150) 0.609 1.000 A-A-G-C 0.953 (0.724 - 1.255) 0.732 1.000 1.208 (0.927 - 1.573) 0.162 0.954 A-G-G-C 1.404 (1.026 - 1.922) 0.034 0.285 1.072 (0.772 - 1.490) 0.677 1.000 C-G-C-T 1.236 (0.895 - 1.707) 0.197 0.941 0.907 (0.644 - 1.277) 0.576 1.000 A-A-G-T 1.272 (0.835 - 1.938) 0.262 0.795 0.886 (0.564 - 1.394) 0.601 1.000 A-G-G-T 1.175 (0.748 - 1.846) 0.483 0.989 1.048 (0.661 - 1.663) 0.841 1.000 C-G-G-T 1.334 (0.761 - 2.341) 0.313 0.999 1.585 (0.918 - 2.736) 0.095 0.996 C-A-C-C 0.021 (0.001 - 0.354) <0.0001 0.001 0.397 (0.178 - 0.888) 0.020 0.888 A-G-C-C 1.519 (0.823 - 2.803) 0.178 0.983 0.448 (0.197 - 1.018) 0.049 0.882 C-A-G-C 1.343 (0.585 - 3.082) 0.485 1.000 3.562 (1.717 - 7.391) 0.000 0.034 C-A-C-T 0.200 (0.022 - 1.795) 0.110 0.540 0.089 (0.005 - 1.654) 0.026 0.729 A-G-C-T 0.114 (0.006 - 2.219) 0.053 1.000 0.114 (0.006 - 2.219) 0.053 0.978 C-A-G-T 17.008 (0.995 - 290.811) 0.005 0.284 8.873 (0.490 - 160.769) 0.045 0.833 A-A-C-T 7.254 (0.390 - 134.985) 0.073 0.975 - - -
VEGF -2578/-1154/-634 A-G-G 1.313 (1.008 - 1.711) 0.043 0.177 1.047 (0.796 - 1.377) 0.744 1.000 C-A-C 0.034 (0.005 - 0.253) <0.0001 0.001 0.309 (0.142 - 0.672) 0.002 0.412 A-G-C 1.439 (0.803 - 2.581) 0.219 0.820 0.442 (0.203 - 0.962) 0.034 0.655 C-A-G 2.257 (1.048 - 4.858) 0.033 0.914 4.036 (1.960 - 8.309) <0.0001 0.015
VEGF -2578/-1154/936 C-G-C 0.813 (0.685 - 0.964) 0.017 0.072 0.910 (0.767 - 1.080) 0.282 0.953 A-G-C 1.416 (1.066 - 1.880) 0.016 0.139 0.942 (0.695 - 1.276) 0.700 0.999 C-A-C 0.439 (0.232 - 0.831) 0.009 0.153 1.477 (0.916 - 2.381) 0.108 0.732
VEGF -2578/-634/936 C-C-C 0.835 (0.700 - 0.996) 0.045 0.143 0.892 (0.749 - 1.063) 0.202 0.511 C-G-T 1.753 (1.024 - 3.001) 0.038 0.579 1.796 (1.051 - 3.067) 0.030 0.761
VEGF -1154/-634/936 A-G-C 0.977 (0.751 - 1.271) 0.861 0.992 1.409 (1.099 - 1.808) 0.007 0.156 G-C-T 1.390 (1.008 - 1.916) 0.044 0.426 0.978 (0.695 - 1.376) 0.896 0.999 A-G-T 1.694 (1.108 - 2.589) 0.014 0.132 1.124 (0.713 - 1.773) 0.614 0.998 A-C-C 0.020 (0.001 - 0.335) <0.0001 0.020 0.418 (0.193 - 0.903) 0.022 0.800 A-C-T 0.668 (0.203 - 2.196) 0.504 0.911 0.061 (0.003 - 1.092) 0.006 0.630
* Two-sided chi-square test, each haplotype compared with all other haplotypes. ** After 10,000 permutation test with Haploview 4.1software.
1

2
Supplemental Table 2. OR values of VEGF polymorphism haplotypes among the ischemic stroke subtypes and control subjects
Small-artery occlusion Single small-artery occlusion Multiple small-artery occlusion Haplotype
OR (95% CI) P* P** OR (95% CI) P* P** OR (95% CI) P* P**
VEGF -2578/-1154/-634/936
C-G-C-C 0.991 (0.831 - 1.182) 0.920 1.000 1.072 (0.899 - 1.277) 0.438 1.000 0.898 (0.752 - 1.072) 0.233 0.927
C-G-G-C 0.788 (0.649 - 0.956) 0.016 0.573 0.893 (0.738 - 1.080) 0.244 1.000 0.665 (0.545 - 0.810) <0.0001 0.256
A-A-G-C 1.092 (0.834 - 1.429) 0.522 0.996 0.843 (0.636 - 1.118) 0.235 1.000 1.199 (0.920 - 1.562) 0.180 0.892
A-G-G-C 1.098 (0.792 - 1.524) 0.575 1.000 1.310 (0.953 - 1.799) 0.095 1.000 0.931 (0.664 - 1.305) 0.677 1.000
C-G-C-T 0.959 (0.684 - 1.345) 0.807 1.000 1.090 (0.783 - 1.516) 0.610 1.000 0.792 (0.557 - 1.126) 0.194 1.000
A-A-G-T 2.127 (1.440 - 3.142) 0.000 0.018 1.812 (1.217 - 2.699) 0.003 0.972 3.090 (2.124 - 4.495) <0.0001 0.002
A-G-G-T 1.048 (0.661 - 1.663) 0.841 1.000 0.998 (0.626 - 1.591) 0.993 1.000 1.074 (0.678 - 1.700) 0.762 1.000
C-G-G-T 1.086 (0.606 - 1.949) 0.781 1.000 0.719 (0.378 - 1.367) 0.312 1.000 1.585 (0.918 - 2.736) 0.095 1.000
C-A-C-C 0.021 (0.001 - 0.354) <0.0001 0.496 0.021 (0.001 - 0.354) <0.0001 0.689 0.353 (0.153 - 0.815) 0.011 0.991
A-G-C-C 0.750 (0.369 - 1.525) 0.425 1.000 0.024 (0.001 - 0.400) <0.0001 0.987 1.467 (0.792 - 2.717) 0.220 1.000
C-A-G-C 2.441 (1.143 - 5.217) 0.017 0.967 1.525 (0.676 - 3.436) 0.306 1.000 3.186 (1.52 - 6.661) 0.001 0.534
C-A-C-T 0.401 (0.073 - 2.193) 0.275 0.994 0.089 (0.005 - 1.654) 0.026 0.995 0.089 (0.005 - 1.654) 0.026 1.000
A-G-C-T 0.803 (0.162 - 3.988) 0.788 1.000 0.114 (0.006 - 2.219) 0.053 1.000 2.149 (0.569 - 8.126) 0.248 1.000
A-A-C-C - - - 25.211 (1.506 - 422.155) 0.001 1.000 - - -
A-A-C-T 13.746 (0.792 - 238.616) 0.011 0.748 - - - - - -
VEGF -2578/-1154/-634
C-G-G 0.811 (0.672 - 0.979) 0.029 0.560 0.880 (0.730 - 1.061) 0.180 0.989 0.723 (0.597 - 0.875) 0.001 0.372
A-A-G 1.419 (1.129 - 1.782) 0.003 0.085 1.104 (0.872 - 1.398) 0.410 0.979 1.795 (1.437 - 2.242) <0.0001 0.015
C-A-C 0.103 (0.031 - 0.343) <0.0001 0.291 0.017 (0.001 - 0.275) <0.0001 0.355 0.275 (0.122 - 0.617) 0.001 0.920
A-G-C 0.846 (0.441 - 1.620) 0.613 1.000 0.021 (0.001 - 0.354) <0.0001 0.947 1.625 (0.917 - 2.880) 0.093 0.971
C-A-G 2.349 (1.095 - 5.037) 0.024 0.870 1.525 (0.677 - 3.436) 0.306 1.000 3.186 (1.524 - 6.661) 0.001 0.407
A-A-C 10.495 (0.590 - 186.648) 0.028 0.797 26.859 (1.609 - 448.563) 0.000 0.590 - -
VEGF -2578/-1154/936
C-G-C 0.843 (0.711 - 1.000) 0.050 0.257 1.005 (0.846 - 1.193) 0.959 1.000 0.679 (0.573 - 0.805) <0.0001 0.020
A-A-T 2.541 (1.717 - 3.762) <0.0001 0.010 1.996 (1.333 - 2.988) 0.001 0.546 3.246 (2.213 - 4.760) <0.0001 0.004
C-A-C 0.890 (0.525 - 1.507) 0.664 0.995 0.529 (0.289 - 0.966) 0.035 0.821 1.352 (0.832 - 2.195) 0.221 1.000
C-A-T 0.073 (0.004 - 1.317) 0.013 1.000 0.073 (0.004 - 1.317) 0.013 0.994 0.073 (0.004 - 1.317) 0.013 1.000
VEGF -2578/-634/936
C-C-C 0.922 (0.774 - 1.098) 0.361 0.858 0.979 (0.823 - 1.166) 0.814 1.000 0.835 (0.700 - 0.996) 0.045 0.576
C-G-C 0.842 (0.697 - 1.018) 0.076 0.642 0.917 (0.760 - 1.107) 0.367 0.997 0.753 (0.621 - 0.912) 0.004 0.468
A-G-T 1.699 (1.261 - 2.289) 0.000 0.045 1.332 (0.979 - 1.814) 0.068 0.847 2.071 (1.549 - 2.770) <0.0001 0.016
VEGF -1154/-634/936
G-G-C 0.863 (0.722 - 1.033) 0.108 0.775 1.036 (0.868 - 1.236) 0.697 1.000 0.689 (0.573 - 0.828) <0.0001 0.254
A-G-C 1.272 (0.988 - 1.637) 0.062 0.757 1.089 (0.841 - 1.410) 0.517 1.000 1.578 (1.235 - 2.017) 0.000 0.227
G-C-T 1.181 (0.849 - 1.643) 0.323 0.978 1.390 (1.008 - 1.916) 0.044 0.976 1.031 (0.735 - 1.446) 0.859 0.999
G-G-T 0.905 (0.633 - 1.294) 0.585 1.000 0.642 (0.436 - 0.945) 0.024 0.999 1.206 (0.860 - 1.693) 0.277 0.987
A-G-T 2.121 (1.405 - 3.202) 0.000 0.020 1.432 (0.926 - 2.215) 0.105 0.806 2.757 (1.849 - 4.113) <0.0001 0.004
A-C-C 0.020 (0.001 - 0.335) <0.0001 0.797 0.020 (0.001 - 0.335) <0.0001 0.865 0.020 (0.001 - 0.335) <0.0001 0.997
* Two-sided chi-square test, each haplotype compared with all other haplotypes. ** After 10,000 permutation test with Haploview 4.1 software.

Supplemental Table 3. Comparison of genotype frequencies and AOR of VEGF -2578C>A, -1154G>A, -634G>C, and 936C>T polymorphisms between the ischemic stroke subtypes with small-artery occlusion, single and multiple small-artery occlusion, and silent brain infarction (SBI)
Small-artery occlusion Single small-artery occlusion Multiple small-artery occlusion Genotype SBI (%)
Case (%) AOR (95% CI) P P† Case (%) AOR (95% CI) P P† Case (%) AOR (95% CI) P P†
n=376 n=214 n=118 n=96
VEGF -2578C>A
CC 199 (52.9) 96 (44.9) 1.00 (Reference) 58 (49.2) 1.00 (Reference) 38 (39.6) 1.00 (Reference) CA 149 (39.7) 99 (46.2) 1.26 (0.88 - 1.82) 0.208 0.277 52 (44.0) 1.10 (0.70 - 1.71) 0.682 0.690 47 (48.9) 1.55 (0.94 - 2.54) 0.086 0.115 AA 28 (7.4) 19 (8.9) 1.35 (0.70 - 2.62) 0.373 0.708 8 (6.8) 0.88 (0.36 - 2.12) 0.772 0.862 11 (11.5) 2.34 (1.02 - 5.39) 0.046 0.184
CC vs. CA+AA (Dominant) 1.28 (0.90 - 1.82) 0.165 0.220 1.08 (0.70 - 1.65) 0.731 0.731 1.65 (1.02 - 2.66) 0.041 0.059 CC+CA vs. AA (Recessive) 1.24 (0.66 - 2.33) 0.514 0.778 0.94 (0.41 - 2.18) 0.884 0.896 1.72 (0.79 - 3.77) 0.176 0.450
VEGF -1154G>A GG 246 (65.4) 132 (61.7) 1.00 (Reference) 80 (67.8) 1.00 (Reference) 52 (54.2) 1.00 (Reference) GA 109 (29.0) 70 (32.7) 1.16 (0.79 - 1.70) 0.444 0.444 33 (28.0) 0.91 (0.56 - 1.46) 0.690 0.690 37 (38.5) 1.58 (0.96 - 2.61) 0.071 0.115 AA 21 (5.6) 12 (5.6) 1.26 (0.59 - 2.70) 0.555 0.708 5 (4.2) 0.91 (0.33 - 2.55) 0.862 0.862 7 (7.3) 1.92 (0.74 - 4.98) 0.179 0.349
GG vs. GA+AA (Dominant) 1.18 (0.82 - 1.69) 0.379 0.379 0.93 (0.57 - 1.42) 0.660 0.731 1.65 (1.02 - 2.64) 0.040 0.059 GG+GA vs. AA (Recessive) 1.20 (0.57 - 2.55) 0.630 0.778 0.92 (0.33 - 2.54) 0.870 0.896 1.67 (0.66 - 4.24) 0.279 0.450
VEGF -634G>C
GG 128 (34.0) 58 (27.1) 1.00 (Reference) 30 (25.4) 1.00 (Reference) 28 (29.2) 1.00 (Reference) GC 191 (50.8) 128 (59.8) 1.42 (0.96 - 2.11) 0.084 0.168 71 (60.2) 1.53 (0.94 - 2.520) 0.090 0.360 57 (59.4) 1.29 (0.76 - 2.18) 0.352 0.352 CC 57 (15.2) 28 (13.1) 1.12 (0.63 - 1.97) 0.708 0.708 17 (14.4) 1.23 (0.61 - 2.49) 0.558 0.862 11 (11.4) 0.90 (0.41 - 1.99) 0.802 0.802
GG vs. GC+CC (Dominant) 1.36 (0.93 - 1.99) 0.115 0.220 1.48 (0.92 - 2.39) 0.109 0.436 1.22 (0.73 - 2.03) 0.443 0.443 GG+GC vs. CC (Recessive) 0.89 (0.54 - 1.48) 0.659 0.778 0.96 (0.53 - 1.76) 0.896 0.896 0.76 (0.37 - 1.55) 0.450 0.450
VEGF 936C>T
CC 261 (69.4) 130 (60.7) 1.00 (Reference) 76 (64.4) 1.00 (Reference) 54 (56.3) 1.00 (Reference) CT 106 (28.2) 79 (37.0) 1.41 (0.97 - 2.05) 0.075 0.168 40 (33.9) 1.30 (0.82 - 2.08) 0.264 0.528 39 (40.6) 1.60 (0.98 - 2.61) 0.063 0.115
TT 9 (2.4) 5 (2.3) 1.36 (0.43 - 4.25) 0.601 0.708 2 (1.7) 0.76 (0.16 - 3.71) 0.737 0.862 3 (3.1) 2.25 (0.55 - 9.22) 0.262 0.349 CC vs. CT+TT (Dominant) 1.40 (0.97 - 2.02) 0.071 0.220 1.25 (0.79 - 1.98) 0.333 0.666 1.64 (1.01 - 2.65) 0.044 0.059 CC+CT vs. TT (Recessive) 1.18 (0.38 - 3.63) 0.778 0.778 0.70 (0.15 - 3.35) 0.655 0.896 1.76 (0.45 - 6.89) 0.418 0.450 The adjusted odds ratio on the basis of risk factors such as age, gender, hypertension, hyperlipidemia, and diabetes mellitus. † FDR-adjusted P value using the Benjamin-Hochberg method.
3

Supplemental Table 4. Plasma homocysteine levels of VEGF -2578C>A, -1154G>A, -634G>C, and 936C>T haplotypes between ischemic stroke subtypes and control subjects
Homocysteine level (µmol/L) ± SD(n) Haplotype
Control Ischemic stroke P* SBI P*
VEGF -2578/ -1154/ -634/ 936
C-G-C-C 10.19 ± 4.43 11.07 ± 5.00 0.007 11.19 ± 6.54 0.010
C-G-G-C 9.76 ± 3.93 10.80 ± 5.23 0.043 11.60 ± 5.95 <0.0001
A-A-G-C 10.05 ± 2.85 11.11 ± 4.79 0.265 11.60 ± 9.28 0.681
A-G-G-C 10.09 ± 4.28 11.47 ± 5.91 0.230 11.91 ± 6.00 0.078
C-G-C-T 9.70 ± 3.08 12.66 ± 8.73 0.056 11.08 ± 4.38 0.110
A-A-G-T 10.65 ± 5.90 11.86 ± 4.81 0.025 11.45 ± 3.02 0.008
A-G-G-T 10.80 ± 5.14 10.31 ± 3.08 0.729 11.51 ± 4.60 0.290
* Mann-Whitney test of non-parametric test.
4
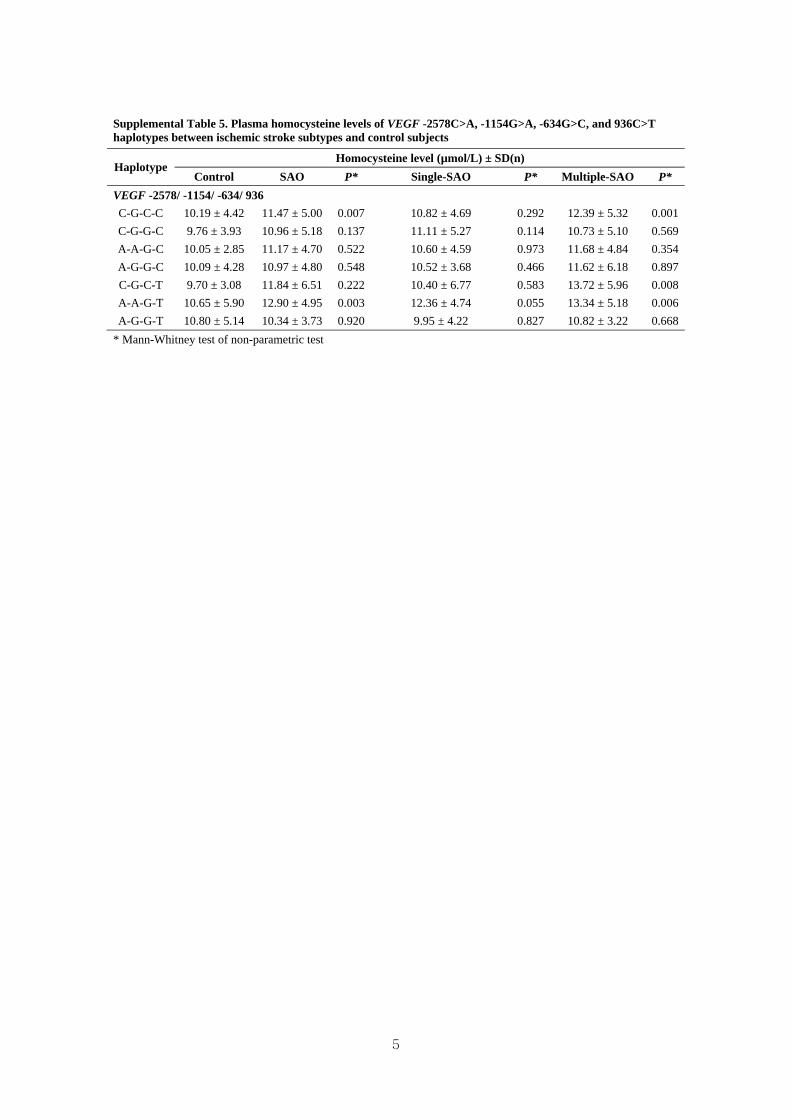
Supplemental Table 5. Plasma homocysteine levels of VEGF -2578C>A, -1154G>A, -634G>C, and 936C>T haplotypes between ischemic stroke subtypes and control subjects
Homocysteine level (µmol/L) ± SD(n) Haplotype
Control SAO P* Single-SAO P* Multiple-SAO P*
VEGF -2578/ -1154/ -634/ 936
C-G-C-C 10.19 ± 4.42 11.47 ± 5.00 0.007 10.82 ± 4.69 0.292 12.39 ± 5.32 0.001
C-G-G-C 9.76 ± 3.93 10.96 ± 5.18 0.137 11.11 ± 5.27 0.114 10.73 ± 5.10 0.569
A-A-G-C 10.05 ± 2.85 11.17 ± 4.70 0.522 10.60 ± 4.59 0.973 11.68 ± 4.84 0.354
A-G-G-C 10.09 ± 4.28 10.97 ± 4.80 0.548 10.52 ± 3.68 0.466 11.62 ± 6.18 0.897
C-G-C-T 9.70 ± 3.08 11.84 ± 6.51 0.222 10.40 ± 6.77 0.583 13.72 ± 5.96 0.008
A-A-G-T 10.65 ± 5.90 12.90 ± 4.95 0.003 12.36 ± 4.74 0.055 13.34 ± 5.18 0.006
A-G-G-T 10.80 ± 5.14 10.34 ± 3.73 0.920 9.95 ± 4.22 0.827 10.82 ± 3.22 0.668
* Mann-Whitney test of non-parametric test
5

6
Supplemental Table 6. Baseline characteristics of ischemic stroke patients, silent brain infarction (SBI) patients, and control subjects in the study samples
Sample 1* Sample2** Characteristics
Control (%) Stroke (%) P Control (%) Stroke (%) P
N 202 228 292 387
Male (%) 103 (51) 130 (57) 0.245 166 (56.8) 218 (56.3) 0.308
Age (year) 60.33 ± 11.05 61.84 ± 11.08 0.160 63.39 ± 12.07 64.42 ± 11.45 0.254
tHcy (µmol/L)† 9.87 ± 4.17 10.83 ± 5.87 0.054 10.23 ± 4.15 (289) 11.48 ± 5.16 (383) 0.000
Folate (nmol/L, n)† 9.99 ± 6.59 (76) 10.01 ± 8.68 (143) 0.985 9.06 ± 8.82 (287) 6.96 ± 6.72 (382) <0.0001
Hypertension (%) 105 (52) 160 (70.2) 0.000 126 (43.2) 233 (60.2) <0.0001
Diabetes mellitus (%) 36 (17.8) 70 (30.7) 0.002 35 (12.0) 110 (28.4) <0.0001
Hyperlipidemia (%) 32 (15.8) 86 (37.7) <0.0001 62 (21.2) 129 (33.3) 0.001
Smoking (%) 22 (10.9) 34 (14.9) 0.252 89 (30.5) 159 (41.1) 0.005
Characteristics Control (%) SBI (%) P Control (%) SBI (%) P
N 202 264 292 112
Male (%) 103 (51) 121 (45.8) 0.304 166 (56.8) 49 (43.8) 0.120
Age (year) 60.33 ± 11.05 62.27 ± 11.96 0.074 63.39 ± 12.07 65.13 ± 10.67 0.182
tHcy (µmol/L)† 9.87 ± 4.17 11.34 ± 6.38 0.005 10.23 ± 4.15 (289) 11.61 ± 6.03 0.005
Folate (nmol/L, n)† 9.99 ± 6.59 (76) 9.70 ± 5.99 0.718 9.06 ± 8.82 (287) 7.80 ± 4.96 (110) 0.112
Hypertension (%) 105 (52) 140 (53.0) 0.852 126 (43.2) 62 (55.4) 0.028
Diabetes mellitus (%) 36 (17.8) 48 (18.2) 1.000 35 (12.0) 22 (19.6) 0.048
Hyperlipidemia (%) 32 (15.8) 85 (32.2) <0.0001 62 (21.2) 34 (30.4) 0.002
Smoking (%) 22 (10.9) - - 89 (30.5) - - Abbreviations: tHcy, plasma total homocysteine P values derived from Chi-square test for categorical data and from Student t-test and †Mann-Whitney test for continuous data. * Sample 1 was recruited from 2000 to 2003. ** Sample 2 was recruited from 2004 to 2008.

7
Supplemental Table 7. Comparison of genotype frequencies and AOR for VEGF -2578C>A, -1154G>A, -634G>C, and 936C>T polymorphisms between the ischemic stroke patients and control subjects in samples 1 and 2
Sample 1* Sample 2**
Control (%) Case (%) AOR (95%CI) P P† Control (%) Case (%) AOR (95%CI) P P† Genotype
n=202 n=228 n=292 n=387
VEGF -2578C>A
CC 107 (53.0) 106 (46.5) 1.00 (Reference) 155 (53.1) 195 (50.4) 1.00 (Reference) CA 81 (40.1) 100 (43.9) 1.30 (0.85 - 1.98) 0.222 0.399 122 (41.8) 150 (38.7) 1.03 (0.72 - 1.47) 0.887 0.887 AA 14 (6.9) 22 (9.6) 1.91 (0.90 - 4.09) 0.094 0.188 15 (5.1) 42 (10.9) 2.56 (1.20 - 5.46) 0.015 0.060
CC vs. CA/AA (Dominant) 1.40 (0.93 - 2.09) 0.105 0.210 1.16 (0.82 - 1.64) 0.389 0.519 CC/CA vs. AA (Recessive) 1.70 (0.82 - 3.54) 0.155 0.207 2.31 (1.11 - 4.80) 0.025 0.100
VEGF -1154G>A GG 137 (67.8) 146 (64.0) 1.00 (Reference) 202 (69.2) 282 (72.9) 1.00 (Reference) GA 56 (27.7) 70 (30.7) 1.27 (0.81 - 1.98) 0.299 0.399 81 (27.7) 92 (23.7) 0.83 (0.56 - 1.23) 0.353 0.471 AA 9 (4.5) 12 (5.3) 1.56 (0.61 - 3.99) 0.356 0.356 9 (3.1) 13 (3.4) 1.87 (0.59 - 5.90) 0.289 0.385
GG vs. GA/AA (Dominant) 1.30 (0.85 - 1.99) 0.224 0.299 0.90 (0.61 - 1.31) 0.567 0.567 GG/GA vs. AA (Recessive) 1.40 (0.55 - 3.54) 0.477 0.477 1.93 (0.61 - 6.11) 0.263 0.351
VEGF -634G>C
GG 66 (32.7) 62 (27.2) 1.00 (Reference) 69 (23.6) 116 (30.0) 1.00 (Reference) GC 103 (51.0) 139 (61.0) 1.13 (0.71 - 1.80) 0.595 0.595 167 (57.2) 206 (53.2) 0.68 (0.49 - 1.03) 0.070 0.202 CC 33 (16.3) 27 (11.8) 0.71 (0.36 - 1.38) 0.306 0.356 56 (19.2) 65 (16.8) 0.57 (0.34 - 0.96) 0.033 0.066
GG vs. GC/CC (Dominant) 1.05 (0.67 - 1.63) 0.841 0.841 0.65 (0.44 - 0.97) 0.034 0.136 GG/GC vs. CC (Recessive) 0.64 (0.36 - 1.16) 0.140 0.207 0.72 (0.47 - 1.12) 0.146 0.292
VEGF 936C>T .
CC 149 (73.8) 138 (60.5) 1.00 (Reference) 195 (66.8) 243 (62.8) 1.00 (Reference) CT 51 (25.2) 83 (36.4) 1.47 (0.95 - 2.30) 0.087 0.348 85 (29.1) 131 (33.8) 1.38 (0.94 - 2.02) 0.101 0.202
TT 2 (1.0) 7 (3.1) 5.09 (0.95 - 27.39) 0.058 0.188 12 (4.1) 13 (3.4) 0.77 (0.31 - 1.94) 0.581 0.581 CC vs. CT/TT (Dominant) 1.59 (1.03 - 2.45) 0.036 0.144 1.31 (0.90 - 1.88) 0.155 0.310 CC/CT vs. TT (Recessive) 4.42 (0.85 - 22.87) 0.077 0.207 0.76 (0.30 - 1.88) 0.546 0.546 The adjusted odds ratio on the basis of risk factors such as age, gender, hypertension, hyperlipidemia, diabetes mellitus, and smoking. † False discovery rate (FDR)-adjusted P value for multiple hypothesis testing using the Benjamin-Hochberg method. * Sample 1 was recruited from 2000 to 2003. ** Sample 2 was recruited from 2004 to 2008. Note: Frequencies of 3 polymorphisms of VEGF -2578C>A (sample 2), -634G>C (sample 2), and 936C>T (sample 1) were significantly different between the control and ischemic
stroke groups, although the associations of the three polymorphisms in ischemic stroke were not replicated in both samples 1 and 2.
8
Supplemental Table 8. Comparison of genotype frequencies and AOR for VEGF -2578C>A, -1154G>A, -634G>C, and 936C>T polymorphisms between the ischemic stroke subtype with small-artery occlusion and control subjects in samples 1 and 2
Sample 1* Sample 2** Genotype
Control (%) Case (%) AOR (95%CI) P P† Control (%) Case (%) AOR (95%CI) P P†
n=202 n=118 n=292 n=96
VEGF -2578C>A
CC 107 (53.0) 47 (39.8) 1.00 (Reference) 155 (53.1) 49 (51.0) 1.00 (Reference) CA 81 (40.1) 58 (49.2) 1.77 (1.07 - 2.94) 0.028 0.112 122 (41.8) 41 (42.7) 0.95 (0.55 - 1.63) 0.856 0.856 AA 14 (6.9) 13 (11.0) 2.73 (1.12 - 6.63) 0.027 0.086 15 (5.1) 6 (6.3) 1.54 (0.50 - 4.70) 0.449 0.898
CC vs. CA/AA (Dominant) 1.89 (1.16 - 3.08) 0.011 0.034 1.02 (0.61 - 1.71) 0.947 0.947 CC/CA vs. AA (Recessive) 1.93 (0.84 - 4.43) 0.123 0.245 1.44 (0.48 - 4.30) 0.517 0.991
VEGF -1154G>A GG 137 (67.8) 65 (55.1) 1.00 (Reference) 202 (69.2) 67 (69.8) 1.00 (Reference) GA 56 (27.7) 43 (36.4) 1.66 (0.99 - 2.80) 0.056 0.112 81 (27.7) 27 (28.1) 1.09 (0.62 - 1.94) 0.763 0.856 AA 9 (4.5) 10 (8.5) 2.79 (1.04 - 7.52) 0.043 0.086 9 (3.1) 2 (2.1) 1.01 (0.17 - 5.98) 0.992 0.992
GG vs. GA/AA (Dominant) 1.82 (1.11 - 2.99) 0.017 0.034 1.08 (0.62 - 1.89) 0.776 0.947 GG/GA vs. AA (Recessive) 1.54 (0.61 - 3.90) 0.367 0.367 0.98 (0.17 - 5.83) 0.985 0.991
VEGF -634G>C
GG 66 (32.7) 29 (24.6) 1.00 (Reference) 69 (23.6) 29 (30.2) 1.00 (Reference) GC 103 (51.0) 78 (66.1) 1.40 (0.80 - 2.46) 0.235 0.235 167 (57.2) 50 (52.1) 0.73 (0.40 - 1.35) 0.316 0.632 CC 33 (16.3) 11 (9.3) 0.65 (0.27 - 1.54) 0.326 0.326 56 (19.2) 17 (17.7) 0.63 (0.29 - 1.37) 0.246 0.898
GG vs. GC/CC (Dominant) 1.23 (0.72 - 2.10) 0.454 0.454 0.72 (0.41 - 1.27) 0.256 0.512 GG/GC vs. CC (Recessive) 1.77 (0.76 - 4.10) 0.184 0.245 0.83 (0.43 - 1.60) 0.584 0.991
VEGF 936C>T
CC 149 (73.8) 73 (61.9) 1.00 (Reference) 195 (66.8) 57 (59.4) 1.00 (Reference) CT 51 (25.2) 43 (36.4) 1.49 (0.88 - 2.50) 0.136 0.136 85 (29.1) 36 (37.5) 1.52 (0.87 - 2.64) 0.142 0.568
TT 2 (1.0) 2 (1.7) 3.55 (0.45 - 27.86) 0.229 0.305 12 (4.1) 3 (3.1) 1.18 (0.28 - 5.00) 0.824 0.992 CC vs. CT/TT (Dominant) 1.54 (0.92 - 2.57) 0.099 0.132 1.47 (0.87 - 2.51) 0.154 0.512 CC/CT vs. TT (Recessive) 1.82 (0.78 - 4.25) 0.164 0.245 1.01 (0.25 - 4.13) 0.991 0.991 The adjusted odds ratio on the basis of risk factors such as age, gender, hypertension, hyperlipidemia, diabetes mellitus, and smoking. † False discovery rate (FDR)-adjusted P value for multiple hypothesis testing using the Benjamin-Hochberg method. * Sample 1 was recruited from 2000 to 2003. ** Sample 2 was recruited from 2004 to 2008. Note: Frequencies of 2 polymorphisms of VEGF -2578C>A (sample 1) and -1154G>A (sample 1) were significantly different between the control and ischemic stroke subtype with
small-artery occlusion groups, although the associations of the two polymorphisms in ischemic stroke subtype with small-artery occlusion were not replicated in both samples 1 and 2.
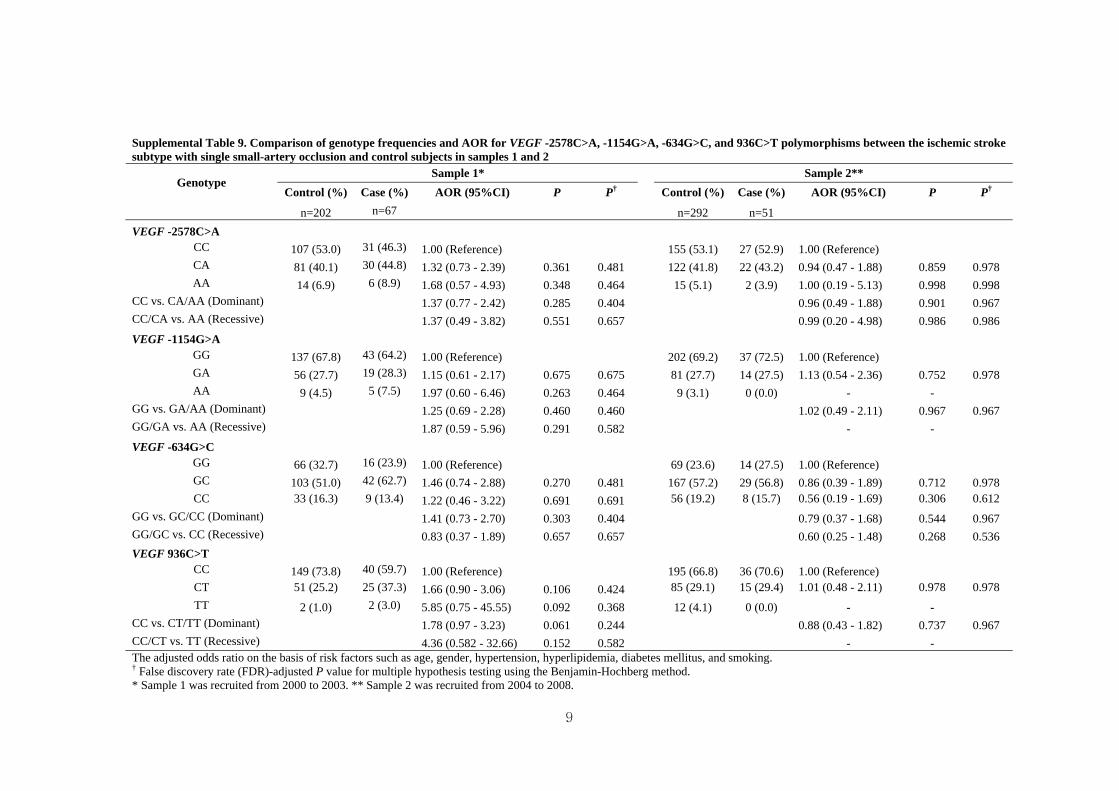
9
Supplemental Table 9. Comparison of genotype frequencies and AOR for VEGF -2578C>A, -1154G>A, -634G>C, and 936C>T polymorphisms between the ischemic stroke subtype with single small-artery occlusion and control subjects in samples 1 and 2
Sample 1* Sample 2** Genotype
Control (%) Case (%) AOR (95%CI) P P† Control (%) Case (%) AOR (95%CI) P P†
n=202 n=67 n=292 n=51
VEGF -2578C>A
CC 107 (53.0) 31 (46.3) 1.00 (Reference) 155 (53.1) 27 (52.9) 1.00 (Reference) CA 81 (40.1) 30 (44.8) 1.32 (0.73 - 2.39) 0.361 0.481 122 (41.8) 22 (43.2) 0.94 (0.47 - 1.88) 0.859 0.978 AA 14 (6.9) 6 (8.9) 1.68 (0.57 - 4.93) 0.348 0.464 15 (5.1) 2 (3.9) 1.00 (0.19 - 5.13) 0.998 0.998
CC vs. CA/AA (Dominant) 1.37 (0.77 - 2.42) 0.285 0.404 0.96 (0.49 - 1.88) 0.901 0.967 CC/CA vs. AA (Recessive) 1.37 (0.49 - 3.82) 0.551 0.657 0.99 (0.20 - 4.98) 0.986 0.986
VEGF -1154G>A GG 137 (67.8) 43 (64.2) 1.00 (Reference) 202 (69.2) 37 (72.5) 1.00 (Reference) GA 56 (27.7) 19 (28.3) 1.15 (0.61 - 2.17) 0.675 0.675 81 (27.7) 14 (27.5) 1.13 (0.54 - 2.36) 0.752 0.978 AA 9 (4.5) 5 (7.5) 1.97 (0.60 - 6.46) 0.263 0.464 9 (3.1) 0 (0.0) - -
GG vs. GA/AA (Dominant) 1.25 (0.69 - 2.28) 0.460 0.460 1.02 (0.49 - 2.11) 0.967 0.967 GG/GA vs. AA (Recessive) 1.87 (0.59 - 5.96) 0.291 0.582 - -
VEGF -634G>C
GG 66 (32.7) 16 (23.9) 1.00 (Reference) 69 (23.6) 14 (27.5) 1.00 (Reference) GC 103 (51.0) 42 (62.7) 1.46 (0.74 - 2.88) 0.270 0.481 167 (57.2) 29 (56.8) 0.86 (0.39 - 1.89) 0.712 0.978 CC 33 (16.3) 9 (13.4) 1.22 (0.46 - 3.22) 0.691 0.691 56 (19.2) 8 (15.7) 0.56 (0.19 - 1.69) 0.306 0.612
GG vs. GC/CC (Dominant) 1.41 (0.73 - 2.70) 0.303 0.404 0.79 (0.37 - 1.68) 0.544 0.967 GG/GC vs. CC (Recessive) 0.83 (0.37 - 1.89) 0.657 0.657 0.60 (0.25 - 1.48) 0.268 0.536
VEGF 936C>T
CC 149 (73.8) 40 (59.7) 1.00 (Reference) 195 (66.8) 36 (70.6) 1.00 (Reference) CT 51 (25.2) 25 (37.3) 1.66 (0.90 - 3.06) 0.106 0.424 85 (29.1) 15 (29.4) 1.01 (0.48 - 2.11) 0.978 0.978
TT 2 (1.0) 2 (3.0) 5.85 (0.75 - 45.55) 0.092 0.368 12 (4.1) 0 (0.0) - - CC vs. CT/TT (Dominant) 1.78 (0.97 - 3.23) 0.061 0.244 0.88 (0.43 - 1.82) 0.737 0.967 CC/CT vs. TT (Recessive) 4.36 (0.582 - 32.66) 0.152 0.582 - - The adjusted odds ratio on the basis of risk factors such as age, gender, hypertension, hyperlipidemia, diabetes mellitus, and smoking. † False discovery rate (FDR)-adjusted P value for multiple hypothesis testing using the Benjamin-Hochberg method. * Sample 1 was recruited from 2000 to 2003. ** Sample 2 was recruited from 2004 to 2008.

10
Supplemental Table 10. Comparison of genotype frequencies and AOR for VEGF -2578C>A, -1154G>A, -634G>C, and 936C>T polymorphisms between the ischemic stroke subtype with multiple small-artery occlusion and control subjects in samples 1 and 2
Sample 1* Sample 2** Genotype
Control (%) Case (%) AOR (95%CI) P P† Control (%) Case (%) AOR (95%CI) P P†
n=202 n=51 n=292 n=45
VEGF -2578C>A
CC 107 (53.0) 16 (31.4) 1.00 (Reference) 155 (53.1) 22 (48.9) 1.00 (Reference) CA 81 (40.1) 28 (54.9) 2.96 (1.38 - 6.36) 0.005 0.010 122 (41.8) 19 (42.2) 1.08 (0.52 - 2.23) 0.835 0.835 AA 14 (6.9) 7 (13.7) 8.32 (2.19 - 31.64) 0.002 0.006 15 (5.1) 4 (8.9) 2.38 (0.65 - 8.70) 0.191 0.359
CC vs. CA/AA (Dominant) 3.28 (1.57 - 6.82) 0.002 0.004 1.23 (0.62 - 2.46) 0.549 0.549 CC/CA vs. AA (Recessive) 3.70 (1.19 - 11.55) 0.024 0.036 2.02 (0.58 - 7.07) 0.270 0.540
VEGF -1154G>A GG 137 (67.8) 22 (43.1) 1.00 (Reference) 202 (69.2) 30 (66.7) 1.00 (Reference) GA 56 (27.7) 24 (47.1) 2.87 (1.38 - 5.97) 0.005 0.010 81 (27.7) 13 (28.9) 1.35 (0.63 - 2.87) 0.439 0.585 AA 9 (4.5) 5 (9.8) 5.71 (1.53 - 21.35) 0.010 0.015 9 (3.1) 2 (4.4) 2.15 (0.34 - 13.52) 0.416 0.416
GG vs. GA/AA (Dominant) 3.22 (1.59 - 6.51) 0.001 0.004 1.43 (0.69 - 2.93) 0.335 0.447 GG/GA vs. AA (Recessive) 3.48 (1.00 - 12.11) 0.051 0.051 2.14 (0.35 - 13.09) 0.411 0.548
VEGF -634G>C
GG 66 (32.7) 13 (25.5) 1.00 (Reference) 69 (23.6) 15 (33.3) 1.00 (Reference) GC 103 (51.0) 36 (70.6) 1.33 (0.61 - 2.91) 0.477 0.636 167 (57.2) 21 (46.7) 0.58 (0.26 - 1.29) 0.181 0.362
CC 33 (16.3) 2 (3.9) 0.11 (0.02 - 0.69) 0.019 0.019 56 (19.2) 9 (20.0) 0.58 (0.22 - 1.53) 0.269 0.359
GG vs. GC/CC (Dominant) 0.96 (0.45 - 2.06) 0.922 0.922 0.61 (0.30 - 1.26) 0.184 0.368 GG/GC vs. CC (Recessive) 0.13 (0.03 - 0.61) 0.010 0.030 1.00 (0.43 - 2.30) 0.990 0.990
VEGF 936C>T
CC 149 (73.8) 33 (64.7) 1.00 (Reference) 195 (66.8) 21 (46.7) 1.00 (Reference) CT 51 (25.2) 18 (35.3) 1.12 (0.54 - 2.32) 0.770 0.770 85 (29.1) 21 (46.7) 2.75 (1.31 - 5.74) 0.007 0.028
TT 2 (1.0) 0 (0.0) - - 12 (4.1) 3 (6.6) 4.41 (0.79 - 24.55) 0.090 0.359 CC vs. CT/TT (Dominant) 1.09 (0.53 - 2.26) 0.818 0.922 2.74 (1.36 - 5.52) 0.005 0.020 CC/CT vs. TT (Recessive) - - 2.36 (0.53 - 10.50) 0.262 0.540 The adjusted odds ratio on the basis of risk factors such as age, gender, hypertension, hyperlipidemia, diabetes mellitus, and smoking. † False discovery rate (FDR)-adjusted P value for multiple hypothesis testing using the Benjamin-Hochberg method. * Sample 1 was recruited from 2000 to 2003. ** Sample 2 was recruited from 2004 to 2008. Note: Frequencies of 4 polymorphisms of VEGF -2578C>A (sample 1), -1154G>A (sample 1), -634G>C (sample 1), and 936C>T (sample 2) were significantly different between the
control and ischemic stroke subtype with multiple small-artery occlusion groups, although the associations of the four polymorphisms in ischemic stroke subtype with multiple
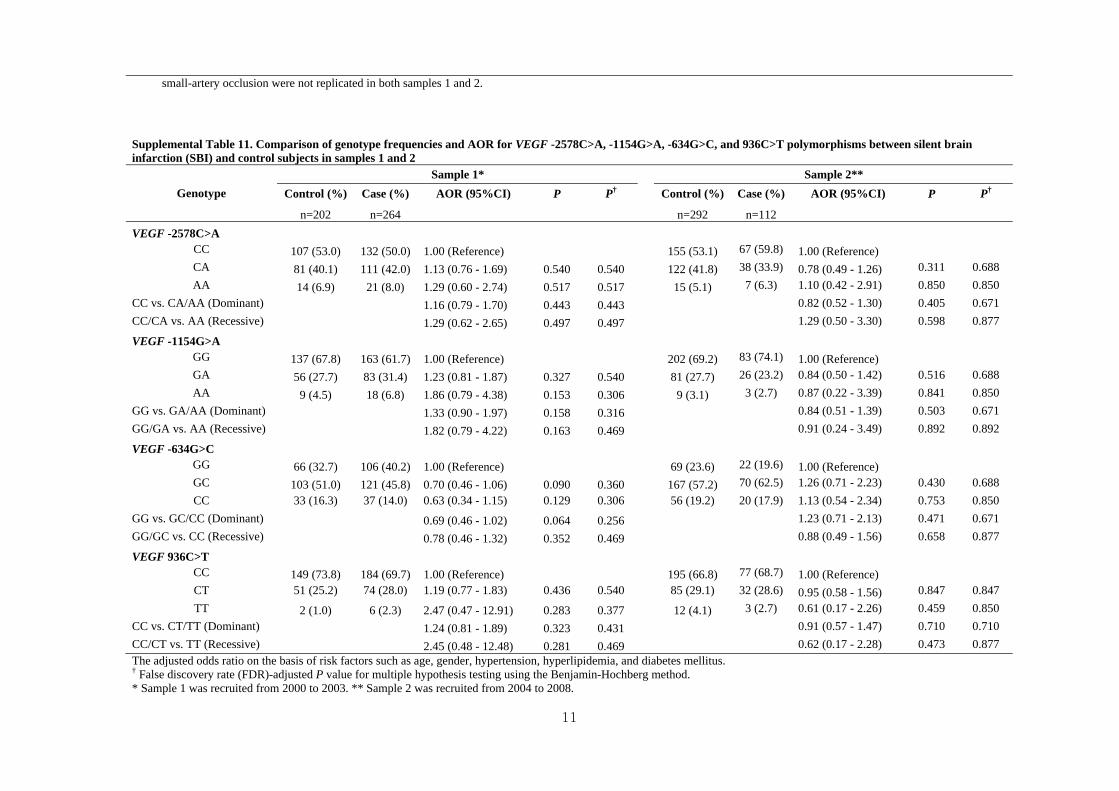
11
small-artery occlusion were not replicated in both samples 1 and 2.
Supplemental Table 11. Comparison of genotype frequencies and AOR for VEGF -2578C>A, -1154G>A, -634G>C, and 936C>T polymorphisms between silent brain infarction (SBI) and control subjects in samples 1 and 2
Sample 1* Sample 2**
Control (%) Case (%) AOR (95%CI) P P† Control (%) Case (%) AOR (95%CI) P P† Genotype
n=202 n=264 n=292 n=112
VEGF -2578C>A
CC 107 (53.0) 132 (50.0) 1.00 (Reference) 155 (53.1) 67 (59.8) 1.00 (Reference)
CA 81 (40.1) 111 (42.0) 1.13 (0.76 - 1.69) 0.540 0.540 122 (41.8) 38 (33.9) 0.78 (0.49 - 1.26) 0.311 0.688
AA 14 (6.9) 21 (8.0) 1.29 (0.60 - 2.74) 0.517 0.517 15 (5.1) 7 (6.3) 1.10 (0.42 - 2.91) 0.850 0.850
CC vs. CA/AA (Dominant) 1.16 (0.79 - 1.70) 0.443 0.443 0.82 (0.52 - 1.30) 0.405 0.671
CC/CA vs. AA (Recessive) 1.29 (0.62 - 2.65) 0.497 0.497 1.29 (0.50 - 3.30) 0.598 0.877
VEGF -1154G>A
GG 137 (67.8) 163 (61.7) 1.00 (Reference) 202 (69.2) 83 (74.1) 1.00 (Reference)
GA 56 (27.7) 83 (31.4) 1.23 (0.81 - 1.87) 0.327 0.540 81 (27.7) 26 (23.2) 0.84 (0.50 - 1.42) 0.516 0.688
AA 9 (4.5) 18 (6.8) 1.86 (0.79 - 4.38) 0.153 0.306 9 (3.1) 3 (2.7) 0.87 (0.22 - 3.39) 0.841 0.850
GG vs. GA/AA (Dominant) 1.33 (0.90 - 1.97) 0.158 0.316 0.84 (0.51 - 1.39) 0.503 0.671
GG/GA vs. AA (Recessive) 1.82 (0.79 - 4.22) 0.163 0.469 0.91 (0.24 - 3.49) 0.892 0.892
VEGF -634G>C
GG 66 (32.7) 106 (40.2) 1.00 (Reference) 69 (23.6) 22 (19.6) 1.00 (Reference)
GC 103 (51.0) 121 (45.8) 0.70 (0.46 - 1.06) 0.090 0.360 167 (57.2) 70 (62.5) 1.26 (0.71 - 2.23) 0.430 0.688
CC 33 (16.3) 37 (14.0) 0.63 (0.34 - 1.15) 0.129 0.306 56 (19.2) 20 (17.9) 1.13 (0.54 - 2.34) 0.753 0.850
GG vs. GC/CC (Dominant) 0.69 (0.46 - 1.02) 0.064 0.256 1.23 (0.71 - 2.13) 0.471 0.671
GG/GC vs. CC (Recessive) 0.78 (0.46 - 1.32) 0.352 0.469 0.88 (0.49 - 1.56) 0.658 0.877
VEGF 936C>T
CC 149 (73.8) 184 (69.7) 1.00 (Reference) 195 (66.8) 77 (68.7) 1.00 (Reference)
CT 51 (25.2) 74 (28.0) 1.19 (0.77 - 1.83) 0.436 0.540 85 (29.1) 32 (28.6) 0.95 (0.58 - 1.56) 0.847 0.847
TT 2 (1.0) 6 (2.3) 2.47 (0.47 - 12.91) 0.283 0.377 12 (4.1) 3 (2.7) 0.61 (0.17 - 2.26) 0.459 0.850
CC vs. CT/TT (Dominant) 1.24 (0.81 - 1.89) 0.323 0.431 0.91 (0.57 - 1.47) 0.710 0.710
CC/CT vs. TT (Recessive) 2.45 (0.48 - 12.48) 0.281 0.469 0.62 (0.17 - 2.28) 0.473 0.877 The adjusted odds ratio on the basis of risk factors such as age, gender, hypertension, hyperlipidemia, and diabetes mellitus. † False discovery rate (FDR)-adjusted P value for multiple hypothesis testing using the Benjamin-Hochberg method. * Sample 1 was recruited from 2000 to 2003. ** Sample 2 was recruited from 2004 to 2008.