Embed Size (px)
Citation preview

Clinical Evaluation and Nonlipid Clinical Evaluation and Nonlipid
Treatment of Coronary Artery Treatment of Coronary Artery
Disease in the Diabetic PatientDisease in the Diabetic Patient
Richard Nesto, MDRichard Nesto, MD
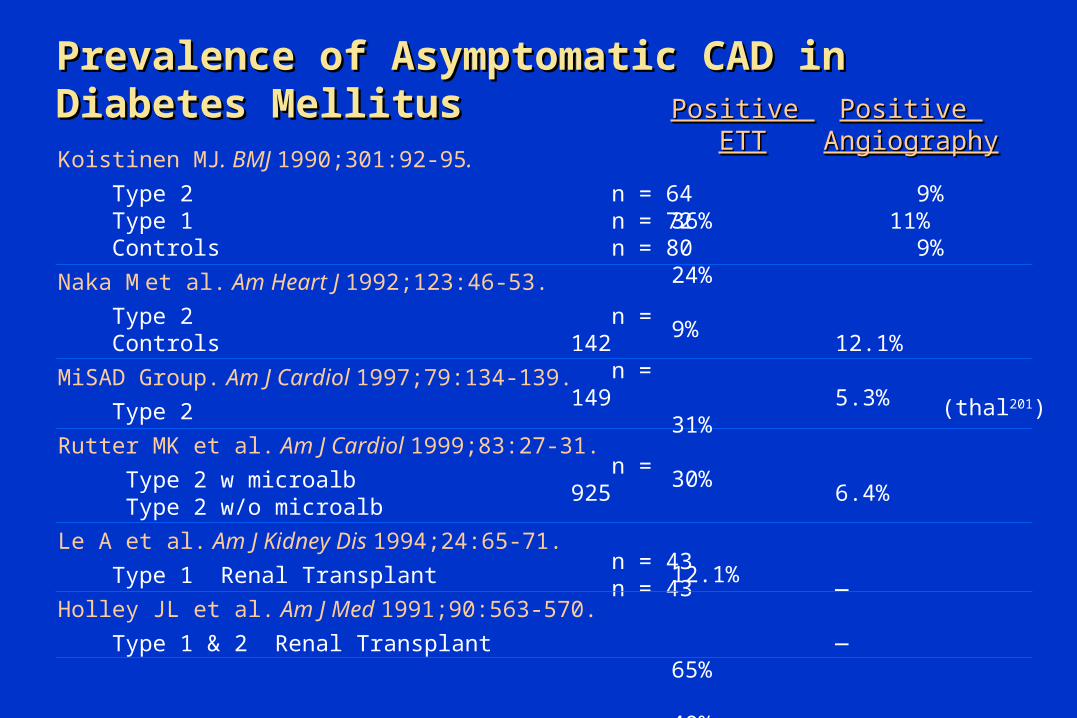
Prevalence of Asymptomatic CAD in Prevalence of Asymptomatic CAD in Diabetes MellitusDiabetes MellitusKoistinen MJ. BMJ 1990;301:92-95.
Type 2 Type 1 Controls
Naka M et al. Am Heart J 1992;123:46-53.
Type 2 Controls
MiSAD Group. Am J Cardiol 1997;79:134-139.
Type 2
Rutter MK et al. Am J Cardiol 1999;83:27-31.
Type 2 w microalb Type 2 w/o microalb
Le A et al. Am J Kidney Dis 1994;24:65-71.
Type 1 Renal Transplant
Holley JL et al. Am J Med 1991;90:563-570.
Type 1 & 2 Renal Transplant
n = 64 n = 72 n = 80
n = 142 n = 149
n = 925
n = 43 n = 43
Positive Positive ETTETT
Positive Positive AngiographyAngiography
(thal201)
36% 24% 9%
31% 30%
12.1%
65% 40%
58%
55%
9% 11% 9%
12.1% 5.3%
6.4%
— —
35%
43%

Indications for Cardiac Testing in Indications for Cardiac Testing in Diabetic PatientsDiabetic Patients Typical or atypical cardiac symptoms
Resting ECG suggestive of ischemia or infarction
Peripheral or carotid occlusive arterial disease
Sedentary lifestyle or plan to begin a vigorous exercise program
Two or more of the risk factors listed below
- Total cholesterol >240 mg/dL, LDL cholesterol >160 mg/dL, or HDL cholesterol <35 mg/dL
- Blood pressure >140/90 mmHg
- Smoking
- Family history of premature CAD
- Positive micro/macroalbuminuria

Factors Limiting Accuracy of Noninvasive Factors Limiting Accuracy of Noninvasive "Stress" Tests for CAD"Stress" Tests for CAD
Hypertensive Cardiomyopathy
Diabetic Cardiomyopathy
Autonomic Cardiomyopathy
Renal Insufficiency
Microvascular Dysfunction
Benefits of Early Detection of CADBenefits of Early Detection of CAD
Implement more aggressive CHD prevention regimen
Initiate anti-ischemic medications
Identify patients who would benefit from revascularization
Educate patients to recognize coronary symptoms
0
20
40
60
80
100
120
140
160
180
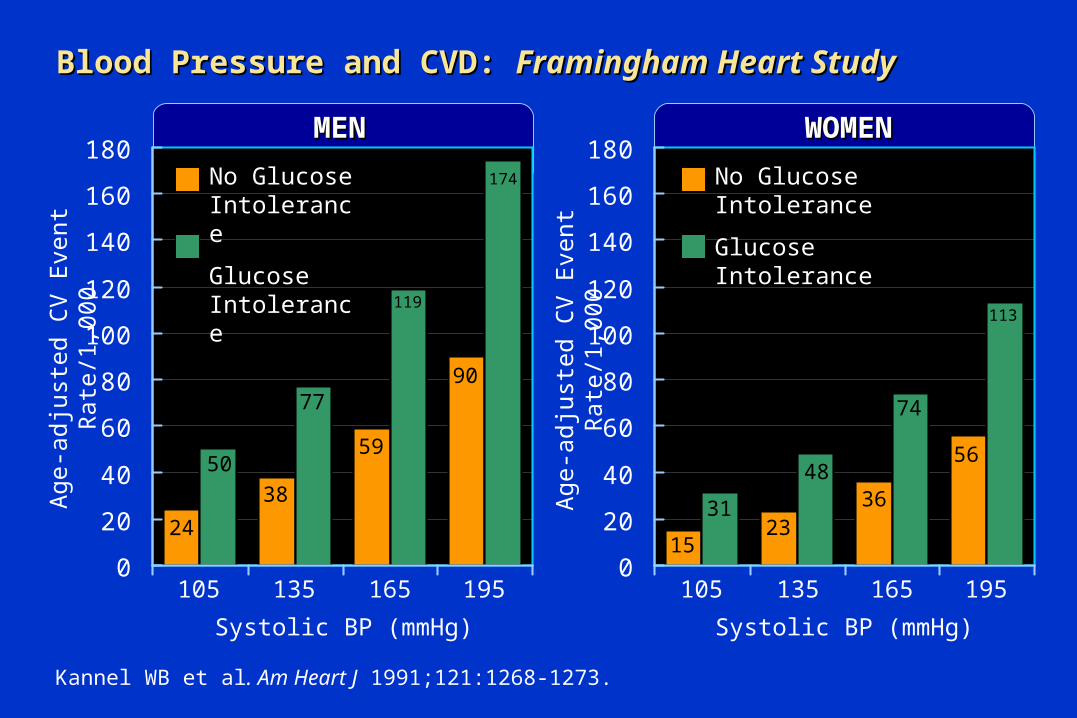
Kannel WB et al. Am Heart J 1991;121:1268-1273.
Blood Pressure and CVD: Blood Pressure and CVD: Framingham Heart StudyFramingham Heart StudyA
ge-a
dju
sted C
V E
vent
Rate
/1,0
00
Systolic BP (mmHg)
105 135 165 1950
20
40
60
80
100
120
140
160
180
Systolic BP (mmHg)
105 135 165 195A
ge-a
dju
sted C
V E
vent
Rate
/1,0
00
24
5038
77
59
119
90
174
15
3123
4836
74
56
113
No Glucose Intolerance
Glucose Intolerance
No Glucose Intolerance
Glucose Intolerance
MENMEN WOMENWOMEN
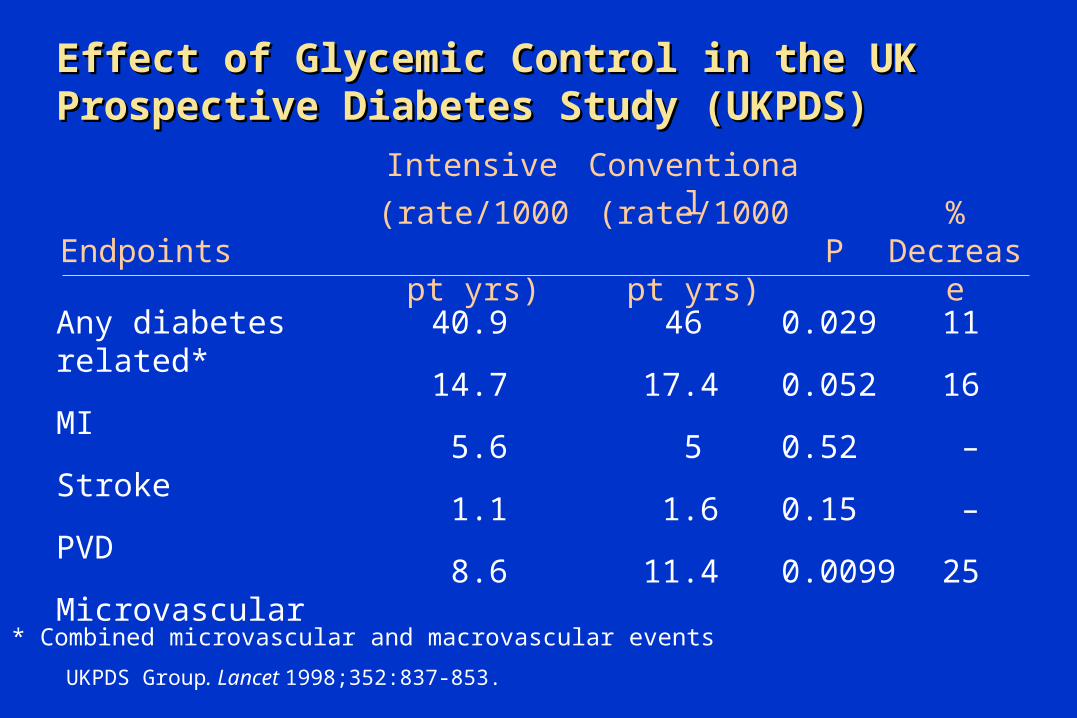
UKPDS Group. Lancet 1998;352:837-853.
Effect of Glycemic Control in the UK Effect of Glycemic Control in the UK Prospective Diabetes Study (UKPDS)Prospective Diabetes Study (UKPDS)
Any diabetes related*
MI
Stroke
PVD
Microvascular
40.9
14.7
5.6
1.1
8.6
46
17.4
5
1.6
11.4
0.029
0.052
0.52
0.15
0.0099
11
16
–
–
25
(rate/1000 pt yrs)
* Combined microvascular and macrovascular events
Intensive
%Decreas
e
(rate/1000 pt yrs) P
Conventional
Endpoints

Reasons for Death in UKPDS Intensive Reasons for Death in UKPDS Intensive Treatment Arm: Treatment Arm: 10-Year Follow-up10-Year Follow-up
UKPDS Group. Lancet 1998;352:837-853.
Fatal MI or SD
Cancer
Other
Fatal Stroke
Renal Disease
Accidents
PVD
Hypo- or Hyperglycemia
231
120
74
43
16
5
2
1
(8.4%)
(4.4%)
(2.9%)
(1.6%)
(0.6%)
(0.2%)
(0.07%)
(0.04%)
(%)N =
2729
47%47%
8.7%8.7%
24%24%
15%15%
3.3%3.3% 2.5%2.5%
MI or SDMI or SD
CancerCancer
StrokeStroke
OtherOther
RenalRenal
Accidents, PVD, Hypo-Accidents, PVD, Hypo-& Hyperglycemia& Hyperglycemia

UKPDS Group. BMJ 1998;317:703-713.
Effect of Blood Pressure Control in the UKPDSEffect of Blood Pressure Control in the UKPDSTight vs. Less Tight ControlTight vs. Less Tight Control
Any diabetes-related endpoint
Diabetes-related deaths
Heart failure
Stroke
Myocardial infarction
Microvascular disease
Tight Control
1,148 Type 2 patients
Average BP lowered to 144/82 mmHg (controls: 154/87);9-year follow-up
24
32
56
44
21
37
Risk Reduction (%) P value
0.0046
0.019
0.0043
0.013
NS
0.0092
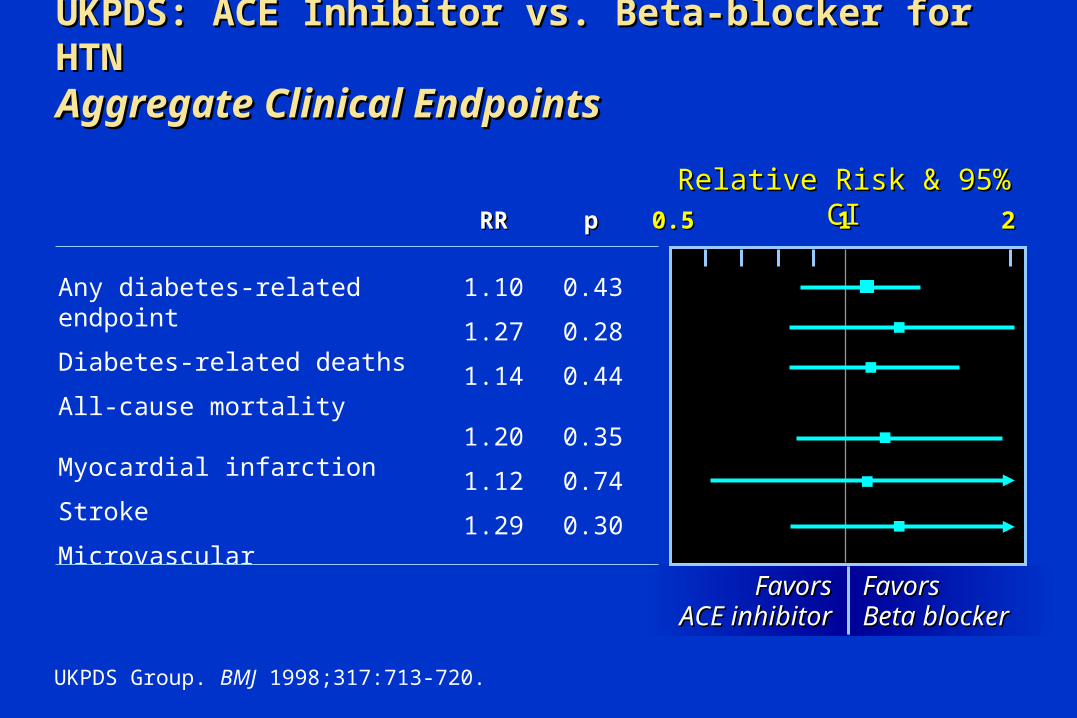
UKPDS: ACE Inhibitor vs. Beta-blocker for HTNUKPDS: ACE Inhibitor vs. Beta-blocker for HTNAggregate Clinical EndpointsAggregate Clinical Endpoints
0.50.5 11 22
Relative Risk & 95% CIRelative Risk & 95% CI
Any diabetes-related endpoint
Diabetes-related deaths
All-cause mortality
Myocardial infarction
Stroke
Microvascular
1.10
1.27
1.14
1.20
1.12
1.29
0.43
0.28
0.44
0.35
0.74
0.30
ppRRRR
UKPDS Group. BMJ 1998;317:713-720.
FavorsFavorsACE inhibitorACE inhibitor
FavorsFavorsBeta blockerBeta blocker
0
10
20
30
40
50
60
70
Placebo
Events
/ 1
000 P
t-Years
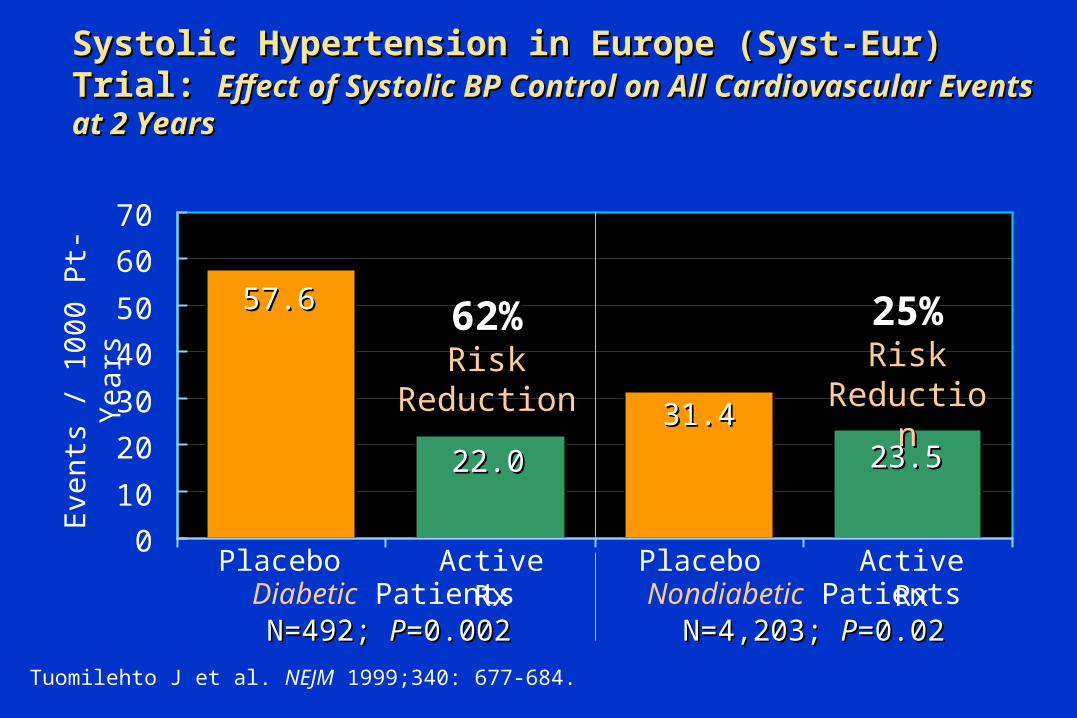
Systolic Hypertension in Europe (Syst-Eur) Trial: Systolic Hypertension in Europe (Syst-Eur) Trial: Effect of Systolic BP Control on All Cardiovascular Events Effect of Systolic BP Control on All Cardiovascular Events at 2 Yearsat 2 Years
Tuomilehto J et al. NEJM 1999;340: 677-684.
N=492; N=492; PP=0.002=0.002
Active Rx
57.657.6
22.022.0
62%62%RiskRisk
ReductionReduction
N=4,203; N=4,203; PP=0.02=0.02
31.431.423.523.5
Placebo Active Rx
25%25%RiskRisk
ReductionReduction
Diabetic Patients Nondiabetic Patients
0
5
10
15
20
25
30
Major CV Events MI
Events
/ 1
000 P
t-Years
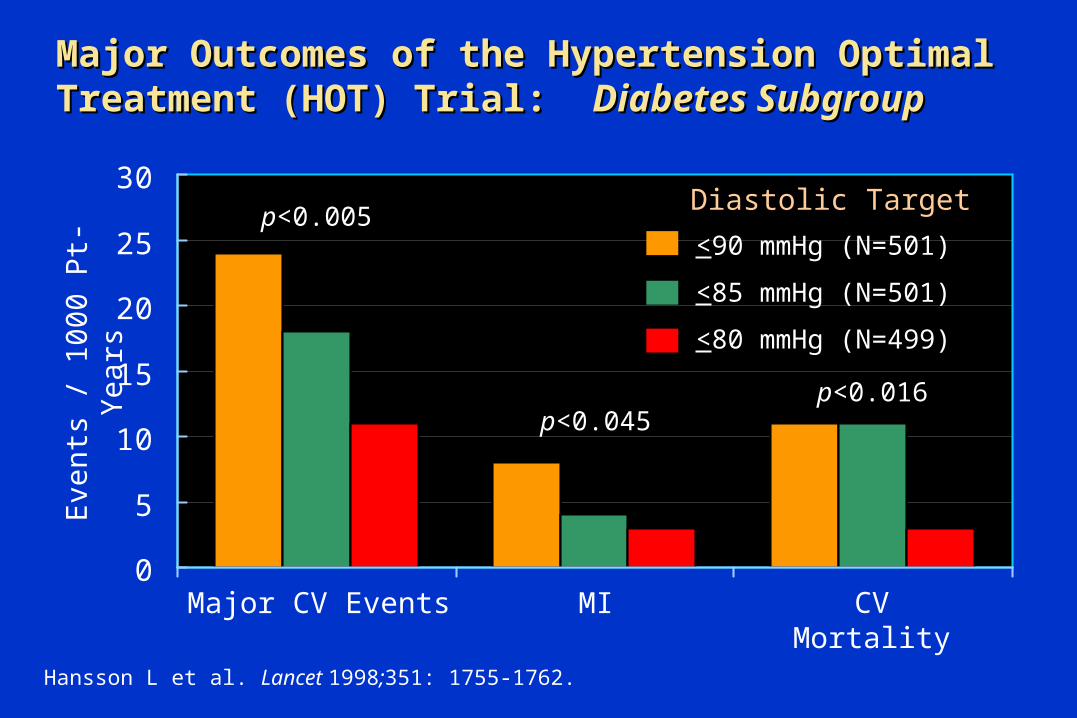
Major Outcomes of the Hypertension Optimal Major Outcomes of the Hypertension Optimal Treatment (HOT) Trial: Treatment (HOT) Trial: Diabetes SubgroupDiabetes Subgroup
Hansson L et al. Lancet 1998;351: 1755-1762.
CV Mortality
<90 mmHg (N=501)
<85 mmHg (N=501)
<80 mmHg (N=499)
Diastolic Target
p<0.045p<0.016
p<0.005

0
5
10
15
20
25
30
<90
Events
/ 1
000 P
t-Years
HOT Trial:Cardiovascular Events in Diabetics and HOT Trial:Cardiovascular Events in Diabetics and Nondiabetics—Nondiabetics—Effect of Diastolic Target at 4 YearsEffect of Diastolic Target at 4 Years
Hansson L et al. Lancet 1998;351: 1755-1762.
DiabeticDiabetic Patients Patientsn=1,501; p=0.016n=1,501; p=0.016
<85 <80 <90 <85 <80
NondiabeticNondiabetic Patients Patientsn=18,790; p=NSn=18,790; p=NS
24.424.4
18.618.6
11.911.99.99.9 10.010.0 9.39.3
48%48%RiskRisk
ReductionReduction
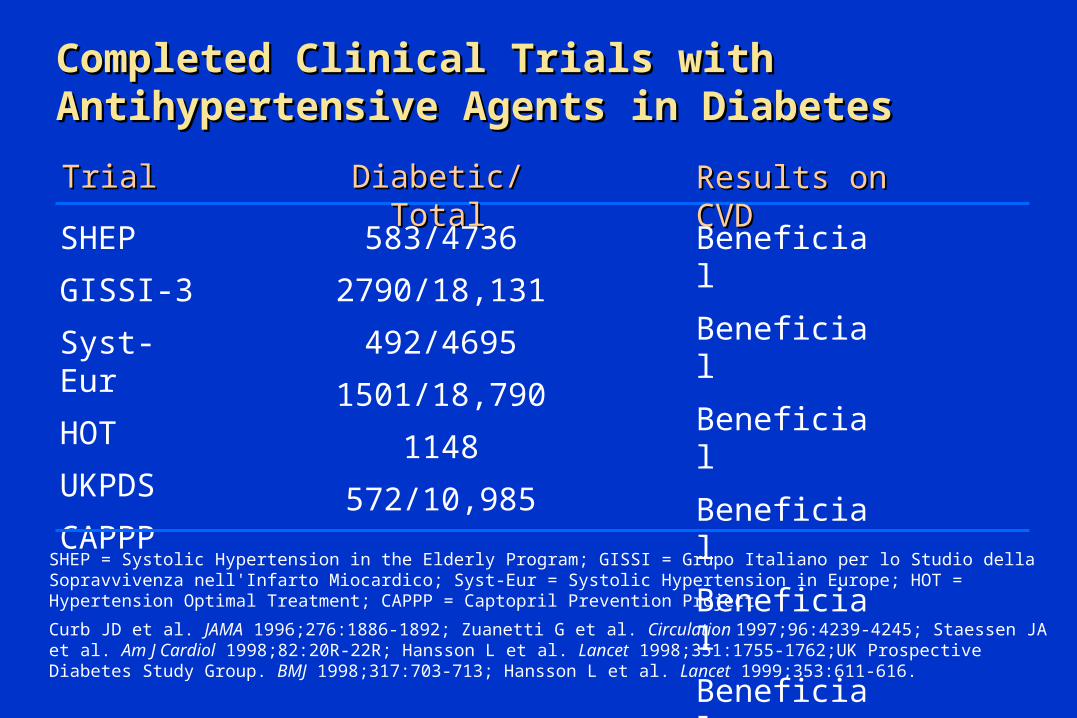
Completed Clinical Trials with Completed Clinical Trials with Antihypertensive Agents in DiabetesAntihypertensive Agents in Diabetes
SHEP = Systolic Hypertension in the Elderly Program; GISSI = Grupo Italiano per lo Studio della Sopravvivenza nell'Infarto Miocardico; Syst-Eur = Systolic Hypertension in Europe; HOT = Hypertension Optimal Treatment; CAPPP = Captopril Prevention Project
Curb JD et al. JAMA 1996;276:1886-1892; Zuanetti G et al. Circulation 1997;96:4239-4245; Staessen JA et al. Am J Cardiol 1998;82:20R-22R; Hansson L et al. Lancet 1998;351:1755-1762;UK Prospective Diabetes Study Group. BMJ 1998;317:703-713; Hansson L et al. Lancet 1999;353:611-616.
SHEP
GISSI-3
Syst-Eur
HOT
UKPDS
CAPPP
Results on CVDResults on CVDDiabetic/TotalDiabetic/TotalTrialTrial
583/4736
2790/18,131
492/4695
1501/18,790
1148
572/10,985
Beneficial
Beneficial
Beneficial
Beneficial
Beneficial
Beneficial

Heart Outcomes Prevention Evaluation (HOPE) StudyHeart Outcomes Prevention Evaluation (HOPE) StudyEffect of Ramipril on Cardiovascular Events (Myocardial Effect of Ramipril on Cardiovascular Events (Myocardial Infarction, Stroke, or CVD Death) ~ 4.5 Yrs Infarction, Stroke, or CVD Death) ~ 4.5 Yrs
Hope Study Investigators. NEJM 2000;342:145-153.
0
5
10
15
20
25
Placebo
% o
f Pati
ents
Ramipril
19.819.8
15.015.0
24%24%RiskRisk
ReductionReduction16.416.4
13.013.0
Placebo Ramipril
21%21%RiskRisk
ReductionReduction
Diabetic Patients Nondiabetic PatientsN=3,578, N=3,578, PP=<0.001=<0.001 N=5,719, N=5,719, PP=<0.001=<0.001

Diabetes Increases Risk of Coronary PlaqueDiabetes Increases Risk of Coronary PlaqueDisruption and ThrombosisDisruption and Thrombosis Cause of Myocardial InfarctionCause of Myocardial Infarction
PlaquePlaqueFormationFormation
F VIIF VII
F VIIIF VIII
Coronary ArteryCoronary Artery
Sympathetic ToneSympathetic Tone
PAI-1PAI-1
TPATPA
PGIPGI22
Platelet AggregationPlatelet Aggregation
FibrinogenFibrinogen
vWFvWF
ThrombusThrombus
PlaquePlaqueDisruptionDisruption
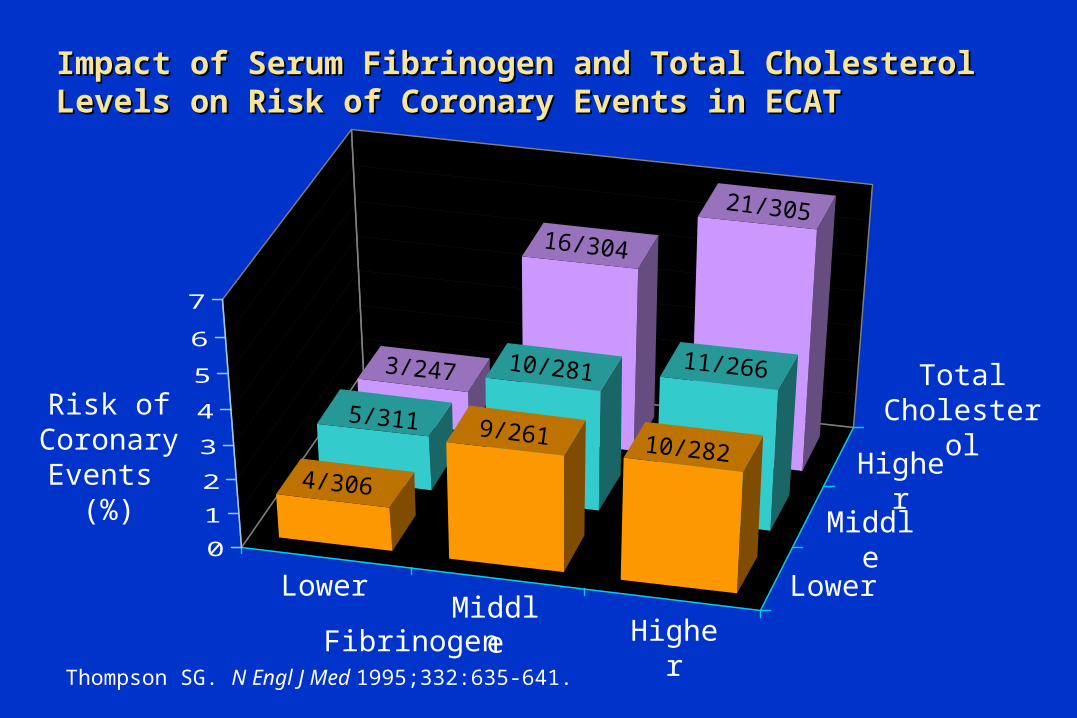
Impact of Serum Fibrinogen and Total Cholesterol Impact of Serum Fibrinogen and Total Cholesterol Levels on Risk of Coronary Events in ECATLevels on Risk of Coronary Events in ECAT
Thompson SG. N Engl J Med 1995;332:635-641.
0
1
2
3
4
5
6
7
Fibrinogen
LowerMiddle
Higher
Higher
Middle
Lower
Total CholesterolRisk of
Coronary Events
(%)4/306
9/261 10/282
5/311
3/247 10/281 11/266
16/304
21/305
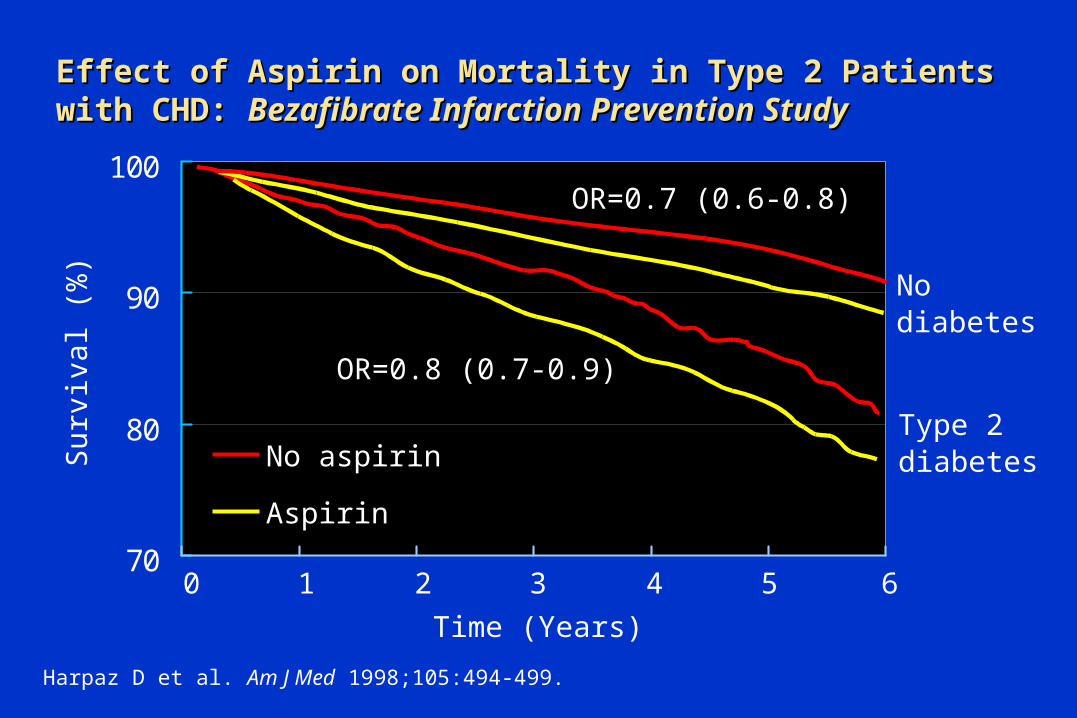
Effect of Aspirin on Mortality in Type 2 Patients with Effect of Aspirin on Mortality in Type 2 Patients with CHD: CHD: Bezafibrate Infarction Prevention StudyBezafibrate Infarction Prevention Study
Harpaz D et al. Am J Med 1998;105:494-499.
70
80
90
100
Surv
ival (%
) Nodiabetes
Type 2diabetes
Time (Years)
0 1 2 3 4 5 6
No aspirin
Aspirin
OR=0.8 (0.7-0.9)
OR=0.7 (0.6-0.8)
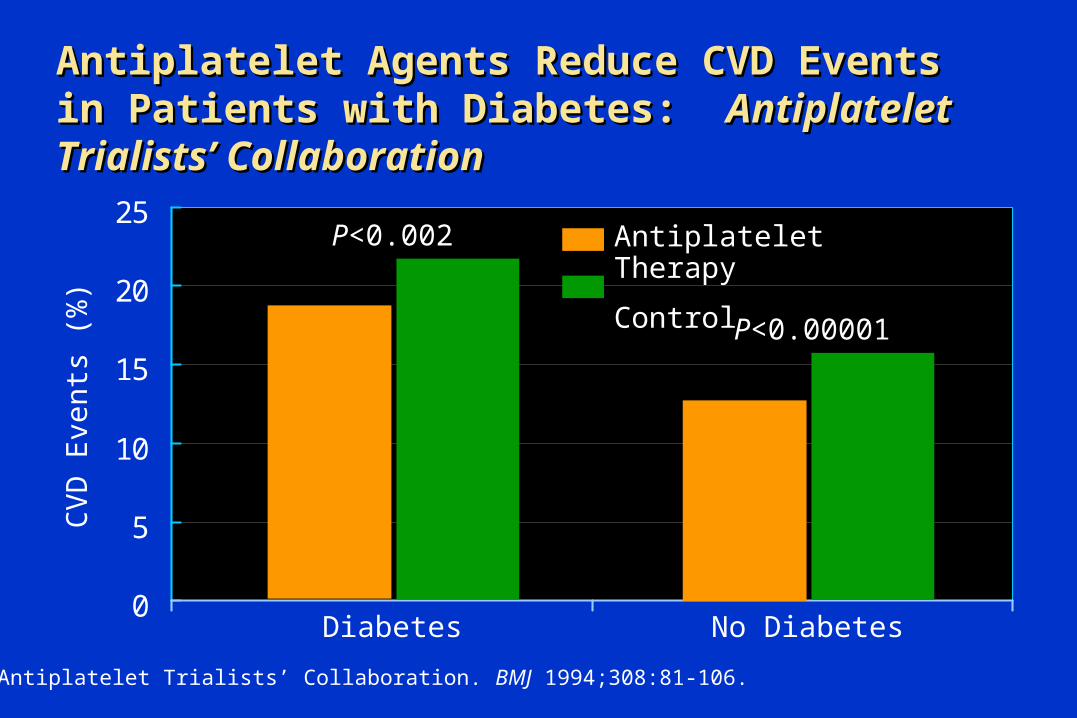
Antiplatelet Agents Reduce CVD Events in Antiplatelet Agents Reduce CVD Events in Patients with Diabetes: Patients with Diabetes: Antiplatelet Antiplatelet Trialists’ CollaborationTrialists’ Collaboration
Antiplatelet Trialists’ Collaboration. BMJ 1994;308:81-106.
0
5
10
15
20
25
CV
D E
vents
(%
)
Diabetes
Antiplatelet Therapy
Control
No Diabetes
P<0.002
P<0.00001
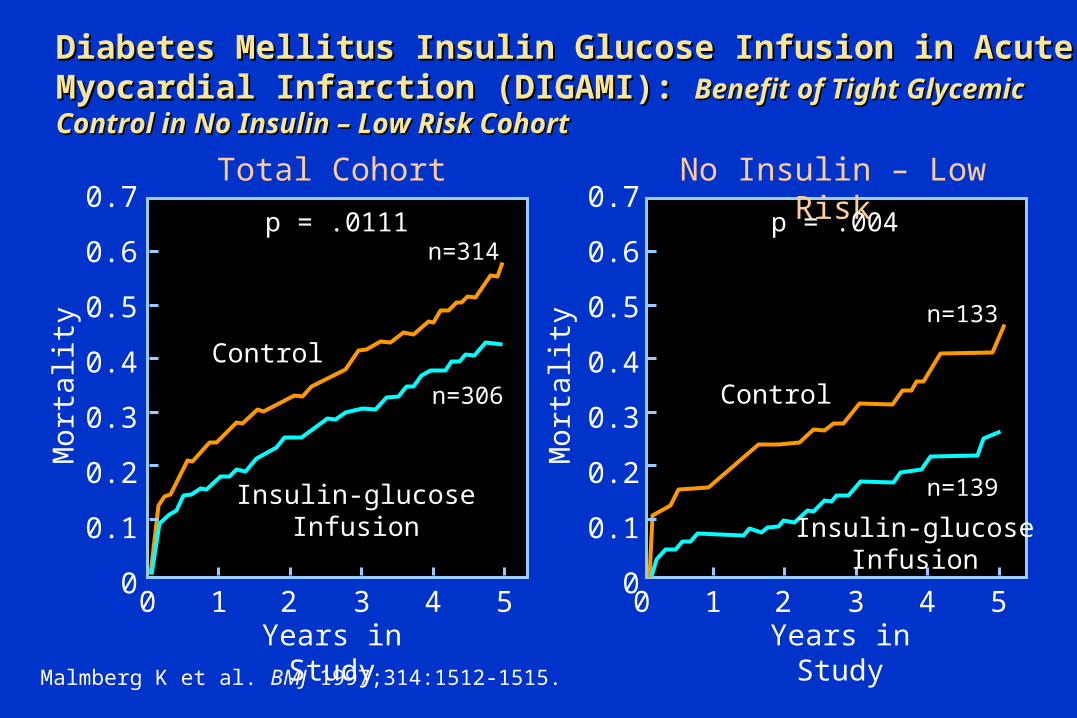
Diabetes Mellitus Insulin Glucose Infusion in Acute Diabetes Mellitus Insulin Glucose Infusion in Acute Myocardial Infarction (DIGAMI): Myocardial Infarction (DIGAMI): Benefit of Tight Glycemic Benefit of Tight Glycemic Control in No Insulin – Low Risk CohortControl in No Insulin – Low Risk Cohort
Malmberg K et al. BMJ 1997;314:1512-1515.
0.7
0.6
0.5
0.4
0.3
0.2
0.1
0
0.7
0.6
0.5
0.4
0.3
0.2
0.1
0
Mort
alit
y
Mort
alit
y
Total Cohort No Insulin – Low Risk
Years in Study Years in Study
Control
Insulin-glucoseInfusion
0 1 2 3 4 5 0 1 2 3 4 5
Insulin-glucoseInfusion
Control
p = .0111 p = .004
n=133
n=139
n=314
n=306

0.0
0.1
0.2
0.3
0.4
0.5
Effect of Trandolapril on Post-MI CHF Progression: Effect of Trandolapril on Post-MI CHF Progression: Trandolapril Cardiac Evaluation (TRACE)Trandolapril Cardiac Evaluation (TRACE)
Years
Gustafsson I et al. J Am Coll Cardiol 1999;34:83-89.
Diabetics (n=237)Diabetics (n=237)
0 1 2 3 4
Even
t R
ate
0.0
0.1
0.2
0.3
0.4
0.5
Years
Nondiabetics (n=1512)Nondiabetics (n=1512)
0 1 2 3 4
Even
t R
ate
Relative risk, 0.38P<0.001
Relative risk, 0.81P = 0.1
Placebo
Trandolapril
Placebo
Trandolapril

Cardiovascular death
Sudden death
Reinfarction
Progression in CHF
DiabeticsDiabetics
RR (95% CI) PRR (95% CI) PEnd PointEnd Point
Effect of Trandolapril on Secondary Effect of Trandolapril on Secondary Endpoints in TRACEEndpoints in TRACE
0.56 (0.37-0.85)
0.46 (0.25-0.85)
0.55 (0.29-1.07)
0.38 (0.21-0.67)
0.79 (0.66-0.96)
0.84 (0.63-1.12)
0.93 (0.69-1.26)
0.81 (0.63-1.04)
0.17
0.09
0.15
0.03
NondiabeticsNondiabetics
RR (95% CI) PRR (95% CI) P
InteractionInteraction
PP
CI = confidence interval; RR = relative risk.
Gustafsson I et al. J Am Coll Cardiol 1999;34:83-89.
0.01
0.01
0.08
<0.001
0.02
0.23
0.65
0.10
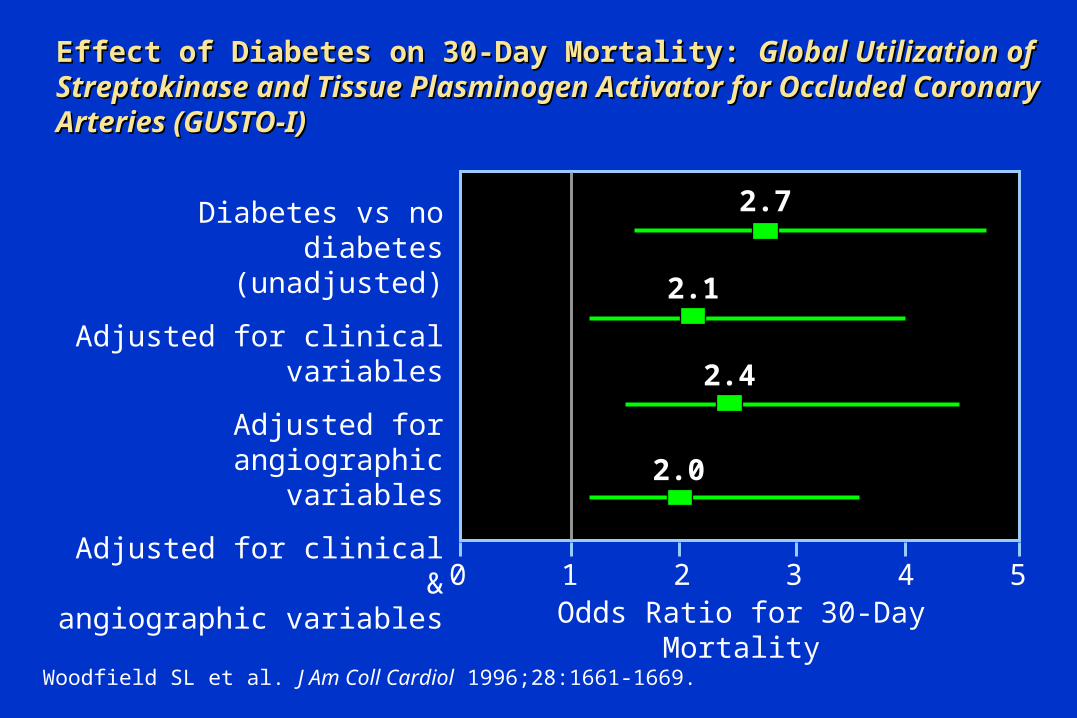
Woodfield SL et al. J Am Coll Cardiol 1996;28:1661-1669.
Effect of Diabetes on 30-Day Mortality: Effect of Diabetes on 30-Day Mortality: Global Utilization of Global Utilization of Streptokinase and Tissue Plasminogen Activator for Occluded Streptokinase and Tissue Plasminogen Activator for Occluded Coronary Arteries (GUSTO-I)Coronary Arteries (GUSTO-I)
2.7
2.1
2.4
2.0
0 1 2 3 4 5Odds Ratio for 30-Day Mortality
Diabetes vs no diabetes(unadjusted)
Adjusted for clinical variables
Adjusted for angiographicvariables
Adjusted for clinical &angiographic variables

Overall 5-Year Mortality in the Bypass Angioplasty Overall 5-Year Mortality in the Bypass Angioplasty Revascularization Investigation (BARI-1)Revascularization Investigation (BARI-1)
Detre KM et al. N Engl J Med 2000;342:989-997.
0.0
0.2
0.4
0.6
0.8
1.0
0
Mort
alit
y
DM-PTCA
DM-CABG
Non DM-CABG
Non DM-PTCA
Follow-up (years)
0.250.180.080.07
1 2 3 4 5

0.0
0.2
0.4
0.6
0.8
1.0
0.0
0.2
0.4
0.6
0.8
1.0
Impact of PTCA vs. CABG on Mortality Impact of PTCA vs. CABG on Mortality in BARI-1in BARI-1
Mort
alit
y
Follow-up (years) Years after Q-MI
DM-PTCA
DM-CABG
Non DM-CABG
Non DM-PTCA
Mort
alit
y
Mortality in PatientsMortality in Patientswithout Q-MIwithout Q-MI
Mortality in PatientsMortality in PatientsAfter Q-MIAfter Q-MI
0 1 2 3 4 5 0 1 2 3 4 5
0.220.220.160.160.070.070.060.06
0.790.79
0.290.290.270.27
0.170.17
Detre KM et al. N Engl J Med 2000;342:989-997.
0
20
40
60
80
100
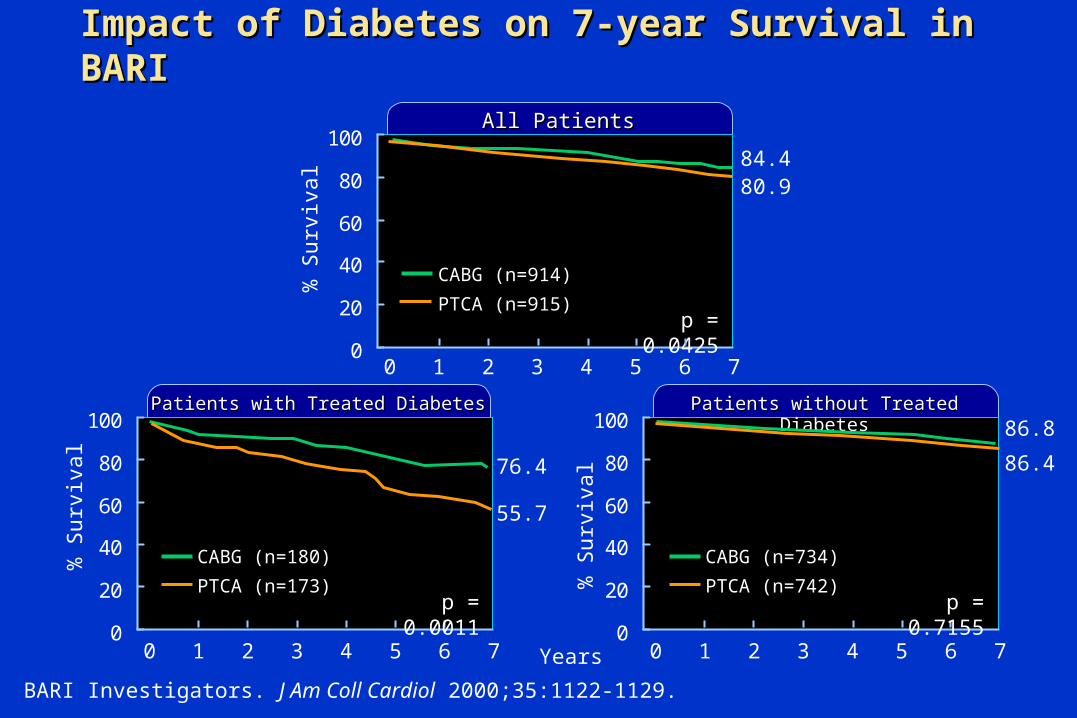
Impact of Diabetes on 7-year Survival in BARIImpact of Diabetes on 7-year Survival in BARI
BARI Investigators. J Am Coll Cardiol 2000;35:1122-1129.
% S
urv
ival
0 1 3 4 5 72 6Years
Patients without Treated DiabetesPatients without Treated Diabetes
0
20
40
60
80
100
% S
urv
ival
0 1 3 4 5 72 6
All PatientsAll Patients
0
20
40
60
80
100
% S
urv
ival
0 1 3 4 5 72 6
Patients with Treated DiabetesPatients with Treated Diabetes
p = 0.0425
p = 0.7155p = 0.0011
CABG (n=914)
PTCA (n=915)
CABG (n=180)
PTCA (n=173)
CABG (n=734)
PTCA (n=742)
84.480.9
76.4
55.7
86.8
86.4

0
20
40
60
80
100
Eight-Year Mortality in Emory Angioplasty vs Surgery Eight-Year Mortality in Emory Angioplasty vs Surgery Trial (EAST)Trial (EAST)
King SB III et al. J Am Coll Cardiol 2000;35:1116-1121.
% S
urv
ival
Years after Randomization
Patients without DiabetesPatients without Diabetes
0
20
40
60
80
100
% S
urv
ival
All EAST PatientsAll EAST Patients
0
20
40
60
80
100
% S
urv
ival
Treated Diabetic PatientsTreated Diabetic Patients
p = 0.40
p = 0.71p = 0.23
CABG (n=194)
PTCA (n=198)
CABG (n=30)
PTCA (n=29)
CABG (n=164)
PTCA (n=169)
0 1 3 4 5 82 76
0 1 3 4 5 82 76 0 1 3 4 5 82 76
82.779.3
0
25
50
75
100
0
25
50
75
100
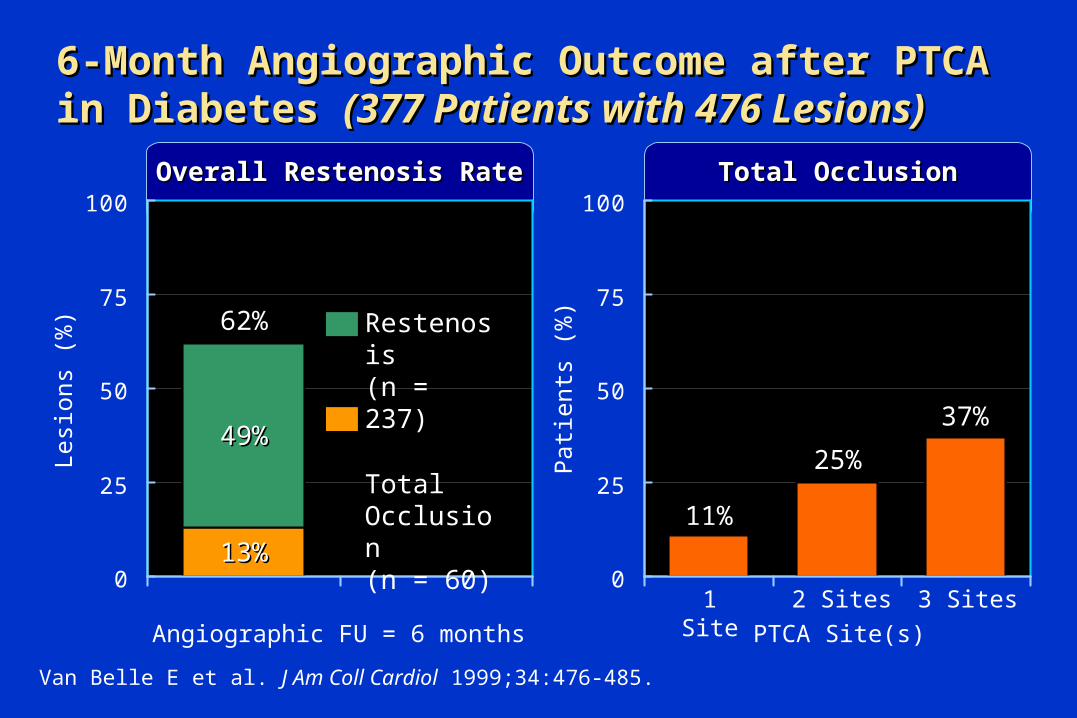
6-Month Angiographic Outcome after PTCA 6-Month Angiographic Outcome after PTCA in Diabetes in Diabetes (377 Patients with 476 Lesions)(377 Patients with 476 Lesions)
Van Belle E et al. J Am Coll Cardiol 1999;34:476-485.
Lesi
ons
(%)
Angiographic FU = 6 months
62%
PTCA Site(s)1 Site 2 Sites 3 Sites
Overall Restenosis RateOverall Restenosis Rate Total OcclusionTotal Occlusion
49%49%
13%13%
Restenosis(n = 237)
Total Occlusion(n = 60)
Pati
ents
(%
)
11%
25%
37%

Impact of Restenosis and Total Occlusion Impact of Restenosis and Total Occlusion on LV Function in Diabeteson LV Function in Diabetes
Van Belle E et al. J Am Coll Cardiol 1999;34:476-485.
-20
-15
-10
-5
0
5
10
15
in
EF
(%)
p = ns p = ns p = 0.0001
(n = 297) (n = 237) (n = 60)
Restenosis (–)Total Occlusion (–)
Restenosis (+)Total Occlusion (–)
Total Occlusion (+)
-1.5+9.5 +0.5+9.9
-6.2+9.9
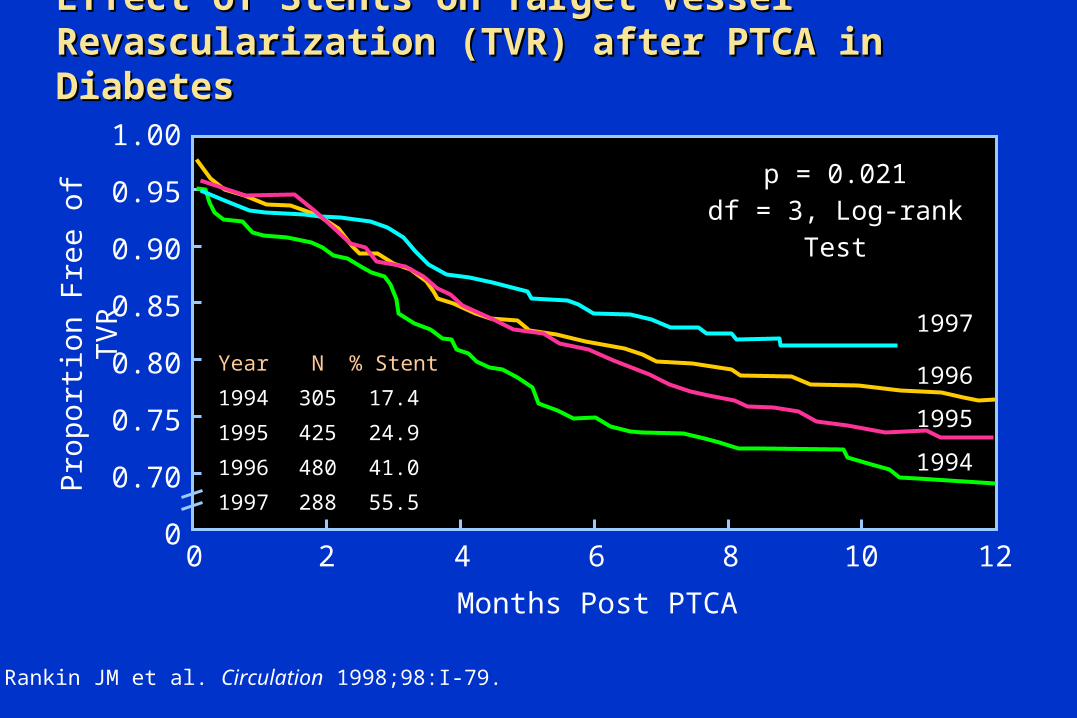
Effect of Stents on Target Vessel Effect of Stents on Target Vessel Revascularization (TVR) after PTCA in DiabetesRevascularization (TVR) after PTCA in Diabetes
1.00
0.95
0.90
0.85
0.80
0.75
0.70
0
Pro
port
ion F
ree o
f TV
R p = 0.021df = 3, Log-rank Test
Rankin JM et al. Circulation 1998;98:I-79.
Months Post PTCA
0 2 4 6 8 10 12
Year
1994
1995
1996
1997
1997
1996
1995
1994
N
305
425
480
288
% Stent
17.4
24.9
41.0
55.5
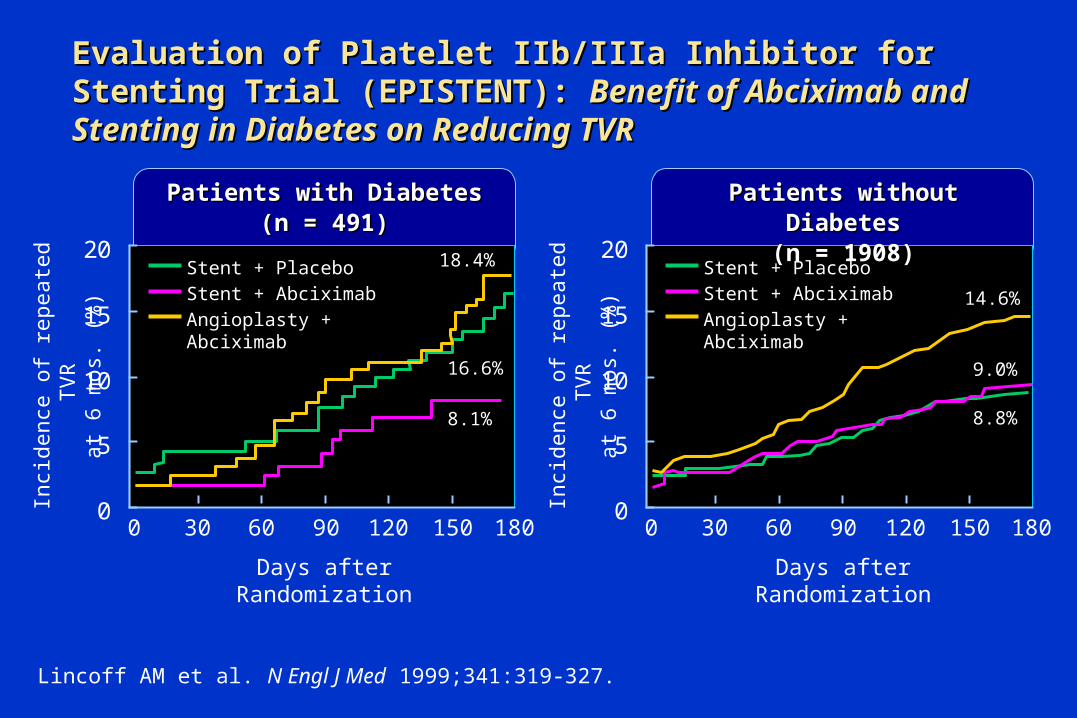
Evaluation of Platelet IIb/IIIa Inhibitor for Stenting Evaluation of Platelet IIb/IIIa Inhibitor for Stenting Trial (EPISTENT): Trial (EPISTENT): Benefit of Abciximab and Stenting in Benefit of Abciximab and Stenting in Diabetes on Reducing TVRDiabetes on Reducing TVR
Lincoff AM et al. N Engl J Med 1999;341:319-327.
Days after Randomization
0
5
10
15
20Stent + PlaceboStent + AbciximabAngioplasty + Abciximab
Patients with DiabetesPatients with Diabetes(n = 491)(n = 491)
0 30 90 120 18060 150
Inci
dence
of
repeate
d T
VR
at
6 m
os.
(%
)
Days after Randomization
0
5
10
15
20
Patients without Patients without DiabetesDiabetes
(n = 1908)(n = 1908)
0 30 90 120 18060 150In
cidence
of
repeate
d T
VR
at
6 m
os.
(%
)
18.4%
16.6%
8.1%
14.6%
Stent + PlaceboStent + AbciximabAngioplasty + Abciximab
9.0%
8.8%
0
5
10
15
% o
f Pati
ents
Days
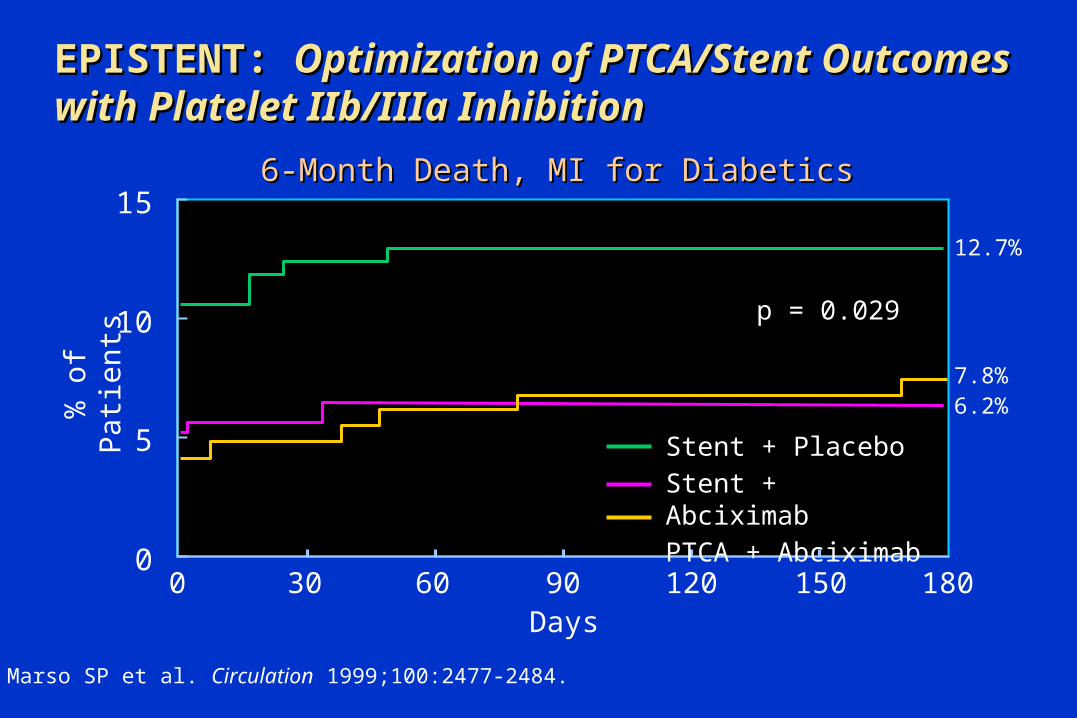
EPISTENT: EPISTENT: Optimization of PTCA/Stent Optimization of PTCA/Stent Outcomes with Platelet IIb/IIIa InhibitionOutcomes with Platelet IIb/IIIa Inhibition
Marso SP et al. Circulation 1999;100:2477-2484.
12.7%
7.8%6.2%
0 30 90 120 18060 150
6-Month Death, MI for Diabetics6-Month Death, MI for Diabetics
Stent + PlaceboStent + AbciximabPTCA + Abciximab
p = 0.029
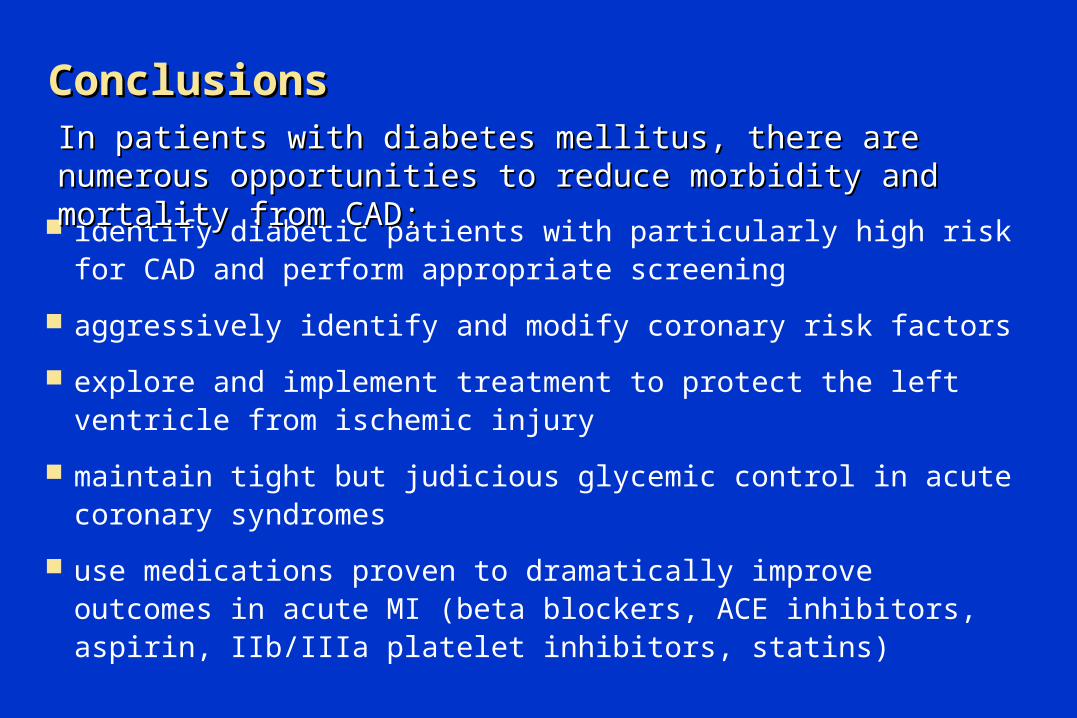
ConclusionsConclusions
identify diabetic patients with particularly high risk for CAD and perform appropriate screening
aggressively identify and modify coronary risk factors
explore and implement treatment to protect the left ventricle from ischemic injury
maintain tight but judicious glycemic control in acute coronary syndromes
use medications proven to dramatically improve outcomes in acute MI (beta blockers, ACE inhibitors, aspirin, IIb/IIIa platelet inhibitors, statins)
In patients with diabetes mellitus, there are numerous opportunities In patients with diabetes mellitus, there are numerous opportunities to reduce morbidity and mortality from CAD:to reduce morbidity and mortality from CAD:

Future DirectionsFuture Directions
Additional clinical trials are needed to evaluate cardiovascular therapeutic interventions in diabetic patients, because certain therapies may produce different results in the presence of diabetes