Embed Size (px)
Citation preview

CLIENT RESOURCE KITFIXED INCOME
INVESTMENT MANAGEMENT TEAMS RESEARCH
LEVERAGED FINANCEWilliam Housey, CFA, MBA, 25 yearsJeffrey Scott, CFA, MBA, 31 yearsScott D. Fries, CFA, MBA, 27 yearsGregory Olsen, CFA, MBA, 29 yearsBrian Kessler, CFA, CMT, 17 yearsSebastian Dassouli, 13 yearsPeter Fasone, CFA, MBA, 36 yearsHoward Tiffen, AM, 40+ yearsAndy Rybak, CFA, MBA, 22 yearsDave Tanny, 25 yearsJeffrey Johnson, CFA, 7 yearsRyan Kommers, 24 yearsCory Starkey, CFA, MS, 4 yearsDaniel Nagode, CFA, 4 yearsDaniel Waldron Jr., 4 yearsSam Cafi, MBA, 11 yearsBrandon Nelson, 0 years
SECURITIZED PRODUCTSJim Snyder, MBA, 32 yearsJeremiah Charles, MS, 18 yearsJud Tigerman, MBA, 25 yearsAustin Stockfisch, 10 yearsAlex DeRochie, 4 yearsMinhua Wu, 4 yearsOwen Aronson, 14 yearsStephen Pennington, MS, 17 yearsSamuel Cecil, MBA, 9 yearsDanielle Vandolder-Beaudin, 0 yearsJordan Pflum, MS, 0 Years
David McGarel, CFA, CPA, 31 yearsJon Erickson, CFA, MBA, 31 yearsChris Peterson, CFA, MBA, 22 years
EQUITY RESEARCH John Sherren, CFA, MBA, 23 yearsJared Wollen, CFA, MS, 12 yearsTom Marsh, 7 yearsEric Glombicki, 1 year
FIXED INCOME RESEARCH Jim Vavrek, CFA, 22 yearsTom Evans, CFA, JD, 19 yearsSteve Collins, CFA, MBA, 15 yearsOrlando Becerra, 8 years
PRODUCT SPECIALISTJeff Margolin, MBA, 25 yearsRyan O. Issakainen, CFA, MA, 20 yearsAndrew Hull, 12 years
STRATEGY RESEARCH Chris Bush, CFA, 15 yearsBob Hensley, CFA, MS, 18 yearsOmar Sepulveda, CFA, 23 yearsGraham Homberg, CFA, 14 yearsElliott Papineau, 13 yearsBrad Phillips, CFA, 10 yearsSteve Rinn, CFA, 5yearsJohn Bria, 7 yearsChris Swade, 2 yearTyler Jones, 2 yearSimon Peterson, 0 years
QUANT TECHDan Godoy, CFA, MBA, 14 yearsJohn Hagerson, CFA, 21 yearsJeff Sommars, PhD, CFA, 6 yearsLandon Kavlie, PhD, 5 yearsNathan Bliss, PhD, CFA 3 yearsRobby Teevans, 2 yearsEvan Cameron, 1 yearMichael Kietzman, 1 yearJon Larson, 1 yearMatt Adomshick, 1 year
PREFERRED SECURITIES(Stonebridge Advisors LLC)Scott Fleming, MBA, 40 yearsRobert Wolf, MBA, 22 yearsEric Weaver, MS, 14 yearsAngelo Graci, CFA, MBA, 26 yearsAllen Shepard, PhD, 28 yearsConnor Fleming, CFA, CIPM, 9 yearsScott Hubbell, CFA, 13 yearsJeff Vinca, 17 yearsMarie-Belle Mikue, 8 years
MODEL INVESTMENT COMMITTEE
INVESTMENT GRADETodd Larson, CFA, 29 yearsEric Maisel, CFA, MBA, 29 yearsYing Timmerman, CFA, CPA, 14 yearsDavid Worniak, CFA, 11 yearsNathan Simons, CFA, 10 yearsMichael Doyle, MBA, 23 yearsMatthew Franz, 3 yearsCharles Kovarik, 3 years
GLOBAL BONDS(First Trust Global Portfolios Limited)Derek Fulton, 25 yearsLeonardo DaCosta, CFA, 17 yearsAnthony Beevers, CFA, 11 years
CLOSED-END FUNDSKen Fincher, MBA, 25 yearsJordan Ramsland, 8 years
MUNICIPAL SECURITIESTom Futrell, CFA, MBA, 40 yearsJohnathan Wilhelm, JD, 29 yearsNick Novosad, CFA, 9 yearsJeff Samuel, 27 yearsSarah Schusler, CFA, 16 yearsShari Sikes, MS, 26 yearsBrendan Stewart, CFA, CPA, 9 yearsJohn Loch, MBA, 26 yearsAndrew Folland, MBA, 25 yearsAllison Keller, 2 years
Daniel J. Lindquist, CFA, MBAChairman and Managing Director 29 years
David McGarel, CFA, CPACIO, COO and Managing Director 31 years
William Housey, CFA, MBAManaging Director of Fixed-Income 25 years
Chris Peterson, CFA, MBASVP, Head of Strategy Research22 years
ECONOMICS
Brian Wesbury, MBA, 38 yearsRobert Stein, CFA, 25 yearsStrider Elass, 14 yearsAndrew Opdyke, CFA, MBA, 9 yearsGill Bryce, 6 yearsMary Buchanan, 17 years
MARKET ANALYSIS
Bob Carey, CFA, 34 yearsSteve Claiborne, 32 years
Chris Fallow, CFASVP, Portfolio Oversight21 years
Steve Collins, CFA, MBASVP, Senior Fixed-Income Analyst15 years
INVESTMENT EXPERTISE
1
TABLE OF CONTENTS
2
MARKET DATA LEADING INDICATORS FIXED INCOME OPPORTUNITY SET
3. SECULAR BULL AND BEAR EQUITY MARKETS
4. WEEKLY S&P 500 INDEX
5. WEEKLY 2 YR AND 5 YR U.S. TREASURY YIELD
6. WEEKLY 10 YR AND 30 YR U.S. TREASURY YIELD
7. 40-YEAR MONTHLY 10 YR U.S. TREASURY YIELD
8. 10 YR U.S. TREASURY REAL YIELD
9. INFLATION: BREAKEVENS
10. 10 YR U.S. TREASURY YIELD AND 10 YR GERMANBUND YIELD
11. WEEKLY 10 YR GOVERNMENT BOND YIELDS(GERMANY & JAPAN)
12. WEEKLY 10 YR GOVERNMENT BOND YIELDS(U.K. & ITALY)
13. CENTRAL BANK BALANCE SHEETS
14. NET DEALER TREASURY HOLDINGS
15. GLOBAL NEGATIVE YIELDING DEBT
16. WEEKLY U.S. DOLLAR INDEX (DXY)
17. THE BUSINESS CYCLE
18. 2 YR VS 10 YR U.S. TREASURY YIELD SPREAD & 3 MO VS 10 YR U.S. TREASURY YIELD SPREAD
19. REAL FEDERAL FUNDS RATE
20. TOTAL PICKUP TRUCK SALES
21. ECONOMIC SURPRISE INDEX
22. COMMODITIES
23. CHEMICAL ACTIVITY BAROMETER (CAB INDEX)
24. FIXED INCOME DASHBOARD
25. MUNICIPAL BONDS
26. MONEY MARKET RATES
27. FIXED INCOME ASSET CLASS PRICE ANALYSIS
28. YIELD PER UNIT OF DURATION
29. FIXED INCOME OPPORTUNITY SET –DURATION VS YTM
30. SIZE AND GROWTH OF THE U.S. DEBT MARKET
31. SIZE AND CREDIT QUALITY OF THE U.S.CORPORATE DEBT MARKET
32. YTM DIFFERENCE OF HIGH-YIELD BONDS VS LOANS
33. SENIOR LOAN AND HIGH-YIELD BOND DEFAULT RATE
34. FIXED INCOME ASSET CLASS RETURNS
35. ASSET CLASS CORRELATION
36. DEFINITIONS
All index data shown herein is for illustrative purposes only and not indicative of any actual investment. Index returns do not reflect any fees, expenses, or sales charges. Investors cannot invest directly in an index.
The information presented is not intended to constitute an investment recommendation for, or advice to, any specific person By providing this information, First Trust is not undertaking to give advice in any fiduciary capacity withinthe meaning of ERISA, the Internal Revenue Code or any other regulatory framework. Financial professionals are responsible for evaluating investment risks independently and for exercising independent judgment in determiningwhether investments are appropriate for their clients.

30
60
120
240
480
960
1,920
3,840
7,680
15,360
30,720
SECULAR BULL AND BEAR EQUITY MARKETSDow Jones Industrial Average (January 31, 1900 – September 30, 2021)
Source: BloombergPast performance is no guarantee of future results.
MARKET DATA
World War I
The Great Depression
World War IIKorean War
Black Monday
Vietnam War
9-11 TerroristAttacks
Global FinancialCrisis
COVID-19Pandemic
Secular Consolidations: Range 13 yrs – 25 yrs Secular Bull Markets: Range 4 yrs – 17 yrs Recession
3
Index
Leve
l (Log
Sca
le)
1900-1909 1910-1919 1920-1929 1930-1939 1940-1949 1950-1959 1960-1969 1970-1979 1980-1989 1990-1999 2000-2009 2010-2019

December 31, 1999 – September 24, 2021
Source: BloombergPast performance is no guarantee of future results.
MARKET DATA
WEEKLY S&P 500 INDEX
4
769
667
2192
1011
3074
1,575 1,575
600
1200
2400
4800
600
1200
2400
4800
12/99 12/00 12/01 12/02 12/03 12/04 12/05 12/06 12/07 12/08 12/09 12/10 12/11 12/12 12/13 12/14 12/15 12/16 12/17 12/18 12/19 12/20
Index
Leve
l (Log
Sca
le)
Cyclical Corrections/Bear Markets
Start of Secular Bull Market
ResistanceEquities remain in a
Secular Bull Market above the uptrend line at ~3100
New Cyclical Bull Market

5.23%3.10%
1.19% 1.01%0.53%
0.89% 1.31%
0.19%0.10%
0.20%
0.40%
0.80%
1.60%
3.20%
6.40%
12/05 12/06 12/07 12/08 12/09 12/10 12/11 12/12 12/13 12/14 12/15 12/16 12/17 12/18 12/19 12/20
5 YEAR U.S. TREASURY Q3 2021 RETURN: -0.25%
2 YEAR U.S. TREASURY Q3 2021 RETURN: 0.09%5.13%
3.11% 2.97%
0.14%
0.50%
1.25%
0.10%0.08%
0.15%
0.30%
0.60%
1.20%
2.40%
4.80%
12/05 12/06 12/07 12/08 12/09 12/10 12/11 12/12 12/13 12/14 12/15 12/16 12/17 12/18 12/19 12/20
WEEKLY 2 YEAR AND 5 YEAR U.S. TREASURY YIELDDecember 31, 2005 – September 24, 2021
Source: Bloomberg. Past performance is no guarantee of future results. The 2 Year U.S. Treasury return is represented by the ICE BofA Current 2-Year U.S. Treasury Index and is a one-security index comprised of the most recently issued 2-year U.S. Treasury note. The 5 Year U.S. Treasury return is represented by the ICE BofA Current 5-Year U.S. Treasury Index and is a one-security index comprised of the most recently issued 5-year U.S. Treasury note. The Indices are rebalanced monthly.
MARKET DATA
5
Resistance at 1.25%
Bottomed
Resistance at 1.75%.
Bottomed
Consolidating

10 YEAR U.S. TREASURY Q3 2021 RETURN: -0.31%
30 YEAR U.S. TREASURY Q3 2021 RETURN: 0.03%
WEEKLY 10 YEAR AND 30 YEAR U.S. TREASURY YIELDDecember 31, 1999 – September 24, 2021
Source: Bloomberg. Past performance is no guarantee of future results. The 10 Year U.S. Treasury return is represented by the ICE BofA Current 10-Year U.S. Treasury Index and is a one-security index comprised of the most recently issued 10-year U.S. Treasury note. The 30 Year U.S. Treasury return is represented by the ICE BofA Current 30-Year U.S. Treasury Index and is a one-security index comprised of the most recently issued 30-year U.S. Treasury note. The Indices are rebalanced monthly.
MARKET DATA
6
5.32%
3.05% 3.26%3.07%
1.38% 1.32% 1.43%
0.31%0.20%
0.40%
0.80%
1.60%
3.20%
6.40%
12/99 12/00 12/01 12/02 12/03 12/04 12/05 12/06 12/07 12/08 12/09 12/10 12/11 12/12 12/13 12/14 12/15 12/16 12/17 12/18 12/19 12/20
Support at ~1.40%
6.76%5.44%
3.97%3.46%4.14%
2.51% 2.44% 2.09% 1.90%2.22%
0.50%
1.00%
2.00%
4.00%
8.00%
12/99 12/00 12/01 12/02 12/03 12/04 12/05 12/06 12/07 12/08 12/09 12/10 12/11 12/12 12/13 12/14 12/15 12/16 12/17 12/18 12/19 12/20
Resistance at 1.74% and 1.94%
Bottomed
Consolidating, Resistance at 2.25%
Bottomed
Trending higher
0.70%

40-YEAR MONTHLY 10 YEAR U.S. TREASURY YIELDJanuary 31, 1980 – September 30, 2021
Source: Bloomberg. Past performance is no guarantee of future results.
MARKET DATA
7
0.20%
0.40%
0.80%
1.60%
3.20%
6.40%
12.80%
0.20%
0.40%
0.80%
1.60%
3.20%
6.40%
12.80%
01/80 01/84 01/88 01/92 01/96 01/00 01/04 01/08 01/12 01/16 01/20
2.91%
9 Year Support at ~1.40%
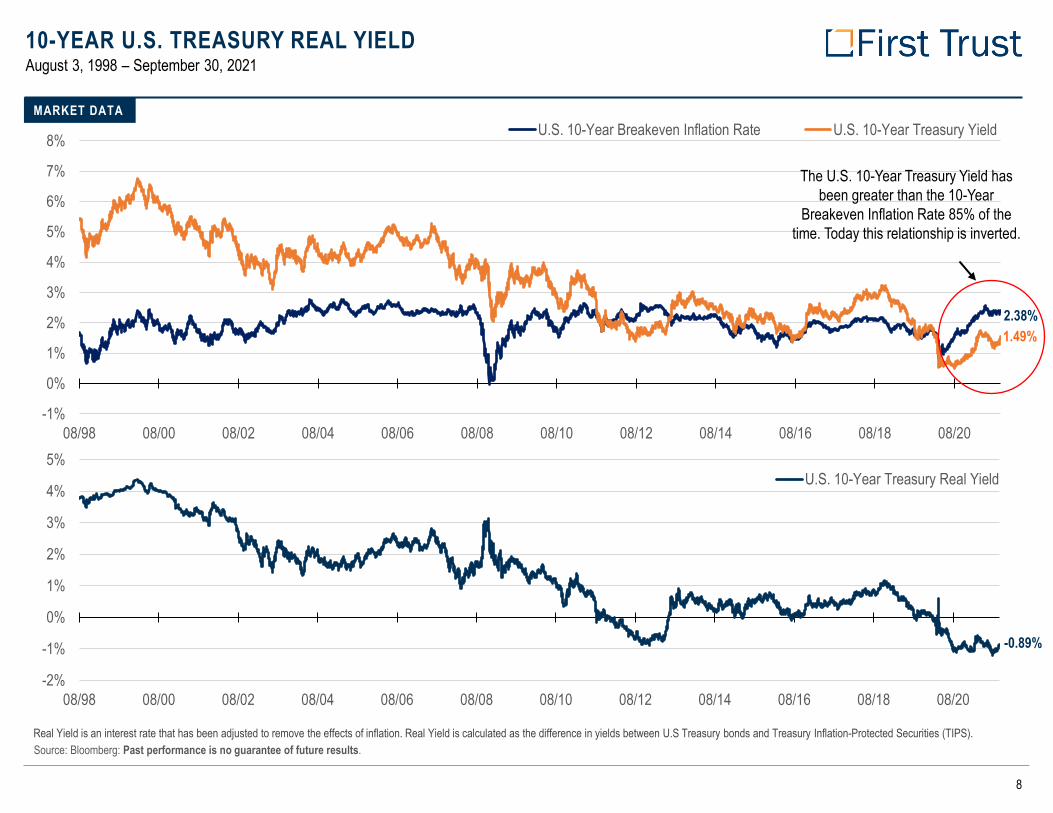
10-YEAR U.S. TREASURY REAL YIELD
MARKET DATA
8
August 3, 1998 – September 30, 2021
Source: Bloomberg: Past performance is no guarantee of future results.
-1%
0%
1%
2%
3%
4%
5%
6%
7%
8%
08/98 08/00 08/02 08/04 08/06 08/08 08/10 08/12 08/14 08/16 08/18 08/20
U.S. 10-Year Breakeven Inflation Rate U.S. 10-Year Treasury Yield
2.38%1.49%
The U.S. 10-Year Treasury Yield has been greater than the 10-Year
Breakeven Inflation Rate 85% of the time. Today this relationship is inverted.
-2%
-1%
0%
1%
2%
3%
4%
5%
08/98 08/00 08/02 08/04 08/06 08/08 08/10 08/12 08/14 08/16 08/18 08/20
U.S. 10-Year Treasury Real Yield
-0.89%
Real Yield is an interest rate that has been adjusted to remove the effects of inflation. Real Yield is calculated as the difference in yields between U.S Treasury bonds and Treasury Inflation-Protected Securities (TIPS).

INFLATION: BREAKEVENS
MARKET DATA
9
October 27, 2004 – September 30, 2021
Source: Bloomberg: The breakeven rate is a market-based gauge for the expected annual inflation. Past performance is no guarantee of future results.
-8%
-6%
-4%
-2%
0%
2%
4%
6%
10/04 10/05 10/06 10/07 10/08 10/09 10/10 10/11 10/12 10/13 10/14 10/15 10/16 10/17 10/18 10/19 10/20
2-Year US Breakeven Inflation Rate 5-Year US Breakeven Inflation Rate
10-Year US Breakeven Inflation Rate 30-Year US Breakeven Inflation Rate
9/21
2.53%2.53%2.38%2.29%

10 YEAR U.S. TREASURY YIELD AND 10 YEAR GERMAN BUND YIELDDecember 31, 1988 – September 24, 2021
Source: BloombergPast performance is no guarantee of future results.
MARKET DATA
10
YIELD SPREAD BETWEEN THE 10 YEAR U.S. TREASURY YIELD AND THE 10 YEAR GERMAN BUND YIELD
-2.0%
0.0%
2.0%
4.0%
6.0%
8.0%
10.0%
12/88 12/90 12/92 12/94 12/96 12/98 12/00 12/02 12/04 12/06 12/08 12/10 12/12 12/14 12/16 12/18 12/20
U.S. 10-Year Bund 10-Year
1.45%
-0.23%
-2.0%
-1.0%
0.0%
1.0%
2.0%
3.0%
12/88 12/90 12/92 12/94 12/96 12/98 12/00 12/02 12/04 12/06 12/08 12/10 12/12 12/14 12/16 12/18 12/20
Yield Spread Average
1.68%
0.62%

WEEKLY 10 YEAR GOVERNMENT BOND YIELDS (GERMANY & JAPAN)December 31, 2005 – September 24, 2021
Source: BloombergPast performance is no guarantee of future results.
MARKET DATA
11
4.70%3.51%
2.09%
1.06% 0.81%
2.85%
1.13%
-0.91%
-0.23%
-2.00%
-1.00%
0.00%
1.00%
2.00%
3.00%
4.00%
5.00%
12/05 12/06 12/07 12/08 12/09 12/10 12/11 12/12 12/13 12/14 12/15 12/16 12/17 12/18 12/19 12/20
1.91%
1.35%
0.55%0.17%
0.83%0.33%
-0.28% -0.29%0.06%
-1.00%-0.50%0.00%0.50%1.00%1.50%2.00%2.50%
12/05 12/06 12/07 12/08 12/09 12/10 12/11 12/12 12/13 12/14 12/15 12/16 12/17 12/18 12/19 12/20
WEEKLY 10 YEAR GERMAN BUND YIELD
WEEKLY 10 YEAR JAPANESE GOVERNMENT BOND YIELD

WEEKLY 10 YEAR GOVERNMENT BOND YIELDS (U.K. & ITALY)December 31, 2005 – September 24, 2021
Source: BloombergPast performance is no guarantee of future results.
MARKET DATA
12
5.56%
4.30%
1.75%2.79%
1.41%
0.50%
3.08%
1.33%
0.06%
0.93%0.00%
1.00%
2.00%
3.00%
4.00%
5.00%
6.00%
12/05 12/06 12/07 12/08 12/09 12/10 12/11 12/12 12/13 12/14 12/15 12/16 12/17 12/18 12/19 12/20
3.31%3.25% 3.10%
0.83%
6.57%
0.85% 0.47%0.70%
-1.00%0.00%1.00%2.00%3.00%4.00%5.00%6.00%7.00%
12/05 12/06 12/07 12/08 12/09 12/10 12/11 12/12 12/13 12/14 12/15 12/16 12/17 12/18 12/19 12/20
WEEKLY 10 YEAR U.K. GOVERNMENT BOND YIELD
WEEKLY 10 YEAR ITALIAN GOVERNMENT BOND YIELD
4.59%

CENTRAL BANK BALANCE SHEETS
MARKET DATA
13
December 31, 1999 – September 24, 2021
Source: Bloomberg
$0 Tn
$2 Tn
$4 Tn
$6 Tn
$8 Tn
$10 Tn
$12 Tn
12/99 12/00 12/01 12/02 12/03 12/04 12/05 12/06 12/07 12/08 12/09 12/10 12/11 12/12 12/13 12/14 12/15 12/16 12/17 12/18 12/19 12/20
European Central Bank (ECB) Bank of Japan (BOJ) U.S. Federal Reserve (Fed)
The Fed balance sheet has grown $4.3 Trillion since the beginning of 2020
$9.69T
$6.62T
$8.49T

$0B
$50B
$100B
$150B
$200B
$250B
$300B
$350B
12/14 6/15 12/15 6/16 12/16 6/17 12/17 6/18 12/18 6/19 12/19 6/20 12/20 6/21 9/21
NET DEALER TREASURY HOLDINGS
MARKET DATA
14
Source: Bloomberg, Federal Reserve
December 31, 2014 – September 22, 2021
$150.47 Billion9/22/2021

GLOBAL NEGATIVE YIELDING DEBTDecember 31, 2013 – September 30, 2021
Source: BloombergGlobal negative yielding debt is comprised by summing the negative yielding debt within the Bloomberg Barclays Global-Aggregate Index, which is a flagship measure of global investment grade debt from twenty-four localcurrency markets which includes treasury, government-related, corporate and securitized fixed-rate bonds from both developed and emerging market issuers.
MARKET DATA
15
$0 Tn
$2 Tn
$4 Tn
$6 Tn
$8 Tn
$10 Tn
$12 Tn
$14 Tn
$16 Tn
$18 Tn
$20 Tn
12/13 06/14 12/14 06/15 12/15 06/16 12/16 06/17 12/17 06/18 12/18 06/19 12/19 06/20 12/20 06/21
$18.38 Trillion12/11/2020
$13.10 Trillion9/30/2021
103.82
96.9899.67
102.99
72.70
78.91
91.92
88.25
100.33
70
80
90
100
110
7012/10 06/11 12/11 06/12 12/12 06/13 12/13 06/14 12/14 06/15 12/15 06/16 12/16 06/17 12/17 06/18 12/18 06/19 12/19 06/20 12/20 06/21
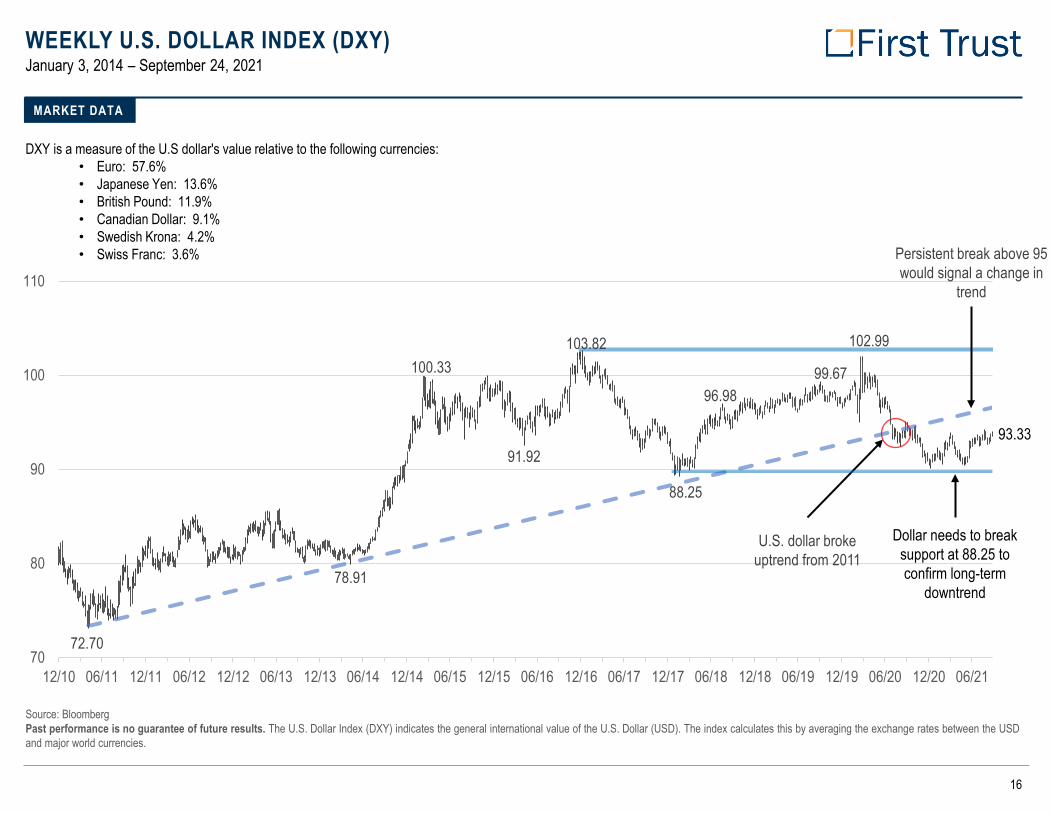
WEEKLY U.S. DOLLAR INDEX (DXY)January 3, 2014 – September 24, 2021
Source: BloombergPast performance is no guarantee of future results. The U.S. Dollar Index (DXY) indicates the general international value of the U.S. Dollar (USD). The index calculates this by averaging the exchange rates between the USDand major world currencies.
MARKET DATA
16
DXY is a measure of the U.S dollar's value relative to the following currencies:• Euro: 57.6%• Japanese Yen: 13.6%• British Pound: 11.9%• Canadian Dollar: 9.1%• Swedish Krona: 4.2%• Swiss Franc: 3.6%
U.S. dollar broke uptrend from 2011
Dollar needs to break support at 88.25 to confirm long-term
downtrend
Persistent break above 95 would signal a change in
trend
93.33

THE BUSINESS CYCLE
Source: Goldman Sachs Global Investment ResearchPast performance is no guarantee of future results. This chart is for illustrative purposes only and not indicative of any actual investment.
LEADING INDICATORS
17
PHASE 1 PHASE 2 PHASE 3 PHASE 4
Returns (09/30/20-09/30/21)Commodities 81.90%
S&P 500 30.01%3-Mo LIBOR 0.13%
U.S. Agg -0.90%

2 YEAR VS 10 YEAR U.S. TREASURY YIELD SPREAD &3 MONTH VS 10 YEAR U.S. TREASURY YIELD SPREAD
Source: Bloomberg, as of 9/30/2021.Past performance is no guarantee of future results. The yield spread is the difference between yields on the varying Treasury maturities. A basis point is a common unit of measure for interest rates and is equal to 1/100th of1% percent or 0.01%. A 1% change is equal to 100 basis points.
LEADING INDICATORS
18
121 bps145 bps
-300
-200
-100
0
100
200
300
400
12/76 12/79 12/82 12/85 12/88 12/91 12/94 12/97 12/00 12/03 12/06 12/09 12/12 12/15 12/18
Recession 2yr vs 10yr U.S. Treasury Yield Spread 3mo vs 10yr U.S. Treasury Yield Spread
Basis
Poin
ts (B
PS)
9/21

REAL FEDERAL FUNDS RATE
Source: Bloomberg, FREDReal Federal Funds Rate is the effective Federal Funds Rate minus 12-month core PCE inflation. The Effective Federal Funds Rate is the interest rate banks charge each other for overnight lending.
LEADING INDICATORS
19
December 31, 1970 – September 30, 2021
-6
-4
-2
0
2
4
6
8
10
12
12/70 12/73 12/76 12/79 12/82 12/85 12/88 12/91 12/94 12/97 12/00 12/03 12/06 12/09 12/12 12/15 12/18
Recession Real Fed Funds Rate (%)
Real
Fed F
unds
Rate
(%)
09/21

TOTAL PICKUP TRUCK SALES
Source: Motor Intelligence, Good Car Bad Car
LEADING INDICATORS
1980 – 3Q 2021
20
0.0
0.5
1.0
1.5
2.0
2.5
3.0
3.5
1980 1985 1990 1995 2000 2005 2010 2015 2020
Recessions Total Pickup Truck Sales
Millio
ns of
Pick
up T
ruck
s
Truck Sales constrained by supply

ECONOMIC SURPRISE INDEX & 10-YEAR U.S. TREASURY YIELD
A positive reading means that data releases have been stronger than expected and a negative reading means that data releases have been worse than expected. The Economic Surprise Index has historically exhibited a positive correlation with 10–Year U.S. Treasury yields.
Source: Bloomberg, Citigroup Global Markets Inc.Past performance is no guarantee of future results.
LEADING INDICATORS
December 31, 2002 – September 24, 2021
21
-190-170-150-130-110-90-70-50-30-101030507090110130150170190210230250270290
-190-170-150-130-110
-90-70-50-30-101030507090
110130150170190210230250270290
12/02 12/04 12/06 12/08 12/10 12/12 12/14 12/16 12/18 12/20
Economic Surprise Index (%) US 10-Yr Yield (13-week change, basis points)

238.52 175.68
91.94 87.37
102.15
72.33 58.87
40
80
160
320
12/90 12/92 12/94 12/96 12/98 12/00 12/02 12/04 12/06 12/08 12/10 12/12 12/14 12/16 12/18 12/20
Index
Leve
lCr
ude O
il Pric
e
WEEKLY BLOOMBERG COMMODITY (BCOM) INDEX (DECEMBER 31, 1990 – SEPTEMBER 24, 2021)
WEEKLY CRUDE OIL PRICE (APRIL 1, 1983 – SEPTEMBER 24, 2021)
COMMODITIES
Source: Bloomberg. Past performance is no guarantee of future results. The Bloomberg Commodity Index (BCOM) is a highly liquid and diversified benchmark for commodity investments including but not limited to energy,grains, industrial metals, precious metals, softs and livestock.
LEADING INDICATORS
22
Broke through a 12-year Downtrend
9/21
128.49
72.24
$10
$20
$40
$80
$160
04/83 04/87 04/91 04/95 04/99 04/03 04/07 04/11 04/15 04/19
Recession Crude Oil Price
Broke Resistance at $66
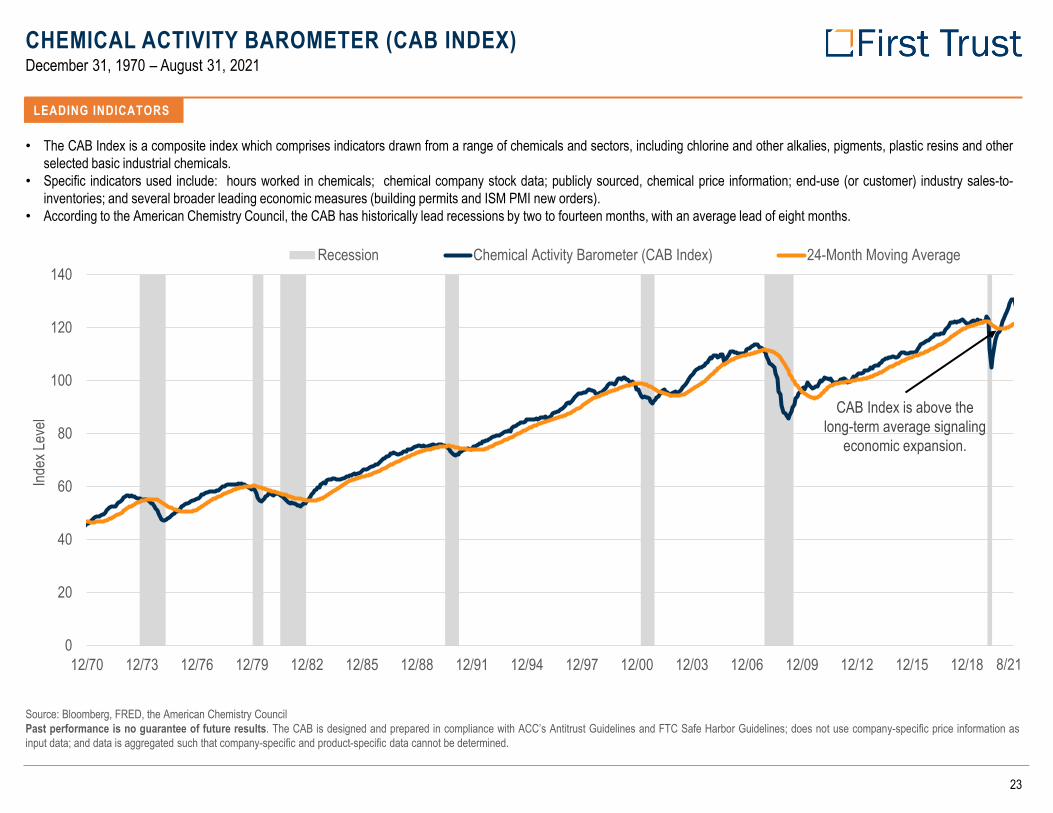
CHEMICAL ACTIVITY BAROMETER (CAB INDEX)December 31, 1970 – August 31, 2021
Source: Bloomberg, FRED, the American Chemistry CouncilPast performance is no guarantee of future results. The CAB is designed and prepared in compliance with ACC’s Antitrust Guidelines and FTC Safe Harbor Guidelines; does not use company-specific price information asinput data; and data is aggregated such that company-specific and product-specific data cannot be determined.
LEADING INDICATORS
23
• The CAB Index is a composite index which comprises indicators drawn from a range of chemicals and sectors, including chlorine and other alkalies, pigments, plastic resins and otherselected basic industrial chemicals.
• Specific indicators used include: hours worked in chemicals; chemical company stock data; publicly sourced, chemical price information; end-use (or customer) industry sales-to-inventories; and several broader leading economic measures (building permits and ISM PMI new orders).
• According to the American Chemistry Council, the CAB has historically lead recessions by two to fourteen months, with an average lead of eight months.
0
20
40
60
80
100
120
140
12/70 12/73 12/76 12/79 12/82 12/85 12/88 12/91 12/94 12/97 12/00 12/03 12/06 12/09 12/12 12/15 12/18
Recession Chemical Activity Barometer (CAB Index) 24-Month Moving Average
Index
Leve
l CAB Index is above the long-term average signaling
economic expansion.
8/21

FIXED INCOME DASHBOARD
Source: ICE and Standard & Poor’s Leveraged Loan Commentary and Data. Past performance is no guarantee of future results. Option Adjusted Spread (OAS) is the current spread over a Treasury security of similar tenor.Senior Loan STM is Spread-To-Maturity. Current yield is equivalent to the Index’s annual income (face value multiplied by par weighted coupon) divided by the current price (full market value). Preferreds Current Yield Spread(CYS) is the current yield of the preferreds blended benchmark minus the current yield of the 10-Year Treasury Index (GA10), going back to 12/31/2013.*The blended benchmark consists of 30% ICE BofA Core Plus Fixed Rate Preferred Securities Index (P0P4) / 30% ICE BofA US Investment Grade Institutional Capital Securities Index (CIPS) / 30% ICE BofA USD ContingentCapital Index (CDLR) / 10% ICE BofA US High Yield Institutional Capital Securities Index (HIPS).
FIXED INCOME OPPORTUNITY SET
24
10 Year Minimum and Maximum Option Adjusted Spreads (OAS)
HIGH-YIELD BONDS
OAS – ICE BofA U.S. High Yield Constrained Index
Current OAS 316 High OAS 1,087 3/23/2020Mean OAS 474 Low OAS 304 7/1/2021Std Dev 126
SENIOR LOANS
STM – S&P/LSTA Leveraged Loan Index
Current STM 399 High STM 1,071 3/23/2020Mean STM 476 Low STM 353 4/20/2018Std Dev 85
EMERGING MARKETS
OAS – ICE BofA U.S. Emerging Markets External Sovereign Index
Current OAS 295 High OAS 693 3/23/2020Mean OAS 313 Low OAS 211 2/2/2018Std Dev 57
PREFERREDS
CYS – Preferreds Blended Benchmark*
Current CYS 396 High CYS 603 3/23/2020Mean CYS 405 Low CYS 307 2/27/2019Std Dev 55
INVESTMENT GRADE CORPORATES
OAS – ICE BofA U.S. Corporate Index
Current OAS 89 High OAS 401 3/23/2020Mean OAS 141 Low OAS 86 9/27/2021Std Dev 39
MORTGAGE BACKED SECURITIES
OAS – ICE BofA U.S. Mortgage Backed Securities Index
Current OAS 9 High OAS 136 3/19/2020Mean OAS 36 Low OAS -12 4/30/2021Std Dev 21
As of 12/31/2020:As of 9/30/2021:
Mean as of 9/30/2021:

MUNICIPAL BONDS
FIXED INCOME OPPORTUNITY SET
25
Source: Bloomberg. Past performance is no guarantee of future results. The spread is the difference between the benchmark shown and the Bloomberg Barclays Municipal AAA Index Total Return Index Value UnhedgedUSD.
10 Year Spreads to AAA Municipals
AA MUNICIPALS A MUNICIPALS
BBB MUNICIPALS HIGH-YIELD MUNICIPALS
Bloomberg Barclays Municipal AA IndexTotal Return Index Value Unhedged USD
Current 5 High 69 12/5/2011Mean 25 Low 4 7/21/2021Std Dev 18
Bloomberg Barclays Municipal A IndexTotal Return Index Value Unhedged USD
Current 26 High 154 12/1/2011Mean 79 Low 24 7/21/2021Std Dev 34
Bloomberg Barclays Municipal BAA IndexTotal Return Index Value Unhedged USD
Current 54 High 318 1/31/2014Mean 161 Low 54 9/29/2021Std Dev 61
Bloomberg Barclays Muni High YieldTotal Return Index Value Unhedged USD
Current 212 High 525 2/11/2016Mean 382 Low 218 8/30/2021Std Dev 96
As of 12/31/2020:As of 9/30/2021:
Mean as of 9/30/2021:

FIXED INCOME OPPORTUNITY SET
26
MONEY MARKET RATESJune 30, 2019 – September 30, 2021
Source: Bloomberg. Tier 1 90d - U.S. Commercial Paper Placed Top 90 Day Yield (DCPB090Y Index), Tier 1 30d - U.S. Commercial Paper Dealer Placed Second 30 Day Yield (DCPD030Y Index), Tier 2 60d- U.S. CommercialPaper Dealer Placed Second 60 Day Yield (DCPD060Y Index), 3m Libor- ICE LIBOR USD 3 Month (US0003M Index).For illustrative purposes only. Past performance is no guarantee of future results.
0.00
0.50
1.00
1.50
2.00
2.50
3.00
3.50
4.00
6/19 7/19 8/19 9/19 10/1911/19 12/19 1/20 2/20 3/20 4/20 5/20 6/20 7/20 8/20 9/20 10/2011/20 12/20 1/21 2/21 3/21 4/21 5/21 6/21 7/21 8/21 9/21
Tier 1 90d Tier 2 30d Tier 2 60d 3m Libor

FIXED INCOME ASSET CLASS PRICE ANALYSISAs of September 30, 2021
Source: Barclays, S&P LCD and Bloomberg. Past performance is no guarantee of future results. U.S. High-Yield Bonds are represented by the ICE BofA U.S. High Yield Constrained Index; Institutional Preferreds arerepresented by the ICE BofA Investment Grade Institutional Capital Securities Index; Preferreds are represented by a blended benchmark consisting of 30% ICE BofA Core Plus Fixed Rate Preferred Securities Index (P0P4) / 30% ICEBofA US Investment Grade Institutional Capital Securities Index (CIPS) / 30% ICE BofA USD Contingent Capital Index (CDLR) / 10% ICE BofA US High Yield Institutional Capital Securities Index (HIPS); U.S. Senior Loans arerepresented by the S&P/LSTA Leveraged Loan Index; Investment Grade Corporates are represented by the Bloomberg Barclays U.S. Corporate Investment Grade Index; Core Bonds are represented by the Bloomberg Barclays U.S.Aggregate Bond Index; Government Bonds are represented by the Bloomberg Barclays U.S. Government Index; TIPS are represented by the Bloomberg Barclays U.S. Treasury TIPS 1-5 Year Index; High Yield Municipal Bonds arerepresented by the Bloomberg Barclays High Yield Municipal Bond Index; Municipal Bonds are represented by the Bloomberg Barclays Municipal Bond Index; Mortgage Backed Securities are represented by the ICE BofA U.S.Mortgage Backed Securities Index.
FIXED INCOME OPPORTUNITY SET
27
70 75 80 85 90 95 100 105 110 115 120
Mortgage Backed Securities
Municipal Bonds
High-Yield Municipal Bonds
TIPS
Government Bonds
Core Bonds
Investment Grade Corporates
U.S. Senior Loans
Preferreds
U.S. High-Yield Bonds
12/31/2020 9/30/2021Par
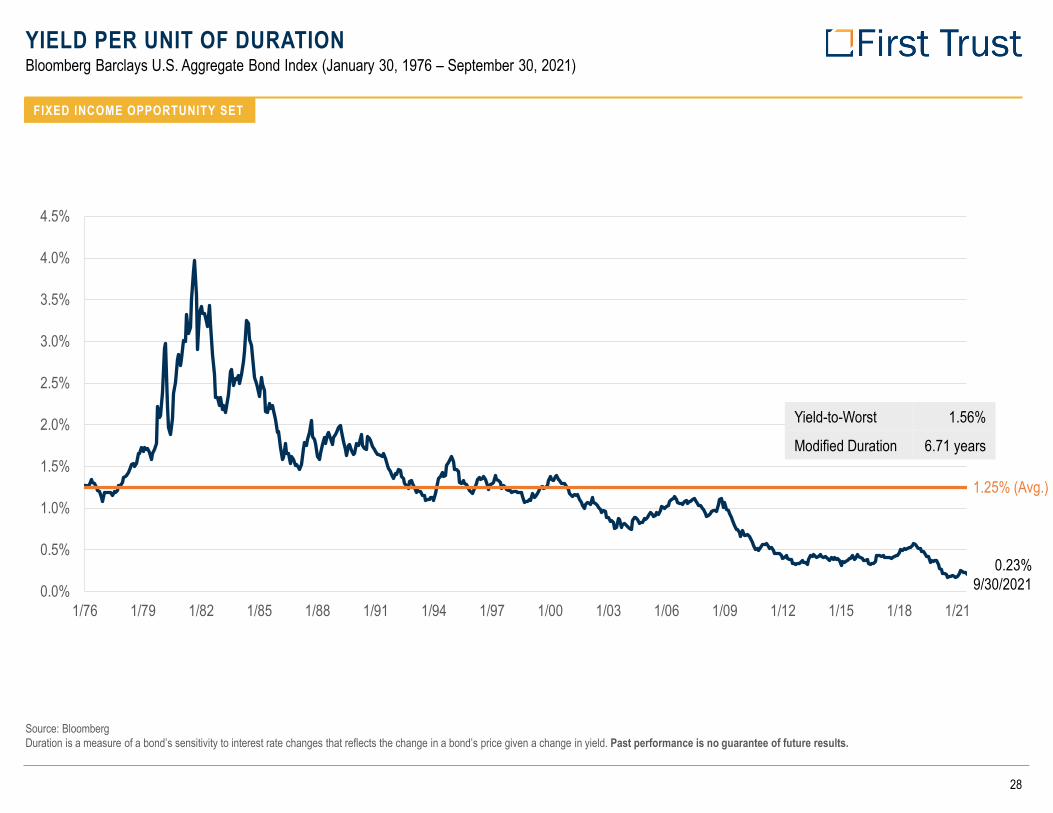
1.25% (Avg.)
0.0%
0.5%
1.0%
1.5%
2.0%
2.5%
3.0%
3.5%
4.0%
4.5%
1/76 1/79 1/82 1/85 1/88 1/91 1/94 1/97 1/00 1/03 1/06 1/09 1/12 1/15 1/18 1/21
0.23%9/30/2021
YIELD PER UNIT OF DURATIONBloomberg Barclays U.S. Aggregate Bond Index (January 30, 1976 – September 30, 2021)
Source: BloombergDuration is a measure of a bond’s sensitivity to interest rate changes that reflects the change in a bond’s price given a change in yield. Past performance is no guarantee of future results.
FIXED INCOME OPPORTUNITY SET
28
Yield-to-Worst 1.56%
Modified Duration 6.71 years

FIXED INCOME OPPORTUNITY SET – DURATION VS YTMAs of September 30, 2021
Source: Barclays, S&P LCD, and Bloomberg.*YTM represents the Tax-Equivalent Yield (TEY) for the highest tax bracket of 37%. Past performance is no guarantee of future results. U.S. Senior Loans are represented by the S&P/LSTA Leveraged Loan Index; U.S. High-Yield Bonds are represented by the ICE BofA U.S. High Yield Constrained Index; Preferreds are represented by a blended benchmark consisting of 30% ICE BofA Core Plus Fixed Rate Preferred Securities Index (P0P4) / 30% ICE BofAUS Investment Grade Institutional Capital Securities Index (CIPS) / 30% ICE BofA USD Contingent Capital Index (CDLR) / 10% ICE BofA US High Yield Institutional Capital Securities Index (HIPS); Investment Grade Corporates arerepresented by the Bloomberg Barclays U.S. Corporate Investment Grade Index; Municipal Bonds are represented by the Bloomberg Barclays Municipal Bond Index; Mortgage Backed Securities are represented by the ICE BofA U.S.Mortgage Backed Securities Index; Core Bonds are represented by the Bloomberg Barclays U.S. Aggregate Bond Index; Government Bonds are represented by the Bloomberg Barclays U.S. Government Index; TIPS are represented bythe Bloomberg Barclays U.S. Treasury TIPS 1-5 Year Index.
FIXED INCOME OPPORTUNITY SET
29
0
1
2
3
4
5
6
7
8
9
10
0%
1%
2%
3%
4%
5%
6%
7%
8%
9%
10%
Senior Loans High-YieldBonds
PreferredSecurities
InvestmentGrade
Corporates
MunicipalBonds*
MortgageBacked
Securities
Core Bonds GovernmentBonds
TIPS
Duration (years)Yield
To M
aturity
YTM Duration
$ Tn
$5 Tn
$10 Tn
$15 Tn
$20 Tn
$25 Tn
$30 Tn
$35 Tn
$40 Tn
'97 '98 '99 '00 '01 '02 '03 '04 '05 '06 '07 '08 '09 '10 '11 '12 '13 '14 '15 '16 '17 '18 '19 '20 '21
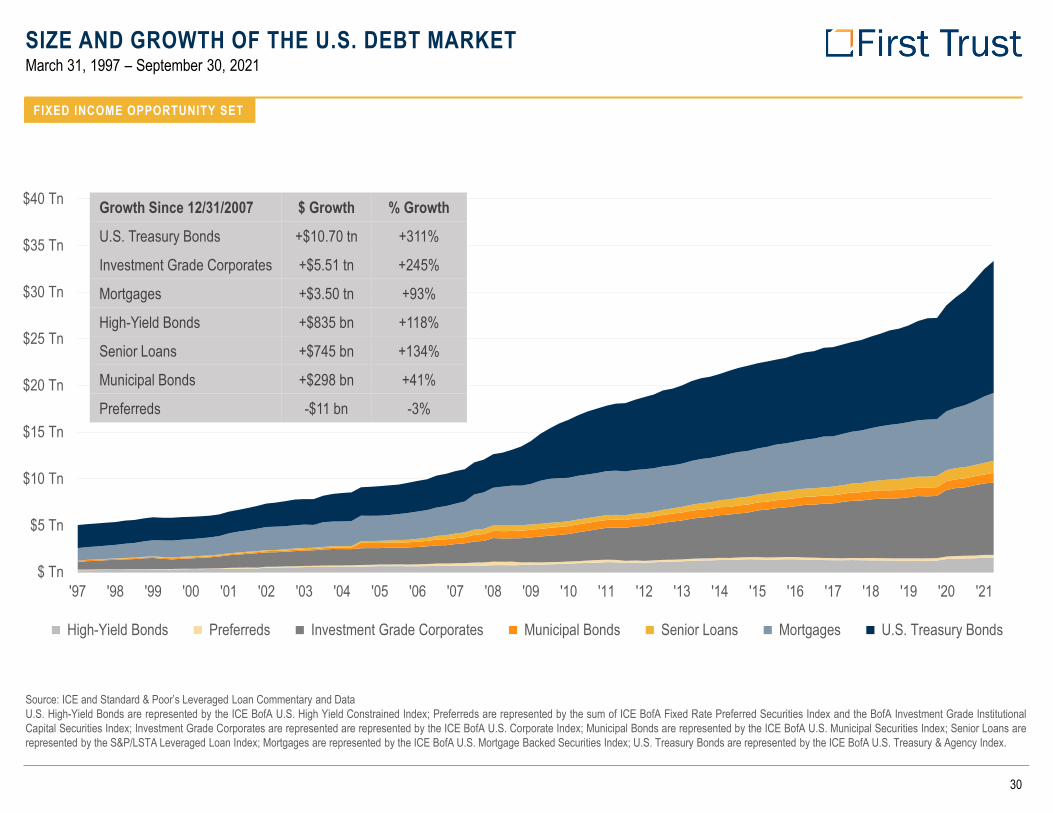
High-Yield Bonds Preferreds Investment Grade Corporates Municipal Bonds Senior Loans Mortgages U.S. Treasury Bonds
SIZE AND GROWTH OF THE U.S. DEBT MARKETMarch 31, 1997 – September 30, 2021
Source: ICE and Standard & Poor’s Leveraged Loan Commentary and DataU.S. High-Yield Bonds are represented by the ICE BofA U.S. High Yield Constrained Index; Preferreds are represented by the sum of ICE BofA Fixed Rate Preferred Securities Index and the BofA Investment Grade InstitutionalCapital Securities Index; Investment Grade Corporates are represented are represented by the ICE BofA U.S. Corporate Index; Municipal Bonds are represented by the ICE BofA U.S. Municipal Securities Index; Senior Loans arerepresented by the S&P/LSTA Leveraged Loan Index; Mortgages are represented by the ICE BofA U.S. Mortgage Backed Securities Index; U.S. Treasury Bonds are represented by the ICE BofA U.S. Treasury & Agency Index.
FIXED INCOME OPPORTUNITY SET
30
Growth Since 12/31/2007 $ Growth % Growth
U.S. Treasury Bonds +$10.70 tn +311%
Investment Grade Corporates +$5.51 tn +245%
Mortgages +$3.50 tn +93%
High-Yield Bonds +$835 bn +118%
Senior Loans +$745 bn +134%
Municipal Bonds +$298 bn +41%
Preferreds -$11 bn -3%
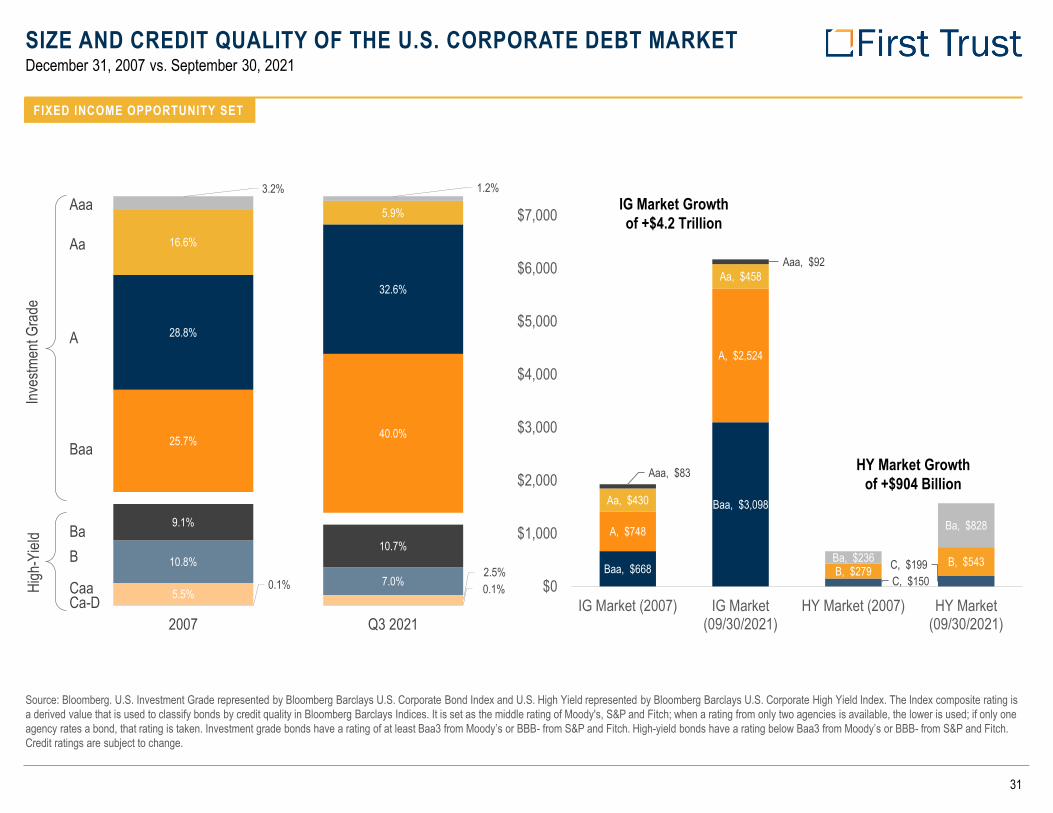
SIZE AND CREDIT QUALITY OF THE U.S. CORPORATE DEBT MARKETDecember 31, 2007 vs. September 30, 2021
Source: Bloomberg. U.S. Investment Grade represented by Bloomberg Barclays U.S. Corporate Bond Index and U.S. High Yield represented by Bloomberg Barclays U.S. Corporate High Yield Index. The Index composite rating is a derived value that is used to classify bonds by credit quality in Bloomberg Barclays Indices. It is set as the middle rating of Moody's, S&P and Fitch; when a rating from only two agencies is available, the lower is used; if only one agency rates a bond, that rating is taken. Investment grade bonds have a rating of at least Baa3 from Moody’s or BBB- from S&P and Fitch. High-yield bonds have a rating below Baa3 from Moody’s or BBB- from S&P and Fitch. Credit ratings are subject to change.
FIXED INCOME OPPORTUNITY SET
31
Inves
tmen
t Gra
deHi
gh-Y
ield
CaaCa-D
BBa
Baa
A
Aa
Aaa
0.1% 0.1%5.5%
2.5%10.8%
7.0%
9.1%
10.7%
25.7% 40.0%
28.8%
32.6%
16.6%
5.9%
3.2% 1.2%
2007 Q3 2021
C, $150 C, $199 B, $279
B, $543 Ba, $236
Ba, $828
Baa, $668
Baa, $3,098
A, $748
A, $2,524
Aa, $430
Aa, $458
Aaa, $83
Aaa, $92
$0
$1,000
$2,000
$3,000
$4,000
$5,000
$6,000
$7,000
IG Market (2007) IG Market(09/30/2021)
HY Market (2007) HY Market(09/30/2021)
HY Market Growthof +$904 Billion
IG Market Growthof +$4.2 Trillion
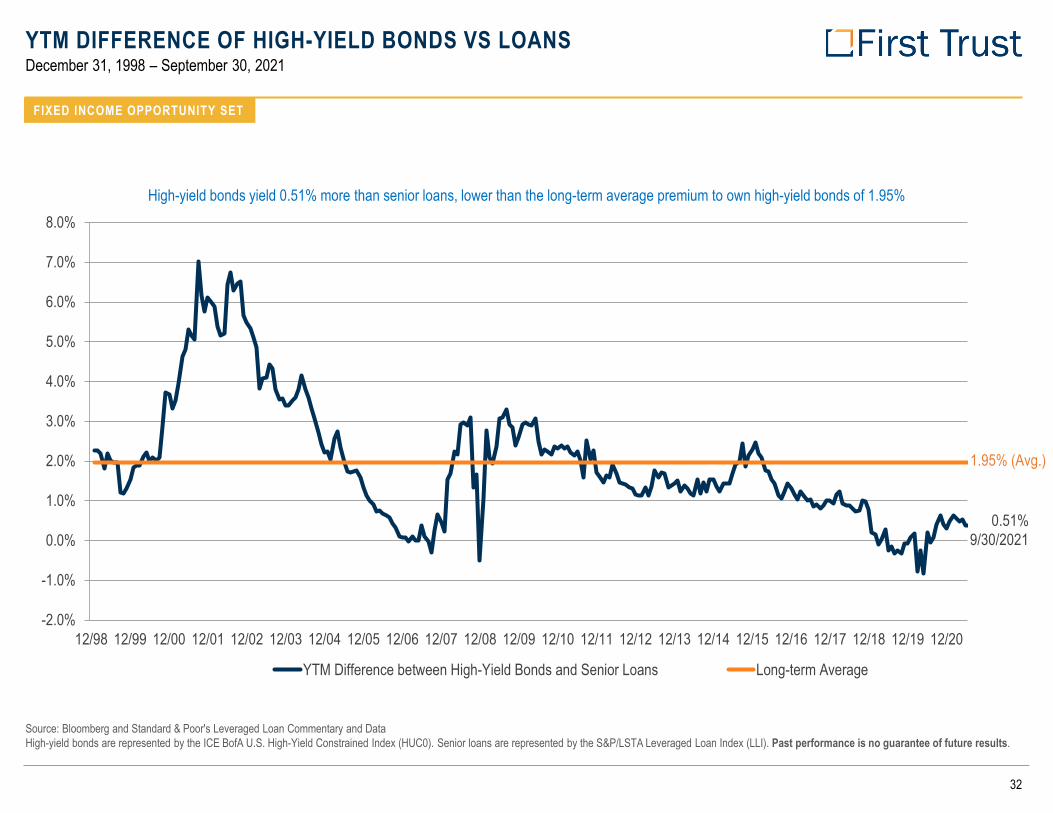
YTM DIFFERENCE OF HIGH-YIELD BONDS VS LOANSDecember 31, 1998 – September 30, 2021
Source: Bloomberg and Standard & Poor's Leveraged Loan Commentary and DataHigh-yield bonds are represented by the ICE BofA U.S. High-Yield Constrained Index (HUC0). Senior loans are represented by the S&P/LSTA Leveraged Loan Index (LLI). Past performance is no guarantee of future results.
FIXED INCOME OPPORTUNITY SET
32
-2.0%
-1.0%
0.0%
1.0%
2.0%
3.0%
4.0%
5.0%
6.0%
7.0%
8.0%
12/98 12/99 12/00 12/01 12/02 12/03 12/04 12/05 12/06 12/07 12/08 12/09 12/10 12/11 12/12 12/13 12/14 12/15 12/16 12/17 12/18 12/19 12/20
YTM Difference between High-Yield Bonds and Senior Loans Long-term Average
1.95% (Avg.)
0.51%9/30/2021
High-yield bonds yield 0.51% more than senior loans, lower than the long-term average premium to own high-yield bonds of 1.95%
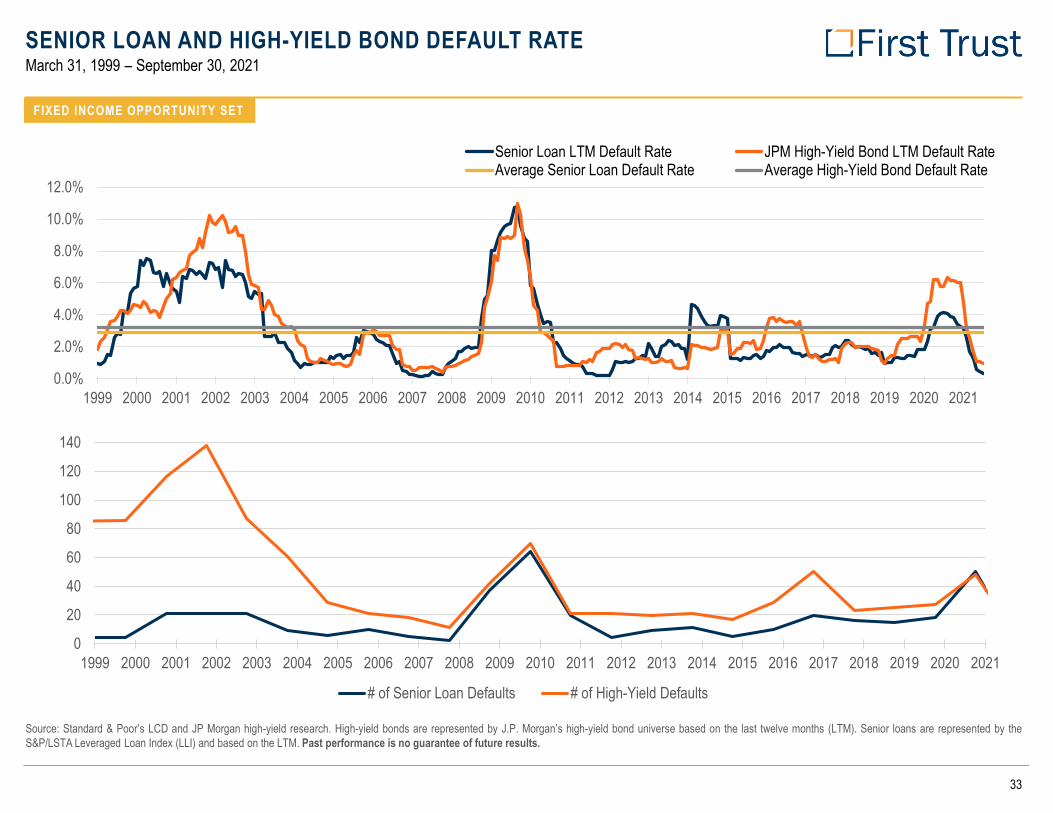
SENIOR LOAN AND HIGH-YIELD BOND DEFAULT RATEMarch 31, 1999 – September 30, 2021
Source: Standard & Poor’s LCD and JP Morgan high-yield research. High-yield bonds are represented by J.P. Morgan’s high-yield bond universe based on the last twelve months (LTM). Senior loans are represented by theS&P/LSTA Leveraged Loan Index (LLI) and based on the LTM. Past performance is no guarantee of future results.
FIXED INCOME OPPORTUNITY SET
33
0.0%
2.0%
4.0%
6.0%
8.0%
10.0%
12.0%
1999 2000 2001 2002 2003 2004 2005 2006 2007 2008 2009 2010 2011 2012 2013 2014 2015 2016 2017 2018 2019 2020 2021
Senior Loan LTM Default Rate JPM High-Yield Bond LTM Default RateAverage Senior Loan Default Rate Average High-Yield Bond Default Rate
0
20
40
60
80
100
120
140
1999 2000 2001 2002 2003 2004 2005 2006 2007 2008 2009 2010 2011 2012 2013 2014 2015 2016 2017 2018 2019 2020 2021
# of Senior Loan Defaults # of High-Yield Defaults
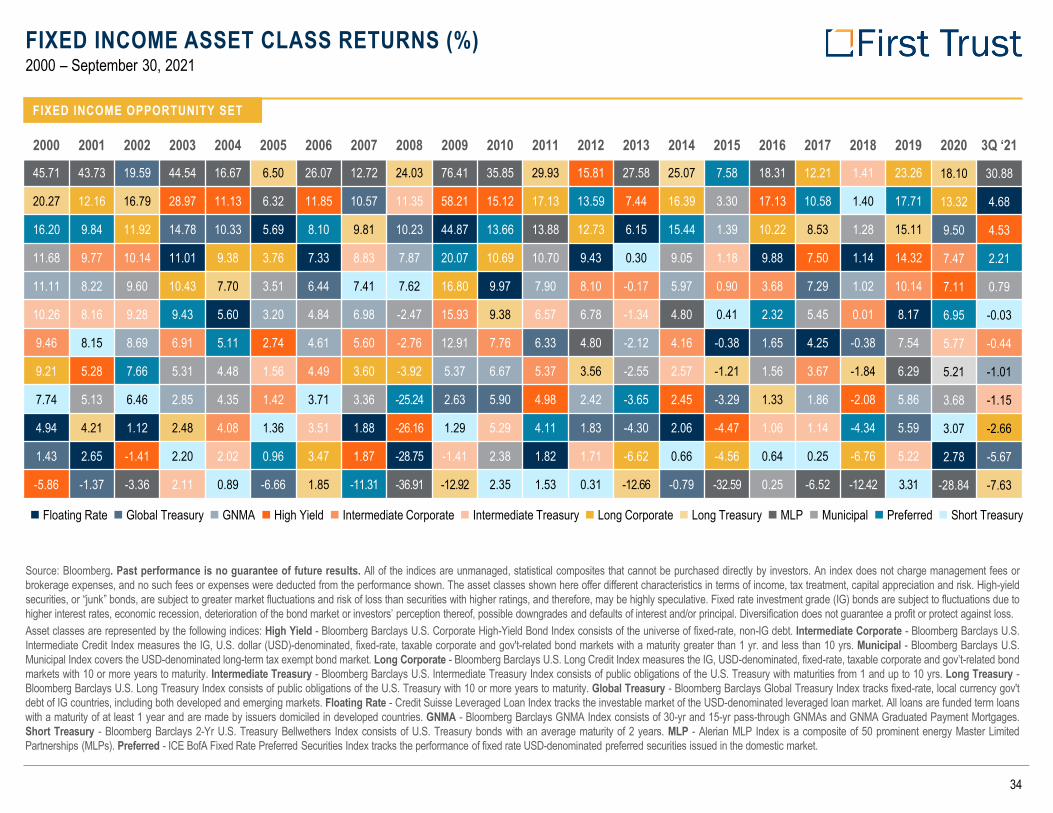
FIXED INCOME ASSET CLASS RETURNS (%)2000 – September 30, 2021
Source: Bloomberg. Past performance is no guarantee of future results. All of the indices are unmanaged, statistical composites that cannot be purchased directly by investors. An index does not charge management fees orbrokerage expenses, and no such fees or expenses were deducted from the performance shown. The asset classes shown here offer different characteristics in terms of income, tax treatment, capital appreciation and risk. High-yieldsecurities, or “junk” bonds, are subject to greater market fluctuations and risk of loss than securities with higher ratings, and therefore, may be highly speculative. Fixed rate investment grade (IG) bonds are subject to fluctuations due tohigher interest rates, economic recession, deterioration of the bond market or investors’ perception thereof, possible downgrades and defaults of interest and/or principal. Diversification does not guarantee a profit or protect against loss.Asset classes are represented by the following indices: High Yield - Bloomberg Barclays U.S. Corporate High-Yield Bond Index consists of the universe of fixed-rate, non-IG debt. Intermediate Corporate - Bloomberg Barclays U.S.Intermediate Credit Index measures the IG, U.S. dollar (USD)-denominated, fixed-rate, taxable corporate and gov't-related bond markets with a maturity greater than 1 yr. and less than 10 yrs. Municipal - Bloomberg Barclays U.S.Municipal Index covers the USD-denominated long-term tax exempt bond market. Long Corporate - Bloomberg Barclays U.S. Long Credit Index measures the IG, USD-denominated, fixed-rate, taxable corporate and gov’t-related bondmarkets with 10 or more years to maturity. Intermediate Treasury - Bloomberg Barclays U.S. Intermediate Treasury Index consists of public obligations of the U.S. Treasury with maturities from 1 and up to 10 yrs. Long Treasury -Bloomberg Barclays U.S. Long Treasury Index consists of public obligations of the U.S. Treasury with 10 or more years to maturity. Global Treasury - Bloomberg Barclays Global Treasury Index tracks fixed-rate, local currency gov'tdebt of IG countries, including both developed and emerging markets. Floating Rate - Credit Suisse Leveraged Loan Index tracks the investable market of the USD-denominated leveraged loan market. All loans are funded term loanswith a maturity of at least 1 year and are made by issuers domiciled in developed countries. GNMA - Bloomberg Barclays GNMA Index consists of 30-yr and 15-yr pass-through GNMAs and GNMA Graduated Payment Mortgages.Short Treasury - Bloomberg Barclays 2-Yr U.S. Treasury Bellwethers Index consists of U.S. Treasury bonds with an average maturity of 2 years. MLP - Alerian MLP Index is a composite of 50 prominent energy Master LimitedPartnerships (MLPs). Preferred - ICE BofA Fixed Rate Preferred Securities Index tracks the performance of fixed rate USD-denominated preferred securities issued in the domestic market.
34
Floating Rate Global Treasury GNMA High Yield Intermediate Corporate Intermediate Treasury Long Corporate Long Treasury MLP Municipal Preferred Short Treasury
FIXED INCOME OPPORTUNITY SET
2000 2001 2002 2003 2004 2005 2006 2007 2008 2009 2010 2011 2012 2013 2014 2015 2016 2017 2018 2019 2020 3Q ‘21
45.71 43.73 19.59 44.54 16.67 6.50 26.07 12.72 24.03 76.41 35.85 29.93 15.81 27.58 25.07 7.58 18.31 12.21 1.41 23.26 18.10 30.88
20.27 12.16 16.79 28.97 11.13 6.32 11.85 10.57 11.35 58.21 15.12 17.13 13.59 7.44 16.39 3.30 17.13 10.58 1.40 17.71 13.32 4.68
16.20 9.84 11.92 14.78 10.33 5.69 8.10 9.81 10.23 44.87 13.66 13.88 12.73 6.15 15.44 1.39 10.22 8.53 1.28 15.11 9.50 4.53
11.68 9.77 10.14 11.01 9.38 3.76 7.33 8.83 7.87 20.07 10.69 10.70 9.43 0.30 9.05 1.18 9.88 7.50 1.14 14.32 7.47 2.21
11.11 8.22 9.60 10.43 7.70 3.51 6.44 7.41 7.62 16.80 9.97 7.90 8.10 -0.17 5.97 0.90 3.68 7.29 1.02 10.14 7.11 0.79
10.26 8.16 9.28 9.43 5.60 3.20 4.84 6.98 -2.47 15.93 9.38 6.57 6.78 -1.34 4.80 0.41 2.32 5.45 0.01 8.17 6.95 -0.03
9.46 8.15 8.69 6.91 5.11 2.74 4.61 5.60 -2.76 12.91 7.76 6.33 4.80 -2.12 4.16 -0.38 1.65 4.25 -0.38 7.54 5.77 -0.44
9.21 5.28 7.66 5.31 4.48 1.56 4.49 3.60 -3.92 5.37 6.67 5.37 3.56 -2.55 2.57 -1.21 1.56 3.67 -1.84 6.29 5.21 -1.01
7.74 5.13 6.46 2.85 4.35 1.42 3.71 3.36 -25.24 2.63 5.90 4.98 2.42 -3.65 2.45 -3.29 1.33 1.86 -2.08 5.86 3.68 -1.15
4.94 4.21 1.12 2.48 4.08 1.36 3.51 1.88 -26.16 1.29 5.29 4.11 1.83 -4.30 2.06 -4.47 1.06 1.14 -4.34 5.59 3.07 -2.66
1.43 2.65 -1.41 2.20 2.02 0.96 3.47 1.87 -28.75 -1.41 2.38 1.82 1.71 -6.62 0.66 -4.56 0.64 0.25 -6.76 5.22 2.78 -5.67
-5.86 -1.37 -3.36 2.11 0.89 -6.66 1.85 -11.31 -36.91 -12.92 2.35 1.53 0.31 -12.66 -0.79 -32.59 0.25 -6.52 -12.42 3.31 -28.84 -7.63

S&P 500 Core Bonds Senior Loans
High-Yield Bonds Preferreds EM U.S.
Convertibles U.S. MBS Municipals IG Corporates
U.S. Treasury MLPs Commodities
S&P 500 1.00
Core Bonds -0.01 1.00
Senior Loans 0.65 0.08 1.00
High-Yield Bonds 0.75 0.24 0.87 1.00
Preferreds 0.58 0.45 0.64 0.72 1.00
EM 0.56 0.46 0.65 0.80 0.65 1.00
U.S. Convertibles 0.84 0.08 0.72 0.77 0.55 0.56 1.00
U.S. MBS -0.16 0.85 -0.17 0.01 0.27 0.27 -0.08 1.00
Municipals 0.05 0.73 0.28 0.35 0.48 0.57 0.15 0.60 1.00
IG Corporates 0.24 0.91 0.37 0.51 0.64 0.64 0.30 0.64 0.69 1.00
U.S. Treasury -0.34 0.89 -0.33 -0.18 0.10 0.08 -0.26 0.82 0.55 0.66 1.00
MLPs 0.70 0.07 0.75 0.72 0.59 0.48 0.66 -0.10 0.12 0.32 -0.27 1.00
Commodities 0.49 -0.09 0.54 0.62 0.33 0.49 0.51 -0.17 0.06 0.08 -0.34 0.49 1.00
Ann. Volatility
13.26
2.99
5.20
6.81
5.69
7.52
12.27
2.04
3.61
4.82
3.57
29.81
13.29
June 30, 2011 – September 30, 2021ASSET CLASS CORRELATION
Source: Morningstar. Past performance is no guarantee of future results. Volatility is based on standard deviation which is a measure of price variability (risk). Core Bonds are represented by the Bloomberg Barclays U.S.Aggregate Bond Index; Senior Loans are represented by the S&P/LSTA Leveraged Loan Index; High-Yield Bonds are represented by the ICE BofA U.S. High Yield Constrained Index; Preferreds are represented by the ICE BofAFixed Rate Preferred Securities Index; EM is represented by the ICE BofA U.S. Emerging Markets External Sovereign Index; U.S. Convertibles are represented by the ICE BofA U.S. Convertible Index; U.S. MBS is represented bythe Bloomberg Barclays U.S. MBS Index; Municipals are represented by the Bloomberg Barclays Municipal Bond Index; IG Corporates are represented by the Bloomberg Barclays U.S. Corporate Investment Grade Index; U.S.Treasury is represented by the Bloomberg Barclays U.S. Treasury Index; MLPs are represented by the Alerian MLP Index; Commodities are represented by the Bloomberg Commodity Index.
FIXED INCOME OPPORTUNITY SET
35First Trust Portfolios L.P. | Member SIPC | Member FINRA | 1-800-621-1675 | www.ftportfolios.com | MISCCRFI1021
DEFINITIONS
36
CBOE S&P 500 3-Month Volatility Index – VIX3M is designed to be a constant measure of 3-month implied volatility of the S&P 500.Citi Economic Surprise United States Index – Measures data surprises relative to market expectations.Convertibles – ICE BofA US Convertible Bonds TR USD tracks the performance of publicly issued U.S. dollar denominated convertible securities of U.S. companies.DJIA – Dow Jones Industrial Average® (The Dow®) is a price-weighted measure of 30 U.S. blue-chip companies. The index covers all industries except transportation and utilities.Emerging Markets – ICE BofA U.S. Emerging Markets External Sovereign Index tracks the performance of U.S. dollar emerging markets sovereign debt publicly issued in the U.S. and Eurobond markets.Government Debt (Agency & Treasury) – Bloomberg Barclays U.S. Government Index consists of Securities issued by the U.S. Government.Government Debt (Agency & Treasury) – ICE BofA U.S. Treasury & Agency Index tracks the performance of U.S. dollar denominated U.S. Treasury and non-subordinated U.S. agency debt issued in theU.S. domestic market.High-Yield Bonds – ICE BofA U.S. High Yield Constrained Index (HUC0) tracks the performance of U.S. dollar denominated below investment grade corporate debt publicly issued in the U.S. domesticmarket but caps issuer exposure at 2%.High-Yield Bonds – J.P. Morgan Global High Yield Indices consist of fixed income securities of domestic and foreign issuers with a maximum credit rating of BB+ or Ba1.High-Yield Municipal Bonds – ICE BofA U.S. Municipal Index tracks the performance of U.S. dollar denominated below investment grade tax-exempt debt publicly issued by U.S. states and territories,and their political subdivisions, in the U.S. domestic market.Institutional Preferreds – ICE BofA US Investment Grade Institutional Capital Securities Index tracks the performance of U.S. dollar denominated investment grade hybrid capital corporate and preferredsecurities publicly issued in the U.S. domestic market.Investment Grade Corporates – Bloomberg Barclays U.S. Corporate Investment Grade Index tracks publicly issued, SEC-registered, U.S. corporate and specified foreign debentures and secured notesthat have a maturity greater than one year, at least $250 M outstanding par balance, and rated Baa3/BBB- or higher.Investment Grade Corporate Bonds – ICE BofA U.S. Corporate Index tracks the performance of U.S. dollar denominated investment grade (BBB/Baa-rated or better) corporate debt publicly issued in theU.S. domestic market.Mortgage-Backed Securities – Bloomberg Barclays U.S. Mortgage Backed Securities Index tracks agency mortgage backed pass-through securities (both fixed-rate and hybrid ARM) guaranteed byGinnie Mae, Fannie Mae, and Freddie Mac.Mortgage-Backed Securities – ICE BofA U.S. Mortgage Backed Securities Index tracks the performance of U.S. dollar denominated fixed rate and hybrid residential mortgage pass-through securitiespublicly issued by U.S. agencies in the U.S. domestic market.Municipal Bonds – Bloomberg Barclays Municipal Bond Index tracks the performance of the tax-exempt bond market.Municipal Bonds – ICE BofA U.S. Municipal High Yield Securities Index tracks the performance of U.S. dollar denominated investment grade tax-exempt debt publicly issued by U.S. states and territories,and their political subdivisions, in the U.S. domestic market.Senior Loans – S&P/LSTA Leveraged Loan Index (LLI) is designed to track the current outstanding balance and spread over LIBOR for fully funded term loans.S&P 500 Index – An unmanaged index of 500 stocks used to measure large-cap U.S. stock market performance..Treasury Inflation Protected Securities (TIPS) – Bloomberg Barclays U.S. Treasury TIPS 1-5 Year Index measures the performance of inflation-protected public obligations of the U.S. Treasury thathave a remaining maturity of less than five years.U.S. Aggregate – Bloomberg Barclays U.S. Aggregate Bond Index is a broad-based flagship benchmark that measures the investment grade, U.S. dollar-denominated, fixed-rate taxable bond market,including Treasuries, government-related and corporate securities, MBS, ABS and CMBS.VIX Index – The VIX Index is the financial benchmark designed to be an up-to-the-minute market estimate of the expected volatility of the S&P 500 Index, and is calculated by using the midpoint of real-time S&P 500 Index option bid/ask quotes.

First Trust Portfolios L.P. | 1-800-621-1675 | www.ftportfolios.com