Embed Size (px)
Citation preview
UNITED STATES INTERNATIONAL TRADE COMMISSION
CLEAR POLYMETHYL METHACRYLATE OF PELLET, POWDER, FLAKE, GRANULAR, OR SIMILAR FORMS FRDM JAPAN
Determination of No Injury or Likelihood Thereof in Investigation No. AA1921-153 Under the Antidumping
Act, 1921, as Amended, Together With the Information Obtained in the
Investigation
USITC Publication 780 Washington, D. C.
June 1976
UNITED STATES INTERNATIONAL TRADE COMMISSION
COMMISSIONERS
Will E. Leonard, Chairman Daniel Minchew, Vice Chairman George M. Moore Catherine Bedell Joseph 0. Parker Italo H. Ablondi
Kenneth R. Mason, Secretary to the Commission
Address all communications to United States International Trade Commission
Washington, _D. C. 20436
FOR RELEASE June 21, ·1976
CONTACT: Robert Childers (202) 523-0161
USITC 76-061
. USITC FINDS NO INJURY IN PMMA DUMPING CASE
The United States International Trade Commission today
notified the Secretary of the Treasury that it has determined
that there is no injury, or likelihood of injury, to an in-
dustry in the United States from imports of polymethyl meth
acrylate (PMMA) from Japan being sold at less than fair value.
All five of the participating Commissioners--Will E.
Leonard, Daniel Minchew, Catherine Bedell, lloseph o. Parker,
and Italo H. Ablondi--concurred in the decision. Commissioner
George M. Moore did not participate.
, As a result of the Commission's determination, no dumping
duti.es wiJl be placed on the imports of PMMA from Japan. On
Marc.h 19, ·· 1976, the USITC received advice from the Treasury
Depa~tmerrt that PMMA of pellet, powder, flake, granular, or . . .
similar forms from Japan is being or is lfkely to be sold
in the Un~t~d States at less than fair valu~. On March 30,
1916, the~Com~ission instituted an investigation to determine
whether an industry in the United States is being or is likely
fo be injured, or is prevented from being e·stablished as a
( more
-USitC FINDS NO 1NJUR~ IN PMMA ~UM~ING CASE
2 . .
res~lt of these import~. Th~ investigation in~luded a public
hearing and extensive staff inquiries, and the Commission con
sidered numerous exhibits and written statements in arriving
at today's decision.
PMMA polymer resins are colorless synthetic, thermoplastic
materials and are commercially the single most important of
the acrylic resi'ns. They are used as a glazing material on
~uildings and mot~r vehicles, for-taillight lenses on motor -
vehicles, and for luminous ceiling panels.
Expcirts of PMMA polymer resins from Japan to the United
S t ~ t e s a mo u n t e d to a b o u t 1 , 3 8 0 , 0 0 0 p o u n d s i n 1 9 7 5 w h i c h r e p -
reiented about 1.5 percent of U.S. consumption in that year.
The current tariff on PMMA imported into the United States
i.s 1.3 cents per pound plus 10 percent ad valorem.
T~eie are only four domestit prod~cers of PMMA. They
are located in Perinsylvania, Delaware, New Jersey, .and Cali
fornia •. PMMA resins comprise only a small portion of the
·total plastics op·e-rations of the domestic. producers.
_Copies of the Commission is report, Clear P~lymethyl I
,Methacrylate of Pellet, Powder, Flake, Granular, or Similar
Forms from Japan (USlTC Publication 780), containing the views
of the Commissioners and information developed during the
course ~f investigation AA1921-153, may be o~tained from the
Office of the Secreta~y, United States International Trade
C om m_ i s s i o n , 7 O l -E S t re et N W . , Wa s h i n g ton , D • C • 2 0 4 3 6 .
0 0 0
C 0 N T E N T S
Determination of no injury or likelihood thereof----------------Statement of reasons--------------------------------------------lnformat ion obtained in the investigation:
Introduction------------------------------------------------The product:
Description----------------~---------------------------PMMA polymer resiris---------------------------------PMMA copolymer resins------------------------------
Uses: PMMA polymer resins---------------------------------PMMA copolymer resins-------------------------------
U .S. tariff treatment-----------------------------------Treasury finding of sales at less than fair value:
Summary------------------------------------------------Home market price--------------------------------------Purchase price------------------------------------------
Domestic industry-------------------------------------------Consideration of injury or likelihood thereof by reason of
LTFV sales: U.S. consumption, production, domestic sales, and
foreign trade---------------------------------------Market penetration of LTFV sales-----------------------The Japanese industry:
PMMA polymer resins--------------------------------MMA monomer-----------------------------------------
Emp loymen t-------------------·--------------------------Evidence of lost sales by domestic producers to
imports-----------------------------------------------Prices:
General economic conditions in the U.S. plastics industry------------------------------------------
Channels of distribution and pricing practices: Imports from Japan----------------~------------U .S. producers----------------------------------
Price comparison of domestic and imported (Japanese) PMMA polymer resins, January-1973-March 1976:
. January-July 1973-----------------------------August 1973-May 1974--------------------------June-October 1974-----------------------------
The distress sale of December 1974---------LTFV sales, January-June 1975--------------July-December 1975--------------~-----------1976----------------------------------------
1
1 3
A-1
A-3 A-3 A-4
A-5 A-6 A-6
A-8 A-9
A-10 A-11
A-17 A-23
A-26 A-28 A-29
A-31
A-34
A-34 A-35
A-36 A-36 A-36 A-39 A-40 A-40 A-40
l. l.
CONTENTS
Information obtained in the investigation--Continued Consideration of injury or likelihood thereof by reason of
LTFV sales--Continued Prices--Continued
Price suppression and/or depression--------------Factors other th_an price:
Allocation in the domestic industry----------Preferability of domestically-produced PMMA
polymer resins-------------~----------------Quality considerations------------------------The recession---------------------------------Compet it ion from other domestic and foreign
producers-----------------------------------Prof it-and- loss experience of domestic producers-----------Appendix A. Glossary of terms------------------------------
Tables
l. · PMMA polymer resins: U.S. capacity, production, and industry utilization of capacity, 1971-75, January-June 1974, January-June 1975, and January-March 1976-----------
2. Methyl methacrylate (MMA) monomer: Domestic producers, plant locations, and capacities, 1975---------------------
3. Methyl methacrylate monomer: U.S. production and U.S. producers' sales, by companies, 1971-75------------------
4. Methyl methacrylate monomer: U.S. exports, 1973-75----------5. PMMA polymer resins: U.S. production, exports, imports,
apparent c:onsumpt ion, and end-of-period inventories, 1971-75, January-June 1974, January-June 1975, and January-March 1976----------------------------------------
6. · PMMA polymer resins: U.S. production and domestic and export sales, by producers, 1971-75, January-June 1974, January-June 1975, and January-March 1976----------------
7. Acrylic resins: U.S. exports, by principal markets, 19 71-7 5--~------------------------------------.-----------
8. Acrylic resins: U.S. imports, by principal sources, 1971-75--------------------------------------------------
9 Acrylic resins from Japan: Official U.S. i~ports, U.S. imports of PMMA polymer resins as reported by the importers, official Japanese exports of PMMA pqlymer resins to the United States, and U.S. apparent consumption of PMMA polymer resins, 1971-75, January-June 1974, January-June 1975, and January~March 1976----------------
A-41
A-45
A-45 A-47 A-47
A-48 A-50 A-53
A-12
A-14
A-15 A-16
A-18
A-20
A-21
A-22
A-25
111
CONTENTS
Tables--Continued
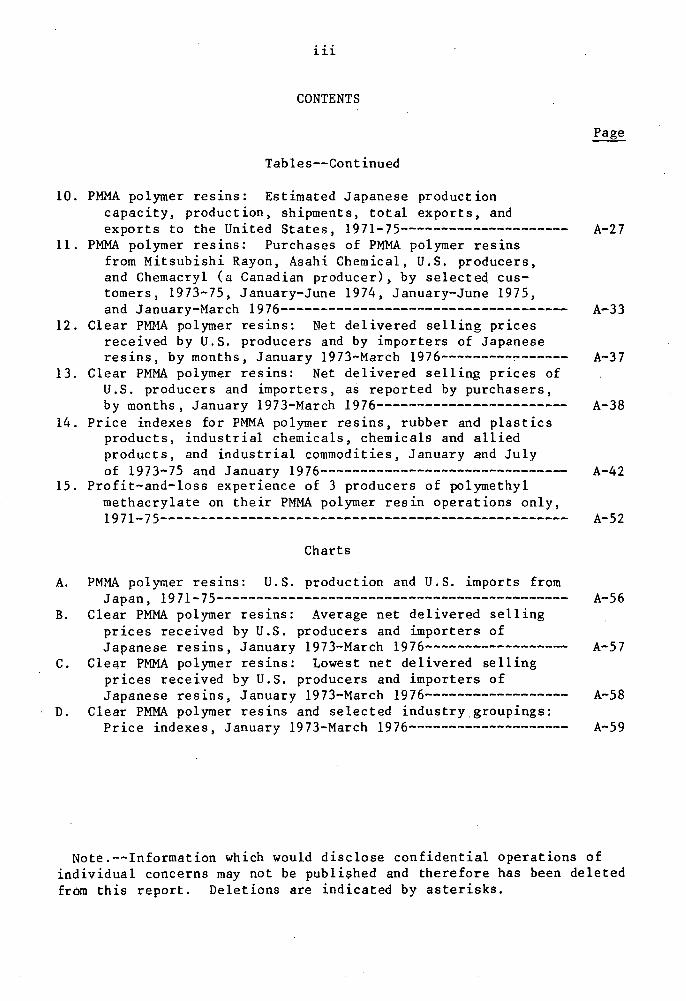
10. PMMA polymer resins: Estimated Japanese production capacity, production, shipments, total exports, and exports to the United States, 1971-75---------------------
11. PMMA polymer resins: Purchases of PMMA polymer resins from Mitsubishi Rayon, Asahi Chemical, U.S. producers, and Chemacryl (a Canadian producer), by selecteq customers, 1973-75, January-June 1974, January-June 1975, and January-March 1976------------------------------------
12. Clear PMMA polymer resins: Net delivered selling prices received by U.S. producers and by importers of Japanese resins, by months, January 1973-March 1976---------~------
13. Clear PMMA polymer resins: Net delivered selling prices of U.S. producers and importers, as reported by purchasers, by months, January 1973-March 1976------------------------
14. Price indexes for PMMA polymer resins, rubber and plastics products, industrial chemicals, chemicals and allied products, and industrial commodities, January and July of 1973-75 and January 1976-------------------------------
15. Profit-and-loss experience of 3 producers of polymethyl methacrylate on their PMMA polymer resin operations only, 1971-75---------------------------------------------------
Charts
A. PMMA polymer resins: U.S. production and U.S. imports from Japan, 1971-75--------------------------------------------
B. Clear PMMA polymer resins: Average net delivered selling prices received by U.S. producers and importers of Japanese resins, January 1973-March 1976-----------------
C. Clear PMMA polymer resins: Lowest net delivered selling prices received by U.S. producers and importers of Japanese resins, January 1973-March 1976-----------------
D. Clear PMMA polymer resins and selected industry groupings: Price indexes, January 1973-March 1976--------------------
A-27
A-33
A-37
A-38
A-42
A-52
A-56
A-57
A-58
A-59
Note.--Information which would disclose confidential operations of individual concerns may not be published and therefore has been deleted from this report. Deletions are indicated by asterisks.

UNITED STATES INTERNATIONAL TRADE COMMISSION Washington, D.C.
[ AA1921-153 ]
CLEAR POLYMETHYL METHACRYLATE OF PELLET, POWDER, FLAKE, GRANULAR OR SIMILAR FORMS
Determination of No Injury or Likelihood Thereof
On March 19, 1976, the United_ States International Trade Com-
mission received advice from the Department of the Treasury that
clear polymethyl methacrylate of pellet, powder, flake, granular or
similar forms from Japan is being, or is likely to be, sold in the
United States at less than fair value within the meaning of the Anti-
dumping Act, 1921, as amended (19 U.S.C. 160(a)). Accordingly, on
March 30, 1976, the Commission instituted investigation .No. AA1921-
153 under section 20l(a) of said act to determine whether an industry
in the United States is being or is likely to be injured, or is
prevented from being established, by reason of the importation of
such merchandise into the United States.
Notice of the institution of the investigation and of the
public hearing was published in the Federal Register of April 5,
1976 (41 F.R. 14435). The hearing was ~ld on May 11, 1976.
In arriving at its determination, the Commission gave due
consideration to written submissions from interested parties, evi-
dence adduced at the hearing., and all factual information obtained
by the Commission's staff from questionnaires, personal interviews,
and other sources.
2
On the basis of its investigation, the Commission}_/ has unanimously
determined that an industry in the United States is not being and is not
likely to be injured, and is not prevented from being established, by
reason of the importation of clear polymethyl methacrylate of pellet,
powder, flake, granular or similar forms from Japan that is being, or
is likely to be, sold at less than fair value within the meaning of the
Antidumping Act, 1921, as amended.
}_/ Commissioner Moore did not participate in the decision.
3
Statement of Reasons
On March 30, 1976, the U.S. International Trade Commission
instituted investigation No. AA1921-153 under section 20l(a) of
the Antidumping Act, 1921, as amended. The investigation was
made to determine whether an industry in the United States
is being or is likely to ~e injured, or is prevented from being
established, by reason of the importation into the United States
of clear polymethyl methacrylate (hereinafter referred to as
PMMA polymer resins) that the Department of the Treasury (Treasury)
has determined is being, or is likely to be, sold at less than fair
value (LTFV) within the meaning of such act. In other words, the
Commission, in order to find affirmatively, must find two
conditions satisfied in this investigation. .First, there must
be injury, or likelihood of injury, to an industry in the United
States,or an industry in the United States must be prevented from
being established. 1/ Second, such injury or likelihood of inj~ry
must be "by reason of" the importation into the United States of
the class or ki.nd of foreign merchandise which the Treasury has
determined is being, or is likely to be, sold at LTFV.
On the basis of the information developed in the investi-
gation we have determined that any injury which the domestic
industry may be experiencing or may be likely to experience is
');/ Prevention of the establishment of an industry is not an issue in the instant case and w~ll not be discussed further.
4
not by reason of LTFV imports. Therefore the.second condition,·
that of causation, has .not been satisfied, and we have made a
negative.determination.
The product
PMMA polymer resins are sy~thetic, thermoplastic resins
(plastics) which are produced by polymerizing methyl metha-
crylate (MMA) monomer. On a resin-content basis they contain
less than 10 percent by weight of comonomer (e.g., ethyl acrylate)
other than MMA. PMMA polymer resins are cast, molded, or extruded
to form glazing materials for buildings and vehicles, taillight
lenses for motor vehicles, luminous ceiling panels, and other
articles for which optical clarity, transparency, and hardness
are desirable properties.
The U.S. industry
In making this determination we have considered the domestic
industry to cons~st of the facilities in the United States used
in the production of PMMA polymer resins. These are the facilities
most likely to be affected by the LTFV imports, and no evidence
was developed during the course of the inv_estig.ation showing that
any other industry in the United States was adversely affected by
such imports. 1/ PMMA polymer resins are produced in the United
]:/ The Commission's investigation developed information on all PMMA resins including copolymer resins. However, the Commission , did not find any imports of PMMA copolymer resins from Japan. Such resins are not substitutable for or directly competitive with PMMA polymer resins and the production lines used in the manufacture of • PMMA polymer resins are separate and distinct from those used in producing copolymer resins.
5
States by three horizontally diversified producers of chemicals
and plastics, and by a fourth company, a vertically integrated
producer of extruded products. The processes and materials used
in producing PMMA polymer resins are similar for the various
producers.
No injury by reason of LTFV imports
All of the U.S. imports of PMMA polymer resins from Japan
that were examined by Treasury during the period of its investi-
gation (January 1-June 30, 1975) were sold at LTFV. Japanese
exports of these resins to the United States declined annually
from 5.9 million pounds in 1971 to 1.2 million pounds in 1974 and
then increased slightly to 1.4 million pounds in 1975. As a share
of apparent U.S. consumption, exports from Japan represented more
than 6 percent of total U.S. consumption in 1971, about 1 percent
in 1974, and about 1.5 percent in 1975. 1/ The sharp decline in
Japanese exports of PMMA polymer resins to the United States and
the very low level of import penetration in 1975, the year in
which Treasury found there were imports at LTFV, make it difficult,
absent unusual circumstances, to establish an identifiable causal
relationship between the LTFV imports and any injury the domestic
industry may be experieneing. Such circumstances are not present
here.
1/ The ratios of Japanese exports of PMMA polymer resins to the United States to U.S. consumption are. shown in this statement rather than the ratios of U.S. imports to U.S. consumption because such imports are not separately reported in official statistics.
6
U.S. producers' domestic shipments of PMMA polymer resins
declined from 131 million pounds in peak year 1973 to about 100
million pounds in 1975, or by more than 30 million pounds. During
the same period, exports of PMMA polymer resins from Japan to the
United States decreased from 1.5 million pounds in 1973 to 1.4
million pounds in 1975. The large drop in U.S. producers'
domestic shipments, most of which occurred in 1975, was attributable
to the economic recession in that year. The two principal markets
for PMMA polymer resins, the automotive and construction industries,
were particularly depressed in 1975. ·Thus, it is evident that
LTFV imports did not cause the sharp decline in U.S. producers'
shipments in 1975.
U.S. producers' prices for PMMA polymer resins declined
slightly during the first half of 1975; thereafter, prices trended
upward, and no substantial evidence was presented which indicated
that the early 1975 decline was by reason of LTFV imports. To.
the contrary, the small quantity of such imports in the U.S.
market supports the conclusion that the price weakness was attrib
utable to intense competition among the U.S~ producers during
a period of depressed demand.
The three largest U.S. producers of PMMA polymer resins provided
the Commission with financial data on their PMMA polymer resin
operations. These producers enjoyed favorable profits during the
period 1971-74, with their annual aggregate net operating profits
ranging from 15 to 26 percent of net sales. The ratio of net
7
operating profits to net sales~declined to· 1.8.percent in 1975.
The profit pattern for PMMA polymer resins was similar to that
reported by the major domestic producers for their overall
plastics operations. The decline in the profitability of the
producers in 1975 was attributable to a sharp decline in sales as
a result of the depressed market-conditions and an accompanying
large increase in raw material costs, and not to LTFV imports.
The number o~ workers engag~d in the production of PMMA
polymer resins increased from 178_ in _1971 to 229 in 1974 and then
declined substantially in ·1975. The trend in employment for the
PMMA polymer resin industry during 1971-75 was similar to that
experienced by the overall, operatiods of the establishments pro
ducing PMMA polymer resins. Thus, the decline in employment which
occurred between 1974 and 1975 could not be attributed to imports
from Japan.
No likelihood of injury by reason of LTFV imports .
The finding above with respect to the role of the subject
LTFV imports in any injury being experienced by the domestic
industry under consideration leads to the conclusion that such.
imports are also not an identifiable cause of any likelihood of
injury which may exist. Although the Japanese PMMA p9lymer
resin industry had substantial unused capacity in 1975, as did the
PMMA ·polymer resin industry in the United States, there· is no
evidence to suggest that there will be any increase.in import penetration.
The. economic: recovery .whi.c,h ... is. underway .. in· Japan. and. th.e. United
8
States will result in greater utilization of capacity in both
countries. There has been no indication of any plans by the
Japanese to expand capacity, and substantial lead time from
instituting construction plans to actual operation is necessary
in this capital-intensive industry. The outlook for increased
consumption of PMMA polymer resins in the United States is
evidenced by the fact that U.S. producers more than doubled
their capacity to produce these resins during 1971-75 and have
.plans to bring additional capacity on stream in late 1976.
Furthermore, U.S. demand for PMMA polymer resins has increased
substantially in 1976, and U.S. producers' domestic shipments
in the first quarter were at an annual rate that was 28 percent
greater than that experienced in 1975.
The ratio of Japanese PMMA polymer resin exports to the
United States to total Japanese exports of PMMA polymer resins
decreased every year from 1971 to 1975. In 1975 only 15 percent of
Japanese exports of PMMA polymer resins went to the United States,
compared with more than 70 percent of such exports in 1971. Ten
major domestic purchasers of PMMA polymer resins tha.t account for
about one-third of total U.S. purchases were contacted by the
Commission during the investigation; none of these firms purchased
any PMMA polymer resins of Japanese origin during the first quarter
of 1976.
The major U.S. producers of PMMA polymer resins are large
diversified corporations with long-esfab1ished business relationships
9
W;ith the U.S. plastics-fabricating companies that are purchasers
of these resins. In addition, three of the four U.S. producers of
PMMA polymer resins produce MMA monomer, the principal raw material
used in producing PMMA polymer resins, and all four U.S. producers
further process MMA monomer or PMMA polymer resins into more
advanced products.
Conclusion
We therefore conclude that an industry in the United States is
not being and is not likely to be injured by reason of the importation
of PMMA polymer resins from Japan that are being, or are likely to
be, sold at LTFV within the meaning of the Antidumping Act, 1921,
as amended.

A-l
INFORMATION OBTAINED IN THE INVESTIGATION
Introduction
On March 19, 1976, the United States International Trade Commi~
s1on received advice from the Department of the Treasury that clear
polymethyl methacrylate of pellet, powder, flake, granular, or similar
forms from Japan is being, or is likely to be, sold in the United
States at less than fair value (LTFV) within the meaning of the
Antidumping Act, 1921, as amended (19 U.S.C. 160(a)). Accord1ngly,
on March 30, 1976, the Commission.instituted investigation No.
AA1921-153 under section 20l(a) of the act, to determine whether an
industry in the United States is being or is likely to be injured,
or is prevented from being established, by reason of the importation
of such polymethyl methacrylate into the United States. By statute
the Commission must render its determination within 3 months of its
receipt of advice from the Department of the Treasury--in thi~ case
by Monday, June 21, 1976.
In connection with the investigation, the Commission conducted
a public hearing on May 11, 1976. Notice of the institution of the
investigation and of the hearing was duly given by posting copies
thereof at the Office of the Secretary, United States International
Trade Commission, Washington, D.C., and at the Commission's New York
Office and by publishing the notice in the Federal Register on
April 5, 1976 (~l F.R. 14435).
A-2
Following the receipt of a complaint from E. I. du Pont de Nemours
and Company, Inc., the Department of the Treasury instituted an
antidumping investigation by publication of an 11 Antidumping Proceeding
Notice" in the Federal Register on June 16, 1975 (40 F.R. 25497).
On June 23, 1975, an 11 Amendment of Antidumping Proceeding Notice,"
limiting the class or kind of merchandise under consideration to clear
polymethyl methacrylate of pellet, powder, flake, granular, or similar
forms, was published in the Federal Register (40 F.R. 26282). On
December 18, 1975, a "Withholding of Appraisement Notice" was published
1n the Federal Register (40 F.R. 58666). The determination of sales
at less than fair value was made on March 18, 1976, .and was published
1n the Federal Register on March 24, 1976 (41 F.R. 12233).
A-3
The Product
Description
Polymethyl methacrylate is a clear (colorless and transparent),
synthetic, thermoplastic resin 1/ known as PMMA resin or simply as
PMMA. PMMA is prepared by polymerizing methyl methacrylate (MMA)
monomer in the presence of a catalyst and/or heat. The yield of
polymer produced, based on monomer used, exceeds 90 percent. MMA,
a colorless, volatile, flammable liquid, is prepared by the reaction
of acetone, hydrogen cyanide,. sulfuric acid, and methanol.
PMMA is not a single, distinct plastic but comprises a group of
products which, in turn, are part of a broader classification of
plastics known as acrylic resins. Acrylic resins are so named
because these resins.are polymers or copolymers of acrylic acid,
methacrylic acid, or esters of these acids (i.e., acrylates and
methacrylates). PMMA is commercially the most important of all the
acrylic res.ins, and it may be divided by the level of comonomer pre-
sent into two distinct use categories, as described below.
PMMA polymer resins
PMMA polymer resins are PMMA resins that contain less than 10
percent by weight, on a resin content basis, of a comonomer (e.g.,
ethyl acrylate) other than MMA. Such resins are referred to in this (;,
report as either PMMA molding and extrusion resins or as PMMA polymer
resins. The comonomer in these resins (usually a:n aq·ylate or another
1/ See appendix A for definition of this and other technical .terms.
A-4
methacrylate) is added principally as a processing aid (e.g., a melt-
flow modifier) and is not added to alter significantly the properties
that PMMA would exhibit if no comonomer were present. The special
properties that give PMMA polymer resins their importance are their
optical clarity and transparency, which compare favorably with those
of glass. Further, these resins are hard, have a high refractive index
(ca. 1.49), and exhibit good resistance to light and aging. Cast,
molded, or extruded products made with clear PMMA polymer resins
exhibit a light transmission of 92 percent, which means that these
resins are as transparent as the best optical glass. PMMA' s light
transmission and clarity can be modified with the addition of a wide
range of transparent, translucent, or opaque colors:
PMMA copolymer resins
PMMA copolymer resins are PMMA resins that contain 10 to 49 per-
cent by weight, on a resin content basis, of a comonomer (e.g., ethyl
methacrylate) other than MMA. !/ These products are referred to
individually in this report as PMMA micro (or bead) polymers, PM}f.A
emulsion polymers, and PMMA solution polymers. They are called copo-
lymer ~esins because the comonomer (usually an acrylate or another 0
methacrylate) is present in such amounts in the final product as to
0 alter in a significant fashion ·some of the basic properties that
PMMA would exhibit if no comonomer were present. These materials are
normally available as dry micro (or bead) polymers <i.e., powders
1/ Products containing more than 50 percent of another comonomer would be classified as copolymers of. the· other comonomer, not as PMMA copolymers.
A-5
with the consistency of flour), in solution (solution polymer), or
as emulsion polymers (latices). The micro (or bead) polymers fre
quently are used in emulsions or solutions. The solution polymers
are frequently converted to thermosetting resins by the addition of
acrylic anhydride, acrylamide, and so forth.
Uses
PMMA polymer resins
Virtually all of PMMA polymer resins are consumed in the manu
facture of molded and extruded products. Industry sources report
that about 75 percent of the annual output of PMMA molding and
extrusion resins consist of clear (colorless and transparent) resins;
the balance consists of resins which have had color added. In the
indu~try these resins are referred to. solely by their chief use, that
is, as molding and extrusion resins.
The principal end-use applications for PMMA polymer resins in
1975 were in the automotive and lighting industries, and in glazing
(i.e., transparent material fitting the door and/or window of a
building or a vehicle) .
. Automotive uses for PMMA molding and extrusion resins include
taillight lenses (reported to be the largest single use in the auto
industry), instrument covers, control dials, and knobs. The major
lighting application for PMMA molding and extrusion resins is in the
manufacture of luminous ceiling panels (i.e., fluorescent-lamp
reftactor lenses). These panels are made from extruded sheet, which
in turn, is made directly from PMMA polymer resin. The major use for
A-6
PMMA molding and extrusion resins in the glazing market has been as
safety glazing in hazardous areas, such as storm doors made from
extruded PMMA sheet. This is a growing use because of the require-
ments of recently enacted safety codes. A wide variety of additional
products made from PMMA polymer resins include highway reflectors,
faucet knobs, and backs of brushes.
PMMA copolymer resins
PMMA emulsion polymers are used mainly in water-based paints
(latices); the emulsion polymers also are used in floor polishes, paper
sizing and coatings, textile manufacturing applications, and so forth.
Organic solutions of PMMA copolymer resins (i.e., solution poiymers)
are used in a wide variety of appliance and automotive coatings (e.g.,
lacquers for automotive topcoats).
U.S. Tariff Treatment
Clear polymethyl methacrylate (PMMA) of pellet, powder, flake,
granular, or similar forms is dutiable under TSUS item 445 .05 (acrylic
and methacrylic acid resins). The column 1 rate of duty 1/ is 1.3
cents per pound plus 10 percent ad valorem; the column 2 rate of duty 2/
is 4 cents per pound plus 30 percent ad valorem. The column 1 rate
of duty, which has been in effect since January 1, 1972, represents
the last of five staged reductions negotiated under the Kennedy Round
1/ The column 1 rate applies to countries .other than designated Communist-dominated countries.
'!:_/ The column 2 rate applies to designated Communist-dominated countries.
A-7
of the General Agreement on Tariffs and Trade. The average ad valorem
equivalent (AVE) for imports in 1975 under TSUS item 445.05 was 12.5
percent.
A-8
Treasury Finding of Sales at Less Than Fair Value
Summary
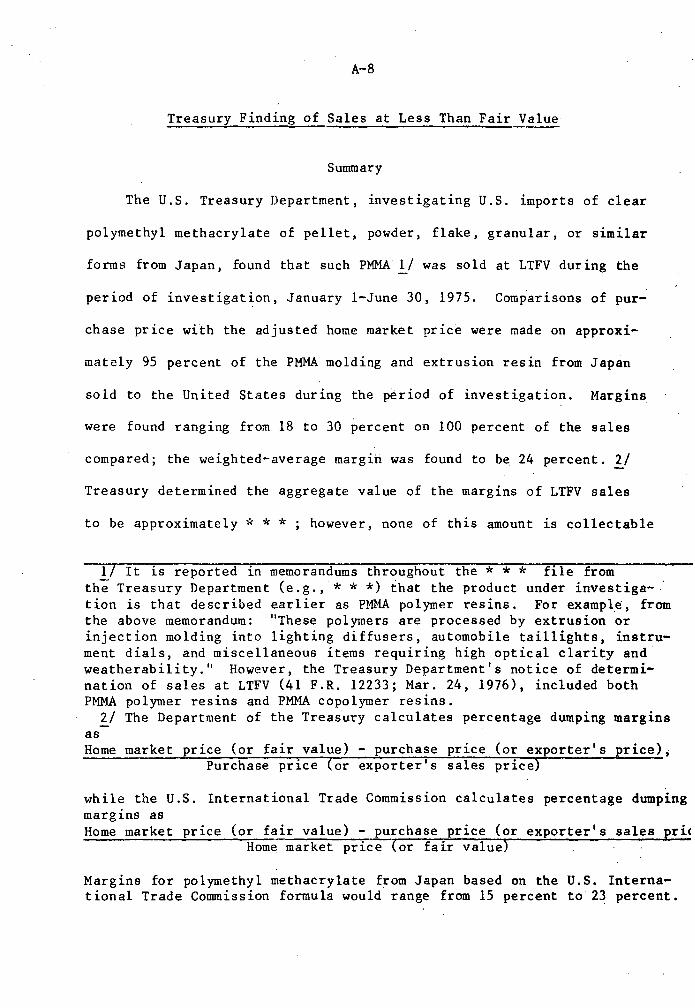
The U.S. Treasury Department, investigating U.S. imports of clear
polymethyl methacrylate of pellet, powder, flake, granular, or similar
forms from Japan, found that such PMMA 1/ was sold at LTFV during the
period of investigation, January 1-June 30, 1975. Comparisons of pur-
chase price wi'th the adjusted home market price were made on approxi-
mately 95 percent of the PMMA molding and extrusion resin from Japan
sold to the United States during the p~riod of investigation. Margins
were found ranging from 18 to 30 percent on 100 percent of the sales
compared; the weighted-average margin was found to be 24 percent. '!:._/
Treasury determined the aggregate value of the margins of LTFV sales
to be approximately * * * ; however, none of this amount is collectable
1/ It is reported in memorandums throughout the * * * file from the Treasury Department (e.g.,***) that the product under investigation is that described earlier as PMMA polymer resins. For example, from the above memorandum: "These polymers are processed by· extrusion or injection molding into lighting diffusers, automobile taillights, instrument dials, and miscellaneous items requiring high optical clarity and weatherability.'' However, the Treasury Department's notice of determination of sales at LTFV (41 F.R. 12233; Mar. 24, 1976), included both PMMA polymer resins and PMMA copolymer resins.
2/ The Department of the Treasury calculates percentage dumping margins as Home market price (or fair value) - purchase price (or exporter's rice),
Purchase price or exporter's sales price
while the U.S. International Trade Commission calculates percentage dumping margins as Home market price (or fair value) - purchase price (or exporter's sales ric
Home. market price or fair value
Margins for polymethyl methacrylate from Japan based on the U.S. International Trade Connnission formula would range from 15 percent to 23 percent.
A-9
because Treasury did not withhold appraisement until December 18, 1975.
All, or virtually all, imports of the subject merchandise from Japan
were manufactured by either Mitsubishi Rayon Co., Ltd., or Asahi Chemi
cal Industry Co., Ltd., both of Tokyo, Japan.
During the period of the Treasury Department's investigation,
only clear grades of PMMA resins were sold in the United States.
Accordingly, the LTFV determination was limited to clear polymethyl
methacrylate (i.e., PMMA polymer resins).
Home Market Price
The home market price was calculated on the basis of the deliv
ered, net, packed price to the distributor. Adjustments were made
for rebates, credit expen~es, transportation, certain technical serv
ice expenses, and packing costs, as appropriate, for merchandise
sold by both manufacturers, in accordance with section 153.8, Customs
Regulations (19 CFR i'53 .8). With respect to sales by Asahi Chemical
Industry Co., Ltd., further adjustments for differences in circum
stances of sales were made for freely offered discounts and rebates
on merchandise, for royalty payments, and for certain sales aids,
including technical brochures, provided for the benefit of purchasers
in later sales. With respect to sales by Mitsubishi Rayon Co., Ltd.,
fu~ther adjustments for differences in circumstances of sales were
made for certain expenses relating to advertis~ng, sales aids, and
technical service brochures incurred for the benefit of purchasers
in later sales, and for rebates actually paid in connection with the
A-10
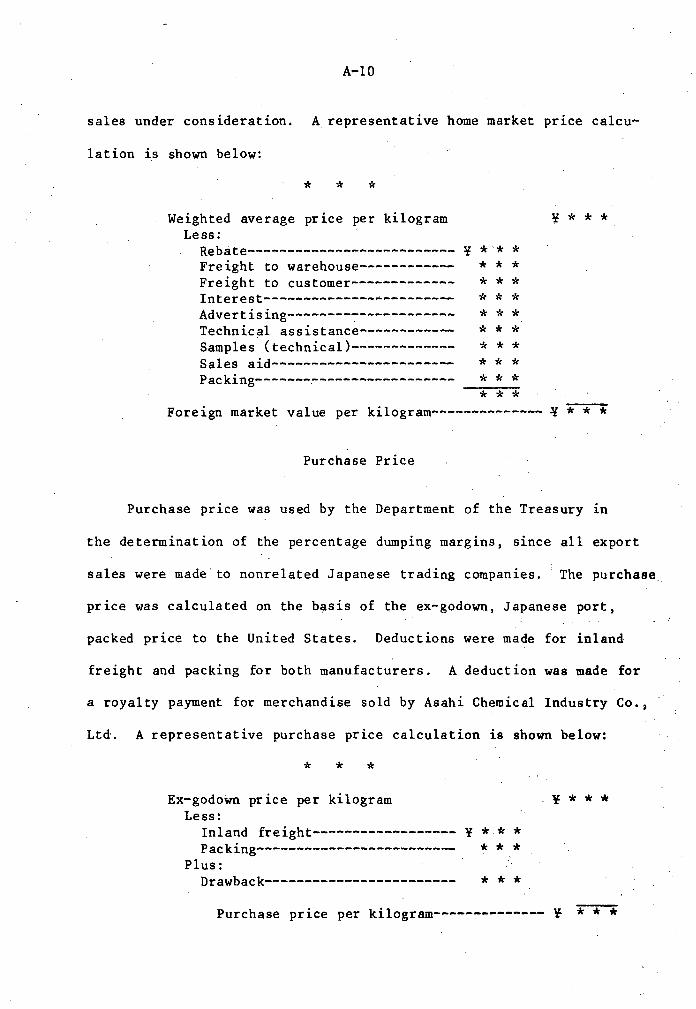
sales under consideration. A representative home market price calcu-
lation is shown below:
* * * Weighted average price per kilogram
Less: Rebate--------------------------Fre ight to warehouse-----------Freight to customer~------------Interest------------------------Advertising--------~-----------Technical assistance-----------Samples (technical)-------------Sales aid----------------------Packing-------~-----------------
¥
¥ * * * *'* * * * * * * * * * * * * * * * * * * * * * * * * * * * *
Foreign market value per kilogram-------------- ¥ * * *
Purchase Price
Purchase price was used by the Department of the Treasury in
the determination of the percentage dumping margins, since all export
sales were made to nonrelated Japanese trading companies. The purchase
price was calculated on the basis of the ex-godown, Japanese port,
packed price to the United States. Deductions were made for inland
freight and packing for both manufacturers. A deduction was made for
a royalty payment for merchandise sold by Asahi Chemical Industry Co.~
Ltd. A representative purchase price calculation is shown below:
* * * Ex-godoWn price per kilogram
Less: Inland freight------------------ ¥ * * * Packing-------------~----------- * * *
Plus: Drawback------------------------ * * *
¥ * * *
Purchase price per kilogram-------------- ¥ * * *
A-11
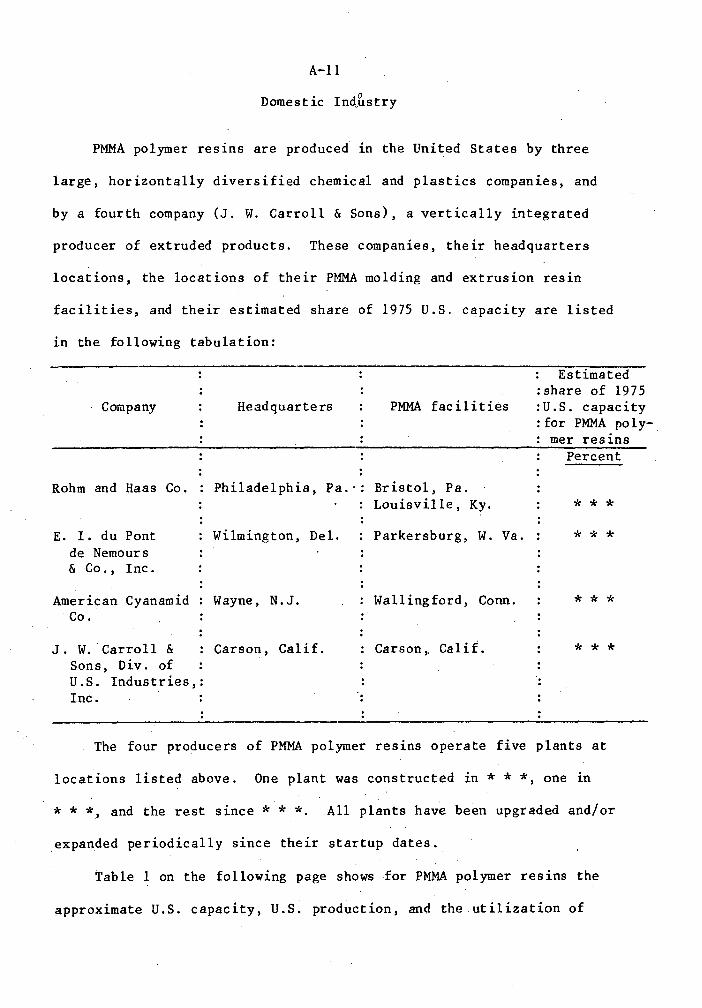
• do Domestic In custry
PMMA polymer resins are produced in the United States by three
large, horizontally diversified chemical and plastics companies, and
by a fourth company (J. W. Carroll & Sons), a vertically integrated
producer of extruded products. These companies, their headquarters
locations, the locations of their PMMA molding and extrusion resin
facilities, and their estimated share of 1975 U.S. capacity are listed
in the following tabulation:
Company
Rohm and Haas Co.
E. I. du Pont de Nemours & Co., Inc.
American Cyanamid . Co.
J. W. ·Carroll & Sons, Div. of U.S. Industries,: Inc.
Headquarters PMMA fac i 1i ties
Philadelphia, Pa.·: Bristol, Pa. Louisville, Ky.
Wilmington, Del. Parkersburg, W. Va.
Wayne, N.J . Wallingford, Conn.
Carson, Calif. Carson,. Calif.
Estimated :share of 1975 :U.S. capacity : for PMMA poly-
mer resins Percent
* * *
* * *
* * *
* * *
The four producers of PMMA polymer resins operate five plants at
locations listed above. One plant was constructed in * * *, one in
* * *, and the rest since * * * All plants have been upgraded and/or
. expanded periodically since their startup dates.
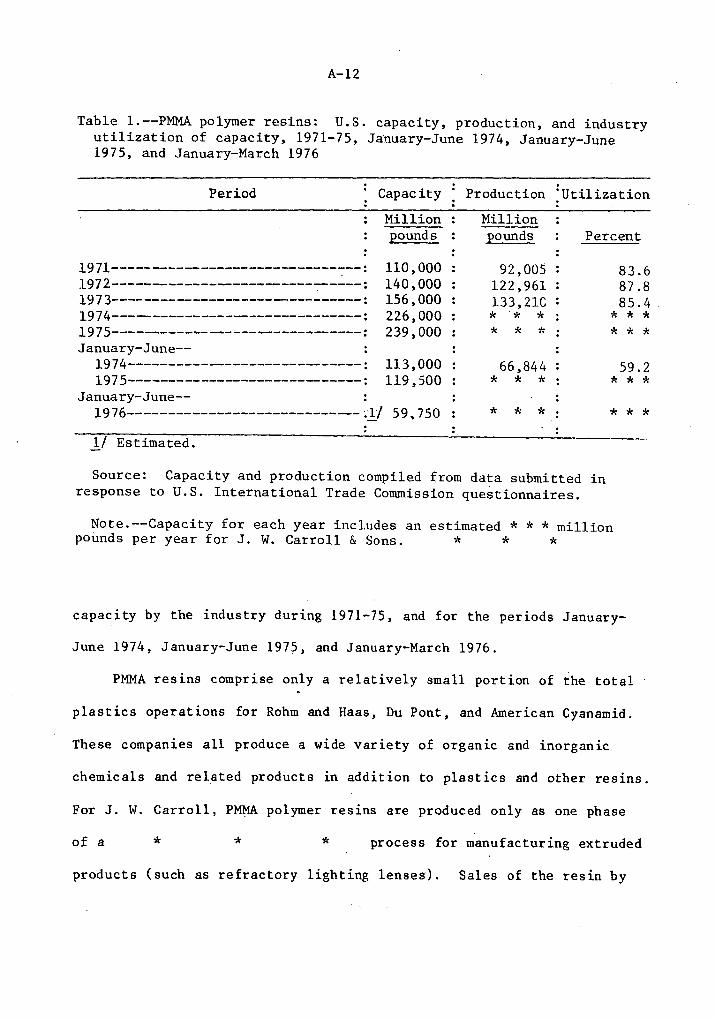
Table 1 on the following page shows .for PMMA polymer resins the
approximate U.S. capacity, U.S. production, and the utilization of
A-12
Table 1.--PMMA polymer resins: U.S. capacity, production, and industry utilization of capacity, 1971-75, January-June 1974, January-June 1975, and January-March 1976
Period Capacity Production "Utilization . Million pounds
Million pounds Percent
1971----------------------------~--:
1972-------------------------~-----: 1973-------------------------------: 1974-------------------------------: 1975-------------------------------: January-June--
1974-----------------------------: 1975------------~---------------:
110,000 140,000 156,000 226,000 239,000
113,000 119,500
January-June--1976--------------------------~-~l/ 59,750
Jj Estimated.
92,005 122,961 133,21C * '* * * * * :
66 ,844-* * * * * *
Source: Capacity and production compiled from data submitted in response to U.S. International Trade Commission questionnaires.
83.6 87.8 85.4
* * * * * *
59.2 * * *
* * *
Note.--Capacity for each year includes an estimated * * * million pounds per year for J. W. Carroll & Sons. * * *
capacity by the industry during 1971-75, and for the periods January-
June 1974, January-June 1975, and January-March 1976.
PMMA resins comprise only a relatively small portion of the total
plastics operations for Rohm and Haas, Du Pont, and American Cyanamid.
These companies all produce a wide variety of organic and inorganic
chemicals and rel_ated products in add it ion to plastics and other resins.
For J. W. Carroll, PMMA polymer resins are produced only as one phase
of a * * * process for manufacturing extruded
products (such as refractory lighting lenses). Sales of the resin by
A-13
this firm occur only when it has an excess after supplying its own
captive requirements; * * * Of the four PMMA polymer resin producers, Rohm and Haas, Du Pont,
and American Cyanamid produce their o~m MMA monomer from acetone,
methanol, sulfuric acid, and hydrogen cyanide. J. W. Carroll either
imports MMA monomer or purchases it from one of the three domestic MMA
producers. All three MMA producers have captive supplies of hydrogen
cyanide and sulfuric acid. Both Du Pont and Rohm and Haas also produce
methanol, but none of the companies produce acetone. Annual U.S.
production capacity for MMA in 1975 totaled 870 million pounds, as
shown in table 2, on the following page.
The MMA producers annually consumed about * * * percent of their
own production of MMA monomer during 1971-75. Overall, about* * *
percent of intracompany consumption of MMA monomer was used to produce
cell cast and continous cast acrylic sheet. In producing the cast
sheet, the monomer is polymerized in situ and never takes the shape
of resin of pellet, powder, flake, granular, or similar forms; there
fore, cast PMMA sheet is not within the scope of this investigation.
About * * *percent of the monomer was consumed in surface coatings;
and about * * * percent went into polishes, textiles, and paper. The
other * * * percent was used to produce PMMA polymer resins or PMMA
copolymer resins, or to modify other plastic resins.
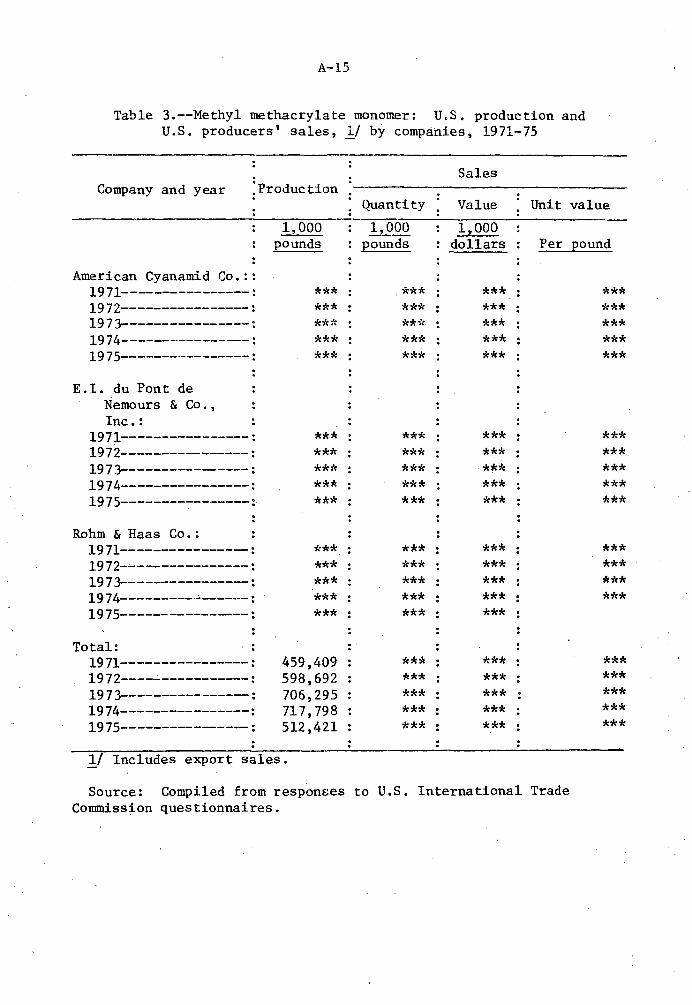
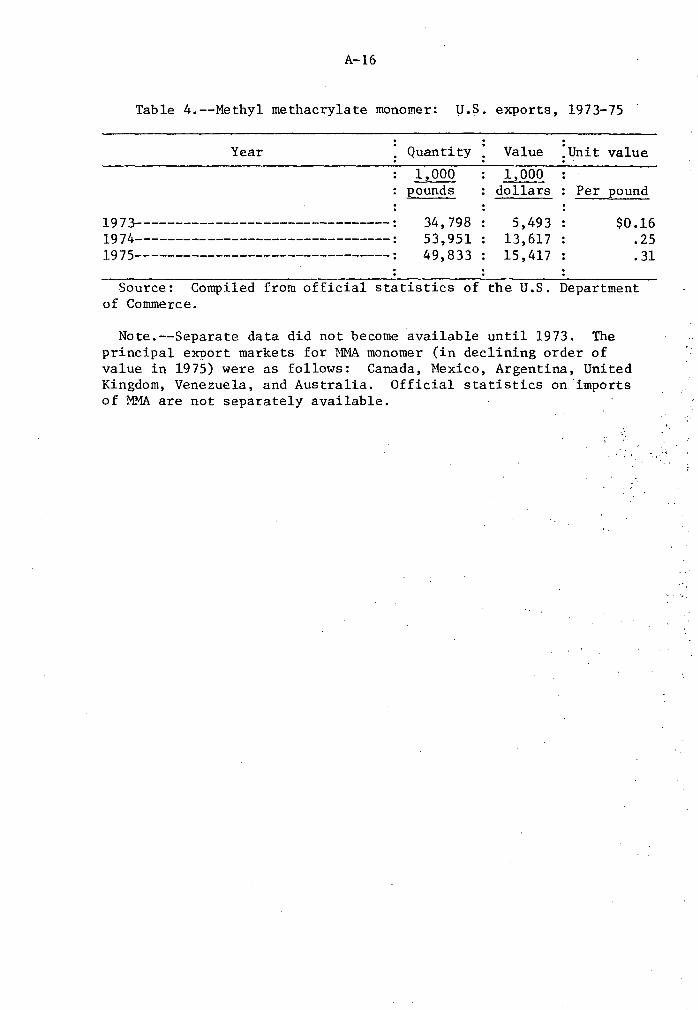
Statistics on U.S. production and exports of MMA are shown in
table 3 (p. A-15) and table 4 (p. A:-16), respectively.
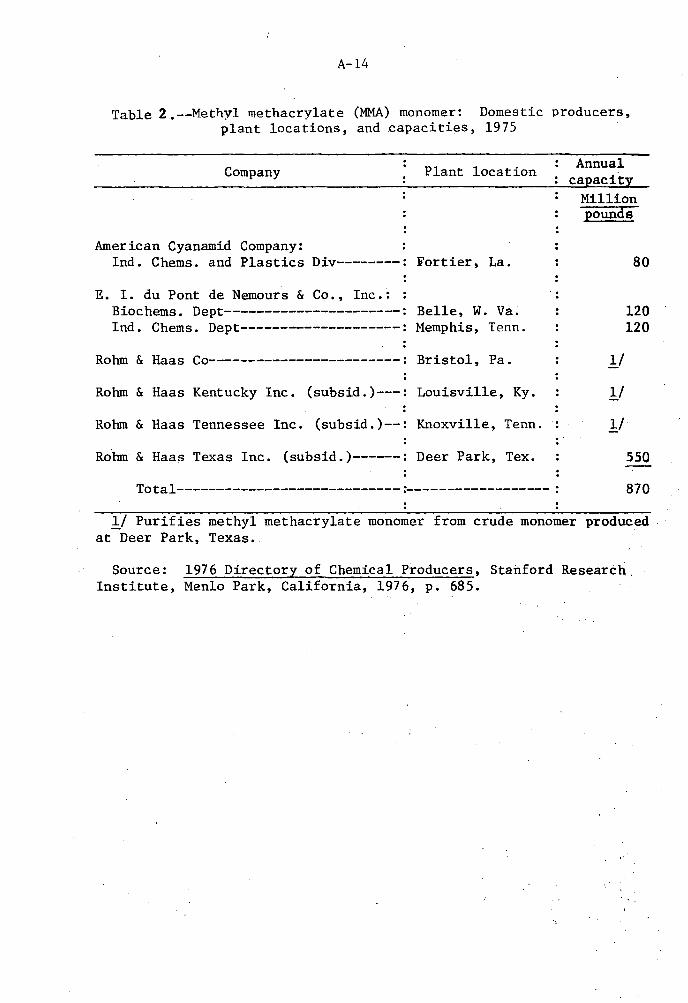
A-14
Table 2.--Methyl methacrylate (MMA) monomer: Domestic producers, plant locations, and capacities, 1975
Company Plant location
American Cyanamid Company: Ind. Chems. and Plastics Div--------: Fortier, La.
E. I. du Pont de Nemours & Co., Inc.: : Biochems. Dept----------------------: Belle, W. Va: Ind. Chems. Dept--------------------: Memphis, Tenn.
Rohm & Haas Co------------------------: Bristol, Pa.
Rohm & Haas Kentucky Inc. (subsid. )---: Louisville, Ky.
Rohm & Haas Tennessee Inc. (subsid. )-- : Knoxville, Tenn. .. . .
Rohm & Haas Texas Inc. (subsid.)------: Deer Park, Tex.
Total----------------------------:------------------:
Annual capacity
Million pounds
80
120 120
!/
!/
):_/
550
870
!/ Purifies methyl methacrylate monomer from crude monomer produced at Deer Park, Texas.
Source: 1976 Directory of Chemical Producers, Stanford Research. Institute, Menlo Park, California, 1976, p. 685.
A-15
Table 3.--Methyl methacrylate monomer: U.S. production and U.S. producers' sales, l/ by companies, 1971-75
. Company and year :Production
American Cyanamid Co.:: 1971----------------: 1972----------------: 1973----------------: 1974----------------: 1975----------------:
E.I. du Pont de Nemours & Co. , Inc.:
1971----------------: 1972----------------: 1973----------------: 1974----------------: 1975--------~-------:
Rohm & Haas Co.: : 1971--------------~:
1972----------------: 19 7 3----------------: 19 7 4---------·-"------: 1975------------~--:
Total: 1971----------------: 1972----------------: 1973----------------: 1974----------------: 1975----------~--~:
1,000 pounds
*** *** *** *** ***
*** *** *** *** ***
*** *** *** *** ***
459,409 598,692 706,295 717,798 512,421
l./ Includes export sales.
Sales
Quantity Value Unit
l,OOQ 1,000 pounds dollars Per
*** *** : *** *** *** *** *** *** *** ***
*** *** *** *** *** *** *** *** *** ***
*** *** *** *** *** *** *** *** *** ***
.. *** *** *** *** *** *** *** *** *** ***
Source: Compiled from responses to U.S. International Trade Commission questionnaires.
value
Eound
*** *** *** *** ***
*** *** *** *** ***
*** *** *** ***
*** *** *** *** ***
A-16
Table 4.--Methyl methacrylate monomer: U.S. exports, 1973-75
Year Quantity Value :unit value .. 1,000 1,000
pounds dollars Per pound
1973--------------------------------: 1974--------------------------------: 1975--------------------------------:
34,798 5,493 $0.16 53,951 13,617 .25 49,833 15,417 .31
Source: Compiled from official statistics of the U.S. Department of Commerce.
Note.--Separate data did not become available until 1973. The principal exoort markets for MMA monomer (in declining order of value in 1975) were as follows: Canada, Mexico, Argentina, United Kingdom, Venezuela, and Australia. Official statistics on imports of MMA are not separately available.
·-,
A-17
Consideration of Injury or Likelihood Thereof by Reason of LTF~ Sales
U.S. Consumption, Production, Domestic Sales, and Foreign Trade
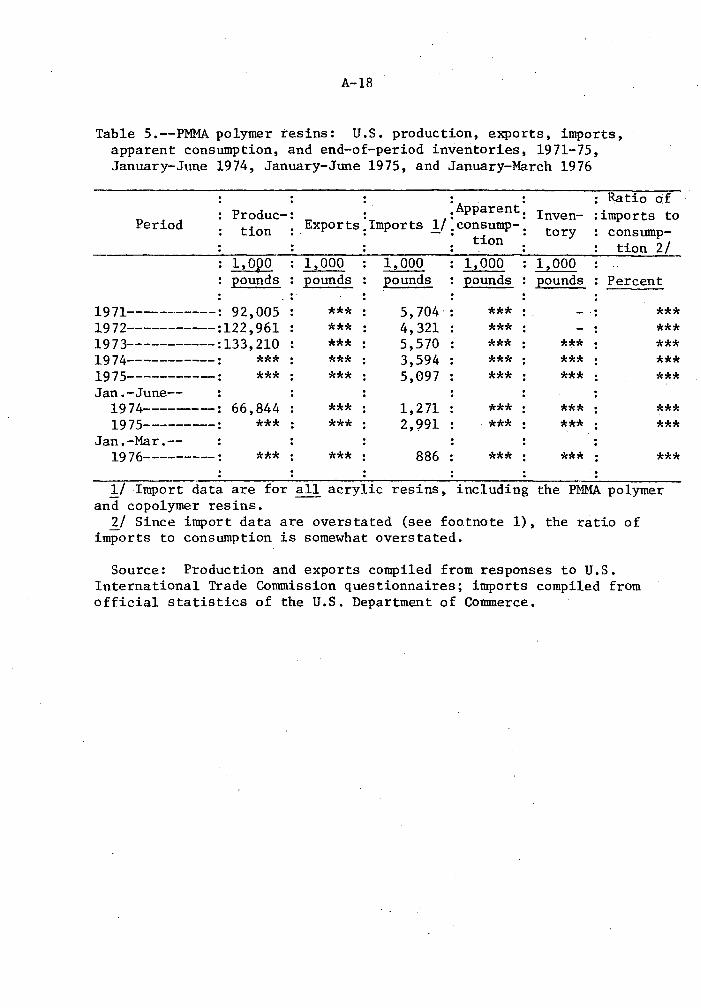
U.S. consumption of PMMA polymer resins increased from * * * mil
lion pounds in 197l•to * **million pounds in 1973, then declined
in 1974 and 1975, reachii:ig * * * million pounds in the latter year
(table 5, p. A-18). Clear PMMA molding and extrusion resins, ~ich
sell for 3 to 5 cents per pound less than the color grades, account
for about 75 percent of annual domestic sales of such resins. Cap
tive consumption of PMMA polymer resins by U.S. producers is small
and is believed not to exceed * * * percent of production during any
of the periods covered here.
U.S. production of PMMA polymer resins was * **than consump-
tion in each year during 1972-75. * * * Production increased from 92 million pounds in 1971 to 133 million
pounds in 1973, then declined in 1974 and 1975, reaching*** million
pounds in the latter year (table 5, p. A-18, and chart A, appendix B).
During the period 1973-75, U.S. producers' yearend inventories
of PMMA polymer resins ranged from * *
1974 to * * * million pounds in 1975.
* million pounds in
During the period of
LTFV sales, inventories amounted to * * * million pounds; for a similar
period in 1974 and for the first quarter of 1976, end-of-period inven
tories amounted to * * * million pounds and * * * million pounds,
respectively. Similar data for 1971 and 1972 are not available.
A-18
Table 5.--PMMA polymer resins: U.S. production, exports, imports, apparent consumption, and end-of-period inventories, 1971-75, January-June 1974, January-June 1975, and January-March 1976
. . Ratio o·f :Apparent: Produc-: Inven- :imports to
Period tion Exports:Imports 1/:consump-: - · tion · tory cons ump-
ti on 2/ 1,000 1,000 1,000 1,000 1,000 2ounds Eounds Eounds Eounds £Ounds Percent
•· .. 1971-----------: 92,005 *** 5,704· *** . - ': *** .. 1972----------:122,961 *** 4,321 *** *** 1973-----------:133,210 *** 5,570 *** *** *** 1974-----------: *** *** 3,594 *** *** *** 1975----------: *** *** 5,097 *** *** *** Jan.-June--
1974-------: 66,844 *** 1,271 *** *** *** 1975--------: *** *** 2,991 *** *** ***
Jan.-Mar.--1976---------: *** *** 886 *** *** *** ·. Jj Import data are for all acrylic resins, including the PMMA polymer
and copolymer resins. J) Since import data are overstated (see footnote 1), the ratio of
imports to consumption is somewhat overstated.
Source: Production and exports compiled from responses to U.S. International Trade Commission questionnaires; imports compiled from official statistics of the U.S. Department of Connnerce.
A-19
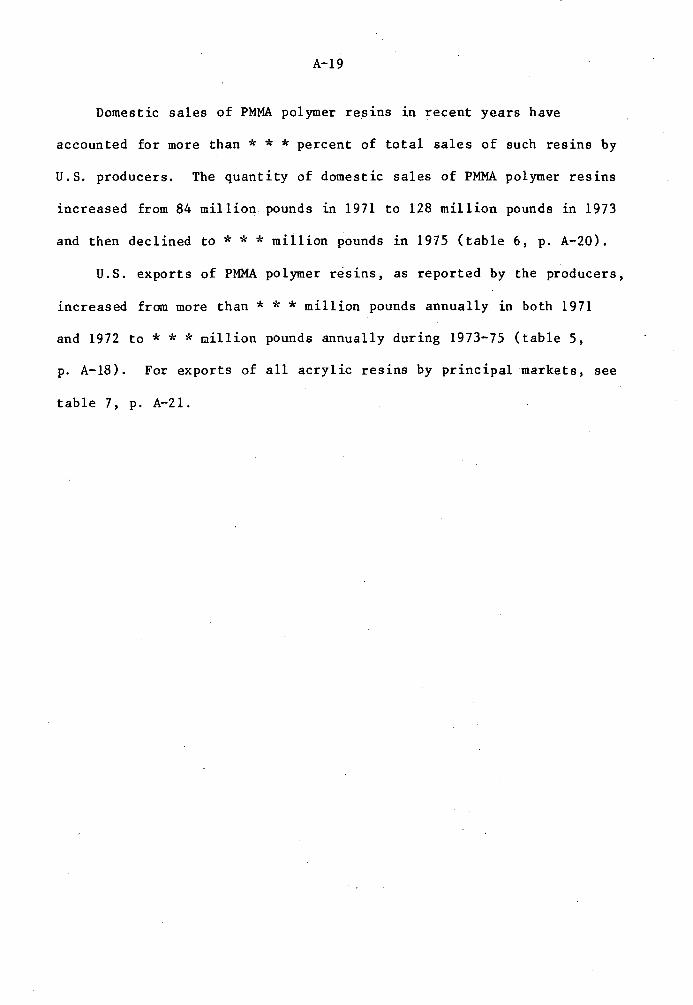
Domestic sales of PMMA polymer resins in recent years have
accounted for more than * * * percent of total sales of such resins by
U.S. producers. The quantity of domestic sales of PMMA polymer resins
increased from 84 million pounds in 1971 to 128 million pounds in 1973
and then declined to*** miilion pounds in 1975 (table 6, p. A-20).
U.S. exports of PMMA polymer resins, as reported by the producers,
increased from more than * * * million pounds annually in both 1971
and 1972 to * * *million pounds annually during 1973-75 (table 5,
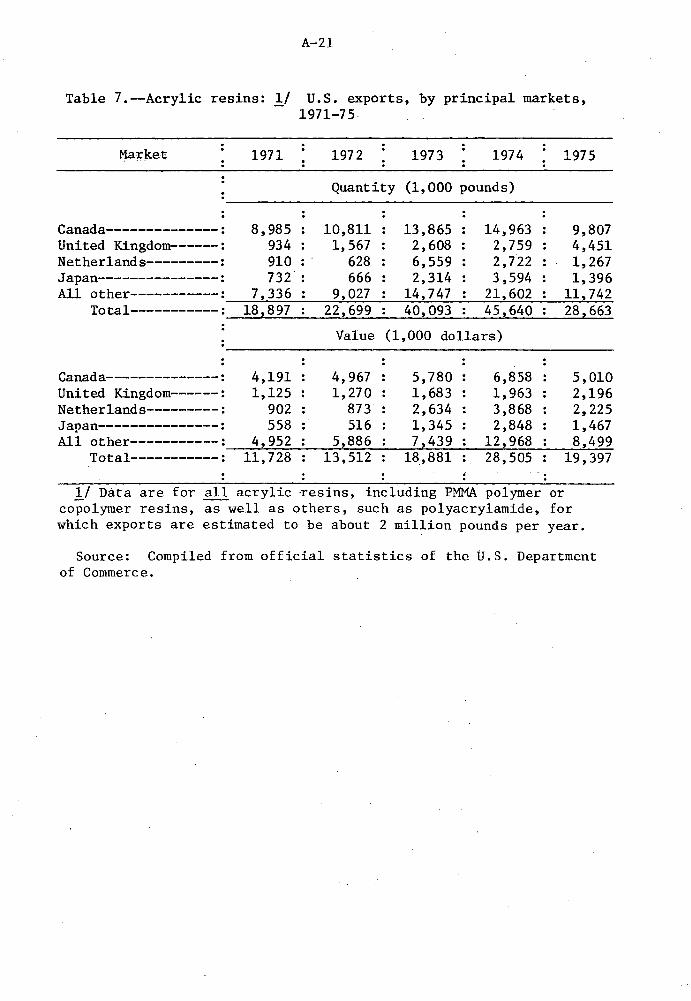
p. A-18). For exports of all acrylic resins by principal Darkets, see
table 7, p. A-21.
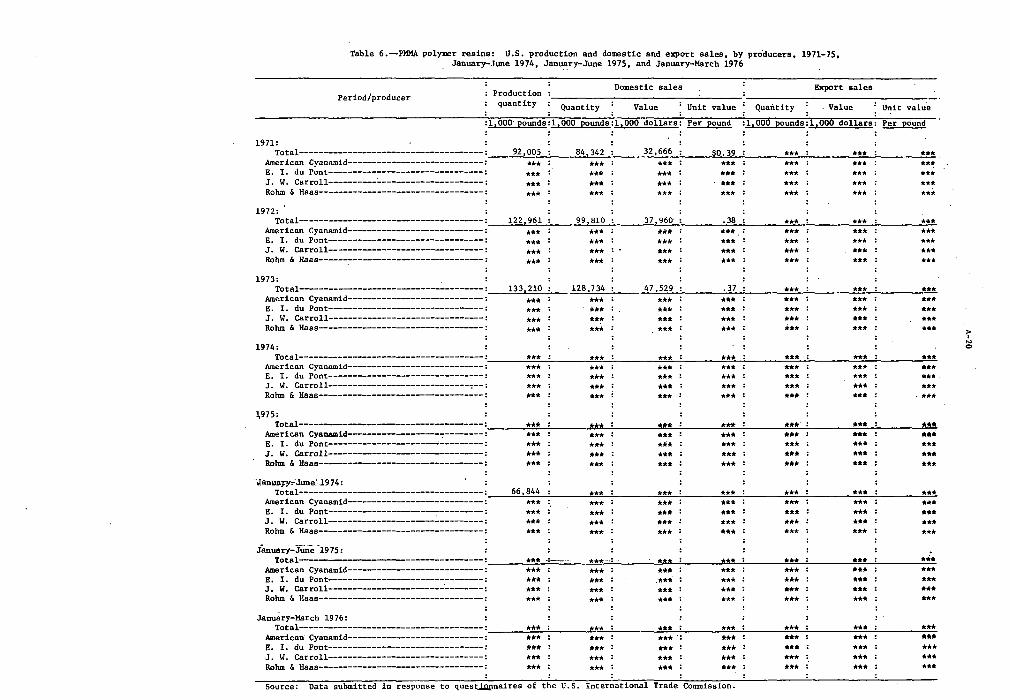
Table 6 .-PMMA polymer resins: U .s. production and domestic and export sales, by pro"ducers, 1971-75, January-June 1974, January-June 1975, and January-March 1976
Domestic sales Export sales Period/producer Production
quantity Quantity Value · Unit value Quantity Value · Unit value
:l,OOO·pounds:l,000 pounds:l,000 dollars: Per pound :i;-ooo poiiiids:1;-oOO-dollars: Per pound
1971: Total--------------------------------------: 92,005 : 84,342 : 32,666 : $0.39 : ••• : •••
American Cyanamid----------------------------: *** : *** : *** : *** : *** : *** E. I. du Pont--------------------------------: *** : · *** ; *** : *** : *** : *** J. W. Carroll----------:..---------------------: *** : *** : *** : *** : *** : *** Rohm & Haas----------------------------------: *** : *** : *** : *** : *** : ***
1972:
~
*** ••• ••• •••
Total------------------------:--------------: 122 961 : 99 810 : 37 960' : • 38 : *** : ••• : ••• American Cyanamid----------------------------: *** : *** : *** : *** : *** : *** : *** E. I. du Pont--------------------------------: *** : *** : *** : ***.: *** : *** : *** J. W. Carroll--------------------------------: *** : *** : *** : *** : *** : *** : *** Rohm & Haas----------------------------------: *** : *** : *** : *** : *** : **~ : ***
1973: Total-------------------------------------: 133 210: 128,734 : 47,529 : .37 : *** : *** : ***
American Cyanamid--------------------------: *** : *** : *** : *** : *** : *** : *** E. I. du Pont--------------------------------: *** : *** : *** : *** : *** : *** : *** J. W. Carroll--------------------------------: *** : *** : *** : *** : *** : *** : *** Rohm & Haas---------------------------------: *** : *** : *** : *** : *** : *** : ***
1974: Total-------------------------------------: *** : *** : *** : *** : *** : *** : ***
American Cyanamid----------------------------: *** : *** : *** : *** : *** : *** : *** E. I. du Pont--------------------------------: *** : *** : *** : *** : *** : *** : *** J. W. Carroll-----------------------------1--: *** : *** : *** : *** : *** : *** : *** Rohm & Haas----------------------------------: *** : *** : *** : *** : *** : *** : ***
~975:
Total------------------------------·------: *** : *** : *"* : *** : *** · : *** : *** American Cyanamid-------------------"'."--------: *** : *** : *** : *** : *** : *** : *** E. I. du Pont----------------------...:---------: *** : *** : *** : *** : *** : *** : *** J. W. Carroll----------------------------: *** : *** : *** : *** : *** : *** : *** Rohm & Haas----------------------------------: *** : *** : *** : *** : *** : *** : ***
··..ianuanr,.:June: .. 19 74: Total--------------------------------------: 66,844 : *** : *** : *** : *** : *** : ***
American Cyanamid---------------------------: *** : *** : *** : *** : *** : *** : *** E. I. du Pont--------------------~--------: *** :' *** : *** : *** : *** : *** : *** J. ·w. Carroll-------------------------------: *** : *** : *** : *** : *** : *** : *** Rohm & Haas----------------------------------: *** : *** : *** : *** : *** : *** : ***
january-Jiln<!1975: Total~~~~~~~~~~-· ------------: *** ..:--· ***......:- *** : *** : *** : *** : •••
American Cyanamid----------------------------: *** : *** : *** : *** : *** : *** : *** E. I. du Pont--------------------------.------: *** : *** : ·*** : *** : *** : *** : *** J. W. Carroll-----------------------·-------: *** : *** : *** : *** : *** : *** : *** Rohm & Haas---------------------------------: *** : *** : *** : *** : *** : *** : ***
January-March 1976: Total--------------------------------------: *** : *** : *** : *** : *** : *** : ***
American Cyanamid----------------------------: *** : *** : *** ·: *** : *** : *** : *** E. I. du Pont--------------------------------: *** : *** : *** : *** : *** : *** : *** J. W. Carroll--------------------------------: *** : *** : *** : *** : *** : *** : *** Rohm & Haas----------------------------------: *** : *** : *** : *** : *** : *** : *** Source: Data submitted in response to quest..J.Qpnaires of the U.S. International Trade Commission.
::-N 0
A-21
Table 7 .--Acrylic resins: l./ U.S. exports, by principal markets, 1971-7 5
Ma:rke~ 1971 1972 1973 1974 1975
Quantity (1,000 pounds)
Canada--------------: 8,985 10,811 13,865 14,963 9,807 United Kingdom------: 934 1,567 2,608 2,759 4,451 Netherlands---------: 910 628 6,559 2,722 1,267 Japan---------------: 732 666 2,314 3,594 1,396 All other-----------: 7,336 9,027 14,747 21,602 11,742
~~~~~~~---~~~--'~~~~~~~~~~~
Total-----------:~_18 ___ ,8_9_7~ ___ 2_2_,6_9_9 _____ 4_0~,0_9_3~ ___ 4_5_,6_4_0~ ___ 28 ___ ,6_6~3
Value (1,000 dollars)
Canada--------------: 4,191 4,967 5,780 6,858 5,010 United Kingdom------: 1,125 1,270 1,683 1,963 2,196 Netherlands---------: 902 873 2,634 3,868 2,225 Japan---------------: 558 516 1,345 2,848 1,467 All other-----------:~--4~,_95_2~----5~,_8_8_6 _____ 7~,~4_3_9 _____ 1_2~,_96_8 ______ 8~,_4~9-'-9
Total-----------: 11,728 13,512 18,881 28,505 19,397
)j Data are for all acrylic ·resins, including PMMA polymer or copolymer resins, as well as others, such as polyacrylamide, for which exports are estimated to be about 2 million pounds per year.
Source: Compiled from official statistics of the U.S. Department of Commerce.
A-22
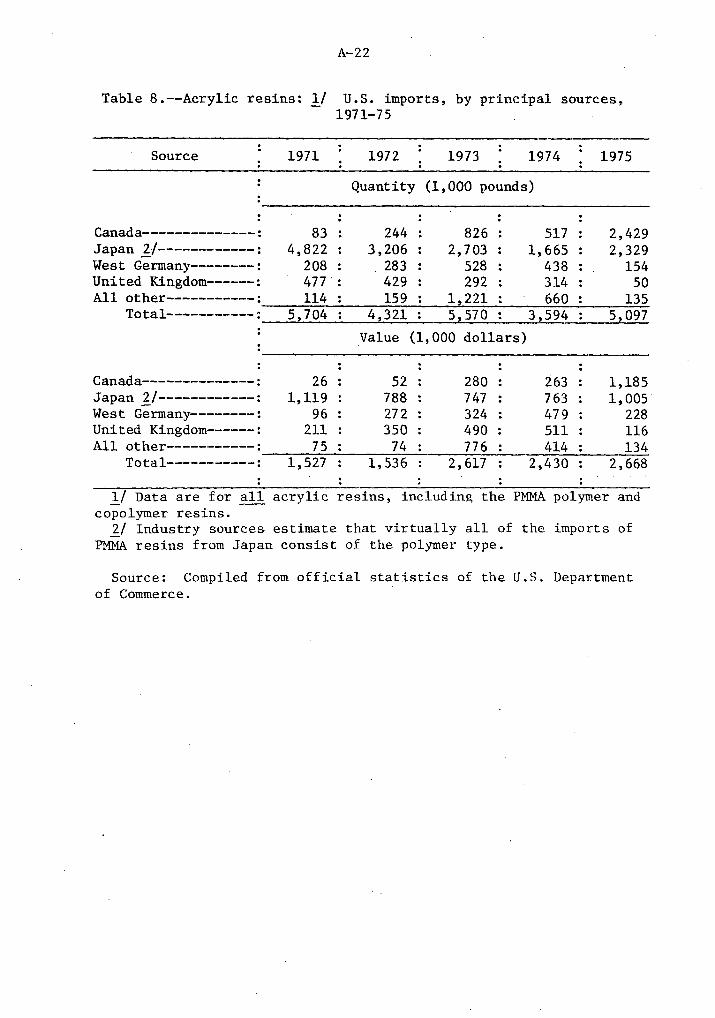
Table 8.--Acrylic resins: !/ U.S. imports, by principal sources, 1971-75
Source 1971
Canada--------------: 83 Japan I/------------: 4,822 West Germany--------: 208 United Kingdom------: 477.: All other-----------: 114
Total-----------: 5,704
Canada------------·--: 26 Japan]:_/------------: 1,119 West Germany--------: 96 United Kingdom------: 211 All other-----·------: 75
Total-----------: 1,527
1972 1973 1974
Quantity (1,000 pounds)
244 826 517 3,206 2, 703 1,665
283 528 438 429 292 314 159 1,221 660
4,321 5, 570 3,594
Value (1,000 dollars)
52 280 263 788 747 763 272 324 479 350 490 511
74 776 414 1,536 2,617 2,430
1975
2,429 2,329
154 so
135 5,097
1,185 1,005
228 116 134
2,668
l/ Data are for all acrylic resins, including the PMMA polymer and copolymer resins.
J:/ Industry sources estimate that virtually all of the imports of PMMA resins from Japan consist of the polymer type.
Source: Compiled from official statistics of the U.S. Department of Commerce.
A-23
During the period 1971-75, total U.S. imports of all acrylic
res1ns from all countries were at the period high of 5.7 million
pounds in 1971 and then fluctuated to 5.1 million pounds in 1975.
These imports amounted to 1.3 million pounds and 3.0 million pounds
during January-June 1974 and January-June 1975, respectively; and
amounted to about 900,000 pounds during January-March 1976 (see table
5, p. A-18). Imports of all acrylic resins by principal sources are
given in table 8, p. A-22.
Market Penetration of LTFV Sales
Imports of acrylic res1ns from Japan as compiled from three
sources are shown in table 9, p. A-25, both in absolute terms and as
a ratio to consumption. These sources are the official U.S. import
statistics for acrylic resins, imports of PMMA polymer resins reported
to the U.S. International Trade Commission by importers (see chart A,
appendix B), and official Japanese statistics on exports of PMMA
polymer resins to the United States.
Imported PMMA polymer resins from Japan, based on official Japanese
export statistics, supplied a percentage of U.S. consumption which
steadily declined from * * * percent in 1971 to * * * percent in 1974
and then increased to * * * percent in 1975. These imports supplied
* * * percent of consumption during the period of LTFV sales (January
June 1975), compared with*** percent during the corresponding period
of 1974 (table 9, p. A-25).
A-24
The ratio of imports of PMMA polymer resins from Japan to U.S.
consumption for the period of the Treasury Department's investi-
gation in 1975 was * * * percent when calculated with official U.S. ·i, ',
import statistics and * * * percent when determined from import data
furnished by the importers. For January-June 1974, the ratios were
calculated to be * * * percent using official U.S. import data and
* **percent based on data received from importers.
The official Japanese export statistics are believed to give a
more accurate picture of Japanese import penetration than either the
official U.S. import statistics, which include all acrylic resins and
thereby overstate the imports, or the imports from Japan as reported
to the Connnission by the importers, which may understate the actual
imports during certain periods because of incomplete coverage.
Japanese exports may also differ in part from official U.S.
imports and from the data furnished by the importers, because there
is a lag between the time when a shipment is exported from Japan and
the time when it is imported into the United States.
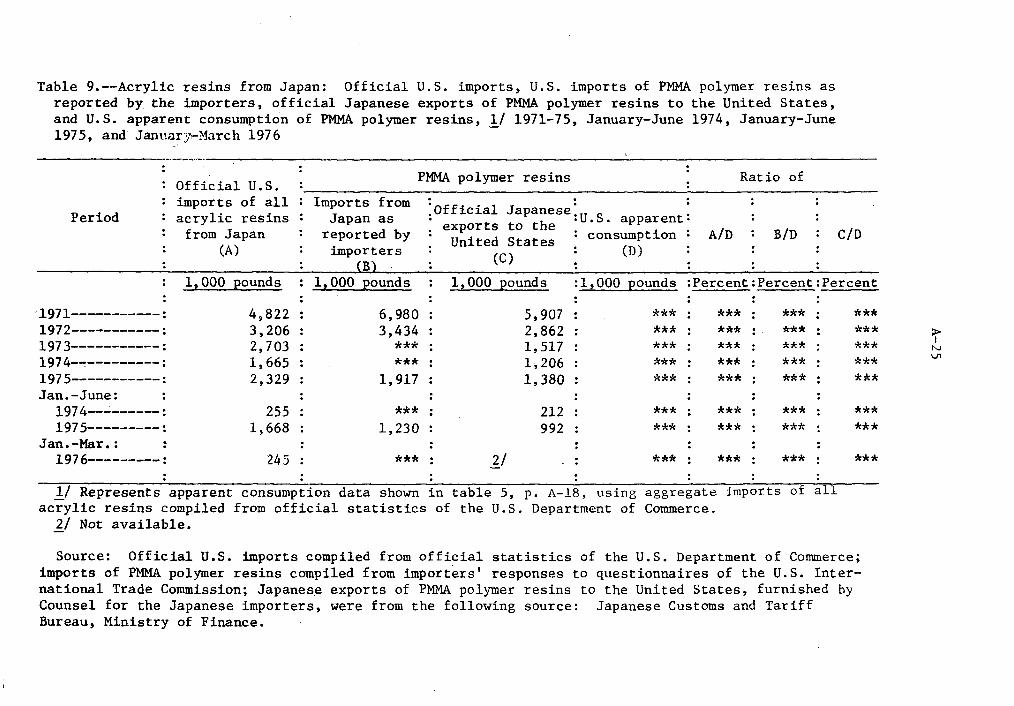
Table 9.--Acrylic resins from Japan: Official U.S. imports, U.S. imports of PMMA polymer resins as reported by the importers, official Japanese exports of PMMA polymer resins to the United States, and U.S. apparent consumption of PMMA polymer resins, 1/ 1971-75, January-June 1974, January-June 1975, and January~March 1976
~~~~~~~~~~~~-·-~-----~~~~~~~~~~~~~~~~~~~~~~~~~~~~~~~~~~~~~~~~~~~~~~~~~~~~~~~~~~~~~~~~~-
Period
Official U.S. imports of all acrylic resins
from Japan (A)
Imports from Japan as
reported by importers
(B)
PMMA polymer resins
. ·official Japanese:u.s. apparent: · exports to the : consumption
United States : (D) (C)
Ratio of
A/D B/D C/D
1,000 pounds 1,000 pounds 1,000 pounds :1,000 pounds :Percent:Percent:Percent
·1971--~----~-:
1972-----------: 1973-----------: 1974-""'.---------: 1975-----------: Jan.-June:
1974---------: 1975---------:
Jan.-Ma.r.: 1976---------:
4,822 3,206 2,703 1,665 2,329
255 1,668
245
6,980 3,434
*** ***
1,917
*** 1,230
*** 1_/
5,907 2,862 1,517 1,206 1,380
212 992
1/ Represents apparent consumption data shown in table 5, p. A-18, using acrylic resins compiled from official statistics of the U.S. Department of
1_/ Not available.
*** : *** : *** : *** *** : *** : *** : *** *** : *** : *** : *** *** : *** : *** : *** *** . *** : *** : ***
: :
*** : *** : *** : *** *** : *** : *** : ***
: . : . *** : *** : *** : ***
: : : aggregate imports of all Commerce.
Source: Official U.S. imports compiled from official statistics of the U.S. Department of Commerce; imports of PMMA polymer resins compiled from importers' responses to questionnaires of the U.S. International Trade Commission; Japanese exports of PMMA polymer resins to the United States, furnished by Counsel for the Japanese importers, were from the following source: Japanese Customs and Tariff Bureau, Ministry of Finance.
;I>-I
N V1
A-26
The Japanese Industry
PMMA polymer resins
Table 10 shows data concerning the Japanese industry producing
these resins. These data were submitted by counsel for the two
Japanese producers .involved in this investigation, Asahi Chemical
Industry Co., Ltd., and Mitsubishi Rayon Co., Ltd.
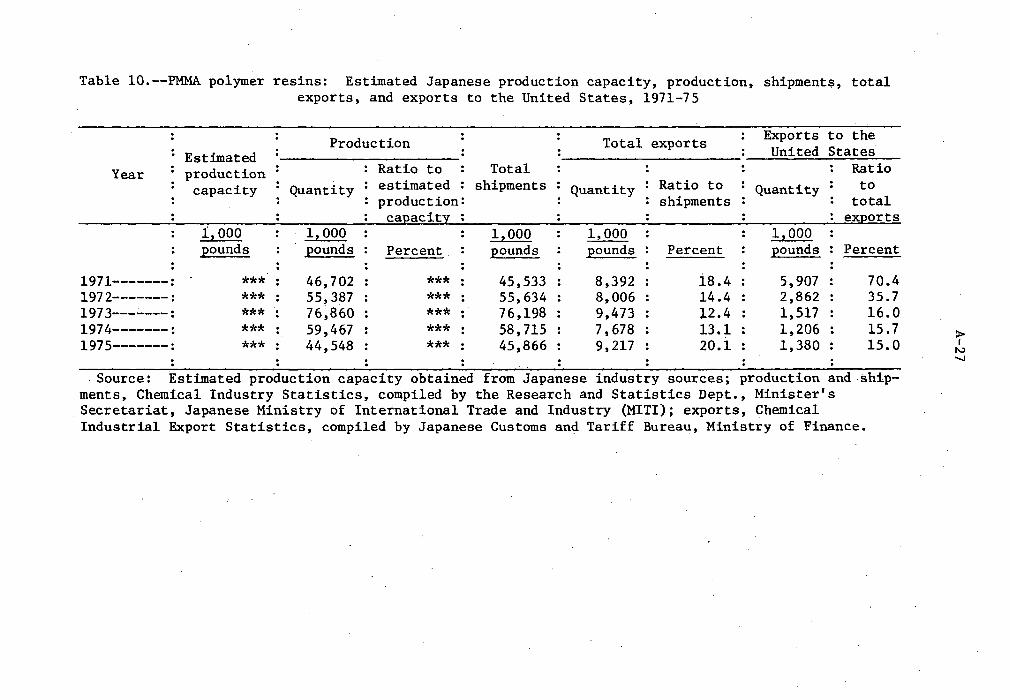
Table 10.--PMMA polymer resins: Estimated Japanese production capacity, production, shipments, total exports, and exports to the United States, 1971-75
Year
: 1971-------: 1972-------: 1973---;_---: 1974-------: 1975-------:
Estimated production capacity
.1 2 000 : 2ounds :
: *** : *** : *** : *** : *** :
Production Total exports Exports to the United States
Ratio to Total Ratio
Quantity estimated : shipments : Quantity : Ratio to : Quantity : to production: : : shipments : : total
caJ!acity : : : : : exJ!orts 1,000 1,000 : 1,000 : : 1,000 2ounds Percent : Eounds : Eounds : Percent : pounds : Percent . : . 46,702 *** : 45,533 : 8 ,392 : i8.4 : 5,907 : 70.4 55,387 *** : 55,634 : 8,006 : 14.4 : 2,862 : 35.7 76,860 *** : 76,198 : 9,473 : l2.4 : 1,517 : 16.0 59,467 *** : 58, 715 : 7,678 : 13.1 : 1,206 : 15.7 44,548 *** . 45,866 : 9,217 : 20.1 : 1,380 : 15.0
. Source: Estimated production capacity obtained from Japanese industry sources; production and ·shipments, Chemical Industry Statistics, compiled by the Research and Statistics Dept., Minister's Secretariat, Japanese Ministry of International Trade and Industry (MIT!); exports, Chemical Industrial Export Statistics, compiled by Japanese Customs and Tariff Bureau, Ministry of Finance.
~ N .......
A-28
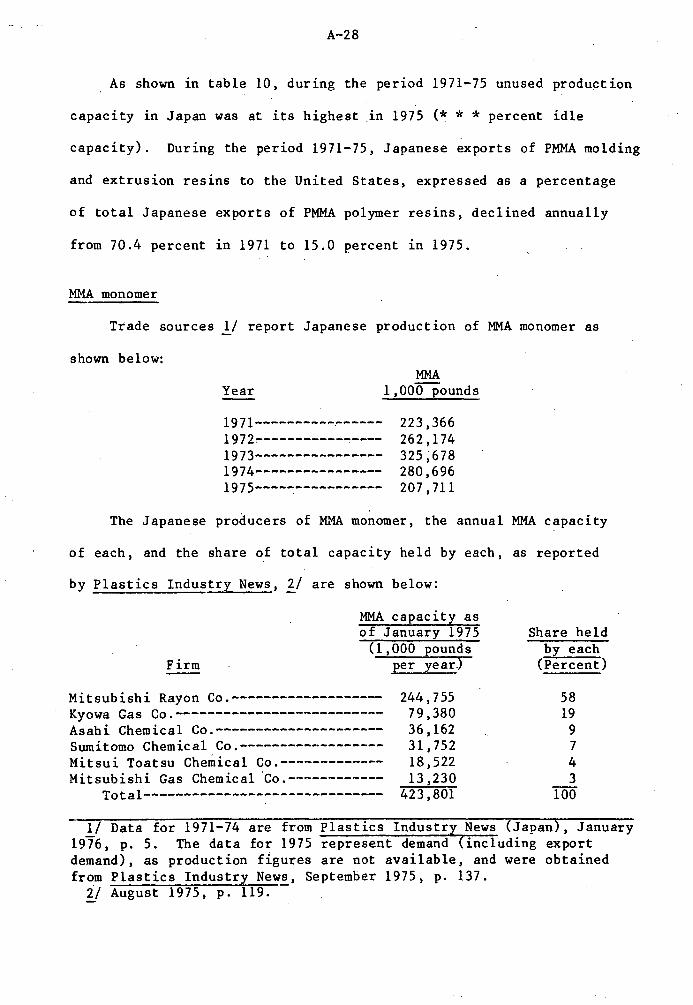
As shown in table 10, during the period 1971-75 unused produ~tion
capacity in Japan was at its highest .in 1975 (* * * percent idle
capacity). During the period 1971-75, Japanese exports of PMMA molding
and extrusion resins to the United States, expressed as a percentage
of total Japanese exports of PMMA polymer resins, declined annually
from 70.4 percent in 1971 to 15.0 percent in 1975.
MMA monomer
Trade sources 1/ report Japanese production of MMA monomer as
shown below:
Year
1971----------~----
l 972~----------~----1973----------------1974----------------1975----------------
MMA l,OOQPounds
223,366 262,174 325;678 280 ,696 207,711
The Japanese producers of MMA monomer, the annual MMA capacity
of each, and the share of total capacity held by each, as reported
by Plastics Industry News, 2/ are shown below:
Firm
MMA capacitv as of January 1975
(1, 000 pounds per year)
Mitsubishi Rayon Co.---~---------------Kyowa Gas Co.--------------------------Asahi Chemical Co.--------------------Sumitomo Chemical Co.-----------------Mitsui Toatsu Chemical Co.------------Mitsubishi Gas Chemical ·co.------------
Total------------------------------
244' 755 79,380 36,162 31,752 18,522 13,230
423,801
Share held by each
(Percent)
58 19
9 7 4 3
100
1/ Data for 1971-74 are from Plastics Industry News (Japan), January 1976, p. 5. The data for 1975 represent demand (including export demand), as production figures are not available, and were obtained from Plastics Industry News, September 1975, p. 137.
ii August 1975, p. 119.
A-29
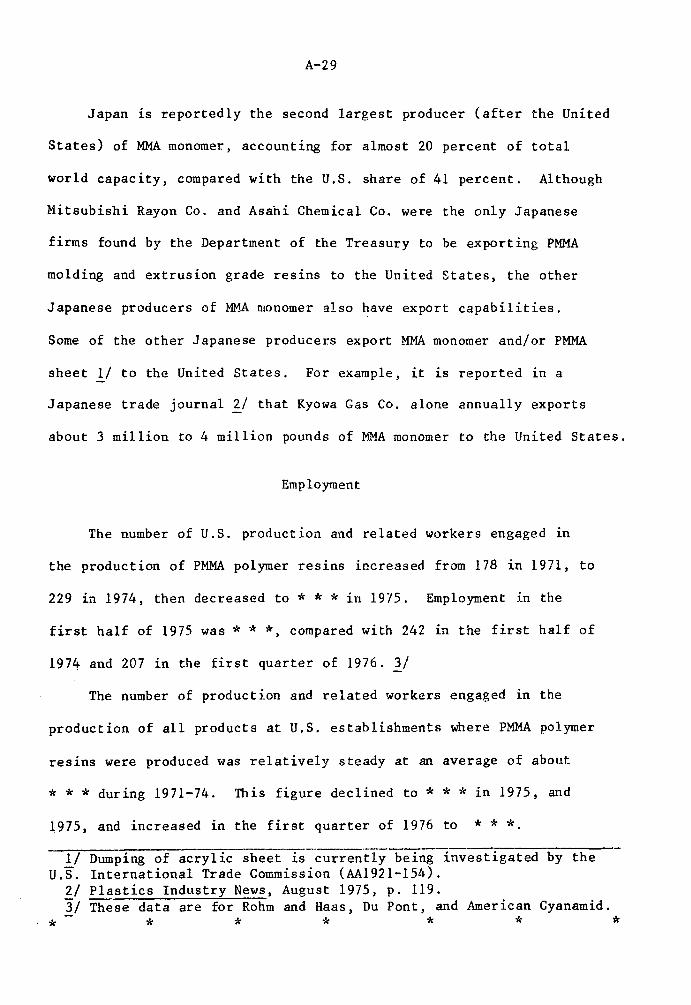
Japan is reportedly the second largest producer (after the United
States) of MMA monomer, accounting for almost 20 percent of total
world capacity, compared with the U.S. share of 41 percent. Although
Mitsubishi Rayon Co. and Asahi Chemical Co. were the only Japanese
firms found by the Department of the Treasury to be exporting PMMA
molding and extrusion grade resins to the United States, the other
Japanese producers of MM...A monomer al so have export capabilities.
Some of the other Japanese producers export MMA monomer and/or PMMA
sheet 1/ to the United States. For example, it is reported in a
Japanese trade journal 2/ that Kyowa Gas Co. alone annually exports
about 3 million to 4 million pounds of MMA monomer to the United States.
Employment
The number of U.S. production and related workers engaged in
the production of PMMA polymer resins increased from 178 in 1971, to
229 in 1974, then decreased to * * * in 1975. Employment in the
first half of 1975 was***, compared with 242 in the first half of
1974 and 207 in the first quarter of 1976. 3/
The number of production and related workers engaged in the
production of all products at U.S. establishments where PMMA polymer
resins were produced was relatively steady at an average of about
* * * during 1971-74. This figure declined to* * * in 1975, and
1975, and increased in the first quarter of 1976 to * * * 1/
u.s. 2/ 3J
*
Dumping of acrylic sheet is currently being investigated by the International Trade Commission (AA1921-154). Plastics Industry News, August 1975, p. 119. These data are for Rohm and Haas, Du Pont, and American Cyanamid.
* * * * * *
A-30
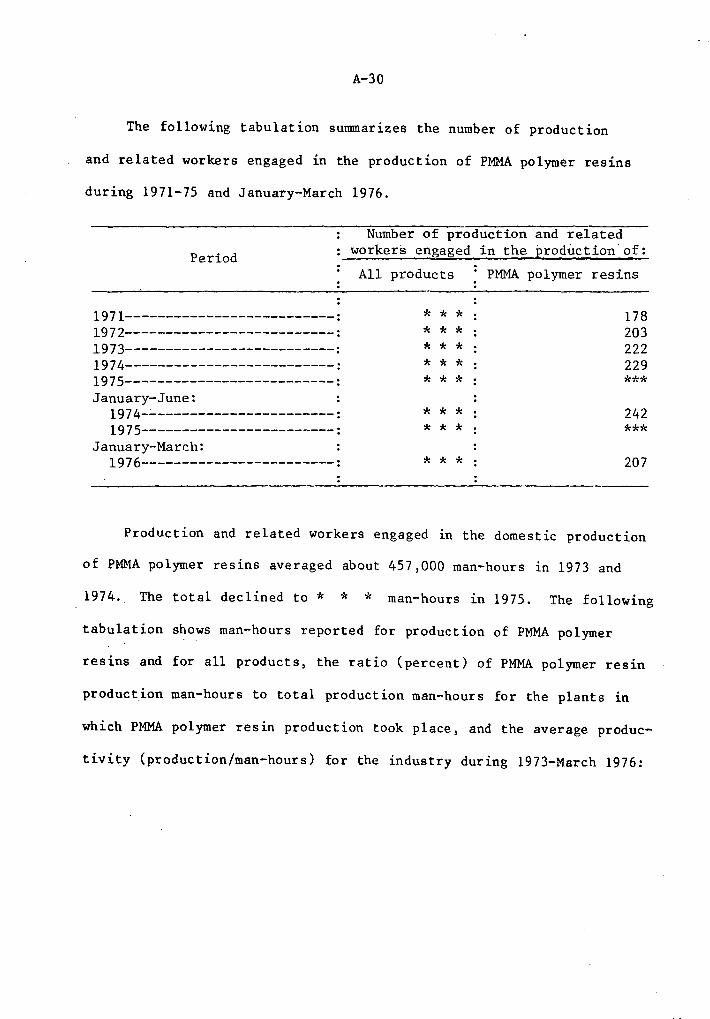
The following tabulation sunnnarizes the number of production
and related workers engaged in the production of PMMA polymer resins
during 1971-75 and January-March 1976.
Period
1971--------------------------: 1972--------------------------: 1973--------------------------: 1974--------------------------: 1975--------------------------: January-June:
1974------------------------: 1975------------------------:
January-March: 1976------------------------:
Number of production and related workers engaged in the production of:
All products PMMA polymer resins
* * * * * * * * * * * * * * *
* * * * * *
* * *
178 203 222 229
*** 242
*** 207
Production and related workers engaged in the domestic production
of PMMA polymer resins averaged about 457,000 man-hours in 1973 and
1974. The total declined to * * * man-hours in 1975. The following
tabulation shows man-hours reported for production of PMMA polymer
resins and for all products, the ratio (percent) of PMMA polymer resin
production man-hours to total production man-hours for the plants in
which PMMA polymer resin production took place, and the average produc-
tivity (production/man-hours) for the industry during 1973-March 1976:
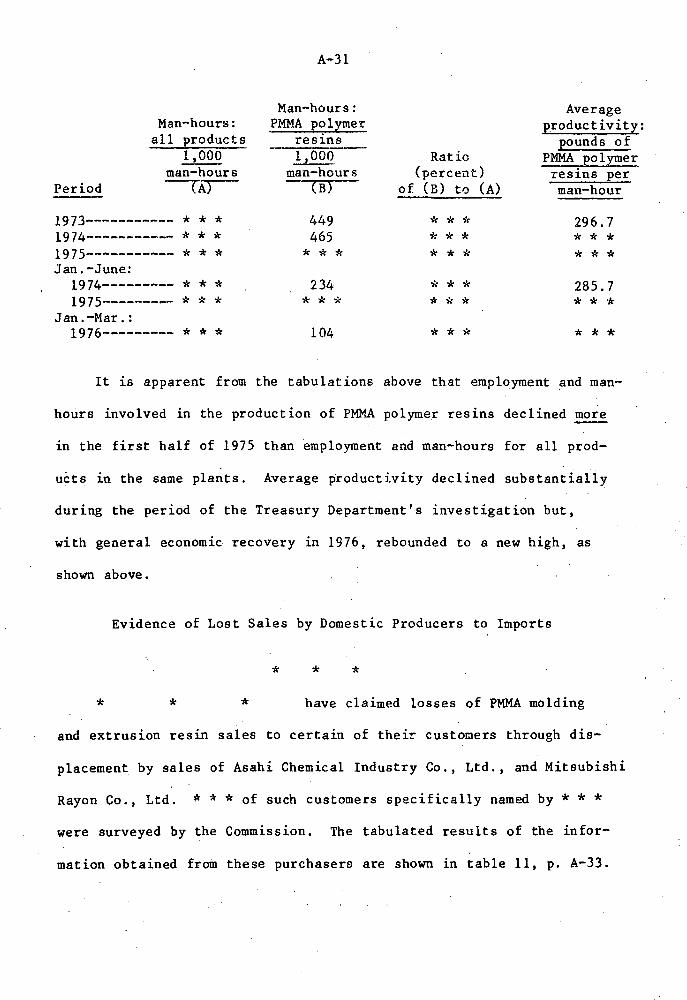
Period
Man-hours: all products
1,000 man-hours --r~
1973----------- * * * 1974----------- * * * 1975----------- * * * Jan.-June:
1974--------- * * * 1975--------- * * *
Jan.-Mar.: 1976--------- * * *
A-31
Man-hours: PM¥...A polymer
resins 1,000
man-hours (B)
449 465
* * * 234
* * * 104
Average eroductivit~:
2ounds of Ratio PMMA polymer
(percent) resins per of (B) to (A) man-hour
* * -;, 296. 7 * * * * * * * * * * * *
* * * 285.7 * * * * * *
* * * * * *
It is apparent from the tabulations above that employment and man~
hours involved in the production of PMMA polymer resins declined more
in the first half of 1975 than employment and man-hours for all prod-
ucts in the same plants. Average productivity declined substantially
during the period of the Treasury Department's investigation but,
with general economic. recovery in 1976, rebounded to a new high, as
shown above.
Evidence of Lost Sales by Domestic Producers to Imports
* * *
* * * have claimed losses of PMMA molding
and extrusion resin sales to certain of their customers through dis-
placement by sales of Asahi Chemical Industry Co., Ltd., and Mitsubishi
Rayon Co., Ltd. ***of such customers specifically named by***
were surveyed by the Commission. The tabulated results of the infor-
mation obtained from these purchasers are shown in table 11, p. A-33.
A-32
Data supplied by * * *
* * * show that the only purchases from non-
domestic sources made in 1974 and 1975 were from * * *
* * * and amounted to * * * percent and * * * percent,
respectively, of total purchases (* * * percent during the period of
LTFV sales). * * * reported that * * *
furnished * * * percent of its purchases in 1975 ( * · * * percent
during the period of LTFV sales); * * * supplied * * *
percent and * * * percent of purchases in 1974 and 1975, respectively
(* * * percent during the period of LTFV sales). * * *
* * * reported that * * * supplied * * * percent and * * * percent of their purchases in 1973 and 1974, respec
tively, but none during ~he period of LTFV sales. * * * supplied
* * * percent and * * * percent of * * * · requirements in i'974 and
1975, respectively, including * * * percent during the period of LTFV
sales. * * * purchased * * *percent
and * * * percent of its requirements frcm * * * in 1974 and 1975,
respective(y. * * * supplied * * • percent of * * * needs
during January-June 1974 and January-June 1975 (table 11, p. A-33).
A-33
Table 11.--PMMA polymer resins: Purchases of PMMA polymer resins from Mitsubishi Rayon, Asahi Chemical, U.S. producers, and Chemacryl, (a Canadian producer), by selected customers, 1973-75, January-June 1974, January-June 1975, and January-March 1976
* * * * * *
Source: Compiled from data submitted in response to questionnaires 'qf the U.S. International Trade Commission. .
A-34
Prices
General economic conditions in the U.S. plastics industry
During 1971-75, the plastics industry was affected by general
economic trends as well as by events related more specifically to
the plastics industry. Both 1971 and 1972 were record-breaking years
for plastics sales, and by January 1973 the trade journal Modern
Plastics was speaking of "The general feeling of euphoria evident all
around the plastics industry II Plastics sales increased again
in 1973, although by the end of the year, shortages of raw materials
began to develop.
In 1974, with the slump in the construction and automotive indus
tries, plastics sales amounted to 28.5 billion pounds, or 1.7 percent
less than the 29.0 billion pounds sold in 1973. Prices for rubber
and plastics products increased about 27 percent during 1974. In
1975, plastics sales decreased sharply to 22.8 billion pounds, or by
20.0 percent from the previous year, while prices for rubber and
plastics products rose only about 2 percent. Modern Plastics reports
that an upturn in resin sales occurred in mid-1975, and that the out
look for 1976 is for a 15-to-20-percent growth in sales quantity over
the depressed figure for 1975.
Channels of distribution and pricing practices
Imports from Japan.--Mitsubishi Rayon Co., Ltd., and Asahi
Chemical Industry Co., Ltd., sell PMMA polymer resins to Japanese
trading companies, which in turn resell the resins to U.S. importers
which are subsidiaries of the Japanese trading companies. The two
A-35
principal U.S. importers of Japanese PMMA polymer resins in 1974 and
1975 were Nissho-Iwai American Corp. and the Marubeni Corp. Nissho-
Iwai handles resins produced by Mitsubishi Rayon, while Marubeni
handles resins produced by Asahi Chemical Industry Co. Neither
Nissho-Iwai nor Marubeni publishes price lists; prices are established
through bargaining and negotiation . ... ~
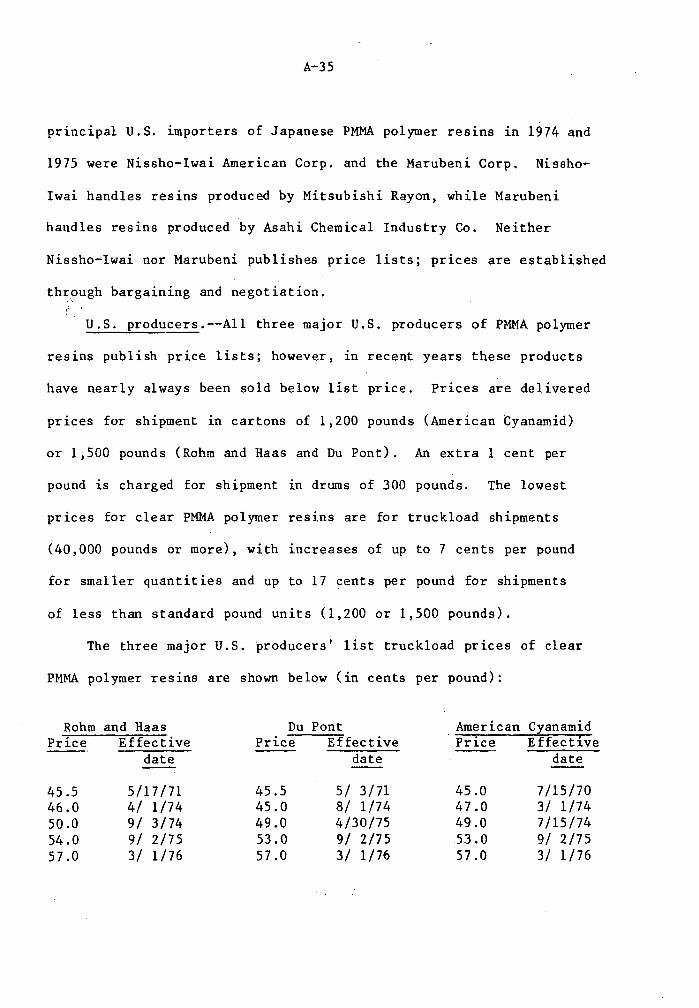
U.S. producers.--All three major U.S. producers of PMMA polymer
resins publish price lists; however, in recent years these products
have nearly always been sold below list price. Prices are delivered
prices for shipment in cartons of 1,200 pounds (American Cyanamid)
or 1,500 pounds (Rohm and Haas and Du Pont). An extra 1 cent per
pound is charged for shipment in drums of 300 pounds. The lowest
prices for clear PMMA polymer resins are for truckload shipments
(40,000 pounds or more), with increases of up to 7 cents per pound
for smaller quantities and up to 17 cents per pound for shipments
of less than standard pound units (1,200 or 1,500 pounds).
The three major U.S. producers' list truckload prices of clear
PMMA polymer resins are shown below (in cents per pound):
Rohm and Haas Du Pont American Cyanamid Price Effective Price Effective Price Effective
date date date
45.5 5/17/71 45.5 5/ 3/71 45.0 7 /15/70 46.0 4/ 1/74 45.0 8/ 1 /74 47.0 3/ 1/74 50.0 9/ 3/74 49.0 4/30/75 49.0 7/15/74 54.0 9/ 2/75 53.0 9/ 2/75 53.0 9/ 2/75 57.0 3/ 1/76 57.0 3/ 1 /76 57.0 3/ 1 /76
A-36
Price comparison of domestic and imported (Japanese) PMMA polymer resins, January 1973-March 1976
January-July 1973.--Net delivered selling prices received by
U.S. producers and importers of Japanese clear PMMA polymer resins
during January 1973-March 1976 are shown in tables 12 and 13 and in
charts B and C, appendix B. During January-July 1973, the average
imported price was * * * the average domestic price, except in March
1973 when the imported price was * * * the domestic price.
August 1973-May 1974.--From August 1973 to May 1974, a period of
strong worldwide demand for acrylics, there were no reported sales
of Japanese PMMA polymer resins in the United States. Beginning in
late 1973, U.S. product ion and sales of acrylic resins were limited
by a shortage of acetone, a principal raw material in the production
of methyl rnethacrylate monomer. During this period, * * * *
June-October 1974.--Between June and October 1974, Japanese
PMMA polymer resins reappeared on the U.S. market, but sales of
Japanese resins were made at average prices * * *
* * * domestic prices. During this period of strong demand,
domestic prices * * * In November 1974, * * *
A-37
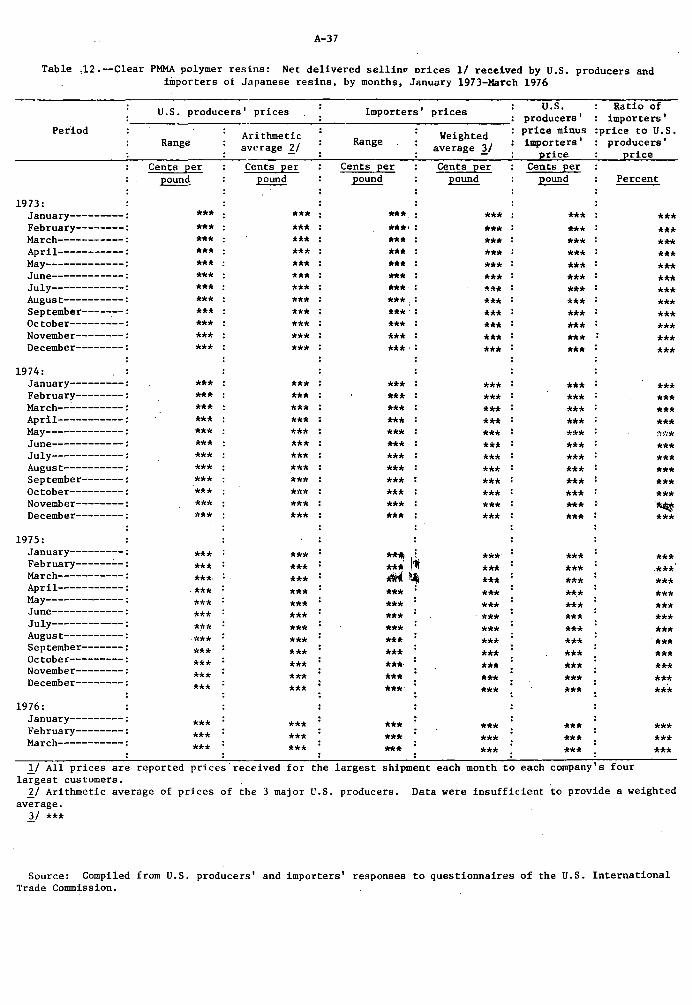
Table ,12.--Clear PMMA polymer resins: Net delivered sellinP orices 1/ received by U.S. producers and importers of Japanese resins, by months, January 1973-March 1976
Period
1973: January---------: February--------: March-----------: April---------~:
May-------------: June------------: July------------: August----------: September-----.--: October---------: November--------: December--------:
1974: January---------: February--------: March--~--------: April-----------: May-------------: June------------: July------------: August----------: September-------: October---------: November--------: December--------:
1975: January---------: February--------: March-----------: April-----------: May-------------: June------------: July------------: August----------: September-------: October---------: November--------: December--------:
1976: January--------~:
February--------; March-----------:
U.S. producers' prices
Range
Cents per pound
*** *** *** *** *** *** *** *** *** *** *** ***
*** *** *** *** *** *** *** *** *** *** *** ***
*** *** ***·
·*** *** *** *** *** *** *** *** ***
*** *** ***
Arithmetic average lf Cents per
pound
*** *** *** *** *** *** *** *** *** *** *** ***
*** *** *** *** *** *** *** *** *** *** *** ***
*** *** *** *** *** *** *** *** *** *** *** ***
*** *** ***
Importers' prices
Range
Cents per pound
***· ***' *** *** *** *** ***· *** ***.: *** : *** : ***.:
*** *** *** *** *** *** .. *** *** *** *** *** ***
*** *** *** *** *** *** ***· *** ***
*** *** ***
Weighted average 11 Cents per
pound
*** *** *** *** *** *** "'"'* *** *** *** *** ***
*** *** *** *** *** *** *** *** *** *** *** ***
***. *** *** *** *** *** *** *** *** *** *** ***
*** *** ***
U.S. producers' price minus importers'
rice Cents per
pound
*** *** *** *** *** *** *** *** *** *** *** ***
*** *** *** *** *** *** *** *** *** *** *** ***
*** *** ***· *** *** *** *** *** *** *** *** ***
*** *** ***
Ratio of importers'
:price to U.S. producers'
rice
Percent
*** *** *** *** *** *** *** *** *** *** *** ***
*** *** *** ***
*** *** *** *** *** .ltil4t ***
*** ·*** *** *** *** *** *** *** *** *** *** ***
*** *** ***
1/ All prices are reported prices.received for the largest shipment each month to each company's four largest customers. ll Arithmetic average of prices of the 3 major U.S. producers. Data were insufficient to provide a weighted
average. 11 ***
Source: Compiled from U.S. producers' and importers' responses to questionnaires of the U.S. International Trade Commission.
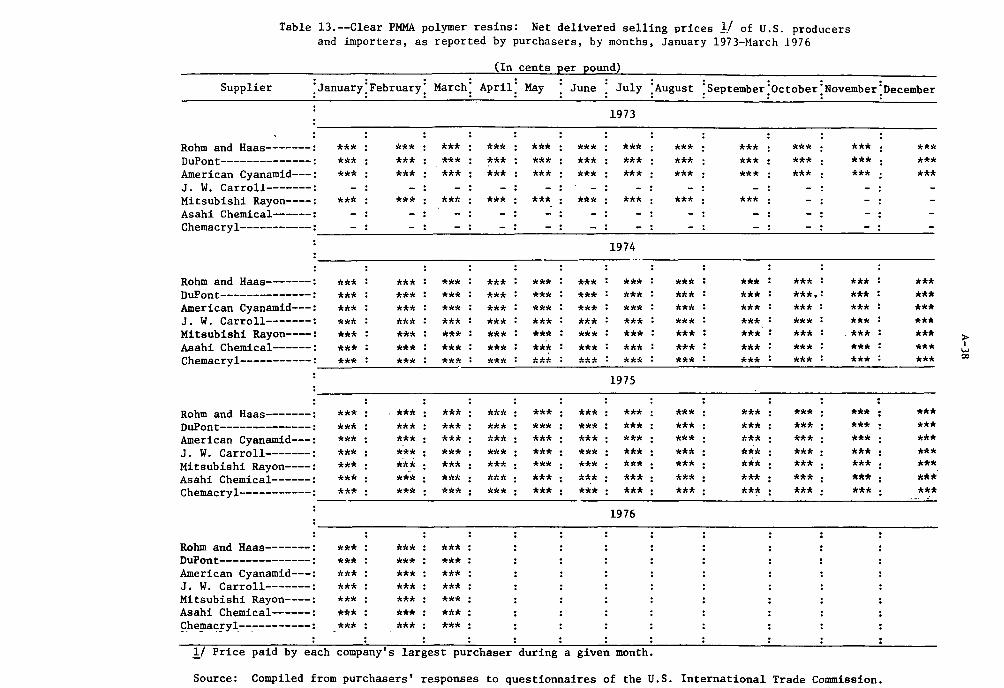
Table 13.--Clear PMMA polymer resins: Net delivered selling prices 1/ of U.S. producers and importers, as reported by purchasers, by months, January 1973-March .1976
(In cents per pound)
Supplier :January:February: March: April: May June : July :August ~September~October:November~December
Rohm and Haas-------: DuPont--------------: American Cyanamid---: J. W. Carroll-------: Mitsubishi Rayon----: Asahi Chemical------:
*** *** ***
***
*** *** ***
***
*** *** ***
***
*** *** ***
***
*** *** ***
***
*** *** ***
***
1973
*** *** ***
***
*** *** ***
***
*** *** ***
***
*** *** ***
*** *** ***
Chemacryl-----------: . . . . . . . . . . .
1974
*** *** ***
Rohm and Haas-------: *** : *** : *** : *** : *** : *** : *** : *** : *** : *** : *** : *** DuPont--------------: *** : *** : *** : *** : *** : *** : *** : *** : *** : ***•: *** : *** American Cyanamid---: *** : *** : *** : *** : *** : *** : *** : *** : *** : *** : *** : *** J. W. Carroll-------: *** : *** : *** : *** : *** : *** : *** : *** : *** : *** : *** : *** Mitsubishi Rayon----: *** : *** : *** : *** : *** : *** : *** : *** : *** : *** : . *** : *** Asahi Chemical------: *** : *** : *** : *** : *** : *** : *** : *** : *** : *** : *** : *** Chemacryl-----------: *** : *** : *** : *** : *** : *** : *** : *** : *** : *** : *** : ***
Rohm and Haas-------: DuPont--------------: American Cyanamid---: J. W. Carroll-------: Mitsubishi Rayon----: Asahi Chemical------: Chemacryl-----------:
Rohm and Haas-------: DuPont--------------: American Cyanamid---: J. W. Carroll-------: Mitsubishi Rayon----: Asahi Chemical------: ~he~ac~yl-----------:
*** *** *** *** *** *** ***
*** *** *** *** *** *** ***
*** *** *** *** *** *** ***
*** *** *** *** *** *** ***
*** *** *** *** *** *** ***
*** *** *** *** *** *** ***
*** *** *** *** *** *** ***
*** *** *** *** *** *** ***
*** *** *** *** *** *** ***
1975
*** *** *** *** *** *** ***
1976
1/ Price paid by each company's largest purchaser during a given month.
*** *** *** *** *** *** ***
*** *** *** *** *** *** ***
*** *** *** *** *** *** ***
*** *** *** *** *** *** ***
Source: Compiled from purchasers' responses to questionnaires of the U.S. International Trade Commission.
*** *** *** *** *** *** ***
::-w 00
A-39
The distress sale of December 1974.--In December 1974, 220,000
pounds of Japanese PMMA polymer resins were sold to * * * , at
* * * cents per pound, which was * * * cents per pound below the
Japanese selling price of only 2 months before, and * * * cents per
pound below the average domestic selling price for December 1974.
This particular sale was allegedly due to a specialized set of cir
cumstances, under which Nissho-Iwai, faced with a suddenly cancelled
order, had to dispose of the 220,000 pounds of merchandise in order
to avoid the accumulating storage and insurance expenses of holding
the resins in a bonded warehouse in Japan. It was decided to drop
the price to * * * cents per pound in order to complete the sale.
This particular sale was the first of many sales of Japanese PMMA
polymer resins * * * in the ensuing months.
At the Commission hearing, importers alleged that their price
decrease of December 1974 was made in response to a decrease which
occurred in domestic prices. Evidence furnished to the Commission
shows that
* * * * * * *
A-40
LTFV sales, January-June 197~.--Between January and June 1975
(the period of LTFV sales), the average price of Japanese PMMA poly-
mer resins ranged
domestic price.
*
*
*
*
* the average
*
* * * Average Japanese prices during this period ranged
* * * * * * compared with the dumping margins of
18 to 30 percent which were found by the U.S. Department of the
Treasury.
The average domestic price of PMMA polymer resins * * *
* * * cents per pound in January 1975 to * * * cents per pound in
May 1975. Purchasers' prices paid to*** fell from*** cents
per pound in January 1975 to * * * cents per pound in May-July 1975
* * *
* * *
* * *
* * * July-December 1975.--During the second half of 1975, Japanese
PMMA polymer resins * * *
* * *
* * *
* * * All three major U.S. producers raised their list
prices by 4.0 cents per pound in September 1975.
1976.--There have been no known major sales of Japanese PMMA
polymer res ins in the United States _in 1_976, * * *
A-41
* * * * * *
* * * One major U.S. purchaser reported
to the Commission that:
* * *
U.S. producers' average prices of PMMA polrmer resins * * *
* * * cents per pound in December 1975 to** *'cents per pound
in March 1976. All three major domestic producers raised their list
prices 3 to 4 cents per pound in March 1976.
Price suppression and/or depression
It was alleged in the hearing that in the 1969-72 period, domes-
tic producers were forced to lower their prices by as much as 30 per-
cent in order to meet import competition from Japan. !/ It was further
alleged that during a period of escalating costs at the end of 1974,
Du Pont was forced to maintain prices at unsatisfactory levels 2/ in
order to meet import competition from Japan. '}_/ While price data avail-
able to the Commission do not include the 1969-72 period, price trends
during the 1973-75 period were analyzed to determine· whether price
suppression/depression actually occurred in 1974 and 1975.
* * * * * *
1/ Transcript of the hearing, p. 7. 2/ * * * 3/ Transcript of the hearing, p. 8 ."
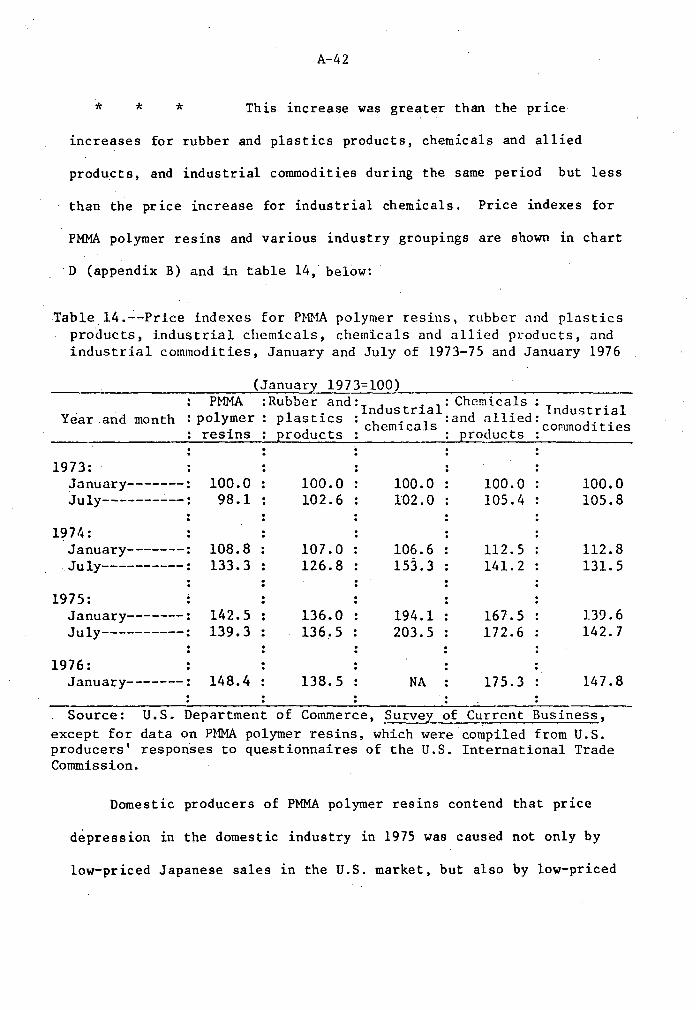
A-42
* * * This increase was greater than the price
increases for rubber and plastics products, chemicals and allied
produ.cts, and industrial commodities during the same period but less
than the price increase for industrial chemicals. Price indexes for
PMMA polymer resins and vari.ous industry groupings are shown in chart
D (appendix B) and in table 14,· below:
Table. 14 .~-Pri.ce indexes for PMMA polymer resins, rubber and plastics products, industrial chemicals, chemicals and allied products, and industrial commodities, January and July of 1973-75 and January 1976
(January 1973=100) PMMA : Rubber and:
1 d .
1: Chemicals !
1 d .
1 . n us tria . n ustria Year and month : polymer : plastics : h . 1 :and allied: d ..
resins d c emica s 1 t conuno 1t1es pro ucts : procuc s :
1973: January-------: 100.0 100.0 100.0 100.0 100.0 July-------_:.--: 98.1 102.6 102.0 105. 4 105.8
1974: January-------: 108.8 107.0 106.6 112. 5 112.8
·.July--..;. _______ : 133.3 126.8 153.3 141. 2 131. 5
1975: January-------: 142.5 136.0 194.1 167.5 139.6 July--------:---: 139.3 136 .• 5 203.5 172.6 142.7
1976: January-------: 148.4 138.5 NA 175.3 147.8
Source: U.S. Department of Commerce, Survey of Current Business, except for data on PMMA polymer resins, which were compiled from U.S. producers' responses to questionnaires of the U.S. International Trade Commission.
Domestic producers of PMMA polymer resins contend that price
depression in the domestic industry in 1975 was caused not only by
low-priced Japanese sales in the U.S. market, but also by low-priced
A-43
Japanese offers of major quantities of material in late 1974 to early
1975. Domestic producers allegedly were obliged to lower their prices
in order to avoid losing sales to foreign suppliers. * * * >'c * *
* * * * >'< *
Between July 1974 and July 1975, prices for PMMA polymer resins
increased 4. 5 percent, or at a slower rate than in any of the indus
try groupings listed above. Between January and July 1975, prices
for PMMA polymer resins actually declined; ·x * *
* * *
* * *
* * * * * * alth6ugh this period also was one of seriously depressed
demand. Between July 1975 and January 1976, the price increase for
PMMA polymer resins was greater than that for any of the. other industry
groupings listed above.
* * * * * * *
A-44
* * * * * *
Prices of J. W. Carroll & Sons and of Chemacryl are alleged by
the attorney for Mitsubishi Rayon and Asahi Chemical to have been
below those of the major domestic producers:
*
.. the entry of a new domestic acrylic resin producer, J. W. Carroll & Sons, into the market in 1975 could also have caused the alleged injury to the complainant and other members of the domestic industry. It is reported that this new domestic manufacturer is already producing at a rate far in excess of the available annual importations of our clients and is offering its product for sale at prices below those of other domestic producers.
In addition, we call the Commission's attention to the increased imports from Chemacryl, a Canadian producer owned in part by Rohm and Haas Darmstadt that began producing acrylic resin in late 1973. We have been advised that Chemacryl's prices for acrylic ~esin, both list and actual, are substantially below those of the U.S. producers. 1/
* * * * *
J:../ Transcript of the hearing, p. 95.
*
*

A-45
Factors other than price
Allocation in the domestic industry.-- * * *
During parts of 1973 and 1974, shortages of MMA monomer raw material
occurred, and it was necessary for the major producers to place their
PMMA polymer resin customers on allocation. 1./
* * * * *
Preferability of domestically-produced PMMA polymer resins.--!£
prices of domestically produced and Japanese PMMA polymer resins are
equal, all or nearly all domestic purchasers prefer· to purchase from
1/ Transcript of the hearing, p. 29.
*
A-46
domestic producers. For this reason, importers must undersell domes
tic producers by a few cents per pound in order to compete effectively
during normal economic periods.
One drawback to the purchase of imported PMMA polymer resins
from Japan is delivery time; the mean delivery time is about 2 months,
while domestic producers can deliver orders much more quickly.
A second drawback to the purchase of Japanese PMMA polymer
resins arises because domestic producers are able to deliver in bulk
by means of a truckload (40,000 pounds) or a railroad carload (180,000
pounds), while importers of Japanese PMMA polymer resins must ship
in Gaylord boxes (1,200-1,400 pounds) or in 55-pound bags, since bulk
shipment across the Pacific Ocean is not economical. Some large domes
tic purchasers, such as * * * and * * * employ storage silos which
can be loaded directly from bulk shipments; when such purchasers buy
Japanese PMMA polymer resins, they must incur the additional costs
of opening and handling 150 individual boxes in order to obtain the
amount he1d by a bulk railroad carload. One domestic purchaser has
estimated that the in-plant cost of boxed material is about 2 cents
per pound above that of bulk material.
Most domestic purchasers would prefer to purchase from a domes
tic producer, rather than be dependent upon a foreign source of
supply. This is especially so in the PMMA polymer resin industry
in which there have been periods of shortage and allocation. It is
reported that domestic producers also offer arrangements whereby a
purchaser may utilize the producer's. well-known trade name in pro
moting an end product.
A-47
Quality considerations.--Purchasers surveyed by the Commission
in regard to this investigation were asked to comment on quality and
suitability differences of PMMA molding and extrusion resin purchases
made by ·them from domestic sources and from Asahi Chemical and
Mitsubishi Rayon. Out of eight pertinent responses.--
1. Three purchasers did not use Japanese PMMA polymer resins.
2. Five purchasers found no difference between sources (however, none had personal experience with PMMA polymer resins made by Asahi Chemical; they handled only the product of Mitsubishi Rayon).
3. One purchaser stated that the domestic suppliers.have more technical expertise relating to molding characteristics.
4. One user stated that the domestic producer has technical personnel "more proximinent [sic] to the manufacturing location as expected."
5. None of the purchasers favored the use of PMMA polymer resins from Asahi Chemical or Mitsubishi Rayon over those from domestic suppliers.
The recession.--In testimony before the Commission, 1/ the attar-
ney for Mitsubishi Rayon and Asahi Che.mical stated:
It cannot be denied that the domestic PMMA pellet market was depressed during 1975; however, it is clear that this depression can in no way be attributed to imports of (P) MMA pellet from Japan ..•
Rather, the depression can be directly linked to the decline in the U.S. economy- in general, and to the disastrous decline in the auto industry and construction industry in particular. [2/] For instance, the auto industry recorded a-:-gain in production between 1972 and 1973 of 11.3 percent; however, production fell off between 1973 and 1974 by 24.3 percent, and between 1974 and 1975
1/ Transcript of the hearing, p. 93. 2/ During 1973-75 GNP declined 3.8 percent. By contrast, auto and
construction industries declined 30.7 percent and 26.1 percent, respectively, during the same period.
A-48
by an additional 8 percent, so that the average monthly figure for 1975 was 30.7 percent below
- the same figure for 1973. The same was also true in the construction industry. Between 1972 and 1973, the average monthly rate of private nonresidential construction units put in place rose by S.T percent; however, between 1973 and 1974 the average declined by 10.2 percent and the 1974-75 figures registered a whopping 17. 7 . percent decline. Thus, the 1975 monthly average was ·26 .1 percent. be tow that for 1973. ·
It is common knowledge that· the vast preponderance of acrylic resin utilized by aufomobile, construction, or related industries. Therefore, when. construction slows to .a' virtual halt' and automobile product ion drops off 'by 30. 7 percent in a . two-year perio~, sales of methyl meth~crylat~ pellet are bound· to drop off substantially, and it is these economic occurrences which we submit: are the proximate [sic] cause of any alleged injury suffered by domestic industry during the relevant period. ·
''
Competition from other domestic and foreign produc'ers .-..:rrt''
testimony before the Commission,!/ Mr. William B. Jones, Jr., Vice
President, K-S-H, Inc. (St. Louis, Mo.) stated that-.:.
. . . one of our competitors in. the extrusion industry, J. W. Carroll & .Sons, makes i'ts own PMMA from monomer, originally for its own use. In the last couple of years, it has begun . offering PMMA pellets for sale irt the domestic market. (2/] . This fact has a repressing effect on domestTc pricing. Obviously, any material sold by that company into the U.S. ma~ket is volume not realized by the other.three U.S. manufacturers. In addition, other foreign sources of supply are and should be available to the United States consumers of PMMA such as K-S-H, Inc. To the extent that these sources make · sales in this country, domestic manufacturers would be subjected to competitive effects.
!/Transcript of. the hearing~ p. 38.
2/ * * * * * * ·*

A-49
U.S. imports of acrylic resins from Canada increased from 517,000
pounds in 1974 to 2.4 million pounds in 1975; in 1975, Canada sur
passed Japan as the principal U.S. source of imported acrylic resins.
During the first quarter of 1976, U.S. imports from Canada amounted
to 575,000 pounds while U.S. imports from Japan amounted to 245,000
pounds.
A-SO
Profit-and-Loss Experience of Domestic Producers
Financial information was received from the 3 major producers
of PMMA polymer resins. These companies account for about * * * per-
cent * * *of domestic production of such resins.
* * *
* * *
* * *
* * *
Profit-and-loss data were requested on the establishments in which
PMMA polymer resins were manufactured. The companies were not able to
supply the information on this basis since their records are kept on
a division or department basis which has little relationship to such
resin operations. The companies, however, maintained their records
on a product line basis, however, and therefore were able to segregate
profit-and-loss data on PMMA polymer resins.
Sales of PMMA polymer resins rose without interruption from 1971
to 1974 before declining by* **million in 1975. Net profits gen
erally followed the same trend except in 1974 when they declined
slightly from the level of 1973. The ratio of net operating profit
to net sales ranged between 25.7 percent and 1.8 percent, 1973 being
the highest and 1975 the lowest.
* * * * * * *

A-51
* * * * * * *
Members of the staff contacted each of the three· companies for
which data are reported herein and verified these data.
* * *
* * *
In both instances the main reasons given were the large increase
in raw material cost and the depressed market; these factors brought
about an increase in the cost of goods sold and a decrease in sales.
These points were also brought out at the public hearing by the com
plainant.
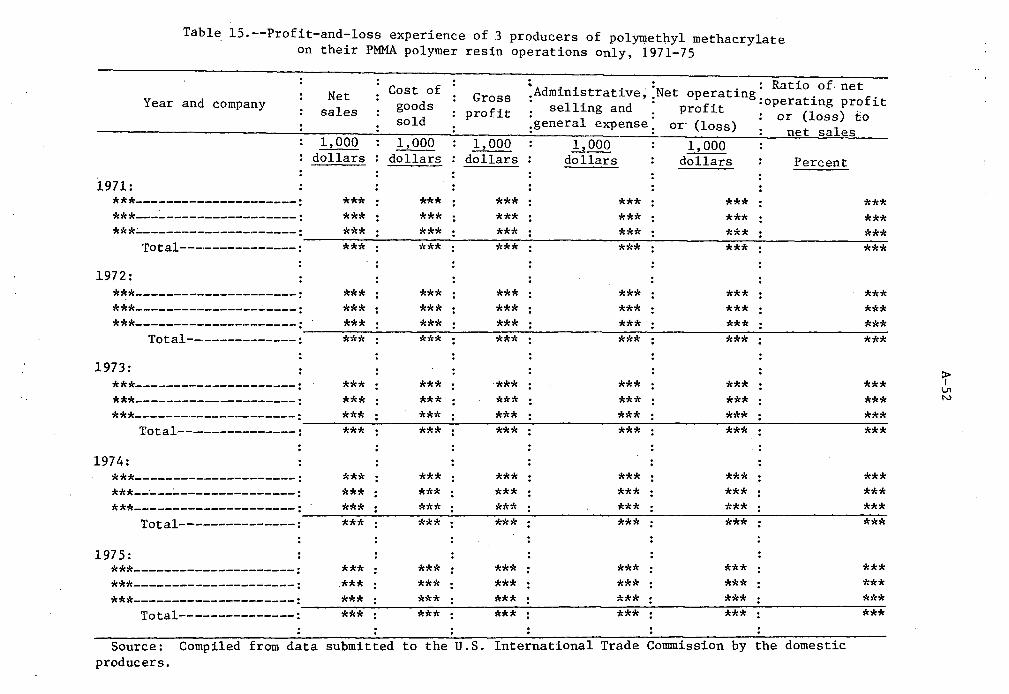
1971:
Table 15.--Profit-and-loss experience of 3 producers of polymethyl methacrylate on their PMMA polymer resin operations only, 1971-75
Year and company Net sales
1,000 dollars
Cost of goods sold
1,000 dollars
Gross profit
1,000 dollars
:Administrative; '.Net : Ratio of. net operating:operating profit
: selling and ;general expense.
profit : or (loss) to or· (loss) . net sales
1,000 dollars
1,000 dO"ila"rs Percent
***---------------------: *** : *** : *** : *** : *** : *** ***---------------------: *** : *** : *** : *** : *** : *** ***~--------------------: *** : *** : *** : *** : *** : ***
Total---·------------: *** : *** : *** : *** : *** ! *** 1972:
***---------------------: *** : *** : *** : *** : *** : *** ***----------------.;.. ____ : *** : *** : *** : *** : *** : *** ***--------------·-------: *** : *** : *** : *** : *** : ***
Total---------------: *** : *** : *** : *** : *** : *** 1973:
***---------------------: *** : *** : •*** : *** : *** . : *** ***--------------------: *** : ***. : *** : *** : *** : *** ***-------·--------------: *** : *** : *** : *** : *** : ***
Total---------------: *** · *** · *** · *** · *** · *** 1974:
***---------------------: *** : *** : *** : *** : *** : *** ***-----------------------: *** : *** : *** : *** : *** : *** ***---------------------: *** : *** : *** : *** : *** : ***
Total---------------: *** · *** · *** · *** · *** · *** 1975:
***---------------------: *** : *** : *** : *** : *** : *** ***---------------------: *** : *** : *** : *** : *** : *** ***---------------------: *** : *** : *** : *** : *** : ***
Total---------------: *** · *** · *** · *** · *** · *** Source: Compiled from data submitted to the U.S. International Trade Commission by the domestic
producers.
:r-\.11 N
A-53
APPENDIX A
GLOSSARY OF TERMS.
A-54
Acrylic 1esin: A thermoplastic polymer or copolymer of acrylic acid, methacrylic acid, or esters of these acids.
Comonomer: A monomer which is mixed with a different kind of monomer in order to produce a copolymer.
Copolymer: A polymer made from two or more different kinds of monomers.
Molding and extrusion resins: Resins for use in molding or extrusion processes. Molding means imparting shape to a dry thermoplastic resin by applying heat and/or pressure in a confining cavity or matrix. Extrusion means forcing a thermoplastic resin through a die under heat and/or pressure to produce continuous lengths of plastic sections such as rods, sheets, tubes, profiles, and cable coatings.
Monomer: A compound of simple structure and low molecular weight which is capable of reacting with itself or other simple compounds to form a polymer.
Plastic: capable desired dients,
A high polymer which, at some stage in its manufacture, is of flowing under heat and pressure, if necessary, into any final shape. The high polymer is combined with other ingresuch as fillers, colors, or plasticizers.
Polymer: A compound formed by the reaction of simple molecules having functional groups which permit their combination to proceed to high molecular weights under suitable conditions. The term often is used synonymously with the term "plastic" or the· term "resin."
Resin: A high-molecular-weight material with no definite melting point. For general purposes, the terms "resin," "polymer, 1·
1 and "plastic" can be (and are) used interchangeably by the trade.
Resin content basis: The weight of the resin exclusive of the weight of plasticizers, colorants, liquid diluents, and other additives.
Thermoplastic resin: A material that will repeatedly soften when heated and harden when cooled.
Thermosetting resin: A material that cures by chemical reaction when heated and, when cured, cannot be resoftened by heating.
A-55
APPENDIX·B
CHARTS·
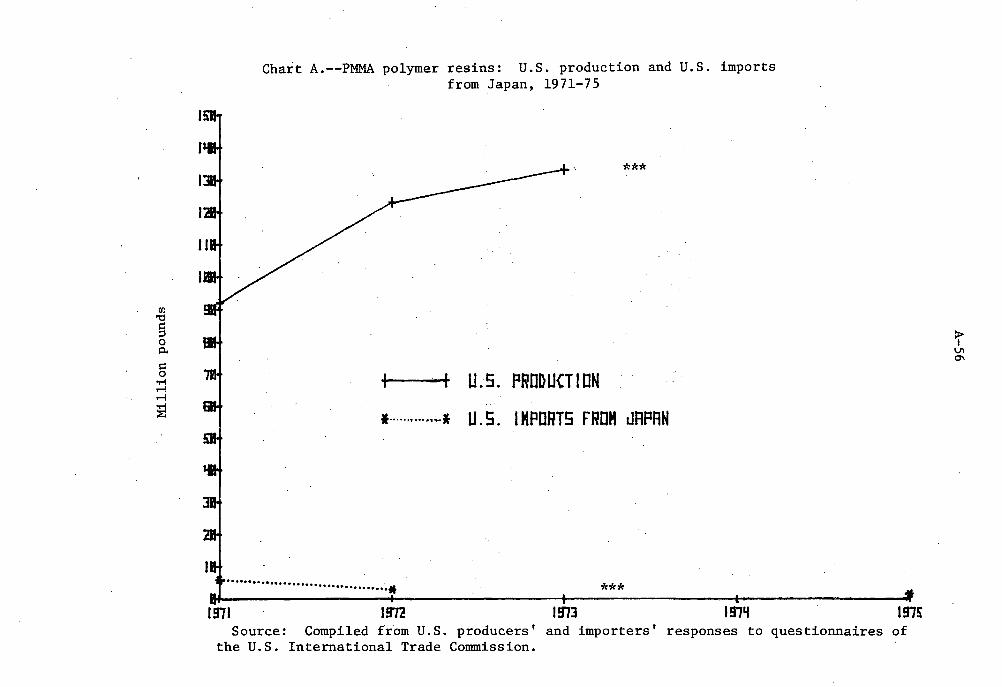
fl)
'"d
§ 0 ~
s::: 0 ..... ~ r-l
il
1311·
121
Chart A.--PMMA polymer resins: U.S. production and U.S. imports from Japan, 1971-75
***
I · I U.S. PRODUCTION
, ............ ~.* U.5. IHPDRTS FRllH JAPAN
······················· ······· ...... ~. *** 1971 1972 1973 197'1 197!l
Source: Compiled from U.S. producers' and importers' responses to questionnaires of the U.S. International Trade Connnission.
~ \JI
°'
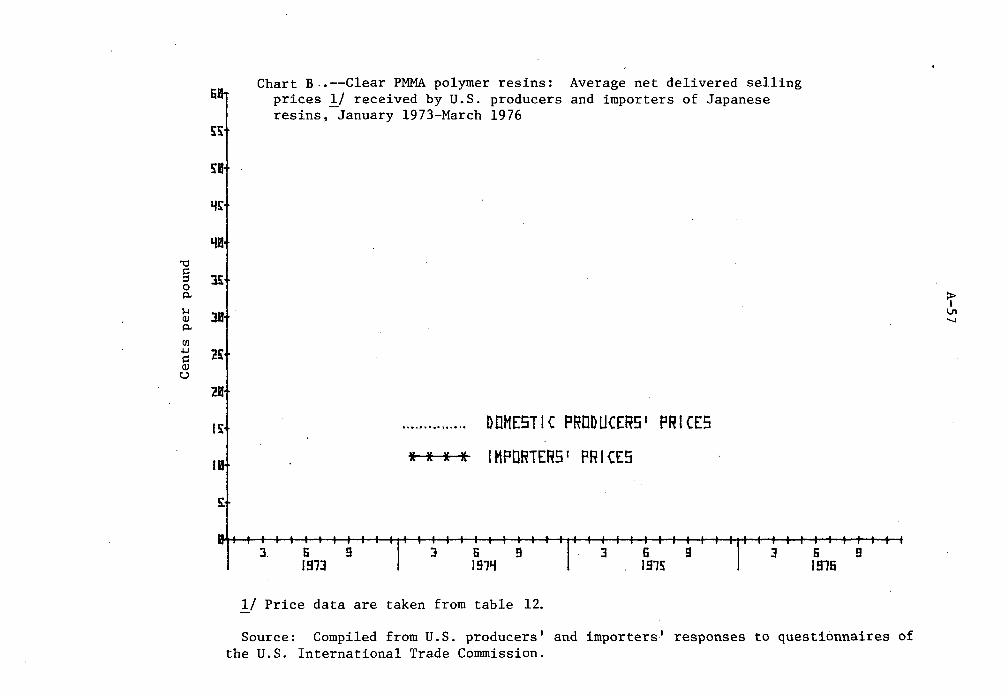
"'O p ::I 0 0.
)..j Cl) 0.
Cl) +.J p Cl) u
Ii
s:s:
S:I·
4!L
'lil
JS
l8
2~
28
IS:
IH
Chart B .• --Clear PMMA polymer resins: Average net delivered selling prices l./ received by U.S. producers and importers of Japanese resins, January 1973-March 1976
XJlltt
DOMESTIC PRODUCERS' PRICES
IHPORTERS 1 PRICES
~
J. ~73 ~,-. j I ~1~1~ I 9 I I 'I' I j I I 1~1~1 g I I Ill I 3 1~1~9-~
±_/ Price data are taken from table 12.
Source: Compiled from U.S. producers' and importers' responses to questionnaires of the U.S. International Trade Commission.
~ VI -...J
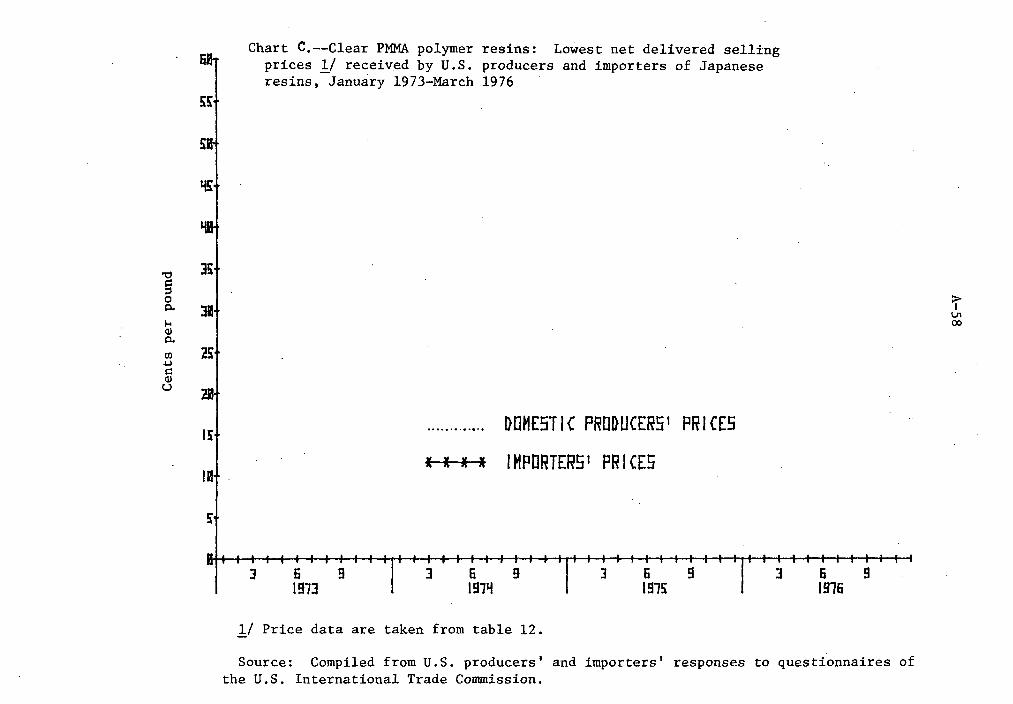
6
~s:
S::
~
"t.I 35 i:: ;j
]Bf 0 p..
'"" Q) p..
Cl) 25 .µ i:: Q) u 21'
I
IS:f
ID
s:
Chart C.--Clear PMMA polymer resins: Lowest net delivered selling prices 1:/ received by U.S. producers and importers of Japanese resins, January 1973-March 1976
.............. DOHESTIC PRODUCERS' PRICES
K l * l IHPDRTER5 1 PRICES
3 6 9 3 6 g 3 6 9 J 1913 191'! 1915
1/ Price data are taken from table 12.
6 g 1916
Source: Compiled from U.S. producers' and importers' responses to questionnaires of the U.S. International Trade Commission.
:r-V1 00
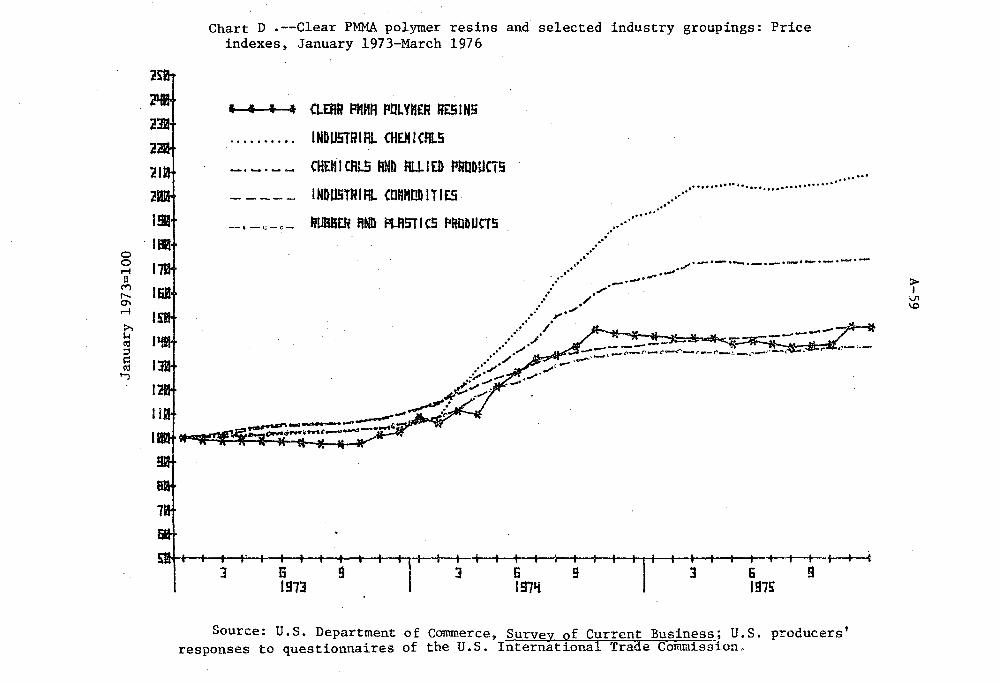
0 0 ..-1 II
("f') .-.. °' ..-1
:>.. 1-1 ell :I ~ ell IJ
· IBfl·
Chart D .--Clear PMMA polymer resins and selected industry groupings: Price indexes, January 1973-March 1976
3
• f • "
-li-c.:-c;-
CLEAR PMMR POLYHER RESINS
INDUSTRIAL CHEH!CRL5
CHEM I ®-5 FIND RLL I ED PRObUCTS
INl>USTHIRL conMODITl£5.
RUalstR RN!> t:iLfl5T I CS ~ffilb UCTS
-.. ··' .. . • .. .·· .. ·
• •• ••• j• •••• ' .. ··· ........... ··············· .. . .·· .. ·········
.·· ...../·-·-·--·-·-·-'--·-·-·
_. . ...,,.,,,,,-• ,•' .~'
,,..
.·· ,,.. ·-"
~ .. ···"./·/·
.. __.....-------... _,.....,,-r-r--c-<"-r ,.. • ·"·/ - -o_,,_ ... _,
_.,.: ........ -~~
~"' _,.,,..·
~-------·~ ~-....-Ii""'~~~-.,~'~ MUtlx......-.
6 1913
g ··1 t I ~ i I ~ I I ~ I I I I' I ~ I I ~ +-g• I ~ 197~ 1915
Source: U.S. Department of Commerce, Survey of Current Business; U.S. producers' responses to questionnaires of the U.S. International Trade Commission.
~ V1 \.0

Library Cataloging Data
U.S. International Trade Commission. Clear polymethyl methacrylate of pellet,
powder, flake, granular, or similar forms from Japan. Determination of no injury or likelihood thereof in investigation no. AA1921-153 under the antidumping act, 1921, as amended, together with the information obtained in the investigation. Washington, 1976.
9, Al-59 p. illus. 27 cm. (USITC Pub. 780)
1. Polymers and polymerization. 2. Vinyl polymers. I. Title.
UNITED STATES
INTERNATIONAL TRADE COMMISSION WASHINGTON, D.C. 20436
OFFICIAL BUSINESS
ADDRESS CORRECTION REQUESTED
ADDRESS CHANGE O Remove from List 0 Change as Shown
Please detach address label and mail to address shown above.
Colll9r, Shannon, Rill & Sdward lbbb K Street, N. W. Washingtor, DC 20006
AT1N: Mr. Donald DeKieffer PUB
PENALTY FOR PRIVATE USE TO AVOID PAYMENT
OF POSTAGE, $300 ~ u.-.MAIL