Embed Size (px)
Citation preview

CLEAN AIR COPENHAGEN– Air quality challenges and solutions

ISBN: 978-87-92044-65-5
Text: Kaare Press-Kristensen, the Danish Ecological Council.
Layout: Designkonsortiet, Hanne Koch.
Print: Svanemærket, KLS
Edition: 1st edition, 1st issue, January 2014.
This publication can be downloaded from the website:
www.ecocouncil.dk under Traffic.
The publication is free and can be ordered from the Danish
Ecological Council with payment of postage.
Citing, copying, or any other usage of this publication is
encouraged and can be done so freely with the appropriate
acknowledgement of source material.
The publication is financed by the EU: LIFE11 ENV/DE/495:
Clean Air Europe and the EU campaign: Soot-free for the
Climate.
Published by
Blegdamsvej 4B,
2200 Copenhagen N
Denmark
Telephone: (+45) 33 15 09 77
www.ecocouncil.dk
TABLE OF CONTENTS
The crucial environmental challenge | 3
Particles and nitrogen oxides | 4
Hazardous soot particles | 6
Air pollution in Copenhagen | 8
Technical solutions | 12
Ineffective open filters | 15
EU regulation | 16
Limit values for soot particles | 20
Low emission zones | 22
Road pricing | 27
Green taxes | 29
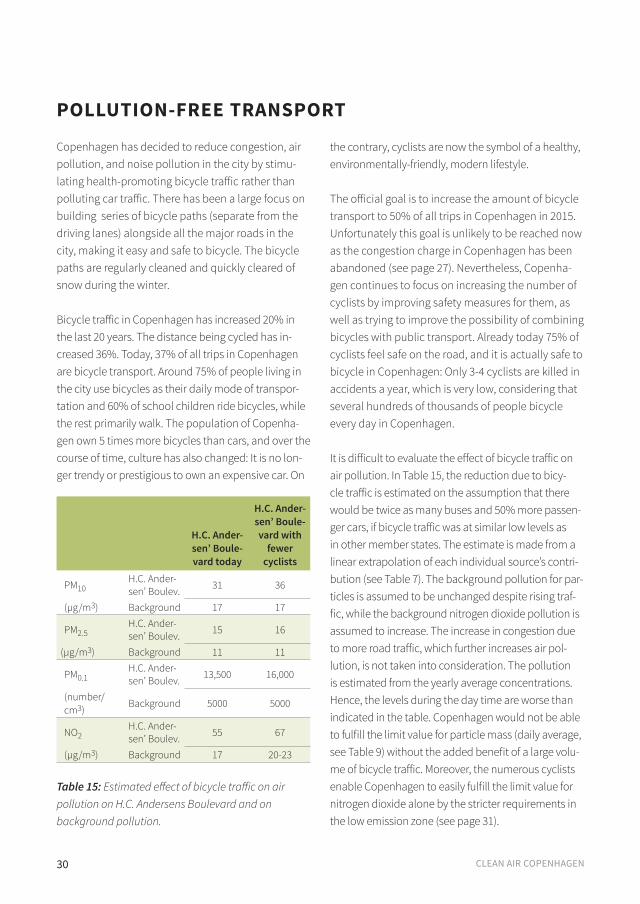
Pollution-free transport | 30
Fulfilling the air quality directive | 31
NGO activities | 32
Recommendations | 34
Additional information | 35

CLEAN AIR COPENHAGEN 3
pollution sources are substantially less than the damage costs caused by air pollution. Despite all of this evidence, many cities in the EU still violate the EU’s basic limit values for air pollution.
The Commission’s official estimates are currently ba-sed on air pollution with fine particles and ground-le-vel ozone. Research from recent years has found that in larger cities, ultrafine soot particles from traffic exhaust cause unnoticed health problems. The num-ber of premature deaths, illnesses, and costs related to air pollution is thereby substantially larger than proclaimed by the Commission. Despite this, there are still no limit values for soot particles in the EU.
In larger cities road traffic is the dominant source of exhaust particles and exhaust gases inhaled by the general public. This is caused by the large amount of polluting traffic on city roads at exactly the same time when the city is most populated. Consequently, the focus of this publication is on the damaging air pollu-tion caused by road traffic. Based on a detailed study of the air pollution in Copenhagen, the most effective methods for fulfilling the limit values in the Air Quality Directive, as well as minimizing the pollution with hazardous ultrafine soot particles, are identified.
According to the Commission’s latest estimates, air quality is a health hazard in over 80 percent of EU cities. Every year approximately 400,000 Europeans die prematurely due to air pollution, while many millions fall seriously ill. On average, a lifespan is cut short by around 10 years in the case of a pre-mature death due to air pollution. Accumulatively, this equates to a staggering 4 million potential life years lost due solely to air pollution every year in the EU. The associated socio-economic health costs are approximately 500 billion euro a year. In com-parison, Denmark’s total GDP is around 200 billion euro a year. Figure 1 shows the number of years an average life span is reduced by air pollution with fine particles in the EU. Prior to an early onset death, the stricken usually suffer through years of severe illness, therefore the actual number of lost, healthy living years is misrepresented and is in fact substantially larger than the official number of life years lost. On top of health issues, damages by air pollution extend to crops, nature and historical constructions etc. Air pollution is the most expensive environmental health problem in the EU. Paradoxically, several cost-benefit analyses from the Commission show that reducing air pollution is socio-economically very beneficial, as reduction costs for most of the
THE CRUCIAL ENVIRONMENTAL CHALLENGE
Figure 1: Life years lost due to air pollution with fine particle in the EU. Source: European Environment
Agency, 2013.
70°60°50°
40°
40°
30°
30°
20°
20°
10°
10°
0°
0°-10°-20°-30°
60°
50°
50°
40°
40°
0 500 1000 1500 km
Years of life lost (YOLL)
Reference year: 2005
Years
0–0.5
0.5–1
1–5
5–10
10–25
25–50
50–100
100–500
500–5 000
> 5 000
Poor data coverage
Outside data coverage

4 CLEAN AIR COPENHAGEN
ultrafine particles and nanoparticles are measured in numbers of particles (number/cm3). This is becau-se coarse and fine particles dominate the particle mass whereas ultrafine particles and nanoparticles dominate the particle number and contribute insig-nificantly to the particle mass. This is illustrated in Figure 2.
Based on their diameter, air particles can be divided into five particle fractions: the particle mass, coarse particles, fine particles, ultrafine particles, and nano-particles. The five fractions are shown in Table 1.
Note that coarse and fine particles together make up the total particle mass and that all three fracti-ons are measured in units of mass (µg/m3), while
PARTICLES AND NITROGEN OXIDES
Diameter in micrometers Unit of measure
The particle mass (PM10) < 10 µg/m3
Coarse particles (PM2.5-10) 2.5 - 10 µg/m3
Fine particles (PM2.5) < 2.5 µg/m3
Ultrafine particles (PM0.1) < 0.1 number/cm3
Nanoparticles (PM0.02) < 0.02 number/cm3
Table 1: Characterization of particle fractions.
Figure 2: The large particles dominate the particle mass, while the smaller particles dominate the particle number.Source: Danish Centre for Environment and Energy, 2012.
Nanoparticles (PM0.02)
Coarse particles(dust from road, tyres etc.)
Particles from regional transport
NumberMass
Ultrafine particles (PM0.1)Fine particles (PM2.5)
Particle mass (PM10)
100 µm
CLEAN AIR COPENHAGEN 5
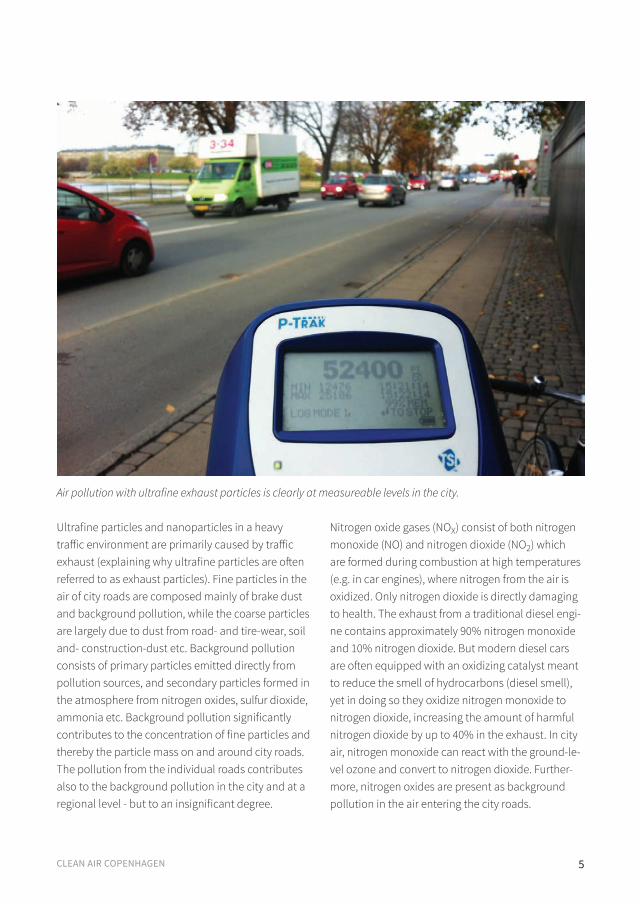
Nitrogen oxide gases (NOX) consist of both nitrogen monoxide (NO) and nitrogen dioxide (NO2) which are formed during combustion at high temperatures (e.g. in car engines), where nitrogen from the air is oxidized. Only nitrogen dioxide is directly damaging to health. The exhaust from a traditional diesel engi-ne contains approximately 90% nitrogen monoxide and 10% nitrogen dioxide. But modern diesel cars are often equipped with an oxidizing catalyst meant to reduce the smell of hydrocarbons (diesel smell), yet in doing so they oxidize nitrogen monoxide to nitrogen dioxide, increasing the amount of harmful nitrogen dioxide by up to 40% in the exhaust. In city air, nitrogen monoxide can react with the ground-le-vel ozone and convert to nitrogen dioxide. Further-more, nitrogen oxides are present as background pollution in the air entering the city roads.
Ultrafine particles and nanoparticles in a heavy traffic environment are primarily caused by traffic exhaust (explaining why ultrafine particles are often referred to as exhaust particles). Fine particles in the air of city roads are composed mainly of brake dust and background pollution, while the coarse particles are largely due to dust from road- and tire-wear, soil and- construction-dust etc. Background pollution consists of primary particles emitted directly from pollution sources, and secondary particles formed in the atmosphere from nitrogen oxides, sulfur dioxide, ammonia etc. Background pollution significantly contributes to the concentration of fine particles and thereby the particle mass on and around city roads. The pollution from the individual roads contributes also to the background pollution in the city and at a regional level - but to an insignificant degree.
Air pollution with ultrafine exhaust particles is clearly at measureable levels in the city.
6 CLEAN AIR COPENHAGEN
excess mortality causes 300-500 premature deaths every year. Traditionally, the number of premature deaths associated with air pollution has been esti-mated from established dose-response curves of fine particles. These are known to increase the risk of cancer, cardiovascular diseases, blood clots, brain hemorrhages, bronchitis, chronic obstructive pul-monary disease, asthma, as well as premature death in general. However, research from recent years has shown that air pollution with fine particles can only explain a small fraction of the observed excess mor-tality among people living close to roads with heavy traffic. Other factors such as pollution with exhaust gasses, noise, traffic accidents, or that more low-in-come groups tend to live by roads with heavy traffic cannot explain this excess mortality either.
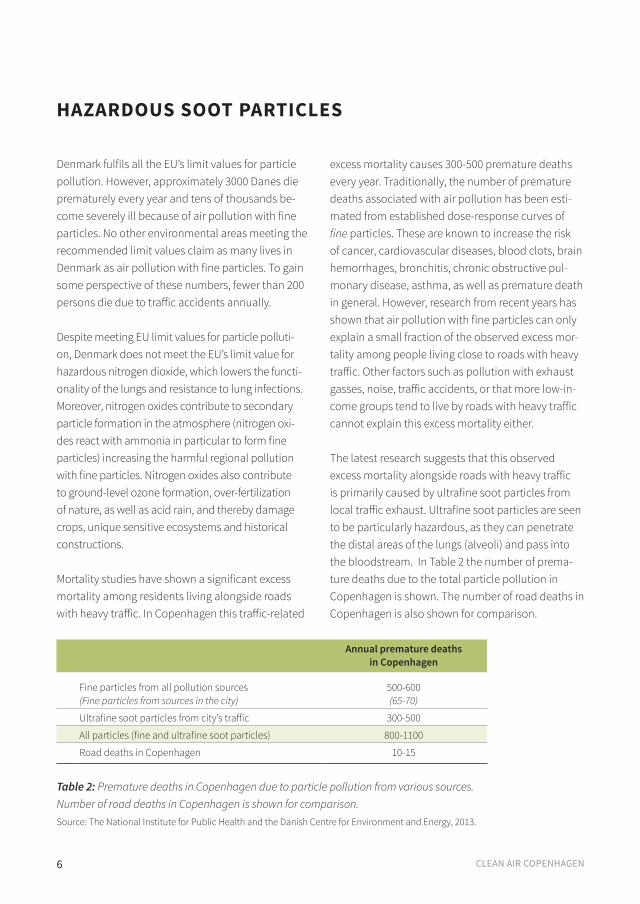
The latest research suggests that this observed excess mortality alongside roads with heavy traffic is primarily caused by ultrafine soot particles from local traffic exhaust. Ultrafine soot particles are seen to be particularly hazardous, as they can penetrate the distal areas of the lungs (alveoli) and pass into the bloodstream. In Table 2 the number of prema-ture deaths due to the total particle pollution in Copenhagen is shown. The number of road deaths in Copenhagen is also shown for comparison.
Denmark fulfils all the EU’s limit values for particle pollution. However, approximately 3000 Danes die prematurely every year and tens of thousands be-come severely ill because of air pollution with fine particles. No other environmental areas meeting the recommended limit values claim as many lives in Denmark as air pollution with fine particles. To gain some perspective of these numbers, fewer than 200 persons die due to traffic accidents annually.
Despite meeting EU limit values for particle polluti-on, Denmark does not meet the EU’s limit value for hazardous nitrogen dioxide, which lowers the functi-onality of the lungs and resistance to lung infections. Moreover, nitrogen oxides contribute to secondary particle formation in the atmosphere (nitrogen oxi-des react with ammonia in particular to form fine particles) increasing the harmful regional pollution with fine particles. Nitrogen oxides also contribute to ground-level ozone formation, over-fertilization of nature, as well as acid rain, and thereby damage crops, unique sensitive ecosystems and historical constructions.
Mortality studies have shown a significant excess mortality among residents living alongside roads with heavy traffic. In Copenhagen this traffic-related
HAZARDOUS SOOT PARTICLES
Table 2: Premature deaths in Copenhagen due to particle pollution from various sources. Number of road deaths in Copenhagen is shown for comparison.Source: The National Institute for Public Health and the Danish Centre for Environment and Energy, 2013.
Annual premature deaths in Copenhagen
Fine particles from all pollution sources 500-600(Fine particles from sources in the city) (65-70)
Ultrafine soot particles from city’s traffic 300-500
All particles (fine and ultrafine soot particles) 800-1100
Road deaths in Copenhagen 10-15

CLEAN AIR COPENHAGEN 7
which assists in making their bodies more resistant to cardiovascular diseases and blood clots, which are the primary causes of deaths related to air pollution. The benefit of exercise from cycling far outweighs the negative side effects of more air pollution potentially being inhaled by cyclists in cities.
Soot particles from exhaust also contribute to climate changes. They absorb radiation in the atmosphere, affect cloud formations and reduce reflective pro-perties (albedo) from snow/ice-covered areas. Soot particles from Europe are transported to the Arctic and deposited on the ice, making the ice grey and able to absorb more sunlight, which increases its surface temperature and in turn accelerates the rate at which the ice melts. For the past few years, a record-breaking amount of ice has melted in the Arctic. There is a grow-ing acceptance that limiting the climate change to a maximum of a 2 degree temperature increase will only be reached if the reduction in emissions of soot par-ticles is paralleled to greenhouse gas reductions. Both significant health and climate benefits can thereby be achieved through reduction of soot particle emissions.
The 500-600 premature deaths due to fine particles from all sources of pollu-tion (80-90% originating from outside Copenhagen) in Table 2 are evenly distributed throughout Copenhagen and therefore cannot explain the excess mortality alongside roads with heavy traffic. The fine particles from all pollution sources inside Copen-hagen (primarily residential wood burning and traffic) can only explain around 65-70 premature deaths a year. Most of these deaths are caused by pollution arising from residential wood burning. Fine particles from traffic within Copenhagen account for only about 20 premature deaths a year. The excess mortality of 300-500 deaths among residents alongsi-de roads with heavy traffic in the city is therefore, believed to be associated with ultrafine soot particles from local traffic exhaust. The World Health Organi-zation (WHO) has classified diesel exhaust (ultrafine soot particles) as a high-level carcinogen. Thus, it is very important to focus on excess mortality associa-ted with ultrafine soot particles from traffic exhaust, which is largely overseen in most studies.
Residents living close to roads with heavy traffic are not the only ones affected by traffic pollution. Drivers are also at risk since exhaust particles are ventilated into vehicles, where limited airflow results in the dri-ver and passengers inhaling the pollution over a long period of time. Hence, air pollution is an overseen work-related problem for road workers, business dri-vers etc. It would be natural to presume that cyclists, who have a quicker rate of breathing than drivers, would theoretically inhale more pollution from the city air and thereby be more vulnerable. However, cyclists through their exercise, are generally healthier

8 CLEAN AIR COPENHAGEN
Table 3 shows that even though HCAB is one of the most traffic-dense roads in Copenhagen, backg-round pollution is a significant contributor to the local measured pollution with both particles and nitrogen dioxide. The background pollution with particle mass (PM10) and fine particles (PM2.5) con-tribute about 55% and 73.5% to the pollution on the road, respectively. It is also noted that the pollution from sources outside the city make up the largest contribution to the pollution of these two particle fractions on HCAB. The opposite is the case for ul-trafine particles (PM0.1) and nitrogen dioxide (NO2), which are primarily caused by pollution from the local traffic on HCAB. This pollution could be drasti-cally reduced by local efforts.
Table 3 is based on yearly average concentrations measured on HCAB. During the daytime, when most people are in the city, up to 80% of nitrogen dioxide concentration and 80-90% of the ultrafine particles concentration on HCAB are caused by pollution from local traffic on the road. Hence, local traffic impacts much more to the inhaled nitrogen dioxide and ultrafine particles than indicated in the table.
Many factors contribute to air pollution near a road: the background pollution in the air that enters the road, the pollution from local traffic on the road, for-mations of pollution in the air around the road (e.g. oxidization of nitrogen monoxide to nitrogen dioxi-de), and the roads’ physical characteristic (important in terms of dilution, air changes, wind exposure etc.).
Background pollutionBackground pollution entering the road consists of pollution from sources within and outside the city (natural and man-made). The pollution from regi-onal sources outside the city is generally smaller in Denmark compared to central parts of the EU that are more densely populated. Denser populations translate to increased sources of regional pollution.
In Table 3, background pollution in Copenhagen is divided into sources of pollution from outside the city and from within the city, as well as the pollution from traffic on H.C. Andersen’s Boulevard (HCAB) in Copen-hagen and the resulting air pollution on HCAB. HCAB is used as a model road since one of the national air measuring stations is located here and the air polluti-on on the road is extremely well investigated.
AIR POLLUTION IN COPENHAGEN
PM10 PM2.5 PM0.1 NO2
µg/m3 % µg/m3 % number/cm3 % µg/m3 %
Pollution from sources outside the city 16 52 10 66.5 2500 18,5 9 16.5
Pollution from sources within the city 1 3 1 6.5 2500 18,5 8 14.5
Background pollution from all sources 17 55 11 73.5 5000 37 17 31Pollution from road traffic on H.C. Andersen’ Boulevard
14 45 4 26.5 8500 63 38 69
Resulting concentration on H.C. Andersen’ Boulevard
31 100 15 100 13,500 100 55 100
Table 3: Sources for the annual average pollution levels of particles and nitrogen dioxide on H.C. Andersen’ Boulevard in Copenhagen. Source: The Danish Centre for Environment and Energy, 2013.

CLEAN AIR COPENHAGEN 9
Pollution from local traffic The air pollution from traffic on the road depends mainly on the amount and composition of the traf-fic, as well as the vehicles’ age and the traffic flow (speed, congestion etc.). On HCAB, there are approxi-mately 51,000 vehicles on an average weekday (sum of vehicles in both directions). The average speed is low during the day due to traffic congestion, espe-cially during the rush hours. In Table 5, the vehicle composition on HCAB is shown. The share of diesel cars in Denmark is rising but is still relatively low (due to historical reasons) compared to most other EU-member states.
In Table 4, different sources contributing to backg-round pollution in Copenhagen for particle mass, fine particles, and nitrogen dioxide are shown. A cor-responding study of ultrafine particles does not yet exist. As shown in Table 4, the category ‘other sources’ is the biggest contributor to background pollution. With regards to particles, this is primarily due to par-ticles transported from far away and particles formed from gases in the atmosphere. Other sources to nitrogen dioxide are, to a large extent, sources in mu-nicipalities around Copenhagen as well as long range transport. The identified sources of particle pollution are dominated by residential wood burning, while nitrogen dioxide is dominated by road transport.
Sources of background pollution in Copenhagen (%)PM10 PM2.5 NO2
Power plants etc. 0.2 0.2 8.3
Residential wood burning etc. 4.6 6.7 1.5
Road transport 2.3 2.6 25.8
Train transport 0.1 0.1 1.2
Construction equipment etc. 0.2 0.3 2.2
Shipping traffic in Oresund 0.1 0.1 3.6
Other sources 92.5 90.0 57.4
Total 100 100 100
Division (%) Fuel
Passenger cars 76.4 70 % Gasoline / 30 % Diesel
Taxis 7.5 Diesel
Vans 11.4 9 % Gasoline / 91 % Diesel
Trucks (< 32 tons) 2.6 Diesel
Trucks (> 32 tons) 0.35 Diesel
Buses 1.7 Diesel
Total 100 ---Heavy traffic (> 3.5 tons) 4.7 Diesel
Table 4: Sources of background pollution with particles and nitrogen dioxide on H.C. Andersen’ Boulevard in Copenhagen. Source: The Danish Centre for Environment and Energy, 2013.
Table 5: Vehicles on H.C. Andersen’ Boulevard in Copenhagen. Source: The Danish Centre for Environment and Energy, 2013

10 CLEAN AIR COPENHAGEN
passenger diesel cars (Euro 3-5) with oxidizing cata-lysts as these vehicles emit a much higher share of harmful nitrogen dioxide in their exhaust than older vehicles.
In Figure 3 the age of vehicles in Copenhagen after Euro standards (see page 16) is shown. Higher Euro standards should mean less polluting vehicles. This does not however, apply for newer diesel vans and
Euro standards on H.C. Andersen’ Boulevard
Figure 3: Vehicles after Euro standards on H.C. Andersen’ Boulevard in Copenhagen. Source: Estimates taken from the Danish Centre for Environment and Energy, 2013.
Local traffic contribution to air pollution on H.C. Andersen’ Boulevard(%)
PM10 PM2.5 PM0.1 NO2
Passenger cars Exhaust 7.5 18 43 38
Non-Exhaust 49.5 36.5 0 0
Total 57 54.5 43 38
Taxis Exhaust < 0.1 < 0.1 < 0.1 6
Non-Exhaust 6.5 5 0 0
Total 6.5 5 < 0.1 6
Vans Exhaust 6 14.5 38.5 17
Non-Exhaust 11.5 8 0 0
Total 17.5 22.5 38.5 17
Trucks Exhaust 2 4.5 11 26
Non-Exhaust 10 6.5 0 0
Total 12 11 11 26
Buses Exhaust 1.5 3.5 7.5 13
Non-Exhaust 5.5 3.5 0 0
Total 7 7 7.5 13
Total Exhaust 17 40.5 100 100Non-Exhaust 83 59.5 0 0Total 100 100 100 100
Table 6: Estimated traffic contribution to the air pollution on H.C. Andersen’ Boulevard in Copenhagen. Source: Estimates on basis of the Danish Centre for Environment and Energy, 2013.
Euro 0Euro 1Euro 2Euro 3Euro 4Euro 5Euro 6
BusTruck (> 32 ton)Truck (< 32 ton)
Vanl, DieselVan, Gasoline
TaxiPassenger car, Diesel
Passenger car, Gasoline

CLEAN AIR COPENHAGEN 11
the majority of the exhaust-related air pollution with particles and nitrogen oxides on HCAB.
Air pollution at road levelIn Table 7, the vehicles’ contribution to the total amount of air pollution on HCAB in Copenhagen is estimated (including background pollution) from the data given in Table 3 and Table 6. From Table 7, it can be clearly seen how low emission zones and traffic limitations will affect air pollution. If all vans were equipped with particulate filters that removed all exhaust particles, then the particle mass (PM10) would be reduced by 2.5%, fine particles (PM2.5) by 4%, and ultrafine particles (PM0.1) by 24%. If the number of passenger cars was reduced by 25%, then the particle mass (PM10) would be reduced by 6.4%, fine particles (PM2.5) by 3.7%, ultrafine particles (PM0.1) by 6.7%, and nitrogen dioxide by 6.5%.
However, the absolute release of nitrogen oxides is reduced in most new vehicles with higher Euro standards.
Table 6 shows that the particle mass from the traffic on HCAB comes primarily from non-exhaust, which coincides with the fact that the particle mass largely consists of dust particles from roads, tires, brakes etc. For vans the amount of fine particles from exhaust exceeds the pollution from non-exhaust due to the numerous older vans present on the road (see Figure 3). It can also be seen that taxi exhaust does not contribute to the particle pollution. This is due to taxis accounting for a small part of the traffic and being primarily new cars (Euro 5) that have factory-installed closed particulate filters. Ultrafine particles and nitrogen dioxide, as expected, come entirely from exhaust. Diesel exhaust contributes to
PM10 PM2.5 PM0.1 NO2
µg/m3 % µg/m3 % number/cm3 % µg/m3 %
Background pollution from outside the city 16 52 10 66.5 2500 18.5 9 16.5
Background pollution from the city 1 3 1 6.5 2500 18.5 8 14.5Background pollution from all sources 17 55 11 73.5 5000 37 17 31
Passenger cars: Exhaust 1 3 0.7 4.7 3650 27 14.5 26
Non-exhaust 7 22.5 1.5 10 0 0 0 0
Taxis: Exhaust 0 0 0 0 0 0 2.3 4
Non-exhaust 0.9 3 0.2 1.3 0 0 0 0
Vans: Exhaust 0.8 2.5 0.6 4 3250 24 6.5 12
Non-exhaust 1.6 5 0.3 2 0 0 0 0
Trucks: Exhaust 0.3 1 0.2 1.3 950 7 10 18
Non-exhaust 1.5 5 0.3 2 0 0 0 0
Busses: Exhaust 0.2 0.5 0.1 0.6 650 5 5 9
Non-exhaust 0.8 2.5 0.1 0.6 0 0 0 0Total pollution from traffic on H.C. Andersen’ Boulevard 14 45 4 26.5 8500 63 38 69
Concentration on road level 31 100 15 100 13,500 100 55 100
Table 7: Estimated sources contributing to the average concentration of particles and nitrogen dioxide on H.C. Andersen’ Boulevard in Copenhagen.

12 CLEAN AIR COPENHAGEN
by incineration of particles in the filter, converting the particles to carbon dioxide and water vapour. Different regeneration techniques and technologies exist, and some of them require that the engines are frequently put under stress (high speed), so tem-peratures will be sufficiently high to incinerate the re-tained particles. Some particulate filters can increase the direct emission of nitrogen dioxide by oxidizing nitrogen monoxide.
City-SCRMore than 80% of the nitrogen oxides (NOX) in the exhaust can be removed in an SCR-system (SCR: Selec-tive Catalytic Reduction). The system consists of a SCR catalytic converter, a NOX-sensor and a source of am-monia. The NOX-sensor releases the required dose of ammonia to the catalytic converter to transform nitro-gen oxides (and ammonia) to harmless free nitrogen and water vapour. Traditionally, urea has been used as a source of ammonia but urea causes destructive pre-cipitation in the SCR-system under low exhaust tempe-ratures. Hence, the dosage of urea is prematurely and automatically stopped at low exhaust temperatures e.g. at slow speed in city centers, rendering the SCR-sy-stem without an effect. This can be solved either by an electrical heater for the catalytic converter, which increases the fuel consumption by 2-5 %, or by adding
Most of the particle emissions from vehicle exhaust can be removed by installing a closed particulate filter in the exhaust system. It is important to distinguish between the effective closed particulate filters and the ineffective open particulate filters. Closed par-ticulate filters remove more than 99% of the particle emissions for all particle sizes (PM10, PM2.5, and PM0.1). Open particulate filters reduce only the largest particle fractions by 15-30% and the reduction of ul-trafine particles is poorly documented (see page 15).
A closed particulate filter consists of a series of closed channels whereby only air (gas) can pass through the channel walls. Particles of all sizes are retained in the filter through ordinary mechanical filtration. In order for filters for heavy vehicles to be
approved in the Danish low emission zones, the filter must remove at least 80%
of the particles – usually the reduction is above
99%. The retained particles are typically removed by a fully automatic regenera-tion of the filter. The regeneration of the
filter is usually done
TECHNICAL SOLUTIONS
The technical solutions for exhaust pollution are fully developed.

CLEAN AIR COPENHAGEN 13
the ammonia as a gas, which eliminates the risk of precipitation. The latter can be done without the need for heating the catalytic converter. When an SCR-system is adapted to work at slow speed in city centers, it will be referred to below as city-SCR. Newer (Euro 4 and Euro 5) heavy vehicles with an SCR-system are not adapted to slow speed and thereby significantly pollute with nitrogen oxides in city centers at slow speed.
A combined filter and SCR solution for heavy vehicles has even been developed and in Denmark it is priced around 16,650 euro. The lifetime of the system is at least 5 years, which equates to approximately 3350 euro a year plus 1350 euro for ammonia and additional service charges. Compare this with the running costs for a heavy vehicle that in Denmark equates to approximately 133,350 euro a year (depreciation allowance, diesel, drivers’ wage, service, insurance etc.). The total additional costs for a closed par-ticulate filter and city-SCR are only 3-4% a year for a truck. To comparison, the installation of a closed particulate filter adds 1-2% to the total annual costs.
Vehicle owners do not voluntarily install closed particulate filters and city-SCR systems, making it apparent that legal measures are needed to ensure that diesel vehicles are equipped with the technical solutions available. The EU’s Euro standards (see page 16) do this to a certain extent with all new diesel vehicles having factory-installed particulate filters and traditional SCR-systems. There is however, an acute need for filters and city-SCR systems (see page 12) on existing vehicles and city-SCR systems on new vehicles with traditional SCR-systems. This can be implemented through low emission zones in larger cities (see page 22).
Besides cleaner air, an obligatory requirement for filters and city-SCR systems ensures that business vehicle owners do not lose their ability to compete in the market by instal-ling these technical solutions (since other business vehicle owners need to do the same). This treatment of business vehicle owners allows them to pass on the costs for the technical solutions to their customers, keeping the market
The combination of closed particulate filters and city-SCR systems effectively remove both particles and nitrogen oxides from the exhaust.

14 CLEAN AIR COPENHAGEN
with the polluter pays the price principle. However, politicians in member states (Denmark included) still hesitate to implement low emission zones requiring technical solutions for both heavy and light vehicles. This is often caused by a misguided protection of business vehicle owners. But as mentioned above, the business vehicle owners can pass on the extra costs directly to the next level in the supply chain and low emission zones will not result in extra costs for them.
Currently there are closed particulate filters available for all vehicles while city-SCR systems are under de-velopment for light vehicles (< 3.5 ton). Particulate filters are relevant for all diesel vehicles and most gasoline cars with direct injection – a technology that is continuously expanding. SCR is only relevant for diesel vehicles, as gasoline cars have a catalytic converter removing nitrogen oxides.
equal between them. In the end, the extra costs for the technical solutions will reach the consumers by a slight increase in pro-duct prices. Since total transport costs are usually a very small part of the product price (often below 1%) the final product price will increase below 0.1%, i.e. below 0.1 euro cent for a liter of milk. This is so minute that the only thing consumers will pay attention to is the cleaner air.
Socio-economic analyses have been made by several different authorities and independent institutions in Denmark and abroad. They underline that it is cost-ef-ficient to require closed particulate filters and city-SCR systems on diesel vehicles in cities since the costs of the air pollution (in the form of illnesses and deaths) are much greater than the prevention and removal costs. As a whole, society could in fact earn money by reducing traffic-related air pollution. Less air pollution in cities will provide more people with a longer and better quality of life. Furthermore, requiring particu-late filters and city-SCR systems is in full accordance
The results underline that society most likely can achieve an overall benefit by retrofitting closed particulate filters on heavy vehicles. The benefit can reach 12 billion euro du-ring the next 15 years (in Denmark). However, this should be seen as the largest benefit possible.
Ref. Samfundsøkonomisk vurdering af partikelfiltre (in Danish), Environ-mental Assessment Institute of Denmark, 2002.
Retrofitting SCR on heavy vehicles would reduce NOX by 3.279 tons in 2010 … SCR gives a net present value (benefit) of 30 million euro.
Ref. Samfundsøkonomisk analyse af NOX reduction (in Danish), Danish EPA, 2006
It has been recognized for many years that it is economically beneficial to clean the exhaust.
15CLEAN AIR COPENHAGEN
than open filters, the closed filters are much more cost-efficient, i.e. remove more particles per invested euro – and the closed filters even work during low speed in cities to remove hazardous ultrafine soot particles.
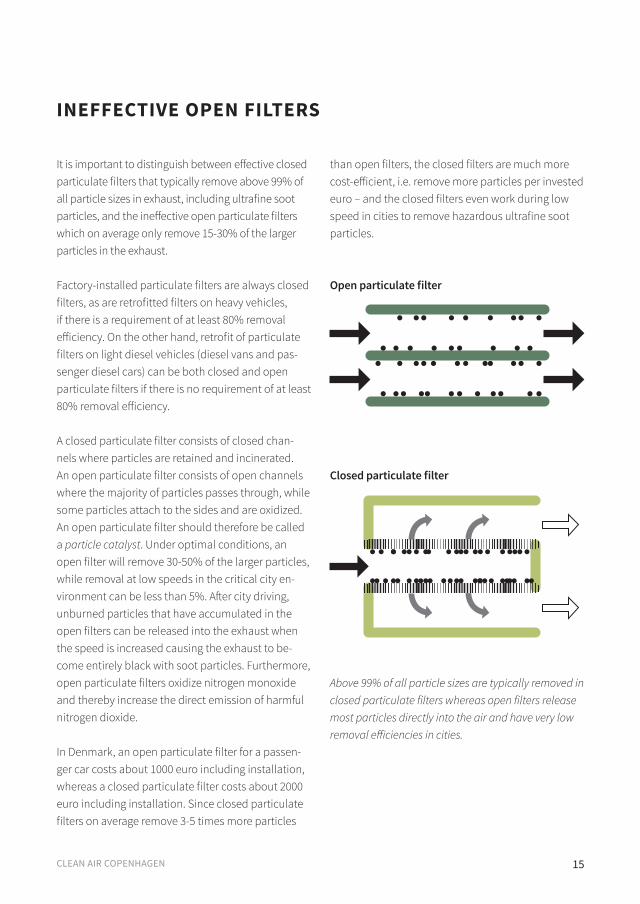
It is important to distinguish between effective closed particulate filters that typically remove above 99% of all particle sizes in exhaust, including ultrafine soot particles, and the ineffective open particulate filters which on average only remove 15-30% of the larger particles in the exhaust.
Factory-installed particulate filters are always closed filters, as are retrofitted filters on heavy vehicles, if there is a requirement of at least 80% removal efficiency. On the other hand, retrofit of particulate filters on light diesel vehicles (diesel vans and pas-senger diesel cars) can be both closed and open particulate filters if there is no requirement of at least 80% removal efficiency.
A closed particulate filter consists of closed chan-nels where particles are retained and incinerated. An open particulate filter consists of open channels where the majority of particles passes through, while some particles attach to the sides and are oxidized. An open particulate filter should therefore be called a particle catalyst. Under optimal conditions, an open filter will remove 30-50% of the larger particles, while removal at low speeds in the critical city en-vironment can be less than 5%. After city driving, unburned particles that have accumulated in the open filters can be released into the exhaust when the speed is increased causing the exhaust to be-come entirely black with soot particles. Furthermore, open particulate filters oxidize nitrogen monoxide and thereby increase the direct emission of harmful nitrogen dioxide.
In Denmark, an open particulate filter for a passen-ger car costs about 1000 euro including installation, whereas a closed particulate filter costs about 2000 euro including installation. Since closed particulate filters on average remove 3-5 times more particles
INEFFECTIVE OPEN FILTERS
Above 99% of all particle sizes are typically removed in closed particulate filters whereas open filters release most particles directly into the air and have very low removal efficiencies in cities.
Open particulate filter
Closed particulate filter

international regulations as well. For example, the new Eco-Design directive will regulate air pollution from new wood stoves, while the IMO (International Maritime Organization) regulates pollution from international shipping. Euro standards The Euro standards continue to introduce even more stringent requirements for emissions from road ve-hicles in the EU. The Euro standards are technology neutral and do not place any requirements on which technologies are used to achieve the still lower
In order to prevent distortion of the competition between member states and to minimize air pol-lution, the EU regulates air quality and emissions of air pollution equally among member states through several directives. For road transport the Euro standards, the Air Quality Directive, and the NEC Directive (National Emission Ceilings) are the most relevant. As Table 3 and Table 4 show, background pollution from ‘other sources’ contri-butes significantly to air pollution – even on city roads with heavy traffic. Sources of background pollution are regulated by other EU directives and
EU REGULATION
VehicleEffective date Factory/Sale NOX-limits
Particle mass limits
Particle number limits
Euro 3
Passenger gasoline car 2000/2001 150 mg/km --- ---
Passenger diesel car 2000/2001 500 mg/km 50 mg/km ---
Van (1.3-1.76 tons) 2001/2002 650 mg/km 70 mg/km ---
Van (> 1.76 tons) 2001/2002 780 mg/km 100 mg/km ---
Truck/Bus (> 3.5 tons) 2000/2001 5 g/kWh 100 mg/kWh ---
Euro 4
Passenger gasoline car 2005/2006 80 mg/km --- ---
Passenger diesel car 2005/2006 250 mg/km 25 mg/km ---
Van (1.3-1.76 tons) 2006/2007 330 mg/km 40 mg/km ---
Van (> 1.76 tons) 2006/2007 390 mg/km 60 mg/km ---
Truck/Bus (> 3.5 tons) 2005/2006 3.5 g/kWh 20 mg/kWh ---
Euro 5
Passenger gasoline car 2009/2010 60 mg/km 5 mg/km a) ---
Passenger diesel car 2009/2010 180 mg/km 5 mg/km 6 ∙ 1011 part./km
Van (1.3-1.76 tons) 2010/2011 235 mg/km 5 mg/km 6 ∙ 1011 part./km
Van (> 1.76 tons) 2010/2011 280 mg/km 5 mg/km 6 ∙ 1011 part./km
Truck/Bus (> 3.5 tons) 2009/2010 2 g/kWh 20 mg/kWh ---
Euro 6
Passenger gasoline car 2014/2015 60 mg/km 5 mg/km a) 6 ∙ 1011 part./km a)
Passenger diesel car 2014/2015 80 mg/km 5 mg/km 6 ∙ 1011 part./km
Van (1.3-1.76 tons) 2015/2016 105 mg/km 5 mg/km 6 ∙ 1011 part./km
Van (> 1.76 tons) 2015/2016 125 mg/km 5 mg/km 6 ∙ 1011 part./km
Truck/Bus (> 3.5 tons) 2013/2014 0.4 g/kWh 10 mg/kWh 8 ∙ 1011 part./kWh
Table 8: Euro standards for road vehicles in the EU. New vehicles with an earlier Euro standard can be sold up to one year after a new Euro standard is put into effect in order to create an opportunity for car dealers to sell their cars in stock. For vans under 1.3 tons, the same limits apply as for passenger diesel cars. Emission limits for gasoline vans are not included as gasoline vans make up a very small part of new vans (the limits are close to the limits of passenger gasoline cars). a) Only for gasoline cars with direct injection.
16 CLEAN AIR COPENHAGEN

17CLEAN AIR COPENHAGEN
ved and sold) and not the actual driving environment. For the case of nitrogen oxides, the emission levels are too high during low speeds in the cities because the temperature cannot get high enough for the SCR catalyst. This can generally be avoided by installing ci-ty-SCR (see page 12). Yet this is not done since it is not necessary to meet the artificial testing requirements in order to get the vehicles approved for sale.
Since Euro 5, new light diesel vehicles have been equipped with factory-installed closed particulate filters, while only new (Euro 6) heavy vehicles are equipped with factory-installed closed particulate filters. Without closed filters the requirement for the number of particles in the exhaust cannot be met. In some member states, there is a growing trend of rem-oving particulate filters on new diesel cars since some people believe that the filters lower the acceleration of the car. Furthermore, there is a large interest for so-called ‘chip tuning’ and this is not always possible for diesel cars with closed particulate filters. When the filter is removed the Euro standards are not met and the car is illegal.
Air pollution in the exhaust is measured for periodic vehicle inspections. Unfortunately, the number of particles in the exhaust is not measured. Broken (or removed) filters are therefore not discovered during inspections. Hence, the particle reductions in the Euro
emissions. The Euro standards thereby promote the development of new and cost-effective technology. These Euro standards can be seen in Table 8. Note that new vehicles with an earlier Euro standard can be sold up to one year after a new Euro standard is put into effect in order to create an opportunity for car dealers to sell the cars in stock. The table shows that diesel cars have traditionally not been regula-ted as strictly as gasoline cars. It is first with Euro standard 6 that new diesel cars are almost as strictly regulated as gasoline cars. It will then take 10-15 years before the existing fleet of diesel cars are repla-ced unless politicians expedite the replacements (or the retrofitting of the existing fleet) by low emission zones (see page 22) and/or economic incentives (see page 29). It is first with EU requirements for particle number that closed particle filters have been instal-led on new vehicles. Emission measurements under realistic driving conditions (low speeds) in the EU’s larger cities have unfortunately shown that the Euro standards do not guarantee the reductions shown in Table 8. This is because the Euro standards are met through special testing conditions in laboratories and these testing conditions are vastly different from the actual driving patterns on city roads. Car producers have designed engines to meet the emission requirements in the artificial testing environment (so cars can be appro-
Measured as Limit value Enforcement year
Particle mass (PM10) Daily average 50 µg/m3 a)2005
Yearly average 40 µg/m3
Fine particles (PM2.5)Yearly average 25 µg/m3 2015
Yearly average 20 µg/m3 b) 2020
Nitrogen dioxide (NO2)Hourly average 200 µg/m3 c)
2010Yearly average 40 µg/m3
Ultrafine soot particles No limit values
Table 9: Limit values for particles and nitrogen dioxide in the Air Quality Directive. a) May not be exceeded more than 35
times in a calendar year. b) Under revision due to new recommendations from the WHO. c) May not be exceeded more than 18 times in a
calendar year.

18 CLEAN AIR COPENHAGEN
several years after it came into force in 2005, as the authorities made no effort to reduce the pollution. This changed when the Danish Ecological Council and other NGOs decided to sue the state in 2008 (see page 32). Today, Denmark fulfills the limit value.”
“Denmark has also exceeded the yearly average limit value for nitrogen dioxide since it was introduced in 2010. The limit value plus the so-called margin of tolerance for nitrogen dioxide has been surpassed in Copenhagen since its introduction in 2002. The politicians ignored the violation and merely reque-sted the Commission for a postponement until 2015 instead of addressing the problem to reduce the pollution. In response, the Danish Ecological Council and other NGOs complained to the Commission (see page 32) which resulted in Denmark´s request for postponement was denied. Subsequently, the politi-cians have ignored the violation and demonstrated a pathetic and inefficient approach to reduce the pol-lution of nitrogen dioxide. In short, Denmark is still violating the limit value and the Directive (and there-by national legislation). In addition, the latest model calculations from the Danish Centre for Environment
standards are only valid until the filter breaks after a lifetime of 5-6 years or until the filter is removed.
Even though the Euro standards have reduced emis-sions, they do not deliver the expected Table 9 (see page 17) reduction of nitrogen oxides and particles. This will only happen when vehicles are approved under test conditions similar to actual driving conditi-ons (low speeds in the cities), when fines for uninstal-ling filters are implemented/enforced, and when the number of exhaust particles are measured at periodic vehicle inspection allowing inspectors to reveal bro-ken (and uninstalled) filters. Furthermore, the increa-sing interest for ‘chip tuning’ has increased pollution to much higher levels than the Euro standards. Air Quality DirectiveThe Air Quality Directive contains limit values (air quality standards) for a long list of air pollutants. Today it is primarily the limit values for larger par-ticles (PM10 and PM2.5) and nitrogen dioxide that are violated by many member states. The directive does not set limit values for ultrafine soot particles. Table 9 (see page 17) shows the limit values for particles and nitrogen dioxide in the directive.
Denmark had large challenges fulfilling the particle mass limit value (daily average) in Copenhagen and Odense. The limit value was continually exceeded for
The concentration of fine particles in Denmark is well below the EU’s limit value for fine particles. Still, approximately 3000 Danes die prematurely every year due to fine particle pollution. The given limit value for fine particles should be 100-1000 times lower if translated to those safety margins set (toxi-cologically justified) for drinking water and food. This issue of limit values for fine particles reflects a political compromise and clearly does not provide the population with sufficient protection.
Figure 4: : Red markings show the expected violations of the limit values for nitrogen dioxide in Copenhagen in 2015.Source: The Danish Centre for Environment and Energy, 2012.

CLEAN AIR COPENHAGEN 19
methane (CH4) and as a consequence, trans-border background pollution with fine particles will also be reduced. The NEC Directive will be important for road transport since road transport is responsible for about one third of the total Danish NOX emis-sion. The new NEC Directive will be able to force politicians to dramatically reduce NOX emission originating from transport, while at the same time put pressure on the Euro standards to provide solid reductions in reality on the roads (see page 18).
Table 10 shows the Danish emission ceilings for 2010 in the present NEC Directive and the Commission’s suggestions for the new ceilings in 2030. Additional-ly, the largest sources of pollution for different air pollutants are shown. Even though the ceilings cur-rently seem ambitious, a large part of the reductions will automatically occur through already decided/planned reductions. Furthermore, ceilings before 2030 are imperative to help avoid that member states delay in reducing air pollution. However, it is a positive step that the Directive has ceilings for fine particles and methane in place, as well as high- lighting that specific attention should be given to reducing soot particles.
and Energy show that the limit value will continue to be violated in 2015 (Figure 4 on page 18).
As shown in Table 9, no limit values exist for ultrafine soot particles in air; even though ultrafine soot par-ticles seem to be the most harmful particle fraction in traffic exhaust, and are shown to increase global warming. The Commission is well aware of this problem, but has not wished to open the Air Quality Directive for negotiations in 2013 in fear of member states taking advantage of the opportunity to wea-ken the existing limit values given by the Directive (Table 9) rather than implementing new limit values. The Danish Ecological Council’s recommendation for limit values for soot particles are found on page 20-21.
The National Emission Ceilings Directive (NEC)The NEC Directive regulates the total emission of sulfur dioxide (SO2), nitrogen oxides (NOX), ammonia (NH3) and non-methane volatile organic compounds (NMVOC) from member states through emission ceilings in tons/year. The EU’s new NEC Directive is expected to be decided in 2015. This will further regulate the emission of fine particles (PM2.5) and
Ceilings for Denmark SO2 NOX NH3 NMVOC PM2.5 Methane
2010: Present NEC Directive(actual ceilings in tons/year)
55,000 127,000 69,000 85,000 --- ---
2030: New NEC Directive (suggested new ceilings in tons/year)
10,000 58,000 46,500 47,000 9000 205,000
Danish emissions in 2011(tons/year)
13,901 125,532 66,513 81,432 23,196 261,600
Largest source of pollution (% of total emissions in 2012)
Energy & industry
(47%)
Transport (47 %)
Agriculture(96%)
Solvents(33%)
Wood burning
(67%)
Agriculture (75%)
Table 10: Danish emission ceilings for 2010 in the NEC Directive and the Commission’s suggestions for new ceilings in 2030. Source: The Commission’s new recommendations for NEC: COM (2013) 918 final, Brussels, 18.12.2013 .
The Danish Centre for Environment and Energy, 2013

20 CLEAN AIR COPENHAGEN
and soot particles (measured as elementary carbon, EC) on HCAB in Copenhagen are compared to the corresponding pollution in Danish nature (far from all pollution sources). In the figure, the concentration is indexed by setting the concentration measured in nature to index 1. The figure shows that the con-centration of fine particles is only slightly higher on HCAB when compared to nature. If fine particles are used as an indicator for traffic pollution, which often is the case, then it follows that the pollution in nature is comparable to the pollution on the most polluted road (HCAB) in Denmark, with over 50,000 vehicles per day. This clearly highlights that fine particles are an inappropriate indicator for pollution for local road traffic. Conversely, it is can be seen that the concentra-tion of soot particles (EC) on HCAB is 7-8 times higher than in nature. The figure, which is based on yearly average concentrations, underestimates the propor-tions as during rush hour the concentration of soot particles on HCAB is more than 15 times higher than that measured in nature. Soot particles are therefore a much better indicator of pollution for road traffic than fine particles. Moreover, soot particles are 5-10 times more harmful than “average” particles and provide a plausible explanation for the observed excess mortali-ty alongside roads with heavy traffic.
The high concentration of soot particles on HCAB can be directly detected in fine particles: On HCAB, the concentration of soot particles (measured as EC in fine particles) is about 2.25 µg per m3. In nature the corresponding concentration of soot particles is about 0.30 µg per m3. Fine particles in the air on HCAB are therefore believed to be a greater health hazard than fine particles in nature. This danger is overlooked in both Danish and international studies where it is simply assumed, due to a lack of data, that all fine particles are equally hazardous without acknowledging the particles’ soot content.
Air pollution with fine particles from local traffic can only explain a small part (below 10%) of the obser-ved excess mortality among people living close to roads with heavy traffic, as mentioned previously (see page 7). The excess mortality cannot be explai-ned by exhaust gases, noise, accidents, or that more low-income groups tend to live close to larger roads. It is for this reason that the excess mortality is chiefly believed to be caused by ultrafine soot particles from the local traffic. Despite increasing evidence, there are still no specific limit values for soot par-ticles, as shown in Table 9. Hence, there is an urgent need to implement limit values for soot particles, so member states are obligated to reduce the ha-zardous soot particles from local traffic exhaust.
Ultrafine soot particles can be directly measured in the city air as black carbon or indirectly as a part of the fine particles (elementary carbon). In Figure 5, the yearly average concentrations of fine particles (PM2.5)
LIMIT VALUES FOR SOOT PARTICLES
Figure 5: Indexed yearly average concentrations of fine particles (PM2.5) and soot particles (EC) in nature and on H.C. Andersen’ Boulevard.
8
7
6
5
4
3
2
1
0
Relative index (Nature = 1)
Pollution in nature versus H.C. Andersen’ Boulevard
Nature
H.C. Andersen’ Boulevard
PM2.5 EC

CLEAN AIR COPENHAGEN 21
ment and a school classroom in Copenhagen, before and after opening windows facing towards roads with heavy traffic. The data in the figure shows that the pollution quickly increases after opening the windows and that the pollution remains high inside the class- room even 40 minutes after the window is closed again. The gradual reduction observed is caused by dilution and aggregation of particles (particles combi-ne to form fewer yet larger particles).
Soot particles and ultrafine particles can be removed by acquiring closed particles filters in low emission zones (see page 26). Based on a series of measure-ments in Denmark and abroad, the Danish Ecologi-cal Council recommends limit values for soot and ultrafine particles as shown in Table 11. The limit values should be implemented into the Air Quality Directive as quickly as possible.
Soot particles are formed by combustion processes. On HCAB, the source of soot particles is exhaust from diesel vehicles that do not have closed particulate filters. Soot particles are emitted as ultrafine particles, however they aggregate quickly and can absorb to the surface of fine particles. Diesel exhaust contains roughly 70% soot particles while the remaining par-ticles are mainly condensate particles (see Figure 2) below 0.02 micrometers. Ultrafine particles larger than condensate particles are therefore used as an indicator for soot particles from traffic. The Danish Ecological Council always measures exhaust particles with a particle counter only measuring the number of exhaust particles with a diameter above 0.02 micro-meters to get an indirect measure of soot particles.
Figure 6 shows measurements of ultrafine exhaust particles (soot particles) from both inside an apart-
Figure 6: Measurements of ultrafine exhaust particles (with a diameter above 0.02 micrometers) in an apartment and in a classroom in Copenhagen before and after opening windows facing roads with heavy traffic.
Table 11: Recommendations for limit values for exhaust particles in the form of soot and ultrafine particles.Limit values are set from measurements with a particle counter (PTRAK: Model 8525 Ultrafine Particle Counter) from TSI. Other particles counters with same measuring spectrums (> 20nm) and quality may be used
Measurement Limit Value
Soot particles Elementary carbon as part of fine particles.
Yearly Average: 0.5 µg pr. m3
Ultrafine particles a) Number of particles larger than 0.02 micro-meters
Yearly Average: 7000 particles per cm3
Hourly Average: 20,000 particles per cm3
a) Hourly average may exceed maxi-
mum limit values 20 days a year (due to
New Year’s Eve, road work etc.).
40,000
30,000
20,000
10,000
000 20 40 60 80 10010
Window opened
20 30 40
Window opened
Ultrafine particles per cm3
Ester Soegade, First floor Class room at school in Copenhagen
Time in minutes
Window closed

22 CLEAN AIR COPENHAGEN
by the attorney´s office, Jon Palle Buhl, rejected the Ministry of Justice’s expropriation argument, as any and all environmental regulations then should simil-arly be seen as expropriation. The Danish Ecological Council then worked intensively using media coverage to create political pressure towards the low emission zone topic. Finally in 2006 an amendment was made to the Law of Environmental Protection to allow low emission zones, and the low emission zone authority was moved from the Ministry of Justice to the Ministry of the Environment. These changes led to expedition of the case, but the law had strict limitations. Low emission zones were only allowed in the five largest Danish cities: Copenhagen, Aarhus, Aalborg, Odense and in Frederiksberg. At the same time, only filter requirements for old, heavy vehicles (Euro 3 and older) could be enforced and the low emission zones could only be implemented in a two-stage process of 14 and 36 months after the law’s approval. This meant that the low emission zones did not require particulate fil-ters on newer heavy vehicles, vans, taxis, or passenger diesel cars, nor the requirement of city-SCR systems on heavy vehicles or catalysts on old passenger gasoline cars. Mopeds, construction equipment and locomo-tives were excluded from the amended law. Taken together, the low emission zones would do little to fulfil the EU’s limit values (see Table 7).
In 2007 Copenhagen and Frederiksberg decided to implement low emission zones. The first stage of filter requirements for the oldest heavy vehicles (Euro 2 and older) went into effect in September 2008. The second stage also included newer heavy vehicles (Euro 3) and this went into effect in July 2010. The filter require-ments were particulate filters with a minimum of 80% removal efficiency (closed particulate filters). Aalborg, Odense and Aarhus later followed and implemented corresponding low emission zones. The documenta-tion for fulfilling the low emission zone requirements is indicated by a green sticker on the front windshield. The fine for not meeting the requirements is 2000 euro for a truck/bus owner and 650 euro for a driver.
Low emission zones with age requirements for vehicles and/or requirements for closed particulate filters and city-SCR systems (see page 12) are effective tools to re-duce air pollution containing hazardous ultrafine soot particles and nitrogen dioxide in city centers. However, low emission zones that only require particulate filters on old heavy vehicles will just result in small reducti-ons of the largest particle fractions (PM10 and PM2.5), which are minimal components of exhaust (see Table 7). However, these low emission zones can reduce the number of days where the particle mass (PM10) exceeds 50 µg/m3 and this would be important in relation to fulfilling the daily average limit value for the particle mass, which must not be exceeded more than 35 times annually (see Table 9).
Low emission zones in DenmarkIn 1997, the Danish Ecological Council for the first time raised the issue of diesel particles in the Danish media and demanded diesel vehicles to be fitted with particulate filters in cities. The Danish Road Traffic Act was revised accordingly in the year 2000 (§ 92d) with the intent on implementing low emission zones. The low emission zones, however, were to be approved by the Ministry of Justice before being implemented by the municipalities. In the years 2002 and 2003 several governmental and independent reports pertaining to health effects of particle pollution in Denmark were released. All of these publications supported the Da-nish Ecological Council’s demand for particulate filters on diesel vehicles in cities.
In 2003, the municipality of Copenhagen applied for permission to implement a low emission zone requi-ring particulate filters for heavy vehicles (> 3.5 tons). After a two-year waiting period the Ministry of Justice denied the application. The key denial argument was that low emission zones were expropriation of busi-ness vehicle owners’ right to pollute. An investigation
LOW EMISSION ZONES

23CLEAN AIR COPENHAGEN
O 2
O 2
- Københavns Kommune indenfor Ring 2 og Frederiksberg Kommune
19.03.07
Miljøzone Stage 1 of Copenhagen’s Low emission zone went into effect on
1 September 2008. Map: Municipality of Copenhagen.
It is hereby noted that municipalities in line with the traffic law will be able to con-duct low emission zone experiments with special requirements for emissions of e.g. particles in closely populated areas.
Report Appendix from the government parties V, DF, KF, KrF published in 2002
It is the opinion of the Ministry of Justice, that the European Court does not restrict low emission zones.
Rejection from the Ministry of Justice on the Municipality of Copenhagen’s application for a low emission zone, May 2005
It is the main conclusions of this report that the establishment of a low emission zone in Copenha-gen, as applied for by the Municipality of Copenha-gen will not be expropriation, but a compensati-on-free regulation.
Attorney Report, Jon Palle Buhl, December 2005
It is in the opinion of the Ministry of Justice that the low emission zone proposal raises serious legal expropriation questions… This is held in connecti-on with the decision in the traffic law § 92d that it does not allow for measures that include notions of expropriation.
Rejection from the Ministry of Justice on the Municipality of Copenha-gen’s application for a low emission zone, May 2005
”

24 CLEAN AIR COPENHAGEN
ticle mass analysis shows fewer asphalt particles after 2009. Variations in the concentration of fine particles (PM2.5) follow, as expected, the variation in the back-ground pollution. The fall in ultrafine particles (PM0.1) from 2007 to 2009 is partly believed to be caused by the low emission zone, as ultrafine particles primarily come from local traffic exhaust (see Table 7), and is directly reduced due to the filter requirements for heavy vehicles. This reduction would have been sub-stantially greater if the zone had also included filter requirements for vans and passenger cars on HCAB. The estimated reduction of nitrogen dioxide (NO2) is due to an accelerated replacement of the oldest hea-vy vehicles to newer Euro standards (see Table 8).
As Table 12 shows, low emission zones with filter requirements are to be evaluated from the reduction of exhaust particles measured as ultrafine particles (black carbon or elementary carbon, see page 20), and not from the reduction of larger particles (PM10 and PM2.5) that originate to a very limited degree from local exhaust. Similarly, future low emission zones with SCR requirements (city-SCR, see page 12) must be evaluated from the reduction of nitrogen dioxide. The values in the table are, as mentioned previously, yearly averages.
The Effect of the low emission zone Table 12 shows the concentration of particles and nitrogen dioxide at the air monitoring station on HCAB (see page 8) and background pollution before and after the implementation of the low emission zone in Copenhagen (Stage 1 in summer 2008 and Stage 2 in summer 2010). The estimated effect of the low emission zone is also shown. It is difficult to predict the effect of the zone by comparing the yearly average concentrations since the zone was announced a long time before it went into enforced effect. That is, ve-hicles might have been replaced and filters installed years before the zone was officially in place. In addi-tion, the pollution level changed due to new asphalt, newer vehicles, changes in the amount of traffic, and more passenger diesel cars etc. Furthermore, signifi-cant variations in the background pollution are seen year after year – especially for the particle mass and fine particles for which the background pollution is a dominating factor (see Table 3). Although problemati-cal, the effect of the low emission zone can be estima-ted by taking all these aspects into consideration.
Table 12 also shows a large change in the particle mass (PM10) from 2008 to 2009, due to asphalt on HCAB being replaced, resulting in less road dust from wear-and-tear on the road. This fully explains why par-
Table 12: Air pollution on H.C. Andersens Boulevard and background pollution before and after implementing the low emission zone (Stage 1 in the summer 2008 and Stage 2 in the summer 2010). The estimated effect of the zone is also shown. a) Own estimate from the yearly average reduction. Source: The Danish Centre for Environment and Energy, 2011.
2007 2008 2009 2010 2011 2012Effect of low
emission zone
PM10 H.C. Andersen’ Boulv. 38 39 30 29 36 32 0.5-1
(µg/m3) Background 24 21 21 20 24 18 0
PM2.5 H.C. Andersen’ Boulv. 23 22 18 18 20 15 0.5-1 (µg/m3) Baggrund --- 13 11 14 17 11 0
PM0.1 H.C. Andersen’ Boulv. 21,000 25,000 15,000 17,000 14,000 14,000 3-5000 a)
(number/cm3) Baggrund 6000 5000 6000 7000 6500 5500 0-500 a)
NO2 H.C. Andersen’ Boulv. 52 55 50 56 54 55 1-2
(µg/m3) Baggrund 19 20 18 17 18 17 1

CLEAN AIR COPENHAGEN 25
absence of a green sticker results in a fine of 40 euro. The low emission zone stickers in the German zones can be purchased at inspection stations across Euro-pe. Comparison of the German low emission zone requirements with the present Danish requirements (shown in Table 13) demonstrates that the German requirements are much stricter than the Danish re-quirements. However, the German requirements for vans and passenger diesel cars can be fulfilled with ineffective open filters (see page 15). It can therefore be assumed that the air quality improvement in the German low emission zones comes mainly from closed particulate filters on heavy vehicles and the ban on old diesel vehicles (Euro 2 and older).
The zone’s effect on ultrafine particles during the daytime (amount of inhaled ultrafine particles), is thereby substantially larger than noted in the table.
German low emission ZonesMany German cities have implemented low emission zones that apply to both heavy and light vehicles. In these zones, cars must be a certain age or meet a filter or catalytic converter requirement. The oldest diesel cars (Euro 2 and older) are forbidden in the zones. Placement of a low emission zone green sticker in the front windshield ensures cars docu-ment their fulfillment of the requirements, while the
Table 13: Comparison between German and Danish low emission zones. a) If a vehicle does not fulfill the technology requirement then it must at least meet this Euro standard.
German low emission zones Danish low emission zones
Technology requirement Age requirement a) Technology requirement Age requirement a)
Trucks and buses Diesel Euro 3 with closed par-
ticulate filter Euro 4 Euro 0, 1, 2 and 3 with closed particulate filters Euro 4
VansDiesel Euro 3, with open (or
closed) particulate filter Euro 4 No Requirement No Requirement
Gasoline Euro 0 with new catalytic converter Euro 1 No Requirement No Requirement
Passenger cars
Diesel Euro 3, with open (or closed) particulate filter Euro 4 No Requirement No Requirement
Gasoline Euro 0 with new catalytic converter Euro 1 No Requirement No Requirement
“Berlin’s low emission zone includes requirements on both heavy and light vehicles

Euro 6 busesOn roads that do not fulfill the EU’s limit value for nitrogen dioxide there should be a requirement for public buses to meet the Euro 6 emission standard during city driving.
Age requirements Light vehicles (older than Euro 3) should be ban-ned from driving in the low emission zones. Heavy vehicles older than Euro 3 with installed closed particulate filters and city-SCR can continue to be allowed in the low emission zones as their pollution contribution is minimized.
Two-wheeled vehicles Two-wheeled vehicles with combustion engines pol-lute a great deal with ultrafine particles and hydro- carbons (and noise). In low emission zones mopeds, scooters, motorcycles etc. with combustion engines should be prohibited. The ban would promote elec-trical scooters and mopeds, as well as bicycles.
Additional low emission zonesLow emission zones are often implemented in the largest cities. However, many medium-sized cities also suffer from air pollution from traffic and residen-tial wood burning. Such cities should implement low emission zones to reduce both the pollution from traffic and residential wood burning.
Low emission zone recommendationsThe Danish Ecological Council recommends low emission zones with requirements for:• Closed particulate filters on all diesel vehicles
and on gasoline cars with direct injection. • City-SCR (see page 12) for heavy vehicles (or a
comparable technology).• Public buses that fulfill Euro 6 (as a minimum on
the most polluted roads).• Age requirements prohibiting light vehicles older
than Euro 3. • Emission and noise requirements for two-wheel-
ed motor vehicles (moped etc.)
Furthermore, it should be possible for medium-sized cities to implement low emission zones.
Filter requirementsHeavy Euro 4 and Euro 5 vehicles pollute up to 500 times as much with ultrafine soot particles compa-red to older heavy vehicles retrofitted with closed particulate filters. For that reason filter requirements for all heavy vehicles in low emission zones should be mandatory. Furthermore, there should be re-quirements for closed particulate filters on diesel vans, passenger diesel cars, and gasoline cars with direct injection. Similar requirements should be implemented for construction equipment and diesel locomotives.
City-SCR Heavy vehicles contribute significantly to the polluti-on with nitrogen dioxide on the most polluted roads (see Table 7), often not fulfilling the NO2 limit values given by the Air Quality Directive. City-SCR systems (see page 12) on heavy vehicles (or a comparable technology) should be required in low emission zones. Once city-SCR is fully developed to vans, the requirement should apply to these as well.
26 CLEAN AIR COPENHAGEN

CLEAN AIR COPENHAGEN 27
Both congestion charges and satellite-based road pricing can effectively reduce air pollution in cities by reducing traffic. The advantage of road pricing is that all the country’s vehicles are targeted and the rates are easier to differentiate after time and place (a higher rate during rush hour in the larger cities and a lower rate at night). On the other hand, road pricing is significantly more expensive and techni-cally difficult to put into place. Both systems would only decrease the number of passenger cars, as the business sector can invoice the additional costs directly to their customers and are thus, not econo-mically affected. The reduction of passenger cars is dependent upon on the rates. Typically, rates are adjusted so the number of passenger cars is reduced by 15-25%. As passenger cars contribute significantly to air pollution (see Table 7), such a reduction would significantly improve the air quality in Copenhagen. Another way to further reduce air pollution would be to link the ‘congestion charge/road pricing’ directly to the vehicles’ Euro standards (pollution), so that the charges are highest for the oldest cars and lowest for the newest. This would primarily target the oldest cars and assist in their removal from the roads. Simultaneously it would promote a general exchange of old vehicles, thus reducing air pollution. Part of the road pricing proceeds should be used with the intent on improving alternative transport, i.e. better cycling conditions, public transport etc.
As a temporary alternative to road pricing, the Da-nish Ecological Council has suggested a simpler system by sealing the car odometer and paying a fee according to the number of kilometers driven annually. People can read and declare the number of kilometers themselves, and when the car is in for mandatory inspection, the readings can be control-led. Again, the charges should depend on the Euro standard of the vehicle.
Several large European cities (London, Stockholm, Milan and others) have implemented a congestion charge, whereby drivers have to pay a levy to drive in the city center. The goals have mainly been to redu-ce congestion and to improve the city environment by reducing traffic. Other member states (such as the Netherlands) have investigated the opportunity to reduce traffic through satellite-based road pricing, but postponed the idea indefinitely.
In Copenhagen and surrounding municipalities, about 150,000 hours per day are collectively lost due to congestion. This number corresponds to 20,000 fulltime employees sitting passively in traffic conges-tion all day. The yearly financial loss for the Danish society is about 1.4 billion euro. Moreover, congesti-on increases air pollution. The current government promised in their government platform to imple-ment a congestion charge in Copenhagen in order to reduce congestion and air pollution. Unfortunately, the government cancelled this promise because the congestion charge was met with some criticism from the media. Similar critique was seen in member states prior to implementing congestion charges, yet opposition diminished almost completely after it was implemented when the public experienced the direct benefits of less congestion and better city environments. Copenhagen did unfortunately not reach this point yet. However, the government established a Congestion Commission consisting of the leading Danish traffic experts. The Congestion Commission concluded that satellite-based road pricing was the only other effective way to reduce congestion. But this proposal was rejected by the government with the argument that Denmark is not to be the technological leader in the field of satel-lite-based road pricing. Hence, congestion will simp-ly increase in the coming years, even with improved infrastructure.
ROAD PRICING

28 CLEAN AIR COPENHAGEN
The results are shown in Figure 7 and Table 14. It is seen that the pollution with ultrafine exhaust par-ticles within the congestion charge area is less than half that of the pollution at the bus stop outside the area. Inside the congestion charge area, pollution mainly originates from buses, scooters, mopeds and motorcycles. Pollution inside this area can be redu-ced by including scooters, mopeds, and motorcycles in the congestion charge, as well as requiring filters on all buses. The pollution outside the congestion charge area can be reduced by imposing yet another congestion charge area (and a low emission zone) further from the city center so the amount of traffic is generally reduced (and pollutes less).
Congestion charge in Milan Milan has implemented a congestion charge around a central city area that is bordered by a ring road. In June 2013, the Danish Ecological Council measured1
ultrafine exhaust particles to document the effect of the congestion charge. The measurements took pla-ce at a bus stop outside the congestion charge area (Corso XXII Marzo), at a corresponding bus stop inside the congestion charge area (Corso di Porta Vittoria), and by the ring road (Viale Bianca Maria) around the congestion charge area. For comparison, the backg-round pollution in the middle of a public park (Largo Marinai d’Italia) was measured.
Figure 7: Measurements of ultrafine particles to assess the congestion charge area in Milan.
Table 14: Measurements (rounded off) of ultrafine particles during rush hours in Milan.
Average (number of particles
per cm3)
Measurements(number of measure
points)
Bus stop outside congestion charge area 29,050 1800In the middle of a park (background pollution) 6475 780Ring road around the congestion charge area 35,150 1260Bus stop inside the congestion charge area 11,500 1740
Milan, Juni, 2013
90,00080,00070,00060,00050,00040,00030,00020,00010,000
0
Ultrafine particles per cm3
Bus stop outside congestion charge area
Park Ring road around congestion charge area
Bus stop inside congestion charge area
Moped and bus accelerating
Bus Motorcycle
1 Measurements were performed with a PTrak (Model 8525 Ultra-fine Particle Counter) from TSI see page 21

CLEAN AIR COPENHAGEN 29
The previous government took a step towards this direction in 2010 by imposing a tax of 130 euro a year for vans and passenger diesel cars without particula-te filters. But no requirements for closed filters were made, meaning that car owners can avoid the tax by installing ineffective open filters (see page 15). A year after the filter tax was introduced, about 1300 diesel car owners (0.5%) had installed open filters in order to avoid the tax, while around 300,000 car owners chose to pay the tax. Those few car owners that bought an open filter now have a filter with a very low efficiency. The mistake in this was that the filter tax should have been 650 euro a year and that requirements for closed particulate filters should have been specified. The low filter tax implemented indicates that the real agenda with the introduction of the filter tax was to create revenue for the state rather than to limit air pollution.
Particulate filters and city-SCR systems (see page 12) are not automatically installed on vehicles sin-ce there is no direct overlap between the polluter (e.g. a truck owner), those affected by the pollution (e.g. children), and those who in the end pay for the damages (hospitals and tax payers). Hence, it is not the polluter that suffers from the pollution or pays the damages. As such the polluter has no incentive to reduce the pollution caused by their vehicle. This can be changed through green taxes on polluting vehicles that impose the polluter pays the price principle: the polluter will reduce the pollution to avoid the tax, and the polluter (e.g. a truck owner) can cover the extra costs for filters and SCR systems by raising the costs on transport services, without losing the ability to compete (competitors have the same price increase). Furthermore, green taxes will stimulate development, production, marketing, and usage of less polluting vehicles.
Green taxes are one of the most effective tools in reducing pollution and resource consumption. This also applies to air pollution from road transport. At the same time green taxes are a national issue, whe-re the individual member states can decide to intro-duce green taxes independently of the EU (as long as the taxes do not hinder free competition). Through green taxes, member states can regulate the size, vehicle age, composition and thereby the pollution of the entire traffic fleet. Green taxes within the trans-port area are recommended by the EU and OECD and can form the basis for a green tax-change, where high taxes are placed on pollution and resources with the proceeds going towards lowering income tax. This means that activities (pollution and resour-ces) that society wishes to reduce are taxed more, while tax on activities society wishes to promote (e.g. work) are taxed less.
The high Danish registration tax on new cars has held Danish car ownership at a low level, compared to its neighboring countries. Furthermore, both the Danish registration tax and the annual green car owner’s tax are differentiated after the cars’ fuel consumption (CO2-emission) resulting in Danes mainly buying small energy-efficient cars. This in turn has lowered traffic CO2-emissions. However, in 2007 small diesel cars without particulate filters were economically favored as the direct result of a tax-change, which drastically increased the pollu-tion with ultrafine particles and nitrogen dioxide. This highlights the urgent need for a green tax that will encourage these car owners to retrofit old, pol-luting diesel vehicles with closed particulate filters, e.g. a high annual car-owner tax on vehicles that do not meet the low emission zone requirements recommended by the Danish Ecological Council (see page 26).
GREEN TAXES
30 CLEAN AIR COPENHAGEN
the contrary, cyclists are now the symbol of a healthy, environmentally-friendly, modern lifestyle.
The official goal is to increase the amount of bicycle transport to 50% of all trips in Copenhagen in 2015. Unfortunately this goal is unlikely to be reached now as the congestion charge in Copenhagen has been abandoned (see page 27). Nevertheless, Copenha-gen continues to focus on increasing the number of cyclists by improving safety measures for them, as well as trying to improve the possibility of combining bicycles with public transport. Already today 75% of cyclists feel safe on the road, and it is actually safe to bicycle in Copenhagen: Only 3-4 cyclists are killed in accidents a year, which is very low, considering that several hundreds of thousands of people bicycle every day in Copenhagen.
It is difficult to evaluate the effect of bicycle traffic on air pollution. In Table 15, the reduction due to bicy-cle traffic is estimated on the assumption that there would be twice as many buses and 50% more passen-ger cars, if bicycle traffic was at similar low levels as in other member states. The estimate is made from a linear extrapolation of each individual source’s contri-bution (see Table 7). The background pollution for par-ticles is assumed to be unchanged despite rising traf-fic, while the background nitrogen dioxide pollution is assumed to increase. The increase in congestion due to more road traffic, which further increases air pol-lution, is not taken into consideration. The pollution is estimated from the yearly average concentrations. Hence, the levels during the day time are worse than indicated in the table. Copenhagen would not be able to fulfill the limit value for particle mass (daily average, see Table 9) without the added benefit of a large volu-me of bicycle traffic. Moreover, the numerous cyclists enable Copenhagen to easily fulfill the limit value for nitrogen dioxide alone by the stricter requirements in the low emission zone (see page 31).
Copenhagen has decided to reduce congestion, air pollution, and noise pollution in the city by stimu-lating health-promoting bicycle traffic rather than polluting car traffic. There has been a large focus on building series of bicycle paths (separate from the driving lanes) alongside all the major roads in the city, making it easy and safe to bicycle. The bicycle paths are regularly cleaned and quickly cleared of snow during the winter.
Bicycle traffic in Copenhagen has increased 20% in the last 20 years. The distance being cycled has in-creased 36%. Today, 37% of all trips in Copenhagen are bicycle transport. Around 75% of people living in the city use bicycles as their daily mode of transpor-tation and 60% of school children ride bicycles, while the rest primarily walk. The population of Copenha-gen own 5 times more bicycles than cars, and over the course of time, culture has also changed: It is no lon-ger trendy or prestigious to own an expensive car. On
POLLUTION-FREE TRANSPORT
Table 15: Estimated effect of bicycle traffic on air pollution on H.C. Andersens Boulevard and on background pollution.
H.C. Ander-sen’ Boule-vard today
H.C. Ander-sen’ Boule-vard with
fewer cyclists
PM10 H.C. Ander-sen’ Boulev. 31 36
(µg/m3) Background 17 17
PM2.5 H.C. Ander-sen’ Boulev. 15 16
(µg/m3) Background 11 11
PM0.1 H.C. Ander-sen’ Boulev. 13,500 16,000
(number/cm3)
Background 5000 5000
NO2 H.C. Ander-sen’ Boulev. 55 67
(µg/m3) Background 17 20-23

CLEAN AIR COPENHAGEN 31
For the congestion charge, the estimate includes an observed lower amount of air pollution due to higher speed, but not reduced pollution due to less congestion (due to lack of data). The effect of the congestion charge is thereby underestimated. As the Danish Road Directorate’s analyses of “traffic chan-ges due to congestion charge” show, most former car drivers would choose to carpool or bicycle. Hen-ce, it is assumed that the number of buses does not increase dramatically due to congestion charge.
As Table 16 shows, the limit value for nitrogen dioxide (40 µg NO2 per m3, see Table 9) in Copenhagen would be fulfilled by implementing a low emission zone with the requirements mentioned above, or by combining a congestion charge and a low emission zone. Tech-nically speaking, Copenhagen (Denmark) can easily fulfill the limit values for nitrogen dioxide in 2015. The government promised both a congestion charge and stricter low emission zones in the government platform from 2011, but the congestion charge was scrapped and there is yet (January 2014) to be made a new low emission zone proposal. The pollution with ultrafine exhaust particles and nitrogen dioxide is seen to be dra-stically reduced in the low emission zone. All reductions are estimated from the yearly average concentrations. Hence, the reduction in air pollution will be significantly larger during day time, meaning that there will be a relatively larger reduction in the amount of inhaled air pollution (the harmful part) than suggested in the table.
The high share of bicycle traffic in Copenhagen, new asphalt on HCAB, and the low emission zones in the city has made Copenhagen (Denmark) able to fulfill all particle limit values in the EU’s Air Quality Directi-ve. Copenhagen on the other hand, exceeds the limit values for nitrogen dioxide which should have been fulfilled in 2010.
In Table 16, the improvement of air quality by 2015 on HCAB in Copenhagen is estimated by:I) Congestion charge (area inside in Ring Road 2)
that reduces the number of passenger cars by 20-25% (business traffic is not affected, see page 27).
II) An environment zone like in Berlin (see page 25), but with requirements for closed particulate filters on all diesel vehicles, city-SCR on all heavy vehicles and buses meeting the Euro 6 standard on the most polluting roads.
III) The combination of I (congestion charge) and II (low emission zone).
HCAB is used as a model street since it is the most polluted road in Denmark. Thus, if the limit values are fulfilled on HCAB it can be assumed that they are fulfilled throughout Copenhagen (Denmark) as well. The estimate below includes an expected fall in air pollution (Reference 2015) due to the “natural” replacement of vehicles. Reference 15 is, however, uncertain for larger particles (PM10 and PM2.5) due to unknown background pollution.
FULFILLING THE AIR QUALITY DIRECTIVE
2015 Reference I: Congestion chargeII: Low emission
zone III: I and II combinedPM10 (µg/m3) 30.5 28.5 29.5 27.5
PM2. 5 (µg/m3) 14.5 14 13.5 13
PM0.1 (number/cm3) 11,500 10,500 6000 5000
NO2 (µg/m3) 51 47 < 40 < 36
Table 16: Estimated reference pollution and improvement in 2015 on H.C. Andersen’ Boulevard by congestion charge, by a low emission zone, and in combination. The estimate is based on the source inventory in Table 7 and reductions from particulate filters and city-SCR.

32 CLEAN AIR COPENHAGEN
ber states and can therefore be used in all member states. Just the threat of a lawsuit against the State quickly motivated politicians in Denmark to develop and implement the needed air quality plans to fulfill the limit value for particle mass.
As mentioned, Denmark has exceeded the limit value for nitrogen dioxide since 2010 when the limit value came in effect. The Danish Environmental Protec-tion Agency (the State) had reports already in 2007 showing that the limit value would be violated in 2010 unless something was done. But nothing was done. The limit value was therefore (as expected) exceeded in 2010 and the Danish State simply asked the Com-mission for a postponement until 2015. Paradoxically, a key argument for the postponement was that Den-mark had a rise in nitrogen dioxide pollution due to an “unexpected” rise in private diesel cars. But the rise in private diesel cars was not unexpected since it was the initial goal of the politicians’ change of car taxes in 2007 (see page 29). However, this information was not, of course, given to the Commission.
The existing low emission zone in Copenhagen was put into effect after massive political pressure from national NGOs. A stricter low emission zone in order to improve public health and fulfill EU’s limit values can only be implemented if NGOs get politicians to act. There are two things that are effective in relation to getting the attention of politicians. The first is a traditional lawsuit against the State for violating the EU’s directives (and thereby national law). The second is a letter of formal notice from the Commission.
The Danish Ecological Council decided in 2008 along with several other green organizations to use the national court to force the State to reduce air pollution of particle mass. The inspiration for the lawsuit was taken from a verdict announced by the European Court (July 25th 2008 in case C-237/07), where a German citizen won a similar case against the state of Bavaria because the state did not devel-op and implement an air quality plan allowing the limit values in the Air Quality Directive to be fulfilled. The verdict is a preliminary ruling that binds mem-
NGO ACTIVITIES
The Danish Ecological Council has earlier been pre-pared to go to court in order to improve air quality.Title: The State will be sued for air pollution”.

CLEAN AIR COPENHAGEN 33
Copenhagen and there are no signs that a new low emission zone will be strict enough to fulfill the limit values in 2015. This will only change if Denmark re-ceives a letter of formal notice from the Commission forcing Denmark to improve air quality – or if Danish NGOs start a lawsuit against the State. The Danish Ecological Council cooperates with European NGOs to procure the Commission to make indictments against member states (including Denmark) that do not bother fulfilling the basic air quality limit values of the EU. However, The Danish Ecological Council does not have the resources to again sue the State for violation of the Air Quality Directive, and thereby national law.
In connection with Project LIFE11 ENV/DE/495: Clean Air Europe, the Danish Ecological Council helt two large conferences in the Danish Parliament about air pollution.
The Danish Ecological Council together with other NGOs filed an objection to the Commission in 2011 concerning the Danish postponement application. The key points in the objection were that the State could not justify that the State itself had attempted to fulfill the limit value in 2010 (since nothing had been done), and that the State could not docu-ment that the limit value would be fulfilled in 2015. Furthermore, the applied postponement period was not kept as short as possible (the limit value for nitrogen dioxide could have been fulfilled in 2013 by stricter low emission zones). In addition, Denmark withheld several points of key information from the Commission. In 2011, the postponement application was denied by the Commission, and in summer 2012 a new official report from the Danish Environmental Protection Agency showed that the nitrogen dioxide limit values could be fulfilled by stricter low emission zones. But still to this day (January 2014), there is no official suggestion for a stricter low emission zone in

34 CLEAN AIR COPENHAGEN
!For the Commission The Danish Ecological Council hereby advises the Commission to:
1) Enforce the existing directives so member states are forced to fulfill the laws of the EU. The Com-mission needs to act quicker to initiate lawsuits against member states not fulfilling the directi-ves. Fines should be higher so it does not pay off to violate the laws of the EU.
2) Set aside a judicial and financial resource pool that NGOs (and private citizens) can seek with the intent of suing member states that do not fulfill the laws of the EU.
3) Ensure that the testing conditions in relation to the Euro standards are representative of actual driving conditions in cities (low speed) so en-vironmental improvements are achieved on the road and not only under artificial test conditions poorly representing actual driving patterns in cities.
4) Implement the suggested (see Table 11) limit values for soot particles and ultrafine particles as well as the WHO’s recommended limit value for fine particles in the next revision of the Air Quality Directive.
5) Implement requirements for particle number measurements at periodic vehicle inspections, so that broken or uninstalled particulate filters are identified, and implement requirements for the measuring of NOX at low speeds in order to ensure that the SCR-systems provide the desired reductions at low speeds (city-SCR).
6) Maintain a strict directive for the reduction of member states’ emissions (NEC Directive).
The air quality in member states will only be impro-ved and the air quality limit values fulfilled if both the individual member states and the Commission (EU) accomplish a goal-oriented effort.
To the member statesThe Danish Ecological Council hereby advises governments in member states and local politicians to:
1) Implement low emission zones in large and me-dium-size cities with the following requirements:
> Closed particulate filters on all diesel vehicles and on gasoline cars with direct injection.
> City-SCR (see page 12) for heavy vehicles (or a comparable technology).
> Public buses that fulfill Euro 6 (as a minimum on the most polluted roads).
> Age requirements prohibiting light vehicles older than Euro 3.
> Emission and noise requirements for two-wheeled motor vehicles (moped etc.).
2) Implement a congestion charge or satellite-ba-sed road pricing where rates are differentiated after the vehicles’ pollution. This will reduce both congestion and environmental problems related to traffic.
3) Change national vehicle taxation so the least polluting vehicles are favored and more people are encouraged to use pollution-free bicycle transport or public transport.
Public health will subsequently improve significantly and (most) member states will fulfill the EU’s limit values for particles and nitrogen dioxide.
RECOMMENDATIONS

CLEAN AIR COPENHAGEN 35
The Danish Ecological Council: www.ecocouncil.dk
Clean Air Europe: www.cleanair-europe.org
Soot-free for the Climate: www.russfrei-fuers-klima.de/international
City ranking: www.sootfreecities.eu
The Danish Centre for Environment and Energy: www.dce.au.dk/myndigheder/luft
ADDITIONAL INFORMATION

Every year about 400,000 Europeans die prematurely and millions of Europeans become severely ill due to air pollution with fine particles. Despite the fact Denmark fulfills all EU’s limit values for fine particles, approximately 3000 Danes die prematurely every year due to air pol-lution containing fine particles. In comparison, less than 200 Danes die due to traffic accidents. Air pollution with fine particles still poses a serious health problem.
The newest research shows that pollution with fine particles cannot explain the excess mortality among people living close to roads with heavy traffic. The excess mortality is most likely caused by the local pollution with hazardous ultrafine soot particles from road traffic. However, there are no limit values for soot particles. Furthermore, new vehicles pollute much more with nitrogen oxide on roads than expec-ted, since vehicles are approved under artificial testing conditions that do not reflect real world conditions.
Luckily, there are several efficient tools to reduce air pollution from traffic. But a goal-oriented effort is needed to implement these tools to improve air quality - both on a member state level and on an EU level. This publication is about effective tools to fulfill the air quality limit values in the Air Quality Directive and at the same time reduce the pollution with hazardous ultrafine soot particles.
CLEAN AIR COPENHAGEN– Air quality challenges and solutions