Embed Size (px)
Citation preview

Classification of Brain-Computer Interface Data
Omar AlZoubi1,2, Irena Koprinska1 and Rafael A. Calvo2 1School of Information Technology
2School of Electrical and Information Engineering University of Sydney, NSW 2006, Australia
[email protected], [email protected], [email protected]
Abstract In this paper we investigate the classification of mental tasks based on electroencephalographic (EEG) data for Brain Computer Interfaces (BCI) in two scenarios: off line and on-line. In the off-line scenario we evaluate the performance of a number of classifiers using a benchmark dataset, the same pre-processing and feature selection and show that classifiers that haven’t been used before are good choices. We also apply a new feature selection method that is suitable for the highly correlated EEG data and show that it greatly reduces the number of features without deteriorating the classification accuracy. In the on-line scenario that we have designed, we study the performance of our system to play a computer game for which the signals are processed in real time and the subject receives visual feedback of the resulting control within the game environment. .We discuss the performance and highlight important issues. . Keywords: classification of EEG data, brain-computer interfaces, correlation-based feature selection
1 Introduction A BCI is a system which allows a person to control
special computer applications (e.g. a computer cursor or robotic limb) by only using his/her thoughts. The idea is to provide a new communication channel to people who are paralyzed but are cognitively intact, e.g. people suffering from the so called locked-in syndrome. BCIs have been a very active area of research, especially over the past ten years (Wolpaw et al. 2000, Dornhege et al. 2007). The research is based on recording and analyzing EEG brain activity and recognizing EEG patterns associated with mental states. For example, imagining a movement of the right hand is associated with a pattern of EEG activity in the left side of the motor cortex. Other frequently used mental tasks are the movement of the left hand, movement of the toes and movement of the tongue. Mental tasks are carefully chosen so that they activate different parts of the brain, which makes them easier to detect.
The increasing success of BCI systems is partially due to a better understanding of the dynamics of brain
Copyright © 2008, Australian Computer Society, Inc. This paper appeared at the Seventh Australasian Data Mining Conference (AusDM 2008), Glenelg, Australia. Conferences in Research and Practice in Information Technology, Vol. 87. John F. Roddick, Jiuyong Li, Peter Christen and Paul Kennedy, Eds. Reproduction for academic, not-for-profit purposes permitted provided this text is included.
oscillations that generate EEG signals. In the brain, networks of neurons form feedback loops responsible for the oscillatory activity recorded in the EEG. Normally the frequency of such oscillations becomes slower with increased synchronization. Sensorimotor activity such as body movements or mental imagery (e.g. imagining body movement) changes the oscillatory patterns resulting in amplitude suppression called event related desynchronization or amplitude enhancement called event related synchronization on the Rolandic mu rhythm (7-13 Hz) and the central beta rhythms above 13 Hz. This phenomenon has been known since the 1940’s (Jasper and Penfield 1949).
Supervised classification methods are employed to learn to recognize these patterns of EEG activities, i.e. to learn the mapping between the EEG data and classes corresponding to mental tasks such as movement of the left hand (Lotte et al. 2007). From data mining point of view this is a difficult learning task due to two main reasons. Firstly, the EEG data is noisy and correlated as many electrodes need to be fixed on the small scalp surface and each electrode measures the activity of thousands of neurons (Lee et al. 2005; Thulasidas, Guan, and Wu 2006)). Selecting the optimal frequency band and extracting a good set of features are still open research problems. Secondly, the quality of the data is affected by the different degree of attention of the subject and changes in their concentration.
Traditionally, classical linear classifiers such as the Fisher’s linear discriminant have been favoured (Lotte et al. 2007; Blankertz et al. 2001, Müller at al 2004). More recently, a variety of machine learning classifiers have been applied, e.g. neural networks such as multi-layer perceptrons (Anderson and Sijercic 1996; Kubat, Koprinska and Pfurtscheller 1998), probabilistic classifiers (Barreto, Frota and Medeiros 2004), lazy learning classifiers such as k-nearest neighbor (Blankertz, curio and Müller 2002) and state of the art classifiers such as support vector machines (Lee at al. 2005). However, as noted by Lotte et al. (2007), it is hard to evaluate these classifiers as the experimental setup, the pre-processing and feature selection are different in the reported studies. In addition, Lotte et al. (2007) also note that some of the classical classification algorithms such as decision trees and also ensembles of classifiers haven’t been evaluated. Thus, the first goal of our study is to evaluate a variety of classification techniques on a multi-class BCI classification task, using a benchmark dataset, and also under the same conditions, i.e. using the same pre-processing and feature selection methods.
For this purpose we used the BCI2000 (Schalk and McFarland 2004) and Weka (Witten and Frank 2005) software and also data from the latest BCI competition

(BCI III) (Blankertz et al. 2006). The BCI2000 is a recently developed publicly available software platform for EEG data recording and signal processing. Weka is a publicly available Java-based open-source library for machine learning and data mining. We have integrated the WEKA’s classifiers in BCI2000 which allows for evaluation of a wide range of classifiers. On the other hand, the BCI competitions provide publicly available datasets recorded at the leading BCI laboratories and can be used for benchmark evaluation which hasn’t been done. We chose dataset IIIa from the BCI III competition, a four class problem.
We also introduce a new pre-processing and feature selection method that is appropriate for the highly correlated and noisy EEG data. It is based on common spatial patterns and correlation-based feature selection. We evaluate the performance of 13 classifiers and compare the results with the top three competition results.
While the classification of BCI competition data is an off-line task, our second goal is to evaluate the performance of our BCI system (using the most successful classifiers from the previous off-line task) in an online experiment. We chose the simple pong computer game. A vertical panel (target) appears in either the right or left side of the screen, and a ball appears in the middle of the screen. The goal is to move the ball towards the target. Three subjects took part in this experiment. We discuss the performance of our system and highlight important issues.
Thus, the contribution of our paper can be summarised as follows: • We propose a new pre-processing and feature
extraction method appropriate for the noisy and correlated nature of the EEG data. • We integrated BCI2000 with Weka and evaluated a
number of classification algorithms using the same experimental setup, pre-processing and feature selection, and also using a benchmark dataset from the BCI competition. We also compared the performance against the BCI competition submissions. • We designed and conducted an online experiment to
evaluate our BCI system in a realistic application. The paper is organised as follows. Section 2 presents
the off-line scenario, i.e. the classification of the BCI competition data. Section 3 presents the on-line classification of BCI data. We describe the datasets, pre-processing and feature selection, present and discuss the results. Section 4 concludes the paper and suggests avenues for future work.
2 Task 1: Off-Line Classification of BCI Competition Data
2.1 Data Acquisition We used dataset IIIa from the BCI III competition (BCI Competition III 2008). It contains data from 3 subjects: K3b, K6b and L1b and was collected as follows (Schlögel 2005). Each subject, sitting in front of a computer, was asked to perform imaginary movements of the left hand, right hand, tongue or foot during a pre-specified time interval. As mentioned before, when a person imagines such movements, there are associated changes in the EEG
data called event-related synchronization or de-synchronization. 60 electrodes were placed on the scalp of the subject recording a signal sampled at 250 Hz and filtered between 1 and 50 Hz using a Notch filter.
Each trial starts with a blank screen. At t=2s, a beep is generated and a cross “+”is shown to inform the subject to pay attention. At t=3s an arrow pointing to the left, right, up or down is shown for 1s and the subject is asked to imagine a left hand, right hand, tongue or foot movement, respectively, until the cross disappears at t=7s. This is followed by a 2s break, and then the next trial begins. For each subject 60 trials per class were recorded.
Two data files are available for each subject: training and testing.
2.2 Pre-processing and Feature Selection Firstly, we applied the Common Spatial Patterns (CSP) method (Müller-Gerking, Pfurtscheller and Flyvbjerg 1999) to the raw EEG data. The standard CSP is applicable to two class problems; it transforms the original signal into a new space where the variance of one of the classes is maximised while the variance of the other is minimized. We used an extension for more than two classes by considering one class versus the rest. The result of the application of CSP to the original 60 signals, for each class versus the others, is a new set of 60 signals ordered based on how informative they are to predict the class. We selected the first 5 projections which resulted in 20 signals (5 channels x 4 projections). Then we applied 3 frequency band filters for 8-12 Hz, 21-20 Hz, 20-30 Hz. Finally, we extracted 7 features: max, min and mean voltage values, voltage range, number of samples above zero volts, zero voltage crossing rate and average signal power. This resulted in 420 (5x4x3x7) discrete numeric features for each subject.
The number of instances in the training and test sets was equal for all subjects and was 180 for K3b, 120 for K6b and 120 for L1b. Each instance was labelled with one of the four classes and the distribution of the classes was equal in both training and test data. Thus, given a set of 120 or 180 instances labelled into 4 classes, each of them 420 dimensional, the goal is to build a classifier for each subject able to distinguish between the 4 classes. This highlights another difficulty in classifying BCI data: the curse of dimensionality - small number of training instances but highly dimensional. It is generally accepted that the number of training instances per class should be at lest 10 times more than the features and that more complex classifiers require a larger ratio of sample size to features (Jain, Duin and Mao 2000).
Good feature selection is the key to the success of a classification algorithm. It is needed to reduce the number of features by selecting the most informative and discarding the irrelevant and redundant features. As EEG data is known to be highly correlated, a feature selection method which exploits this property seems appropriate. We applied a simple, fast and efficient method, called Correlation-Based Feature Section (CFS) (Hall 2000). It searches for the “best” sub-set of features where “best” is defined by a heuristic which takes into consideration 2 criteria: 1) how good the individual features are at predicting the class and 2) how much they correlate with

the other features. Good subsets of features contain features that are highly correlated with the class and uncorrelated with each other. The search space is very big for employing a brute-force search algorithm. We used the best first (greedy) search option starting with an empty set of features and adding new features. It is important also to note that the feature selection was done using the training data only.
As a result, 56 features were selected for B3b, 19 for K6b and 15 for L1b, which is a feature reduction of 86.7% for B3b, 95.5% for K6b and 96.4% for L1b. Thus, this drastic feature reduction confirms that the BCI data is highly correlated. It also reduces the effect of the curse of dimensionality: the ratio of the number of instances per class to the number of features is reduced from 45/420 to 45/56 for K3b, from 30/420 to 30/19 for K3b and from 30/420 to 30/15 for L1b.
2.3 Classifiers We evaluated 13 classifiers using their WEKA’s
implementations (Witten and Frank 2005). They are summarized in Table 1.
classifier Description and parameters
1 ZeroR Predicts the majority class in the training data; used as a baseline.
2 1R A rule based on the values of 1 attribute i.e. one level decision tree, (Holte 1993).
3 Decision Tree (DT)
A classical divide and conquer learning algorithm (Quinlan 1986). We used J48.
4-5
K Nearest Neighbor (k-NN)
A classical instance-based algorithm (Aha and Kibler 1991); uses normalised Euclidean distance. We used k=1 and 5.
6 Naïve Bayes (NB)
A standard probabilistic classifier.
7 Radial-bases Network (RBF)
A 2-layer network. Uses Gausssians as basis functions in the first layer (number and centers set by the k-means algorithm) and a linear second layer and learning algorithm (Moody and Darken 1989).
8 Support Vector Machine (SVM)
Finds the maximum margin hyperplane between 2 classes. We used Weka’s SMO with polynomial kernel. SMO is based on Platt’s optimisation algorithm (Platt 1998)
9 Logistic Regression (LogReg)
Standard linear regression. Weka’s implementation is based on (Le Cessie and van Houwelingen 1992).
10 Ada Boost An ensemble of classifiers. It produces a series of classifiers iteratively; new classifiers focus on the instances which were misclassified by the previous classifiers; uses weighed vote to combine individual decisions (Freund and Shapire1996). We used boosting of 10 decision trees (J48).
11 Bagging An ensemble of classifiers. Uses random sampling with replacement to generates training sets for the classifiers; decisions are combined with majority vote (Breiman 1996). We combined 10 decision trees (J48).
12 Stacking A 2 level ensemble of classifiers (Wolpert 1992).We used 1-NN, NB and DT (J48) as level-1 classifiers and 1-NN as a level-2 classifier.
13 Random Forest (RF)
An ensemble of decision trees based bagging and random feature selection (Breiman 2001). We used t=10 trees.
Table 1: Classifiers used
2.4 Results and Discussion Figures 1, 2 and 3 show the classification results in
terms of accuracy on the test set for the three subjects, under 2 conditions: without and with CFS feature selection. More specifically, each of the 13 classifiers was trained on the training set and tested on the test set; and the accuracy on the test set is reported. The testing set was not used in any way during the training or feature selection.
Subject K3b
0102030405060708090
100
zeroR 1R DT
1-NN
5-NN NB
RBFSVM
LogR
eg
AdaBoo
st
Baggin
g
Stacking RF
classifier
accu
racy
[%]
all features (420)
CFS features (56)
Figure 1: BCI competition data IIIa, subject K3b -
accuracy on test set [%] for various classifiers
Subject K6b
0
10
20
30
40
50
60
70
zeroR 1R DT
1-NN
5-NN NB
RBFSVM
LogR
eg
AdaBoo
st
Baggin
g
Stacking RF
classifier
accu
racy
[%]
all features (420)
CFS features (19)
Figure 2: BCI competition data IIIa, subject K6b -
accuracy on test set [%] for various classifiers
Subject L1b
0102030405060708090
zeroR 1R DT
1-NN
5-NN NB
RBFSVM
LogR
eg
AdaBoo
st
Baggin
g
Stacking RF
classifier
accu
racy
[%]
all features (420)CFS features (15)
Figure 3: BCI competition data IIIa, subject L1b -
accuracy on test set [%] for various classifiers It can be seen that all classifiers, with and without
feature selection, outperform the baseline (ZeroR’s 25% accuracy). Comparing across the subjects, the accuracy is highest for K3b and lowest for K6b. This is consistent with Lee (2005) who note that the three subjects have different amount of experience in BCI training, with K3 being the most experienced subject, L1 having little experience and K6 being a beginner.

The results from Figures 1-3 also show that CFS was a very successful feature selector for all subjects despite the fact that it was very aggressive and discarded a large number of features. It improved or maintained the accuracy for all classifiers except the following 3: LogReg, AdaBoost and Bagging for K3b.
Table 2 shows our best results and the results of the top 3 competition submissions. They were achieved using CFS feature selection and SVM for K3b, AdaBoost and Bagging for K6b and AdaBoost for L1b. As it can be seen our results are the second best for each subject, thus they are comparable with the best submitted results.
BCI team K3b K6b L1b
Hill & Schröder (resampling 100Hz, detrending, Informax ICA, Welch amplitude spectra, linear PCA, SVM)
96.11 55.83 64.17
Guan, Zhang & Li Fisher ratios of channel-frequency-time bins, feature selection, mu- and beta- passband, multiclass CSP, SVM)
86.67 81.67 85.00
Gao, Wu & Wei (surface laplacian, 8-30Hz filter, multi-class CSP, SVM+kNN+LDA)
92.78 57.50 78.33
Ours (multi class CSP, CFS)
93.89 (SVM)
61.67 (Ada
Boost or Bagging)
78.33 (Ada
Boost)
Table 2: BCI competition data IIIa – comparison between the 3 top competition submissions as reported
in Blankertz et al. (2006) and our best results, accuracy [%] on test set
In the rest of this section we focus on the approach
with feature selection and discuss the results in more details. The top three classifiers were as follows: • for K3b: SVM (accuracy on test set: 93.33%), NB
(91.67%) and 5-NN (90.56%) • for K6b: AdaBoost and Bagging (both 61.67%) and
SVM (58.33%) • for L1b: AdaBoost (78.33%), Stacking (73.33%) and
Bagging (71.67%).
Accuracy averaged over the 3 subjects (K3b, K6b, L1b)
0
10
20
30
40
50
60
70
80
zeroR 1R DT
1-NN
5-NN NB
RBFSVM
LogR
eg
AdaBoo
st
Baggin
g
Stacking RF
classifier
accu
racy
[%]
Figure 4: BCI competition data IIIa, accuracy on test
set [%] averaged over the 3 subjects for various classifiers using CFS feature selector
Figure 4 shows the average accuracy on test set across the 3 subjects. The best overall classifier was SVM (74.16%), closely followed by AdaBoost (73.70%), RF (71.76%), Bagging and RBF (both 71.48%). Thus, our results confirm the good generalization ability of SVM but they also show that other algorithms such as ensembles of classifiers and RBF networks produce similar results. Below we discuss each of these 4 classifiers.
SVM were previously shown to classify successfully BCI data but comparisons are difficult as the data, pre-processing and experimental setups were different. The same data was used by Schlögel et al. (2005), the team which collected the BCI IIIa competition data. They applied different pre-processing (adaptive autoregressive processing) extracting 180 features and then compared SVM with linear discriminant analysis (LDA) and k-NN and found SVM to significantly outperform the other 2 algorithms achieving accuracy of 77.2.4% for K3b, 52.4% for K6b and 53.9% for L1b. This accuracy is significantly lower than ours and BCI competition results, especially for the first and third subjects and it may be due to the different experimental evaluation: they used leave-one-out cross validation while we and the BCI competition participants used 1 training/test run, consistent with the rules. In addition, the reason why SVM performed well in their case may be due to the high number of features they retained (180 as opposite to 15-56 in our case) – dealing with high dimensional data is one of the main strengths of SVM and weakness of k-NN.
In our experiments AdaBoost, Bagging and RF were ensembles of decision trees and the results showed that they outperformed the single decision tree classifier with 2-11% (the only exception was RF on K6b which achieved the same accuracy as DT). Boosting of decision trees is a highly successful classifier, frequently used for comparison in machine learning. Bagging is a less complex and faster than boosting; there is empirical evidence (Dietterich 2000, Opitz 1999) that it is more robust to noisy data than bagging which may explain its good performance on the BCI data. RF combines bagging with random feature selection. It is RF is faster than DT as it considers less number of features when selecting an attribute to split on and also does not prune the trees. Our results are also consistent with Breiman (1996) who showed that RF runs faster than AdaBoost and gives comparable accuracy results.
While RF and Bagging hasn’t been used previously to classify BCI data, Boosting of backpropagation neural networks was used by Boostani and Moradi (2004) and was found to be significantly outperformed by linear discriminant analysis. Again, comparison is not possible as the task was different (two imaginary movement classes), the datasets were different and the feature extraction was different (based on band power, Hjort parameters and fraction dimension).
We also found RBF to be a successful classifier. It is a powerful nonlinear classifier, fast to train (in contrast to the slow training of the backpropagation network), accurate in classification and tolerant to noise (similarly to the backpropagation network). While the backpropagation networks have been widely used for

classification of BCI data, RBF hasn’t received enough attention. There seem to be only one published study (Hoya et al. 2003) in the context of BCI data classification - letter imaginary tasks, with principle component analysis and independent component analysis for feature selection and RBF for classification.
In terms of training time, SVM was the slowest classifier (e.g. 1.03s to build a classifier for K3B) as the 4-class problem is decomposed into 4 binary problems, followed by AdaBoost (0.42s) and the remaining 3 classifiers (0.04-0.19s). In general, the current BCI applications are trained off-line which means that accuracy is more important than training time; they require fast classification of new data which is true for all classifiers except lazy classifiers such as k-NN. However, the need to incrementally retrain the classifier to adapt to the incoming data or subject is recognised as one of the desirable features of the future BCI applications, in which case the training time and the development of incremental versions of the algorithms become very important.
In summary, our experiments show that: 1) CFS is an appropriate and successful feature selector for classification of BCI data; 2) SVM, ensembles of classifiers such as AdaBoost, Bagging and RF of decision trees, and also RBF were the best classifiers. While SVM has been widely used in previous BCI data classification, the remaining 4 classifiers haven’t received enough attention although they have many attractive properties; 3) Our classification results are comparable with the top BCI competition results.
3 Task 2: On-line Classification of BCI Data for Playing the Pong Game
There are two stages in this task: 1) collecting data and building classifiers and 2) playing of the pong game on-line using these trained classifiers. Below we discuss the experimental setup and data acquisition for each of them.
3.1 Collecting Data and Building Classifiers Firstly, we need to collect labelled data that will be
used as training data to build a classifier able to recognise “move the cursor right” from “move the cursor left”. This classifier will be then used to play pong on line, i.e. given an EEG signal, it will classify it as one of the two movements and the cursor will be moved accordingly.
The training data has been collected as follows. The subjects sit in front of a computer in a relaxing chair with armrests. They wear EEG recording cap; for this experiment we used three electrodes as described below. In each trial, a cursor (ball) appears in the centre of the screen, and a target (vertical panel) in either the left or right side. The task for the subjects is to move the cursor to the target within a given time (4-5s) by imagining such movement to the right and left (e.g. by imagining movement of the right and left hand, respectively). Thus, we collect data associated with imaginary movement to the right and left, and it is labelled with the correct class based on the target.
Data from 3 subjects was collected: So, Si and Sp. The subjects were firstly given a few minutes to play the game and this data was not recorded. Then, they took part in 1 or more sessions lasting approximately 240s for which
the data was recorded. Each session was divided into trials. Our subjects performed different number of sessions: Si – 1 session, Sp and So – 2 sessions each. Thus, all subjects are beginners, with So being the most experienced and Si the less experienced. To ensure consistency, data from one session was used as a training set; in case of multiple sessions (e.g. for So and Sp), this was the data from the last session. Each session consisted of the same number of trials.
A novel wearable dry electrode EEG recording equipment (Gargiulo et al 2008) was used for the recordings. Three electrodes were used for data acquisition, C3, C4 and Cz according to the international 10-20 system. Sampling has been done at 256Hz with a sample block size of 40Hz. A feature vector was extracted from each trial and it consisted of 11 features for each electrode. These features were derived using a standard BCI EEG data pre-processing using BCI2000 and described below. An autoregressive filter was applied and 11 coefficients were obtained for 11 bins of equal size for frequencies between 0 and 31.5 Hz (BCI2000 ARFilter). Then, a common average spatial filter (BCI2000 Spatial Filter) was applied. This type of filter was shown to produce a good signal to noise ratio and perform well in BCI mental tasks applications (McFarland et al. 1997).
This resulted in 33-dimensional datasets with 3918 instances for Si, 2174 instances for Sp and 4109 instances for So. We used this data to build and evaluate classifiers off-line for each subject.
3.2 On-line Experiment In this experiment we used the classifiers built in the
previous step to play the pong game on-line. The experimental setup and signal pre-processing were the same as before but now the classifier’s prediction is used to move the cursor. More specifically, as before, the subject sits in front of the computer, the same pong game is run and the subject is instructed to imagine left and right movements in order to hit the target. This imaginary movement signal is fed to the classifier; it predicts the class (left or right), the cursor moves accordingly and the subject can see the movement i.e. the subject receives visual feedback. This feedback looks continuous to the subject, i.e. the cursor moves smoothly, although the classification of the signal is discrete.
Performance is calculated as the number of hits, i.e. how many times the target was hit. To hit the target (i.e. move the cursor from the centre to the target) several consecutive signals need to be correctly classified.
3.3 Results and Discussion For the off-line evaluation of the classifiers we used
10-fold cross validation (Witten and Frank 2005). Figures 5, 6 and 7 show the accuracy results for subjects Si, Sp and So, respectively.
The following observations can be made: 1) Subjects So and Sp performed much better than
subject Si. For So, all classifiers outperformed the baseline ZeroR=50.3%. For Sp all but 1 classifier (LogReg with feature selection) outperformed the baseline ZeroR=50.87%. In contrast Si was not able to
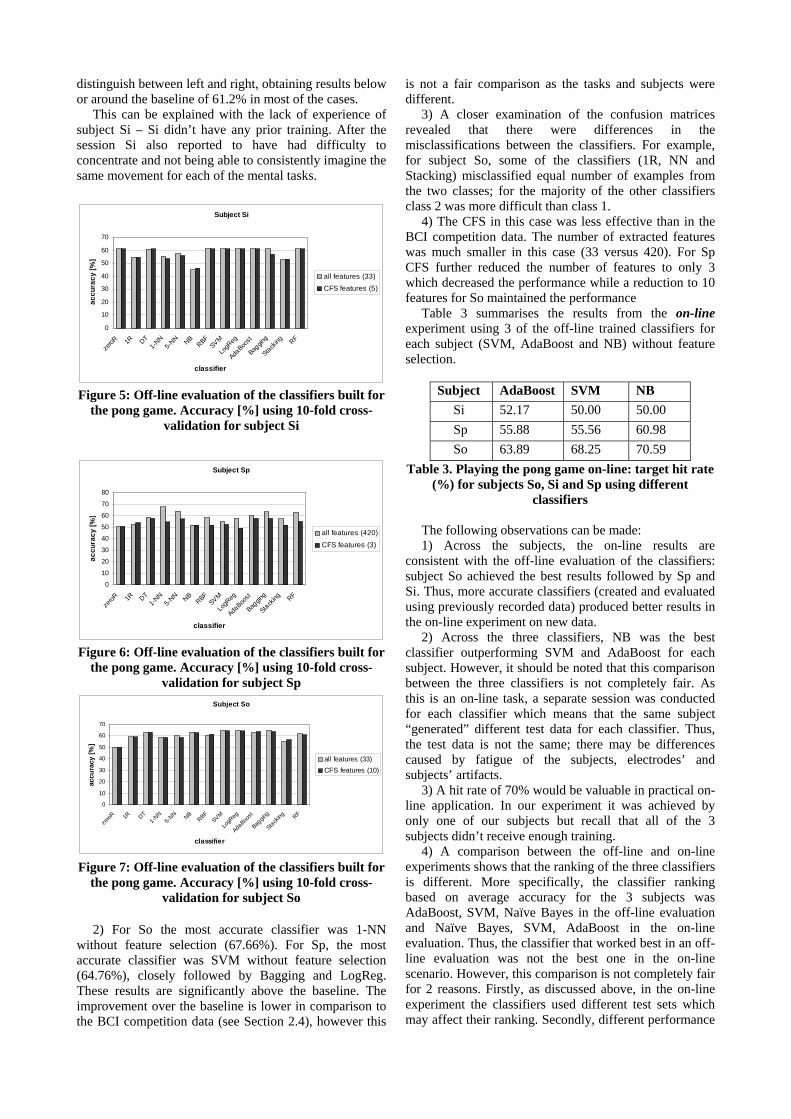
distinguish between left and right, obtaining results below or around the baseline of 61.2% in most of the cases.
This can be explained with the lack of experience of subject Si – Si didn’t have any prior training. After the session Si also reported to have had difficulty to concentrate and not being able to consistently imagine the same movement for each of the mental tasks.
Subject Si
0
10
20
30
40
50
60
70
zeroR 1R DT
1-NN
5-NN NB
RBFSVM
LogR
eg
AdaBoo
st
Baggin
g
Stacking RF
classifier
accu
racy
[%]
all features (33)CFS features (5)
Figure 5: Off-line evaluation of the classifiers built for
the pong game. Accuracy [%] using 10-fold cross-validation for subject Si
Subject Sp
0
10
20
30
40
50
60
70
80
zeroR 1R DT
1-NN
5-NN NB
RBFSVM
LogR
eg
AdaBoo
st
Baggin
g
Stacking RF
classifier
accu
racy
[%]
all features (420)
CFS features (3)
Figure 6: Off-line evaluation of the classifiers built for
the pong game. Accuracy [%] using 10-fold cross-validation for subject Sp
Subject So
0
10
20
30
40
50
60
70
zeroR 1R DT
1-NN
5-NN NB
RBFSVM
LogR
eg
AdaBoo
st
Baggin
g
Stacking RF
classifier
accu
racy
[%]
all features (33)CFS features (10)
Figure 7: Off-line evaluation of the classifiers built for
the pong game. Accuracy [%] using 10-fold cross-validation for subject So
2) For So the most accurate classifier was 1-NN
without feature selection (67.66%). For Sp, the most accurate classifier was SVM without feature selection (64.76%), closely followed by Bagging and LogReg. These results are significantly above the baseline. The improvement over the baseline is lower in comparison to the BCI competition data (see Section 2.4), however this
is not a fair comparison as the tasks and subjects were different.
3) A closer examination of the confusion matrices revealed that there were differences in the misclassifications between the classifiers. For example, for subject So, some of the classifiers (1R, NN and Stacking) misclassified equal number of examples from the two classes; for the majority of the other classifiers class 2 was more difficult than class 1.
4) The CFS in this case was less effective than in the BCI competition data. The number of extracted features was much smaller in this case (33 versus 420). For Sp CFS further reduced the number of features to only 3 which decreased the performance while a reduction to 10 features for So maintained the performance
Table 3 summarises the results from the on-line experiment using 3 of the off-line trained classifiers for each subject (SVM, AdaBoost and NB) without feature selection.
Subject AdaBoost SVM NB
Si 52.17 50.00 50.00 Sp 55.88 55.56 60.98 So 63.89 68.25 70.59
Table 3. Playing the pong game on-line: target hit rate (%) for subjects So, Si and Sp using different
classifiers The following observations can be made: 1) Across the subjects, the on-line results are
consistent with the off-line evaluation of the classifiers: subject So achieved the best results followed by Sp and Si. Thus, more accurate classifiers (created and evaluated using previously recorded data) produced better results in the on-line experiment on new data.
2) Across the three classifiers, NB was the best classifier outperforming SVM and AdaBoost for each subject. However, it should be noted that this comparison between the three classifiers is not completely fair. As this is an on-line task, a separate session was conducted for each classifier which means that the same subject “generated” different test data for each classifier. Thus, the test data is not the same; there may be differences caused by fatigue of the subjects, electrodes’ and subjects’ artifacts.
3) A hit rate of 70% would be valuable in practical on-line application. In our experiment it was achieved by only one of our subjects but recall that all of the 3 subjects didn’t receive enough training.
4) A comparison between the off-line and on-line experiments shows that the ranking of the three classifiers is different. More specifically, the classifier ranking based on average accuracy for the 3 subjects was AdaBoost, SVM, Naïve Bayes in the off-line evaluation and Naïve Bayes, SVM, AdaBoost in the on-line evaluation. Thus, the classifier that worked best in an off-line evaluation was not the best one in the on-line scenario. However, this comparison is not completely fair for 2 reasons. Firstly, as discussed above, in the on-line experiment the classifiers used different test sets which may affect their ranking. Secondly, different performance

measures are used in the off-line and on-line evaluation: accuracy and hit rate, respectively as discussed below.
It is important to note that Table 3 reports the “hit rate” which is the performance index reported by the BCI2000 software. Hit rate is the ratio of the trials when the target was hit to the total number of trials. The hit of the target is just the final step in a sequence of steps, where each step is a classification task. Thus, the hit rate is a very coarse measure of performance which doesn’t tell us how the individual steps were classified. For example, a hit rate of 100% may correspond to accuracy of 80% meaning that the target was always hit but the individual steps were not always correctly classified. Or alternatively, for example, the hit rate can be low and the accuracy high when all the steps except the last one were correctly classified within the given time but the target was not hit. This highlights the need for consistency in the reporting of the BCI classification results and the use of a more informative performance index than the hit rate. Accuracy is a better choice but it doesn’t provide information where the misclassifications were. Reporting the confusion matrix or using recall, precision and their combinations (e.g. the F1 measure) would be a better choice.
In summary, our experiments show that: 1) For some subjects it is possible to train a classifier and use it on-line to control a cursor achieving a hit rate of 70%. For other subjects, the on-line classification was not successful and some of the reasons were insufficient subject training and difficulty of the subject to concentrate both during the collection of the training data and the on-line classification; 2) The classifiers that worked best during the training are not necessarily the classifiers that perform best on-line although such comparison is difficult due to the different performance measures used during the training and on-line classification and also the different test sets used during the on-line classification.
4 Conclusions In this paper we study classification of mental tasks for EEG-based BCI. We consider 2 scenarios: off-line and on-line classification of BCI data.
In the on-line scenario we used 4-class benchmark dataset from the BCI competition to evaluate a number of classification algorithms under the same conditions, i.e. using the same pre-processing and feature selection. The need for such consistent evaluation has been identified in previous research, e.g. Lotte (2007). Our evaluation included algorithms that have not been previously applied for classification of BCI data or have received very little attention such as RF, RBF, Bagging, Stacking and Boosting. The results showed that these classifiers, in addition to the popular SVM, produced best results and are good choices for classification of BCI data. We also applied a new feature selector (CFS) which exploits the high correlation of the EEG data. The results showed that it was very successful: it discarded a large number of features (87-96%) while improving or maintaining the classification accuracy for almost all classifiers. The results also showed that our classification results using CSP for signal processing, CFS for feature selection, and
SVM, AdaBoost or Bagging for classification, are comparable to the top competition results.
We designed an on-line experiment to test the performance of our BCI system in a realistic application. Data from 3 subjects was collected and used to train classifiers, which were then used to control the cursor on-line in a computer game. On the positive side, one of the subjects was able to achieve a hit rate slightly above 70% which would be very valuable for practical BCI applications and could possible be improved with more training. However, the results also highlighted several issues. Firstly, the on-line task is more difficult than the off-line BCI classification setup used in the BCI competition data as there is visual feedback which may affect the performance. Secondly, it is difficult to compare the off-line training performance of the classifiers with their performance for on-line classification as different performance measures are used (accuracy and hit rate) and also as the subject generates different test set for the on-line testing as discussed in Section 3.3.
There are several avenues for future work. First, we plan to use more than 3 electrodes in the on-line task and apply the CSP pre-processing and CFS feature selection. Second, the BCI2000 software could be extended to report accuracy and show the confusion matrices in addition to the hit rate which will allow for consistent comparison. Third, more research is needed to choose the right mental tasks for an on-line BCI application and also to study the effect of the feedback and the potential benefits of using on-line classification algorithms.
5 Acknowledgements We are very grateful to Jorge Villalon and Benjamin Harding for the integration of Weka with BCI2000 and the CSP implementation and to Gaetano Gargiulo for the help with the EEG data recording. This work was supported in part by the University of Sydney bridging support grant U1189
6 References Aha, D., and Kibler D. (1991): Instance-based learning
algorithms. Machine Learning 6:37-66. Anderson C.W. and Sijercic Z. (1996): Classification of
EEG signals from four subjects during five mental tasks. Proc. International Conference on Engineering Applications of Neural Networks (EANN).
Barreto, G.A., Frota R.A. and Medeiros F.N.S. (2004): On the classification of mental tasks: a performance comparison of neural and statistical approaches. Proc. IEEE Workshop on Machine Learning for Signal Processing.
BCI2000 ARFilter: http://www.bci2000.org/wiki/index. php/User_Reference:ARFilter. Accessed July 2008.
BCI Competition III: http://ida.first.fraunhofer.de/ projects/bci/competition_iii/. Accessed July 2008.
Blankertz B., Müller K.-R., Krusienski, D., Schalk G., Wolpaw J.R., Schlögl, A., Pfurtscheller, G., Millan J., Schröder, M., Birbaumer, N. (2006): The BCI2000 Competition III: validating alternative approaches to

actual BCI problems. IEEE Transactions on Neural Systems and Rehabilitation Engineering.
Blankertz B., Curio, G. and Müller K.-R. (2001): Classifying single trial EEG: towards brain computer interfacing. In Advances in Neural Information Processing Systems, T.G. Diettrich, S. Becker and Z. Ghahramani, ed., 14: 157-164.
Boostani, R. and Moradi, M.H. (2004): A new approach in the BCI research based on fractal dimension as feature and Adaboost as classifier. Journal of Neural Engineering 1:212-217.
Breiman, L. (2001): Random forests. Machine Learning 45: 5-32.
Breiman, L. (1996): Bagging predictors. Machine Learning 24(2): 123-140.
Dietterich, T.G. (2000): An experimental comparison of three methods for constructing ensembles of decision trees: bagging, boosting and randomization. Machine Learning 40(2) 139-158.
Dornhege, G., Millán, J. del R., Hinterberger, T., McFarland, D.J. and Müller K.-R. (2007): Toward Brain-Computer Interfacing. Cambridge, MIT Press. Freund Y. and Schapire R.E. (1996): Experiments with a
new boosting algorithm. Proc. International Conference on Machine Learning, 148-156, Morgan Kaufmann, San Francisco.
Gargiulo, G., Bifulco, P., Calvo, R.A., Cesarelli, M., Fratini, A., Jin, C. and van Schaik, A. (2008): A wearable dry-electrode-capable Bluetooth personal monitoring system. Proc. 4th European Conference for Medical and Biomedical Engineering, Antwerp, Belgium.
Garrett, D., Peterson, D.A., Anderson C.W. and Thaut M.H. (2003): Comparison of linear, non-linear and feature selection methods for EEG signal classification, IEEE Transactions on Neural Systems and Rehabilitation Engineering, 11(2): 141-144.
Jain, A. K, Duin, R.P.W. and Mao, J. (2000): Statistical pattern recognition: a review. IEEE Transactions on Pattern Analysis and machine Intelligence 22(1): 4-37.
Jasper, H.H. and Penfield, W. (1949): Electro-corticograms in man: effect of the voluntary movement upon the electrical activity of the precentral gyrus. Arch. Psychiat. Z. Neurol. 183: 163-174.
Hall, M. (2000): Correlation-based feature selection for discrete and numeric class machine learning. Proc. 17th International Conference on Machine Learning (ICML), 359-366, Morgan Kaufmann.
Holte, R.C. (1993): Very simple classification rules perform well on most commonly used datasets. Machine Learning 11: 63-91.
Hoya, T., Hori G., Bakardjian H., Nishimura T., Suzuki T., Miyawaki Y., Funase A. and Cao J. (2003): Classification of single trial EEG signals by combined principal + independent component analysis and probabilistic neural network approach. Proc. 4th International Symposium on Independent Component Analysis and Blind Signal Separation (ICA), Japan.
Kubat, M., Koprinska, I. and Pfurtcheller G. (1998). Learning to classify biomedical signals. In Machine Learning and Data Mining: Methods and Applications, R.S. Michalsi, M. Kubat and I. Bratko (ed.), Wiley.
Le Cessie, S. and van Houwelingen, J.C. (1992): Ridge Estimators in Logistic Regression. Applied Statistics, 41(1):191-201.
Lee, F., Scherer, R., Leeb, R., Neuper, C., Bischof, H. and Pfurtscheller, G. (2005): A comparative analysis of multi-class EEG classification for brain computer interface. Proc. 10th Computer Vision Winter Workshop (CVWW), Technical University of Graz, Austria.
Lotte, F., Congedo M., Lecuyer A., Lamarche F. and Arnalsi B. (2007): a review of classification algorithms for EEG-based brain-computer interfaces. Journal of Neural Engineering 4: R1-R13.
McFarland D.J., McCane l. M., David S.V., Wolpaw J. R. (1997): Spatial filter selection for EEG-based communication. Electroencepalography and Clinical Neurophysiology 103(3) 386-394.
Moody J. and Darken C. (1989): Fast training in networks of locally-tuned processing units. Neural Computation 1: 284-294.
Müller, K-R., Anderson C.W and Birch G.E (2003): Linear and nonlinear methods for brain-computer interfaces. IEEE Transactions on Neural Systems and Rehabilitation Engineering 11(2): 165-169.
Müller, K-R., Krauledar, M., Dornhege, G., Curio, G. and Blankertz, B. (2004): Machine learning techniques for brain computer interfaces. Biomedical Technology 49: 11-22.
Opitz, D. and Maclin, R. (1999): Popular ensemble methods: an empirical study. Journal of Artificial Intelligence Research 11:169-198.
Platt, J. (1998): Fast Training of Support Vector Machines using Sequential Minimal Optimization. In Advances in Kernel Methods - Support Vector Learning, B. Schoelkopf, C. Burges, and A. Smola, eds., MIT Press.
Quinlan, J.R. (1986). Induction of decision trees. Machine Learning 1(1): 81-106.
Müller-Gerking, J., Pfurtscheler, G. and Flyvbjerg H. (1999): Designing optimal spatial filters for single-trial EEG classification in a movement task. Clinical Neurophysiology, 110(5): 787-798.
Schlögl, A., Lee, F., Bischof, H. and Pfurtscheller, G. (2005): Characterization of four-class motor imagery EEG data for the BCI competition 2005. Journal of Neural Engineering 2: L14-L22.
Schalk, G., McFarland D. J., et al. (2004): BCI2000: A general-purpose Brain-Computer Interface (BCI) System. IEEE Transactions on Biomedical Engineering 51(6): 1034-1043.
Thulasidas, M., Guan C. and Wu, J. (2006): Robust classification of EEG signal for brain-computer interface. IEEE Transactions on Neural Systems and Rehabilitation Engineering 14:24-9.

Witten, I. H and Frank, E. (2005): Data mining: practical machine learning tools and techniques. Second edition, San Francisco, Morgan Kaufmann.
Wolpert, D.H. (1992): Stacked generalization. Neural Networks 5: 231-259.
Wolpaw, J.R., Birbaumer, N, Heetderks, W.J., McFarland, D.J, Peckham, P.H., Schalk, G., Donchin, E., Quatrano, L.A, Robinson, C.J., Vaughan, T.M. (2000): Brain-computer interface technology: a review of the first international meeting. IEEE Transactions on Rehabilitation Engineering 8:164-173.