Embed Size (px)
Citation preview
City of Seattle— City Light Department Financial Statements as of and for the Years Ended December 31, 2005 and 2004, Required Supplementary Information, and Independent Auditors’ Report

CITY OF SEATTLE—CITY LIGHT DEPARTMENT
TABLE OF CONTENTS
Page
INDEPENDENT AUDITORS’ REPORT 1
MANAGEMENT’S DISCUSSION AND ANALYSIS 2–13
FINANCIAL STATEMENTS AS OF AND FOR THE YEARS ENDED DECEMBER 31, 2005 AND 2004:
Balance Sheets 14
Statements of Revenues, Expenses, and Changes in Equity 15
Statements of Cash Flows 16–17
Notes to Financial Statements 18–40

INDEPENDENT AUDITORS’ REPORT
Superintendent City of Seattle—City Light Department Seattle, Washington
We have audited the accompanying balance sheets of the City of Seattle—City Light Department (the “Department”) as of December 31, 2005 and 2004, and the related statements of revenues, expenses, and changes in equity and cash flows for the years then ended. These financial statements are the responsibility of the Department’s management. Our responsibility is to express an opinion on the financial statements based on our audits.
We conducted our audits in accordance with auditing standards generally accepted in the United States of America. Those standards require that we plan and perform the audit to obtain reasonable assurance about whether the financial statements are free of material misstatement. An audit includes consideration of internal control over financial reporting as a basis for designing audit procedures that are appropriate in the circumstances, but not for the purpose of expressing an opinion on the effectiveness of the Department’s internal control over financial reporting. Accordingly, we express no such opinion. An audit also includes examining, on a test basis, evidence supporting the amounts and disclosures in the financial statements, assessing the accounting principles used and significant estimates made by management, as well as evaluating the overall financial statement presentation. We believe that our audits provide a reasonable basis for our opinion.
As discussed in Note 1 to the financial statements, the financial statements referred to above present only the Department and are not intended to present fairly the financial position and results of operations of the City of Seattle, in conformity with accounting principles generally accepted in the United States of America.
In our opinion, the financial statements referred to above present fairly, in all material respects, the financial position of the Department as of December 31, 2005 and 2004, and the changes in its equity and its cash flows for the years then ended in conformity with accounting principles generally accepted in the United States of America.
The management’s discussion and analysis on pages 2 through 13 is not a required part of the basic financial statements, but is supplementary information required by the Governmental Accounting Standards Board. This supplementary information is the responsibility of the Department’s management. We have applied certain limited procedures, which consisted principally of inquiries of management regarding the methods of measurement and presentation of the supplementary information. However, we did not audit the information and express no opinion on it.
April 28, 2006

- 2 -
CITY OF SEATTLE—CITY LIGHT DEPARTMENT
MANAGEMENT’S DISCUSSION AND ANALYSIS DECEMBER 31, 2005 AND 2004
The following discussion and analysis of the financial performance of the City of Seattle—City Light Department (the “Department”) provides a summary of the financial activities for the years ended December 31, 2005 and 2004. This discussion and analysis should be read in combination with the Department’s financial statements, which immediately follow this section.
ORGANIZATION
The Department is the public electric utility of the City of Seattle (the “City”). As an enterprise fund of the City, the Department owns and operates certain generating, transmission, and distribution facilities and supplies electricity to approximately 376,000 customers. The Department also supplies electrical energy to other City agencies at rates prescribed by City ordinances.
OVERVIEW OF THE FINANCIAL STATEMENTS
The Department’s accounting records are maintained in accordance with generally accepted accounting principles for proprietary funds as prescribed by the Governmental Accounting Standards Board (GASB) and, where not in conflict with GASB pronouncements, accounting principles prescribed by the Financial Accounting Standards Board (FASB). The Department’s accounting records follow the Uniform System of Accounts for Public Licensees prescribed by the Federal Energy Regulatory Commission (FERC).
This discussion and analysis is intended to serve as an introduction to the Department’s basic financial statements, which are comprised of the financial statements and the notes to the financial statements. The Department’s financial statements include the following:
Balance Sheets, Statements of Revenues, Expenses, and Changes in Equity, and Statements of Cash Flows—The basic financial statements provide an indication of the Department’s financial health. The balance sheets include all of the Department’s assets and liabilities, using the accrual basis of accounting, as well as an indication about which assets can be utilized for general purposes, and which assets are restricted as a result of bond covenants and other commitments. The statements of revenues, expenses, and changes in equity report all of the revenues and expenses during the time periods indicated. The statements of cash flows report the cash provided and used by operating activities, as well as other cash sources such as investment income and cash payments for bond principal and capital additions and betterments.
Notes to the Financial Statements—The notes to the financial statements provide additional information that is essential to a full understanding of the data provided in the financial statements.

- 3 -
CONDENSED BALANCE SHEETS
2005 2004 2003Assets: Utility plant—net 1,458,734,681$ 1,408,183,614$ 1,390,857,362$ Capitalized purchased power commitment 25,891,406 35,662,876 45,130,152 Restricted assets 35,815,079 123,718,739 159,432,145 Current assets 296,900,130 252,414,183 178,234,062 Other assets 239,406,075 206,203,653 286,898,970
Total assets 2,056,747,371$ 2,026,183,065$ 2,060,552,691$
Liabilities: Long-term debt 1,401,815,402$ 1,459,292,622$ 1,462,609,162$ Noncurrent liabilities 39,184,724 45,010,305 55,717,497 Current liabilities 193,070,831 185,063,263 215,129,588 Deferred credits 36,878,664 32,929,702 36,970,209
Total liabilities 1,670,949,621 1,722,295,892 1,770,426,456
Equity: Invested in capital assets—net of related debt 145,886,527 128,453,544 158,451,970 Restricted: Deferred power costs 100,000,000 Other 107,428,778 72,156,591 56,831,686 Unrestricted 132,482,445 103,277,038 (25,157,421)
Total equity 385,797,750 303,887,173 290,126,235
Total liabilities and equity 2,056,747,371$ 2,026,183,065$ 2,060,552,691$
December 31
ASSETS
Utility Plant - Net
2005 Compared to 2004
Utility Plant Assets net of accumulated depreciation increased $50.6 million to $1,458.7 million for 2005. The increase consisted of the following:
• Additions and replacements in 2005 to Utility plant-in-service net of retirements and adjustments totaled $107.2 million including:
− a $29.3 million increase in the Hydroelectric production including $16.4 million for the North Cascades Environmental Learning Center; $5.2 million for generators at the Ross Dam; $2.2 million for the governor control and network system at Boundary; $2.1 million for Gorge electrical equipment; $1.8 million to upgrade the water wheels and turbines at Diablo; and other hydraulic system increases amounting to $1.6 million;

- 4 -
− a $2.8 million increase in Transmission plant including $1.1 million for station equipment replacement; $0.6 million in steel towers; and $0.4 million in structures and improvements;
− a $54.4 million increase in Distribution plant including $3.8 million in substation equipment; $6.8 million for poles and $4.4 million for overhead conductors for capacity additions and relocations; $4.7 million for underground conduit; $4.6 million for network underground conduit; $6.6 million for underground conductors; $4.8 million for network underground conductors for meters, Broad Street substation network, and Sound Transit; $5.6 million for transformers; and $11.9 million due to overhead services, underground services, network underground, meter additions, and streetlights;
− a $20.8 million increase in General plant assets primarily as a result of the addition of $8.0 million for the Maximo work management system; $6.4 million for fiber optic communication equipment for the Boundary Project; $2.7 million by the Department for computer equipment, network and other software; and $3.7 million for other general plant assets.
These additions to utility plant-in-service were offset by a corresponding increase in the Accumulated depreciation of $66.3 million and a decrease in Construction work-in-progress of $8.7 for a net increase of $32.2 million in utility plant-in-service.
• In addition, Nonoperating property net of accumulated depreciation increased $17.8 million including an increase of $18.8 million for the ductbank installed for undergrounding distribution system along Martin Luther King Way South related to the Sound Transit light rail project. This increase is offset by the retirement and write-down in value of $1.0 million in the Department’s art assets purchased with 1% for Art program monies; and
• Land and land rights increased $0.6 million due primarily to the acquisition of a property for wildlife habitat in Skagit for $0.4 million.
More information on the Department’s capital assets can be found in Note 2 of the accompanying financial statements.
2004 Compared to 2003
Utility Plant Assets net of depreciation increased $17.3 to $1,408.2 million in 2004. The increase consisted of the following:
• Additions and replacements in 2004 to Utility plant-in-service net of retirements and adjustments totaled $96.8 million, which consisted of the following:
− a $19.8 million increase in the Hydroelectric system including $12.8 million for the Boundary rehabilitation project in progress; $4.3 million for the completed portion of the North Cascade Environmental Learning Center; $0.7 million for Gorge Road improvements; $0.5 million to upgrade exhibits at Newhalem; and $1.5 million in other hydraulic system increases;
− a $0.9 million increase in Transmission plant due primarily to replacement of circuit breakers at substation switch yards;
− a $60.6 million increase in Distribution plant including $7.8 million for poles and $6.2 million for overhead conductors for capacity additions and relocations; $4.5 million for underground conduit; $7.7 million for network underground conduit; $7.3 million for underground conductors;

- 5 -
$8.5 million for network underground conductors for meters, Broad Street substation network, and Sound Transit; $5.7 million for transformers; and an increase of $12.9 million due to overhead services, underground services, network underground, meter additions, and streetlights; and
− a $15.6 million increase in General plant assets including $6.9 million for communication equipment for the Boundary Project; $2.5 million for systems software for the Department’s data warehouse; $5.2 million by the Department for computer equipment, network and other software; and $1.0 million for other general plant assets.
These additions to utility plant-in-service were offset by a corresponding increase in the Accumulated depreciation of $65.8 million and a decrease in Construction work-in-progress of $15.9 million for a net increase of $15.1 million in utility plant-in-service.
• In addition, Nonoperating property net of accumulated depreciation increased $1.3 million including an art inventory write-off of $0.7 million; and
• Land and land rights increased $0.9 million as a result of the sale of two substation properties for $1.7 million offset by the purchase of land for wildlife protection in the Skagit watershed for $0.8 million.
Restricted Assets
2005 Compared to 2004
Restricted assets decreased by $87.9 million to $35.8 million in 2005. In May 2005, the Seattle City Council passed Ordinance No. 121812 which authorized the purchase of a surety bond to meet the total reserve account requirements for the Department’s first-lien bonds and eliminated the need for the bond reserve account. The Ordinance also authorized the Department to use $25.0 million of the $84.7 million in the bond reserve account to set up a Contingency Reserve Account and to transfer the remaining balance to the Construction Account. The contingency reserve account is restricted for extraordinary costs associated with the operation of the electric system. In September 2005, the $62.4 million in the Construction Account, along with $26.9 million remaining from the investment of and interest earnings on 2004 bond proceeds, was transferred to the operating cash account to reimburse it for expenditures incurred for capital improvements, conservation measures, and other deferred assets.
2004 Compared to 2003
Restricted assets decreased by $35.7 million to $123.7 million in 2004 due primarily to the transfer of $41.4 million of bond proceeds plus interest earnings held for capital improvements in the restricted asset accounts to reimburse the operating cash account for capital expenditures. This decrease was offset by a $5.1 million addition to the Bond reserve account and a $2.8 million increase in Special deposits. The increase in Special deposits included a $2.5 million increase in restricted cash for 2004’s streetlight refund judgment and a $1.4 million increase in vendor retainage offset by decreases of $0.6 million for northwest fish and wildlife and $0.5 million for contributions in aid of construction. Other changes in restricted assets resulted from a decrease of $0.9 in fair market value for investments and cash equivalents held in restricted asset accounts.
- 6 -
Current Assets
2005 Compared to 2004
Current assets increased $44.5 million to $296.9 million in 2005. Operating cash increased $81.2 million to $141.9 million due to the transfer of cash from the Construction Account and the investment of and interest earnings on 2004 bond proceeds (see Restricted Assets above).
Total Accounts receivable decreased $38.8 million to $69.8 million. Receivables for electric sales decreased $7.6 million net of the allowance. The decrease was due in part to the crediting of streetlight refunds as a result of the streetlight litigation and the granting of antitrust settlements. The Washington state attorney general negotiated monetary settlements with several energy companies for the purpose of remedying harm suffered by Washington consumers stemming from the 2000–2001 energy crisis. Accounts receivable in arrears over 90 days decreased primarily for active accounts, which is the focus of collection efforts. Accounts receivable for wholesale power sales decreased $8.7 million. The decrease reflects lower sales during the month of December 2005 than occurred during the month of December 2004. Interfund receivables decreased $17.6 million. $18.9 million was received from the General Fund for streetlight payment refunds to customers from the Streetlight litigation judgment (see Note 14 of the accompanying financial statements). Due from other governments decreased $6.1 million as a result of a reduction in the outstanding receivables balance from Sound Transit and grants at year end. More information on the Department’s various accounts receivable balances can be found in Note 4 of the accompanying financial statements.
2004 Compared to 2003
Current assets increased $74.2 million to $252.4 million in 2004. The increase includes a $51.4 million increase in Cash and equity in pooled investments as a result of sustained rates and transfers in from the Construction account as reimbursement for capital costs; a $26.1 million increase in Accounts receivable, net of allowance, that was the result of the streetlight refund as well as an increase in receivables for billing for current year streetlight revenues; and a decrease of $3.7 million in Energy contracts recognized as derivative instruments.
Other Assets
2005 Compared to 2004
Statement of Financial Accounting Standards No. 71, Accounting for the Effects of Certain Types of Regulation, provides for the deferral of certain utility costs and related recognition in future years as the costs are recovered through future rates. Deferred costs are authorized by resolutions passed by the Seattle City Council and include capitalized energy management services, deferred power costs, capitalized relicensing costs, deferral of payments to the Province of British Columbia under the High Ross agreement, and other deferred charges and assets.
Deferred assets increased $33.2 million to $239.4 million in 2005. The increase includes the following:
• $6.3 million in deferred conservation costs, net. Conservation measures, funded in part by the BPA in exchange for decrements to Block power, are currently deferred and amortized over a 20-year period;
• $8.1 million in capitalized relicensing costs incurred in preparation for the application to FERC to relicense the Boundary hydrogeneration facility; the Department intends to submit an application for a new license by October 2009;

- 7 -
• $9.1 million annual deferral of payment due to B. C. Hydro for the High Ross Agreement;
• $2.4 million in unamortized cost for the surety bond purchased to replace the bond reserve fund.
• $7.0 million for Bonneville Slice contract true-up payment. The Department is subject to true-up payments for the Department’s fixed 4.6676% of actual output and costs of Bonneville Slice power through September 30, 2011. In December 2004, Bonneville billed the Department $2.1 million for the 2004 true-up cost adjustment with payment due in January 2005. In December 2005, Bonneville billed the department $9.1 million, which was recorded as an account payable and deferred asset in December 2005 to be paid and expensed in 2006.
• $1.0 million in unrealized losses from fair market valuations of short-term power transactions.
Details for Other deferred charges and assets, net, is provided in Note 11 of the accompanying financial statements.
2004 Compared to 2003
Deferred assets decreased $80.7 million to $206.2 million in 2004. The decrease is primarily due to the following:
• In 2001, $300.0 million of short-term wholesale power costs were deferred for recovery through future revenues and were fully amortized by December 31, 2004 at a rate of $100.0 million per year.
The $100.0 million decrease in deferred power costs was offset in part by the following increases:
• $8.0 million in deferred conservation costs, net;
• $1.7 million in capitalized relicensing costs incurred in preparation for the application to FERC to relicense the Boundary and Skagit hydrogeneration facilities;
• $9.1 million annual deferral of payment due to B. C. Hydro for the High Ross Agreement; and
• $0.7 million in other deferrals.
LIABILITIES
Long-Term Debt
2005 Compared to 2004
The Department’s long-term debt decreased by $57.5 million to $1,401.8 million in 2005. A long-term note payable to Sound Transit for $14.9 million was issued in 2005 for electrical work for the new light rail line under construction. Payments of $5.3 million were made in 2005 leaving a balance due at year-end of $9.6 million. A short-term note to the City of Seattle of $5.2 million for purchase of real estate issued in 2003 was paid in 2005. After payment of cash operating expenses, net revenues available to pay debt service were equal to 1.86 times principal and interest on all bonds. Note 6 of the accompanying financial statements provides additional information related to the Department’s long-term debt.

- 8 -
2004 Compared to 2003
Long-term debt decreased by $3.3 million to $1,459.3 million in 2004. Activity during 2004 for long-term debt included issuance of $284.9 million in Municipal Light & Power Improvement and Refunding Revenue Bonds in December. The proceeds were used to fund the ongoing Capital Improvement Program and to defease certain prior lien bonds. Scheduled redemption of certain prior lien bonds also took place in the normal course of business. A note payable to the City of Seattle for $5.2 million for purchase of real estate was issued in 2003 and is due in 2005.
After payment of cash operating expenses, net revenues available to pay debt service were equal to 2.39 times principal and interest on first lien bonds. If the amortization of $100 million in power costs deferred from 2001 is factored into the calculation, net revenues would be equal to 1.58 times first lien debt service.
Environmental Liabilities
Environmental liabilities totaled $9.1 million, $6.1 million and $5.8 million at December 31, 2005 and 2004 and 2003, respectively. The liabilities are primarily attributable to the estimated cost of remediating contaminated sediments in the lower Duwamish Waterway, which was designated a federal Superfund site by the Environmental Protection Agency in 2001. The Department is considered a potentially responsible party for contamination in the Duwamish River due to land ownership or use of property located along the river.
RESULTS OF OPERATIONS
While the balance sheets show changes in assets, liabilities, and fund equity, the statements of revenues, expenses, and changes in fund equity provide insight into the source of these changes.
Condensed Revenues and Expenses
2005 2004 2003
Operating revenues 748,552,561$ 777,918,589$ 739,005,298$ Nonoperating revenues 5,417,494 4,286,396 3,849,386
Total revenues 753,970,055 782,204,985 742,854,684
Operating expenses 624,592,061 710,002,913 700,067,504 Nonoperating expenses 73,646,463 76,304,899 77,054,688
Total expenses 698,238,524 786,307,812 777,122,192
Capital contributions 18,944,222 10,580,789 22,089,096 Grants 7,234,823 7,282,976 4,044,558
Net income (loss) 81,910,576$ 13,760,938$ (8,133,854)$
Year Ended December 31
SUMMARY
2005 Compared to 2004
During 2005, the Department realized net income of $81.9 million, an increase of $68.1 million from the net income of $13.8 million recorded in 2004. The increase in net income was due primarily to the elimination of

- 9 -
the amortization of $300.0 million in excess power costs deferred from 2001 and amortized in equal monthly amounts over the 2002 through 2004 period of time. No excess power costs remained to be deferred in 2005, whereas $100.0 million was amortized during 2004. Excluding the effect of the 2004 amortization, net income decreased $31.9 million.
In 2005, revenue from net wholesale power sales was $87.4 million compared to $113.5 million for 2004, a decrease of $26.1 million. In addition, operating revenues outside of short-term power sales declined $15.8 million while operating expenses, other than the amortization of the deferred power costs and the cost of wholesale power purchase, increased by $2.1 million. These decreases in net operating income were offset by a $3.8 million reduction in nonoperating expenses and an $8.4 million increase in capital contributions.
2004 Compared to 2003
In 2004, the Department realized net income of $13.8 million, an improvement of $21.9 million from the net loss of $8.1 million recorded in 2003. Higher revenue from sales of energy to retail customers accounts for most of the improvement in financial results. Retail revenues were $24.5 million higher in 2004 than in the prior year. Revenue from wholesale power sales (net of the cost of wholesale purchases) was $113.6 million, or virtually the same amount as in 2003. Other miscellaneous revenues increased $2.9 million over 2003. Lower power costs, in particular a reduction of $26.1 million in the cost of power purchased from the Bonneville Power Administration, were partially offset by a slight increase in other operations and maintenance costs resulting in a net addition to net income of $2.6 million. Income from fees and grants were $8.3 million lower than in 2003.
In 2004, the Department fully amortized excess power costs deferred from 2001. In 2002, 2003, and 2004, $300 million in deferred power costs was amortized in equal monthly amounts. If power costs had not been deferred from 2001 and amortized over the 2002-04 period, net income in 2004 would have been $113.8 million.
REVENUES
2005 Compared to 2004
Retail—Revenues from sales of energy to retail customers decreased by $14.2 million to $562.5 million in 2005 due in part to downward Bonneville pass-through rate adjustments of 2.1% and 2.2% effective in April 2004 and November 2005, respectively. The decreases in rates along with lower consumption resulted in a $2.9 million or 1.4% decrease in residential retail revenues. Nonresidential revenues decreased by $9.6 million or 2.5%. A major component of the decrease was due to a one-time $9.0 million true-up payment received from Nucor in 2004 negotiated under a new interruptible power contract; there was no such payment in 2005.
Wholesale—Sales of surplus power in the wholesale market generated $149.6 million in revenue in 2005, a decrease of $13.6 million from the prior year. Due to poor water conditions in 2005 and decreased forward sales, the surplus energy sold on the wholesale market decreased by 46.9% from 5,359,491 MWh in 2004 to 2,846,599 MWh in 2005. The effect of the decrease in surplus energy was somewhat offset by a 36.2% increase in the average year-to-date sales price of $53.93 per MWh in 2005 compared to $39.59 in 2004.
Purchases of wholesale energy in 2005 were up $12.5 million from the previous year primarily to meet forward purchase commitments. Although the amount of energy purchased in 2005 was only 1,034,211 MWh compared to 2,389,071 MWh in 2004, a 56.7% decrease, the average year-to-date purchase price increased to $63.89 per MWh in 2005, compared to $41.29 in 2004. Although the amount of energy sold in 2005 was

- 10 -
nearly 2.8 times the amount of energy purchased, the higher purchase price caused the net revenues of $87.4 million for 2005 to be $26.1 million less than the net revenues of $113.6 million in 2004.
Other Power-Related—This category of revenue consists of other power-related transactions such as revenue from Bonneville conservation programs and sales of reserve capacity. Revenue in this category increased by $3.3 million to $23.3 in 2005 largely due to increases in revenue from wheeling sales, which are revenues from the sale of transmission pursuant to the agreement for coordination of operations among northwest power systems. The Department lowered its price for point-to-point transmission, resulting in increased sales volume that has maximized utilization capacity. Excess capacity in transmission resulted from the dry water year in 2005.
Other—Revenues from a variety of other sources decreased by $4.9 million from $17.9 million in 2004 to $13.0 million in 2005. The decrease is due primarily to a $2.9 million decrease in revenue recorded for streetlight refunds from the City. In 2004, a total of $3.4 million was recorded as revenue as a result of a Washington State Supreme Court decision that required the City of Seattle reimburse the Department for $23.9 million in streetlight costs that would have been billed to the City from December 29, 1999 to November 13, 2003. The Department was required to refund to its customers in the City the amount collected for streetlight costs over that period and to refund to its customers in the city of Tukwila the amount collected from December 24, 1999 through April 30, 2003. This amount was estimated to be $21.5 million. The Department recorded the $2.4 million difference as other operating revenues in 2004 along with an additional $1.0 million in reimbursed expenses as outlined in the Supreme Court decision. In 2005, an additional $0.5 million was recognized as revenue from the City for administering the streetlight refunds. However, in 2005, it was also determined that the City had overpaid the amount due to the Department by $1.1 million, and the overpayment was refunded, classified as an expense.
2004 Compared to 2003
The $27.4 million increase in revenues affecting net income was due primarily to increases in Retail power revenues and Other revenues. The $25.6 million increase in Short-term wholesale power revenues and $14.1 million decrease in Other power-related revenues were offset in their entirety by a $25.5 million increase in Short-term wholesale power purchases and a $14.0 million decrease in Other power expenses and had no effect on the increase in net income.
Retail—Revenue from sales of energy to retail customers increased by $24.5 million to $576.7 million in 2004. Virtually all of this increase occurred in the non-residential rate classes. Revenue billed to residential customers in 2004 totaled $199.2 million, an increase of only $0.1 million from the prior year. Billings to non-residential customers generated $376.9 million in revenue, an increase of $24.8 million from the 2003 level. Recognition of unbilled revenue resulted in a decrease of $0.5 million from 2003.
$15.5 million of the increase in non-residential revenue from 2003 to 2004 can be attributed to the following special nonrecurring circumstances:
• Streetlight Payments—On November 13, 2003, the Washington State Supreme Court ruled that the practice of allocating the costs of streetlighting in Seattle and Tukwila to the general customer base in those jurisdictions and setting rates to recover streetlighting costs from those customers constituted an illegal tax. Effective with the date of the Supreme Court decision, the Department resumed billing the cities of Seattle and Tukwila for streetlight costs, generating $0.5 million in revenue in 2003 and $6.0 million in 2004.

- 11 -
• Revenues from Interruptible Customer—In March 2004, the Department and Nucor, the Department’s largest and only interruptible customer, agreed to an amendment to its contract, which provided that Nucor would make a one-time payment of $9 million to compensate the Department for discounted rates paid in 2002 and 2003. The $9.0 million payment was recorded as revenue in 2004.
• Recovery of Underbillings—Revenue of $1.0 million was recorded in 2004 to recover amounts underbilled to certain non-residential customers.
The remaining increase of $9.3 million in non-residential billings can be attributed to $2.0 million in increased billings to the single interruptible customer account and $7.3 million in increased billings to other non-residential customers. These increases reflect an increase of 1.3% in the average billing rate and growth of 0.9% in energy consumption, as the local economy continued its recovery from the earlier recession.
Other—Revenues from a variety of other sources increased by $2.9 million to $17.9 million in 2004. The increase in other revenues was due primarily to the $2.4 million difference between the $23.9 million in payments received from the City of Seattle for reimbursement of streetlighting costs and the $21.5 million in streetlighting costs refunded to customers. The difference was recorded as other operating revenues in 2004. These transactions were a result of a Supreme Court decision that required the City to reimburse the Department for $23.9 million in streetlight costs that would have been billed to the City for streetlight costs from December 24, 1999 to November 13, 2003. The Department was required to refund to its customers in the city of Seattle the amount collected for streetlight costs over that period and to refund to its customers in the city of Tukwila the amount collected from December 24, 1999 through April 30, 2003. This amount was estimated to be $21.5 million.
EXPENSES
2005 Compared to 2004
Total operating expenses decreased by $85.4 million to $624.6 million in 2005. $100.0 million of the decrease is due to the elimination of the amortization of deferred costs from 2001 that were recorded and fully amortized in 2004. The effective increase in operating costs other than the amortization of deferred costs was $14.7 million of which $12.5 million can be attributed to higher short-term wholesale power purchase costs discussed above under Wholesale Revenue. The remaining $2.1 million in higher operating expenses is a result of a $1.6 million increase in wheeling and transmission costs due primarily to a 19.3% increase in Bonneville transmission rates effective October 2005, accounting for $0.5 million per month in increased wheeling expenses. Transmission maintenance costs increased $0.2 million.
2004 Compared to 2003
After eliminating the effect of the $25.5 million increase in Short-term wholesale power purchases and the $14.0 million dollar decrease in Other power expenses, the remaining operating expenses decreased by $1.4 million primarily due to a $1.3 million decrease in Administrative and general expenses.

- 12 -
OTHER NONOPERATING INCOME AND EXPENSE
2005 Compared to 2004
Nonoperating Revenues (Expenses)—Nonoperating revenues (expenses) increased $3.8 million in 2005 due to the following:
Nonoperating income increased $1.1 million to $5.4 million in 2005. The increase is due to a $3.2 million increase in investment income that resulted from operating cash balances being significantly higher in 2005 than 2004 and invested at rates of return that have increased throughout 2005. The increase in investment income was offset by a $1.9 million decrease in the gain on the sale of property. During 2005 the sale of the California substation to the Department of Parks and Recreation resulted in a gain of $0.3 million compared to the gain of $2.2 million reported in 2004 for the sale of various properties.
Nonoperating expense decreased by $2.7 million from $76.3 million in 2004 to $73.6 million in 2005. The decrease is primarily due to the $2.5 million decrease in interest expense from 2004 to 2005. Interest expense for parity bonds decreased $1.7 million as improvement and refunding revenue bonds issued in December 2004 lowered the average interest rate. Interest expense for variable rate bonds increased $1.0 million due to higher short-term interest rates. Interest expense of $2.6 million was recorded in 2004 to compensate customers in Seattle and Tukwila for the loss of use of funds that they had paid through their rates for streetlight costs from 2000 through 2003. No similar expense existed in 2005. Capitalized interest charged monthly to construction projects for funds used during construction (AFUDC) decreased by $1.0 million as major capital improvement projects such as Boundary rehabilitation and the Environmental Learning Center were either completed or substantially completed in 2005.
Fees and Grants—Fees and grants increased by $8.3 million in 2005. General fees increased $2.3 million including $0.5 million to install an underground electric system at Highpoint. This was offset by a $0.9 million decrease in standard and nonstandard fees. In-kind contributions increased $7.0 million primarily from Sound Transit in connection with the construction of the regional light rail system.
2004 Compared to 2003
Nonoperating Revenues (Expenses)—Nonoperating revenues (expenses) increased $1.2 million from $(73.2) million in 2003 to $(72.2) million in 2004 due primarily to the following:
Nonoperating income increased $0.5 million due primarily to a decrease of $1.3 million in investment income offset by a $1.8 million increase in Other income—net. In 2003 funds available for investment were at higher levels as the Department accumulated substantial cash balances for the repayment of revenue anticipation notes that matured in that year. With cash balances at more normal levels in 2004, interest income decreased. Gain on the sale of property increased $1.5 million to $2.2 million in 2004. Other expense decreased $0.3 million to $(0.3) million in 2004.
Nonoperating expense decreased $0.8 million from $(77.1) million in 2003 to $(76.3) million in 2004. The decrease was due primarily to the issuance of refunding and new-money bonds in 2003 and 2004 which resulted in a $0.6 million decrease to $2.5 million in 2004 of amortization expenses related to bond issue costs, bond premium and discount and refunding loss. Interest expense in 2004 decreased by $0.1 million from the level of $73.9 million recorded in 2003.
Fees and Grants—Fees and grants declined by $8.3 million in 2004 from $26.1 million in 2003, due mainly to the occurrence of one-time events in 2003. The Department recorded $9.2 million in in-kind contributions in 2003 related to arterial improvements carried out by the Seattle Engineering Department. The Department

- 13 -
also received $3.8 million from BPA in reimbursement for 2003 costs incurred in reinforcing transmission lines to stabilize the regional transmission grid. Neither of these events was repeated in 2004. Offsetting these declines was an increase of $2.9 million in installation charges. Grants increased by $3.2 million primarily as a result of work performed for Sound Transit in connection with the construction of the regional light rail system.
RISK MANAGEMENT
The Department’s exposure to market risk is managed by a Risk Management Committee. The Department engages in market transactions only to meet its load obligations or to sell surplus energy. Except for strictly limited and closely monitored intraday and interday trading to take advantage of owned hydro storage, the Department does not take market positions in anticipation of generating revenue.
With a significant portion of the Department’s revenue expected from wholesale market sales, great emphasis is placed on the management of market risk. Processes, policies, and procedures designed to monitor and control these market risks, including credit risk, are in place and engagement in the market is strictly governed by those policies.
The Department measures the market price risk in its portfolio on a weekly basis using a modified revenue at risk measure that reflects not only price risk, but also the volumetric risk associated with its hydro-dominated power portfolio. Monte Carlo simulation is used to capture financial risk, and scenario analysis is used for stress testing.
The Department takes a very conservative approach to managing volumetric risk, assuming hydro generation at the 95% exceedance level until observed precipitation or snow pack surveys indicate otherwise.
While the Department’s portfolio includes purchased power from a gas turbine (a share of the Klamath Falls cogeneration facility), the Department’s exposure to gas price excursions is limited as it chooses on a daily basis whether or not to run the plant and commit to purchase the gas. If the value of the power is high enough to cover the operating costs, the Department will order its dispatch for that day. It is then exposed to the volatility of the spot gas market for that day. Daily spot gas price volatility is relatively low, and as this is a daily choice for the Department, it has no long-term exposure to the gas market.
The Department mitigates credit risk by trading only with qualified counterparties. The Credit Committee, a subcommittee of the Risk Management Committee, establishes credit policies and counterparty limits based on approved criteria. The Credit Committee monitors credit exposure and updates counterparty limits to reflect their most current financial condition and creditworthiness.

CITY OF SEATTLE—CITY LIGHT DEPARTMENT
BALANCE SHEETSAS OF DECEMBER 31, 2005 AND 2004
2005 2004ASSETS
UTILITY PLANT—At original cost: Plant-in-service—excluding land 2,356,718,850$ 2,249,506,046$ Less accumulated depreciation (1,047,055,430) (980,740,177) Total utility plant 1,309,663,420 1,268,765,869 Construction work-in-progress 76,938,379 85,659,390 Nonoperating property—net of accumulated depreciation 4,537,293 5,525,586 Assets held for future use 26,353,965 7,586,497 Land and land rights 41,241,624 40,646,272
Utility plant—net 1,458,734,681 1,408,183,614
CAPITALIZED PURCHASED POWER COMMITMENT 25,891,406 35,662,876
RESTRICTED ASSETS: Contingency Reserve Account 25,000,000 Municipal Light & Power Bond Reserve Account 84,682,384 Construction Account 2,008,047 Construction Account—investments 26,888,326 Debt Service Account 3,041,471 3,210,985 Special deposits and other 7,773,608 6,928,997
Total restricted assets 35,815,079 123,718,739
CURRENT ASSETS: Cash and equity in pooled investments 141,897,558 60,707,996 Accounts receivable, net of allowance of $15,488,000 and $16,087,000 69,845,998 108,645,662 Unbilled revenues 60,731,335 61,803,766 Energy contracts 1,835,156 1,825,246 Materials and supplies at average cost 21,650,992 18,885,987 Prepayments, interest receivable, and other 939,091 545,526
Total current assets 296,900,130 252,414,183 OTHER ASSETS: Deferred conservation costs—net 130,657,939 124,315,501 Capitalized relicensing costs 24,158,953 16,013,434 Deferred costs—High Ross Agreement 58,068,382 49,194,941 Other deferred charges and assets—net 26,520,801 16,679,777
Total other assets 239,406,075 206,203,653
TOTAL 2,056,747,371$ 2,026,183,065$
See notes to financial statements.

- 14 -
2005 2004LIABILITIES
LONG-TERM DEBT: Revenue bonds 1,472,650,000$ 1,537,246,000$ Plus bond premium 36,774,060 40,848,307 Less bond discount (648,302) (745,410) Less deferred charges on advanced refunding (47,843,880) (53,460,275) Less revenue bonds—current portion (63,435,000) (64,596,000) Note payable—Sound Transit 9,593,840 Less note payable—current portion (5,275,316)
Total long-term debt 1,401,815,402 1,459,292,622
NONCURRENT LIABILITIES: Accumulated provision for injuries and damages 13,861,016 9,507,214 Compensated absences 10,479,828 10,369,328 Long-term purchased power obligation 25,891,406 35,662,876 Less obligation—current portion (11,240,000) (10,705,000) Other 192,474 175,887
Total noncurrent liabilities 39,184,724 45,010,305
CURRENT LIABILITIES: Accounts payable and other 78,228,695 60,170,556 Accrued payroll and related taxes 8,156,690 6,018,469 Compensated absences 510,816 479,657 Accrued interest 21,083,915 16,226,097 Streetlight refund payable 3,864,182 19,998,457 Note payable—City of Seattle 5,158,625 Note payable—Sound Transit 5,275,316 Long-term debt—current portion 63,435,000 64,596,000 Purchased power obligation 11,240,000 10,705,000 Energy contracts 1,276,217 1,710,402
Total current liabilities 193,070,831 185,063,263
DEFERRED CREDITS 36,878,664 32,929,702
Total liabilities 1,670,949,621 1,722,295,892
COMMITMENTS AND CONTINGENCIES (Note 14)
EQUITY: Invested in capital assets—net of related debt 145,886,527 128,453,544 Restricted: Contingency reserve account 25,000,000 Deferred conservation costs 44,165,891 35,821,624 Deferred costs—High Ross Agreement 21,655,050 21,884,942 Other 16,607,837 14,450,025 Unrestricted 132,482,445 103,277,038
Total equity 385,797,750 303,887,173
TOTAL 2,056,747,371$ 2,026,183,065$

- 15 -
CITY OF SEATTLE—CITY LIGHT DEPARTMENT
STATEMENTS OF REVENUES, EXPENSES, AND CHANGES IN EQUITYFOR THE YEARS ENDED DECEMBER 31, 2005 AND 2004
2005 2004
OPERATING REVENUES: Retail power revenues 562,548,318$ 576,692,244$ Short-term wholesale power revenues 149,649,844 163,264,753 Other power-related revenues 23,332,060 20,027,768 Other 13,022,339 17,933,824
Total operating revenues 748,552,561 777,918,589
OPERATING EXPENSES: Long-term purchased power—Bonneville 131,516,808 130,974,780 Long-term purchased power—other 93,544,001 98,441,580 Short-term wholesale power purchases 62,214,265 49,714,393 Amortization of deferred power costs 100,000,000 Other power expenses 8,241,812 7,074,410 Generation 18,895,735 20,283,509 Transmission 38,162,666 36,282,986 Distribution 40,402,673 40,972,862 Customer service 31,638,738 33,680,968 Conservation 12,054,526 11,237,221 Administrative and general 52,746,238 46,042,690 City of Seattle occupation tax 33,393,646 34,488,319 Other taxes 27,231,620 26,956,351 Depreciation 74,549,333 73,852,844
Total operating expenses 624,592,061 710,002,913
NET OPERATING INCOME 123,960,500 67,915,676
NONOPERATING REVENUES (EXPENSES): Investment income 5,710,370 2,481,150 Interest expense (71,324,308) (73,823,812) Amortization of refunding loss (5,616,396) (4,696,692) Amortization of bond premium 4,074,247 3,004,828 Amortization of bond discount and issue costs (780,006) (789,223) Other income—net (292,876) 1,805,246
Total nonoperating expenses (68,228,969) (72,018,503)
NET INCOME (LOSS) BEFORE FEES AND GRANTS 55,731,531 (4,102,827)
FEES AND GRANTS: Capital contributions 18,944,222 10,580,789 Grants 7,234,823 7,282,976
Total fees and grants 26,179,045 17,863,765
NET INCOME 81,910,576 13,760,938
EQUITY: Beginning of year 303,887,174 290,126,235
End of year 385,797,750$ 303,887,173$
See notes to financial statements.

- 16 -
CITY OF SEATTLE—CITY LIGHT DEPARTMENT
STATEMENTS OF CASH FLOWSFOR THE YEARS ENDED DECEMBER 31, 2005 AND 2004
2005 2004OPERATING ACTIVITIES: Cash received from customers and counterparties 742,713,517$ 791,002,215$ Cash paid to suppliers, employees, and counterparties (425,793,325) (477,722,621) Taxes paid (63,740,102) (71,039,601)
Net cash provided by operating activities 253,180,090 242,239,993
NONCAPITAL FINANCING ACTIVITIES: Decrease in short-term borrowings—City of Seattle note (70,000,000) Interest paid on City of Seattle note (489,277) Decrease of bond reserve account (87,407,387) Increase of contingency reserve account 25,000,000 Grants received 8,923,510 6,503,504 Bonneville receipts for conservation augmentation 4,825,323 8,628,000 Payment to vendors on behalf of customers for conservation augmentation (16,383,484) (17,164,802)
Net cash used in noncapital financing activities (65,042,038) (72,522,575)
CAPITAL AND RELATED FINANCING ACTIVITIES: Proceeds from long-term borrowings—net of discount 299,112,223 Payment to trustee for defeased bonds (237,479,529) Increase of construction account 62,407,387 Bond issue costs paid (2,527,173) (1,344,780) Principal paid on long-term debt (69,871,318) (53,820,000) Interest paid on long-term debt (69,368,075) (74,744,950) Payment of City of Seattle note (5,158,625) Acquisition and construction of capital assets (110,124,877) (92,608,287) Decrease in other deferred assets and charges (18,086,793) (11,396,560) Proceeds from sale of utility plant 306,522 2,364,182 Capital contributions 10,909,542 12,055,263
Net cash used in capital and related financing activities (201,513,410) (157,862,438)
INVESTING ACTIVITIES: Proceeds from investments 26,887,538 83,237,038 Purchases of investments (41,880,917) Interest received on investments and on cash and equity in pooled investments 6,662,048 3,792,440
Net cash provided by investing activities 33,549,586 45,148,561
NET INCREASE IN CASH AND CASH EQUIVALENTS 20,174,228 57,003,541
CASH AND EQUITY IN POOLED INVESTMENTS: Beginning of year 157,538,409 100,534,868
End of year 177,712,637$ 157,538,409$
(Continued)

- 17 -
CITY OF SEATTLE—CITY LIGHT DEPARTMENT
STATEMENTS OF CASH FLOWSFOR THE YEARS ENDED DECEMBER 31, 2005 AND 2004
2005 2004
RECONCILIATION OF NET OPERATING INCOME TO NET CASH PROVIDED BY OPERATING ACTIVITIES: Net operating income 123,960,500$ 67,915,676$ Adjustments to reconcile operating income to net cash provided by operating activities: Depreciation 74,549,333 73,852,844 Amortization of deferred credits (5,284,761) (5,770,236) Amortization of deferred power costs and other charges 13,585,279 110,322,445 Change in: Accounts receivable 38,926,212 (25,458,138) Unbilled revenues 1,072,431 (608,976) Materials and supplies (2,765,004) (161,251) Prepayments, interest receivable, and other (397,997) 9,360 Other deferred charges and assets 499,011 333,715 Provision for injuries and damages and claims payable 2,781,874 1,948,141 Accounts payable, accrued payroll, and other 22,245,828 6,085,373 Compensated absences 141,659 131,448 Streetlight refund payable (16,134,275) 19,998,457 Deferred credits (6,358,865)
Total adjustments 129,219,590 174,324,317
Net cash provided by operating activities 253,180,090$ 242,239,993$
SUPPLEMENTAL DISCLOSURES OF NONCASH ACTIVITIES—In-kind capital contributions 7,322,034$ 297,568$
Note payable for acquisition of capital assets 9,593,840$ $
See notes to financial statements. (Concluded)

- 18 -
CITY OF SEATTLE—CITY LIGHT DEPARTMENT
NOTES TO FINANCIAL STATEMENTS AS OF AND FOR THE YEARS ENDED DECEMBER 31, 2005 AND 2004
1. OPERATIONS AND SUMMARY OF SIGNIFICANT ACCOUNTING POLICIES
The City Light Department (the “Department”) is the public electric utility of the City of Seattle (the “City”). The Department owns and operates certain generating, transmission, and distribution facilities and supplies electricity to approximately 376,000 customers. The Department supplies electrical energy to other City agencies at rates prescribed by City ordinances. The establishment of the Department’s rates is within the exclusive jurisdiction of the Seattle City Council. A requirement of Washington State law provides that rates must be fair, nondiscriminatory, and fixed to produce revenue adequate to pay for operation and maintenance expenses and to meet all debt service requirements payable from such revenue. The Department pays occupation taxes to the City based on total revenues.
The Department’s revenues were $13.1 million and $12.4 million for electrical energy and $2.1 million and $2.0 million for nonenergy services provided to other City departments in 2005 and 2004, respectively.
The Department receives certain services from other City departments and paid approximately $34.4 million and $33.9 million, respectively, in 2005 and 2004 for such services. Amounts paid include central cost allocations from the City for services received including treasury services, risk financing, purchasing, data processing systems, building rentals, vehicle maintenance, personnel, payroll, legal, other administrative, and lease of Seattle administrative office.
Accounting Standards—The accounting and reporting policies of the Department are regulated by the Washington State Auditor’s Office, Division of Municipal Corporations, and are based on the Uniform System of Accounts prescribed for public utilities and licensees by the Federal Energy Regulatory Commission (“FERC”). The financial statements are also prepared in conformity with accounting principles generally accepted in the United States of America as applied to governmental units. The Governmental Accounting Standards Board (“GASB”) is the accepted standard-setting body for establishing governmental accounting and financial reporting principles. The Department has applied all applicable GASB pronouncements as well as the following pronouncements, except for those that conflict with or contradict GASB pronouncements: Statements and Interpretations of the Financial Accounting Standards Board (“FASB”), Accounting Principles Board (“APB”) Opinions, and Accounting Research Bulletins of the Committee on Accounting Procedures. The more significant of the Department’s accounting policies and related FASB/GASB pronouncements are described below.
In November 2004, the FASB issued Statement of Financial Accounting Standards (“SFAS”) No. 151, Inventory Costs—an amendment of ARB No. 43, Chapter 4, effective for the Department January 1, 2006. This statement provides that idle facility expense, obsolescence, double freight, rehandling costs, and wasted material be recognized as current-period charges. The adoption of this statement is not expected to have a material effect on the Department’s financial position or operations.
In December 2004, the FASB issued SFAS No. 153, Exchanges of Nonmonetary Assets—an amendment of APB Opinion No. 29, effective for the Department January 1, 2006. Power exchanges under long-term contracts were recognized by the Department at the blended weighted-average cost of power in accordance with APB Opinion No. 29. SFAS No. 153 will be applied prospectively effective 2006 for

- 19 -
power exchanges under long-term contracts. The effect of implementing SFAS No. 153 on January 1, 2006, is expected to result in an increase in accounts receivable and deferred unrealized gain in the amount of approximately $2.4 million. The Department intends to obtain an ordinance to defer unrealized gains and losses resulting from the application of SFAS No. 153 as allowed under SFAS No. 71, Accounting for the Effects of Certain Types of Regulation.
In March 2005, the FASB issued FASB Interpretation No. 47, Accounting for Conditional Asset Retirement Obligations—an interpretation of FASB Statement No. 143, effective for the Department on January 1, 2006. This statement clarifies the accounting for a legal obligation to perform an asset retirement activity in which the timing and/or method of settlement are conditional upon a future event. There is no impact on the Department’s financial position and results of operations from adoption of this statement, as the Department does not have any conditional asset retirement obligations.
In March 2003, the GASB issued Statement No. 40, Deposit and Investment Risk Disclosures, effective for the Department January 1, 2005. This statement establishes and modifies disclosure requirements related to investment risks: credit risk (including custodial credit risk and concentrations of credit risk), interest rate risk, and foreign currency risk. This statement also establishes and modifies disclosure requirements for deposit risks: custodial credit risk and foreign currency risk. The adoption of this statement did not have a material effect on the Department’s financial position or operations.
In November 2003, the GASB issued Statement No. 42, Accounting and Financial Reporting for Impairment of Capital Assets and for Insurance Recoveries, effective for the Department January 1, 2005. This statement establishes accounting and financial reporting standards for impairment of capital assets. A capital asset is considered impaired when its service utility has declined significantly and unexpectedly. This statement also clarifies and establishes accounting requirements for insurance recoveries. The adoption of this statement did not have a material effect on the Department’s financial position or operations.
In July 2004, the GASB issued Statement No. 45, Accounting and Financial Reporting by Employers for Postemployment Benefits Other Than Pensions. This statement establishes and modifies disclosure requirements for reporting by administrators or trustees of other postemployment benefits (“OPEB”) plan assets or by employers or sponsors that include OPEB plan assets as trust or agency funds in financial reports. The requirements of this statement are effective for the Department’s financial statements for periods beginning January 1, 2007. The Department is in the process of determining the impact on its financial position and results of operations from adoption of this statement.
Assets Held for Future Use—These assets include property acquired, but never used by the Department in electrical service and therefore held for future service, under a definitive plan. Also included is property previously used in service, but retired from service and held pending its reuse in the future, under a definitive plan. As of December 31, 2005 and 2004, assets held for future use included the following electrical plan assets: substations, ducts and vaults, and transmission lines totaling $26.4 million and $7.6 million, respectively.
Restricted Assets—In accordance with the Department’s bond resolutions, state law, or other agreements, certain assets are designated as “restricted” for specific purposes and reported in a separate section. The restricted assets have specific purposes, including such things as the Municipal Light & Power (“ML&P”) Bond Reserve Account, financing of the Department’s ongoing Capital Improvement Program, and other.

- 20 -
In September 2005, the bond reserve account was liquidated and a portion of these funds was used to establish a Contingency Reserve Account in the amount of $25 million in accordance with Ordinance No. 121812. This account is restricted for extraordinary costs associated with the operation of the electrical system.
Compensated Absences—Permanent employees of the Department earn vacation time in accordance with length of service. A maximum of 480 hours may be accumulated and, upon termination, employees are entitled to compensation for unused vacation. At retirement, employees receive compensation equivalent to 25% of their accumulated sick leave. The Department accrues all costs associated with compensated absences, including payroll taxes.
Revenue Recognition—Service rates are authorized by City ordinances. Billings are made to customers on a monthly or bimonthly basis. Revenues for energy delivered to customers between the last billing date and the end of the year are estimated and reflected in the accompanying financial statements under the caption unbilled revenues.
The Department’s customer base accounted for electric energy sales at December 31, 2005 and 2004, as follows:
2005 2004
Residential 34.8 % 34.5 % Nonresidential 65.2 65.5
Total 100.0 % 100.0 %
Administrative and General Overhead Costs Applied—Administrative and general costs are allocated to construction work-in-progress, major data processing systems development, programmatic conservation, relicensing mitigation projects, and billable operations and maintenance activities based on rates established by cost studies. Pension and benefit costs are fully allocated to capital and operations and maintenance activities based on a percentage of labor dollars. The administrative and general overhead costs applied totaled $20.7 million and $18.9 million in 2005 and 2004, respectively. Pension and benefit costs were $24.3 million and $23.5 million in 2005 and 2004, respectively. Administrative and general expenses, net of total applied overhead, were $52.7 million and $46.0 million in 2005 and 2004, respectively.
Interest Charged to Construction—Interest is charged for funds used during construction of plant assets and to nonbillable construction work-in-progress. Interest charged represents the estimated costs of financing construction projects and is computed using the Department’s weighted-average interest rate for all bonds outstanding at the end of the year. The allowance totaled $2.5 million and $3.5 million in 2005 and 2004, respectively, and is reflected as a reduction of interest expense in the statements of revenues, expenses, and changes in equity.
Nonexchange Transactions—Capital contributions and grants in the amount of $26.2 million and $17.9 million are reported for 2005 and 2004, respectively, on the statements of revenues, expenses, and changes in equity as nonoperating revenues from nonexchange transactions. Capital contributions and grants revenues are recognized based on the accrual basis of accounting. In-kind capital contributions are recognized in the period when all eligibility requirements have been met as described in GASB Statement No. 33, Accounting and Financial Reporting for Nonexchange Transactions, and are recognized at fair market value. The determination of the fair market value is based either on the internal engineer’s estimate of the current cost of comparable plant-in-service or the donor’s actual cost.

- 21 -
Fair Value of Financial Instruments—The Department’s financial instruments include cash and cash equivalents, short-term investments, receivables, payables, and long-term debt. The carrying value of these financial instruments approximates fair value because of their short maturity or because they are based on year-end quoted market prices. Accordingly, the Department’s financial instruments are reported at fair value on the accompanying balance sheets at December 31, 2005 and 2004. In addition, certain forward power contracts are considered derivative instruments that are valued at fair market and related gains and losses resulting from fair valuation are deferred pursuant to SFAS No. 71.
Use of Estimates—The preparation of the financial statements in conformity with accounting principles generally accepted in the United States of America requires management to make estimates and assumptions that affect amounts reported in the financial statements. The Department used significant estimates in determining reported allowance for doubtful accounts, unbilled revenues, energy contract assets and liabilities, accumulated provision for injuries and damages, accrued sick leave, and other contingencies. Actual results may differ from those estimates.
Significant Risk and Uncertainty—The Department is subject to certain business risks that could have a material impact on future operations and financial performance. These risks include prices on the wholesale markets for short-term power transactions; interest rates; water conditions, weather, and natural disaster-related disruptions; terrorism; collective bargaining labor disputes; fish and other Endangered Species Act (“ESA”) issues; Environmental Protection Agency (“EPA”) regulations; federal government regulations or orders concerning the operations, maintenance, and/or licensing of hydroelectric facilities; other governmental regulations; restructuring of the electrical utility industry; and the costs of constructing transmission facilities that may be incurred as part of a northwest regional transmission system, and related effects of this system on transmission rights, transmission sales, the value of surplus energy, and governance.
Reclassifications—Certain 2004 account balances have been reclassified to conform to the 2005 presentation.
2. UTILITY PLANT
Utility Plant—Utility plant is recorded at original cost, which includes both direct costs of construction or acquisition and indirect costs, including an allowance for funds used during construction. Property constructed with capital fees received from customers is included in utility plant. Capital fees totaled $18.9 million in 2005 and $10.6 million in 2004. Provision for depreciation is made using the straight-line method based upon estimated economic lives, which range from 3 to 50 years, of related operating assets. The Department uses a half-year convention method on the assumption that additions and replacements are placed in service at mid-year. The composite depreciation rate was approximately 3.2% in 2005 and 3.3% in 2004. When operating plant assets are retired, their original cost together with removal costs, less salvage, is charged to accumulated depreciation. The cost of maintenance and repairs is charged to expense as incurred, while the cost of replacements and betterments is capitalized. The Department periodically reviews long-lived assets for impairment to determine whether any events or circumstances indicate the carrying value of the assets may not be recoverable. No impairment was identified in 2005 or 2004.

- 22 -
Utility plant-in-service at original cost, excluding land, at December 31, 2005 and 2004, was:
Hydraulic2005 Production Transmission Distribution General Total
Original cost: Beginning balance 578,538,829$ 146,878,059$ 1,199,966,841$ 324,122,317$ 2,249,506,046$ Capital acquisitions 30,991,565 3,248,505 55,470,155 21,000,498 110,710,723 Dispositions (1,684,784) (489,418) (1,928,620) (770,302) (4,873,124) Transfers and adjustments 823,606 551,599 1,375,205
Total original cost 607,845,610 149,637,146 1,254,331,982 344,904,112 2,356,718,850
Accumulated depreciation: Beginning balance 289,063,621 65,638,978 437,756,656 188,280,922 980,740,177 Increase in accumulated depreciation 11,737,121 2,687,486 36,161,453 25,387,644 75,973,704 Retirements (2,774,737) (665,735) (4,924,582) (781,050) (9,146,104) Retirement work-in-process (350,381) (15,614) 75,614 (221,966) (512,347)
Total accumulated depreciation 297,675,624 67,645,115 469,069,141 212,665,550 1,047,055,430
Ending balance 310,169,986$ 81,992,031$ 785,262,841$ 132,238,562$ 1,309,663,420$
Hydraulic2004 Production Transmission Distribution General TotalOriginal cost: Beginning balance 558,719,929$ 145,980,758$ 1,139,408,622$ 308,571,436$ 2,152,680,745$ Capital acquisitions 21,961,354 1,187,005 62,987,671 16,314,017 102,450,047 Dispositions (2,142,454) (293,036) (2,623,685) (777,529) (5,836,704) Transfers and adjustments 3,332 194,233 14,393 211,958
Total original cost 578,538,829 146,878,059 1,199,966,841 324,122,317 2,249,506,046
Accumulated depreciation: Beginning balance 279,407,244 62,863,386 410,101,952 162,605,931 914,978,513 Increase in accumulated depreciation 11,282,044 3,054,556 34,751,523 26,120,555 75,208,678 Retirements (2,203,137) (291,843) (6,425,010) (648,305) (9,568,295) Retirement work in progress 577,470 12,879 (671,809) 202,741 121,281
Total accumulated depreciation 289,063,621 65,638,978 437,756,656 188,280,922 980,740,177
Ending balance 289,475,208$ 81,239,081$ 762,210,185$ 135,841,395$ 1,268,765,869$
3. CASH AND EQUITY IN POOLED INVESTMENTS
Cash and Equity in Pooled Investments—Cash resources of the Department are combined with cash resources of the City to form a pool of cash that is managed by the City’s Department of Executive Administration (“DEA”). Under the City’s investment policy, DEA invests and manages all temporary cash surpluses in the pool. The Department’s share of the pool is included in the balance sheets under the caption “cash and equity in pooled investments” or accounts within restricted cash. The pool operates like a demand deposit account in that all agencies, including the City, may deposit cash at any time and can also withdraw cash out of the pool without prior notice or penalty. Accordingly, the statements of cash flows reconcile to cash and equity in pooled investments.
Custodial Credit Risk—Deposits—Custodial credit risk is the risk that the deposits may not be returned to the City in the event of a bank failure. The Federal Deposit Insurance Corporation (“FDIC”) insures the City’s deposits up to $100,000. All deposits not covered by FDIC insurance are covered by the Public Deposit Protection Commission (“PDPC”) of the State of Washington. The PDPC is a statutory authority established under the Revised Code of Washington (RCW) 39.58. It constitutes a multiple financial institution collateral pool. In the case of a loss by any public depository in the state, each public depository is liable for an amount up to 11% of its public deposits. Provisions of RCW 39.58.060

- 23 -
authorize the PDPC to make pro-rata assessments in proportion to the maximum liability of each such depository as it existed on the date of loss. Therefore, PDPC protection is that of collateral, not of insurance.
Investments—The Department’s cash resources may be invested by DEA separate from the cash and investments pool. Investments are managed in accordance with the City’s investment policy, with limits and restrictions applied at the City-wide level rather than to specific investments of the Department.
As of December 31, 2005 and 2004, the Department’s dedicated investments and the City’s pool and other investments were as follows:
Weighted-Dedicated Other Average
Investments of City Dedicated Maturitythe Department City Pool Investments Total (Days)
U.S. government agencies - $ 463,082,449$ 19,413,066$ 482,495,515$ 362Commercial paper 148,243,488 34,222,940 182,466,428 8U.S. government obligations 49,243,172 49,243,172 264Repurchase agreements 66,900,812 66,900,812 3
- 727,469,921 53,636,006 781,105,927
Cash on deposit 14,378,730 14,378,730
Total - $ 741,848,651$ 53,636,006$ 795,484,657$
Portfolio weighted-average maturity 243
Fair Value2005
Weighted-Dedicated Other Average
Investments of City Dedicated Maturitythe Department City Pool Investments Total (Days)
U.S. government agencies 17,928,928$ 415,548,889$ 77,358,485$ 510,836,302$ 525Commercial paper 8,959,398 124,853,475 58,327,328 192,140,201 27U.S. government obligations 49,350,625 49,350,625 630Repurchase agreements 30,600,403 30,600,403 3
26,888,326 620,353,392 135,685,813 782,927,531
Cash on deposit 7,019,078 7,019,078
Total 26,888,326$ 627,372,470$ 135,685,813$ 789,946,609$
Portfolio weighted-average maturity 389
Fair Value2004

- 24 -
As of December 31, 2005 and 2004, the Department’s share of the City pool was as follows:
2005 2004
Cash and equity in pooled investments: Restricted assets 35,815,079$ 96,830,413$ Current assets 141,897,558 60,707,996
Total 177,712,637$ 157,538,409$
Balance as a percentage of City pool 24.0 % 29.4 %
Interest Rate Risk—Interest rate risk is the risk that changes in interest rates over time will adversely affect the fair value of an investment. In accordance with its investment policy, the City manages its exposure to declines in fair values by limiting the weighted-average maturity of its investment portfolio to no longer than five years. Furthermore, to achieve its financial objective of maintaining liquidity to meet its operating cash flow needs, the City typically selects investments that have much shorter average maturities.
Credit Risk—Credit risk is the risk that an issuer or other counterparty to an investment will not fulfill its obligations. In accordance with its investment policy, the City manages its exposure to credit risk by limiting its investments in commercial paper purchased on the secondary market to those with maturities not longer than 180 days from purchase and with the highest rating by at least two nationally recognized statistical rating organizations. As of December 31, 2005, the City’s investments in commercial paper were rated P-1 by Moody’s Investors Service, A-1 by Standard & Poor’s, and/or F-1 by Fitch Ratings.
The City also purchases obligations of government-sponsored enterprises, which are eligible as collateral for advances to member banks as determined by the Board of Governors of the Federal Reserve System. These include, but are not limited to, debt securities of Federal Home Loan Bank, Federal Home Loan Mortgage Corporation, Federal Farm Credit Bank, and Federal National Mortgage Association. As of December 31, 2005 and 2004, these investments were rated Aaa by Moody’s Investors Service and AAA by Standard & Poor’s.
The City’s investments in repurchase agreements require a master repurchase agreement executed with the counterparty and may only be conducted with primary dealers, the City’s bank of record, or master custodial bank. Securities delivered as collateral must be priced at a minimum of 102% of their market value for U.S. Treasuries and at higher margins of 103% to 105% for debentures of U.S. federal government-sponsored enterprises, mortgage-backed pass-throughs, banker’s acceptances, and commercial paper. In addition, collateral securities must have the highest credit ratings of at least two Nationally Recognized Statistical Rating Organizations (“NRSRO”). Repurchase agreements themselves do not carry a credit rating as of December 31, 2005 and 2004, the securities underlying the City’s investment in repurchase agreements included collateral other than U.S. Treasuries.

- 25 -
Concentration of Credit Risk—Concentration of credit risk is the risk of loss attributed to the magnitude of a government’s investment in a single issuer. In accordance with its investment policy, the City manages its exposure to concentration of credit risk for the City’s investments portfolio as a whole. The City limits its investments in any one issuer to no more than 20% of its portfolio, except for investments in U.S. government obligations or U.S. government agency securities, which may comprise up to 100% of the portfolio. The City’s investments in which 5% or more is invested in any single issuer as of December 31, 2005 and 2004, were as follows:
Percent of Percent ofTotal Total
Issuer Fair Value Investments Fair Value Investments
Federal Home Loan Mortgage Corporation 188,149,001$ 24 % 147,635,256$ 19 %Federal National Mortgage Corporation 140,905,430 18 183,833,596 23 Federal Home Loan Bank 114,213,705 15 94,353,228 12 Merrill Lynch Government Securities, Inc. 66,900,000 9 Federal Farm Credit Bank 39,227,380 5 70,065,456 9
Total 549,395,516$ 71 % 495,887,536$ 63 %
2005 2004
The Department’s dedicated investments in which 5% or more is invested in any single issuer as of December 31, 2005 and 2004, were as follows:
Department DepartmentPercent of Percent of
Total TotalIssuer Fair Value Investments Fair Value Investments
Intesa Funding LLC - $ - % 8,959,398$ 33.3 %Federal National Mortgage Corporation 10,973,448 40.8 Federal Agricultural Mortgage Corporation 6,955,480 25.9
Total - $ - % 26,888,326$ 100.0 %
20042005
Custodial Credit Risk—Custodial credit risk for investments is the risk that, in the event of the failure of the counterparty, the City will not be able to recover the value of its investments or collateral securities that are in the possession of an outside party. In accordance with its investment policy, the City maintains a list of security dealers and financial institutions authorized to provide investment services to the City. The security dealers and financial institutions may include primary dealers or regional dealers that qualify under Securities and Exchange Commission Rule 15C3-1 (uniform net capital rule) and investment departments of local banks which passed evaluation of their financial condition, strength, and capability to fulfill commitments; overall reputation with other dealers and investors; regulatory status; and background and expertise on their individual representative.
Foreign Currency Risk—The City treasury investments pool and securities held for dedicated funds do not have any exposure to foreign currency risk.

- 26 -
Securities Lending Transactions—The City is authorized to engage in securities lending transactions similar to that instituted by the Washington State Treasurer’s Office and other municipal corporations in the State of Washington. There were no securities lending transactions outstanding as of December 31, 2005 and 2004.
Reverse Repurchase Agreements—The City may enter into reverse repurchase agreements as part of its investment policies. These agreements are sales of securities with a simultaneous agreement to repurchase the securities at a future date at the same prices plus contracted rates of interest. The fair value of the securities underlying the agreements normally exceeds the cash received, providing the dealers a margin against a decline in the fair value of the securities. If the dealers default on their obligations to resell these securities to the City, or provide securities or cash of equal value, the City would suffer an economic loss equal to the difference between the fair value plus accrued interest of the underlying securities and the agreement obligation, including accrued interest. There were no outstanding reverse repurchase agreements as of December 31, 2005 and 2004.
4. ACCOUNTS RECEIVABLE
Accounts receivable at December 31, 2005 and 2004, consist of:
Due From Retail Wholesale Fees OtherPower Power and Other Interfund Governments Total
2005: Accounts receivable 52,978,487$ 17,252,550$ 8,593,180$ 3,106,870$ 3,402,911$ 85,333,998$ Less allowance for doubtful accounts (12,236,500) (2,061,500) (1,190,000) (15,488,000)
40,741,987$ 15,191,050$ 7,403,180$ 3,106,870$ 3,402,911$ 69,845,998$
2004: Accounts receivable 60,641,402$ 26,453,326$ 7,394,914$ 20,729,775$ 9,513,245$ 124,732,662$ Less allowance for doubtful accounts (12,335,000) (2,550,000) (1,202,000) (16,087,000)
48,306,402$ 23,903,326$ 6,192,914$ 20,729,775$ 9,513,245$ 108,645,662$
5. SHORT-TERM POWER CONTRACTS AND DERIVATIVE INSTRUMENTS
The Department enters into short-term forward contracts to purchase or sell energy. Under these forward contracts, the Department commits to purchase or sell a specified amount of energy at a specified time, or during a specified time in the future. Certain of the forward contracts are considered derivative instruments as they may be net-settled without physical delivery. These derivative instruments, along with other short-term power transactions, are entered into solely for the purpose of managing the Department’s resources to meet load requirements. Gains and losses resulting from the fair valuation of the derivative instruments are deferred pursuant to SFAS No. 71 (see Notes 11 and 12). Power transactions in response to forecasted seasonal resource and demand variations require approval by the Department’s Risk Oversight Committee. Fluctuations in annual precipitation levels and other weather conditions materially affect the energy output from the Department’s hydroelectric facilities and some of its long-term purchased hydroelectric power agreements. Demand fluctuates with weather and local economic conditions. Accordingly, short-term power transactions required to manage resources to meet the Department’s load and dispose of surplus energy may vary from year to year.
- 27 -
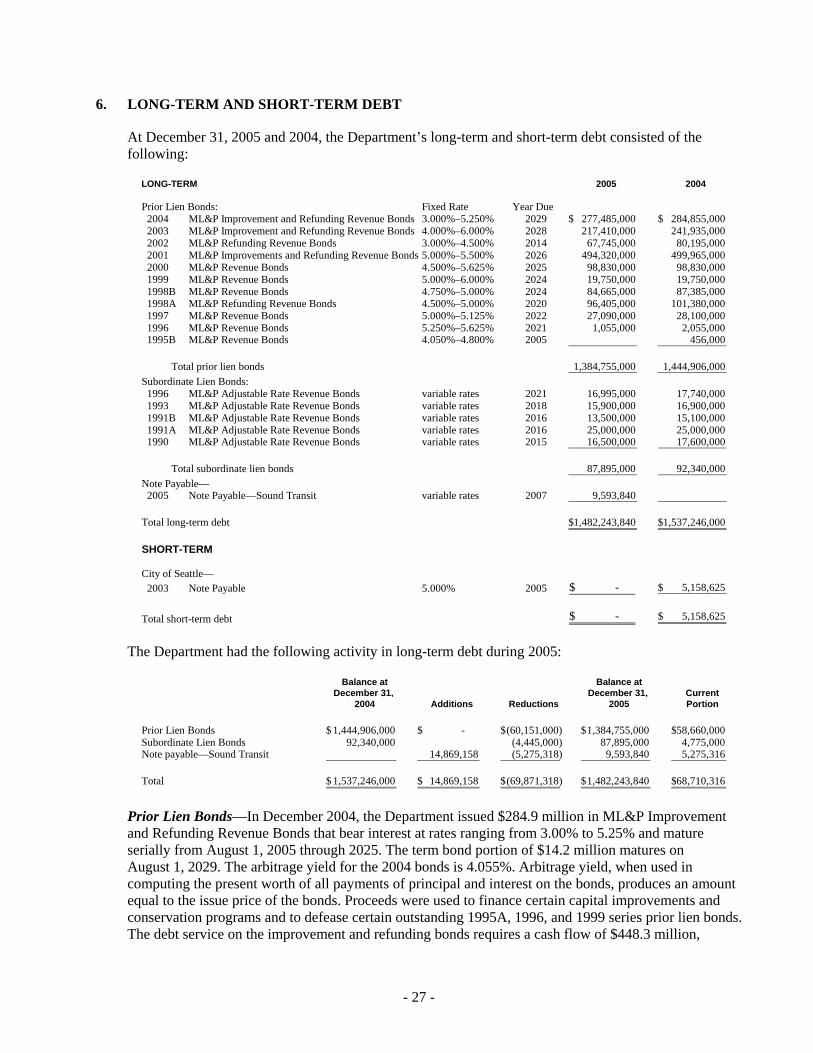
6. LONG-TERM AND SHORT-TERM DEBT
At December 31, 2005 and 2004, the Department’s long-term and short-term debt consisted of the following:
LONG-TERM 2005 2004
Prior Lien Bonds: Fixed Rate Year Due 2004 ML&P Improvement and Refunding Revenue Bonds 3.000%–5.250% 2029 277,485,000$ 284,855,000$ 2003 ML&P Improvement and Refunding Revenue Bonds 4.000%–6.000% 2028 217,410,000 241,935,000 2002 ML&P Refunding Revenue Bonds 3.000%–4.500% 2014 67,745,000 80,195,000 2001 ML&P Improvements and Refunding Revenue Bonds 5.000%–5.500% 2026 494,320,000 499,965,000 2000 ML&P Revenue Bonds 4.500%–5.625% 2025 98,830,000 98,830,000 1999 ML&P Revenue Bonds 5.000%–6.000% 2024 19,750,000 19,750,000 1998B ML&P Revenue Bonds 4.750%–5.000% 2024 84,665,000 87,385,000 1998A ML&P Refunding Revenue Bonds 4.500%–5.000% 2020 96,405,000 101,380,000 1997 ML&P Revenue Bonds 5.000%–5.125% 2022 27,090,000 28,100,000 1996 ML&P Revenue Bonds 5.250%–5.625% 2021 1,055,000 2,055,000 1995B ML&P Revenue Bonds 4.050%–4.800% 2005 456,000
Total prior lien bonds 1,384,755,000 1,444,906,000 Subordinate Lien Bonds: 1996 ML&P Adjustable Rate Revenue Bonds variable rates 2021 16,995,000 17,740,000 1993 ML&P Adjustable Rate Revenue Bonds variable rates 2018 15,900,000 16,900,000 1991B ML&P Adjustable Rate Revenue Bonds variable rates 2016 13,500,000 15,100,000 1991A ML&P Adjustable Rate Revenue Bonds variable rates 2016 25,000,000 25,000,000 1990 ML&P Adjustable Rate Revenue Bonds variable rates 2015 16,500,000 17,600,000
Total subordinate lien bonds 87,895,000 92,340,000 Note Payable— 2005 Note Payable—Sound Transit variable rates 2007 9,593,840
Total long-term debt 1,482,243,840$ 1,537,246,000$
SHORT-TERM
City of Seattle— 2003 Note Payable 5.000% 2005 - $ 5,158,625$
Total short-term debt - $ 5,158,625$
The Department had the following activity in long-term debt during 2005:
Balance at Balance atDecember 31, December 31, Current
2004 Additions Reductions 2005 Portion
Prior Lien Bonds 1,444,906,000$ - $ (60,151,000)$ 1,384,755,000$ 58,660,000$Subordinate Lien Bonds 92,340,000 (4,445,000) 87,895,000 4,775,000 Note payable—Sound Transit 14,869,158 (5,275,318) 9,593,840 5,275,316
Total 1,537,246,000$ 14,869,158$ (69,871,318)$ 1,482,243,840$ 68,710,316$
Prior Lien Bonds—In December 2004, the Department issued $284.9 million in ML&P Improvement and Refunding Revenue Bonds that bear interest at rates ranging from 3.00% to 5.25% and mature serially from August 1, 2005 through 2025. The term bond portion of $14.2 million matures on August 1, 2029. The arbitrage yield for the 2004 bonds is 4.055%. Arbitrage yield, when used in computing the present worth of all payments of principal and interest on the bonds, produces an amount equal to the issue price of the bonds. Proceeds were used to finance certain capital improvements and conservation programs and to defease certain outstanding 1995A, 1996, and 1999 series prior lien bonds. The debt service on the improvement and refunding bonds requires a cash flow of $448.3 million,

- 28 -
including $163.4 million in interest. The difference between the cash flows required to service the old and the new debt and complete the refunding totaled $22.4 million, and the aggregate economic gain totaled $12.1 million at net present value. The loss on refunding was $19.7 million and is being amortized using the effective interest method over the life of the refunded bonds. The unamortized balance of the loss on refunding at December 31, 2005 and 2004, was $18.1 million and $19.6 million, respectively.
Future debt service requirements for prior lien bonds are as follows:
Years Ending Principal InterestDecember 31 Redemptions Requirements Total
2006 58,660,000$ 69,569,752$ 128,229,752$ 2007 61,450,000 66,766,240 128,216,240 2008 64,620,000 63,596,352 128,216,352 2009 67,990,000 60,235,645 128,225,645 2010 71,525,000 56,698,740 128,223,740 2011–2015 344,005,000 232,746,294 576,751,294 2016–2020 346,405,000 141,725,888 488,130,888 2021–2025 299,130,000 58,046,088 357,176,088 2026–2029 70,970,000 5,158,050 76,128,050
Total 1,384,755,000$ 754,543,049$ 2,139,298,049$
The Department is required by ordinance to fund reserves for prior lien bond issues in an amount equal to the lesser of (a) the maximum annual debt service on all bonds secured by the reserve account or (b) the maximum amount permitted by the Internal Revenue Code (“IRC”) of 1986 as a reasonably required reserve or replacement fund. Upon issuance of the 2004 bonds, the maximum annual debt service on prior lien bonds was $128.2 million due in 2006. The maximum amount permitted by the IRC was $113.3 million. At December 31, 2004, the balance in the reserve account was $87.0 million at fair value. The reserve account is required to be fully funded by December 1, 2009. In September 2005, the Department purchased a Municipal Bond Debt Service Reserve Insurance Policy (Surety Bond) at a cost of $2.5 million to meet the total reserve fund requirement as authorized by Ordinance No. 121812. Accordingly, the reserve account was liquidated and the funds in the reserve account were used to fund a new $25.0 million Contingency Reserve Account, also authorized by Ordinance No. 121812. The balance of $62.4 million was used for additional long-term debt reduction by transferring these funds to the Construction Account for authorized capital expenditures.
In addition to the 2004 refunding revenue bonds, the Department has previously issued several refunding revenue bonds for the purpose of defeasing certain outstanding prior lien bonds. Proceeds from the refunding bonds were placed in separate irrevocable trusts to provide for all future debt service payments on the bonds defeased. Refunding revenue bonds issued with balances outstanding in irrevocable trusts during 2005 and 2004 were for the 1998 and 1993 series. Neither the assets of the respective trust accounts nor the liabilities for the defeased bonds are reflected in the Department’s financial statements. The bonds defeased in 1998 were called in full on July 1, 2004. The bonds defeased in 1993 were called in full on August 1, 2005. The bonds defeased in 2004 had outstanding principal balances of $163.5 million and $215.3 million as of December 31, 2005 and 2004, respectively. Funds held in the 2004 trust account on December 31, 2005, are sufficient to service and redeem the defeased bonds.

- 29 -
Subordinate Lien Bonds—The Department is authorized to issue a limited amount of adjustable rate revenue bonds, which are subordinate to prior lien bonds with respect to claims on revenues. Subordinate lien bonds may be issued to the extent that the new bonds will not cause the aggregate principal amount of such bonds then outstanding to exceed the greater of $70.0 million or 15% of the aggregate principal amount of prior lien bonds then outstanding. Subordinate bonds may be remarketed daily, weekly, short term, or long term and may be converted to prior lien bonds when certain conditions are met.
Future debt service requirements on the subordinate lien bonds, based on 2005 end of year actual interest rates ranging from 2.9% to 3.45% through year 2021, are as follows:
Years Ending Principal InterestDecember 31 Redemptions Requirements Total
2006 4,775,000$ 2,688,539$ 7,463,539$ 2007 5,305,000 2,533,179 7,838,179 2008 5,840,000 2,364,198 8,204,198 2009 6,270,000 2,179,522 8,449,522 2010 6,705,000 1,982,427 8,687,427 2011–2015 41,830,000 6,355,759 48,185,759 2016–2020 15,760,000 1,217,763 16,977,763 2021 1,410,000 44,204 1,454,204
Total 87,895,000$ 19,365,591$ 107,260,591$
Fair Value—The fair value of the Department’s bonds is estimated based on the quoted market prices for the same or similar issues or on the current rates offered to the Department for debt of the same remaining maturities. Carrying amounts (net of premiums and discounts) and fair values at December 31, 2005 and 2004, are as follows:
Carrying CarryingAmount Fair Value Amount Fair Value
Long-term debt: Prior lien bonds 1,421,086,258$ 1,448,952,736$ 1,485,232,262$ 1,530,156,972$ Subordinate lien bonds 87,689,500 87,895,000 92,116,635 92,340,000
Total 1,508,775,758$ 1,536,847,736$ 1,577,348,897$ 1,622,496,972$
2005 2004
Amortization—Bond issue costs, including the surety bond, discounts, and premiums are amortized using the effective interest method over the term of the bonds.
The excess of costs incurred over the carrying value of bonds refunded on early extinguishment of debt is amortized as a component of interest expense using both the straight-line and effective interest methods over the terms of the issues to which they pertain. Deferred refunding costs amortized to interest expense totaled $5.6 million in 2005 and $4.7 million in 2004. Deferred refunding costs in the amount of $47.8 million and $53.5 million are reported as a component of long-term debt in the 2005 and 2004 balance sheets, respectively.

- 30 -
Note Payable—Sound Transit—In 2003, the Department negotiated an agreement with Sound Transit, the regional transit authority, to perform electrical work pertaining to the undergrounding of utilities along Martin Luther King Way for the new light rail line under construction. There are two major components of this work. The first component consists of installing an underground ductbank along Martin Luther King Way in South Seattle. The second element is to perform the necessary underground electrical work within the ductbank. Financial terms of this agreement were finalized during 2005 that resulted in a note payable to Sound Transit. Sound Transit is nearing completion of the underground ductbank at a cost of $18.7 million, of which the Department is responsible for $11.8 million, payable to Sound Transit. During 2005, $3.9 million was repaid leaving an outstanding balance of $7.9 million at December 31, 2005. The underground electrical work is being financed in part by Sound Transit and the total amount due to Sound Transit is $3.1 million. During 2005, $1.4 million was repaid leaving a balance due of $1.7 million at year-end. Both of these items comprise the total balance of the $9.6 million note payable to Sound Transit. The note payable matures in December 2007 at an interest rate of 3.9%, plus an inflation component. Debt service requirements are:
Years Ending Principal InterestDecember 31 Redemptions Requirements Total
2006 5,275,316$ 205,824$ 5,481,140$2007 4,318,524 85,079 4,403,603
Total 9,593,840$ 290,903$ 9,884,743$
Note Payable—City of Seattle—In 2003, the Department purchased real estate property for a potential future substation from the City of Seattle Department of Parks and Recreation at a price of $5.6 million, financed with a note payable to the Department of Parks and Recreation at 5%, that matured and was paid in July 2005.
Short-Term Borrowings—Ordinance No. 121154 authorized an interfund loan up to $100.0 million beginning October 31, 2003, and expiring in December 31, 2004. The amount outstanding as of December 31, 2003, was $70 million. The interest rate for the note payable for each month during 2004 was equal to the rate of return earned for each respective month by the City’s consolidated (residual) cash portfolio. The 2003 short-term borrowing was carried as a reduction of operating cash balance until the cash balance was restored from operations in May 2004. There were no additional short-term borrowings for the balance of 2004 and during 2005.
7. ACCOUNTS PAYABLE
Accounts Payable and Other—The composition of accounts payable and other at December 31, 2005 and 2004, is as follows:
2005 2004
Vouchers payable 10,652,387$ 7,486,533$ Power accounts payable 45,017,292 29,871,492 Interfund payable 6,439,120 5,265,504 Taxes payable 8,829,925 8,367,304 Claims payable—current 4,526,540 6,098,468 Guarantee deposit and contract retainer 2,560,447 2,909,548 Other accounts payable 202,984 171,707 Total 78,228,695$ 60,170,556$

- 31 -
8. SEATTLE CITY EMPLOYEES’ RETIREMENT SYSTEM
The Seattle City Employees’ Retirement System (“SCERS”) is a single-employer defined benefit public employee retirement system, covering employees of the City and administered in accordance with Chapter 41.28 of the Revised Code of Washington and Chapter 4.36 of the Seattle Municipal Code. SCERS is a pension trust fund of the City.
All employees of the City are eligible for membership in SCERS with the exception of uniformed police and fire personnel who are covered under a retirement system administered by the State of Washington. Employees of Metro and the King County Health Department who established membership in SCERS when these organizations were City departments were allowed to continue their SCERS membership. As of January 1, 2004, there were 4,876 retirees and beneficiaries receiving benefits and 8,382 active members of SCERS. In addition, 1,560 vested terminated employees were entitled to future benefits.
SCERS provides retirement, death, and disability benefits. Retirement benefits vest after five years of credited service, while death and disability benefits vest after 10 years of service. Retirement benefits are calculated as 2% multiplied by years of creditable service, multiplied by average salary, based on the highest 24 consecutive months, excluding overtime. The benefit is actuarially reduced for early retirement. Future increases in the cost-of-living adjustments are available to current and future retired members only if SCERS attains at least a 95% funding level. SCERS does not provide termination benefits.
Actuarially recommended contribution rates both for members and for the employer were 8.03% of covered payroll during 2005 and 2004.
Under the authority of the state and City, SCERS operates a securities lending program, and there were transactions during 2005 and 2004. SCERS has had no losses resulting from a default, and SCERS did not have negative credit exposure at December 31, 2005 or 2004.
SCERS issues stand-alone financial statements that may be obtained by writing to the Seattle City Employees’ Retirement System, 720 Third Avenue, Suite 1000, Seattle, WA 98104; telephone: (206) 386-1292.
Employer contributions for the City were $35.8 million and $36.7 million in 2005 and 2004, respectively, and the annual required contributions were made in full.
Actuarial Data
Valuation date January 1, 2004Actuarial cost method Entry ageAmortization method Level percentRemaining amortization period 30.2 yearsAmortization period OpenAsset valuation method Market
Actuarial Assumptions* Percentage
Investment rate of return 7.75%Projected general wage increases 4.00Cost-of-living year-end bonus dividend 0.67
* Includes price inflation at 3.5%.

- 32 -
Schedule of funding progress for SCERS (dollar amounts in millions):
UAAL orActuarial (Excess) as a
Actuarial Actuarial Accrued Unfunded Percentage Valuation Value of Liabilities AAL Funding Covered of Covered
Date Assets (“AAL”)(1) (“UAAL”)(2) Ratio Payroll(3) PayrollJanuary 1, (a) (b) (b-a) (a/b) (c) ((b-a)/c)
2001(4) 1,493.1$ 1,490.3$ (2.8)$ 100.2 % 405.0$ (0.7)% 2002 1,383.7 1,581.4 197.7 87.5 405.1 48.8 2004(5) 1,527.5 1,778.9 251.4 85.9 424.7 59.2
(1) Actuarial present value of benefits less actuarial present value of future normal costs based on entry age actuarial cost method.
(2) Actuarial accrued liabilities less actuarial value of assets; funding excess if negative. (3) Covered payroll includes compensation paid to all active employees on which contributions are
calculated. (4) Information for January 1, 2001, was provided by an actuarial study, rather than a full valuation. (5) An actuarial study as of January 1, 2006, is scheduled to be issued by June 2006.
9. DEFERRED COMPENSATION
The Department’s employees may contribute to the City’s Voluntary Deferred Compensation Plan (the “Plan”). The Plan, available to City employees and officers, permits participants to defer a portion of their salary until future years. Effective 2004, the Plan administrator is Prudential Retirement. The deferred compensation is paid to participants and their beneficiaries upon termination, retirement, death, or unforeseeable emergency.
Effective January 1, 1999, the Plan became an eligible deferred compensation plan under Section 457 of the IRC of 1986, as amended, and a trust exempt from tax under IRC Sections 457(g) and 501(a). The Plan is operated for the exclusive benefit of participants and their beneficiaries. No part of the corpus or income of the Plan shall revert to the City or be used for, or diverted to, purposes other than the exclusive benefit of participants and their beneficiaries.
The Plan is not reported in the financial statements of the City or the Department.
It is the opinion of the City’s legal counsel that the City has no liability for investment losses under the Plan. Participants direct the investment of their money into one or more options provided by the Plan and may change their selection from time to time. By enrolling in the Plan, participants accept and assume all risks inherent in the Plan and its administration.
10. LONG-TERM PURCHASED POWER, EXCHANGES, AND TRANSMISSION
Bonneville Power Administration—The Department purchases electric energy from the U.S. Department of Energy, Bonneville Power Administration (“Bonneville”) under the Block and Slice Power Sales Agreement, a 10-year contract that expires September 30, 2011. The agreement provides power equal to the Department’s annual net requirement, defined as the difference between projected load and firm resources declared to serve that load. The Block product provides fixed amounts of power per month. The terms of the Slice product specify that the Department will receive a fixed percentage (4.6676%) of the actual output of the Federal Columbia River Power System. The cost of Slice power is

- 33 -
based on the Department’s same percentage (4.6676%) of the expected costs of the system and is subject to true-up adjustments based on actual costs. Subsequent amendments to the contract provide that Bonneville will pay the Department for energy savings realized through specified programs.
Lucky Peak—In 1984, the Department entered into a purchase power agreement with four irrigation districts to acquire 100% of the net output of a hydroelectric facility that began commercial operation in 1988 at the existing Army Corps of Engineers Lucky Peak Dam on the Boise River near Boise, Idaho. The irrigation districts are owners and license holders of the project, and the FERC license expires in 2030. The agreement, which expires in 2038, obligates the Department to pay all ownership and operating costs, including debt service, over the term of the contract, whether or not the plant is operating or operable. To properly reflect its rights and obligations under this agreement, the Department includes as an asset and liability the outstanding principal of the project’s debt, net of the balance in the project’s reserve account.
British Columbia—High Ross Agreement—In 1984, an agreement was reached between the Province of British Columbia and the City under which British Columbia will provide the Department with power equivalent to that which would result from an addition to the height of Ross Dam. The power is to be received for 80 years, and delivery of power began in 1986. In addition to the direct costs of power under the agreement, the Department incurred costs of approximately $8.0 million in prior years related to the proposed addition and was obligated to help fund the Skagit Environmental Endowment Commission through four annual $1 million payments. These costs were deferred and are being amortized to purchase power expense over 35 years through 2035.
Power received and expenses under these and other long-term purchased power agreements at December 31, 2005 and 2004, are as follows:
aaMWh*Years EndingDecember 31 2005 2004 2005 2004 Bonneville Block 26,125,092$ 33,696,129$ 109.4 137.8 Bonneville Slice 105,391,716 97,278,651 385.1 392.8
131,516,808 130,974,780 494.5 530.6
Lucky Peak 15,766,739 16,783,152 25.8 31.3 British Columbia—High Ross Dam Agreement 13,376,505 13,370,826 35.4 34.8 City of Klamath Falls 43,806,082 42,022,348 66.4 81.8 State Line Wind 18,004,119 18,254,080 37.4 39.7 Pend Oreille County Public Utility District 421,129 1,500,570 3.0 6.7 Grant County Public Utility District 2,589,273 2,450,048 32.9 36.0 Grand Coulee Project Hydro Authority 3,307,017 5,679,435 28.5 28.9 Bonneville South Fork Tolt billing credit (3,065,648) (3,047,299) British Columbia—Boundary Encroachment (794,436) (1,197,160) 1.7 1.5 Exchange energy 33,070 2,358,648 0.2 12.4 Other 100,151 266,932 0.7
Total 225,060,809$ 229,416,360$ 725.8 804.4
Expense
* Average annual megawatt hours.

- 34 -
Estimated Future Payments Under Purchased Power and Transmission Contracts—The Department’s estimated payments under its contracts with Bonneville, the public utility districts, irrigation districts, Lucky Peak Project, British Columbia—High Ross Agreement, Klamath Falls, PacifiCorp Power Marketing, Inc. (now PPM Energy) and PacifiCorp for wind energy and net integration and exchange services, and for transmission with Bonneville and others for the period from 2006 through 2065, undiscounted, are:
Years Ending EstimatedDecember 31 Payments
2006 292,796,781$ 2007 298,883,897 2008 282,876,661 2009 268,641,653 2010 274,865,239 2011–2015(1) 597,924,668 2016–2020 498,680,493 2021–2025(2) 347,629,925 2026–2030 51,082,640 2031–2035 30,923,881 2036–2040 19,604,572 2041–2065 4,150,509
Total 2,968,060,919$
(1) Bonneville Block and Slice contract expires September 30, 2011.(2) Bonneville transmission contract expires July 31, 2025.
The effects of a proposed Northwest Regional Transmission Organization and other changes that could occur to transmission as a result of FERC’s implementation of the Federal Power Act as amended August 8, 2005, are not known and are not reflected in the estimated future payments.
Payments under these long-term power contracts totaled $238.0 million and $234.6 million in 2005 and 2004, respectively. Payments under these transmission contracts totaled $32.7 million and $30.7 million in 2005 and 2004, respectively.
11. OTHER ASSETS
Other assets comprise deferred conservation costs and other deferred charges. Seattle City Council passed resolutions authorizing the debt financing and deferral of programmatic conservation costs incurred by the Department, but not funded by third parties. These costs are amortized to expense over 20 years. Other deferred charges are incurred for relicensing of the Skagit project and are amortized to expense over the remaining license period of 20 years; and for other authorized purposes.
Deferred power costs incurred for short-term wholesale power purchases during 2001 were recovered through rates at $8.3 million per month through 2004, pursuant to SFAS No. 71 and Ordinance No. 120385.

- 35 -
Other deferred charges and assets net at December 31, 2005 and 2004, consisted of the following:
2005 2004
Unrealized losses from fair valuations of short-term forward purchases of electric energy 1,276,217$ 269,411$ Bonneville Slice contract true-up payment 9,058,233 2,070,957 Puget Sound Energy interconnection and substation 1,576,542 1,719,456 Studies, surveys, and investigations 1,745,016 1,680,622 Skagit Environmental Endowment 1,762,688 1,880,200 Endangered Species Act 1,668,998 1,511,438 Real estate and conservation loans receivable 267,032 414,608 Unamortized debt expense 8,017,602 6,169,024 General work-in-process to be billed 797,772 688,411 Other 350,701 275,650
Total 26,520,801$ 16,679,777$
Unamortized charges for the deferral of contractual payments pursuant to the High Ross Agreement will be amortized between 2021 and 2035. The remaining components of other assets, excluding billable work in progress, are being amortized to expense over 4 to 36 years.
12. DEFERRED CREDITS
Deferred credits at December 31, 2005 and 2004, consisted of the following:
2005 2004
Bonneville conservation augmentation 26,336,063$ 26,795,501$ Unrealized gains from fair valuation of short-term forward sales of electric energy 1,835,156 384,255 Levelized lease payments for Seattle administrative office 37,204 483,639 Deferred capital fees 5,791,235 1,590,580 Deferred revenues in lieu of rent for in-kind capital 551,599 Customer deposits—sundry sales 967,423 2,749,414 Deferred grants 659,777 Deferred revenues—streetlight administration 206,316 673,822 Deferred revenues—other 493,891 252,491
Total 36,878,664$ 32,929,702$
13. PROVISION FOR INJURIES AND DAMAGES
The Department is self-insured for casualty losses to its property, including for terrorism, environmental cleanup, and certain losses arising from third-party damage claims. The Department establishes liabilities for claims based on estimates of the ultimate cost of claims. The length of time for which such costs must be estimated varies depending on the nature of the claim. Actual claims costs depend on such factors as inflation, changes in doctrines of legal liability, damage awards, and specific incremental claim adjustment expenses. Claims liabilities are recomputed periodically using actuarial and statistical techniques to produce current estimates, which reflect recent settlements, claim frequency, industry averages, City-wide cost allocations, and economic and social factors. Liabilities for lawsuits, claims, and workers’ compensation were discounted over a period of 15 to 17 years in 2005 and 2004 at the

- 36 -
City’s average annual rate of return on investments, which was 2.849% in 2005 and 2.338% in 2004. Liabilities for environmental cleanup and for casualty losses to the Department’s property do not include claims that have been incurred but not reported and are not discounted due to uncertainty with respect to regulatory requirements and settlement dates, respectively.
The Lower Duwamish Waterway was designated a federal Superfund site by the EPA in 2001 for contaminated sediments. The City is one of four parties who signed an Administrative Order on Consent with the EPA and State Department of Ecology to conduct a remedial investigation/feasibility study to prepare a site remedy. The Department is considered a potentially responsible party for contamination in the Duwamish River due to land ownership or use of property located along the river. The liability for the Lower Duwamish Waterway site was estimated in the range of $7.5 million through $13 million at the end of 2005. The estimated liabilities recorded related to this site totaled $7.5 million and $5.3 million for 2005 and 2004, respectively.
The changes in the provision for injuries and damages at December 31, 2005 and 2004, are as follows:
2005 2004
Unpaid claims at January 1 15,605,682$ 13,657,541$Payments (3,917,431) (2,262,497) Incurred claims 6,699,305 4,210,638
Unpaid claims at December 31 18,387,556$ 15,605,682$
The provision for injuries and damages included in current and noncurrent liabilities at December 31, 2005 and 2004, is as follows:
2005 2004
Noncurrent liabilities 13,861,016$ 9,507,214$ Accounts payable and other 4,526,540 6,098,468
Total 18,387,556$ 15,605,682$
14. COMMITMENTS AND CONTINGENCIES
Operating Leases—In December 1994, the City entered into an agreement on behalf of the Department for a 10-year lease of office facilities in downtown Seattle commencing February 1, 1996. In early 1996, the City purchased the building in which these facilities are located, thus becoming the Department’s lessor. The lease was extended through December 2006. In addition, the Department leases equipment and smaller facilities for office purposes through long-term operating lease agreements. Expense under the leases totaled $3.9 million in 2005 and 2004.

- 37 -
Minimum payments under the operating leases are:
Years Ending MinimumDecember 31 Payments
2006 3,764,817$2007 137,826 2008 134,622 2009 11,773
Total 4,049,038$
2006 Capital Program—The estimated financial requirement for the Department’s 2006 program for capital improvement, conservation, and deferred operations and maintenance including required expenditures on assets owned by others is $174.8 million, and the Department has substantial contractual commitments relating thereto.
Skagit and South Fork Tolt Licensing Mitigation and Compliance—In 1995, the FERC issued a license for operation of the Skagit hydroelectric facilities through April 30, 2025. On July 20, 1989, the FERC license for operation of the South Fork Tolt hydroelectric facilities through July 19, 2029, became effective. As a condition for both of these licenses, the Department has taken and will continue to take required mitigating and compliance measures. Total Skagit mitigation costs from the effective date until expiration of the federal operating license were estimated at December 31, 2005, to be $115.2 million, of which $81.6 million had been expended; and for South Fork Tolt, $5.2 million and $0.3 million, respectively. Capital improvement, other deferred costs, and operations and maintenance costs are included in the estimates for both licenses.
Application Process for New Boundary License—The Department’s FERC license for the Boundary Project expires on September 30, 2011. The Department intends to submit an application for a new license by October 2009. Application process costs are estimated at $48.5 million; as of December 31, 2005, $6.6 million had been expended and deferred. A new license may require additional mitigation efforts for endangered species, including water quality standards, the full extent of which is not known at this time. Cost projections for new license requirements are not included in the forecast.
Endangered Species—Several fish species that inhabit waters where hydroelectric projects are owned by the Department, or where the Department purchases power, have been listed under the ESA as threatened or endangered. On the Columbia River System, the National Oceanographic Atmospheric Administration (“NOAA”) Fisheries has developed a broad species recovery plan for listed salmon and steelhead, including recommendations for upstream and downstream fish passage requirements. These requirements include minimum flow targets for the entire Columbia Basin designed to maximize the survival of migrating salmon and steelhead. As a result, the Department’s power generation at its Boundary Project is reduced in the fall and winter when the region experiences its highest sustained energy demand. The Boundary Project’s firm capability is also reduced.
Other Department-owned projects are not affected by the Columbia River. In Puget Sound, both bull trout and Chinook salmon have been listed as threatened. A draft recovery plan and proposed critical habitat for Puget Sound bull trout was issued by the U.S. Fish and Wildlife Service in July 2004. Final critical habitat has been designated for Puget Sound Chinook salmon. A recovery plan for Puget Sound Chinook salmon and bull trout, developed by regional stakeholders, has been proposed for adoption by NOAA Fisheries. The U.S. Fish and Wildlife Service has agreed to support this plan when approved by NOAA Fisheries. Bull trout are present in the waters of Skagit, Tolt, and Cedar River projects, and

- 38 -
Chinook salmon occur downstream of these projects. Steelhead, which are also present downstream of these projects, are undergoing a one-year review by NOAA Fisheries for potential listing as a threatened species in the Puget Sound. The decision to list steelhead is expected to be finalized by the end of 2006. While it is unknown how other listings will affect the Department’s hydroelectric projects and operations, the Department is carrying out an ESA Early Action program in cooperation with agencies, tribes, local governments, and salmon groups that will assist in the recovery of bull trout and Chinook salmon on the Skagit and Tolt. The Department will be participating in the implementation of this plan on both the regional and watershed levels. On the Cedar, the Department’s activities are covered by a Habitat Conservation Plan that authorizes operations with regard to all listed species. In addition to the ESA, hydroelectric projects must also satisfy the requirements of the Clean Water Act in order to obtain a FERC license. Total costs through 2011, estimated at December 31, 2005, for the ESA were $9.9 million, of which $4.8 million had been expended.
Project Impact Payments—Effective November 1999, the Department committed to pay a total of $11.6 million and $7.8 million over 10 years ending in 2008 to Pend Oreille County and Whatcom County, respectively, for impacts on county governments from the operations of the Department’s hydroelectric projects. The payments compensate the counties, and certain school districts and towns located in these counties, for loss of revenues and additional financial burdens associated with the projects. The Boundary Project located on the Pend Oreille River affects Pend Oreille County, and Skagit River hydroelectric projects affect Whatcom County. The combined impact compensation, including annual inflation factor of 3.1%, and retroactive payments totaled $1.2 million to Pend Oreille County in 2005 and 2004, and $0.8 million to Whatcom County in 2005 and 2004.
Streetlight Litigation—In November 2003, the Washington Supreme Court invalidated a 1999 ordinance that included streetlight costs in the Department’s general rate base for Seattle and Tukwila customers. As a result, the Department resumed billing the City for streetlight costs. In May 2004, further proceedings resulted in a ruling that required the Department to refund the amount collected from ratepayers since December 1999 attributable to streetlight costs. The ruling also required the City of Seattle general fund to repay the Department for the streetlight costs that should have been billed over the same period. The judgment was entered in October 2004, and required the City’s general fund to pay approximately $23.9 million to the Department, an amount representing billings for streetlight services that should have been made to the City from late December 1999 through November 2003. In addition, the judgment required the City’s general fund to pay approximately $222,000 to the Department for “loss of use” of funds, calculated as a percentage of the difference between the amount that should have been billed to the City and the amount paid by ratepayers for streetlight services. Payments were due on an installment schedule. The Department received $6.2 million in 2004, an additional $6.2 million in January 2005, and the final $12.9 million in April 2005.
The Department was to refund to ratepayers in Seattle and Tukwila the amount of streetlight costs billed to them from January 2000 through November 2003. Gross refunds were estimated to be $21.5 million, plus $2.6 million to compensate ratepayers for “loss of use” of funds. Plaintiffs’ attorney fees totaling $3.3 million and $0.7 million in administrative costs related to the refunds were deducted from the gross refund amount, leaving $20.0 million to be refunded to ratepayers. In 2005, refunds to current customers totaling $15.7 million were made by providing a credit on their electric utility bills. Currently inactive customers who received one or more billings during the period from January 2000 through November 2003 received refund checks during 2005 totaling $0.4 million.
The Department recorded the $2.4 million difference between the $23.9 million in payments from the City of Seattle and the $21.5 million in customer refunds as other operating revenues in 2004. During 2005, it was determined that the City had overpaid the amount due to the Department by $1.1 million, and the overpayment was refunded.

- 39 -
In addition, the partial judgment entered in October 2004 found that the City had inappropriately allocated to the Department certain central costs and ordered the City to refund approximately $1.0 million in such costs, including an allowance for “loss of use” of funds, to the Department.
Also in this partial judgment, the City’s One Percent for Art Ordinance was declared invalid as applied to the Department. The City appealed this ruling. On December 19, 2005, the Washington Court of Appeals reversed the trial court’s ruling that had declared the ordinance invalid as applied to the Department, but affirmed the trial court’s ruling that art funded by the Department must have a “sufficiently close nexus” to the Department’s purpose of providing electricity. Consequently in 2005, the Department recorded a reduction of $1.0 million in the One Percent for Art assets to comply with the court’s ruling.
Oregon Tax Claim—In 2001, the Oregon Department of Revenue assessed the Department, along with another northwest municipal utility, an ad valorem property tax for each utility’s respective interest in the Capacity Ownership Agreements with BPA for the Pacific Northwest Third AC Intertie transmission line. The assessment was for tax year 2001 with a retroactive “omitted property” assessment for years 1997 through 2000. The Oregon Court bifurcated the issues for trial into two phases: (a) liability for taxes and (b) valuation method. In January 2004, the Court issued a ruling in favor of the cities for the “omitted property” claims, eliminating the assessments prior to 2001. In June 2004, as a result of changes to the Oregon Tax Code, the Oregon Department of Revenue made a new “omitted assessment” for years 1999 and 2000.
Prior to trial, the Oregon Legislature resolved the matter by enacting legislation that retroactively exempts tangible property and intangible property rights in or related to the Pacific Northwest AC Intertie from Oregon ad valorem property taxation.
Burns versus Seattle—In July 2005, a class action lawsuit was filed against the City and the five suburban cities (Shoreline, Tukwila, Burien, SeaTac, and Lake Forest Park) that have franchise agreements with the Department. In each franchise, the Department agreed to make certain payments to the suburban city in exchange for the suburban city’s agreement not to establish its own municipal utility. The plaintiffs claimed that these payments were “franchise fees” that were illegal under RCW 35.21.860(1). In February 2006, the judge granted summary judgment in favor of the City and the suburban cities, dismissing the plaintiffs’ claims.
The plaintiffs have appealed this ruling to the State Supreme Court. If the trial court’s ruling is reversed on appeal, and the payments are found to be illegal, it is possible that the suburban cities may be required to refund these payments to the Department. In such event, the suburban cities would have the right to terminate the franchise upon 180 days’ written notice to the Department. Thus, if the payments are found to be illegal on appeal, it is possible that the franchise agreements may terminate. Due to the uncertainty of the litigation, the impact on Department operations is uncertain.
Contract Claims Related to FERC Litigation—In December 2005, Pacific Gas and Electric Company, Southern California Edison Company, San Diego Gas & Electric Company, and the California Electricity Oversight Board (the “California Parties”) filed with the City a claim for reimbursement of the difference between the rates charged by City Light in the ISO and PX markets and the lower rates ultimately determined by FERC for the period May 1, 2000 through June 20, 2001. The California Parties asserted that the City is contractually obligated to make the claimed reimbursements, even if FERC lacks the power to require them from governmental entities. The City denied the claim, and the California Parties have not yet taken further action. If they did, and were successful, the estimated liability would be approximately $1.4 million. The Department has not reserved an amount for a potential adverse judgment in these financial statements.

- 40 -
In January 2006, the People of the State of California and the California Department of Water Resources (the “People”) filed with the City a claim for reimbursement parallel to that of the California Parties. The City has denied the claim and the People have not yet taken further action. If they did, and were successful, the estimated liability would be approximately $1.7 million. The Department has not reserved an amount for a potential adverse judgment in these financial statements.
Other Contingencies—In addition to those noted above, in the normal course of business, the Department has various other legal claims and contingent matters outstanding. The Department believes that any ultimate liability arising from these actions will not have a material adverse impact on the Department’s financial position, operations, or cash flows.
* * * * * *