Embed Size (px)
Citation preview

Citizen-Centred Service
Measurement in Canada:
From Research to Results
Brian Marson Senior Advisor
Treasury Board of Canada
OECD Senior Budget Officials
Madrid, October 2007

2
What is Citizen-Centred Service?
“Citizen-Centred Service incorporates citizens’
concerns at every stage of the service design and
delivery process; that is, citizens’ needs become
the organizing principle around which the public
interest is determined and service delivery is
planned.”
-Deputy Ministers’ Task Force on Service
Delivery Models (1996)
3
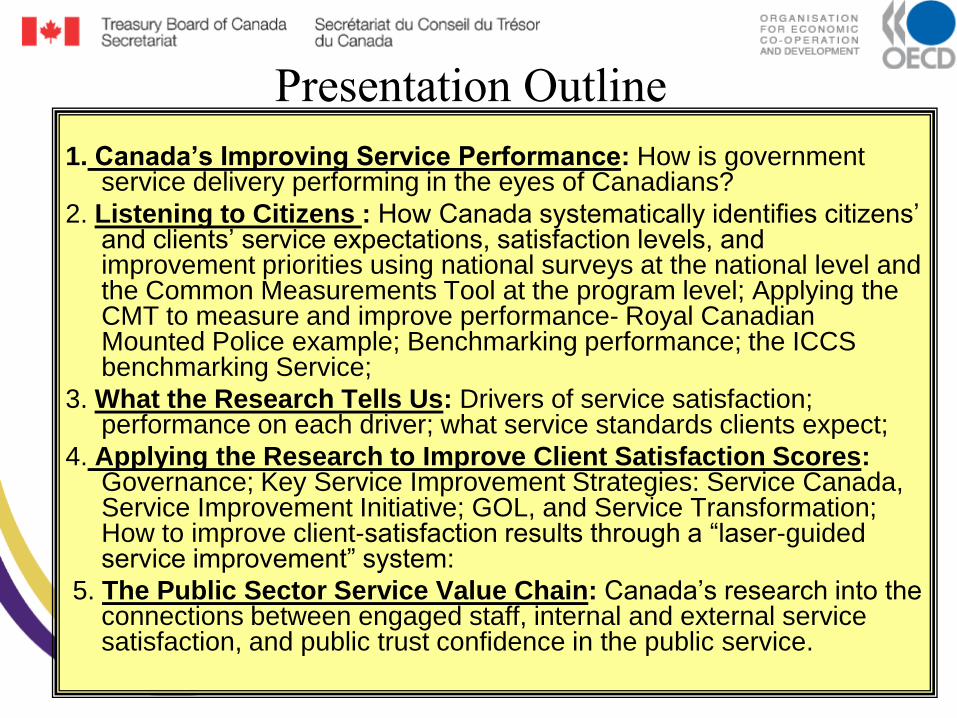
Presentation Outline
1. Canada’s Improving Service Performance: How is government service delivery performing in the eyes of Canadians?
2. Listening to Citizens : How Canada systematically identifies citizens’ and clients’ service expectations, satisfaction levels, and improvement priorities using national surveys at the national level and the Common Measurements Tool at the program level; Applying the CMT to measure and improve performance- Royal Canadian Mounted Police example; Benchmarking performance; the ICCS benchmarking Service;
3. What the Research Tells Us: Drivers of service satisfaction; performance on each driver; what service standards clients expect;
4. Applying the Research to Improve Client Satisfaction Scores:Governance; Key Service Improvement Strategies: Service Canada, Service Improvement Initiative; GOL, and Service Transformation; How to improve client-satisfaction results through a “laser-guided service improvement” system:
5. The Public Sector Service Value Chain: Canada’s research into the connections between engaged staff, internal and external service satisfaction, and public trust confidence in the public service.

5
Canadians Say that Public Sector Service is Steadily Improving
Service reputation scores
Citizens First 1 to 4
"What was the quality of the service for your… government in general?"
5347 47
57
50 51
59
5156
63
52
59
0
20
40
60
80
100
Municipal Provincial/Territorial Federal
Se
rvic
e Q
ua
lity
Sca
le (
0-1
00
)
CF1 CF2 CF3 CF4

6
60 6164
67
20
30
40
50
60
70
80
1998 2000 2002 2005
Se
rvic
e Q
ua
lity
Sc
ale
(0
-10
0)
The Government of Canada has
Achieved a 12% Improvement
in Citizen SatisfactionCompared to Citizens First 1998
(18 Core Services 1998-2005)

7
Key Federal Services are Achieving Higher Citizen Ratings*
(Trend: 1998 to 2005)
* General service rating. CMT scores for a recent experience are higher.

8
Outperforming the Private Sector
--7174Supermarkets
7057--Canada Post
74647066Average rating across services shown
--6457Taxis
6858--Used municipal public transit (bus, streetcar, subway)
--7468Private mail carriers and courier companies
8477--Visited a public library
CF4CF1CF4CF1
GovernmentPrivate
Mean Service Quality Score
(0-100)Services
How do public and private services compare?
Citizens First 1 and 4
“Many public sector services outperform mainstream private sector
services in the eyes of Canadians” (Citizens First-4 Survey, 2006)

9
2. Systematically Listening to
Citizens, Businesses and Clients Identifying Expectations,
Satisfaction Levels, Drivers,
Issues, and Improvement Priorities

10
Listening to Canadians
• Understanding the Big Picture (Citizen Level)– Citizens First national surveys
– Taking Care of Business national surveys
– Canada Internet Panel (10,000 people)
– National focus groups (e.g. telephony)
• Departmental/Program Level (Client)– The Common Measurements Tool (CMT)
• Developed by public managers for public managers
• Housed at the Institute for Citizen Centred Service
www.iccs-isac.org
• The CMT is based on the known “drivers” of client satisfaction
• The CMT permits programs to benchmark their results with others

11
Listening to Citizens:
National Surveys(sponsored by all levels of government)

12
Listening to Canadians: the
Government of Canada Internet Panel• Over 10,000 Canadians are recruited to the Canada Internet
Panel each year;
• Several general surveys on service satisfaction and service issues are conducted with the panel throughout the year;
• Individual departments use the Internet Panel to test service proposals, such as new websites, as well as policy, program design and delivery issues;
• On-line focus groups are conducted around service issues
• Canada has used Internet-based citizen panels for almost a decade.

13
Canadians Like Being Part of the Panel
• “I think this was a great idea and a good forum to
get some voices heard.”
• “It is a good way to test to make sure things are
going the way you think they are going.”
• “How else are you going to get information from all
of us Joe and Joan citizens out there.”

14
Recognition for the Internet Panel:“Canada also leads the world in its systematic
engagement with its citizens’ views. The Internet
Research Panel recruits 10,000 people from across
the country each year to participate in online polls,
discussions and focus groups, covering every topic
from online services to foreign policy.”
Sarah Arnott – Computing.co.uk (April 5, 2007
“This innovative On-Line Citizens Panel…”
“Canada has developed standing panels of citizens
that the government can tap at any point to get direct
and detailed feedback…” Accenture 2003 & 2007

15
Listening to Canadians-
Research on Specific Service Issues
• Each year the Canadian inter-governmental service community sponsors citizen-business survey research on major issues;
• A recent example is a project to improve telephone service for Canadians- “Answering the Call”, which involved both focus groups with citizens, as well as best practice research.

16
Listening to Clients and Improving Service:
The Common Measurements Tool
Obtain from: www.iccs-isac.org

17
CMT overview
• A multi-channel instrument for designing client satisfaction surveys; has a “bank” of standard questions;
• Based on empirical research into the “drivers” of service satisfaction
• Designed by public servants, for public servants
• Enables public organizations to benchmark results with others if the “core questions” are used;
• Being used at all three levels of government across Canada and in a growing number of other countries
1999 Gold Award
2000 Silver
Award

18
FairnessFairness I was treated fairlyI was treated fairly
Extra mileExtra mile Staff went the extra mile to help me get whatStaff went the extra mile to help me get what
I neededI needed
KnowledgeKnowledge Staff were knowledgeable Staff were knowledgeable
TimelinessTimeliness I was satisfied with the amount of time it took I was satisfied with the amount of time it took
to get the serviceto get the service
The five drivers account for almost 75% of the variance in satisfaction ratings
What “drives” citizen satisfaction with
public sector service delivery?
OutcomeOutcome In the end, I got what I neededIn the end, I got what I needed

19
Performance on the The Five DriversDetermines Satisfaction Levels (CF3)
87
7463
55
37
22
0
20
40
60
80
100
5 4 3 2 1 0
Overall
service
quality
rating
87
7463
55
37
22
0
20
40
60
80
100
5 4 3 2 1 0
Overall
service
quality
rating
Number of drivers scoring “Good”
(where “good” is 4 or 5 out of 5)
These clients rated service 4 or 5
out of 5 on all five drivers
Copyright ICCS-ISAC 2003

20
• Setting standards with respect to the CMT (e.g., core items)
• Overseeing further development of the CMT (for example, the development of alternative methodologies such as new applications for specific service channels)
• Conducting reviews of the CMT*
• Recommending revisions to the tool
• Approving consultants using the tool
• Advancing development of support materials for the CMT (e.g., training products)
• Supporting CMT marketing activities
The ICCS CMT Standards Board
The CMT Standards Board is responsible for:

21
www.iccs-isac.org
CMT Registrants 2003-2007
154
418
719
964
1185
0
200
400
600
800
1000
1200
1400
2003 2004 2005 2006 2007
Years
To
tal n
um
ber
of
reg
istr
ants
Registered Requests for the CMT

22
OAS/Canada Pension Plan Clients
Employment Insurance Clients
Royal Canadian Mounted Police
Service New Brunswick & Service BC
807060
Canada Business Service Centres
504030 9010 20
Departmental Service
Satisfaction Results (CMT)
Veterans Affairs Canada 2001 2003
100
2005

23
Citizen-centred Service Measurement- a Key Component of the Treasury
Board of Canada’s Management Accountability Framework (MAF)

24
Example: Using the Common Measurements
Tool in the Annual RCMP Citizen SurveysRegarding your contact(s) with the RCMP during 2004, please indicate whether you strongly disagree, disagree,
neither agree nor disagree, agree or strongly agree with each of the following statements about the RCMP’s
performance, starting with... (if a statement does not apply to a respondent, select "not applicable".)
RCMP personnel treated me fairly
RCMP personnel demonstrated professionalism
RCMP personnel were courteous and respectful
RCMP personnel were knowledgeable and competent
RCMP personnel delivered the service in a timely fashion
RCMP personnel went the "extra mile" to provide good service
RCMP personnel gave me all the information that I needed for the situation
(IF Q6 = Yes) It was easy to get in touch with the RCMP
How satisfied were you with the service you received during your contact(s) with the RCMP? Were you...
•Very satisfied
•Somewhat satisfied
Neither satisfied nor dissatisfied
Somewhat dissatisfied
Very dissatisfied
Don't know / no answer

25
0
25
50
75
100
Timely service Extra mile Outcome Satisfaction
2003 2004 2005 2006 2007
What Canadians, who have had contact
with the RCMP, are saying (CMT Survey)

26

27

28
The ICCS Common Measurements Tool
Benchmarking Service
• The Government of Canada (Treasury Board) and the Provincial governments have collaborated to develop a CMT data repository and benchmarking centre at the ICCS (www.iccs-isac.org); the benchmarking service is confidential and is managed by a Treasury Board office seconded to the ICCS (vicki,[email protected] );
• Over 1200 public managers have registered to use the CMT survey;
• Results from over 150 surveys are held in the data base;
• Confidential benchmarking reports, comparing a department’s results with similar public organizations are issued to organizations who submit their data to the ICCS data repository;
• The CMT has now been licensed to other counties (e.g. New Zealand; 2 Australian States; Bermuda, Qatar etc) offering the opportunity for international benchmarking of service satisfaction results around the world.
• OECD countries may wish to consider adopting the CMT for this purpose.

29
There is a central database for CMT data, which
allows organizations to anonymously compare
results against peers. The ICCS produces CMT
benchmarking reports – analysis includes:
Service Gaps: The difference between what
a client expects to get and how they perceive the
actual service experience.
Service Standards: Understanding what a client
believes to be an acceptable level of service.
Satisfaction/Importance Matrix: Assessing
satisfaction scores relative to importance scores.
Drivers of Satisfaction: What drives satisfaction in
specific service areas?
CMT Benchmarking Database

30
3. What the Citizen-centred
Research Tells Us

31
Citizens First Service ModelCitizen’s
Needs &
Expectations Finding/Accessing the
Service or Group of
Related Services
FINDING
THE
SERVICE
-e.g. knowing the
service location or
phone #
ACCESSING
THE
SERVICE
- e.g. parking, or
getting through on the
phone or Internet.
Service Delivery/
Quality
SERVICE DELIVERY
QUALITY:
One’s experience with
the service provider
- why clients are or are not
satisfied with the service
they receive.
Improving
Service
PRIORITIES
FOR
IMPOVEMENT
- using the survey
results to guide
improvements
Improving
Service
PRIORITIES
FOR
IMPOVEMENT
- using the survey
results to guide
improvements
The Citizens First Service Model
32
Citizens’Needs &
Expectations
Citizens’Needs &
Expectations
Finding/Accessing the Serviceor Group of Related Services
FINDING THE
SERVICEACCESSING
THE SERVICE
Service Delivery/Quality
SERVICE DELIVERY:Citizens’
experience with the service
provider.
Service Delivery/Quality
SERVICE DELIVERY:Citizens’
experience with the service
provider.
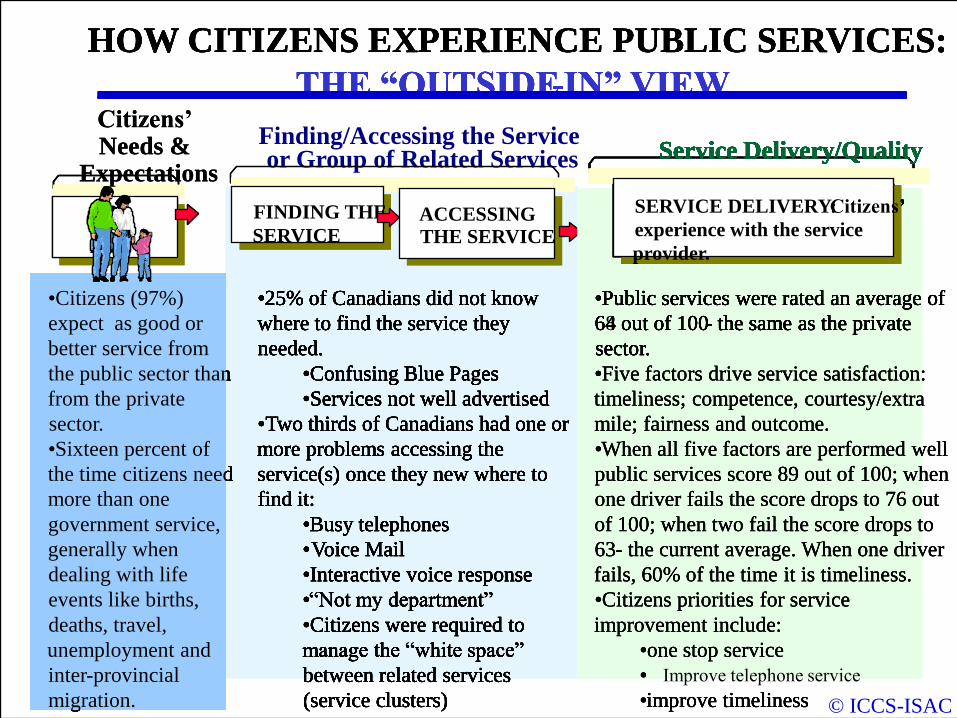
•Citizens (97%)
expect as good or
better service from
the public sector than
from the private
sector.
•Sixteen percent of
the time citizens need
more than one
government service,
generally when
dealing with life
events like births,
deaths, travel,
unemployment and
inter-provincial
migration.
•25% of Canadians did not know
where to find the service they
needed.
•Confusing Blue Pages
•Services not well advertised
•Two thirds of Canadians had one or
more problems accessing the
service(s) once they new where to
find it:
•Busy telephones
•Voice Mail
•Interactive voice response
•“Not my department”
•Citizens were required to
manage the “white space”
between related services
(service clusters)
•Public services were rated an average of
64 out of 100- the same as the private
sector.
•Five factors drive service satisfaction:
timeliness; competence, courtesy/extra
mile; fairness and outcome.
•When all five factors are performed well
public services score 89 out of 100; when
one driver fails the score drops to 76 out
of 100; when two fail the score drops to
63- the current average. When one driver
fails, 60% of the time it is timeliness.
•Citizens priorities for service
improvement include:
•one stop service
•
•improve timeliness
HOW CITIZENS EXPERIENCE PUBLIC SERVICES:
THE “OUTSIDE-IN” VIEW
Service Delivery/Quality
SERVICE DELIVERY:Citizens’
experience with the service
provider.
•Citizens (97%)
expect as good or
better service from
the public sector than
from the private
sector.
•Sixteen percent of
the time citizens need
more than one
government service,
generally when
dealing with life
events like births,
deaths, travel,
unemployment and
inter-provincial
migration.
•25% of Canadians did not know
where to find the service they
needed.
•Confusing Blue Pages
•Services not well advertised
•Two thirds of Canadians had one or
more problems accessing the
service(s) once they new where to
find it:
•Busy telephones
•Voice Mail
•Interactive voice response
•“Not my department”
•Citizens were required to
manage the “white space”
between related services
(service clusters)
•Public services were rated an average of
64 out of 100- the same as the private
sector.
•
Service Delivery/Quality
SERVICE DELIVERY:Citizens’
experience with the service
provider.
•Citizens (97%)
expect as good or
better service from
the public sector than
from the private
sector.
•Sixteen percent of
the time citizens need
more than one
government service,
generally when
dealing with life
events like births,
deaths, travel,
unemployment and
inter-provincial
migration.
•25% of Canadians did not know
where to find the service they
needed.
•Confusing Blue Pages
•Services not well advertised
•Two thirds of Canadians had one or
more problems accessing the
service(s) once they new where to
find it:
•Busy telephones
•Voice Mail
•Interactive voice response
•“Not my department”
•Citizens were required to
manage the “white space”
between related services
(service clusters)
•Public services were rated an average of
64 out of 100- the same as the private
sector.
•Five factors drive service satisfaction:
timeliness; competence, courtesy/extra
mile; fairness and outcome.
•When all five factors are performed well
public services score 89 out of 100; when
one driver fails the score drops to 76 out
of 100; when two fail the score drops to
63- the current average. When one driver
fails, 60% of the time it is timeliness.
•Citizens priorities for service
improvement include:
•one stop service
•
•improve timeliness
HOW CITIZENS EXPERIENCE PUBLIC SERVICES:
THE “OUTSIDE-IN” VIEW
Service Delivery/Quality
SERVICE DELIVERY:Citizens’
experience with the service
provider.
Service Delivery/Quality
SERVICE DELIVERY:Citizens’
experience with the service
provider.
•Citizens (97%)
expect as good or
better service from
the public sector than
from the private
sector.
•Sixteen percent of
the time citizens need
more than one
government service,
generally when
dealing with life
events like births,
deaths, travel,
unemployment and
inter-provincial
migration.
•25% of Canadians did not know
where to find the service they
needed.
•Confusing Blue Pages
•Services not well advertised
•Two thirds of Canadians had one or
more problems accessing the
service(s) once they new where to
find it:
•Busy telephones
•Voice Mail
•Interactive voice response
•“Not my department”
•Citizens were required to
manage the “white space”
between related services
(service clusters)
•Public services were rated an average of
64 out of 100- the same as the private
sector.
•
Service Delivery/Quality
SERVICE DELIVERY:Citizens’
experience with the service
provider.
•Citizens (97%)
expect as good or
better service from
the public sector than
from the private
sector.
•Sixteen percent of
the time citizens need
more than one
government service,
generally when
dealing with life
events like births,
deaths, travel,
unemployment and
inter-provincial
migration.
•25% of Canadians did not know
where to find the service they
needed.
•Confusing Blue Pages
•Services not well advertised
•Two thirds of Canadians had one or
more problems accessing the
service(s) once they new where to
find it:
•Busy telephones
•Voice Mail
•Interactive voice response
•“Not my department”
•Citizens were required to
manage the “white space”
between related services
(service clusters)
•Public services were rated an average of
68 out of 100- the same as the private
sector.
•Five factors drive service satisfaction:
timeliness; competence, courtesy/extra
mile; fairness and outcome.
•When all five factors are performed well
public services score 89 out of 100; when
one driver fails the score drops to 76 out
of 100; when two fail the score drops to
63- the current average. When one driver
fails, 60% of the time it is timeliness.
•Citizens priorities for service
improvement include:
•one stop service
• Improve telephone service
•improve timeliness
HOW CITIZENS EXPERIENCE PUBLIC SERVICES:
THE “OUTSIDE-IN” VIEW
Service Delivery/Quality
SERVICE DELIVERY:Citizens’
experience with the service
provider.
•Citizens (97%)
expect as good or
better service from
the public sector than
from the private
sector.
•Sixteen percent of
the time citizens need
more than one
government service,
generally when
dealing with life
events like births,
deaths, travel,
unemployment and
inter-provincial
migration.
•25% of Canadians did not know
where to find the service they
needed.
•Confusing Blue Pages
•Services not well advertised
•Two thirds of Canadians had one or
more problems accessing the
service(s) once they new where to
find it:
•Busy telephones
•Voice Mail
•Interactive voice response
•“Not my department”
•Citizens were required to
manage the “white space”
between related services
(service clusters)
•Public services were rated an average of
- the same as the private
sector.
•
Service Delivery/Quality
SERVICE DELIVERY:Citizens’
experience with the service
provider.
•Citizens (97%)
expect as good or
better service from
the public sector than
from the private
sector.
•Sixteen percent of
the time citizens need
more than one
government service,
generally when
dealing with life
events like births,
deaths, travel,
unemployment and
inter-provincial
migration.
•25% of Canadians did not know
where to find the service they
improve timeliness
HOW CITIZENS EXPERIENCE PUBLIC SERVICES:
THE “OUTSIDE-IN” VIEW
© ICCS-ISAC

33
What Drives Citizen Satisfaction
with Access?

34
1. Outcome
2. Reaching a live person
3. Accurate numbers
4. Not being bounced
around
5. Timeliness
1. Timeliness
2. Courtesy
3. Knowledge, competence
4. Outcome
1. Outcome: I got what
wanted
2. Easy to find what I'm
looking for
3. Sufficient information
4. Ease of site navigation
TELEPHONETELEPHONE IN-PERSONIN-PERSON INTERNETINTERNET
Source: Citizens First 4, 2005
What “drives” satisfaction for each channel?
INTERNETINTERNET
Source: Citizens First 4, 2005
What “drives” satisfaction for each channel?

35
72 6964
5551
0
20
40
60
80
100
1 2 3 4 5
How are we doing on the “drivers”?
Outcome Fairness Knowledge/
competence
Courtesy/
extra mile
TimelinessSource: Citizens First 3, 2003
72 6964
5551
0
20
40
60
80
100
1 2 3 4 5
72 6964
5551
0
20
40
60
80
100
1 2 3 4 5
How are we doing on the “drivers”?
Outcome Fairness Knowledge/
competence
Courtesy/
extra mile
TimelinessSource: Citizens First 3, 2003

36
68
62
62
56
55
54
0 25 50 75 100
Internet/email
Office visit
Kiosk
Phone
Other
SERVICE QUALITYVery poor Very good
Despite being the most popular channel, the telephone consistently
delivers some of the lowest
satisfaction scores
Citizen Satisfaction
by Service Channel
© Institute for Citizen - Centred Service

37
Service Standards: Citizens’ Expectations
Telephone
In-Person Email
21
30
14
4239
20
35
510
1 10
25
50
75
1 2-4 5-9 10-14 15-29 30-60 >60
Percent of respondents
19982002
Number of minutes
30
10
5
4440
2924
43
52
26
12
1 2
0
25
50
75
4 hr Same day Next
business day
2 days 3 days +
Percent of respondents
199820002002
6
10
20
32
17
73 5
0
10
20
30
40
50
10 sec 20 sec 30 sec 1 min 2 min 3 min 4 min 5 min
Percent of respondents

38
Service Standards: Two Models
1. The Ontario Government Model
– Standards are built around Citizens First findings of Canadians’ specific expectations (e.g. 10 minute waiting time in line);
– Government wide standards are set and monitored for waiting times, interactive voice response systems, responding to mail etc.
2. The Alberta Government Model
– Standards are set as a percentage satisfaction with waiting times, courtesy, competence, fairness etc. (e.g. 80% satisfaction with timeliness)

39
4. Using the Research to Develop
Public Sector Service Strategies,
and to Improve and Benchmark
Client Satisfaction Results
40
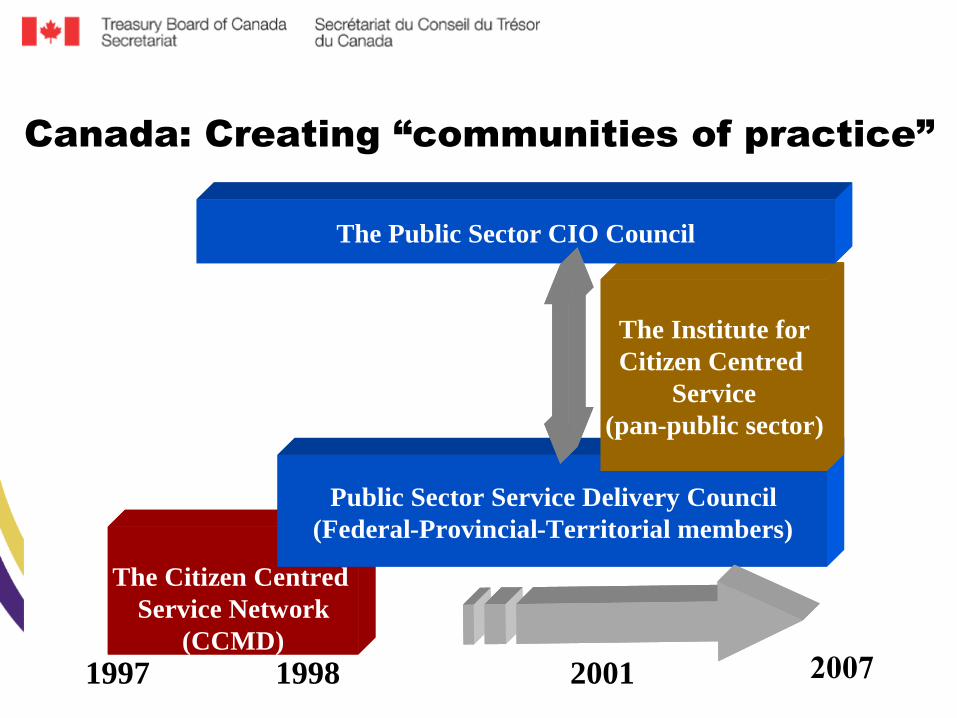
Canada: Creating “communities of practice”
The Citizen Centred
Service Network
(CCMD)
Public Sector Service Delivery Council
(Federal-Provincial-Territorial members)
The Institute for
Citizen Centred
Service
(pan-public sector)
2001 2006
The Public Sector CIO Council
19981997 2007

41
Government of Canada Service Strategies
• 1. Improving Access and Single-window Service(Service Canada; 1-800 OCANADA; Canada-Ontario-Ottawa Common Service Counter)
• 2. Improving Departmental Service (The Service Improvement Initiative)
• 3. Expanding E-Service (Government OnLine)
• 4. Emerging Strategy: Service Transformation– Internal Services transformation (whole of government)
– Departmental services transformation (e.g. Integrated customer contact centres; process re-engineering)
– Inter-governmental: common research, common tools (BizPal; BTEP; CMT), common standards, common systems, integrated service delivery (e.g. Canada-Ottawa-Ontario ISD).
– The Service Value Chain

42
Citizens’ Service Needs and Expectations
Citizen-Centred Service Delivery
Improved Service Quality
Government
On-Line
ImprovedAccess
ServiceCanada &Gateways
ServiceImprovement
Initiative
The Government of Canada’s
Citizen-Centred Service Strategy
10% Client
Satisfaction
Improvement
Target
Main
Services
On-line
Citizen
Surveys
Every Two
Years
Annual CMT
Client Surveys
& Service Transformation

43
Applying the Research and
Measurement Insights to Improve
Client Satisfaction

44
The Service Improvement Initiative: Improving citizen
satisfaction through a focus on measurable results
All departments and agencies directly serving
citizens adopt a systematic approach to service
improvement planning integrated with their annual business planning process
Service satisfaction measured at least annually using the Common Measurements Tool metrics
Treasury Board set a minimum 10% service satisfaction improvement target, for 2000-2005
Targets and performance against targets measured and reported annually
Accountability for results
http://www.tbs-sct.gc.ca/si-
as/index_e.asp
Free: Obtain the How-to Guide: www.iccs-isac.org

45
Set Targets & Develop Service
Improvement Plan
Priorities
Implement, Monitor, Measure & Ensure
Where Are We Now?
Where Do Our
Clients Want Us To Be?
How Will We
Get There?
How Do We Make
It Happen?
Measure Clients’
Stisfaction
Staff
Involvement
Canada’s Results-based
Service Improvement Model
Set Targets &
Develop Service Improvement Plan
Measure Clients’ Expectations &
Priorities
Implement, Monitor, Measure & Ensure
Accountability
Measure Clients’
Satisfaction

46
5. The Public Sector Service Value Chain*:the Relationship Between Employee Engagement, Service
Delivery, and Trust and Confidence in Public Institutions
Employee
Engagement
(Satisfaction &
Commitment)
Client
Satisfaction
Citizen trust
& confidence
in public
institutions
People Service Trust
©Heintzman and Marson 2003

47

48
3. Researching the Service Value Chain:
Exploring The Links in the Chain
The Public Sector
Service Value Chain
Citizen Trust &
Confidence In
Public Institutions
Citizen/Client
Service
Satisfaction
Employee
Engagement
DRIVERS OF
PERFORMANCE
DRIVERS OF
PERFORMANCE
DRIVERS OF
PERFORMANCE
©Heintzman and Marson 2006
Researching the Drivers and the Links in the Chain

49

50
Service Delivery and Democratic Citizenship
Each service experience is
a moment of truth
Strengthens or weakens
confidence in public
institutions and democratic
citizenship
Both the challenge and the
glory of service delivery in
the public sector