Embed Size (px)
Citation preview

Cisco Unified Real-Time Monitoring Tool Administration Guide,Release 11.0(1)First Published: June 08, 2015
Americas HeadquartersCisco Systems, Inc.170 West Tasman DriveSan Jose, CA 95134-1706USAhttp://www.cisco.comTel: 408 526-4000 800 553-NETS (6387)Fax: 408 527-0883

THE SPECIFICATIONS AND INFORMATION REGARDING THE PRODUCTS IN THIS MANUAL ARE SUBJECT TO CHANGE WITHOUT NOTICE. ALL STATEMENTS,INFORMATION, AND RECOMMENDATIONS IN THIS MANUAL ARE BELIEVED TO BE ACCURATE BUT ARE PRESENTED WITHOUT WARRANTY OF ANY KIND,EXPRESS OR IMPLIED. USERS MUST TAKE FULL RESPONSIBILITY FOR THEIR APPLICATION OF ANY PRODUCTS.
THE SOFTWARE LICENSE AND LIMITEDWARRANTY FOR THE ACCOMPANYING PRODUCT ARE SET FORTH IN THE INFORMATION PACKET THAT SHIPPED WITHTHE PRODUCT AND ARE INCORPORATED HEREIN BY THIS REFERENCE. IF YOU ARE UNABLE TO LOCATE THE SOFTWARE LICENSE OR LIMITED WARRANTY,CONTACT YOUR CISCO REPRESENTATIVE FOR A COPY.
The Cisco implementation of TCP header compression is an adaptation of a program developed by the University of California, Berkeley (UCB) as part of UCB's public domain versionof the UNIX operating system. All rights reserved. Copyright © 1981, Regents of the University of California.
NOTWITHSTANDINGANYOTHERWARRANTYHEREIN, ALL DOCUMENT FILES AND SOFTWARE OF THESE SUPPLIERS ARE PROVIDED “AS IS"WITH ALL FAULTS.CISCO AND THE ABOVE-NAMED SUPPLIERS DISCLAIM ALL WARRANTIES, EXPRESSED OR IMPLIED, INCLUDING, WITHOUT LIMITATION, THOSE OFMERCHANTABILITY, FITNESS FORA PARTICULAR PURPOSEANDNONINFRINGEMENTORARISING FROMACOURSEOFDEALING, USAGE, OR TRADE PRACTICE.
IN NO EVENT SHALL CISCO OR ITS SUPPLIERS BE LIABLE FOR ANY INDIRECT, SPECIAL, CONSEQUENTIAL, OR INCIDENTAL DAMAGES, INCLUDING, WITHOUTLIMITATION, LOST PROFITS OR LOSS OR DAMAGE TO DATA ARISING OUT OF THE USE OR INABILITY TO USE THIS MANUAL, EVEN IF CISCO OR ITS SUPPLIERSHAVE BEEN ADVISED OF THE POSSIBILITY OF SUCH DAMAGES.
Any Internet Protocol (IP) addresses and phone numbers used in this document are not intended to be actual addresses and phone numbers. Any examples, command display output, networktopology diagrams, and other figures included in the document are shown for illustrative purposes only. Any use of actual IP addresses or phone numbers in illustrative content is unintentionaland coincidental.
Cisco and the Cisco logo are trademarks or registered trademarks of Cisco and/or its affiliates in the U.S. and other countries. To view a list of Cisco trademarks, go to this URL: http://www.cisco.com/go/trademarks. Third-party trademarks mentioned are the property of their respective owners. The use of the word partner does not imply a partnershiprelationship between Cisco and any other company. (1110R)
© 2016 Cisco Systems, Inc. All rights reserved.

C O N T E N T S
P r e f a c e Preface xix
About This Guide xix
Audience xx
Related Documentation xx
Conventions xx
Obtaining Documentation and Submitting a Service Request xxi
Cisco Product Security xxii
Organization xxii
C H A P T E R 1 Administration Overview 1
Cisco Unified Real-Time Monitoring Tool 1
Operating System Support 2
C H A P T E R 2 Getting Started 3
Install and Configure Unified RTMT 3
Install Unified RTMT 3
Upgrade RTMT 5
Launch Unified RTMT 5
Run as Administrator 7
Multiple installations of Unified RTMT 8
Administration Tools 8
System Interface 8
Performance Monitoring 10
System summary status 10
Server Status Monitoring 11
Performance Counter Interface 12
Category Tabs 12
Cisco Unified Real-Time Monitoring Tool Administration Guide, Release 11.0(1) iii

Sample Rate 13
Zoom In on Perfmon Counter 13
Highlight Charts and Graphs 14
Counter Properties 14
Alert Notification for Counters 14
Trace and Log Central 15
Trace Files Collection, Throttling, and Compression 15
Configuration Profiles 16
Categories 17
Alerts 17
Alert options 17
Alert Fields 18
Alert Logs 21
Log Partition Monitoring Tool 22
Cisco Unified Analysis Manager 23
Services, Servlets, and Service Parameters 24
Nonconfigurable Components 25
Uninstall Unified RTMT 27
C H A P T E R 3 System Performance Monitoring 29
Predefined System Objects 29
Voice and Video Monitoring 32
Predefined Cisco Unified Communications Manager Objects 32
Cisco Unified Communications Manager Summary View 35
Call-Processing Activity Monitoring 35
Call-Processing Logs 36
Perform Session Trace 38
Monitor Real-Time Data 38
Monitor Session Trace Data From Local Disk 39
Trace Calls 40
Services Monitoring 43
Service Logs 44
Device Logs 45
Device Monitoring 45
Device Monitoring 45
Cisco Unified Real-Time Monitoring Tool Administration Guide, Release 11.0(1)iv
Contents

Find Specific Devices to Monitor 47
View Phone Information 48
View Device Properties 49
Set Up Polling Rate for Devices and Perfmon Counters 49
CTI Application, Device, and Line Monitoring 50
View CTI Manager Information 50
Find CTI Applications to Monitor 50
Find CTI Devices To Monitor 51
Find CTI Lines To Monitor 52
View Application Information 53
Access Learned Pattern and SAF Forwarder Reports for Call Control Discovery 53
Access Called Party Trace Report 56
Intercompany Media Services 57
IME Service Monitoring 57
IME System Performance Monitoring 58
Monitor Intercompany Media Services 58
IM and Presence Monitoring 59
IM and Presence and Cisco Jabber summary monitoring 59
Cisco XCP counters 60
Number of connected XMPP clients 60
Number of connected CAXL clients 60
Number of active outbound SIP subscriptions 60
Number of active inbound SIP subscriptions 61
Number of IM sessions 61
Total IM Packets 62
IMs in last 60 seconds 62
Per user and per session counters 62
IM packets sent per session 63
IM packets received per session 63
Total text conferencing rooms 63
Total adhoc group chat rooms 63
Total persistant chat rooms 63
Per-chat room counters 64
IM packets received per room 64
Number of occupants per room 64
Cisco Unified Real-Time Monitoring Tool Administration Guide, Release 11.0(1) v
Contents

SIP proxy counters 64
Number of idle SIP proxy worker processes 64
Cisco Unity Connection Monitoring 65
Port Monitor 65
Start Cisco Unity Connection Port Monitor Polling 66
C H A P T E R 4 Cisco Unified Analysis Manager 67
Cisco Unified Analysis Manager Preferences 67
FTP Server Setup 67
Access FTP Server Options 68
Add or Edit FTP Server 68
Set Up Mail Server 69
Add or Edit Mail Server 69
Set Trace Collection Directory 69
Cisco Unified Analysis Manager Limitations 70
Cisco Unified Analysis Manager Setup 71
Import Device and Group Settings 71
Scheduled Trace and Log Collection Job Status Display 71
Upload and Transfer Files to FTP Server 72
Cisco Unified Analysis Manager Tools 72
Analyze Call Path Tool 72
Analyze Call Path Setup Considerations 73
Cisco Unified Communications Manager 74
Cisco Unified Contact Center Express 75
Cisco Unified Intelligent Contact Management Enterprise/Cisco Unified Contact
Center Enterprise 75
Cisco Unified Customer Voice Portal 76
Cisco Access Control Server and Cisco IOS Gateway 77
Nodes 78
Node Management 78
Display Node Summary 79
Add or Edit a Node 79
Group Management 80
Add or Edit Group 81
Trace File Repository Management 81
Cisco Unified Real-Time Monitoring Tool Administration Guide, Release 11.0(1)vi
Contents

Add or Edit Trace File Repository 81
Call Record Repository Management 82
Add or Edit Call Record Repository 82
Define Trace Templates 83
Add or Edit Template 83
Call Definitions 84
Trace Collection 85
Collect Traces Now 85
Schedule Trace Collection 86
Schedule Trace Settings and Collection 87
Set Trace Levels 87
View Configuration 88
Cisco Unified Analysis Manager Troubleshooting 89
C H A P T E R 5 Profiles and Categories 91
Profiles 91
Add Configuration Profile 91
Restore Configuration Profile 92
Delete Configuration Profile 92
Categories 92
Add Category 92
Rename Category 93
Delete Category 93
C H A P T E R 6 Performance Counters 95
Counters 95
Add Counter Using Performance Queries 95
Remove Counter From Performance Monitoring Pane 96
Add Counter Instance 96
Set Up Counter Alert Notification 97
Display Counter Description 98
Local Perfmon Counter Data Logging 98
Start Perfmon Counter Logging 98
Stop Perfmon Counter Logging 99
Configure Data Sample 99
Cisco Unified Real-Time Monitoring Tool Administration Guide, Release 11.0(1) vii
Contents

View Counter Data 100
Log files on Perfmon Log Viewer and Microsoft Performance Tool 101
View Log Files on Perfmon Log Viewer 101
Zoom In and Out in Performance Log Viewer 102
View Perfmon Log Files with Microsoft Performance Tool 103
Troubleshooting 104
Perfmon Data Log Troubleshooting 104
Troubleshoot Perfmon Data Logging 111
C H A P T E R 7 Alerts 113
Alert Central Displays 113
System Alerts 113
Automatic Trace Download Activation 114
Voice and Video Alerts 115
IM and Presence Service Alerts 116
Cisco Unity Connection Alerts 119
Alert Action Setup 120
Access Alert Central and Set Up Alerts 120
Set Alert Properties 122
Suspend Alerts 124
Set up alerts for core dump and collect relevant logs 125
Enable email alert 125
Collect logs 125
C H A P T E R 8 Traces and Logs 127
Trace and Log Central 127
Preparation 127
Import Certificates 127
Types of trace support 128
Trace and Log Central disk IO and CPU throttling 128
Trace Compression support 128
View Trace and Log Central Options 128
Collect files 129
Collect Trace Files 129
Query Wizard 132
Cisco Unified Real-Time Monitoring Tool Administration Guide, Release 11.0(1)viii
Contents

Start a Query 132
Execute a Query 135
Schedule Trace Collection in Cisco Unified Communications Manager 137
Schedule Trace Collection in Cisco Unity Connection 139
Start a schedule 142
Execute a schedule 144
View Trace Collection Status 145
Real-Time Trace 145
View Real-Time Data 146
Monitor User Event 147
Collect Crash Dump in Cisco Unified Communications Manager 149
Collect Crash Dump in Cisco Unity Connection 151
Collect Installation Logs 152
Collect audit logs 153
Browse Audit Logs 153
Download Audit Logs 154
Schedule Audit Log Download 156
Display Downloaded Trace Files Using Local Browse 157
Display and Download Trace Files in Cisco Unified Communications Manager 158
Display And Download Trace Files in Cisco Unity Connection 160
Set Trace Collection Attributes 162
View Trace Results 165
Display Report Information 166
Log Compression 167
Edit Trace Settings 168
Log Viewers 168
Messages in AuditLog Viewer 168
Display AuditApp Logs 169
Display Cisco Unified OS Logs 170
Display Messages in SysLog Viewer 170
Plugins 171
Download and Install Application Plug-Ins 171
Launch Application Plug-Ins 172
A P P E N D I X A Performance Counters and Alerts 173
Cisco Unified Real-Time Monitoring Tool Administration Guide, Release 11.0(1) ix
Contents

System Counters 173
Cisco Tomcat Connector 173
Cisco Tomcat JVM 174
Cisco Tomcat Web Application 175
Database Change Notification Client 176
Database Change Notification Server 176
Database Change Notification Subscription 177
Database Local DSN 177
DB User Host Information Counters 178
Enterprise Replication DBSpace Monitors 178
Enterprise Replication Perfmon Counters 178
IP 179
Memory 180
Network Interface 182
Number of Replicates Created and State of Replication 184
Partition 184
Process 185
Processor 187
System 188
TCP 190
Thread 191
AXL Web Service 191
Ramfs 191
Voice and Video Counters 192
Cisco Analog Access 192
Cisco Annunciator Device 192
Cisco Call Restriction 193
Cisco CallManager 194
Cisco CallManager System Performance 205
Cisco CTIManager 208
Cisco Dual-Mode Mobility 209
Cisco Extension Mobility 210
Cisco Gatekeeper 211
Cisco H.323 212
Cisco Hunt Lists 212
Cisco Unified Real-Time Monitoring Tool Administration Guide, Release 11.0(1)x
Contents

Cisco HW Conference Bridge Device 213
Cisco IP Manager Assistant 214
Cisco LBM service 215
Cisco Lines 215
Cisco Locations LBM 216
Cisco Locations RSVP 217
Cisco Media Streaming Application 218
Cisco Messaging Interface 222
Cisco MGCP BRI Device 223
Cisco MGCP FXO Device 224
Cisco MGCP FXS Device 224
Cisco MGCP Gateways 225
Cisco MGCP PRI Device 226
Cisco MGCP T1 CAS Device 226
Cisco Mobility Manager 227
Cisco Music On Hold (MOH) Device 229
Cisco MTP Device 230
Cisco Phones 231
Cisco Presence Feature 231
Cisco QSIG Feature 231
Cisco Signaling Performance 232
Cisco SIP 232
Cisco SIP Line Normalization 233
Cisco SIP Normalization 241
Cisco SIP Stack 249
Cisco SIP Station 260
Cisco SW Conf Bridge Device 261
Cisco Telepresence MCU Conference Bridge Device 262
Cisco TFTP Server 263
Cisco Transcode Device 267
Cisco Video Conference Bridge 268
Cisco Web Dialer 269
Cisco WSM Connector 269
IME Client 270
IME Client Instance 271
Cisco Unified Real-Time Monitoring Tool Administration Guide, Release 11.0(1) xi
Contents

SAML Single Sign-On 272
Cisco IVR Device 273
IM and Presence Service Counters 273
Cisco Client Profile Agent 273
Cisco Presence Engine 274
Cisco Server Recovery Manager 279
Cisco SIP Proxy 280
Cisco Sync Agent 284
Cisco XCP Auth Component 285
Cisco XCP CM 285
Cisco XCP Component Stanza Traffic 286
Cisco XCP JDS 287
Cisco XCP JSM 287
Cisco XCP JSM IQ Namespaces 288
Cisco XCP JSM Session 289
Cisco XCP MA Basic 289
Cisco XCP Managed File Transfer 290
Cisco XCP Router 291
Cisco XCP SIP S2S 291
Cisco XCP S2S 292
Cisco XCP TC 293
Cisco XCP TC Room 293
Cisco XCP WebCM 294
Cisco Unity Connection Counters 295
CUC Data Store 295
CUC Data Store: Databases 295
CUC Digital Notifications 296
CUC Directory Services 297
CUC Feeder 297
CUC Mailbox Sync 297
CUC Message Store 299
CUC Message Store: Databases 301
CUC Personal Call Transfer Rules 301
CUC Phone System 302
CUC Phone System: Ports 305
Cisco Unified Real-Time Monitoring Tool Administration Guide, Release 11.0(1)xii
Contents
CUC Replication 305
CUC Replicator: Remote Connection Locations 306
CUC Sessions: Calendar Access 307
CUC Sessions: E-Mail Access 307
CUC Sessions: IMAP Server 308
CUC Sessions: RSS 309
CUC Sessions: SMTP Server 310
CUC Sessions: SpeechView Processor 310
CUC Sessions: TRaP 310
CUC Sessions: TTS 311
CUC Sessions: Unified Client 311
CUC Sessions: Video 312
CUC Sessions: Voice 314
CUC Sessions: VUI 316
CUC Sessions: Web 317
CUC Sessions: Web E-Mail Access 318
CUC System Agent 318
System Alerts 319
AuthenticationFailed 319
CiscoDRFFailure 320
CoreDumpFileFound 320
CpuPegging 321
CriticalServiceDown 322
DBChangeNotifyFailure 323
DBReplicationFailure 323
DBReplicationTableOutOfSync 324
HardwareFailure 325
LogFileSearchStringFound 326
LogPartitionHighWaterMarkExceeded 326
LogPartitionLowWaterMarkExceeded 327
LowActivePartitionAvailableDiskSpace 328
LowAvailableVirtualMemory 329
LowInactivePartitionAvailableDiskSpace 330
LowSwapPartitionAvailableDiskSpace 330
ServerDown 331
Cisco Unified Real-Time Monitoring Tool Administration Guide, Release 11.0(1) xiii
Contents

SparePartitionHighWaterMarkExceeded 332
SparePartitionLowWaterMarkExceeded 333
SyslogSeverityMatchFound 333
SyslogStringMatchFound 334
SystemVersionMismatched 335
TotalProcessesAndThreadsExceededThreshold 336
Voice and Video Alerts 337
BeginThrottlingCallListBLFSubscriptions 337
CallAttemptBlockedByPolicy 337
CallProcessingNodeCpuPegging 338
CARSchedulerJobFailed 339
CARIDSEngineCritical 340
CARIDSEngineFailure 341
CDRAgentSendFileFailed 341
CDRFileDeliveryFailed 342
CDRHighWaterMarkExceeded 343
CDRMaximumDiskSpaceExceeded 343
CiscoElmNotConnected 344
CiscoGraceTimeLeft 345
CiscoNoProvisionTimeout 346
CiscoSystemInDemo 346
CiscoSystemInOverage 347
CiscoSystemSecurityMismatch 348
CodeYellow 348
DDRBlockPrevention 349
DDRDown 350
EMCCFailedInLocalCluster 351
EMCCFailedInRemoteCluster 351
ExcessiveVoiceQualityReports 352
ILSHubClusterUnreachable 353
ILSPwdAuthenticationFailed 353
ILSTLSAuthenticationFailed 354
IMEDistributedCacheInactive 355
IMEOverQuota 355
IMEQualityAlert 356
Cisco Unified Real-Time Monitoring Tool Administration Guide, Release 11.0(1)xiv
Contents

InsufficientFallbackIdentifiers 357
IMEServiceStatus 358
InvalidCredentials 359
LocationOutOfResource 360
MaliciousCallTrace 361
MediaListExhausted 361
MgcpDChannelOutOfService 362
NumberOfRegisteredDevicesExceeded 363
NumberOfRegisteredGatewaysDecreased 363
NumberOfRegisteredGatewaysIncreased 364
NumberOfRegisteredMediaDevicesDecreased 365
NumberOfRegisteredMediaDevicesIncreased 365
NumberOfRegisteredPhonesDropped 366
RecordingCallSetupFail 367
RecordingGatewayRegistrationRejected 367
RecordingGatewayRegistrationTimeout 368
RecordingGatewaySessionFailed 369
RecordingResourcesNotAvailable 369
RecordingSessionTerminatedUnexpectedly 370
RTMTSessionsExceedsThreshold 371
RouteListExhausted 371
SDLLinkOutOfService 372
TCPSetupToIMEFailed 373
TLSConnectionToIMEFailed 374
UserInputFailure 374
IM and Presence Service Alerts 375
CTIGWUserNotLicenced 375
CTIGWQBEFailedRequest 375
CTIGWModuleNotEnabled 376
CTIGWSystemError 376
CTIGWUserNotAuthorized 376
CTIGWProviderFailedtoOpen 376
DuplicateDirectoryURI 377
DuplicateUserid 377
ESPSocketError 377
Cisco Unified Real-Time Monitoring Tool Administration Guide, Release 11.0(1) xv
Contents

ESPCreateLockFailed 378
ESPConfigError 378
ESPSharedMemAllocFailed 378
ESPSharedMemSetPermFailed 379
EspConfigAgentHighCPUUtilization 379
ESPMallocFailure 379
ESPRegistryError 379
EspConfigAgentSharedMemoryStaticRouteError 380
ESPStatsLogFileOpenFailed 380
ESPLoginError 380
EspConfigAgentProxyDomainNotConfigured 381
EspConfigAgentNetworkRestored 381
EspConfigAgentLocalDBAccessError 381
ESPConfigNotFound 381
EspConfigAgentRemoteDBAccessError 382
ESPPassedParamInvalid 382
ESPSharedMemCreateFailed 382
EspConfigAgentHighMemoryUtilization 383
ESPNAPTRInvalidRecord 383
ESPWrongIPAddress 383
EspConfigAgentNetworkOutage 383
EspConfigAgentMemAllocError 384
EspConfigAgentFileWriteError 384
ESPVirtualProxyError 384
ESPStopped 385
ESPWrongHostName 385
ESPRoutingError 385
InterclusterSyncAgentAXLConnectionFailed 385
InterclusterSyncAgentPeerDuplicate 386
ICSACertificateFingerPrintMisMatch 386
ICSACertificateCASignedTrustCertFound 386
ICSACertificateValidationFailure 387
InvalidDirectoryURI 387
LegacyCUPCLogin 387
NotInCucmServerListError 388
Cisco Unified Real-Time Monitoring Tool Administration Guide, Release 11.0(1)xvi
Contents

PEStateLocked 388
PWSAboveCPULimit 388
PWSRequestLimitReached 388
PEIDSQueryError 389
PEStateDisabled 389
PELoadHighWaterMark 389
PWSAboveSipSubscriptionLimit 390
PEMemoryHighCondition 390
PESipSocketBindFailure 390
PEIDStoIMDBDatabaseSyncError 391
PEIDSSubscribeError 391
PWSSCBFindFailed 391
PEDatabaseError 392
PWSSCBInitFailed 392
PEWebDAVInitializationFailure 392
PEPeerNodeFailure 392
PEAutoRecoveryFailed 393
SRMFailover 393
SRMFailed 393
UASCBFindFailed 394
UASCBGetFailed 394
XcpMFTDBConnectError 394
XcpMFTExtFsMountError 394
XcpMFTExtFsFreeSpaceWarn 395
XcpDBConnectError 395
XcpCmStartupError 395
XcpSIPFedCmComponentConnectError 396
XcpTxtConfGearError 396
XCPConfigMgrConfigurationFailure 396
XcpWebCmComponentConnectError 397
XcpXMPPFedCmStartupError 397
XcpXMPPFedCmComponentConnectError 397
XcpSIPFedCmStartupError 397
XcpCmXmppdError 397
XcpCmPauseSockets 398
Cisco Unified Real-Time Monitoring Tool Administration Guide, Release 11.0(1) xvii
Contents

XcpThirdPartyComplianceConnectError 398
XCPConfigMgrJabberRestartRequired 398
XcpTxtConfDBConnectError 399
XcpMdnsStartError 399
XCPConfigMgrR2RPasswordEncryptionFailed 399
XcpCmComponentConnectError 400
XcpWebCmStartupError 400
XCPConfigMgrR2RRequestTimedOut 400
XcpWebCmHttpdError 400
XCPConfigMgrHostNameResolutionFailed 401
XcpSIPGWStackResourceError 401
Intercompany Media Engine Alerts 401
BannedFromNetwork 401
IMEDistributedCacheCertificateExpiring 402
IMEDistributedCacheFailure 403
IMESdlLinkOutOfService 404
InvalidCertificate 405
InvalidCredentials 405
MessageOfTheDay 406
SWUpdateRequired 407
TicketPasswordChanged 408
ValidationsPendingExceeded 408
Cisco Unity Connection Alerts 409
NoConnectionToPeer 409
AutoFailoverSucceeded 410
AutoFailoverFailed 411
AutoFailbackSucceeded 412
AutoFailbackFailed 413
SbrFailed (Split Brain Resolution Failed) 413
DiskConsumptionCloseToCapacityThreshold 414
DiskConsumptionExceedsCapacityThreshold 415
LicenseExpirationWarning 416
LicenseExpired 416
Cisco Unified Real-Time Monitoring Tool Administration Guide, Release 11.0(1)xviii
Contents

Preface
This document may not represent the latest Cisco product information available. You can obtain the mostcurrent documentation by accessing the Cisco product documentation page at:
http://www.cisco.com/en/US/products/sw/voicesw/ps556/tsd_products_support_series_home.html
Note
• About This Guide, page xix
• Audience, page xx
• Related Documentation, page xx
• Conventions, page xx
• Obtaining Documentation and Submitting a Service Request, page xxi
• Organization, page xxii
About This GuideThe Cisco Unified Real-Time Monitoring Tool Administration Guide provides information about the CiscoUnified Real-Time Monitoring Tool.
Use this guide with the following documentation for your configuration:
SystemConfigurationGuide for CiscoUnified CommunicationsManager,Administration Guide for Cisco Unified CommunicationsManager,Cisco
Cisco Unified CommunicationsManager
Unified Serviceability AdministrationGuide,CDRAnalysis and ReportingAdministration Guide, andCisco Unified CommunicationsManager CallDetail Records Administration Guide
Deployment Guide for IM and Presence Service on Cisco UnifiedCommunicationsManager andCiscoUnified Serviceability AdministrationGuide
Cisco Unified CommunicationsManager IM and Presence Service
Cisco Unity Connection System Administration Guide and Cisco UnityConnection Serviceability Administration Guide
Cisco Unity Connection
Cisco Unified Real-Time Monitoring Tool Administration Guide, Release 11.0(1) xix

These documents provide the following information:
• Instructions for administering Cisco Unified CommunicationsManager, Cisco Unified CommunicationsManager IM and Presence Service, and Cisco Unity Connection.
• Descriptions of procedural tasks that you can perform by using the administration interface.
AudienceThe Cisco Unified Real-Time Monitoring Tool Administration Guide provides information for networkadministrators who are responsible for managing and supporting Cisco Unified Communications Manager,Cisco Unified Communications Manager IM and Presence Service, and Cisco Unity Connection. Networkengineers, system administrators, or telecom engineers can use this guide to learn about, and administer,remote serviceability features. This guide requires knowledge of telephony and IP networking technology.
Related DocumentationFor additional documentation about Cisco Unified Communications Manager and Cisco UnifiedCommunications Manager IM and Presence Service, see the Cisco Unified Communications ManagerDocumentation Guide.
For additional documentation about Cisco Unity Connection, see the Cisco Unity Connection DocumentationGuide.
ConventionsThis document uses the following conventions:
DescriptionConvention
Commands and keywords are in boldface.boldface font
Arguments for which you supply values are in italics.italic font
Elements in square brackets are optional.[ ]
Alternative keywords are grouped in braces and separated by vertical bars.{ x | y | z }
Optional alternative keywords are grouped in brackets and separated by verticalbars.
[ x | y | z ]
A nonquoted set of characters. Do not use quotation marks around the stringor the string will include the quotation marks.
string
Terminal sessions and information the system displays are in screen font.screen font
Information you must enter is in boldface screen font.boldface screen font
Cisco Unified Real-Time Monitoring Tool Administration Guide, Release 11.0(1)xx
PrefaceAudience

DescriptionConvention
Arguments for which you supply values are in italic screen font.italic screen font
The symbol ^ represents the key labeled Control—for example, the keycombination ^D in a screen display means hold down the Control key whileyou press the D key.
^
Nonprinting characters, such as passwords, are in angle brackets.< >
Notes use the following conventions:
Means reader take note. Notes contain helpful suggestions or references to material not covered in thepublication.
Note
Timesavers use the following conventions:
Means the described action saves time. You can save time by performing the action described in theparagraph.
Timesaver
Tips use the following conventions:
Means the information contains useful tips.Tip
Cautions use the following conventions:
Means reader be careful. In this situation, you might do something that could result in equipment damageor loss of data.
Caution
Obtaining Documentation and Submitting a Service RequestFor information on obtaining documentation, using the Cisco Bug Search Tool (BST), submitting a servicerequest, and gathering additional information, seeWhat's New in Cisco Product Documentation, at: http://www.cisco.com/c/en/us/td/docs/general/whatsnew/whatsnew.html.
Subscribe toWhat's New in Cisco Product Documentation, which lists all new and revised Cisco technicaldocumentation as an RSS feed and delivers content directly to your desktop using a reader application. TheRSS feeds are a free service.
Cisco Unified Real-Time Monitoring Tool Administration Guide, Release 11.0(1) xxi
PrefaceObtaining Documentation and Submitting a Service Request

Cisco Product SecurityThis product contains cryptographic features and is subject to United States and local country laws governingimport, export, transfer and use. Delivery of Cisco cryptographic products does not imply third-party authorityto import, export, distribute or use encryption. Importers, exporters, distributors and users are responsible forcompliance with U.S. and local country laws. By using this product you agree to comply with applicable lawsand regulations. If you are unable to comply with U.S. and local laws, return this product immediately.
Further information regarding U.S. export regulations may be found athttp://www.access.gpo.gov/bis/ear/ear_data.html.
OrganizationAdministration overview
Overview of Unified RTMT, including browser support.
Getting started
Description of how to install, access, and use the Unified RTMT client.
System performance monitoring
Overview of system performance monitoring in RTMT, including how to manage predefined objectsfor your system, Cisco Unified Communications Manager, Cisco Intercompany Media Engine, CiscoUnified Communications Manager IM and Presence Service, and Cisco Unity Connection.
Cisco Unified Analysis Manager
Provides information about Cisco Unified Analysis Manager, including procedures to install andconfigure the Unified Analysis Manager; procedures to add nodes that the Unified Analysis Managercan diagnose; procedures for device management; and information about troubleshooting.
Profile and categories
Provides information about how to manage profiles and categories.
Performance counters
Provides procedures for working with performance monitors, including viewing performance countersand counter descriptions, and perfmon logs.
Alerts
Provides procedures for working with alerts.
Trace and Log Central
Provides information about configuring on-demand trace collection and crash dump files for systemservices and methods to view the trace files in the appropriate viewer.
Cisco Unified Real-Time Monitoring Tool Administration Guide, Release 11.0(1)xxii
PrefaceCisco Product Security

(Appendix) Performance counters and alerts
Provides a complete list of performance objects and their associated counters for components of yoursystem.
Cisco Unified Real-Time Monitoring Tool Administration Guide, Release 11.0(1) xxiii
PrefaceOrganization

Cisco Unified Real-Time Monitoring Tool Administration Guide, Release 11.0(1)xxiv
PrefaceOrganization

C H A P T E R 1Administration Overview
• Cisco Unified Real-Time Monitoring Tool, page 1
• Operating System Support, page 2
Cisco Unified Real-Time Monitoring ToolThe Cisco Unified Real-TimeMonitoring Tool, which runs as a client-side application, monitors the real-timebehavior of your system components. Unified RTMT uses Hypertext Transfer Protocol Secure (HTTPS) andTransmission Control Protocol (TCP) to monitor the following:
• System performance
• Device status
• Device discovery
• Computer Telephony Integration (CTI) applications
Unified RTMT can connect directly to devices through HTTPS to troubleshoot system problems.
Even when Unified RTMT is not running as an application on your desktop, tasks such as alarm andperformance monitoring updates continue to take place on the server in the background.
Note
Unified RTMT allows you to perform the following tasks:
• Monitor a set of predefined management objects that monitor the health of the system.
• Generate various alerts, in the form of email messages, for objects when values go above or belowuser-configured thresholds.
• Collect and view traces in various default viewers that exist in Unified RTMT.
• View syslog messages in SysLog Viewer.
•Work with performance-monitoring counters.
• Cisco Unified Communications Manager only: Translate Q931 messages.
Cisco Unified Real-Time Monitoring Tool Administration Guide, Release 11.0(1) 1

A single copy of Unified RTMT that is installed on your computer lets you monitor more than one server ormore than one cluster at a time. For example, you can monitor all of the following entities:
• A Unified Communications Manager product on one server.
• Cisco Intercompany Media Engine (Cisco IME) product on one server.
• Cisco Unified Communications Manager IM and Presence Service (IM and Presence Service) producton one server.
• A server on a cluster (to monitor the health of the cluster).
To monitor a product on a different server, you must use a new instance of Unified RTMT.
Operating System SupportYou can install Unified RTMT on a computer that is running one of the following operating systems:
•Windows XP
•Windows Vista
•Windows 7
•Windows 8
• Linux with KDE or GNOME client
ForWindows 7 and later, ensure that you launch Unified RTMT in 'Run as administrator' mode. Otherwise,User Access Control (UAC) rights are disabled.
Note
Consider the following information when you install Unified RTMT:
• Unified RTMT requires at least 128 MB in memory to run on a Windows OS platform.
• Unified RTMT requires at least 300 MB of disk space to run on a Windows and Linux OS platform.
•When you install Unified RTMT on a Windows Vista or 7 platform, you will see this User AccountControl popup message: “An unidentified program wants to access your computer.” Click Allow tocontinue working with Unified RTMT.
• Unified RTMT runs on 32 bit and 64 bit Windows platforms.
Cisco Unified Real-Time Monitoring Tool Administration Guide, Release 11.0(1)2
Administration OverviewOperating System Support
C H A P T E R 2Getting Started
• Install and Configure Unified RTMT, page 3
• Administration Tools, page 8
• Uninstall Unified RTMT, page 27
Install and Configure Unified RTMT
Install Unified RTMT
Before You Begin
• Unified RTMT requires at least 128 MB in memory to run on a Windows OS platform; the tool requiresat least 300 MB of disk space to run on a Windows/Linux OS platform.
The Linux Unified RTMT plugin CcmServRtmtPlugin.bin can be installed on RHEL5, RHEL 6, or higher Linux machines. If you want to install it on a RHEL 4 machine,ensure that the glibc (OS library) version is 2.4.x or higher. If the glibc version is 2.3.xor earlier, the underlying JRE install fails.
Note
• The current Unified RTMT download supports earlier releases of Cisco Unified CommunicationsManager or Cisco Unity Connection. Some releases of Unified Communications Manager may requiredifferent versions of Unified RTMT to be installed on your computer (one version per UnifiedCommunications Manager release). Verify that the Unified RTMT version that you install is compatiblewith the product that you are monitoring. If the Unified RTMT version that you are using is not compatiblewith the server that you want to monitor, the system prompts you to download the compatible version.
• Your computer stores the user preferences, such as the IP address and Unified RTMT frame size, basedon the last instance of Unified RTMT that you run.
Cisco Unified Real-Time Monitoring Tool Administration Guide, Release 11.0(1) 3
Only the administrators with Standard Audit Users and Standard CCMSuper Users privileges have accessto Unified RTMT features. If an application user without these privileges logs into Unified RTMT, someof the features such as Call Control Discovery (CCD) and Service Advertisement Framework (SAF) willnot work as expected.
Note
On a Linux workstation, run RTMT with root access. Otherwise, when you initially install RTMT, theapplication will not start.
Note
Procedure
Step 1 Go to the Plug-ins window of the administration interface for your configuration:How to accessInterface
From Cisco Unified Communications ManagerAdministration, choose Application > Plugins.
Cisco Unified Communications Manager
From Cisco Unified Communications Manager IMand Presence Administration, choose Application >Plugins.
Cisco Unified Communications Manager IM andPresence Service
FromCiscoUnity ConnectionAdministration, chooseSystem Settings > Plugins.
Cisco Unity Connection
Step 2 Click Find.Step 3 To install Unified RTMT on a client that is running the Microsoft Windows operating system, click the
Download link for the Real-Time Monitoring Tool - Windows.To install Unified RTMT on a client that is running the Linux operating system, click the Download link forthe Real-Time Monitoring Tool - Linux.
When you install Unified RTMT on Windows 7 or later, ensure that you perform the installation asan administrator.
Tip
Step 4 Download the executable to the preferred location on your client.Step 5 To install the Windows version, double-click the Unified RTMT icon that appears on the desktop or locate
the directory where you downloaded the file and run the Unified RTMT installation file.The extraction process begins.
Step 6 To install the Linux version, ensure that the file has execute privileges; for example, enter the followingcommand, which is case sensitive: chmod +x CcmServRtmtPlugin.bin
Step 7 After the Unified RTMT welcome window appears, click Next.Step 8 To accept the license agreement, click I accept the terms of the license agreement; then, click Next.Step 9 Choose the location where you want to install Unified RTMT. If you do not want to use the default location,
click Browse and navigate to a different location. Click Next.Step 10 To begin the installation, click Next.
Cisco Unified Real-Time Monitoring Tool Administration Guide, Release 11.0(1)4
Getting StartedInstall Unified RTMT

The Setup Status window appears.
Step 11 To complete the installation, click Finish.
Upgrade RTMT
To ensure compatibility, Cisco recommends that you upgrade RTMT after you complete the Cisco UnifiedCommunications Manager upgrade on all servers in the cluster.
Tip
RTMT saves user preferences and downloaded module jar files locally on the client machine. The systemsaves user-created profiles in the database, so you can access these items in Unified RTMT after you upgradethe tool.
Before You Begin
Before you upgrade to a newer version of RTMT, Cisco recommends that you uninstall the previous version.
Procedure
Step 1 From Cisco Unified CM Administration, choose Application > Plugins.Step 2 Click Find.Step 3 Perform one of the following actions:
• To install the tool on a computer that is running the Microsoft Windows operating system, click theDownload link for the Cisco Unified Real-Time Monitoring Tool - Windows.
• To install the tool on a computer that is running the Linux operating system, click the Download linkfor the Cisco Unified Real-Time Monitoring Tool - Linux.
Step 4 Download the installation file to your preferred location.Step 5 Locate and run the installation file.
The extraction process begins.Step 6 In the RTMT welcome window, click Next.Step 7 Because you cannot change the installation location for upgrades, click Next.
The Setup Status window appears; do not click Cancel.Step 8 In theMaintenance Complete window, click Finish.
Launch Unified RTMT
Before You Begin
For single sign-on in Windows XP, Vista, or 7, run Unified RTMT as an administrator.
Cisco Unified Real-Time Monitoring Tool Administration Guide, Release 11.0(1) 5
Getting StartedUpgrade RTMT
Procedure
Step 1 After you install the plug-in, open Unified RTMT.If you have a Windows XP, Vista, or 7 client and you want to use the single sign-on feature, right click theUnified RTMT shortcut on your desktop or start menu and click Run as Administrator.
Before launching RTMT on Windows 7 or Vista, ensure that User Account Control (UAC)feature is disabled. For more information on UAC feature, referhttp://msdn.microsoft.com/en-us/library/aa511445.aspx.
Important
Step 2 In the Host IP Address field, enter either the IP address or hostname of the node or (if applicable) the nodein a cluster.
Step 3 Enter the port that the application will use to listen to the node.The default setting is 8443 for secure connections. If firewall is disabled, specify the port as443.
Note
The Trace and Log Central tool in Unified RTMT uses the port number that you specify tocommunicate with all the nodes in a cluster. If your system uses port mapping and all nodes do notmap to the same port number, then some Unified RTMT tools cannot connect to those nodes. Thetools that will fail to connect include Trace and Log Central, Job Status, SyslogViewer, Perfmon LogViewer, and FTP/SFTP Configuration.
Note
Step 4 Check the Secure Connection check box.If you uncheck the Secure Connection check box, you must manually change the port to80.
Note
Step 5 Click OK.
• If the single sign-on feature is enabled, Unified RTMT does not prompt for the username and password;proceed to step 8.
• If the single sign-on is not enabled, Unified RTMT displays another window prompting for usernameand password. Enter the details as given in the following steps.
Step 6 In the User Name field, enter the Administrator username for the application.Step 7 In the Password field, enter the Administrator user password that you established for the username.
If the authentication fails or if the node is unreachable, the tool prompts you to reenter the node andauthentication details, or you can click the Cancel button to exit the application. After the authenticationsucceeds, Unified RTMT launches the monitoring module from local cache or from a remote node,when the local cache does not contain a monitoring module that matches the back-end version.
Note
Step 8 When prompted, add the certificate store by clicking Yes.Unified RTMT starts.
Cisco Unified Real-Time Monitoring Tool Administration Guide, Release 11.0(1)6
Getting StartedLaunch Unified RTMT

If you sign in using the single sign-on feature, Unified RTMT prompts once for a username andpassword after you click any one of the following menus:
Note
• System > Performance > Performance log viewer
• System > Tools > Trace and Log Central
• System > Tools > Job status
• System > Tools > Syslog Viewer
• Voice/Video > CallProcess > Session Trace
• Voice/Video > CallProcess > Called Party Tracing
• Voice/Video > Report > Learned Pattern
• Voice/Video > Report > SAF forwarders
• Analysis Manager
What to Do Next
You can create a user with a profile that is limited only to Unified RTMT usage. The user will have full accessto Unified RTMT but will not have permission to administer a node.
You can create a Unified RTMT user by adding a new application user in the administration interface andadding the user to the predefined Standard RealtimeAndTraceCollection group.
For complete instructions for adding users and user groups, see the Administration Guide for Cisco UnifiedCommunications Manager and System Configuration Guide for Cisco Unified Communications Manager .
Related Topics
Run as Administrator, on page 7
Run as AdministratorFollow this procedure to run a program as an administrator in Windows XP, Vista, or 7.
To use the single sign-on feature on the precedingWindows clients, run Unified RTMT as an administrator.Note
Procedure
Step 1 Locate the program shortcut.Step 2 Right-click the shortcut.Step 3 Perform one of the following actions:
• Right-click the shortcut and select Run as administrator.
• 1 Right-click the shortcut.
Cisco Unified Real-Time Monitoring Tool Administration Guide, Release 11.0(1) 7
Getting StartedRun as Administrator

2 Select Properties.
3 Under the shortcut tab, click Advanced.
4 Check the Run as administrator check box.
Multiple installations of Unified RTMTA single copy of Unified RTMT that is installed on your computer lets you monitor more than one server ormore than one cluster at a time. For example, you can monitor all of the following entities:
• A Cisco Unified Communications Manager product on one node
• An Intercompany Media Engine (IME) product on one node.
• An IM and Presence Service on one node.
• A node on a cluster to monitor the health of the cluster.
To monitor a product on a different node, you must use a new instance of Unified RTMT that is installed.
Multiple copies of Unified RTMT that are installed on your computer let you simultaneously monitor multipleIM and Presence Services that are installed on different nodes.
When you install multiple copies of Unified RTMT on a single computer, you must install Unified RTMT indifferent folders. Cisco recommends that you install no more than four copies of Unified RTMT on a computer.
Because installing another copy of Unified RTMT overwrites the shortcut icon, you should complete thefollowing tasks:
1 Create another icon by creating a shortcut to jrtmt.exe in the folder with the previous installation.
2 Rename the icon accordingly.
If the installation detects another version in the selected folder, a message displays. To continue the installation,install the version in a different folder.
Your computer stores the user preferences, such as the IP address and Unified RTMT frame size, fromthe Unified RTMT client that last exits.
Note
Administration Tools
System InterfaceThe Unified RTMT interface consists of the following components:
•Menu bar: the menu bar includes some or all of the following options, depending on your configuration:
Cisco Unified Real-Time Monitoring Tool Administration Guide, Release 11.0(1)8
Getting StartedMultiple installations of Unified RTMT

File
Allows you to save, restore, and delete existing RTMT profiles, monitor Java Heap MemoryUsage, go to the Serviceability Report Archive window in Cisco Unified Serviceability, log off,or exit RTMT.
The RTMTmenu option File >Cisco Unified Reporting lets you access Cisco UnifiedReporting fromRTMT. You can use the Cisco Unified Reporting application to snapshotcluster data for inspection or troubleshooting. For more information, see the CiscoUnified Reporting Administration Guide.
Note
System
Allows you to monitor system summary, monitor server resources, work with performancecounters, work with alerts, collect traces, and view syslog messages.
Voice/Video
Allows you to viewCisco Unified CommunicationsManager summary information on the server;monitor call-processing information; and view and search for devices, monitor services, and CTI.
IM and Presence
Allows you to view IM and Presence Service and Cisco Jabber summary information on theserver.
Cisco Unity Connection
Allows you to view the Port Monitor tool.
IME Service
Allows you monitor server and network activity of the Cisco Intercompany Media Engine server.
Edit
Allows you to configure categories (for table format view), set the polling rate for devices andperformance monitoring counters, hide the quick launch channel, and edit the trace setting forRTMT.
Window
Allows you to close a single RTMT window or all RTMT windows.
Application
Depending on your configuration, allows you to browse the applicable web pages for administrationinterfaces, Cisco Unified Serviceability, and Cisco Unity Connection Serviceability.
Help
Allows you to access RTMT online help documentation and to view the RTMT version.
• Quick Launch channel: Pane that displays information about the server or information about theapplications. The tab contains groups of icons that you can click to monitor various objects.
Cisco Unified Real-Time Monitoring Tool Administration Guide, Release 11.0(1) 9
Getting StartedSystem Interface

•Monitor pane: Pane where monitoring results are displayed.
Performance MonitoringCisco Unified CommunicationsManager, Cisco Unified CommunicationsManager IM and Presence Service,and Cisco Unity Connection directly update Performance counters (called perfmon counters). The counterscontain simple, useful information about the system and devices on the system, such as number of registeredphones, number of active calls, number of available conference bridge resources, and voice messaging portusage.
You can monitor the performance of the components of the system and the components for the applicationon the system by choosing the counters for any object by using the Cisco Unified Real-TimeMonitoring Tool.The counters for each object display when the folder expands.
You can log perfmon counters locally on the computer and use the performance log viewer in Unified RTMTto display the perfmon CSV log files that you collected or the Real-Time Information Server Data Collection(RISDC) perfmon logs.
RTMT integrates with existing software for performance monitoring:
• RTMT integrates with your administration and serviceability software.
• RTMT displays performance information for all system components.
RTMT provides alert notifications for troubleshooting performance. It also periodically polls performancecounter to display data for that counter. You can choose to display perfmon counters in a chart or table format.
Performance monitoring allows you to perform the following tasks:
• Monitor performance counters from all Unified Communications Manager, IM and Presence Service,and Cisco Unity Connection servers.
• Continuously monitor a set of preconfigured objects and receive notification in the form of an emailmessage.
• Associate counter threshold settings to alert notification. An email or popupmessage provides notificationto the administrator.
• Save and restore settings, such as counters that are being monitored, threshold settings, and alertnotifications, for customized troubleshooting tasks.
• Display up to six perfmon counters in one chart for performance comparisons.
• Use performance queries to add a counter to monitor.
System summary statusThe Real-Time Monitoring Tool provides a set of default monitoring objects that help you to monitor thehealth of the system. Default objects include performance counters or critical event status for the system andother supported services. The system summary in Unified RTMT allows you to monitor important commoninformation in a single monitoring pane. In system summary, you can view information about the followingpredefined objects:
• Virtual Memory usage
• CPU usage
Cisco Unified Real-Time Monitoring Tool Administration Guide, Release 11.0(1)10
Getting StartedPerformance Monitoring

• Common Partition usage
• Alert History Log
Server Status MonitoringThe Server category monitors CPU and memory usage, processes, disk space usage, and critical services forthe different applications on the server.
The CPU andMemory monitors provide information about the CPU usage and Virtual memory usage on eachserver. For each CPU on a server, the information includes the percentage of time that each processor spendsexecuting processes in different modes and operations (User, Nice, System, Idle, IRQ, SoftIRQ, and IOWait).The percentage of CPU equals the total time that is spent executing in all the different modes and operationsexcluding the Idle time. For memory, the information includes the Total, Used, Free, Shared, Buffers, Cached,Total Swap, Used Swap, and Free Swap memory in Kbytes, and the percentage of Virtual Memory in Use.
The Process monitor provides information about the processes that are running on the system. Unified RTMTdisplays the following information for each process: process ID (PID), CPU percentage, Status, SharedMemory(KB), Nice (level), VmRSS (KB), VmSize (KB), VmData (KB), Thread Count, Page Fault Count, and DataStack Size (KB).
The Disk Usage monitoring category charts the percentage of disk usage for the common and swap partitions.This category also displays the percentage of disk usage for each partition (Active, Boot, Common, Inactive,Swap, SharedMemory, Spare) in each host.
If more than one logical disk drive is available in your system, the system stores CTI Manager traces inthe spare partition on the first logical disk and Cisco CallManager traces on the second logical disk. UnifiedRTMT monitors the disk usage for the spare partition in the Disk Usage window.
Note
The Critical Services monitoring category provides the name of the critical service, the status (whether theservice is up, down, activated, stopped by the administrator, starting, stopping, or in an unknown state), andthe elapsed time during which the services are up and running on the system.
For a specific description of each state, see the following table.
Table 1: Status of Critical Services
DescriptionStatus of Critical Service
The service currently exists in start mode, as indicated in theCritical Services pane and in Control Center in Cisco UnifiedServiceability
starting
The service currently runs, as indicated in the Critical Servicespane and in Control Center in Cisco Unified Serviceability.
up
The service currently remains stopped, as indicated in theCritical Services pane and in Control Center in Cisco UnifiedServiceability.
stopping
Cisco Unified Real-Time Monitoring Tool Administration Guide, Release 11.0(1) 11
Getting StartedPerformance Monitoring

DescriptionStatus of Critical Service
The service stopped running unexpectedly; that is, you didnot perform a task that stopped the service. The CriticalServices pane indicates that the service is down.
The CriticalServiceDown alert is generated when the servicestatus equals down.
down
You performed a task that intentionally stopped the service;for example, the service stopped because you backed up orrestored your system, performed an upgrade, or stopped theservice in Cisco Unified Serviceability or the CLI.
The Critical Services pane indicates the status.
stopped by Admin
The service does not exist in a currently activated status, asindicated in the Critical Services pane and in ServiceActivation in Cisco Unified Serviceability.
not activated
The system cannot determine the state of the service, asindicated in the Critical Services pane.
unknown state
Performance Counter InterfaceRTMT contains ready-to-view, predefined performance counters. You can also select and add counters tomonitor in RTMT using performance queries.
RTMT displays performance counters in chart or table format. Chart format presents a miniature window ofinformation. You can display a particular counter by double-clicking the counter in the perfmon monitoringpane.
Attributes for predefined performance counters, such as format and category, remain fixed. You can defineattributes for counters that you configure in RTMT. Because chart view represents the default, you canconfigure the performance counters to display in table format when you create a category.
Category Tabs
A category comprises a group of monitored performance counters. A tab in the RTMT monitoring panecontains the category name. All performance counters that are monitored in this tab belong to a category.RTMT displays any categories that you access during a RTMT session in the bottom toolbar.
The system polls the performance counters in the tab at the same rate, with each category configured to haveits own polling rate.
You can create custom categories in the RTMTmonitoring pane to view information that helps you troubleshootspecific performance, system, or device problems. If your system is experiencing performance problems withspecific objects, create custom categories to monitor the performance of the counters within the object. If thesystem is experiencing problems with specific devices, create custom categories to monitor the devices inyour system. In addition, you can create alert notifications for counters and gateways in these custom categories.To create custom categories, you add a new category tab. When the tab is created, you specify the specificperformance counters, devices, and alerts within that tab and then save your custom category by using Profile.
Cisco Unified Real-Time Monitoring Tool Administration Guide, Release 11.0(1)12
Getting StartedPerformance Monitoring

Sample Rate
The application polls the counters, devices, and gateway ports to gather status information.
The polling rate in each precanned monitoring window remains fixed, and the default value specifies 30seconds. If the collecting rate for the AMC (Alert Manager and Collector) service parameter changes, thepolling rate in the precanned window also updates. In addition, the local time of the RTMT client applicationand not the backend server time, provides the basis for the time stamp in each chart. For more informationon Service Parameters, refer to System Configuration Guide for Cisco Unified Communications Manager orCisco Unity Connection System Administration Guide.
In the RTMT monitoring pane, you configure the polling intervals for the applicable performance counters,devices, and gateway ports for each category tab that you create.
High-frequency polling rate affects the performance on the server. Theminimum polling rate for monitoringa performance counter in chart view equals 5 seconds; the minimum rate for monitoring a performancecounter in table view equals 1 second. The default for both specifies 10 seconds.
Note
Zoom In on Perfmon Counter
To get a closer look at perfmon counters, you can zoom in on a perfmon monitor counter in the RTMT.
Procedure
Step 1 To zoom in on a counter, perform one of the following tasks:
• To zoom in predefined objects, such as System Summary, perform one of the following actions:
◦Drag the mouse over the plot area in the counter to frame the data and release the mouse button.The counter zooms in the chart.
◦Click the counter. The counter zooms in.
• To zoom counters in the Performance pane, perform one of the following actions (and resize the window,if necessary):
◦Double-click the counter that you want to zoom. The box with the counter appears highlighted andthe Zoom window launches. The minimum, maximum, average, and last fields show the valuesfor the counter since the monitoring began for the counter.
◦Click the counter to select the counter to zoom. The box with the counter appears highlighted.
◦Right-click the counter and selectZoomChart or choose System > Performance >ZoomChart.The Zoom window launches. The minimum, maximum, average, and last fields show the valuesfor the counter since the monitoring began for the counter.
Step 2 To zoom out a counter, perform one of the following actions:
• To zoom out predefined objects, such as System Summary, click the counter and press Z in the activecounter to return the counter to original size.
Cisco Unified Real-Time Monitoring Tool Administration Guide, Release 11.0(1) 13
Getting StartedPerformance Monitoring

• To zoom out counters in the Performance pane, click OK to close the Zoom window.
Highlight Charts and Graphs
The highlight feature helps to distinguish hosts and counters when multiple nodes or counters display oncolor-coded graphs. This feature is active in the System Summary, CPU and Memory, Disk Usage, andPerformance Log Viewer windows.
Procedure
Step 1 To highlight charts and graphs, perform one of the following tasks:
• To highlight charts and graphs for predefined objects, such as System Summary, right-click in a plotarea to highlight the nearest data series or point.
• To highlight charts and graphs in the performance log viewer, perform one of the following tasks:
◦Right-click any color code in the table below the chart in the Performance Log Viewer and chooseHighlight to highlight the data series for that counter.
◦Right-click any color code in the table below the chart in the Performance Log Viewer and chooseChange Color to select a different color for the counter.
Step 2 To return a highlighted item to its original appearance in the Performance Log Viewer, select another item tohighlight.
Counter Properties
Counter properties allow you to display a description of the counter and configure data-sampling parameters.
The Counter Property window contains the option to configure data samples for a counter. The performancecounters that display in the Unified RTMT performance monitoring pane contain green dots that representsamples of data over time. You can configure the number of data samples to collect and the number of datapoints to show in the chart. After the data sample is configured, view the information by using the View AllData/View Current Data menu option to view the data that a perfmon counter collected.
Related Topics
Performance Counters and Alerts, on page 173
Alert Notification for Counters
When you activate the Alert Notification feature, the application notifies you of system problems. Performthe following configuration setup to activate alert notifications for a system counter:
1 From the RTMT Perfmon Monitoring pane, choose the system perfmon counter.
Cisco Unified Real-Time Monitoring Tool Administration Guide, Release 11.0(1)14
Getting StartedPerformance Monitoring
2 Set up an email or a message popup window for alert notification.
3 Determine the threshold for the alert (for example, an alert activates when calls in progress exceed thethreshold of over 100 calls or under 50 calls).
4 Determine the frequency of the alert notification (for example, the alert occurs once or every hour).
5 Determine the schedule for when the alert activates (for example, on a daily basis or at certain times ofthe day).
Trace and Log CentralThe Trace and Log Central feature in RTMT allows you to configure on-demand trace collection for a specificdate range or an absolute time. You can collect trace files that contain search criteria that you specify andsave the trace collection criteria for later use, schedule one recurring trace collection and download the tracefiles to a SFTP or FTP server on your network, or collect a crash dump file.
From Cisco Unified Serviceability, you can also edit the trace setting for the traces on the node that youhave specified. Enabling trace settings decreases system performance; therefore, enable Trace only fortroubleshooting purposes.
Note
After you collect the files, you can view them in the appropriate viewer within the real-time monitoring tool.You can also view traces on the node without downloading the trace files by using the remote browse feature.You can open the trace files by either selecting the internal viewer that is provided with Unified RTMT orchoosing an appropriate program as an external viewer.
Note • To use the Trace and Log Central feature, make sure that RTMT can directly access the node or allof the nodes in a cluster without Network Access Translation (NAT). If you have set up a NAT toaccess devices, configure the nodes with a hostname instead of an IP address and make sure that thehostnames (Fully Qualified Domain Name of the host) and their routable IP address are in the DNSnode or host file.
• For devices that support encryption, the SRTP keying material does not display in the trace file.
Related Topics
Cisco Unified Analysis Manager Setup, on page 71
Trace Files Collection, Throttling, and Compression
The Collect Files option in Trace and Log Central collects traces for services, applications, and system logson the server or on one or more servers in the cluster.
The services that you have not activated also appear, so you can collect traces for those services.Note
Cisco Unified Real-Time Monitoring Tool Administration Guide, Release 11.0(1) 15
Getting StartedPerformance Monitoring

RTMT Trace and Log Central Disk I/O and CPU Throttling
RTMT supports the throttling of critical Trace and Log Central operations and jobs, whether they are runningon demand, scheduled, or automatic. The throttling slows the operations when I/O utilization is in high demandfor call processing, so call processing can take precedence.
When you make a request for an on-demand operation when the call processing node is running under highI/O conditions, the system displays a warning that gives you the opportunity to abort the operation. You canconfigure the I/O rate threshold values that control when the warning displays with the following serviceparameters (in Cisco RIS Data Collector service):
• TLC Throttling CPU Goal
• TLC Throttling IOWait Goal
The system compares the values of these parameters against the actual system CPU and IOWait values. If thegoal (the value of the service parameter) is lower than the actual value, the system displays the warning.
Trace Compression Support
This feature enables the ROS (Recoverable Outstream) library to support the compressed output of tracefiles.The files get compressed as they are being generated. The benefits of tracefile compression include thefollowing:
• Reduces the capacity that is required to store tracefiles.
• Reduces the disk head movement, which results in significantly improved disk I/O wait. This reductionprovides value when tracefile demand is high.
Use the enterprise parameter Trace Compression to enable or disable trace compression. The default valuefor this parameter is Disabled. For information about setting the values of enterprise parameters, see the“Enterprise Parameters Configuration” chapter in the System Configuration Guide for Cisco UnifiedCommunications Manager .
Compressing files adds additional CPU cycles. Enabling the Trace Compression enterprise parameter cannegatively affect overall call throughput by as much as 10 percent.
Caution
You can recognize compressed files by their .gz extension (.gzo if the file is still being written to). To opena compressed file, double-click the filename, and the file opens in the log viewer.
Configuration ProfilesYou can use RTMT to connect to a server or to any server in a Cisco Unified Communications Managercluster (if applicable). After you log in to a server, RTMT launches the monitoring module from the localcache or from a remote server when the local cache does not contain a monitoring module that matches theback-end version.
RTMT includes a default configuration that is called Default. The first time that you use RTMT, it uses theDefault profile and displays the system summary page in the monitor pane.
Unified Communications Manager clusters only: Default profile also dynamically monitors all registeredphones for all Unified Communications Manager servers in a cluster. If your cluster contains five configuredUnified Communications Manager servers, CM-Default displays the registered phones for each server in thecluster, as well as calls in progress and active gateway ports and channels.
Cisco Unified Real-Time Monitoring Tool Administration Guide, Release 11.0(1)16
Getting StartedConfiguration Profiles

You can configure RTMT to display the information that interests you, such as different performance countersfor different features, in the monitor pane of RTMT and save the framework of your configuration in a profile.You can then restore the profile at a later time during the same session or the next time that you log in toRTMT. By creating multiple profiles, so each profile displays unique information, you can quickly displaydifferent information by switching profiles.
If you are running the RTMT client andmonitoring performance counters during a Unified CommunicationsManager upgrade, the performance counters will not update during and after the upgrade. To continuemonitoring performance counters accurately after theUnified CommunicationsManager upgrade completes,you must either reload the RTMT profile or restart the RTMT client.
Note
Related Topics
Add Configuration Profile, on page 91
CategoriesCategories allow you to organize objects in RTMT, such as performance monitoring counters and devices.For example, the default category under performancemonitoring, RTMT allows you tomonitor six performancemonitoring counters in graph format. If you want to monitor more counters, you can configure a new categoryand display the data in table format.
If you perform various searches for devices, for example, for phones, gateways, and so on, you can create acategory for each search and save the results in the category.
Changes to the profile settings for the default profile on IM and Presence Service are not transferred toUnified Communications Manager. IM and Presence Service profiles are renamed with the prefix“Presence_”.
Note
Related Topics
Add Category , on page 92
AlertsThe system generates alert messages to notify administrators when a predefined condition is met, such aswhen an activated service goes from up to down. Alerts can be sent out as email or epage.
Unified RTMT, which supports alert defining, setting, and viewing, contains preconfigured and user-definedalerts. Although you can perform configuration tasks for both types, you cannot delete preconfigured alerts(whereas you can add and delete user-defined alerts).
Alert optionsThe Alert menu (System > Tools > Alert) comprises the following menu options:
• Alert Central: This option comprises the history and current status of every alert in the system.
Cisco Unified Real-Time Monitoring Tool Administration Guide, Release 11.0(1) 17
Getting StartedCategories

You can also access Alert Central by selecting the Alert Central icon in the hierarchytree in the system drawer.
Note
• Set Alert/Properties: This menu option allows you to set alerts and alert properties.
• Remove Alert: This menu category allows you to remove an alert.
• Enable Alert: With this menu category, you can enable alerts.
• Disable Alert: You can disable an alert with this category.
• Suspend cluster/Node Alerts: This menu category allows you to temporarily suspend alerts on a particularIM and Presence node or on the entire cluster.
• Clear Alerts: This menu category allows you to reset an alert (change the color of an alert item from redto black) to signal that an alert has been taken care of. After an alert has been raised, its color automaticallychanges to in Unified RTMT and stays that way until you manually clear the alert.
• Clear All Alerts: This menu category allows you to clear all alerts.
• Reset all Alerts to Default Config: This menu category allows you to reset all alerts to the defaultconfiguration.
• Alert Detail: This menu category provides detailed information on alert events.
• Config Email Server: In this category, you can configure your email server to enable alerts.
• Config Alert Action: This category allows you to set actions to take for specific alerts; you can configurethe actions to send the alerts to desired email recipients.
In Unified RTMT, you configure alert notification for perfmon counter value thresholds and set alert propertiesfor the alert, such as the threshold, duration, frequency, and so on.
You can locate Alert Central under the Tools hierarchy tree in the quick launch. Alert Central provides boththe current status and the history of all the alerts in the system.
Alert FieldsYou can configure both preconfigured and user-defined alerts in Unified RTMT. You can also disable bothpreconfigured and user-defined alerts in Unified RTMT. You can add and delete user-defined alerts in theperformance-monitoring window; however, you cannot delete preconfigured alerts.
Severity levels for Syslog entries match the severity level for all Unified RTMT alerts. If Unified RTMTissues a critical alert, the corresponding Syslog entry also specifies critical.
Note
The following table provides a list of fields that you may use to configure each alert; users can configurepreconfigured fields, unless otherwise noted.
Cisco Unified Real-Time Monitoring Tool Administration Guide, Release 11.0(1)18
Getting StartedAlerts

Table 2: Alert Customization
CommentDescriptionField
Descriptive name. Forpreconfigured alerts, you cannotchange this field. See topics relatedto Alert Central displays for a listof preconfigured alerts.
High-level name of the monitoringitem with which Unified RTMTassociates an alert
Alert Name
You cannot edit this field forpreconfigured alerts. See topicsrelated to Alert Central displays fora list of preconfigured alerts.
Description of the alertDescription
You cannot change this field. Youcan associate only one instance ofthe performance counter with analert.
Source of the performance counterPerformance Counter(s)
Specify up < - > down, less than #,%, rate greater than #, %, rate. Thisfield is applicable only for alertsbased on performance counters.
Condition to raise alert (value is...)Threshold
Specify value to be evaluated asabsolute, delta (present - previous),or % delta. This field is applicableonly for alerts based onperformance counters.
Method used to check the thresholdcondition
Value Calculated As
Options include the system sendingthe alert immediately or after aspecified time that the alert haspersisted. This field is applicableonly for alerts based onperformance counters.
Condition to raise alert (how longvalue threshold has to persistbefore raising alert)
Duration
ForExcessiveVoiceQualityReports, thedefault thresholds equal 10 to 60minutes. For RouteListExhaustedand MediaListExhausted, thedefaults equal 0 to 60minutes. Thisfield is applicable only for eventbased alerts.
Raise alert only when aconfigurable number of eventsexceeds a configurable timeinterval (in minutes).
Number of Events Threshold
Cisco Unified Real-Time Monitoring Tool Administration Guide, Release 11.0(1) 19
Getting StartedAlerts

CommentDescriptionField
Cisco Unified CommunicationsManager servers, Cisco TFTPserver, or first server. This field isapplicable only for non-clusterwidealerts.
When you deactivate boththe CiscoCallManager andCisco TFTP services of aserver, the systemconsiders that server asremoved from thecurrently monitored serverlist. When you reactivateboth Cisco CallManagerand Cisco TFTP services,that server is added back,and its settings are restoredto default values.
Note
Cluster or list of servers to monitorNode IDs
(Applies to UnifiedCommunications Manager and theIM and Presence Service)
Alert action is defined first (see theAlert Customization topic). Ablank field indicates that e-mail isdisabled.
ID of alert action to take (Systemalways logs alerts no matter whatthe alert action.)
Alert Action ID
Options include enabled ordisabled.
Enable or disable alerts.Enable Alerts
After an alert is raised, its colorautomatically changes to black andremains until you manually clearthe alert. Use Clear All to clear allalerts.
Resets alert (change the color of analert item from red to black) tosignal that the alert is resolved
Clear Alert
ForExcessiveVoiceQualityReports,RouteListExhausted, andMediaListExhausted, up to 30current event details display in thecurrent monitoring interval if analert is raised in the currentinterval. Otherwise, the previous30 event details in the previousinterval displays. For DChannelOOS alert, the list of outstandingOOS devices at the time the alertwas raised appears.
Displays the detail of an alert (notconfigurable)
Alert Details
(Applies to UnifiedCommunications Manager and theIM and Presence Service)
Cisco Unified Real-Time Monitoring Tool Administration Guide, Release 11.0(1)20
Getting StartedAlerts

CommentDescriptionField
Specify every X minutes. (Raisealert once every X minutes ifcondition persists.)
Specify every X minutes up to Ytimes. (Raise alert Y times everyX minutes if condition persists.)
How often to generate alert whenalert condition persists
Alert Generation Rate
—Administrator to append text on topof predefined alert text
User Provide Text
Specify defaults that are providedfor predefined (for example, Error,Warning, Information) alerts.
For viewing purposes (for example,show only Sev. 1 alerts)
Severity
Related Topics
Performance Counters and Alerts, on page 173
Alert LogsThe alert log stores the alert, which is also stored in memory. The memory is cleared at a constant interval,leaving the last 30 minutes of data in the memory. When the service starts or restarts, the last 30 minutes ofthe alert data load into the memory by the system reading from the alert logs on the server or on all serversin the cluster (if applicable). The alert data in the memory is sent to the RTMT clients on request.
Upon RTMT startup, RTMT shows all logs that occurred in the last 30 minutes in the Alert Central log history.The alert log is periodically updated, and new logs are inserted into the log history window. After the numberof logs reaches 100, RTMT removes the oldest 40 logs.
The following filename format for the alert log applies: AlertLog_MM_DD_YYYY_hh_mm.csv.
The alert log includes the following attributes:
• Time Stamp: Time when RTMT logs the data
• Alert Name: Descriptive name of the alert
• Node: Server name for where RTMT raised the alert
• Alert Message: Detailed description about the alert
• Type: Type of the alert
• Description: Description of the monitored object
• Severity: Severity of the alert
• PollValue: Value of the monitored object where the alert condition occurred
• Action: Alert action taken
• Group ID: Identifies the source of the alert
Cisco Unified Real-Time Monitoring Tool Administration Guide, Release 11.0(1) 21
Getting StartedAlerts

The first line of each log file comprises the header. Details of each alert are written in a single line, separatedby a comma.
Log Partition Monitoring ToolLog PartitionMonitoring (LPM), which is installed automatically with the system, uses configurable thresholdsto monitor the disk usage of the log partition on a server. The Cisco Log Partition Monitoring Tool servicestarts automatically after installation of the system.
Every 5 minutes, Log PartitionMonitoring uses the following configured thresholds to monitor the disk usageof the log partition and the spare log partition on a server:
• LogPartitionLowWaterMarkExceeded (% disk space): When the disk usage is above the percentage thatyou specify, LPM sends out an alarm message to syslog and an alert to RTMT Alert central. To savethe log files and regain disk space, you can use trace and log central option in RTMT.
• LogPartitionHighWaterMarkExceeded (% disk space): When the disk usage is above the percentagethat you specify, LPM sends an alarm message to syslog and an alert to RTMT Alert central.
• SparePartitionLowWaterMarkExceeded (% disk space): When the disk usage is above the percentagethat you specify, LPM sends out an alarm message to syslog and an alert to RTMT Alert central. Tosave the log files and regain disk space, you can use trace and log central option in RTMT.
• SparePartitionHighWaterMarkExceeded (% disk space): When the disk usage is above the percentagethat you specify, LPM sends a n alarm message to syslog and an alert to RTMT Alert central.
In addition, Cisco Log Partitioning Monitoring Tool service checks the server every 5 seconds for newlycreated core dump files. If new core dump files exist, Cisco Log Partitioning Monitoring Tool service sendsa CoreDumpFileFound alarm and an alert to Alert Central with information on each new core file.
To utilize log partition monitor, verify that the Cisco Log Partitioning Monitoring Tool service, a networkservice, is running on Cisco Unified Serviceability on the server or on each server in the cluster (if applicable).Stopping the service causes a loss of feature functionality.
When the log partition monitoring services starts at system startup, the service checks the current disk spaceutilization. If the percentage of disk usage is above the low water mark, but less than the high water mark, theservice sends a alarm message to syslog and generates a corresponding alert in RTMT Alert central.
To configure Log PartitioningMonitoring, set the alert properties for the LogPartitionLowWaterMarkExceededand LogPartitionHighWaterMarkExceeded alerts in Alert Central.
To offload the log files and regain disk space on the server, you should collect the traces that you are interestedin saving by using the Real-Time Monitoring tool.
If the percentage of disk usage is above the high water mark that you configured, the system sends an alarmmessage to syslog, generates a corresponding alert in RTMT Alert Central, and automatically purges log filesuntil the value reaches the low water mark.
Cisco Unified Real-Time Monitoring Tool Administration Guide, Release 11.0(1)22
Getting StartedAlerts

Log Partition Monitoring automatically identifies the common partition that contains an active directoryand inactive directory. The active directory contains the log files for the current installed version of thesoftware (Cisco Unified CommunicationsManager or Cisco Unity Connection), and the inactive directorycontains the log files for the previous installed version of the software. If necessary, the service deleteslog files in the inactive directory first. The service then deletes log files in the active directory, startingwith the oldest log file for every application until the disk space percentage drops below the configuredlow water mark. The service does not send an e-mail when log partition monitoring purges the log files.
Note
After the system determines the disk usage and performs the necessary tasks (sending alarms, generatingalerts, or purging logs), log partition monitoring occurs at regular 5 minute intervals.
Cisco Unified Analysis ManagerThe Cisco Unified Analysis Manager, a tool included with the Cisco Unified Real-Time Monitoring Tool, isused to perform troubleshooting operations. When the Unified Analysis Manager is launched, it collectstroubleshooting information from your system and provides an analysis of that information. You can use thisinformation to perform your own troubleshooting operation or to send the information to Cisco TechnicalAssistance for analysis.
The Unified Analysis Manager application is installed as an option when you install the RTMT software. Youcan access the Unified Analysis Manager interface from the RTMT main menu and quick launch channel.
After it is installed, the application can identify the supported Unified Communications (UC) products andapplications that you have in your system and troubleshoot call failures across these UC applications, collectingtrace and log files.
The Unified Analysis Manager supports the following products:
• Cisco Unified Communications Manager
• Cisco Unified Contact Center Enterprise (Unified CCE)
• Cisco Unified Contact Center Express (Unified CCX)
• Cisco IOS Voice Gateways (37xx, 28xx, 38xx, 5350XM, 5400XM) IOS Release PI 11
• Cisco Unity Connection
• IM and Presence Service
The three primary components of the Unified Analysis Manager interface are as follows:
• Administration: The administration component lets you import device and group configuration from anexternal file and provide a status of jobs run by the Unified Analysis Manager.
• Inventory: The inventory component is used to identify all of the devices in your system that can beaccessed and analyzed by the Unified Analysis Manager.
• Tools: The tools component contains all of the functions that Unified Analysis Manager supports. Thisincludes configuring traces settings, collecting logs, and viewing configurations.
Related Topics
View Trace and Log Central Options, on page 128
Cisco Unified Real-Time Monitoring Tool Administration Guide, Release 11.0(1) 23
Getting StartedCisco Unified Analysis Manager

Services, Servlets, and Service ParametersTo support the Unified RTMT client, there are a number of services that needs to be active and running onthe server. Unified RTMT uses the following services and servlets:
• Cisco AMC service: This service starts up automatically after the installation and allows Unified RTMTto retrieve real-time information that exists on nodes in the cluster. The IM and Presence serviceautomatically assigns the first node as the primary collector. For Unified RTMT to continue to retrieveinformation when the primary collector fails, you must configure a subsequent node as the failovercollector in Service Parameters in the administration interface.
The following list comprises some Cisco AMC service parameters that are associated with UnifiedRTMT. For the latest list of parameters, select System > Service Parameters in the administrativeinterface. Then, select the server and the Cisco AMC service.
• Primary Collector
• Failover Collector
• Data Collection Enabled
• Data Collection Polling Rate
• Server Synchronization Period
• RMI Registry Port Number
• RMI Object Port Number
• Logger Enabled
• Unified Communications Manager: Alarm Enabled
• Unified Communications Manager: AlertMgr Enabled
• Cisco Unity Connection: PerfMon Log Deletion Age
• Cisco Unity Connection: AlertMgr Enabled
For information about these service parameters, select the ? button that displays in the Service Parameterconfiguration window of the administrative interface.
The following list comprises some network services and servlets that are associated with Unified RTMT. InCisco Unified Serviceability, select Tools > Control Center - Network Services to view these services.
• Cisco CallManager Serviceability RTMT: Supports the Unified RTMT; this service starts up automaticallyafter the installation.
• Cisco RIS Data Collector: The Real-time Information Server (RIS) maintains real-time information suchas performance counter statistics, critical alarms generated, and so on. The Cisco RIS Data Collectorservice provides an interface for applications, such as Real-Time Monitoring Tool, SOAP applications,and AlertMgrCollector (AMC) to retrieve the information that is stored on the server.
• Cisco Tomcat Stats Servlet: The Cisco Tomcat Stats Servlet allows you to monitor the Tomcat perfmoncounters by using Unified RTMT or the CLI. Do not stop this service unless you suspect that this serviceis using too many resources, such as CPU time.
Cisco Unified Real-Time Monitoring Tool Administration Guide, Release 11.0(1)24
Getting StartedServices, Servlets, and Service Parameters

• Cisco Trace Collection Servlet: The Cisco Trace Collection Servlet, along with the Cisco Trace CollectionService, supports trace collection and allows users to view traces by using the Unified RTMT client. Ifyou stop this service on a server, you cannot collect or view traces on that server.
• Cisco Trace Collection Service: The Cisco Trace Collection Service, alongwith the Cisco Trace CollectionServlet, supports trace collection and allows users to view traces by using the Unified RTMT client. Ifyou stop this service on a server, you cannot collect or view traces on that server.
• Cisco Log Partition Monitoring Tool: This service which starts up automatically after the installation,monitors the disk usage of the log partition on a server.
• Cisco SOAP-Real-Time Service APIs: The Cisco SOAP-Real-Time Service APIs, which startautomatically after the installation, allow Unified RTMT to collect real-time information for devicesand CTI applications.
• Cisco SOAP-Performance Monitoring APIs: This service, which starts up automatically after theinstallation, allows Unified RTMT to use performance monitoring counters for various applicationsthrough SOAP APIs.
• Cisco RTMT Reporter servlet: This service, which starts up automatically after the installation, allowsyou to publish reports for Unified RTMT.
Nonconfigurable ComponentsRTMTCollector, a component that is automatically installedwith the application, logs preconfiguredmonitoringobjects information while Alert Manager, also automatically installed, logs alert histories into log files. Eachpreconfigured object belongs to one of several categories: devices, services, nodes, call activities, and PPR.Each category uses a separate log file, and alert details are also logged in a separate file.
The system also records important perfmon object values in performance log files.
Unified Communications Manager and IM and Presence Service clusters only: Although they require noconfiguration tasks to run, RTMTCollector and Alert Manager support redundancy. If the primary collectoror manager fails for any reason, the secondary collector and manager perform the tasks until primarysupport becomes available. RTMT Collector, Alert Manager, and RTMT Reporter run on the first nodeto minimize call-processing interruptions.
Tip
The locally written log files appear in the primary collector node at cm/log/amc. For Unified CommunicationsManager clusters, the log files can exist on more than one node in the cluster because the primary collectorchanges in failover and fallback scenarios.
You can display log files, except an alert log file, by using the Performance log viewer in Unified RTMT orby using the native Microsoft Performance viewer. You can view an alert log file by using any text editor.
To download log files to a local machine, you can use the collect files option in Trace and Log Central inUnified RTMT.
Alternatively, from the CLI, you can use the file list command to display a list of files and the file get commandto download files by SFTP. For more information about using CLI commands, see theCommand Line InterfaceReference Guide for Cisco Unified Communications Solutions.
Log files exist in CSV format. New log files are created every day at 00:00 hours on the local system. ForUnified Communications Manager clusters, new logs for devices, services, nodes, and calls are created whenthe time zone changes, when a new node is added to the cluster, or during failover/fallback scenarios. The
Cisco Unified Real-Time Monitoring Tool Administration Guide, Release 11.0(1) 25
Getting StartedNonconfigurable Components

first column of all these logs comprises the time zone information and the number of minutes from theGreenwich Meridian Time (GMT). RTMT Reporter uses these log files as a data source to generate dailysummary reports. The report, which is based on the default monitoring objects, is generated every 24 hoursfor the following information:
• Call Activity Status: Number of calls attempted and number of calls completed for each UnifiedCommunications Manager, each gateway, trunk, and overall cluster (if applicable). Number of channelsavailable, in-service for each gateway.
• Device Status: Number of registered phones, gateways, and trunks per each node and overall cluster (ifapplicable).
• Server Status: percentage CPU load, percentage memory that is used, percentage disk space that is usedper node.
• Service Status: (Unified Communications Manager) For each CTI Manager, number of opened devicesand lines. For each TFTP server, number attempted and failed requests.
• Alert Status: Number of alerts per node. For Unified Communications Manager clusters, number ofalerts per severity level for the cluster, including the top 10 alerts in the cluster.
• Performance Protection Report: Trend analysis information about default monitoring objects that allowsyou to track overall system health. The report includes information for the last 7 days for each node.
The Unified RTMT reports appear in English only.Tip
The following service parameters apply to Unified RTMT report generation: RTMT Reporter Designatednode, RTMTReport Generation Time, and RTMTReport DeletionAge. For information about these parameters,go to the service parameter Help for your configuration:
ChooseCisco ServiceabilityReporter in the ServiceParameter window in Cisco UnifiedCommunications Manager Administration and clickthe ? button.
CiscoUnifiedCommunicationsManager andCiscoUnified Communications Manager IM andPresence Service
ChooseCisco ServiceabilityReporter in the ServiceParameter window in Cisco Cisco UnifiedCommunications Manager IM and PresenceAdministration and click the ? button.
Cisco Business Edition 5000
On the Service Parameters window, in the Servicedrop-down list box, click a service and click Help >This Page.
Cisco Unity Connection
For more information about the Serviceability reports, see the “Serviceability Reports” chapter in the CiscoUnified Serviceability Administration Guide.
Cisco Unified Real-Time Monitoring Tool Administration Guide, Release 11.0(1)26
Getting StartedNonconfigurable Components

Uninstall Unified RTMT
Unified RTMT saves user preferences and the module jar files (the cache) locally on the client machine.When you uninstall Unified RTMT, you choose whether to delete or save the cache.
Note
When you uninstall Unified RTMT on aWindowsVista or 7machine, the followingUser Account Controlpopupmessage appears: “An unidentified programwants to access your computer.”ClickAllow to continueworking with Unified RTMT.
Note
Procedure
Step 1 Close any active sessions of Unified RTMT.Step 2 To uninstall Unified RTMT, perform one of the following actions:
a) For a Windows client, choose Start > Settings > Control Panel > Add/Remove Programsb) For a Red Hat Linux installation with KDE or GNOME client, choose Start > Accessories > Uninstall
Real-time Monitoring tool from the task bar.
Step 3 Finish uninstalling the plug-in.
Cisco Unified Real-Time Monitoring Tool Administration Guide, Release 11.0(1) 27
Getting StartedUninstall Unified RTMT

Cisco Unified Real-Time Monitoring Tool Administration Guide, Release 11.0(1)28
Getting StartedUninstall Unified RTMT

C H A P T E R 3System Performance Monitoring
• Predefined System Objects, page 29
• Voice and Video Monitoring, page 32
• Intercompany Media Services, page 57
• IM and Presence Monitoring, page 59
• Cisco Unity Connection Monitoring, page 65
Predefined System ObjectsUnified RTMT displays information about predefined system objects in the monitoring pane.
The polling rate in each precanned monitoring window remains fixed, and the default value specifies 30seconds. If the collecting rate for the Alert Manager and Collector (AMC) service parameter changes, thepolling rate in the precannedwindow also updates. In addition, the local time of the RTMT client application(not the back-end server) time provides the basis for the time stamp in each chart.
For information about service parameters, see the administration online help.
Tip
To zoom in on the monitor of a predefined object, click and drag the left mouse button over the area ofthe chart in which you are interested. Release the left mouse button when you have the selected area.RTMT updates the monitored view. To zoom out and reset the monitor to the initial default view, pressthe R key.
Tip
The following table provides information about the predefined objects that RTMT monitors.
Cisco Unified Real-Time Monitoring Tool Administration Guide, Release 11.0(1) 29

Table 3: System Categories
DescriptionCategory
Displays information about Virtual Memory usage, CPU usage, Common PartitionUsage, and the alert history log.
To display information about predefined system objects, choose System > SystemSummary.
System Summary
Cisco Unified Real-Time Monitoring Tool Administration Guide, Release 11.0(1)30
System Performance MonitoringPredefined System Objects

DescriptionCategory
• CPU andMemory: Displays information about CPU usage and Virtual memoryusage for the server.To display information about CPU and Virtual memory usage, choose System> Server >CPU andMemory.Tomonitor CPU andmemory usage for specificserver, choose the server from the host drop-down list box.
• Process: Displays information about the processes that are running on the server.To display information about processes running on the system, choose System> Server > Process. To monitor process usage for specific server, choose theserver from the Host drop-down list box.
• Disk Usage: Displays information about disk usage on the server.To display information about disk usage on the system, choose System > Server> Disk Usage. To monitor disk usage for specific server, choose the serverfrom the host drop-down list box.
• Critical Services: Displays the name of the critical service, the status (whetherthe service is up, down, activated, stopped by the administrator, starting,stopping, or in an unknown state), and the elapsed time during which theservices existed in a particular state for the server or for a particular server ina cluster (if applicable).To display information about critical services, choose System > Server >Critical Services, then click the applicable tab:
◦To display system critical services, click the System tab.
◦To display Cisco Unified Communications Manager critical services,click the Voice/Video tab.
You can view the Voice/Video tab only if you select a UnifiedCommunications Manager server from the host drop-down listbox.
Note
◦To display IM and Presence Service critical services, click the IM andPresence tab.
You can view the IM and Presence tab only if you select an IMand Presence server from the host drop-down list box.
Note
◦To display Cisco Unity Connection critical services, click theCisco UnityConnection tab.
◦To monitor critical services for specific server on the tab, choose theserver from the host drop-down list box and click the critical services tabin which you are interested.
If the critical service status indicates that the administrator stopped theservice, the administrator performed a task that intentionally stopped theservice; for example, the service stopped because the administrator backedup or restored Cisco Unified Communications Manager; performed anupgrade; or stopped the service in Cisco Unified Serviceability or theCLI.
If the critical service status displays as unknown state, the systemcannot determine the state of the service.
Note
Server
Cisco Unified Real-Time Monitoring Tool Administration Guide, Release 11.0(1) 31
System Performance MonitoringPredefined System Objects

Voice and Video Monitoring
Predefined Cisco Unified Communications Manager ObjectsUnified RTMT displays information about predefined Cisco Unified Communications Manager objects inthe monitoring pane when you select Voice/Video in the quick launch channel. The tool monitors the predefinedobjects on all servers in an cluster, if applicable.
The polling rate in each precanned monitoring window remains fixed, and the default value specifies 30seconds. If the collecting rate for the AMC (Alert Manager and Collector) service parameter changes, thepolling rate in the precanned window also updates. In addition, the local time of the Unified RTMT clientapplication and not the backend server time, provides the basis for the time stamp in each chart.
For more information about service parameters, see the System Configuration Guide for Cisco UnifiedCommunications Manager or Cisco Unity Connection System Administration Guide.
Tip
To zoom in on the monitor of a predefined object, click and drag the left mouse button over the area ofthe chart in which you are interested. Release the left mouse button when you have the selected area.Unified RTMT updates the monitored view. To zoom out and reset the monitor to the initial default view,press the R key.
Tip
The following table provides information about the predefined object that Unified RTMT monitors.
Table 4: Cisco Unified Communications Manager Categories
DescriptionCategory
Displays registered phones, calls in progress, and active MGCP ports and channels.
To display information about predefined Cisco Unified Communications Managerobjects, choose Voice/Video > Voice and Video Summary.
Voice and VideoSummary
Cisco Unified Real-Time Monitoring Tool Administration Guide, Release 11.0(1)32
System Performance MonitoringVoice and Video Monitoring

DescriptionCategory
• Call Activity: Displays the call activity on Cisco Unified CommunicationsManager, including calls completed, calls attempted, calls in progress, andlogical partition total failures. This includes all servers in the cluster, ifapplicable.To display information about call activities, chooseVoice/Video >Call Process> Call Activity.
• GatewayActivity: Displays gateway activity on Cisco Unified CommunicationsManager, including active ports, ports in service, and calls completed. Thisincludes all servers in the cluster, if applicable.To display information about gateway activities, choose Voice/Video > CallProcess > Gateway Activity. Select the type of gateway interface from theGateway Type drop-down box.
• Trunk Activity: Displays the trunk activity on Cisco Unified CommunicationsManager, including calls in progress and calls completed. This includes allservers in the cluster, if applicable.To display information about trunk activities, choose Voice/Video > CallProcess >TrunkActivity. Select the trunk type in theTrunk Type drop-downbox.
• SDL Queue: Displays SDL queue information, including number of signals inqueue and number of processed signals.To display information about the SDL Queue, choose Voice/Video > CallProcess > SDLQueue. Select the type from the SDLQueue Type drop-downlist box.
• SIPActivity: Displays SIP activity on Cisco Unified CommunicationsManager,including summary requests, summary responses, summary of failure responsesin, summary of failure responses out, retry requests out, and retry responsesout. This includes all servers in the cluster, if applicable.To display information about SIP activities, chooseVoice/Video >Call Process> SIP Activity.
Call Process
Displays all SIP message activity: specifically, the incoming and outgoing calls andsessions that pass through the Cisco Unified Communications Manager. Providesassociated call flow diagram for each SIP transaction.
To display information about Session Trace, choose Voice/Video > Call Process >Session Trace.
Session Trace
Cisco Unified Real-Time Monitoring Tool Administration Guide, Release 11.0(1) 33
System Performance MonitoringPredefined Cisco Unified Communications Manager Objects

DescriptionCategory
Device Summary displays information about the Cisco Unified CommunicationsManager server, including the number of registered phone devices, registered gatewaydevices, registered other station devices, and registered media resource devices. Thisincludes all servers in the cluster, if applicable.
Device Search displays cluster name and device types in a tree hierarchy and allowsyou to query for information about phones and devices.
Phone Summary displays information about the Cisco Unified CommunicationsManager server, including the number of registered phones, registered SIP phones,registered SCCP phones, partially registered phones, and the number of failedregistration attempts. This includes all servers in the cluster, if applicable.
To display information about the number of registered phones, gateways, and mediaresource devices on Cisco Unified Communications Manager, choose Voice/Video> Device > Device Summary.
To monitor other devices, you must perform additional configurationsteps.
Tip
Device
• Cisco TFTP: Displays Cisco TFTP status on the Cisco Unified CommunicationsManager server, including total TFTP requests and total TFTP requests aborted.This includes all servers in the cluster, if applicable.To display information about the Cisco TFTP service, choose Voice/Video >Service > Cisco TFTP.
• Heartbeat: Displays heartbeat information for the Cisco UnifiedCommunications Manager, Cisco TFTP service.To display the heartbeat status of Cisco Unified Communications Managerservers, Cisco TFTP servers, choose Voice/Video > Service > Heartbeat.
• Database Summary: Provides connection information for the server, such asthe change notification requests that are queued in the database, changenotification requests that are queued in memory, the total number of activeclient connections, the number of replicates that have been created, and thestatus of the replication.To display information about the database, choose Voice/Video > Service >Database Summary.
Service
Displays information about the devices and applications that interfaces with the CTIManager.
To display information about CTI Applications, choose Voice/Video > CTI > CTIManager.
To monitor specific CTI types, you must perform additional configuration steps. Seetopics related to monitoring CTI applications, devices, and lines.
CTI
Cisco Unified Real-Time Monitoring Tool Administration Guide, Release 11.0(1)34
System Performance MonitoringPredefined Cisco Unified Communications Manager Objects

DescriptionCategory
• Routing: Displays the total number of Cisco IntercompanyMedia Engine routesmaintained by Cisco Unified Communications Manager.To display information about call activities, choose Voice/Video >Intercompany Media Services > Routing.
• Call Activities: Displays the Cisco Intercompany Media Engine call activity,including the number of calls that were accepted, busy, no answer, and failed.To display information about call activities, choose Voice/Video >Intercompany Media Services > Call Activities.
Intercompany MediaServices
Cisco Unified Communications Manager Summary ViewIn a single monitoring pane, Unified RTMT allows you to monitor information about a Cisco UnifiedCommunicationsManager server or about all servers in a cluster (if applicable). In the CallManager Summarywindow, you can view information about the following predefined objects:
• Registered Phones
• Calls in Progress
• Active Gateway, Ports, and Channels
Call-Processing Activity MonitoringThe Call Process monitoring category monitors the following items:
• Call Activity: You can monitor the number of attempted calls, completed calls, in-progress calls, andlogical partition total failures for a particular server or for an entire cluster (if applicable).
• Gateway Activity: You canmonitor gateway activity for each gateway type. Gateway activity monitoringincludes the number of active ports, the number of ports in service, and the number of calls that werecompleted for each gateway type for a particular server or for an entire cluster (if applicable).
• Trunk Activity: The system monitors trunk activity by trunk type for a particular server or for an entirecluster (if applicable). Trunk activity monitoring includes the number of calls in progress and the numberof calls that were completed for a particular trunk type.
• SDL Queue: SDL queue monitoring monitors the number of signals in the SDL queue and the numberof signals that were processed for a particular signal distribution layer (SDL) queue type. The SDL queuetypes comprise high, normal, low, and lowest queue. You can monitor the SDL queue for a particularserver or for an entire cluster (if applicable).
• SIP Activity: The system displays a summary of SIP requests, SIP responses, total number of failedincoming responses (4xx, 5xx, and 6xx), total number of failed outgoing responses (4xx, 5xx, and 6xx),number of retry requests, and number of retry responses.
• Session Trace: You can search or trace the calls based on the following criteria: Calling Number/URI,Called Number/URI, Start Time, and Duration. RTMT downloads the Call Log file(s) that include the
Cisco Unified Real-Time Monitoring Tool Administration Guide, Release 11.0(1) 35
System Performance MonitoringCisco Unified Communications Manager Summary View

Start Time and Duration, search for the matching calls, list the matching call records, and provide theCall Flow Diagram.
The following table provides information about the call processing objects that RTMT monitors, the alert,thresholds, and defaults. For information about call activity daily reports, see the Cisco Unified ServiceabilityAdministration Guide.
Table 5: Call Processing Category
Alert/Threshold/DefaultMonitored Objects (displayed)
—CallsAttempted, CallsCompleted,CallsInProgress, and Logical PartitionFailures Total for each server and cluster (ifapplicable).
—CallsAttempted, CallsCompleted, andCallsInProgress of each type of MGCPFXS/FXO/PRI/T1CAS/H.323 gateway, aswell as SIP and H.323 Trunks for each serverand cluster (if applicable).
—Channel/Port Status of each MGCPFXS/FXO/PRI/T1CAS gateway.
—SDL Queue activity on each server.
Route-List exhaustedMGCP FXSGateway: Number of In-Serviceand Active ports for each server and cluster(if applicable).
Route-List exhaustedMGCP FXOGateway: Number of In-Serviceand Active ports for each server and cluster(if applicable).
• D-Channel out of service
• Route List exhausted
MGCP PRI Gateway: Number of In-Serviceand Active channels for each server andcluster (if applicable).
Route List exhaustedMGCP T1CAS Gateway: Number ofIn-Service and Active ports for each serverand cluster (if applicable).
Call-Processing LogsThe system accumulates call-processing data in the memory whenever Unified RTMT calls the LogCall API.Every 5 minutes, Unified RTMT logs the data into the file as a single record and cleans the memory.
The system logs data every 5 minutes for the following counters on the basis of the following calculation:
Cisco Unified Real-Time Monitoring Tool Administration Guide, Release 11.0(1)36
System Performance MonitoringCall-Processing Logs

• cmCallsAttempted: Cumulative (difference between last collected value and the first collected value inlast 5 minutes)
• cmCallsCompleted: Cumulative (difference between last collected value and the first collected value inlast 5 minutes)
• cmCallsInProgress: Average of all the values that were collected in last 5 minutes
• gwMGCP_FXS_CallsCompleted: Cumulative (difference between last collected value and the firstcollected value in last 5 minutes)
• gwMGCP_FXO_CallsCompleted: Cumulative (difference between last collected value and the firstcollected value in last 5 minutes)
• gwMGCP_PRI_CallsCompleted: Cumulative (difference between last collected value and the firstcollected value in last 5 minutes)
• gwMGCP_T1_CAS_CallsCompleted: Cumulative (difference between last collected value and the firstcollected value in last 5 minutes)
• gwH323_CallsAttempted: Cumulative (difference between last collected value and the first collectedvalue in last 5 minutes)
• gwH323_CallsInProgress: Average of all the values that were collected in last 5 minutes
• gwH323_CallsCompleted: Cumulative (difference between last collected value and the first collectedvalue in last 5 minutes)
• trunkH323_CallsAttempted: Cumulative (difference between last collected value and the first collectedvalue in last 5 minutes)
• trunkH323_CallsInProgress: Average of all the values collected in last 5 minutes
• trunkH323_CallsCompleted: Cumulative (difference between last collected value and the first collectedvalue in last 5 minutes)
• trunkSIP_CallsAttempted: Cumulative (difference between last collected value and the first collectedvalue in last 5 minutes)
• trunkSIP_CallsInProgress: Average of all the values that were collected in last 5 minutes
• trunkSIP_CallsCompleted: Cumulative (difference between last collected value and the first collectedvalue in last 5 minutes)
• gwMGCP_FXS_PortsInService: Average of all the values that were collected in last 5 minutes
• gwMGCP_FXO_PortsInService: Average of all the values that were collected in lasts 5 minutes
• gwMGCP_PRI_SpansInService: Average of all the values that were collected in last 5 minutes
• gwMGCP_T1_CAS_SpansInService: Average of all the values that were collected in last 5 minutes
• gwMGCP_FXS_ActivePorts: Average of all the values that were collected in last 5 minutes
• gwMGCP_FXO_ActivePorts: Average of all the values that were collected in last 5 minutes
• gwMGCP_PRI_ActiveChannels: Average of all the values that were collected in last 5 minutes
• gwMGCP_T1_CAS_ActiveChannels: Average of all the values that were collected in last 5 minutes
Cisco Unified Real-Time Monitoring Tool Administration Guide, Release 11.0(1) 37
System Performance MonitoringCall-Processing Logs

The AMC service logs the call data in windows Performance tool-compatible CSV format. The header of thelog comprises the time zone information and a set of columns with the previously listed counters for the server.These sets of columns repeat for every server in a cluster, if applicable.
The following filename format of the Call Log applies: CallLog_MM_DD_YYYY_hh_mm.csv.
The first line of each log file comprises the header.
Perform Session TraceCisco Unified Communications Manager captures and logs all SIP message activities, which comprise theincoming and outgoing calls or sessions that pass through it. Unified Communications Manager stores themessages on a per-transaction basis in a new Call Log file, which can be downloaded through RTMT forpostprocessing activity.
RTMT users can search or trace the calls based on the following criteria:
• Calling Number/URI
• Called Number/URI
• Start Time
• Duration
RTMT downloads the Call Log file that includes the Start Time and Duration. The tool searches for thematching calls, lists the matching call records, and provides the SIP message Call Flow Diagram.
You can also save the call logs on your local system. Based on the saved call logs, RTMT can search for thematching calls, list the matching records, and provide SIP Message Call Flow Diagrams.
Before You Begin
Perform the following task:
• Use the enterprise parameter Enable Call Trace Log to enable or disable Call Tracing. For moreinformation about configuring enterprise parameters, see the System Configuration Guide for CiscoUnified Communications Manager .
• The default value for maximum number of Call Trace log files specifies 2000 and the default value formaximum Call Trace log file size specifies 2 MB.
Monitor Real-Time DataFollow this procedure to monitor real-time data using RTMT.
You can search calls based on the following criteria: Calling Number/URI, Called Number/URI, StartTime, and Duration. The search applies to the entire Unified Communications Manager cluster, not justthe local node. If any node fails to collect the trace files, the system displays an error message in the bottompanel and pops up the message prompt to the user.
Note
Cisco Unified Real-Time Monitoring Tool Administration Guide, Release 11.0(1)38
System Performance MonitoringPerform Session Trace

In Calling Number/URI, Called Number/URI, you can use wildcard character "*" to match any numberof characters. For example, a search for 123* fetches numbers like 123, 1234, or 123456.
If you want to search for numbers with a “*” in them, use “\*”. For example, to search for a Called Numberlike 12*45, enter 12\*45 in the search box.
Note
Procedure
Step 1 To display information about Session Trace, from the RTMT menus, choose Voice/Video > Call Process >Session Trace Log View > Real Time Data.The Real Time Data screen appears.
Step 2 Enter the search criteria and Click Run.Click Yes to ignore the error and generate the table, based on the input.
If matching calls are found, the Matching Call pane displays Start Time, Calling DN, Original Called DN,Final Called DN, Calling Device Name, Called Device Name, and Termination Cause Code.
The Called Party Trace feature adds the Calling Device Name and Called Device Namefields.
Note
• Calling and Called device names will not be available for failed calls such as calls made to unreachabledestinations.
• The Termination Cause Code helps to identify the failed calls, and provides the reason for the failure ofthe calls. The Termination Cause Code is displayed in parenthesis followed by description.
• If the call is in progress or if the call trace logging is turned off after the call, the Termination CauseCode column remains blank.
After the call records are displayed in the Matching Calls pane, you can trace calls.
If cause code description is missing or if you want more information about the Termination CauseCodes, refer the CDR cause codes in Cisco Unified Call Details Records Administration Guide.
Note
Monitor Session Trace Data From Local DiskFollow this procedure to monitor session trace data from the logs that are saved on your local disk:
Procedure
Step 1 From the RTMT menus, choose Voice/Video > Call Process > Session Trace Log View > Open fromLocal Disk.
Cisco Unified Real-Time Monitoring Tool Administration Guide, Release 11.0(1) 39
System Performance MonitoringPerform Session Trace

The Open from Local Disk screen appears.
Step 2 In the File Location field, specify the directory where the call log files are saved on your local disk. You canclick Browse to specify the directory path.
Step 3 Check the Enable Time Based Search check box to view call records for a specific duration. If you checkthis check box, you can specify the duration in Duration field. If you do not check this check box, you willnot be able to specify the duration. In such cases, all the calls from the specified Start Time that are presentin the saved log files will be displayed.
Step 4 Enter the search criteria and click Run.In Calling Number/URI, Called Number/URI, you can use the wildcard character ‘*’ to match anynumber of characters. For example, a search for 123* fetches numbers like 123, 1234, 123456.
If you want to search for numbers with a ‘*’ in them, use ‘\*’. For example, to search for a CalledNumber like 12*45, enter 12\*45 in the search box.
Note
If matching calls are found, the Matching Call pane displays Start Time, Calling DN, Original Called DN,Final Called DN, Calling Device Name, Called Device Name, and Termination Cause Code.
The Called Party Trace feature adds the Calling Device Name and Called Device Namefields.
Note
a) Calling and Called device names will not be available for failed calls such as calls made to unreachabledestinations.
b) The Termination Cause Code helps to identify the failed calls, and provides the reason for the failure ofthe calls. The Termination Cause Code is displayed in parentheses followed by description.
c) If the call is in progress or if the call trace logging is turned off after the call, the Termination Cause Codecolumn remains blank.
If cause code description is missing or if you want more information about the Termination CauseCodes, see the CDR cause codes in Cisco Unified Call Details Records Administration Guide.
Note
Trace CallsFollow this procedure to trace call records displayed as per the specified search criteria.
Use this procedure along with “Monitor real-time data” and “Monitor session trace data from local disk.”Note
Procedure
Step 1 Select a call (a row) to trace.By default, the Include SIP Message check box is selected to view the associated SIP protocol messages orcall transactions.
Step 2 To generate the SIP Message Call Flow Diagram, click Trace Call. If you want to stop the generation of thesession information, click Cancel on the progress window.The Analyze Call Diagram window displays the corresponding SIP messages in the Call Flow Diagram.
Step 3 Click the tabs that you want to view. The following tabs are available:a) Call Flow Diagram: Displays the corresponding SIP messages in the Call Flow Diagram.
Cisco Unified Real-Time Monitoring Tool Administration Guide, Release 11.0(1)40
System Performance MonitoringPerform Session Trace

b) Log File: Displays the entire log file.c) SIP Message: Appears only when the Include SIP Message check box is checked. Displays the actual
SIP message that is logged into the SDI log file.
Step 4 Move your mouse over the SIP messages in the Call Flow Diagram. The following table lists the details thatare displayed:
DescriptionField
Displays the IP address of the originating call.Sender
Displays the SIP call ID.GUID
Displays the message type for the corresponding SIP message onto whichyou move your mouse; for example, 200 OK, or 180 Ringing.
Message Label
Displays the IP address of the destination call.Receiver
Displays the name of the device.MAC_ADDRESS
Displays the sequence number to match the actual messages in the SDITrace file.
Message Tag
Displays the type of message.MSG_TYPE
Displays the Correlation ID.Correlation ID
Displays the server time at which the call operation (callsetup/split/join/release) happens.
Timestamp
Detailed SIPMessage: Appears only when the Include SIPMessage check box is checked. Displays the actualSIP message that is logged into the SDL log file.
Message in Log File: Displays the log file which contains the message.
To view the SIP messages that get logged into the SDL log file, perform the following actions:
• Check the Enable SIP Call Processing Trace check box in the Trace Configuration window of CiscoUnified Serviceability (Trace >Configuration). SeeCisco Unified Serviceability Administration Guidefor more information.
• Set the trace level to any one of the following: State Transition, Significant, Arbitrary or Detailed.
If you are monitoring the session trace data from the logs stored on your local disk, the detailed SIPmessage will be available only if the SDL/SDI logs are present in the parent directory of the call logs.
Note
Step 5 Click Save.If you are monitoring real-time data, the Call Flow Diagram is saved as index.html in the specified folderalong with the SDL files which contain the SIP messages. You can email the files to the Technical AssistanceCenter (TAC). For more information on monitoring real-time data, see “Monitor real-time data.” The SIPmessages in the saved Call Flow Diagram appear as hyperlinks. When you click a SIP message, the detailedSIP message along with the following details is displayed in a new window.
Cisco Unified Real-Time Monitoring Tool Administration Guide, Release 11.0(1) 41
System Performance MonitoringPerform Session Trace

DescriptionField
Displays the IP address of the originating call.Sender
Displays the SIP call ID.GUID
Displays the message type for the corresponding SIP message onto whichyou move your mouse; for example, 200 OK, or 180 Ringing.
Message Label
Displays the IP address of the destination call.Receiver
Displays the name of the device.MAC_ADDRESS
Displays the sequence number to match the actual messages in the SDITrace file.
Message Tag
Displays the type of message.MSG_TYPE
Displays the Correlation ID.Correlation ID
Displays the server time at which the call operation (callsetup/split/join/release) happens.
Timestamp
If you open logs for Cisco Unified Communications Manager 8.5(1) or 8.6(1) using Open from Local Diskoption and save the ladder diagram , the SIP messages, the SDI log files that contain the SIP messages andSDL Log files for a duration of from 5 minutes before the start of the call to 5 minutes after the start of thecall will be saved. If you save logs from Cisco Unified Communications Manager 9.0(1) or later, the SDLlog files that contain the call details are saved alongwith index.html and the SIPmessages. For more informationabout monitoring the session trace data from the logs saved to your local disk, see “Monitor session trace datafrom local disk.”
If the files are zipped, extract the zipped files to a local folder and open them to view the images.Note
You can perform the following actions:
a) To view the online help, click Help.b) To exit the Analyze Call Diagram screen, click Close.c) To navigate to the previous page, click Previous Messages.d) To navigate to the next page, click Next Messages.
PreviousMessages orNextMessages is enabled only when themessage size exceeds a threshold.Note
The SessionManager logs the call data in new log files. These new log files are located in the following folder:/var/log/active/cm/trace/ccm/calllogs/.
The Call Log name has the following filename pattern: calllogs_dddddddd.txt.gz.
Detailed SIP messages are logged into SDI traces.
The Call Logs include the following message types:
• Call Control: Writes call information at call setup, split, join, and release.Timestamp|MessageType (CC)|Operation (SETUP/SPLI/JOIN/RELEASE)|CI for one leg (aCI)|CIfor other leg (bCI)|calling DN|Orig Called DN|Final Called DN
Cisco Unified Real-Time Monitoring Tool Administration Guide, Release 11.0(1)42
System Performance MonitoringPerform Session Trace

• Device Layer: Writes metadata information that relates to message from or to the device.Timestamp|MessageType (SIPL/SIPT)|My leg CI|Protocol(tcp/ucp)|Direction (IN/OUT)|localip|local port|device name|device ip|device port|Correlation id|Message Tag|SIP CallID|SIP method
The following limitations apply when the Call Flow Diagram is generated:
• Search does not show incomplete calls.
Example:
When the user picks up the handset and hangs up without dialing the complete DN, it will not be listedin the search results.
• The Call Flow Diagram does not show some SIP messages in the following scenarios:
◦Conference calls involving more than three parties.
◦A call leg is used to invoke a feature alone.
Example:
Phone B and Phone C are in the same pickup group.
1 User A calls Phone B.
2 User C lifts up the Phone C handset.
3 User C presses the PickUp softkey to pickup the call.
SIP messages exchanged in Step b are not displayed in the Call Flow Diagram
In these cases, a RELEASE message is logged in the call logs without a corresponding SETUP message.
Services MonitoringThe Service monitoring category monitors the activities of Cisco TFTP requests, database activities, andheartbeat of the server or of different servers in a cluster (if applicable).
The Cisco TFTP service builds and serves files that are consistent with the Trivial File Transfer Protocol,which is a simplified version of the File Transfer Protocol (FTP). Cisco TFTP builds configuration files andserves embedded component executables, ringer files, and device configuration files. You can view the totalCisco TFTP requests, requests not found, and requests that were aborted.
Unified RTMT monitors the heartbeat of Cisco Unified Communications Manager and Cisco TFTP servicesfor the server or for different servers in a cluster (if applicable). The heartbeat acts as an indicator of the lifeof whatever it is monitoring. When the heartbeat is lost, a blinking icon appears in the lower right corner ofthe RTMT window. To find when the heartbeat loss was detected, click the blinking icon. An email can notifyyou of the heartbeat loss, if you configure the system to do so.
The database summary provides connection information for the server or for each server in a cluster (ifapplicable), such as the change notification requests that are queued in the database, change notificationrequests that are queued in memory, the total number of active client connections, the number of devices thatare queued for a device reset, replicates created, and replication status.
Cisco Unified Real-Time Monitoring Tool Administration Guide, Release 11.0(1) 43
System Performance MonitoringServices Monitoring

For information about daily reports for CTI and Cisco TFTP usage statistics, see theCisco Unified ServiceabilityAdministration Guide.
The following table provides information about the service objects that RTMTmonitors, the alert, thresholds,and defaults.
Table 6: Services Category
Alert/Threshold/DefaultMonitored Objects (Displayed)
N/ANumber of open devices, lines, CTIconnections, and active Cisco UnifiedCommunicationsManager links for each CTIManager.
N/ATotalTftpRequests andTotalTftpRequestsAborted for eachCisco TFTP server.
• Connection failed.
• Replication failed.
Connection and replication status for eachDirectory server.
• Cisco Unified CommunicationsManager heartbeat ratespecifies <0.x. Default specifies 0.5.
• Cisco TFTP heartbeat rate specifies <0.x. Defaultspecifies 0.5.
Heartbeat rate for Cisco CallManager,Cisco TFTP services.
Service LogsThe service data accumulates in the memory whenever RTMT calls the LogService API. Every five minutes,RTMT logs the data into the file as a single record and cleans the memory.
The system logs data every five minutes for the following counters, based on the following calculation:
• ctiOpenDevices: Average of all the values that were collected in last five minutes
• ctiLines: Average of all the values that were collected in last five minutes
• ctiConnections: Average of all the values that were collected in last five minutes
• ctiActiveCMLinks: Average of all the values that were collected in last five minutes
• tftpRequests: Cumulative (difference between last collected value and the first collected value in lastfive minutes)
• tftpAbortedRequests: Cumulative (difference between last collected value and the first collected valuein last five minutes)
Cisco Unified Real-Time Monitoring Tool Administration Guide, Release 11.0(1)44
System Performance MonitoringService Logs

TheAMC service logs the service data in csv format. The header of the log comprises the time zone informationand a set of columns with the counters that were previously listed for a server. These sets of columns repeatfor every server in a cluster, if applicable.
The following filename format of the Service Log applies: ServiceLog_MM_DD_YYYY_hh_mm.csv.
The first line of each log comprises the header.
Device LogsThe device data accumulates in the memory whenever RTMT calls the LogDevice API. Every five minutes,RTMT logs the data into the file as a single record and cleans the memory.
The data is logged every five minutes for the following counters based on the following calculation:
• gatewayDevicesFXS: Average of all the values that were collected in last 5 minutes
• gatewayDevicesFXO: Average of all the values that were collected in last 5 minutes
• gatewayDevicesPRI: Average of all the values that were collected in last 5 minutes
• gatewayDevicesT1: Average of all the values that were collected in last 5 minutes
• gatewayDevicesH323: Average of all the values that were collected in last 5 minutes
The AMC service logs the device data in CSV format. The header of the log comprises the time zoneinformation and a set of columns with the previously listed counters for a server. These sets of columns repeatfor every server in a cluster, if applicable.
The following filename format of the Device Log applies: DeviceLog_MM_DD_YYYY_hh_mm.csv.
The first line of each log file comprises the header.
Device Monitoring
Device MonitoringThe Device monitoring category provides a summary of devices, device search capability, and a summary ofphones.
For information about daily reports on registered devices, see the Cisco Unified Serviceability AdministrationGuide.
The following table provides information about the device objects that Unified RTMT monitors, the alert,thresholds, and defaults, and what kind of reports that Unified RTMT generates for those devices.
Table 7: Devices Category
Alert/Threshold/DefaultMonitored Objects (Displayed)
Total number of registered phones drops byX% in consecutivepolls. Default specifies 10%.
Number of registered phones for each serveror for all servers in a cluster (if applicable).
Cisco Unified Real-Time Monitoring Tool Administration Guide, Release 11.0(1) 45
System Performance MonitoringDevice Logs

Alert/Threshold/DefaultMonitored Objects (Displayed)
For Cisco Unified Communications Manager:
• (Warning) Clusterwide total number of registeredgateways decreased in consecutive polls.
• (Informational) Clusterwide total number of registeredgateways increased in consecutive polls.
Number of registered gateways on each serveror for all servers in a cluster (if applicable).
For Unified Communications Manager:
• (Warning) Clusterwide total number of registeredmediadevices decreased in consecutive polls.
• (Informational) Clusterwide total number of registeredmedia devices increased in consecutive polls.
• Media List exhausted.
Number of registered media devices on eachserver or for all servers in a cluster (ifapplicable).
The Device Search menu comprises the following items on which you can search: phones, gateway devices,H.323 devices, CTI devices, voice-messaging devices, media resources, hunt lists, and SIP trunks.
You can search on any device in the Unified Communications Manager system and choose the status of thedevices, including registered, unregistered, rejected, any status, and devices that are only configured in thedatabase. You can also search by any model, or a specific device model, and set up criteria that include severaldifferent attributes. Within the phone search, you can also search on the basis of phone protocol.
Unified RTMT queries RIS to find the matching device. Results display in a table with a row for each matcheddevice, a column for each of the specified attributes, and a time stamp of the device that has been opened orclosed and the application that controls the device media.
If you have Unified Communications Manager clusters and you search for a device by choosing the AnyStatus option, Unified RTMT does not display a snapshot of the matched device type, but rather it displaysdata for that device type from the RIS database for all specified Unified Communications Manager serversfor a period of time. As a result, you may see multiple entries of a device with multiple statuses (for example,Registered or Unregistered) in Unified RTMT.
When you see multiple entries of a device, the current status of the device reflects the entry that has the latesttime stamp. By configuring the RIS Unused Cisco CallManager Device Store Period service parameter forthe Cisco RIS Data Collector service in System Configuration Guide for Cisco Unified CommunicationsManager , you can configure the period of time that the RIS database keeps information on unregistered orrejected device. See the System Configuration Guide for Cisco Unified Communications Manager for moreinformation about configuring service parameters.
To find the matching item, Unified RTMT requires that you activate the Cisco RIS Data Collector servicein the Service Activation window.
Tip
Results display in a table with a row for each matched device, a column for each of the specified attributes,and a time stamp of the device that has been opened or closed and the application that controls the devicemedia.
Cisco Unified Real-Time Monitoring Tool Administration Guide, Release 11.0(1)46
System Performance MonitoringDevice Monitoring

The phone summary provides information about the number of registered phones, phones that are runningSIP, phones that are running SCCP, partially registered phones, and the number of failed registration attempts.
Find Specific Devices to MonitorFollow this procedure to monitor data for the following device types:
• Phones
• Gateway Devices
• H.323 Devices
• CTI Devices
• Voicemail Devices
• Media Resources
• Hunt List
• SIP Trunk
Procedure
Step 1 Perform one of the following tasks:a) On the Quick Launch Channel, perform the following steps:
1 Click Voice/Video.
2 In the tree hierarchy, double-click Device.
3 Click the Device Search icon.
b) Choose Voice/Video > Device > Device Search > Open Device Search and select the device type; forexample, Phone, Gateway, Hunt List, and so on. A device selection window displays where you enter thesearch criteria.TheDevice Searchwindow displays the cluster names (if applicable) and tree hierarchy that lists all devicetypes that you can monitor.
After you display the Device Search or CTI Search panes, you can right-click a device type andchoose CCMAdmin to go to Cisco Unified Communications Manager Administration.
Tip
Step 2 To find all devices or to view a complete list of device models from which you can choose, right-click thecluster name and chooseMonitor.
Step 3 To monitor a specific device type, right-click or double-click the device type from the tree hierarchy.If you right-click the device type, you must chooseMonitor for the device selection window todisplay.
Note
Step 4 In the Select device with status window, click the radio button that applies.Step 5 In the drop-down list box next to the radio button that you clicked, choose Any CallManager or a specific
Cisco Unified Communications Manager server for which you want the device information to display.In the remaining steps, you can choose the < Back,Next >, Finish, orCancel buttons.Tip
Cisco Unified Real-Time Monitoring Tool Administration Guide, Release 11.0(1) 47
System Performance MonitoringDevice Monitoring

Step 6 Click the Next > button.Step 7 In the Select Device with Download Status pane, click the radio button that applies, and click Next.Step 8 In the Search by device model pane, click the radio button that applies.
If you chose Device Model, choose the device type for which you want the device information todisplay.
Tip
Step 9 Click Next.Step 10 In the Search with name pane, click the radio button that applies and enter the appropriate information in the
corresponding fields, if required.If you enter the IPv6 address, the IP Subnet does notapply.
Note
Step 11 Click Next.Step 12 In the Monitor following attributes pane, check one or all of the search attributes.Step 13 Click Finish.
Some devices may not provide information for all search criteria. For example, if you select to monitora phone for active load, inactive load, download status, or download reason, the download statusresults display Unknown for phone models that cannot provide this information.
Note
View Phone InformationYou can view information about phones that display in the RTMT device monitoring pane. This sectiondescribes how to view phone information.
Procedure
Step 1 Find and display the phone in the RTMT device monitoring pane.Step 2 Perform one of the following tasks:
a) Right-click the phone for which you want information to display and choose Open.b) Click the phone and choose Device > Open.
The Device Information window appears.
Step 3 In the Select Device with Status pane, click the radio button that applies.Step 4 In the drop-down list box next to the radio button that you clicked, choose Any CallManager or a specific
Cisco Unified Communications Manager server for which you want the device information to display.Step 5 In the Search By Device Model pane, choose the phone protocol that you want to display.Step 6 Click the Any Model or Device Model radio button.
If you click the Device Model radio button, choose a phone model that you want to display.
Step 7 Click Next.Step 8 In the Search With Name pane, click the radio button that applies and enter the appropriate information in the
corresponding fields.Step 9 In the Monitor following attributes pane, check one or all of the search attributes.Step 10 Click Finish.
The Device Information window appears. For more information about the device, choose any field thatappears in the left pane of the window.
Cisco Unified Real-Time Monitoring Tool Administration Guide, Release 11.0(1)48
System Performance MonitoringDevice Monitoring

View Device PropertiesYou can view the properties of devices that appear in the RTMT device monitoring pane. Follow this procedureto view device properties.
Procedure
Step 1 Find and display the device in the RTMT device monitoring pane.Step 2 Perform one of the following tasks:
• Right-click the device for which you want property information and choose Properties.
• Click the device for which you want property information and choose Device > Properties.
Step 3 To display the device description information, click the Description tab.Step 4 To display other device information, click the Other Info tab.
Set Up Polling Rate for Devices and Perfmon CountersCiscoUnified CommunicationsManager polls counters, devices, and gateway ports to gather status information.In the RTMT monitoring pane, you configure the polling intervals for the performance monitoring countersand devices.
High-frequency polling rate may adversely affect Cisco Unified Communications Manager performance.The minimum polling rate for monitoring a performance counter in chart view is 5 seconds; the minimumrate for monitoring a performance counter in table view is 1 second. The default value for both is 10 seconds.
Note
The default value for devices is 10 minutes.Note
Follow this procedure to update the polling rate:
Procedure
Step 1 Display the device or performance monitoring counter in the RTMT monitoring pane.Step 2 Click the device and choose Edit > Polling Rate.Step 3 In the Polling Interval pane, specify the time that you want to use.Step 4 Click OK.
Cisco Unified Real-Time Monitoring Tool Administration Guide, Release 11.0(1) 49
System Performance MonitoringDevice Monitoring

CTI Application, Device, and Line MonitoringThe CTI category monitors CTI Manager activities and provides CTI search capability. With CTI Manager,you can monitor the number of open devices, lines, and CTI connections.
You can specify criteria for the CTI applications, devices, and lines that include CTI status, device name,application pattern, and attributes.
To find the matching item, RTMT requires that you activate the Cisco RIS Data Collector service in theService Activation window in Cisco Unified Serviceability.
Tip
Results display in a table with a row for each matched device, a column for each of the specified attributes,and a time stamp of the device that has been opened or closed and the application that controls the devicemedia.
View CTI Manager InformationFollow this procedure to display a chart of open devices, lines, and CTI connections for each server or foreach server in a cluster (if applicable).
Procedure
Step 1 Click Voice/Video in the quick launch channel.Step 2 Double-click CTI.Step 3 Click the CTI Manager icon.
Find CTI Applications to MonitorPerform the following procedure to find specific CTI applications to monitor:
Procedure
Step 1 Perform one of the following tasks:
• On the Quick Launch Channel, perform the following steps:
1 Click Voice/Video.
2 In the tree hierarchy, double-click CTI.
3 Click the CTI Search icon.
Cisco Unified Real-Time Monitoring Tool Administration Guide, Release 11.0(1)50
System Performance MonitoringCTI Application, Device, and Line Monitoring

• Choose Voice/Video > CTI > CTI Search > CTI Applications. The selection window appears whereyou can enter the search criteria.
Step 2 From the CTI Manager drop-down list box, choose the CTI Manager that you want to monitor.Step 3 From the Applications Status drop-down list box, choose the application status.Step 4 Click Next.Step 5 In the Application Pattern pane, click the radio button that applies.Step 6 Enter the information in the field for the radio button that you clicked; for example, if you clicked the IP
Subnet radio button, enter the IP address and the subnet mask in the field.If you enter the IPv6 address, the IP Subnet does notapply.
Note
Step 7 Click Next.Step 8 In theMonitor following attributes window, check one or all of the check boxes for the attributes that you
want to monitor.Step 9 Click Finish.
The applications monitoring pane displays the information that you choose.
Find CTI Devices To MonitorFollow this procedure to find specific CTI devices to monitor.
Procedure
Step 1 Perform one of the following tasks:
• On the Quick Launch Channel, perform the following steps:
1 Click Voice/Video.
2 In the tree hierarchy, double-click CTI.
3 Click the CTI Search icon.
• Choose Voice/Video > CTI > CTI Search > CTI Devices. The selection window appears where youcan enter the search criteria.
If you right-click the option, chooseMonitor.
Tip
Step 2 From the CTI Manager drop-down list box, choose the CTI Manager that you want to monitor.Step 3 From the Devices Status drop-down list box, choose the device status.Step 4 In the Devices pane, click the radio button that applies.
If you chose Device Name, enter the device name in thefield.
Tip
Cisco Unified Real-Time Monitoring Tool Administration Guide, Release 11.0(1) 51
System Performance MonitoringCTI Application, Device, and Line Monitoring

Step 5 Click Next.Step 6 In the Application Pattern window, click the radio button that applies.Step 7 Enter the information in the field for the radio button that you clicked; for example, if you clicked IP Subnet,
enter the IP address and subnet mask in the field.If you enter the IPv6 address, the IP Subnet does notapply.
Note
Step 8 Click Next.Step 9 In theMonitor following attributes window, check one or all check boxes for the attributes that you want
to monitor.Step 10 Click Finish.
The devices monitoring pane displays the information that you chose.
Find CTI Lines To MonitorFollow this procedure to find specific CTI lines to monitor.
Procedure
Step 1 Perform one of the following tasks:
• On the Quick Launch Channel, perform the following steps:
1 Click Voice/Video.
2 In the tree hierarchy, double-click CTI.
3 Click the CTI Search icon.
• Choose Voice/Video > CTI > CTI Search > CTI Lines. The selection window appears where you canenter the search criteria.
If you right-click the option, chooseMonitor.
Tip
Step 2 From the CTI Manager & Status drop-down list box, choose the CTI manager that you want to monitor.Step 3 From the Lines Status drop-down list box, choose the status.Step 4 In the Devices pane, click the radio button that applies.
If you chose Device Name, enter the device name in thefield.
Tip
Step 5 In the Lines pane, click the radio button that applies:If you chose Directory Number, enter the directory number in thefield.
Note
Step 6 Click Next.Step 7 In the Application Pattern pane, click the radio buttons apply:Step 8 Enter the information in the field for the radio button that you clicked; for example, if you clicked IP Subnet,
enter the IP address and subnet mask in the field.
Cisco Unified Real-Time Monitoring Tool Administration Guide, Release 11.0(1)52
System Performance MonitoringCTI Application, Device, and Line Monitoring

If you enter the IPv6 address, the IP Subnet does notapply.
Note
Step 9 Click Next.Step 10 In theMonitor following attributes window, check one or all check boxes for the attributes that you want
to monitor.Step 11 Click Finish.
The lines monitoring pane displays the information that you choose.
View Application InformationYou can view the application information for selected devices such as the Cisco Unified IP Phone, CTI port,and CTI route point. Follow this procedure to view application information.
Procedure
Step 1 Find and display the devices in the RTMT monitoring pane.Step 2 Perform one of the following tasks:
• Right-click the device for which you want application information; for example, CTI; then, chooseAppInfo.
• Click the device for which you want application information and choose Device > App Info.
TheApplication Informationwindow displays the CTImanager server name, application ID, user ID, applicationIP address, application status, app time stamp, device time stamp, device name, and CTI device open status.
Step 3 To view updated information, click Refresh. To close the window, click OK.
Access Learned Pattern and SAF Forwarder Reports for Call Control DiscoveryLearned Pattern reports and Service Advertisement Framework (SAF) forwarder reports support the CallControl Discovery feature. When you configure the call control discovery feature, Cisco UnifiedCommunications Manager advertises itself and its hosted DN patterns to other remote call-control entitiesthat use the SAF network. Likewise, these remote call-control entities advertise their hosted DN patterns,which Unified Communications Manager can learn and insert in digit analysis. For more information aboutthe call control discovery feature, see “Call Control Discovery” in the Feature Configuration Guide for CiscoUnified Communications Manager .
The learned pattern may be repeated in the report because the learned pattern may be coming from adifferent source; for example, it may be coming from a different IP address.
Note
Learned Pattern reports include such information as learned pattern name, time stamp, and reachability statusfor the pattern. See the following table.
Cisco Unified Real-Time Monitoring Tool Administration Guide, Release 11.0(1) 53
System Performance MonitoringAccess Learned Pattern and SAF Forwarder Reports for Call Control Discovery
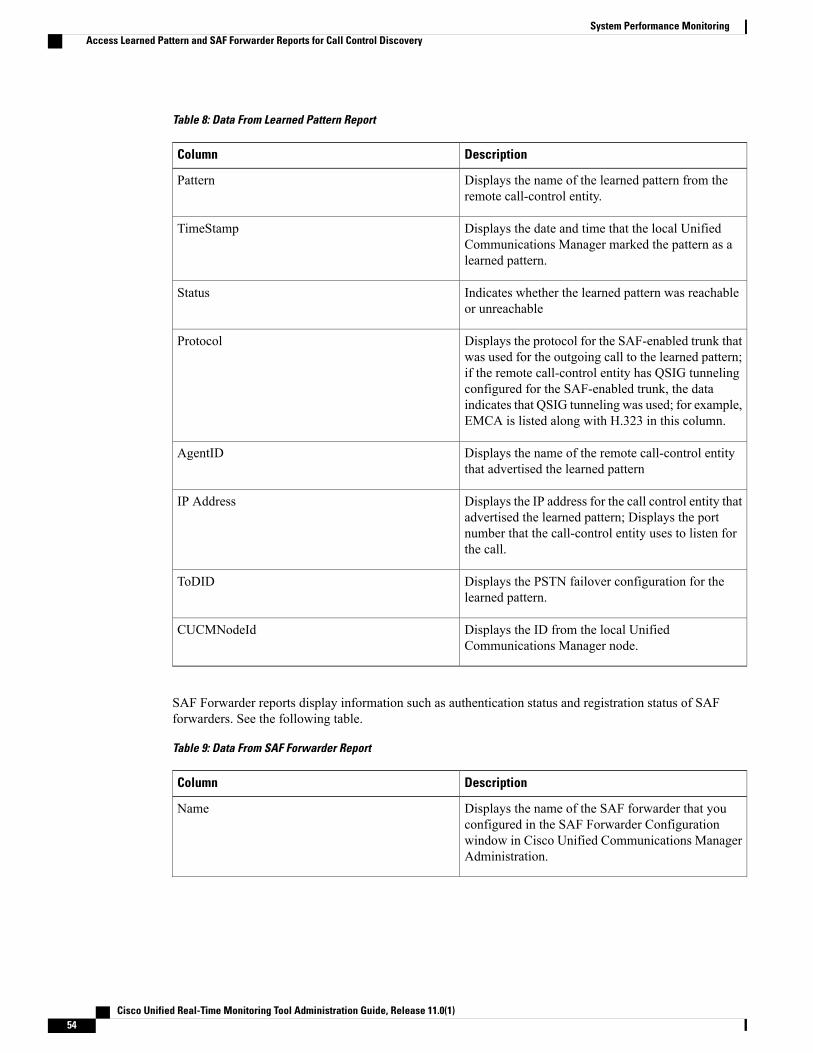
Table 8: Data From Learned Pattern Report
DescriptionColumn
Displays the name of the learned pattern from theremote call-control entity.
Pattern
Displays the date and time that the local UnifiedCommunications Manager marked the pattern as alearned pattern.
TimeStamp
Indicates whether the learned pattern was reachableor unreachable
Status
Displays the protocol for the SAF-enabled trunk thatwas used for the outgoing call to the learned pattern;if the remote call-control entity has QSIG tunnelingconfigured for the SAF-enabled trunk, the dataindicates that QSIG tunneling was used; for example,EMCA is listed along with H.323 in this column.
Protocol
Displays the name of the remote call-control entitythat advertised the learned pattern
AgentID
Displays the IP address for the call control entity thatadvertised the learned pattern; Displays the portnumber that the call-control entity uses to listen forthe call.
IP Address
Displays the PSTN failover configuration for thelearned pattern.
ToDID
Displays the ID from the local UnifiedCommunications Manager node.
CUCMNodeId
SAF Forwarder reports display information such as authentication status and registration status of SAFforwarders. See the following table.
Table 9: Data From SAF Forwarder Report
DescriptionColumn
Displays the name of the SAF forwarder that youconfigured in the SAF Forwarder Configurationwindow in Cisco Unified Communications ManagerAdministration.
Name
Cisco Unified Real-Time Monitoring Tool Administration Guide, Release 11.0(1)54
System Performance MonitoringAccess Learned Pattern and SAF Forwarder Reports for Call Control Discovery

DescriptionColumn
Displays the description for the SAF forwarder thatyou configured in the SAF Forwarder Configurationwindow in Cisco Unified Communications ManagerAdministration. If None displays, you did not entera description for the SAF forwarder.
Description
Displays the IP address for the SAF forwarder, asconfigured in the SAF Forwarder Configurationwindow in Cisco Unified Communications ManagerAdministration.
IP Address
Indicates the port number that Cisco UnifiedCommunicationsManager uses to connect to the SAFforwarder; by default, Unified CommunicationsManager uses 5050.
Port
Indicates whether the SAF forwarder is classified asthe primary or backup SAF forwarder.
Type
Indicates whether Unified CommunicationsManagercan connect to the SAF forwarder.
Connection Status
Indicates that Cisco Unified CommunicationsManager used digest authentication to connect to theSAF forwarder.
Authentication Type
Indicates whether the Cisco Unified CommunicationsManager is registered to the SAF forwarder.
Registration Status
Displays the date and time when the UnifiedCommunications Manager last registered with theSAF forwarder.
Time Last Registered
Displays the total number of CCD advertising andrequesting services that are registered to the SAFforwarder.
No of Registered Applications
Displays the number of times that the call-controlentity, in this case, the Unified CommunicationsManager, has attempted to connect to the SAFforwarder.
No of Connection Re-Attempts
RTMT allows you to search based on different criteria; for example, if you specify a search for the remotecall-control entity, all the learned patterns display for the remote call-control entity.
To access the Learned Patterns or SAF Forwarder reports in RTMT, perform the following procedure.
Cisco Unified Real-Time Monitoring Tool Administration Guide, Release 11.0(1) 55
System Performance MonitoringAccess Learned Pattern and SAF Forwarder Reports for Call Control Discovery

Procedure
Step 1 To access the report, perform one of the following actions:a) For Learned Patterns: From the RTMT menus, choose Voice/Video > Report > Learned Pattern. Or,
Click the Voice/Video tab; then, click Learned Pattern.b) For SAF Forwarders: From the RTMT menus, choose Voice/Video > Report > SAF Forwarders. Or,
click the Voice/Video tab; then, click SAF Forwarders.
Step 2 Choose the node from the Select a Node drop-down list box.For learned pattern reports, if the Cisco CallManager Service is running but the CCD requesting service isnot running on that node, a message displays that the CCD Report Service is not working after you choosethe node. If the CCD requesting service is not active on the node that you choose, the report displays as empty.
Step 3 Review the data in the report.See the Data from Learned Pattern Report table and the Data from SAF Forwarder Report table for descriptionsof the items that were reported.
Step 4 After the data appears, if you want to filter the results based on specific criteria, click the Filter button; specificthe criteria that you want to search, click Apply and then OK.
Step 5 To display the most current results, click Refresh.Step 6 If you want to search on a specific string in the data, click the Find button, enter the string, then, click Find
Next.Step 7 If you want to save the results, click Save, and choose either XML or Text, depending on how you want to
save the results. Browse to the location where you want to save the data, name the file that you want to save;then, click Save.
Access Called Party Trace ReportCalled Party Trace allows you to configure a directory number or list of directory numbers that you want totrace. You can request on-demand tracing of calls using the Session Trace Tool.
The Called Party Trace feature provides information on the calling party number in addition to the calledparty number within a node. You can use the information from each node to trace a call back to the originator.
You must be an authorized administrator to access the directory number logs. To grant authorization to aspecific role using MLA, the “Called Party Tracing” resource must have read permission enabled for therole.
Note
To access the Called Party Trace report in the Real-Time Monitoring Tool, follow these steps:
Procedure
Step 1 From the RTMTmenu, chooseVoice/Video > Callprocess > Called Party Trace. Or, Click theVoice/Videotab; then, click Called Party Trace.
Step 2 Select the start time of the report using the drop-down box.
Cisco Unified Real-Time Monitoring Tool Administration Guide, Release 11.0(1)56
System Performance MonitoringAccess Called Party Trace Report

The start time cannot be older than five years from the currentdate.
Note
Step 3 The report shows the following information:
• Start time
• Calling directory number
• Original called directory number
• Called directory number
• Calling device name
• Called device name
When 5 megabytes of trace file entries have been written to the log files being accessed by RTMT,the oldest log information is overwritten by new trace entries as they are recorded. The RTMT listsa maximum of 500 entries for any given search.
Note
Intercompany Media Services
IME Service MonitoringThe IME Service category monitors the following items:
• Network Activity: Displays the activity on the Cisco Unified Communications Manager that relates toCisco Intercompany Media Engine. The Network Activity object displays these charts:
◦IME Distributed Cache Health: Displays the health of the IME distributed cache based on theIMEDistributedCacheHealth counter for the IME Server performance object.
◦IME Distributed Node Count: Displays an approximation of the number of nodes in the IMEdistributed cache, based on the value of the IMEDistributedCacheNodeCount counter for the IMEServer performance object. Because each physical Cisco Intercompany Media Engine servercontains multiple nodes, the number that displays in the chart does not indicate the number ofphysical Cisco Intercompany Media Engine servers that participate in the IME distributed cache.
◦Internet BW Received: Displays the amount of bandwidth in Kbits/s that the Cisco IME serviceuses for incoming Internet traffic and represents the InternetBandwidthRecv counter for the IMEServer performance object.
◦Internet BW Send: Displays the amount in Kbits/s that the Cisco IME service uses for outgoingInternet traffic and represents the InternetBandwidthSend counter for the IME Server performanceobject.
◦IME Distributed Cache Stored Data Records: Displays the number of IME Distributed Cacherecords that the Cisco Intercompany Media Engine server stores and represents theIMEDistributedCacheStoredData counter for the IME Server performance object.
To display information about network activity, choose Cisco IME Service > Network Activity.
Cisco Unified Real-Time Monitoring Tool Administration Guide, Release 11.0(1) 57
System Performance MonitoringIntercompany Media Services

• Server Activity: Allows you to monitor the activity on the Cisco Intercompany Media Engine server.The Server Activity object displays these charts:
◦Number of Registered Clients: Displays the current number of clients that connect to the CiscoIME service and represents the value of the ClientsRegistered counter for the IME Serverperformance object.
◦IME Distributed Cache Quota: Indicates the number of individual DIDs that can be written intothe IME Distributed Cache, by Cisco Cisco Unified Communications Managers attached to thisIME server. This number is determined by the overall configuration of the IMEDistributed Cache,and the IME license installed on the IME server.
◦IME Distributed Cache Quota Used: Indicates the total number of unique DID numbers that havebeen configured, to be published through enrolled patterns for Intercompany Media Services, byCisco Cisco Unified Communications Managers currently attached to this IME server.
◦Terminating VCRs: Indicates the total number of IME voice call records that are stored on theCisco IME server for the terminating side of a call. These records can be used for validation oflearned routes.
◦Validations Pending: Displays the number of pending validations on the Cisco IME service as wellas the threshold for validations. This chart represents the ValidationsPending counter for the CiscoIME Server performance object.
To display information about server activity, choose Cisco IME Service > Server Activity.
IME System Performance MonitoringThe IME System Performance monitoring category provides the SDL Queue object that monitors the numberof signals in the SDL queue and the number of signals that were processed for a particular signal distributionlayer (SDL) queue type. The SDL queue types comprise high, normal, low, and lowest queue. You can monitorthe SDL queue for a particular server or for an entire cluster (if applicable).
To display information about the SDL Queue, choose Cisco IME Service > SDL Queue. Select the typefrom the SDL Queue Type drop-down list box.
Monitor Intercompany Media Services
The polling rate in each precanned monitoring window remains fixed, and the default value specifies 30seconds. If the collecting rate for the AMC (Alert Manager and Collector) service parameter changes, thepolling rate in the precanned window also updates. In addition, the local time of the RTMT clientapplication, not the back end server time, provides the basis for the time stamp in each chart.
Tip
To zoom in on the monitor of a predefined object, click and drag the left mouse button over the area ofthe chart that interests you. Release the left mouse button when you have the selected area. RTMT updatesthe monitored view. To zoom out and reset the monitor to the initial default view, press the R key.
Tip
The Intercompany Media Services monitoring category monitors the following items:
Cisco Unified Real-Time Monitoring Tool Administration Guide, Release 11.0(1)58
System Performance MonitoringIME System Performance Monitoring
• Routing: Displays the total number of Cisco Intercompany Media Engine routes that Cisco UnifiedCommunications Manager maintains. This total includes the following routes:
◦Learned routes that represent the phone numbers that the Cisco IntercompanyMedia Engine clientlearned and that exist in the Cisco Unified Communications Manager routing tables
◦Unique domains of peer enterprises for which Cisco Intercompany Media Engine routes exist
◦Published routes that represent the number of direct inward dialing numbers (DIDs) that werepublished successfully to the IME distributed hash table across all Cisco Intercompany MediaEngine services
◦Rejected routes that represent the number of learned routes that were rejected because theadministrator blocked them.
These charts represent the following performance counters for the Cisco IME Client performanceobject: RoutesLearned, DomainsUnique, RoutesPublished, and RoutesRejected.
To display information about routing, choose Voice/Video > Cisco IME Client > Routing.
• Call Activities: Allows you to monitor the total number of Cisco IntercompanyMedia Engine calls. Thistotal includes the following types of calls:
◦Calls that were attempted (including calls that were accepted, busy, no answer, and failed)
◦Calls that were received
◦Calls that were set up (that is, made by Cisco Unified Communications Manager and accepted bythe remote party)
◦Calls that were accepted (that is, received by Cisco Unified CommunicationsManager and answeredby the called party)
◦Calls that completed fallback to the PSTN
◦Calls that did not successfully fall back to the PSTN.
These charts represent the following performance counters for the Cisco IME Client performance object:CallsAttempted, CallAccepted, CallsReceived, CallsSetup, IMESetupsFailed, and FallbackCallsFailed.
To display information on call activities, choose Voice/Video > Cisco IME Client > Call Activities.
IM and Presence Monitoring
IM and Presence and Cisco Jabber summary monitoringThe Real-TimeMonitoring Tool provides a set of important performance counters that assist you in monitoringthe overall performance of the IM and Presence service and Cisco Jabber. The IM and Presence and CiscoJabber summaries in RTMT allow you to monitor important common information in a single monitoring pane.
To display information on important performance counters that reflect the overall performance of IM andPresence and Cisco Jabber, select IM and Presence > IM and Presence Summary or IM and Presence >Cisco Jabber Summary.
Under IM and Presence Summary, review the following information:
Cisco Unified Real-Time Monitoring Tool Administration Guide, Release 11.0(1) 59
System Performance MonitoringIM and Presence Monitoring

• PE Active JSM Sessions
• XCP JSM IM Sessions
• Total IMs Handled
• Current XMPP Clients Connected
• Total Ad hoc Chat Rooms
• Total Persistant Chat Rooms
Under Cisco Jabber Summary, review the following information:
• Client Soap interface
• SIP Client Registered Users
• SIP Client Registered User Failures
• SIP Client IM Messages
Cisco XCP counters
Number of connected XMPP clients
Cisco XCP CM—CmConnectedSockets
View the current number of XMPP clients connected to the Cisco XCP Connection Manager on an individualIM and Presence server. This number should rise and fall based on the usage patterns of your deployment.Further investigation may be required if this number is higher than expected for your user base.
Number of connected CAXL clients
Cisco XCP Web CM—WebConnectedSockets
View the current number of CAXL web clients connected to the Cisco XCP Web Connection Manager on anindividual IM and Presence server. This number should rise and fall based on the usage patterns of yourdeployment. Further investigation may be required if this number is higher than expected for your user base.
Number of active outbound SIP subscriptions
Cisco XCP SIP S2S—SIPS2SSubscriptionsOut
View the current number of active outgoing SIP Subscriptions being maintained by the Cisco XCP SIPFederation ConnectionManager service on the IM and Presence server. Monitor this counter if IM and Presenceserver is configured for SIP Interdomain Federation or SIP Intradomain Federation.
Cisco Unified Real-Time Monitoring Tool Administration Guide, Release 11.0(1)60
System Performance MonitoringCisco XCP counters

The total combined count of SIPS2SSubscriptionsOut and SIPS2SSubscriptionsIn must not rise above260,000 on any single IM and Presence server.
Note
Number of active inbound SIP subscriptions
Cisco XCP SIP S2S—SIPS2SSubscriptionsIn
View the current number of active inbound SIP Subscriptions being maintained by the Cisco XCP SIPFederation ConnectionManager service on the IM and Presence server. Monitor this counter if IM and Presenceserver is configured for SIP Interdomain Federation or SIP Intradomain Federation.
The total combined count of SIPS2SSubscriptionsOut and SIPS2SSubscriptionsIn must not rise above260,000 on any single IM and Presence server.
Note
Number of IM sessions
Cisco XCP JSM—JsmIMSessions
This counter gives the total number of IM sessions on the IM and Presence node across all users. The PresenceEngine (PE), which provides presence composition services and rich, always-on, network presence, createsan IM session on behalf of all users at PE start-up time. This is necessary so that network presence eventssuch as Cisco Unified Communications Manager Telephony Presence and Exchange Calendar notificationsare reflected in a user's presence even if that user is not logged in to any IM clients.
Every licensed user on a IM and Presence node has one IM Session for Presence Engine rich presencecomposition in addition to one IM Session for any logged in clients.
Example
There are 100 licensed users on the IM and Presence node as follows:
• 50 users are not logged in
• 40 users are logged in on one IM client
• 10 users are logged in on two IM clients
This gives a total of 160 IM Sessions comprised of:
• 100 x 1 for rich Presence Engine sessions
• 40 x 1 for users logged in on a single client
• 10 x 2 for users logged in on two clients
Cisco Unified Real-Time Monitoring Tool Administration Guide, Release 11.0(1) 61
System Performance MonitoringCisco XCP counters

Total IM Packets
Cisco XCP JSM—JsmTotalMessagePackets
This counter gives the total number of IM packets handled by the IM and Presence node across all users.
Note that if user Alice sends an IM to user Bob, and both users are assigned to the same IM and Presencenode, then this IM packet will be counted twice. This is because the XCP Router and Jabber Session Managertreat the two users separately. For example, Alice's privacy rules will be applied to the IM packet before it isdelivered to Bob, and then Bob's privacy rules will be applied to the IM packet before it is delivered to Bob'sclient. Whenever IM and Presence handles an IM packet it is counted once for the originator and once for theterminator.
If Alice and Bob are assigned to different IM and Presence nodes and Alice sends an IM packet to Bob, thenthe IM will be counted once on Alice's node and once on Bob's node.
IMs in last 60 seconds
Cisco XCP JSM—JsmMsgsInLastSlice
This counter gives the total number of IM packets handled by the IM and Presence node across all users inthe past 60 seconds. This counter is reset to 0 every 60 seconds. The same rules for counting IM packets applyas for JsmTotalMessagePackets. Monitoring of this counter will help identify the busy IM hours in yourorganization.
Per user and per session counters
Cisco XCP JSM Session Counters
These per session counters only exist for the duration of an IM session or user login. One set of these countersexists for each Presence Engine network presence session, and one set of these counters exists for each clientlogin session. In the example given above for the IMSessions counters, there are 160 different sets of CiscoXCP JSM Session Counters. When a user logs out, or when the Presence Engine is stopped, the associatedCisco XCP JSM Session Counters instance is deleted.
You can use the Cisco XCP JSM Session counters to get a snapshot of all users currently logged in. Thesecounters can be accessed from the CLI using the following command:
admin: show perf list instances "Cisco XCP JSM Session Counters"
Every user assigned to an IM and Presence node that is logged into the system will have a set of JSM sessioncounters for their current logged in client session and also their Presence Engine network session. On an IMand Presence node with 5000 users logged in this would result in a minimum of 10,000 sets of JSM Sessioncounters. Updating these counters with new values as they change would place the system under stress. Tocombat this, JSM Session counter values are cached locally by the system and only updated to RTMT every30 minutes.
Cisco Unified Real-Time Monitoring Tool Administration Guide, Release 11.0(1)62
System Performance MonitoringCisco XCP counters

IM packets sent per session
Cisco XCP JSM Session Counters—JsmSessionMessagesIn
This counts the total number of IM packets sent by the user from his IM client or session. Note that theterminology JsmSessionMessagesIn is used as from the perspective of the IM and Presence server, the IMpacket sent by the client is an inbound IM packet to IM and Presence.
IM packets received per session
Cisco XCP JSM Session Counters—JsmSessionMessagesOut
This counts the total number of IM packets sent to the user on his IM client or session. Note that the terminologySessionMessagesOut is used as from the perspective of the IM and Presence server, the IM packet is sent tothe client and is an outbound IM packet from IM and Presence.
JsmTotalMessagePackets, JsmMsgsInLastSlice, JsmSessionMessagesIn and JsmSessionMessagesOuteach represent instant message packets being sent to IM and Presence and are not exact figures of InstantMessages on the system. The amount of IM packets sent to IM and Presence per IM can vary dependingon the client in use.
Note
Total text conferencing rooms
Cisco XCP TC—TcTotalRooms
This counter represents the total number of Text Conferencing rooms hosted on the node. This includes bothad hoc rooms and persistent chat rooms.
Total adhoc group chat rooms
Cisco XCP TC—TcAdHocRooms
This counter represents the total number of AdHoc chat rooms currently hosted on the node. Note that AdHocchat rooms are automatically terminated when all users leave the room, so this counter should rise and fall invalue regularly.
Total persistant chat rooms
Cisco XCP TC—TcPersistentRooms
This counter represents the total number of persistent chat rooms hosted on the node. Persistent chat roomsmust be explicitly terminated by the room owner. You can monitor this counter to identify if the total numberof persistent chat rooms is very large and also to help identify if some persistent chat rooms are not beingused regularly anymore.
Cisco Unified Real-Time Monitoring Tool Administration Guide, Release 11.0(1) 63
System Performance MonitoringCisco XCP counters

Per-chat room counters
Cisco XCP TC Room Counters
These pre-chat room counters exist only for the lifetime of a chat room. For ad hoc chat rooms, these counterinstances are deleted when the AdHoc chat room is terminated. For persistent chat rooms, the counter instancesare also deleted when the persistent chat room is terminated, however persistent chat rooms are long-lived,so they should rarely be terminated.
You can use these per-chat room counters to monitor the usage and participants in persistent (and ad hoc)chat rooms over their lifetime and can help identify persistent chat rooms that are no longer being usedfrequently.
You can use the Cisco XCP TC Room Counters to get a snapshot of all rooms that are currently hosted onthe node. These counters can be accessed from the CLI using the following command:
admin:show perf list instances "Cisco XCP TC Room Counters"
IM packets received per room
Cisco XCP TC Room Counters—TCRoomMsgPacketsRecv
This counter represents the number of IM packets received per room.
Number of occupants per room
Cisco XCP TC Room Counters—TCRoomNumOccupants
This counter gives the current number of occupants of the chat room. Monitor this counter for Persistent Chatrooms to get an indication of the usage trend for the chat room.
It is possible to have a maximum of 16,500 Text Conferencing rooms on an IM and Presence node. Each ofthese rooms will have its own set of Per-Chat Room counters. Similar to JSM Session counters, updatingthese with new values as they change would place the system under stress. To combat this, Per-Chat Roomcounter values are cached locally by the system and only updated to RTMT every 30 minutes.
SIP proxy counters
Number of idle SIP proxy worker processes
SIP Proxy—NumIdleSipdWorkers
View the current number of idle, or free, SIP worker processes on the IM and Presence SIP Proxy. This countergives a good indication of the load being applied to the SIP Proxy on each IM and Presence server. Monitorthis counter if IM and Presence server is configured for SIP Interdomain Federation or SIP IntradomainFederation.
Cisco Unified Real-Time Monitoring Tool Administration Guide, Release 11.0(1)64
System Performance MonitoringSIP proxy counters

The number of idle processes can drop to zero on occasion and is not a cause for concern. However, if thenumber of idle processes are consistently below 5 processes, then it is an indication that the IM and PresenceServer is being heavily loaded and requires further investigation
Cisco Unity Connection Monitoring
Port MonitorThe Port Monitor lets you monitor the activity of each Cisco Unity Connection voice messaging port in realtime. This information can help you determine whether they system has too many or too few ports.
The Port Monitor provides information about each Cisco Unity Connection voice messaging port in real time.This information can help you determine the activity of each port and whether the system has too many ortoo few ports. The Port Monitor displays the information for each port as described in the following table.
Table 10: Fields and Descriptions in the Port Monitor
DescriptionField
The display name of the port in Cisco Unity Connection Administration.Port Name
For incoming calls, the phone number of the caller.Caller
For incoming calls, the phone number that was dialed.Called
If applicable, the reason why the call was redirected.Reason
The extension that redirected the call. If the call was redirected by morethan one extension, this field shows the extension prior to the last extension.
Redir
The last extension that redirected the call.Last Redir
The name of the conversation that Cisco Unity Connection is playing forthe caller. When the port is not handling a call, the status displays Idle.
Application Status
The action that the conversation is currently performing. When the port isnot handling a call, the status displays Idle.
Display Status
Specific details about the action that the conversation is performing.Whenthe port is not handling a call, the status displays Idle.
Conversation Status
The extension of the port.Port Ext
For Cisco Unified Communications Manager SCCP integrations, the IPaddress and port of the Cisco Unified Communications Manager server towhich the ports are registered.
Connected To
Cisco Unified Real-Time Monitoring Tool Administration Guide, Release 11.0(1) 65
System Performance MonitoringCisco Unity Connection Monitoring

Depending on the information that the phone system integration provided and the status of the call, somefields may remain blank.
Note
Start Cisco Unity Connection Port Monitor PollingPerform the following steps to use the Port Monitor.
Setting a low polling rate may impact system performance.Note
Procedure
Step 1 In the Real Time Monitoring Tool, access Unity Connection and click Port Monitor. The Port Monitorwindow appears.
Step 2 In the Node drop-down box, choose a Cisco Unity Connection server.Step 3 In the Polling Rate field, accept the default or enter the number of seconds between updates in the data on the
Port Monitor tab; then, click Set Polling Rate.Step 4 Click Start Polling. The Port Monitor window displays the status of all voice messaging ports on Cisco
Unity Connection.
Cisco Unified Real-Time Monitoring Tool Administration Guide, Release 11.0(1)66
System Performance MonitoringStart Cisco Unity Connection Port Monitor Polling
C H A P T E R 4Cisco Unified Analysis Manager
• Cisco Unified Analysis Manager Preferences, page 67
• Cisco Unified Analysis Manager Limitations, page 70
• Cisco Unified Analysis Manager Setup, page 71
• Cisco Unified Analysis Manager Tools, page 72
• Cisco Unified Analysis Manager Troubleshooting, page 89
Cisco Unified Analysis Manager PreferencesUse the Unified Analysis Manager dropdown menu to set preferences for:
FTP Server SetupThis function allows you to configure a FTP Server which you can then use to export information to. Theseservers can be Cisco TAC FTP servers. This information can include things such as logs, trace files, andsystem call trace information.
By default, the Cisco TAC FTP server will be pre-populated. You can modify this configuration for the defaultFTP server.
The FTP Server option allows you to manage the configured servers. You can perform the following operations:
• Add a new FTP server
• Edit an existing FTP server
• Delete FTP servers
• Test the connection of an FTP server
Cisco TAC has two FTP servers you can configure for exporting files:
• ftp-rtp.cisco.com
• ftp-sj.cisco.com
Cisco Unified Real-Time Monitoring Tool Administration Guide, Release 11.0(1) 67
On both servers, files should be uploaded to the /incoming directory.Note
Access FTP Server OptionsThe following procedure explains how to access the FTP Server Options:
Procedure
Step 1 From the Unified Analysis Manager drop-down menu, select AnalysisManager > Preferences.The Preferences window displays. Click FTP Server.
Step 2 The FTP Servers screen displays with a list of configured servers and buttons to Add, Edit, or Delete aserver. The Test Connection button allows you to test connectivity to a server.
Step 3 Use the buttons to select the option you want.
Add or Edit FTP ServerFollow this procedure to add an FTP Server or edit an existing configuration:
Procedure
Step 1 From theUnifiedAnalysisManager drop-downmenu, selectAnalysisManager>Preferences. The Preferenceswindow appears. Click FTP Server.
Step 2 The FTP Servers screen displays with a list of configured servers and buttons to Add, Edit, or Delete aserver. The Test Connection button allows you to test connectivity to a server.
Step 3 Click theAdd button to add a server or theEdit button to edit an existing configuration. TheAdd FTP Serverscreen appears.
Step 4 In the Name/IP Address field, enter the name or the IP address of the FTP server you are adding.Step 5 In theProtocol field, select either the FTP or SFTP protocol, depending on the type of server you are connecting
to. Use SFTP if you are connecting to a Cisco TAC server.Step 6 In the User Name and Password fields, enter the username and password that gives you access to the server.Step 7 In the Port field, enter the port number on the server that you will be using.Step 8 In the Destination Directory field, enter the path for the directory to which you will be exporting files. If
you are adding a Cisco TAC server, use the /incoming directory.Step 9 Click the OK button to add the server. You can use the Cancel button to end the operation without adding
the FTP server.
Cisco Unified Real-Time Monitoring Tool Administration Guide, Release 11.0(1)68
Cisco Unified Analysis ManagerFTP Server Setup

Set Up Mail ServerThis option allows you to configure a mail server for the purpose of notifying a set of user configured recipientson the status of Unified Analysis Manager operations such as trace and log collections and file transfers.
You must configure at least one mail server in order to be able to send a notification.
Note • You can configure a maximum of two mail servers.
• You can only use mail servers configured with this option for Unified AnalysisManager notifications.For RTMT notifications, you must configure a separate mail server.
Add or Edit Mail ServerThe following procedure explains how to add a Mail Server or edit an existing configuration:
Procedure
Step 1 From the Unified Analysis Manager drop-down menu, select AnalysisManager > Preferences.The Preferences window displays. ClickMail Server.
Step 2 TheMail Servers screen appears with a list of configured servers and buttons toAdd,Edit, orDelete a server.The Test Connectivity button allows you to test connectivity to a server. The Refresh button allows you toreload the server.
Step 3 Click the Add button to add a server or the Edit button to edit an existing configuration. On clicking the Addbutton, the Add Mail Server screen appears.
Step 4 In the Name/IP Address field, enter the name or the IP address of the Mail server you are adding.Step 5 In the Port No. field, enter the port number on the server that you will be using.Step 6 Click Save button to save the settings or the Cancel button to end the operation without adding the Mail
server. The Test Connection button allows you to test connectivity to a server.
Set Trace Collection DirectoryFollow this procedure to use the Trace Collection option under Preferences to set a directory for trace logs:
Procedure
Step 1 From the Unified Analysis Manager drop-down menu, select AnalysisManager > Preferences.
Cisco Unified Real-Time Monitoring Tool Administration Guide, Release 11.0(1) 69
Cisco Unified Analysis ManagerSet Up Mail Server

The Preferences window appears. Click Trace Collection.
Step 2 The Trace Collection screen appears. Enter the directory you want to use for traces logs in the DownloadDirectory box, or use the Browse button to locate the directory. Optionally, you can click the Default buttonto select the default dirctory.
Step 3 Click Save.
Cisco Unified Analysis Manager LimitationsPlease consider the following limitations when you use the Unified Analysis Manager.
• The maximum number of call records that the Call Search Report can display is 500.
• The maximum number of call records that the Call Track Report can display is 100.
• Since there is no globally unique callID to use, Unified Analysis Manager uses link-by-link approachto trace the call. If any record for a call is missing in one of the products in the call path, the link willbe broken for the rest of the chain and the tracking will not be complete.
• Call records are not stored in the database orderly based on any particular column. When running CallSearch Report, the number of returned records is limited to 500. The 500 records that are retrieved maynot be the earliest (based on originating time, connection time, or disconnect time) in the specified timerange. To make sure all of the call records within the specified time range are retrieved, you need toshorten the time range until the returned number of records is less than 500.
• The Unified Analysis Manager option is not displayed when the Unified RTMT is connected to a CiscoUnity Connection or IM and Presence node, because these products do not have a Call Record database.
When you use the Unified RTMT to connect to a Cisco Unified Communications Manager node, youcan add nodes to include Cisco Unity Connection and IM and Presence nodes in the Unified AnalysisManager.
• Call Tracking does not support tracking of SIP Unified Outbound Option calls from Unified CCE andUnified IME to Cisco IOS gateways.
• Call Tracking does not support direct call tracking of call paths using a GED-125 protocol from UnifiedCCE to Unified CVP.
• Cisco Unified CommunicationsManager needs to be in the call path for tracking calls fromCisco UnifiedCommunications Manager.
• Call tracking only supports single branch tracking from Cisco Unified Communications Manager.
• No Call Detail Records (CDR) are generated for calls on the MGCP gateway, because the gateway doesnot implement call control and Q.931 is tunneled to the Cisco Unified Communications Manager forsignaling. The CDR is available only on the Cisco Unified Communications Manager.
•With ACS servers, Unified Analysis Manager is used only for call tracing, and then used only if youwant to include gateway records and information in the tracing data. If you do not have an ACS serveror a supported hardware/software version of the ACS server, most of Unified AnalysisManager functionsin your deployment will continue to work; however, your gateway information will not be included inyour call traces.
Cisco Unified Real-Time Monitoring Tool Administration Guide, Release 11.0(1)70
Cisco Unified Analysis ManagerCisco Unified Analysis Manager Limitations

Cisco Unified Analysis Manager SetupThe Administration option on the Unified Analysis Manager menu allows you to import device and groupconfigurations from a .csv file to the Unified Analysis Manager tool.
Import Device and Group SettingsFollow this procedure to import device and group configuration from a .csv file into the Unified AnalysisManager.
Procedure
Step 1 From the Unified Analysis Manager menu, select Administration > Import.Step 2 Select the .csv configuration file that you want to import.Step 3 Click the Import button.
The selected file appears.
Scheduled Trace and Log Collection Job Status DisplayThis function allows you to display status of scheduled trace setting and log collection jobs. Jobs can bescheduled using the Unified Analysis Manager Tools. Once a device is added to a group, you can scheduletrace setting and log collections jobs on the device.
A scheduled job is linked to the machine it is configured on, and the job cannot be run on a different machine.If the machine on which a job was scheduled is not usable for any reason, the old job can be cloned and savedas a new job with new parameters to be run on the new machine.
Jobs running on a device can have one of the following states:
• Scheduled: A job is scheduled within Unified Analysis Manager; however it has not started
• Running: A job that is currently either setting traces or collecting logs
• Completed: A job that is done
• Pending: A job that has completed one run of collecting logs and is waiting to start the next run.
• Aborted: A job that has stopped abnormally due to an unexpected error
• Canceled: A job that has stopped due to a cancel operation by the user.
The Job Status screen gives a system view of all the jobs in Unified Analysis Manager. For jobs that havemultiple runs, the status and time of the last run is also shown in this page.
The following operations can be performed on a job:
• View Details: Use this option to get more detailed view of the job.
Cisco Unified Real-Time Monitoring Tool Administration Guide, Release 11.0(1) 71
Cisco Unified Analysis ManagerCisco Unified Analysis Manager Setup

• Cancel: Use this option to cancel a job. The Cancel operation can only be done on the machine that thejob is running or scheduled on. This option cannot be used for jobs that are in theCompleted/Aborted/Canceled state.
• Clone: Use this option to select any job and save it as a new job. The job being cloned from can be inany state. This option allows you to change any attribute of the job before saving. Cloning a job doesnot impact the attributes of the job being cloned.
Upload and Transfer Files to FTP ServerThis option allows you to transfer files to a configured FTP server and send an email to interested parties.You can use this option to transfer some files to another machine so they can be viewed by others.
This screen allows you to specify the files and folders to be transferred as well as any annotations to accompanythose files.
Follow this procedure to transfer files to an FTP server:
Procedure
Step 1 From the Unified Analysis Manager menu, select Administration > Upload Files.The Upload Files screen appears.
Step 2 In the Case ID field, enter the number that Cisco TAC has assigned to the case.Step 3 Use the drop-down list box in the Send to Server field to select the FTP server you are sending the file to.Step 4 Use the Notes box to provide any additional information about the file.Step 5 Use the Send Email Notifications check box if you want to add the email addresses to send a notification
that the file is uploaded. To add multiple email addresses, add the mail ids separated by comma. The mailaddresses can be only the <username> or it can be of the format [email protected].
Step 6 In the bottom section of the screen, in the Files to upload box, select the files you want to transfer. Use theAdd orRemove buttons to select or deselect files from the system. The files selected will be zipped by defaultand then uploaded. The name of the zipped file will be of the format <case id>_uploadedfile.zip.
Step 7 Click the OK button to transfer the file.
Cisco Unified Analysis Manager ToolsThis chapter provides information about the Unified Analysis Manager, which provides a set of tools thatallows you to perform management tasks for specific devices and groups of devices.
Analyze Call Path ToolThe Analyze Call Path tool allows you to trace a call between multiple Cisco Unified Communicationsproducts. In order to trace a call using the Analyze Call Path tool, a node must be defined in Unified AnalysisManager and the node must belong to a group.
Cisco Unified Real-Time Monitoring Tool Administration Guide, Release 11.0(1)72
Cisco Unified Analysis ManagerUpload and Transfer Files to FTP Server

All nodes that you define are assigned to the AllNodes group by default. Use the Node Groups functionif you want to assign the node to a different group. See the topics related to the Analyze Call Path setupfor more information on configuring a Call Record Repository before using the Analyze Call Path function.
Note
Procedure
Step 1 From the Unified Analysis Manager menu, select Tools > Analyze Call Path.The Analyze Call Path Information window appears.
Step 2 Click the Continue button. The Search Criteria window appears.Step 3 Enter the number where the call originated in the Calling Number field. The default is an asterisk (*) which
is a wildcard that will trace all numbers for the node.Step 4 Enter the number where the call terminated in the Called Number field. The default is an asterisk (*) which
is a wildcard that will trace all numbers for the node.Step 5 Use theTermination Cause drop-down list box to select the reason for the call termination; either Abandoned,
Dropped, Failed or all three.Step 6 Use the Start Time field to enter the start time for the trace.Step 7 Use the Duration field to indicate the length of the time period you want to trace.Step 8 Use the Time Zone drop-down list box to select the time zone where you are tracing calls.Step 9 Use the Filter Nodes by Group drop-down list box to select the group of nodes that you want to trace.Step 10 Use the and Node Type drop-down list box to select specific types of nodes that you want to trace.
When you have selected the Group and Node, information displays for each node. You can then use the checkbox for each node listed to select or deselect the node.
The limit for the number of nodes that you can select at a time is20.
Note
Step 11 Click theRun button to begin the trace. The trace results display on the bottom of the window. If you selectedmultiple nodes, a tab is displayed for each node. Click the tab to display information for that node.
Step 12 When the call record information appears, you can click the View Full Path button to see the complete callpath. You can click the View Record Details button to see the information about the call. Use the SaveResults button to save the reports.
Analyze Call Path Setup Considerations
The Analyze Call Path Tool might not work correctly if your computer is set to a language other thanEnglish.
Caution
When using the Analyze Call Path tool, there are configuration considerations for each product that the UnifiedAnalysis Manager manages.
The Analyze Call Path tool does not include information for Cisco Unity Connection and IM and Presenceservers.
Cisco Unified Real-Time Monitoring Tool Administration Guide, Release 11.0(1) 73
Cisco Unified Analysis ManagerAnalyze Call Path Tool

Cisco Unified Communications Manager
The following information applies when configuring the Analyze Call Path for Cisco Unified CommunicationsManager:
• Version Support—Unified Analysis Manager supports Release 8.0(1) and above for Cisco UnifiedCommunications Manager.
• Call Record Repository—Use the first node (publisher) as the Call Record Repository with the HTTPSprotocol and the default port 8443.
• User Group and Access Permissions— Users should belong to a user group whose role contains readand update permissions required to access Call Records for the following resources:
◦SOAP Call Record APIs
◦SOAP Control Center APIs
◦SOAP Diagnostic Portal Database Service
◦SOAP Log Collection API
◦SOAP Performance Informations APIs
◦SOAP Realtime Informations and Control Center APIs
New resources “SOAP Diagnostic Portal Database Service” and “SOAP Call RecordAPIs” added on an upgrade should not have the read and update permissions by defaultdue to security reasons for existing users. Users need to create or copy the role to customresources and update the required permissions for above mentioned resources as needed.See theAdministrationGuide for CiscoUnified CommunicationsManager for additionaldetails.
Note
• Configuring NTP—Each product installed in the solution should be configured to point to same set ofexternal NTP clock sources. NTP is required to be configured on all nodes that involve calls for SCTfeatures. For CiscoUnified CommunicationsManager, use the utils ntp configCLI command to configureNTP.
• Enable Call Record Logging—In Cisco Unified Communications Manager Administration, go to theService Parameter Configuration window, and choose theCisco CallManager Service. Enable theCDREnabled Flag and the CDR Log Calls with Zero Duration Flag parameters. Restart the CiscoCallManager service for change-notification to take effect immediately. Repeat this procedure for allnodes in the Cisco Unified Communications Manager cluster.
You can verify that flags are set as desired athttps://<HOSTNAME:PORT>/ccmadmin/vendorConfigHelp.do
Note
• CDR CAR Loader—Ensure your CDR Analysis and Reporting (CAR) Loader is set to ContinuousLoading 24/7. To verify this:
Cisco Unified Real-Time Monitoring Tool Administration Guide, Release 11.0(1)74
Cisco Unified Analysis ManagerAnalyze Call Path Tool

◦Go to the Cisco Unified Serviceability and select Tools > CDR Analysis and Reporting (CAR)page. The CAR page opens in a new browser.
◦Go to System > Scheduler > CDR Load page.
◦Verify if Loader is not disabled and that Continuous Loading 24/7 is enabled. This allows CDRrecords that are generated from Cisco Unified Communications Manager nodes to be loaded intothe CAR database as soon as they arrive to Cisco Unified Communications Manager first node(publisher).
If call records are not found on the Cisco Unified Communications Manager, it is possible that theCAR Loader failed or is having a delay loading the latest CDR records. If this occurs, go to theCAR System > Database >Manual Purge page and click the Table Information button. Checkfor the oldest and latest CDR records that are available in the CAR database. If records are not setto the latest date, go to System > Log Screens > Event Log and select CDR Load to check itsrecent run status to see if there were any Unsuccessful runs. If CDR Load failure is found, collectCAR Scheduler traces to provide to Cisco Support for troubleshooting.
• Raw Call Record Details—For information about Raw Call Record details help for Cisco UnifiedCommunications Manager, see the Cisco Unified Communications Manager Call Detail RecordsAdministration Guide.
Cisco Unified Contact Center Express
The following information applies when configuring the Analyze Call Path for Unified CCX:
• Version Support—Unified Analysis Manager supports Unified CCX version 8.0(1) and later.
• Call Record Repository—The Call Record Repository used for Unified CCX is either (or both in thecase of a High Availability system) of the Unified CCX nodes. The database is active on both nodes andthe data is replicated. The JDBC user is uccxsct and the password is the encrypted version of the TFTPpassword. The password is typically set by the Unified CCX administrator.
• Default user for adding Unified CCX Call Record Repository—The Informix user for adding (andconnecting to) Unified CCX Call Record Repository is: uccxsct. You can reset the default install timepassword for above user in the Unified CCX Application Administration > Tools > PasswordManagement page. Typically, the Unified CCX administrator will reset to the desired password andpass it on to the Unified Analysis Manager administrator.
• User Group and Access Permissions—Unified CCX does not require any additional user group andaccess permission to access Call Records. The access permissions of the uccxsct user is set by UnifiedCCX install for read access to specific tables. No external settings are required.
• Configuring NTP—To configure NTP for Unified CCX, go to OS Administration > Settings > NTPServer.
• Enable Call Record Logging—Unified CCX always generates Call Records by default, so no configurationis required to enable logging of Call Records.
Cisco Unified Intelligent Contact Management Enterprise/Cisco Unified Contact Center Enterprise
The following information applies when configuring the Analyze Call Path for Cisco Unified IntelligentContact Management Enterprise (Unified ICME) and Unified CCE:
Cisco Unified Real-Time Monitoring Tool Administration Guide, Release 11.0(1) 75
Cisco Unified Analysis ManagerAnalyze Call Path Tool

• Version Support—Unified Analysis Manager supports Release 8.0(1) and above for Unified ICME andUnified CCE.
• Call Record Repository—The Call Record Repository used for Unified ICME is either AW-HDS-DDSor HDS-DDS. The server used for Unified CCE is HDS/AW Database (port 1433).
• User Group and Access Permissions—For Release 8.0(1), the recommended user group and accesspermissions that are required to access Call records are theWindows only Authentication for SQL Server.This is done by using the User List tool from the Configuration Manager and creating a user with theright access privileges.
• ConfiguringNTP—Configuration for Time Synchronization of Unified CCE servers is based onMicrosoftWindows Time Services. When setting up the Unified CCE router component, retain the default settingsof the “Disable ICM Time Synchronization” box as checked. With the recommended default setting, thetime synchronization for Unified CCE servers is provided by the Windows Time Service, whichautomatically synchronizes the computer's internal clock across the network. The time source for thissynchronization varies, depending on whether the computer is in an Active Directory domain or aworkgroup. For additional information on setting up Windows Time Service, refer to the MicrosoftWindows Time Service Technical Reference documentation at:http://technet.microsoft.com/en-us/library/cc773061(WS.10).aspx.
• Enable Call Record Logging—To check that Call Record logging is enabled, first be sure that the UnifiedAnalysis Manager service on Unified CCE is enabled. Using the web setup, you need to install theAW-HDS-DDS or HDS-DDS servers with Administration and Data Server roles. Once you install theseroles using the web setup, the call records are available by default.
• RawCall Record Details—To find help for the Raw Call Record details, refer to the Schema Help whichyou can access from the Unified CCE Administration Tool group on either the AW-HDS-DDS orHDS-DDS server. You can also refer to the United CCE Database Schema Handbook for a specificrelease athttp://www.cisco.com/en/US/products/sw/custcosw/ps1844/tsd_products_support_series_home.html.
If you are using RTMT to monitor Cisco Unified Contact Center Enterprise, you must open the followingfile and change the value for ReadTimeout to 360:<RTMT_INSTALLATION_FOLDER_PATH>/conf/rtmt.xml. If you don't change the value, RTMT willnot be able to collect OPC logs because RTMT's default timeout value is greater than the time it takes tocollect OPC logs.
Note
Cisco Unified Customer Voice Portal
The following information applies when configuring the Analyze Call Path for Unified CVP:
• Version Support—United Analysis Manager supports Unified CVP Release 8.0(1) and above.
• Call Record Repository—Unified CVP uses the Unified CVP Reporting Server for the Call RecordRepository.
• User Group and Access Permissions—Unified CVP uses Unified CVP OAMP to set user group andaccess permissions required to access Call Records:
◦All users trying to access Unified CVP records from the Unified CVP database need to be createdthrough Unified CVP OAMP.
Cisco Unified Real-Time Monitoring Tool Administration Guide, Release 11.0(1)76
Cisco Unified Analysis ManagerAnalyze Call Path Tool

◦Unified CVP Reporting users need to be granted the Unified CVP Reporting role in Unified CVPOAMP.
◦User passwords may expire if security hardening is installed on the Unified CVPReporting Server.SNMP monitor displays alerts when this happens.
• Configuring NTP—Configuration for Time Synchronization of the Unified CVP servers is based onMicrosoft Windows Time Services. For additional information on setting up Windows Time Service,refer to the Microsoft Windows Time Service Technical Reference documentation athttp://technet.microsoft.com/en-us/library/cc773061(WS.10).aspx.
• Enable Call Record Logging—To ensure that Call Record logging is enabled, do the following:
◦Unified CVP Reporting Server is not installed nor configured by default. Customers and Partnerswill have to install a Unified CVP Reporting Server to use the Analyze Call Path tool with UnifiedCVP.
◦Unified CVP Database schema needs to be laid down by the Unified CVP_database_config.batfile. This file needs to be run by the user after Unified CVP Reporting Server installation iscompleted.
◦Once a Unified CVP Reporting Server is installed, it needs to be configured through Unified CVPOAMP and a Unified CVP Call Server needs to be associated with the Unified CVP ReportingServer.
◦Follow the Unified CVP CAG and RPT guidelines for configuring the Unified CVP ReportingServer, Unified CVP VXML Server, and Unified CVP Call Servers.
◦Unified CVP data retention is 30 days, by default. You can customize this value through UnifiedCVP OAMP. Unless you back up the database, data will be purged at the end of data retentionday. Backed up Unified CVP data is not accessible unless it is imported back into the database.
◦Unified CVP VXML Server filters need to be configured on Unified CVP OAMP. Refer to theUnified CVP OAMP guide for configuring these filters.
• RawCall Record Details—For information relating to RawCall Record details, refer to theUnified CVPReporting Guide for version7.0(2).
Cisco Access Control Server and Cisco IOS Gateway
The following information applies when configuring the Analyze Call Path for Cisco Access Control (ACS)Servers and Cisco IOS Gateways:
• Version Support—Unified Analysis Manager supports ACS Release 5.1.
• Call Record Repository—To assign a Call Record Repository, one of the acs servers can be configuredas a “collector” node.
• User Group and Access Permissions—To set user group and access permissions, after the ACS serveris installed, in ssh/telnet access, enter acsadmin as the username and default as the password, You willbe prompted to change the password.
• Configuring NTP—To configure an NTP server on an ACS server, use cli: ntp server <NTP serverIP/host>.
Cisco Unified Real-Time Monitoring Tool Administration Guide, Release 11.0(1) 77
Cisco Unified Analysis ManagerAnalyze Call Path Tool

• Enable Web View—Execute the CLI command acs config-web-interface view enable to enable webview. It is disabled by default.
• Cisco IOS gateways as ACS network devices or AAA clients—You need to configure ACS networkdevice to have the correct Radius secret, which is the same secret as the one on the IOS gateway.
◦From acsadmin, access Network Devices Group > Network Devices and AAA clients to add theCisco IOS gateway as the ACS network device or AAA client.
• For IOS configurations:
◦Use the CLI to configure NTP server: ntp server <NTP server IP/host>
◦Configure Cisco IOS gateway as a Radius client of the ACS server. Sample CLIs are below:
aaa new-model!!aaa group server radius acsserver 172.27.25.110 auth-port 1812 acct-port 1813!aaa authentication login h323 group acsaaa authorization exec h323 group acsaaa accounting connection h323 start-stop group acsaaa session-id commongw-accounting aaaradius-server host 172.27.25.110 auth-port 1812 acct-port 1813radius-server key ciscoradius-server vsa send accountingradius-server vsa send authentication
• Be sure you have local login access to your Cisco IOS gateways.
• Enable Call Record Logging—To check that Call Records logging is enabled:
◦aaa accounting connection h323 start-stop group acs
◦aaa session-id common
◦gw-accounting aaa
◦radius-server host 172.27.25.110 auth-port 1812 acct-port 1813
◦radius-server key cisco
◦radius-server vsa send accounting
Nodes
Node ManagementOnce configured, a supported node is added to the Unified Analysis Manager database and will appear on thesupported Unified Analysis Manager node list. You can identify a Unified Analysis Manager node in one ofthree ways:
• Importing node and group configuration from a configuration file.
Cisco Unified Real-Time Monitoring Tool Administration Guide, Release 11.0(1)78
Cisco Unified Analysis ManagerNodes

• Manually entering node and group information with the Unified Analysis Manager screens.
• Discovering Unified Analysis Manager nodes from a seed node. A seed node is one that can returninformation about all the nodes within a deployment. Once discovered, the nodes can then be added tothe node inventory. This option saves you from manually entering details of these nodes.
For Cisco Unified Communications Manager, the first node (publisher) is the seed node. For Cisco UnifiedCustomer Voice Portal (Unified CVP), the Cisco Unified CVP OAMP server is the seed node.
This option allows you to perform Add/Edit/Delete and Discover operations on nodes. All configured UnifiedAnalysis Manager nodes (manually entered, imported from a file, or discovered) will be displayed in the listof nodes.
You can use the Nodes option to perform the following functions:
• Add—The Add button allows you to manually enter a new node.
• Edit—The Edit button allows you to edit a node that has already been configured.
• Delete—The Delete button allows you to delete one or more nodes.
• Discover—You can use the Discover option, which applies only to a seed node. Use the Discover buttonto send a query to the seed node, which then returns information about all the nodes within that deploymentthat the seed node is aware of. Once discovered, the nodes are automatically added to the node inventory.
• Test Connectivity—The Test Connectivity button allows you to test connectivity to the node using theconfigured access information.
Display Node Summary
The Node summary screen displays all of the nodes currently configured with the Unified Analysis Managerapplication. Use the following procedure to access the Node summary screen.
Procedure
Step 1 From the Unified Analysis Manager menu, select Inventory > Nodes.Step 2 TheNode summary screen displays with a list of configured nodes and buttons toAdd,Edit,Delete,Discover.
TheTest Connection button allows you to test connectivity to a node. Nodes are listed byName and ProductType.
Add or Edit a Node
The following procedure explains how to add a node or edit an existing configuration:
Procedure
Step 1 From the Unified Analysis Manager menu, select Inventory > Nodes.
Cisco Unified Real-Time Monitoring Tool Administration Guide, Release 11.0(1) 79
Cisco Unified Analysis ManagerNodes

The Nodes window appears.
Step 2 Click the Add button to add a node or select a node from the list and click the Edit button to edit an existingconfiguration. The Add or Edit Node screen appears.
Fields on this screen that are marked with an asterisk (*) are requiredfields.
Note
Step 3 Use the Product Type drop-down list box to select a product.Step 4 In the IP/Host Name field, enter the hostname or the IP address of the node you are adding or editing.Step 5 In the Transport Protocol field, select the protocol you want to use. Options for this field depend on the
Product Type you selected.Step 6 In the Port Number field, enter the port number on the node that you will be using.Step 7 In the User Name and Password fields, enter the username and password that gives you access to the node.
Reenter the password in the Confirm Password field.Step 8 In the Description field, you can optionally provide a brief description of the node you are adding.Step 9 In the Associated Call Record Repositories and Associated Trace File Repositories fields, use the drop
down list to select the respective servers you want to use for the node.Step 10 Use the Associated Group check boxes if you want to add the node to an existing group.Step 11 If you have a NAT or Terminal Server configuration, use the Advanced button to display the Add
Node-Advanced screen. Enter the appropriate information in the Alternate IP/Hostname and AlternatePort fields.
Step 12 Click the Save button to add the node. You can use the Cancel button to end the operation without addingthe node.
Group ManagementWithin Unified Analysis Manager, you can create groups and add nodes to these groups. Once the nodes areadded to a group, the user can perform a set of functions (for example, Trace Collection and Trace Setting)at a group level. A single node can belong to multiple groups. Nested groups will not be supported. Copyinga group will not be supported.
The AllNodes group is added by default when a node is added in Unified Analysis Manager. Any nodesadded to Unified AnalysisManager are part of the AllNodes group by default. The AllNodes group cannotbe edited or deleted.
Note
The number of groups you can have is limited to 20 and the number of nodes in a group (with the exceptionof the AllNodes group) is 20.
Note
You can use the Group option to perform the following functions:
• Add—Use the Add button to create a group. Once a Group is created, you can add nodes to the group.
• Edit—Use the Edit button to select and edit group information. The Edit function also allows you addor delete the node members of the group. You can change which nodes belong to a group by adding ordeleting nodes from that group.
Cisco Unified Real-Time Monitoring Tool Administration Guide, Release 11.0(1)80
Cisco Unified Analysis ManagerNodes

• Delete—Use the Delete button to delete a Group. This function deletes that group from the UnifiedAnalysis Manager. However, this function does not delete the individual nodes in the group from theUnified Analysis Manager. Nodes must be deleted individually using the Edit button.
Add or Edit Group
The following procedure explains how to add a group or edit an existing configuration:
Procedure
Step 1 From the Unified Analysis Manager menu, select Inventory > Node Groups.Step 2 The Groups window displays. Click the Add button to add a group or select a group from the list and click
the Edit button to edit an existing configuration. The Add or Edit Group screen displays.Step 3 Use the Group Name field to enter the name of the group.Step 4 Use the Group Description field to enter a brief description of the group.Step 5 The Select Nodes section contains a list of each configured node. To add a node to the group, highlight the
node in the list and click the Add button.Step 6 When you have finished selecting nodes for the group, click the Add button to add the group or the Update
button if you are editing the group content. You can use theCancel button to end the operation without addingor editing the group.
Trace File Repository ManagementThis option allows you to performAdd/Edit/Delete operations on trace file repositories for the Unified AnalysisManager. Managed nodes typically use the trace file repository to off load its trace and log files. The UnifiedAnalysis Manager can then connect to the trace file repository to collect logs and traces.
You can use the Trace File Repository option to perform the following functions:
• Add—The Add button allows you to manually enter a new server.
• Edit—The Edit button allows you to edit a server that has already been configured.
• Delete—The Delete button allows you to delete one or more servers.
• Test Connectivity—The Test Connectivity button allows you to test connectivity to a server using theconfigured access information.
Add or Edit Trace File Repository
The following procedure explains how to add a Trace File Repository or edit an existing configuration:
Cisco Unified Real-Time Monitoring Tool Administration Guide, Release 11.0(1) 81
Cisco Unified Analysis ManagerNodes

Procedure
Step 1 From the Unified Analysis Manager menu, select Inventory > Trace File Repositories.Step 2 The Trace File Repositories window displays with a list of configured servers. Click the Add button to add
a new server or highlight a server on the list and click the Edit button to edit an existing configuration.Step 3 In the IP/Host Name field, enter the hostname or the IP address of the server you are adding.Step 4 In the Transport Protocol field, use the drop-down list box to select the protocol you want to use, either
SFTP or FTP.Step 5 In the Port Number field, enter the port number on the server that you will be using.Step 6 In the User Name and Password fields, enter the username and password that gives you access to the server.
Reenter the password in the Confirm Password field.Step 7 In the Description field, you can optionally provide a brief description of the server you are adding.Step 8 In the Associated Nodes field, use the check boxes to select the nodes that will have access to the server.Step 9 If you have a NAT or Terminal Server configuration, use the Advanced button to display the Add Trace File
Repository-Advanced screen. Enter the appropriate information in theAlternate IP/Hostname andAlternatePort fields.
Step 10 Click the Add button to add the server or Edit to update the configuration. You can use the Cancel button toend the operation without adding the server.
Call Record Repository ManagementThis option allows you to perform Add/Edit/Delete operations on call record repositories for the UnifiedAnalysis Manager. Managed nodes typically see the Call Record Repository to store the call data in a database.The Unified Analysis Manager can then connect to the Call Record Repository to obtain detailed call data.
You can use the Call Record Repository option to perform the following functions:
• Add: Allows you to manually enter a new server.
• Edit: Allows you to edit a server that has already been configured.
• Delete: Allows you to delete one or more servers.
• Test Connectivity: Allows you to test connectivity to a server using the configured access information.
Add or Edit Call Record Repository
Follow this procedure to add a call record repository or edit an existing configuration:
Cisco Unified Real-Time Monitoring Tool Administration Guide, Release 11.0(1)82
Cisco Unified Analysis ManagerNodes

Procedure
Step 1 From the Unified Analysis Manager menu, select Inventory > Call Record Repositories.Step 2 TheCall Record Repositorieswindow appears with a list of configured servers. Click theAdd button to add
a new server or highlight a server on the list and click the Edit button to edit an existing configuration.Step 3 Use the Repository Type drop down list to select the product type for the node that will be accessing the
server.Step 4 In the Hostname field, enter the name of the server you are adding.Step 5 In the JDBC Port field, enter the port number on the server that you will be using.Step 6 In the JDBCUser Name and JDBC Password fields, enter the username and password that gives you access
to the server. Re-enter the password in the Confirm Password field.Step 7 In the Description field, you can optionally provide a brief description of the node you are adding.Step 8 Use the Nodes Available for Association to select the nodes that will have access to the server.Step 9 If you have a NAT or Terminal Server configuration, use the Advanced button to display the Add Call
Record Repository-Advanced screen. Enter the appropriate information in the Alternate Hostname andAlternate Port fields.
Step 10 Click the Add button to add the server or Edit to update the configuration. You can use the Cancel button toend the operation without adding the server.
Define Trace TemplatesIf you have large number of nodes in a group, the Unified Analysis Manager provides templates as a shortcutfor selecting components to change trace levels. You can also use templates to establish the new trace levelsfor nodes. You can also use template for collecting logs and trace files.
You can use the Templates option to perform the following functions:
• Add—The Add button allows you to create a new template. When adding a template you should notethat you are doing so for node types and not actual nodes. For a given node type, there is a known fixedset of components and services.
• Edit—The Edit button allows you to edit an existing template.
• Clone—The Clone button allows you to save an existing template as a new template without replacingthe original one.
• Delete—The Delete button allows you to delete a template.
• Import—Use the Import button to import predefined templates from a flat file.
• Export—Use the Export button to export a template to a flat file.
Add or Edit Template
The following procedure explains how to add a template or edit an existing configuration:
Cisco Unified Real-Time Monitoring Tool Administration Guide, Release 11.0(1) 83
Cisco Unified Analysis ManagerNodes

Unified Analysis Manager has default templates which cannot be edited or deleted.Note
Procedure
Step 1 From the Unified Analysis Manager menu, select Inventory > Templates.Step 2 The Templates window displays. Click the Add button to add a template or select a template from the list
and click the Edit button to edit an existing configuration. The Add or Edit Template screen displays.Step 3 Use the Name field to enter the name of the template.Step 4 Use the Description field to enter a brief description of the group.Step 5 The Product Types section contains a list of products supported by the Unified Analysis Manager. When
you select a product from this list, the associated components display in the Component Name field.Step 6 For each component displayed, you can apply a trace level by using the drop down list in the Trace Level
field.Not all components are available for setting trace levels with this screen.Note
Step 7 You can indicate if you want to collect trace logs for the component by checking the box in the Collect field.Step 8 Click the Add button to add the template or Edit to update the configuration. You can use the Cancel button
to end the operation without adding the server.
Call DefinitionsThe following table defines the types of call termination.
Table 11: Call Definitions
Call Termination ExplanationCall Type
The call is not connected for any reason other than user hang-up before theconnection is completed.
Failed call
The call is not connected because the user hangs up after initiating the call.Abandoned call
The call is disconnected after connection for any reason other than user hangingup.
Dropped call
The following table lists the products that support the failed, abandoned, and dropped calls.
Cisco Unified Real-Time Monitoring Tool Administration Guide, Release 11.0(1)84
Cisco Unified Analysis ManagerCall Definitions

Table 12: Product Support for Call Types
Unified CCXUnified CVPUnified CCEUnifiedCommunicationsManager
Call Type
SupportedSupportedSupportedSupportedFailed Call
SupportedNot SupportedSupportedSupportedAbandoned call
SupportedNot SupportedSupportedSupportedDropped Called
Trace CollectionUnified Analysis Manager allows you to collect log and trace files from services of supported devices. Thereare three ways you can collect logs and trace files:
• Collect Traces Now— Collect Traces Now option allows you to collect trace files based on a selectionof services on a device or group of devices for any period of time that has occurred in the past.
• Schedule Trace Collection— Schedule Trace Collection option allows you to collect trace files basedon a selection of services on a device or group of devices for any period of time in the future.
• Schedule Trace Settings and Collections—Schedule Trace Settings and Collection option allows you tocollect trace files from the present into the future and also specify the trace levels to be used during thescheduled time.
Collect Traces NowThe Collect Traces Now option allows you to collect trace files based on a selection of services on a deviceor group of devices for any period of time that has occurred in the past.
Procedure
Step 1 From the Unified Analysis Manager menu, select Tools > Collect Traces Now.
Cisco Unified Real-Time Monitoring Tool Administration Guide, Release 11.0(1) 85
Cisco Unified Analysis ManagerTrace Collection

The Collect Traces Now window displays.
Step 2 Select either the Group to display a list of supported groups or the Node for a list of supported devices. Selectthe groups or devices that you want to collect traces for.
Step 3 Use the Select the template to dropdown list to select the template containing the trace levels you want touse. Alternately, you can click the Customize button if you want to customize new trace levels for the groupor device.
Step 4 Use the Start Time and End Time fields to select the collection time period.Step 5 Use the Referenced Time Zone field to select the time zone for the collection time period.Step 6 You can optionally click the View Summary button to view the Collection Summary window. This window
contain a list of the components associated with the node.Step 7 Click the OK button to start the trace. When the trace is completed, the window displays a Status Summary
and Status Details for the trace. The Status Details provide the path to the directory to which the log was sent.
Schedule Trace CollectionUse the Schedule Trace Collection option if you want to collect trace files for any period of time from thepresent into the future.
Procedure
Step 1 From the Unified Analysis Manager menu, select Tools > Schedule Trace Collection.The Schedule Trace Collection window appears.
Step 2 Select either the Group to display a list of supported groups or the Node for a list of supported devices. Selectthe groups or devices that you want to collect traces for.
Step 3 Use the Select the template to dropdown list to select the template containing the trace levels you want touse. Alternately, you can click the Customize button if you want to collect traces for specific components.
Step 4 Use the Start Time and End Time fields to select the collection time period.Step 5 Use the Referenced Time Zone field to select the time zone for the collection time period.Step 6 Use the Collect Traces Every dropdown field to indicate the frequency of the collection.Step 7 Optionally, you can choose to have an email notification sent regarding the trace collection. To do that, click
the Send Email Notification to check box and enter the email address in the text box.Step 8 You can optionally click theView Summary button to view theCollection Summarywindow. This window
contains a list of the components associated with the node.Step 9 Click the OK button to start the trace. When the trace is scheduled, the window displays a Status Summary
and Status Details for the trace. When the trace is completed, a report is written to your log file and, if emailinformation was provided, a system-generated email is sent.
Cisco Unified Real-Time Monitoring Tool Administration Guide, Release 11.0(1)86
Cisco Unified Analysis ManagerTrace Collection

Schedule Trace Settings and CollectionUse the Schedule Trace Settings and Collection option if you want to collect trace files for any period of timefrom the present into the future and, in addition, also specify the trace levels to be used during the scheduledtime. If you change trace settings with this option, trace levels are restored to their default settings after thecollection period is over.
Procedure
Step 1 From the Unified Analysis Manager menu, select Tools > Schedule Trace Collection.The Schedule Trace Collection window appears.
Step 2 Select either the Group to display a list of supported groups or Node, for a list of supported devices. Selectthe groups or devices that you want to collect traces for.
Step 3 Use the Select the template to drop-down list to select the template containing the trace levels you want touse. Alternately, you can click the Customize button if you want to customize new trace levels for the groupor device. This option also allows you to collect traces for specific components.
Step 4 Use the Start Time and End Time fields to select the collection time period.Step 5 Use the Referenced Time Zone field to select the time zone for the collection time period.Step 6 Use the Collect Traces Every drop-down field to indicate the frequency of the collection.Step 7 Optionally, you can choose to have an email notification sent regarding the trace collection. To do that, click
the Send Email Notification to check box and enter the email address in the text box.Step 8 You can optionally click theView Summary button to view theCollection Summarywindow. This window
contains a list of the components associated with the node.Step 9 Click the OK button to start the trace. When the trace is scheduled, the window displays a Status Summary
and Status Details for the trace. When the trace is completed, a report is written to your log file and, if emailinformation was provided, a system-generated email is sent.
Set Trace LevelsUse the Set Trace Level option to assign trace levels for a group of devices or individual devices. You canassign trace levels using a template or you can customize trace levels. Trace levels can be set for the followingCisco Unified Communications components:
• Cisco Unified CommunicationsManager: Allows setting trace levels for Cisco Unified CommunicationsManager and Common Trace Components.
• IM and Presence: Allows setting trace levels for Unified Presence and Common Trace Components.
• Cisco Unity Connection: Allows setting trace level for Cisco Unity Connection and Common TraceComponents.
• Cisco Unified Contact Center Express: Allows setting trace level only for Common Trace Components.
The following table describes the general trace level settings for the CiscoUnified Communications componentsthat are managed by Unified Analysis Manager.
Cisco Unified Real-Time Monitoring Tool Administration Guide, Release 11.0(1) 87
Cisco Unified Analysis ManagerSet Trace Levels

Table 13: Unified Analysis Manager Trace Level Settings
Expected Volume of TracesGuidelinesTrace Level
Minimum Traces expectedThis level should include all traces generated in abnormalpaths. This level is intended for coding error traces anderror s traces that normally should not occur.
Default
Medium Volume of TracesExpected when componentis used
This level should include traces for system-level operations.This should include all traces generated by “StateTransitions” within components.
Warning
High Volume of TracesExpected when componentis used
This should include traces that can be used in the lab fordebugging difficult problems of the component.
Informational
Very High Volume ofTraces Expected whencomponent is used
This level should include detailed debug information orhigh volume of messages which are primarily used fordebugging.
Debug
Procedure
Step 1 From the Unified Analysis Manager menu, select Tools > Set Trace Level.The Set Trace Level window appears.
Step 2 Select either the Group to display a list of supported groups or the Node for a list of supported devices. Selectthe groups or devices that you want to collect traces for.
Step 3 From the Select the template drop-down list box, select the template containing the trace levels that you youwant to use. Alternately, you can click the Customize button if you want to customize trace levels for thegroup or device. If you choose the Customize option, the Design Preview dialog displays with a list ofsupported devices. Choose the device you want and use the Selected Components fields to set the trace levels.
Step 4 Click View Changes to see any changes made to traces levels for the node. ClickOK to set the level and exitthe screen.
View ConfigurationUse the View Configuration option to view configuration information related to a node. You can collect theversion and configuration information and view it in a browser or save the results.
Procedure
Step 1 From the Unified Analysis Manager menu, select Tools > View Configuration.
Cisco Unified Real-Time Monitoring Tool Administration Guide, Release 11.0(1)88
Cisco Unified Analysis ManagerView Configuration

The View Configuration window appears and displays a list of nodes.
Step 2 Select a node and click the Next button to display the Selected Components screen. This screen lists theVersion, Platform, License and other category configuration information for the product.
Step 3 Click Finish to collect the configuration information.The summary window appears. Users can view the collected information in a browser or save the collectedconfiguration information using the Save As button.
Cisco Unified Analysis Manager TroubleshootingThe following table provides a list of errors that you may see when testing Unified Analysis Managerconnectivity to a node and the suggested action for correcting the errors.
Table 14: Test Connectivity Errors and Corrective Actions
Corrective ActionMessageError CodeNo.
Enter the correctusername and password.
Username or password isnot correct
NOT_AUTHORIZED_CODE1
The requested webservice was not found.Check to see if the webservice is down on thetarget application.
Missing ServiceMISSING_SERVICE_CODE2
Check to see if there areany other ongoing jobsrunning on the server. Ifso, wait until the job isdone. If not, wait a fewminutes and try again.
Server is busySERVER_BUSY_CODE3
The specified port maybe syntactically incorrector may be out of range.
Invalid PortINVALID_PORT_CODE4
Verify that you haveentered the correctaddress for this node. Ifthe address is correct,then verify that the nodeis up and that it isreachable.
Not connected to thespecified node
CONNECTION_FAILED_CODE5
Cisco Unified Real-Time Monitoring Tool Administration Guide, Release 11.0(1) 89
Cisco Unified Analysis ManagerCisco Unified Analysis Manager Troubleshooting

Corrective ActionMessageError CodeNo.
This version of thespecified product is notsupported for thisrelease. Upgrade thisproduct to a supportedversion.
Not supportedNOT_SUPPORTED_CODE6
Verify that you haveaccepted the certificatethat was sent to theclient from the server.
SSL handshake failed.The client and servercould not negotiatedesired level of security
CERTIFICATE_HANDLING_ERROR_CODE7
Save the recent UnifiedAnalysis Manager logfiles and contact UnifiedAnalysis Managersupport for help.
An internal error hasoccurred
GENERAL_CONNECTION_ERROR_CODE8
Cisco Unified Real-Time Monitoring Tool Administration Guide, Release 11.0(1)90
Cisco Unified Analysis ManagerCisco Unified Analysis Manager Troubleshooting

C H A P T E R 5Profiles and Categories
• Profiles, page 91
• Categories, page 92
Profiles
Add Configuration ProfileWith RTMT, you can customize your monitoring window by monitoring different performance counters andthen create your own configuration profiles. You can restore these monitoring windows in a single step ratherthan opening each window again.
You can switch between different profiles during the same RTMT session or use the configuration profile insubsequent RTMT sessions.
Follow this procedure to create a profile.
Procedure
Step 1 Choose File > Profile.The Preferences dialog box appears.
Step 2 Click Save.The Save Current Configuration dialog box appears.
Step 3 In the Configuration name field, enter a name for this particular configuration profile.Step 4 In the Configuration description field, enter a description of this particular configuration profile.
Profiles apply to all nodes within a cluster, but you cannot save and apply the profile to a differentcluster.
Note
The system creates the new configuration profile.
Cisco Unified Real-Time Monitoring Tool Administration Guide, Release 11.0(1) 91
Restore Configuration ProfilePerform the following procedure to restore a profile that you configured:
Procedure
Step 1 Choose File > Profile.The Preferences dialog box appears.
Step 2 Click the profile that you want to restore.Step 3 Click Restore.
All windows with precanned settings or performance monitoring counters for the restored configuration open.
Delete Configuration ProfilePerform the following procedure to delete a profile that you configured:
Procedure
Step 1 Choose File > Profile.The Preferences dialog box appears.
Step 2 Click the profile that you want to delete.Step 3 Click Delete.Step 4 Click Close.
Categories
Add CategoryFollow this procedure to add a category.
Procedure
Step 1 Go to the applicable window for your configuration:Choose System > Performance > Open PerformanceMonitoring.
Cisco Unified Communications Manager
Cisco Unified Real-Time Monitoring Tool Administration Guide, Release 11.0(1)92
Profiles and CategoriesRestore Configuration Profile

Choose System > Performance > Open PerformanceMonitoring.
CiscoUnifiedCommunicationsManager IMand Presence Service
Choose System > Performance > Open PerformanceMonitoring.
Cisco Unity Connection
Step 2 Choose Edit > Add New Category.Step 3 Enter the name of the category; click OK.
The category tab appears at the bottom of the window.
Rename CategoryTo rename a category, perform the following procedure:
Procedure
Step 1 Perform one of the following tasks:a) Right-click the category tab that you want to rename and choose Rename Category.b) Click the category tab that you want to rename and choose Edit > Rename Category.
Step 2 Enter the new name and click OK.The renamed category displays at the bottom of the window.
Delete CategoryTo delete a category, perform one of the following tasks:
• Right-click the category tab that you want to delete and choose Remove Category.
• Click the category tab that you want to delete and choose Edit > Remove Category.
Cisco Unified Real-Time Monitoring Tool Administration Guide, Release 11.0(1) 93
Profiles and CategoriesRename Category

Cisco Unified Real-Time Monitoring Tool Administration Guide, Release 11.0(1)94
Profiles and CategoriesDelete Category

C H A P T E R 6Performance Counters
• Counters, page 95
• Local Perfmon Counter Data Logging, page 98
• Log files on Perfmon Log Viewer and Microsoft Performance Tool, page 101
• Troubleshooting, page 104
Counters
Add Counter Using Performance QueriesYou can use queries to select and display perfmon counters. You can organize the perfmon counters to displaya set of feature-based counters and save it in a category. After you save your Unified RTMT profile, you canquickly access the counters in which you are interested.
Unified RTMT displays perfmon counters in chart or table format. The chart format displays the perfmoncounter information by using line charts. For each category tab that you create, you can display up to six chartsin the PerfmonMonitoring pane with up to three counters in one chart. After you create a category, you cannotchange the display from a chart format to a table format, or vice versa.
You can display up to three counters in one chart in the PerfmonMonitoring pane. To add another counterin a chart, click the counter and drag it to the Perfmon Monitoring pane. Repeat again to add up to threecounters.
Tip
By default, Unified RTMT displays perfmon counters in a chart format. You can also choose to display theperfmon counters in a table format. To display the perfmon counters in table format, you need to check thePresent Data in Table View check box when you create a new category.
Procedure
Step 1 Choose System > Performance > Open Performance Monitoring.Step 2 Click the name of the server where you want to add a counter to monitor.
Cisco Unified Real-Time Monitoring Tool Administration Guide, Release 11.0(1) 95

The tree hierarchy expands and displays all the perfmon objects.
Step 3 To monitor a counter in table format, continue to step 4. To monitor a counter in chart format, skip to step 9.Step 4 Choose Edit > New Category.Step 5 In the Enter Name field, enter a name for the tab.Step 6 To display the perfmon counters in table format, check the Present Data in Table View check box.Step 7 Click OK.
A new tab with the name that you entered appears at the bottom of the pane.
Step 8 Perform one of the following actions to select one or more counters with one or more instances for monitoringin table format (skip the remaining step in this procedure):
• Double-click a single counter and select a single instance from the popup window, and then click Add.
• Double-click a single counter and select multiple instances from the popup window, and then, clickAdd.
To display the counter in chart format after you display it in table format, right-click the category taband choose Remove Category. The counter displays in chart format.
Tip
Step 9 To monitor a counter in chart format, perform the following tasks:a) Click the file icon next to the object name that lists the counters that you want to monitor.
A list of counters appears.
b) To display the counter information, either right-click the counter and click Counter Monitoring,double-click the counter, or drag and drop the counter into the Perfmon Monitoring pane.The counter chart appears in the Perfmon Monitoring pane.
Remove Counter From Performance Monitoring PaneYou can remove a counter chart (table entry) with the Remove Chart/Table Entry menu item in the Perfmonmenu in the menu bar.
You can remove counters from the RTMT Perfmon Monitoring pane when you no longer need them. Followthis procedure to remove a counter from the pane.
Procedure
Perform one of the following tasks:
• Right-click the counter that you want to remove and choose Remove.
• Click the counter that you want to remove and choose Perfmon > Remove Chart/Table Entry.
Add Counter InstanceFollow this procedure to add a counter instance.
Cisco Unified Real-Time Monitoring Tool Administration Guide, Release 11.0(1)96
Performance CountersRemove Counter From Performance Monitoring Pane

Procedure
Step 1 Find and display the performance monitoring counter.Step 2 Click the performance monitoring counter in the performance monitoring tree hierarchy and choose System
> Performance > Counter Instances.Step 3 In the Select Instance window, click the instance, and then click Add.
The counter appears.
Set Up Counter Alert NotificationFollow this procedure to configure alert notification for a counter.
To remove the alert for the counter, right-click the counter and choose Remove Alert. The option appearsgray after you remove the alert.
Tip
Procedure
Step 1 Find and display the performance counter.Step 2 From the counter chart or table, right-click the counter for which you want to configure the alert notification,
and choose Set Alert/Properties.Step 3 Check the Enable Alert check box.Step 4 In the Severity drop-down list box, choose the severity level at which you want to be notified.Step 5 In the Description pane, enter a description of the alert and click Next.Step 6 Configure the settings in the Threshold, Value Calculated As, Duration, Frequency, and Schedule panes. After
you enter the settings in the window, click Next to proceed to the next panes.Step 7 To configure the system to send an e-mail message for the alert, check the Enable Email check box.Step 8 To trigger an alert action that is already configured, choose the alert action that you want from the Trigger
Alert Action drop-down list box.Step 9 To configure a new alert action for the alert, click Configure.
Whenever the specified alert is triggered, the system sends the alert action.Note
The Alert Action dialog box appears.
Step 10 To add a new alert action, click Add.The Action Configuration dialog box appears.
Step 11 In the Name field, enter a name for the alert action.Step 12 In the Description field, enter a description for the alert action.Step 13 Click Add to add a new e-mail recipient for the alert action.
The Input dialog box appears.
Cisco Unified Real-Time Monitoring Tool Administration Guide, Release 11.0(1) 97
Performance CountersSet Up Counter Alert Notification

Step 14 Enter either the e-mail or e-page address of the recipient that you want to receive the alert action notificationand click OK
Step 15 In the User-defined email text box, enter the text that you want to display in the e-mail message and clickActivate.
Display Counter DescriptionThe following shows how to obtain a description of the counter:
Procedure
Step 1 Perform one of the following tasks:a) In the Perfmon tree hierarchy, right-click the counter for which you want property information and choose
Counter Description.b) In the RTMT Performance Monitoring pane, click the counter and choose System > Performance >
Counter Description from the menu bar.You can display the counter description and configure data-sampling parameters.Tip
The Counter Property window displays the description of the counter. The description includes the hostaddress, the object to which the counter belongs, the counter name, and a brief overview of what thecounter does.
Step 2 To close the Counter Property window, click OK.
Local Perfmon Counter Data LoggingRTMT allows you to choose different perfmon counters to log locally. You can then view the data from theperfmon CSV log by using the performance log viewer.
Start Perfmon Counter LoggingTo start logging perfmon counter data into a CSV log file, perform the following procedure:
Procedure
Step 1 Find and display the performance monitoring counters.Step 2 If you are displaying perfmon counters in the chart format, right-click the graph for which you want data
sample information and choose Start Counter(s) Logging.The Counter Logging Configuration dialog box appears.
Cisco Unified Real-Time Monitoring Tool Administration Guide, Release 11.0(1)98
Performance CountersDisplay Counter Description

Step 3 If you want to log all counters in a screen (both chart and table view format), you can right-click the categoryname tab at the bottom of the window and choose Start Counter(s) Logging.The Counter Logging Configuration dialog box appears.
Step 4 Configure the maximum file size and maximum number of files parameter.Step 5 In the Logger File Name field, enter a filename and click OK.
RTMT saves the CSV log files in the log folder in the .jrtmt directory under the user home directory. Forexample, in Windows, the path specifies D:\Documents and Settings\userA\.jrtmt\log, orin Linux, the path specifies /users/home/.jrtmt/log.
To limit the number and size of the files, configure the maximum file size and maximum number of filesparameter in the trace output setting for the specific service in the Trace Configuration window of CiscoUnified Serviceability. See Cisco Unified Serviceability Administration Guide.
If you have already started logging perfmon counters and you want to change the maximum file sizeand maximum number of files, you must first stop the counters before you reconfigure the maximumfile size and number of files parameters. After resetting the parameters, you can then restart loggingperfmon counters.
Note
Stop Perfmon Counter LoggingTo stop logging perfmon counter data, perform the following procedure:
Procedure
Step 1 Find and display the performance monitoring counters.Step 2 If you are displaying perfmon counters in the chart format, right-click the graph for which counter logging is
started and choose Stop Counter(s) Logging. If you want to stop logging of all counters in a screen (bothchart and table view format), you can right-click the category name tab at the bottom of the window andchoose Stop Counter(s) Logging.
Configure Data SampleThe Counter Property window contains the option to configure data samples for a counter. The perfmoncounters that display in the RTMT Perfmon Monitoring pane contain green dots that represent samples ofdata over time. You can configure the number of data samples to collect and the number of data points toshow in the chart. After the data sample is configured, view the information by using the View All Data/ViewCurrent Data menu option.
Follow this procedure to configure the number of data samples to collect for a counter.
Cisco Unified Real-Time Monitoring Tool Administration Guide, Release 11.0(1) 99
Performance CountersStop Perfmon Counter Logging

Procedure
Step 1 Find and display the counter.Step 2 Click the counter for which you want data sample information and choose System > Performance >
Monitoring Properties.TheCounter Propertywindow displays the description of the counter, as well as the tab for configuring datasamples. The description includes the host address, the object to which the counter belongs, the counter name,and a brief overview of what the counter does.
Step 3 To configure the number of data samples for the counter, click the Data Sample tab.Step 4 From the No. of data samples drop-down list box, choose the number of samples (between 100 and 1000).
The default specifies 100.
Step 5 From theNo. of data points shown on chart drop-down list box, choose the number of data points to displayon the chart (between 10 and 50).The default specifies 20.
Step 6 Click one of the following parameters:
• Absolute: Because some counter values are accumulative, choose Absolute to display the data at itscurrent status.
• Delta: Choose Delta to display the difference between the current counter value and the previous countervalue.
• Delta Percentage: Choose Delta Percentage to display the counter performance changes in percentage.
Step 7 To close the Counter Property window and return to the RTMT Perfmon Monitoring pane, click OK.
View Counter DataFollow this procedure to view the data that is collected for a performance counter.
Procedure
Step 1 In the RTMT Perfmon Monitoring pane, right-click the counter chart for the counter for which you want toview data samples.
Step 2 Choose View All Data.The counter chart displays all data that has been sampled. The green dots display close together.
Step 3 Right-click the counter that currently appears.Step 4 Choose View Current.
The counter chart displays the last configured data samples that were collected.
Cisco Unified Real-Time Monitoring Tool Administration Guide, Release 11.0(1)100
Performance CountersView Counter Data

Log files on Perfmon Log Viewer and Microsoft PerformanceTool
The performance log viewer displays a chart with the data from the selected counters. The bottom pane displaysthe selected counters, a color legend for those counters, display option, mean value, minimum value, and themaximum value.
The following table describes the functions of different buttons that are available on the Performance LogViewer.
Table 15: Performance Log Viewer
FunctionButton
Allows you to add counters that you want to display in the performancelog viewer. If you do not want to display a counter, uncheck the Displaycolumn next to the counter.
Select Counters
Resets the performance log viewer to the initial default view.Reset View
Allows you to save the log file to your local computer.Save Downloaded File
View Log Files on Perfmon Log ViewerThe Performance Log Viewer displays data for counters from perfmon CSV log files in a graphical format.You can use the performance log viewer to display data from the local perfmon logs that you collected, oryou can display the data from the Real-time Information Server Data Collection (RISDC) perfmon logs.
Before You Begin
The local perfmon logs consist of data from counters that you select and store locally on your computer.
Procedure
Step 1 Select System > Performance > Open Performance Log Viewer.Step 2 Select the type of perfmon logs that you want to view:
• For RisDC Perfmon Logs, perform the following steps:
1 Select RisDC Perfmon Logs in the Select Perfmon Log Location section.
2 Select a node from the list box.
3 Select Open.
4 Select the file and select Open File.
5 Check the counters that you want to display.
Cisco Unified Real-Time Monitoring Tool Administration Guide, Release 11.0(1) 101
Performance CountersLog files on Perfmon Log Viewer and Microsoft Performance Tool

6 Select OK.
• For locally stored data, perform the following actions:
1 Select Local Perfmon Logs.
2 Select Open.
3 Browse to the file directory.
4 Select the file that you are interested in viewing or enter the filename in the filename field.
5 Select Open.
6 Check the counters that you want to display.
7 Select OK.
Step 3 Select the counters that you want to display.Step 4 Select OK.
Troubleshooting Tips
• The Real-Time Monitoring Tool saves the perfmon CSV log files in the log folder in the.jrtmt directoryunder the user home directory. InWindows, the path specifies D:\Documents and Settings\userA\.jrtmt\log,or in Linux, the path specifies /users/home/.jrtmt/log
• The RISDC perfmon logging is also known as Troubleshooting PerfmonData logging.When you enableRISDC perfmon logging, the server collects data that are used to troubleshoot problems. Because theIM and Presence service collects a large amount of data in a short period of time, you should limit thetime that RISDC perfmon data logging (troubleshooting perfmon data logging) is enabled.
• You can order each column by selecting on a column heading. The first time that you select on a columnheading, the records display in ascending order. A small triangle pointing up indicates ascending order.If you select the column heading again, the records display in descending order. A small triangle pointingdown indicates descending order. If you select the column heading one more time, the records displaysin the unsorted state.
Zoom In and Out in Performance Log ViewerThe Performance Log viewer includes a zoom feature that allows you to zoom in on and out on an area in thechart.
Procedure
Step 1 Perform one of the following actions:a) On the Quick Launch Channel:
• Select System.
• In the tree hierarchy, double-select Performance to display the performance icons.
Cisco Unified Real-Time Monitoring Tool Administration Guide, Release 11.0(1)102
Performance CountersZoom In and Out in Performance Log Viewer

• Select the Performance icon.
b) Select System > Performance > Open Performance Monitoring.
Step 2 Select the name of the server where the counter is located.The tree hierarchy expands and displays all the perfmon objects for the node.
Step 3 Double-select the performance counter you want to monitor.Step 4 Perform one of the following actions:
ActionIf you want to:
• Select and drag the left mouse button over the area of the chartin which you are interested.
• Release the left mouse button when you have the selected area.
Zoom in on an area in the chart
Perform one of the following actions:
• Select Reset View.
• Right-mouse select the chart and select Reset.
Reset the chart to the initial defaultview
View Perfmon Log Files with Microsoft Performance Tool
The method for accessing Performance may vary depending on the version of windows you install onyour computer.
Note
Procedure
Step 1 Select Start > Settings > Control Panel > Administrative Tools > Performance.Step 2 Perform the following actions in the application window:
a) Select the right mouse button.b) Select Properties.
Step 3 Select the Source tab in the System Monitor Properties dialog box.Step 4 Browse to the directory where you downloaded the perfmon log file and select the perfmon csv file. The log
file includes the following naming convention:
Cisco Unified Real-Time Monitoring Tool Administration Guide, Release 11.0(1) 103
Performance CountersView Perfmon Log Files with Microsoft Performance Tool

PerfMon_<node>_<month>_<day>_<year>_<hour>_<minute>.csv; for example,PerfMon_172.19.240.80_06_15_2005_11_25.csv.
Step 5 Select Apply.Step 6 Select Time Range. To specify the time range in the perfmon log file that you want to view, drag the bar to
the appropriate starting and ending times.Step 7 To open the Add Counters dialog box, select the Data tab and select Add.Step 8 Select the perfmon object from the Performance Object drop-down list box. If an object has multiple instances,
you may select All instances or select only the instances that you are interested in viewing.Step 9 You can select All Counters or select only the counters that you are interested in viewing.Step 10 Select Add to add the selected counters.Step 11 Select Close when you finish selecting counters.
Troubleshooting
Perfmon Data Log TroubleshootingThe troubleshooting perfmon data logging feature assists Cisco TAC in identifying system problems. Whenyou enable troubleshooting perfmon data logging, you initiate the collection of a set of system and operatingsystem performance statistics on the selected node. The statistics that are collected include comprehensiveinformation that you can use for system diagnosis.
The system automatically enables troubleshooting perfmon data logging to collect statistics from a set ofperfmon counters that provides comprehensive information about the system state. When you eableTroubleshooting Perfmon Data Logging, Cisco estimates that the system experiences a less than five percentincrease in CPU utilization and an insignificant increase in the amount of memory that is being used, and itwrites approximately 50 MB of information to the log files daily.
You can perform the following administrative tasks with the troubleshooting perfmon data logging feature:
• Enable and disable the trace filter for Troubleshooting perfmon data logging.
• Monitor a set of predefined System and performance objects and counters on each server.
• Log the monitored performance data in CSV file format on the server in the active log partition in thevar/log/active/cm/log/ris/csv directory. The log file uses the following naming convention:PerfMon_<node>_<month>_<day>_<year>_<hour>_<minute>.csv; for example,PerfMon_172.19.240.80_06_15_2005_11_25.csv. Specify the polling rate. This rate specifies the rateat which performance data is gathered and logged. You can configure the polling rate down to 5 seconds.Default polling rate equals 15 seconds.
• View the log file in graphical format by using the Microsoft Windows performance tool or by using thePerformance Log viewer in the Real-Time Monitoring Tool.
• Specify the maximum number of log files that will be stored on disk. Log files exceeding this limit arepurged automatically by removal of the oldest log file. The default specifies 50 files.
• Specify the rollover criteria of the log file based on the maximum size of the file in megabytes. Thedefault value specifies 2 MB.
Cisco Unified Real-Time Monitoring Tool Administration Guide, Release 11.0(1)104
Performance CountersTroubleshooting

• Collect the Cisco RIS Data Collector PerfMonLog log file by using the Trace & Log Central feature ofthe Real-Time Monitoring Tool or Command Line Interface.
The troubleshooting perfmon data-logging feature collects information from the following counters withinthe following perfmon objects.
Cisco Unity Connection counters are not logged to the troubleshooting perfmon data log.Note
• Database Change Notification Server Object:
◦Clients
◦CNProcessed
◦QueueDelay
◦QueuedRequestsInDB
◦QueuedRequestsInMemory
• Database Local DSN Object:
◦CcmDbSpace_Used
◦CcmtempDbSpace_Used
◦CNDbSpace_Used
◦LocalDSN
◦RootDbSpace_Used
◦SharedMemory_Free
◦SharedMemory_Used
• Enterprise Replication DBSpace Monitors Object:
◦ERDbSpace_Used
◦ERSBDbSpace_Used
• IP Object:
◦In Receives
◦In HdrErrors
◦In UnknownProtos
◦In Discards
◦In Delivers
◦Out Requests
◦Out Discards
◦Reasm Reqds
Cisco Unified Real-Time Monitoring Tool Administration Guide, Release 11.0(1) 105
Performance CountersPerfmon Data Log Troubleshooting

◦Reasm Oks
◦Reasm Fails
◦Frag OKs
◦Frag Fails
◦Frag Creates
◦InOut Requests
• Memory Object:
◦% Page Usage
◦% VM Used
◦%Mem Used
◦Buffers Kbytes
◦Cached Kbytes
◦Free Kbytes
◦Free Swap Kbytes
◦HighFree
◦HighTotal
◦Low Total
◦Low Free
◦Page Faults Per Sec
◦Page Major Faults Per Sec
◦Pages
◦Pages Input
◦Pages Input Per Sec
◦Pages Output
◦Pages Output Per Sec
◦SlabCache
◦SwapCached
◦Shared Kbytes
◦Total Kbytes
◦Total Swap Kbytes
◦Total VM Kbytes
◦Used Kbytes
◦Used Swap Kbytes
Cisco Unified Real-Time Monitoring Tool Administration Guide, Release 11.0(1)106
Performance CountersPerfmon Data Log Troubleshooting
◦Used VM Kbytes
• Network Interface Object:
◦Rx Bytes
◦Rx Packets
◦Rx Errors
◦Rx Dropped
◦Rx Multicast
◦Tx Bytes
◦Tx Packets
◦Tx Errors
◦Tx Dropped
◦Total Bytes
◦Total Packets
◦Tx QueueLen
• Number of Replicates Created and State of Replication Object:
◦Replicate_State
• Partition Object:
◦% CPU Time
◦%Used
◦Await Read Time
◦Await Time
◦Await Write Time
◦Queue Length
◦Read Bytes Per Sec
◦Total Mbytes
◦Used Mbytes
◦Write Bytes Per Sec
• Process Object:
◦%Memory Usage
◦Data Stack Size
◦Nice
◦PID
Cisco Unified Real-Time Monitoring Tool Administration Guide, Release 11.0(1) 107
Performance CountersPerfmon Data Log Troubleshooting

◦STime
◦% CPU Time
◦Page Fault Count
◦Process Status
◦Shared Memory Size
◦VmData
◦VmRSS
◦VmSize
◦Thread Count
◦Total CPU Time Used
• Processor Object:
◦Irq Percentage
◦Softirq Percentage
◦IOwait Percentage
◦User Percentage
◦Nice Percentage
◦System Percentage
◦Idle Percentage
◦%CPU Time
• System Object:
◦Allocated FDs
◦Freed FDs
◦Being Used FDs
◦Max FDs
◦Total Processes
◦Total Threads
◦Total CPU Time
• TCP Object:
◦Active Opens
◦Passive Opens
◦Attempt Fails
◦Estab Resets
Cisco Unified Real-Time Monitoring Tool Administration Guide, Release 11.0(1)108
Performance CountersPerfmon Data Log Troubleshooting

◦Curr Estab
◦In Segs
◦Out Segs
◦Retrans Segs
◦InOut Segs
• ThreadObject (Troubleshooting PerfmonData Logger only logs CiscoUnified CommunicationsManagerthreads):
◦%CPU Time
• Cisco CallManager Object:
◦CallManagerHeartBeat
◦CallsActive
◦CallsAttempted
◦CallsCompleted
◦InitializationState
◦RegisteredHardwarePhones
◦RegisteredMGCPGateway
• Cisco SIP Stack Object:
◦CCBsAllocated
◦SCBsAllocated
◦SIPHandlerSDLQueueSignalsPresent
• Cisco CallManager System Performance Object:
◦AverageExpectedDelay
◦CallsRejectedDueToThrottling
◦CodeRedEntryExit
◦CodeYellowEntryExit
◦QueueSignalsPresent 1-High
◦QueueSignalsPresent 2-Normal
◦QueueSignalsPresent 3-Low
◦QueueSignalsPresent 4-Lowest
◦QueueSignalsProcessed 1-High
◦QueueSignalsProcessed 2-Normal
◦QueueSignalsProcessed 3-Low
Cisco Unified Real-Time Monitoring Tool Administration Guide, Release 11.0(1) 109
Performance CountersPerfmon Data Log Troubleshooting

◦QueueSignalsProcessed 4-Lowest
◦QueueSignalsProcessed Total
◦SkinnyDevicesThrottled
◦ThrottlingSampleActivity
◦TotalCodeYellowEntry
• Cisco TFTP Server Object:
◦BuildAbortCount
◦BuildCount
◦BuildDeviceCount
◦BuildDialruleCount
◦BuildDuration
◦BuildSignCount
◦BuildSoftkeyCount
◦BuildUnitCount
◦ChangeNotifications
◦DeviceChangeNotifications
◦DialruleChangeNotifications
◦EncryptCount
◦GKFoundCount
◦GKNotFoundCount
◦HeartBeat
◦HttpConnectRequests
◦HttpRequests
◦HttpRequestsAborted
◦HttpRequestsNotFound
◦HttpRequestsOverflow
◦HttpRequestsProcessed
◦HttpServedFromDisk
◦LDFoundCount
◦LDNotFoundCount
◦MaxServingCount
◦Requests
◦RequestsAborted
Cisco Unified Real-Time Monitoring Tool Administration Guide, Release 11.0(1)110
Performance CountersPerfmon Data Log Troubleshooting

◦RequestsInProgress
◦RequestsNotFound
◦RequestsOverflow
◦RequestsProcessed
◦SegmentsAcknowledged
◦SegmentsFromDisk
◦SegmentsSent
◦SEPFoundCount
◦SEPNotFoundCount
◦SIPFoundCount
◦SIPNotFoundCount
◦SoftkeyChangeNotifications
◦UnitChangeNotifications
Troubleshoot Perfmon Data LoggingFollow this procedure to collect information from counters within the perfmon objects with the perfmondata-logging feature.
Before You Begin
• Be aware that RISDC perfmon logging is also known as Troubleshooting Perfmon Data logging. Whenyou enable RISDC perfmon logging, the server collects performance data that are used to troubleshootproblems.
•When you enable RIS Data Collector (RISDC) perfmon logs, Unified Communications Manager andthe IM and Presence Service collect information for the system in logs that are written on the server.
• You can enable or disable RISDC perfmon logs in the administrative interface by selecting System >Service Parameter and selecting the Cisco RIS Data Collector Service from the Service list box. Bydefault, RISDC perfmon logging is enabled.
Procedure
Step 1 Select System > Service Parameters the administration interface.Step 2 Select the server from the Server list box.Step 3 Select the Cisco RIS Data Collector from the Service drop-down list box.Step 4 Enter the appropriate settings as described in the following table.
Cisco Unified Real-Time Monitoring Tool Administration Guide, Release 11.0(1) 111
Performance CountersPerfmon Data Log Troubleshooting

Table 16: Troubleshooting Perfmon Data-Logging Parameters
DescriptionField
From the drop-down list box, select True to enable or False to disabletroubleshooting perfmon data logging. The default value specifiesFalse.
Enable Logging
Enter the polling rate interval (in seconds). You can enter a value from5 (minimum) to 300 (maximum). The default value specifies 15.
Polling Rate
Enter themaximum number of Troubleshooting PerfmonData Loggingfiles that you want to store on disk. You can enter a value from 1(minimum) up to 100 (maximum). The default value specifies 50.
Consider your storage capacity in configuring the Maximum No. ofFiles and Maximum File Size Parameters. We recommend that you donot exceed a value of 100 MB when you multiply the MaximumNumber of Files value by the Maximum File Size value.
When the number of files exceeds the maximum number of files thatyou specified in this field, the system deletes log files with the oldesttime stamp.
If you do not save the log files on another computer beforeyou change this parameter, you risk losing the log files.
Caution
Maximum No. of Files
Enter the maximum file size (in megabytes) that you want to store ina perfmon log file before a new file is started. You can enter a valuefrom 1 (minimum) to 500 (maximum). The default value specifies 2MB.
Consider your storage capacity in configuring the Maximum No. ofFiles and Maximum File Size Parameters. We recommend that you donot exceed a value of 100 MB when you multiply the MaximumNumber of Files value by the Maximum File Size value.
Maximum File Size (MB)
Step 5 Select Save.You can collect the log files for Cisco RIS Data Collector service on the server by using RTMT todownload the log files. If you want to download the log files by using the CLI, refer to AdministrationGuide for Cisco Unified Communications Manager . After you collect the log files, you can viewthe log file by using the Performance Log Viewer in RTMT or by using the Microsoft Windowsperformance tool.
Note
Cisco Unified Real-Time Monitoring Tool Administration Guide, Release 11.0(1)112
Performance CountersPerfmon Data Log Troubleshooting

C H A P T E R 7Alerts
• Alert Central Displays, page 113
• Alert Action Setup, page 120
• Set up alerts for core dump and collect relevant logs, page 125
Alert Central DisplaysUnified RTMT displays both preconfigured alerts and custom alerts in Alert Central. Unified RTMT organizesthe alerts under the applicable tabs: System, Voice/Video, IM and Presence Service, Cisco Unity Connection,and Custom.
You can enable or disable preconfigured and custom alerts in Alert Central; however, you cannot deletepreconfigured alerts.
System AlertsThe following list comprises the preconfigured system alerts:
• AuthenticationFailed
• CiscoDRFFailure
• CoreDumpFileFound
• CpuPegging
• CriticalServiceDown
• DBChangeNotifyFailure
• DBReplicationFailure
• DBReplicationTableOutofSync
• HardwareFailure
• LogFileSearchStringFound
• LogPartitionHighWaterMarkExceeded
Cisco Unified Real-Time Monitoring Tool Administration Guide, Release 11.0(1) 113

• LogPartitionLowWaterMarkExceeded
• LowActivePartitionAvailableDiskSpace
• LowAvailableVirtualMemory
• LowInactivePartitionAvailableDiskSpace
• LowSwapPartitionAvailableDiskSpace
• ServerDown (Applies to Unified Communications Manager clusters)
• SparePartitionHighWaterMarkExceeded
• SparePartitionLowWaterMarkExceeded
• SyslogSeverityMatchFound
• SyslogStringMatchFound
• SystemVersionMismatched
• TotalProcessesAndThreadsExceededThreshold
Related Topics
System Alerts, on page 319
Automatic Trace Download ActivationSome preconfigured alerts allow you to initiate a trace download based on the occurrence of an event. Youcan automatically capture traces when a particular event occurs by checking the Enable Trace Downloadcheck box in Set Alert/Properties for the following alerts:
• CriticalServiceDown: CriticalServiceDown alert is generated when any service is down.CriticalServiceDown alert monitors only those services that are listed in RTMT Critical Services.
The Unified RTMT backend service checks status (by default) every 30 seconds. Ifservice goes down and comes back up within that period, CriticalServiceDown alertmay not be generated.
Note
• CodeYellow: This alarm indicates that Cisco Unified Communications Manager initiated call throttlingdue to unacceptably high delay in handling calls.
• CoreDumpFileFound: CoreDumpFileFound alert is generated when the Unified RTMT backend servicedetects a new Core Dump file.
You can configure both CriticalServiceDown and CoreDumpFileFound alerts to download correspondingtrace files for troubleshooting purposes. This setup helps preserve trace files at the time of crash.
Note
Cisco Unified Real-Time Monitoring Tool Administration Guide, Release 11.0(1)114
AlertsSystem Alerts
Trace Download may affect services on the node. A high number of downloads adversely impacts thequality of services on the node.
Caution
Voice and Video AlertsThe following list comprises the preconfigured Voice and Video alerts:
• BeginThrottlingCallListBLFSubscriptions
• CallAttemptBlockedByPolicy
• CallProcessingNodeCpuPegging
• CARIDSEngineCritical
• CARIDSEngineFailure
• CARSchedulerJobFailed
• CDRAgentSendFileFailed
• CDRFileDeliveryFailed
• CDRHighWaterMarkExceeded
• CDRMaximumDiskSpaceExceeded
• CiscoElmNotConnected
• CiscoGraceTimeLeft
• CiscoNoProvisionTimeout
• CiscoSystemInDemo
• CiscoSystemInOverage
• CiscoSystemSecurityMismatch
• CodeYellow
• DDRBlockPrevention
• DDRDown
• EMCCFailedInLocalCluster
• EMCCFailedInRemoteCluster
• ExcessiveVoiceQualityReports
• ILSHubClusterUnreachable
• ILSPwdAuthenticationFailed
• ILSTLSAuthenticationFailed
• IMEDistributedCacheInactive
• IMEOverQuota
Cisco Unified Real-Time Monitoring Tool Administration Guide, Release 11.0(1) 115
AlertsVoice and Video Alerts

• IMEQualityAlert
• IMEServiceStatus
• InsufficientFallbackIdentifiers
• InvalidCredentials
• LocationOutOfResource
• MaliciousCallTrace
• MediaListExhausted
• MgcpDChannelOutOfService
• NumberOfRegisteredDevicesExceeded
• NumberOfRegisteredGatewaysDecreased
• NumberOfRegisteredGatewaysIncreased
• NumberOfRegisteredMediaDevicesDecreased
• NumberOfRegisteredMediaDevicesIncreased
• NumberOfRegisteredPhonesDropped
• RecordingCallSetupFail
• RecordingGatewayRegistrationRejected
• RecordingGatewayRegistrationTimeout
• RecordingGatewaySessionFailed
• RecordingResourcesNotAvailable
• RecordingSessionTerminatedUnexpectedly
• RouteListExhausted
• RTMTSessionExceedsThreshold
• SDLLinkOutOfService
• TCPSetupToIMEFailed
• TLSConnectionToIMEFailed
• UserInputFailure
Related Topics
Voice and Video Alerts, on page 337
IM and Presence Service AlertsThe following list comprises the preconfigured IM and Presence Service alerts:
• CTIGWModuleNotEnabled
• CTIGWProviderDown
Cisco Unified Real-Time Monitoring Tool Administration Guide, Release 11.0(1)116
AlertsIM and Presence Service Alerts

• CTIGWUserNotLicenced
• CTIGWUserNotAuthorized
• CTIGWProviderFailedToOpen
• CTIGWQBEFailedRequest
• CTIGWSystemError
• EspConfigAgentMemAllocError
• EspConfigAgentFileWriteError
• EspConfigAgentNetworkOutage
• EspConfigAgentNetworkRestored
• EspConfigAgentHighMemoryUtilization
• EspConfigAgentHighCPUUtilization
• EspConfigAgentLocalDBAccessError
• EspConfigAgentProxyDomainNotConfigured
• EspConfigAgentRemoteDBAccessError
• EspConfigAgentSharedMemoryStaticRouteError
• ESPConfigError
• ESPConfigNotFound
• ESPCreateLockFailed
• ESPLoginError
• ESPMallocFailure
• ESPNAPTRInvalidRecord
• ESPPassedParamInvalid
• ESPRegistryError
• ESPRoutingError
• ESPSharedMemCreateFailed
• ESPSharedMemSetPermFailed
• ESPSharedMemAllocFailed
• ESPSocketError
• ESPStopped
• ESPStatsLogFileOpenFailed
• ESPVirtualProxyError
• ESPWrongIPAddress
• ESPWrongHostName
Cisco Unified Real-Time Monitoring Tool Administration Guide, Release 11.0(1) 117
AlertsIM and Presence Service Alerts

• ICSACertificateCASignedTrustCertFound
• ICSACertificateFingerPrintMisMatch
• ICSACertificateValidationFailure
• InterclusterSyncAgentPeerDuplicate
• LegacyCUPCLogin
• NotInCucmServerListError
• PEAutoRecoveryFailed
• PEDatabaseError
• PEIDSQueryError
• PEIDSSubscribeError
• PEIDStoIMDBDatabaseSyncError
• PELoadHighWaterMark
• PEMemoryHighCondition
• PEPeerNodeFailure
• PESipSocketBindFailure
• PEStateDisabled
• PEStateLocked
• PEWebDAVInitializationFailure
• PWSSCBFindFailed
• PWSSCBInitFailed
• PWSAboveCPULimit
• PWSAboveSipSubscriptionLimit
• PWSRequestLimitReached
• SRMFailed
• SRMFailover
• SyncAgentAXLConnectionFailed
• UASCBFindFailed
• UASCBGetFailed
• XcpCmComponentConnectError
• XcpCmPauseSockets
• XcpCmStartupError
• XcpCmXmppdError
• XcpConfigMgrConfigurationFailure
Cisco Unified Real-Time Monitoring Tool Administration Guide, Release 11.0(1)118
AlertsIM and Presence Service Alerts

• XcpConfigMgrHostNameResolutionFailed
• XcpConfigMgrJabberRestartRequired
• XcpConfigMgrR2RPasswordEncryptionFailed
• XcpConfigMgrR2RRequestTimedOut
• XcpDBConnectError
• XcpMdnsStartError
• XcpSIPFedCmComponentConnectError
• XcpSIPFedCmStartupError
• XcpSIPGWStackResourceError
• XcpThirdPartyComplianceConnectError
• XcpTxtConfComponentConfigError
• XcpTxtConfDBConnectError
• XcpTxtConfDBQueueSizeLimitError
• XcpTxtConfGearError
• XcpWebCmComponentConnectError
• XcpWebCmHttpdError
• XcpWebCmStartupError
• XcpXMPPFedCmComponentConnectError
• XcpXMPPFedCmStartupError
Related Topics
IM and Presence Service Alerts, on page 375
Cisco Unity Connection AlertsThe following list comprises the preconfigured Cisco Unity Connection alerts.
• NoConnectionToPeer
• AutoFailoverSucceeded
• AutoFailoverFailed
• AutoFailbackSucceeded
• AutoFailbackFailed
• SbrFailed (Split Brain Resolution Failed)
• DiskConsumptionCloseToCapacityThreshold
• DiskConsumptionExceedsCapacityThreshold
• LicenseExpirationWarning
Cisco Unified Real-Time Monitoring Tool Administration Guide, Release 11.0(1) 119
AlertsCisco Unity Connection Alerts

• LicenseExpired
The first six alerts apply only to Cisco Unity Connection cluster configurations.Note
Related Topics
Cisco Unity Connection Alerts, on page 409
Alert Action SetupIn RTMT, you can configure alert actions for every alert that is generated and have the alert action sent toe-mail recipients that you specify in the alert action list.
The following table provides a list of fields that you will use to configure alert actions. Users can configureall fields, unless otherwise marked.
Table 17: Alert Action Configuration
CommentDescriptionField
Specify descriptive name.ID of alert action to take.Alert Action ID
—List of e-mail addresses. You canselectively enable or disable anindividual e-mail in the list.
Mail Recipients
Access Alert Central and Set Up AlertsBy using the following procedure, you can perform tasks, such as access Alert Central, sort alert information,enable, disable, or remove an alert, clear an alert, or view alert details.
Procedure
Step 1 Perform one of the following tasks:a) On the Quick Launch Channel, do the following:
1 Click System.
2 In the tree hierarchy, double-click Tools.
3 Click the Alert Central icon.
b) Choose System > Tools > Alert > Alert Central.The Alert Central monitoring window displays and shows the alert status and alert history of the alertsthat the system has generated.
Cisco Unified Real-Time Monitoring Tool Administration Guide, Release 11.0(1)120
AlertsAlert Action Setup

Step 2 Perform one of the following tasks:a) Set alert properties.b) Suspend alerts.c) Configure e-mails for alert notification.d) Configure alert actions.e) Sort alert information in the Alert Status pane. Click the up/down arrow that displays in the column heading.
For example, click the up/down arrow that displays in the Enabled or In Safe Range column.
You can sort alert history information by clicking the up/down arrow in the columns in the Alert Historypane. To see alert history that is out of view in the pane, use the scroll bar on the right side of the AlertHistory pane.
f) To enable, disable, or remove an alert, perform one of the following tasks:
• From the Alert Status window, right-click the alert and chooseDisable/Enable Alert (option toggles)or Remove Alert, depending on what you want to accomplish.
• Highlight the alert in the Alert Status window and choose System >Tools >Alert >Disable/Enable(or Remove) Alert.
You can remove only user-defined alerts from RTMT. The Remove Alert option appears grayedout when you choose a preconfigured alert.
Tip
g) To clear either individual or collective alerts after they get resolved, perform one of the following tasks:
• After the Alert Status window displays, right-click the alert and choose Clear Alert (or Clear AllAlerts).
• Highlight the alert in the Alert Status window and choose System > Tools > Alert > Clear Alert(or Clear All Alerts).
After you clear an alert, it changes from red to black.
h) To reset alerts to default configuration, perform one of the following tasks:
• After the Alert Status window displays, right-click the alert and choose Reset Alert to DefaultConfig, to reset that alert to the default configuration.
• Choose System > Tools > Alert > Reset all Alerts to Default Config, to reset all the alerts to thedefault configuration.
i) To view alert details, perform one of the following tasks:
• After the Alert Status window displays, right-click the alert and choose Alert Details.
• Highlight the alert in the Alert Status window and choose System > Tools > Alert > Alert Details.
After you have finished viewing the alert details, clickOK.
Tip
Cisco Unified Real-Time Monitoring Tool Administration Guide, Release 11.0(1) 121
AlertsAccess Alert Central and Set Up Alerts

Set Alert PropertiesUsing the alert notification feature, the application notifies you of system problems. The following configurationsetup is required to activate alert notifications for a system performance counter.
From the RTMT PerfmonMonitoring pane, you select the system perfmon counter and perform the followingactions:
• Set up an e-mail or a message popup window for alert notification.
• Determine the threshold for the alert.
• Determine the frequency of the alert notification (for example, the alert occurs once or every hour).
• Determine the schedule for when the alert activates (for example, on a daily basis or at certain times ofthe day).
To remove the alert for the counter, right-click the counter and choose Remove Alert. The option appearsdim after you remove the alert.
Tip
Procedure
Step 1 Perform one of the following actions:ActionIf you want to:
• Display the performance counter.
• From the counter chart or table, right-select the counter for which youwant to configure the alert notification, and select Set Alert/Properties.
• Check the Enable Alert check box.
Set alert properties for aperformance counter
• Access Alert Central.
• Select the alert for which you want to set alert properties.Perform one of the following actions:
◦Right-select the alert and select Set Alert/Properties.
◦Select System > Tools > Alert > Set Alert/Properties.
◦Check the Enable Alert check box.
Set alert properties fromAlert Central
Cisco Unified Real-Time Monitoring Tool Administration Guide, Release 11.0(1)122
AlertsSet Alert Properties

Step 2 Select the severity level at which you want to be notified in the Severity list check box.Step 3 Enter a description of the alert in the Description pane.Step 4 Select Next.Step 5 Configure the settings in the Threshold, Value Calculated As, Duration, Frequency, and Schedule panes.
Table 18: Counter Alert Configuration Parameters
DescriptionSetting
Threshold Pane
Check and enter the value that applies:
• Over: Check to configure a maximum threshold that must be met beforean alert notification is activated. In the Over value field, enter a value.For example, enter a value that equals the number of calls in progress.
• Under: Check to configure a minimum threshold that must be met beforean alert notification is activated. In the Under value field, enter a value.For example, enter a value that equals the number of calls in progress.
Use these check boxes in conjunction with the Frequency andSchedule configuration parameters.
Tip
Trigger alert whenfollowing conditions met(Over, Under)
Value Calculated As Pane
Select the radio button that applies:
• Absolute: Because some counter values are accumulative, select Absoluteto display the data at its current status.
• Delta: Select Delta to display the difference between the current countervalue and the previous counter value.
• Delta Percentage: Select Delta Percentage to display the counterperformance changes in percentage.
Absolute, Delta, DeltaPercentage
Duration Pane
• Trigger alert only when value constantly...: If you want the alertnotification only when the value is constantly below or over threshold fora desired number of seconds, select this radio button and enter secondsafter which you want the alert to be sent.
• Trigger alert immediately: If you want the alert notification to be sentimmediately, select this radio button.
Trigger alert only whenvalue constantly...; Triggeralert immediately
Frequency Pane
Cisco Unified Real-Time Monitoring Tool Administration Guide, Release 11.0(1) 123
AlertsSet Alert Properties

DescriptionSetting
Select the radio button that applies:
• Trigger alert on every poll: If you want the alert notification to activateon every poll when the threshold is met, select this radio button.
• Trigger up to...: If you want the alert notification to activate at certainintervals, select this radio button and enter the number of alerts that youwant sent and the number of minutes within which you want them sent.
Trigger alert on every poll;trigger up to...
Schedule Pane
Select the radio button that applies:
• 24-hours daily: If you want the alert to be triggered 24 hours a day, selectthis radio button.
• Start/Stop: If you want the alert notification activated within a specifictime frame, select the radio button and enter a start time and a stop time.If checked, enter the start and stop times of the daily task. For example,you can configure the counter to be checked every day from 9:00 a.m. to5:00 p.m. or from 9:00 p.m. to 9:00 a.m.
24-hours daily; start/stop
Suspend AlertsYou may want to temporarily suspend some or all alerts; you can suspend alerts on a particular node or onan entire cluster. For example, if you are upgrading your system to a newer release, suspend alerts until theupgrade completes, so that you do not receive e-mails and e-pages during the upgrade.
Follow this procedure to suspend alerts in Alert Central.
Procedure
Step 1 Choose System > Tools > Alert > Suspend cluster/node Alerts.Per node suspend states do not apply to clusterwidealerts.
Note
Step 2 Perform one of the following actions:
• To suspend all alerts in the cluster, click theClusterWide radio button and check the Suspend all alertscheck box.
Cisco Unified Real-Time Monitoring Tool Administration Guide, Release 11.0(1)124
AlertsSuspend Alerts

• To suspend alerts per server, click the Per Server radio button and check the Suspend check box ofeach server on which you want alerts to be suspended.
Step 3 Click OK.To resume alerts, choose Alert > Suspend cluster/node Alerts and uncheck the suspend checkboxes.
Note
Set up alerts for core dump and collect relevant logsCore dumps can be difficult to reproduce so it is particularly important to collect the log files associated withthem when they occur and before they are over written.
Set up an e-mail alert for core dumps, so that you are immediately notified when one occurs to assist introubleshooting its cause.
Enable email alert
Procedure
Step 1 Select System > Tools > Alert Central.Step 2 Right-click CoreDumpFileFound alert and select Set Alert Properties.Step 3 Follow the wizard to set your preferred criteria, including checking the Enable Email check box.Step 4 Select System > Tools > Alert > Config Email Server.Step 5 Enter the e-mail server settings.
Collect logsFollow this procedure to collect logs after you receive an e-mail alert.
Procedure
Step 1 Note which services initiated the alert, which are indicated by “Core” in the e-mail message.Step 2 Select Tools > Trace & Log Central > Collect Files and select the relevant logs for all impacted services.
For example, if the service is Cisco Presence Engine, collect the Cisco Presence Engine, Cisco XCP routerand Cisco XCP Connection Manager logs. Or, if the service is Cisco XCP Router, collect the Cisco XCPRouter, and Cisco XCP Connection Manager and Cisco Presence Engine logs.
Step 3 Generate the stack trace by running the following commands from the CLI:utils core active list
utils core active analyze core filename
Cisco Unified Real-Time Monitoring Tool Administration Guide, Release 11.0(1) 125
AlertsSet up alerts for core dump and collect relevant logs

Step 4 Select Tools > Trace & Log Central > Collect Files and select the RIS Data Collector PerfMon Log.Step 5 Select Tools > SysLog Viewer to collect the system logs.
a) Select a node.b) Click System Logs >messages to view and save the messages.c) Click Application Logs > CiscoSyslog to view and save the log file.
Step 6 Attach the collected files to your Cisco technical support case.
Cisco Unified Real-Time Monitoring Tool Administration Guide, Release 11.0(1)126
AlertsCollect logs

C H A P T E R 8Traces and Logs
• Trace and Log Central, page 127
• Log Viewers, page 168
• Plugins, page 171
Trace and Log Central
For Trace and Log Central to work, you must resolve DNS lookup for all nodes in the cluster on the clientmachine.
Note
Preparation
Import CertificatesFollow this procedure to import the node certificates.
You can import the server authentication certificate that the certificate authority provides for the node or foreach node in the cluster.
We recommend that you import the certificates before using the trace and log central option. If you do notimport the certificates, the Trace and Log Central option displays a security certificate for the nodes each timethat you sign in to Unified RTMT and access the Trace and Log Central option. You cannot change any datathat displays for the certificate.
Procedure
Step 1 To import the certificate, choose Tools > Trace > Import Certificate.A messages appears that states that the system imported the node certificates.
Step 2 Click OK.
Cisco Unified Real-Time Monitoring Tool Administration Guide, Release 11.0(1) 127

Types of trace supportThis section describes the types of trace support.
Trace and Log Central disk IO and CPU throttlingUnified RTMT supports the throttling of critical Trace and Log Central operations and jobs, whether they arerunning on demand, scheduled, or automatic.
When you make a request for an on-demand operation when the node is running under high IO conditions,the system displays a warning that gives you the opportunity to cancel the operation. Be aware that the IOrate threshold values that control when the warning displays are configurable with the following serviceparameters (Cisco RIS Data Collector service):
• TLC Throttling CPU Goal
• TLC Throttling IOWait Goal
The values of these parameters are compared to the actual system CPU and IOWait values. If the goal (thevalue of the service parameter) is lower than the actual value, the system displays the warning.
Trace Compression supportThis feature enables the Recoverable Outstream (ROS) library to support the compressed output of trace files.The system compresses the files as they are being generated. The following benefits of tracefile compressionapply:
• Reduces the capacity required to store tracefiles.
• Reduces the disk head movement which results in significantly improved call load. This prevents CPUblockage due to tracefile demands.
Use the enterprise parameter, Trace Compression, to enable or disable trace compression. The default valuefor this parameter specifies Disabled.
Compressed files have a .gz extension (.gzo if the file is still being written to). To open a compressed file,double-select the filename. If there is a viewer associated with the extension, the file opens in that viewer. Ifa viewer is not associated with the extension, the Open With dialog box appears. Select the viewer that youwant to use and check Always use this program to skip this viewer selection process in the future.
View Trace and Log Central OptionsFollow this procedure to view Trace and Log Central options in Unified RTMT.
Cisco Unified Real-Time Monitoring Tool Administration Guide, Release 11.0(1)128
Traces and LogsTypes of trace support

From any option that displays in the tree hierarchy, you can specify the services and applications for whichyou want traces, specify the logs and servers that you want to use, schedule a collection time and date,configure the ability to download the files, configure zip files, and delete collected trace files.
Note
For devices that support encryption, the SRTP keying material does not display in the trace file.Note
Before You Begin
Before you begin, import the security certificates.
Procedure
Step 1 Perform one of the following actions to access Trace and Log Central:a) Select System in the Quick Launch Channel.b) Select System > Tools > Trace > Trace & Log Central.c) Select the Trace & Log Central icon in the tree hierarchy.
Step 2 Perform one of the following tasks after you display the Trace and Log Central options in the Real-TimeMonitoring Tool:
• Collect traces for services, applications, and system logs on one or more servers in the cluster.
• Collect and download trace files that contain search criteria that you specify as well as save trace collectioncriteria for later use.
• Collect a crash dump file for one or more servers on your network.
• View the trace files that you have collected.
• View all of the trace files on the server.
• View the current trace file being written on the server for each application. You can perform a specifiedaction when a search string appears in the trace file.
Collect files
Collect Trace FilesUse the Collect Files option in Trace and Log Central to collect traces for services, applications, and systemlogs on one or more nodes in the cluster. You specify date and time range for which you want to collect traces,the directory in which to download the trace files and whether to delete the collected files from the node.
Follow this procedure to collect traces using the trace and log central feature.
Cisco Unified Real-Time Monitoring Tool Administration Guide, Release 11.0(1) 129
Traces and LogsCollect files

The services that you have not activated also appear, so you can collect traces for those services.Note
Use the Query Wizard if you want to collect trace files that contain search criteria that you specify or youwant to use trace collection criteria that you saved for later use.
Before You Begin
Perform one or more of the following actions:
• Configure the information that you want to include in the trace files for the various services from theTrace Configuration window in Cisco Unified Serviceability. For more information, see theCisco UnifiedServiceability Administration Guide.
• If you want alarms to be sent to a trace file, choose an SDI or SDL trace file as the alarm destination intheAlarmConfigurationwindow in Cisco Unified Serviceability. For more information, see the CiscoUnified Serviceability Administration Guide.
• Configure the throttling of critical Trace and Log Central operations and jobs by setting the values ofthe TLC Throttling CPU Goal and TLC Throttling IOWait Goal service parameters (Cisco RIS DataCollector service). For more information on configuring service parameters, see the SystemConfigurationGuide for Cisco Unified Communications Manager .
Procedure
Step 1 Open the Trace and Log Central options.Step 2 In the Trace & Log Central tree hierarchy, double-click Collect Files.
The Trace Collection wizard appears. The services that you have not activated also appear, so you can collecttraces for those services.
Unified Communications Manager and Cisco Unity Connection clusters: If any node in the clusteris not available, a dialog box appears with a message that indicates which node is not available. Theunavailable node will not appear in the Trace and Log Central windows.
Note
Unified Communications Manager and Cisco Unity Connection clusters: You can install some ofthe listed services/applications only on a particular node in the cluster. To collect traces for thoseservices/applications, make sure that you collect traces from the node on which you have activatedthe service/application.
Note
Step 3 Cisco Unity Connection users go to Step 4. For Unified Communations Manager or Cisco Business Edition,perform one of the following actions in the Select CCM Services/Application tab:a) To collect traces for all services and applications for all nodes in a cluster, check the Select All Services
on All Servers check box and click Next.If you have a standalone node and check the Select All Services on All Servers check box, thesystem collects traces for all service and applications for your standalone node.
Note
b) To collect traces for all services and applications on a particular node (or for particular system logs on thenode for Cisco Unity Connection), check the check box next to the node and click Next.
c) To collect traces for particular services or applications on particular nodes, check the check boxes thatapply and click Next.
d) To go to the next tab without collecting traces for services or applications, click Next.Go to Step 4 for Cisco Business Edition or go to Step 5 for Unified Communications Manager.
Cisco Unified Real-Time Monitoring Tool Administration Guide, Release 11.0(1)130
Traces and LogsCollect files

Step 4 In the Select CUC Services/Application tab, perform one of the following tasks:a) To collect all system logs for the node, check the Select All Services on all Servers check box or check
the check box next to the node and click Next.b) To collect traces for particular system logs on the node, check the check boxes that apply and click Next.c) To go to the next tab without collecting traces for system logs, click Next.
Step 5 In the Select System Services/Application tab, perform one of the following tasks:a) To collect all system logs for all nodes in a cluster, check the Select All Services on all Servers check
box and click Next.If you have a standalone node and check the Select All Services on All Servers check box, thesystem collects traces for your standalone node.
Note
b) To collect traces for all system logs on a particular node, check the check box next to the node and clickNext.
c) To collect traces for particular system logs on particular nodes, check the check boxes that apply and clickNext.
d) To continue the trace collection wizard without collecting traces for system logs, click Next.
Step 6 In the Collection Time pane, specify the time range for which you want to collect traces. Choose one of thefollowing options:a) Absolute Range: Specify the node time zone and the time range (start and end date and time) for which
you want to collect traces.The time zone of the client machine provides the default setting for the Select Reference Server TimeZone field. All the standard time zones, along with a separate set of entries for all time zones that haveDaylight Saving settings, appear in the Select Time Zone drop-down list box.
Trace and Log Central downloads the file with a time range that is based on your Selected ReferenceServer Time Zone field. If you have nodes in a cluster in a different time zone, TLC will adjust for thetime change and get files for the same period of time. For example, if you specify files from 9:00 a.m. to10:00 a.m. and you have a second node (node x) that is in a time zone that is one hour ahead, TLC willdownload files from 10:00 a.m. to 11:00 a.m. from node x.
To set the date range for which you want to collect traces, choose the drop-down list box in the FromDate/Time and To Date/Time fields.
b) Relative Range: Specify the time (in minutes, hours, days, weeks, or months) prior to the current timefor which you want to collect traces.
Unified RTMT returns logs of a different time stamp, than that configured through the wizard.This occurs specifically, when the specified time stamp is lesser than that of the existing log files.
Log files exist on the node for a specific service from 11/24/09, and you have given the timerange from 11/23/09 5:50 to 11/23/09 7:50; Unified RTMT still returns the existing log files.
Note
Step 7 In the Download File option group box, specify the options that you want for downloading traces. From theSelect Partition drop-down list box, choose the partition that contains the logs for which you want to collecttraces.Cisco Unified Serviceability stores the logs for the version of application that you are logged in to in the activepartition and stores the logs for the other version (if installed) in the inactive directory.
This means that when you upgrade from one version of Unified Communications Manager, Cisco BusinessEdition 5000, or Cisco Unity Connection that is running on an appliance node to another version, and yourestart the node with the new version, Cisco Unified Serviceability moves the logs of the previous version tothe inactive partition and stores logs for the newer version in the active partition. If you log back in to theolder version, Cisco Unified Serviceability moves the logs for the newer version to the inactive partition andstores the logs for the older version in the active directory.
Cisco Unified Real-Time Monitoring Tool Administration Guide, Release 11.0(1) 131
Traces and LogsCollect files

Cisco Unified Serviceability does not retain logs from Unified Communications Manager or CiscoUnity Connection versions that ran on the Windows platform.
Note
Step 8 To specify the directory in which you want to download the trace files, click the Browse button next to theDownload File Directory field, navigate to the directory, and click Open. The default specifies<rtmt_users_directory>\<server name or server IP address>\<download time>.
Step 9 To create a zip file of the trace files that you collect, choose the Zip File radio button. To download the tracefiles without zipping the files, choose the Do Not Zip Files radio button.
Step 10 To delete collected log files from the node, check theDelete Collected Log Files from the server check box.Step 11 Click Finish or, to abort the settings, click Cancel.
If you clicked Finish, the window shows the progress of the trace collection.
When the trace collection process is complete, the message “Completed downloading for node <Server nameor IP address>” appears at the bottom of the window.
Step 12 To view the trace files that you collected, you can use the Local Browse option of the trace collection feature.You will see a message if the service parameter values are exceeded or if the system is in code yellow.Note
Query WizardThe Trace Collection Query Wizard allows you to collect and download trace files that contain search criteriathat you specify as well as to save trace collection criteria for later use. To use the Trace Collection QueryWizard, perform the procedures to start a query and execute a query.
Before You Begin
• Configure the information that you want to include in the trace files for the various services from theTrace Configuration window.
• If you want alarms to be sent to a trace file, select an SDI trace file as the alarm destination in theAlarmConfiguration window.
Start a Query
Procedure
Step 1 Open Trace & Log Central.Step 2 Double-select Query Wizard in the tree hierarchy.Step 3 Perform one of the following actions:
Cisco Unified Real-Time Monitoring Tool Administration Guide, Release 11.0(1)132
Traces and LogsCollect files

ResultActionIf you want to:
• If you chose a single node genericquery, the node to which RTMT isconnected displays with a checkmarknext to Browse. You can run thequery on additional nodes by placinga checkmark next to those servers.
• If you chose an all node genericquery, all nodes display with acheckmark next to Browse. You canuncheck any server for which you donot want to run the query.
• If you chose a regular query, all of thenodes that you selected when yousaved the query display with acheckmark. You can check oruncheck any of the servers in the list.If you select new servers, you mustuse the wizard to select the servicesfor that node
• Select Saved Query.
• SelectBrowse to navigate to thequery that you want to use.
• Select the query and selectOpen.
Run a Saved Query
Select Create Query.Create a query
• Select Run Query.
• Complete the steps in “Executea schedule.”
Run the query withoutany modification
Go to Step 4.Modify the query
Step 4 Select Next.Step 5 Perform one of the following actions:
• If you selected Saved Query and chose a query, the criteria that you specified for query appear. Ifnecessary, modify the list of services and applications for which you want to collect traces.
• If you selectedCreate Query, you must select all services and applications for which you want to collecttraces.
Step 6 Select Next.Step 7 Perform one of the following actions:
Cisco Unified Real-Time Monitoring Tool Administration Guide, Release 11.0(1) 133
Traces and LogsCollect files

ActionIf you want to:
• Check the traces that apply.
• Check Select All Services on All Servers.
• Select Next.
Collect traces for system logs or all systemlogs for all servers in the cluster
• Check Select All Services on All Servers.
• Select Next.
Collect traces for all services andapplications for all servers in the cluster,
• Check the name of the server.
• Select Next.
Collect traces for all services andapplications on a particular server,
Step 8 Perform one of the following actions to specify the time range for which you want to collect traces:ActionIf you want to:
Select All Available Traces.Collect all the traces on the server for theservices that you chose
• Select Absolute Range.
• Specify the server time zone and the time range (start andend date and time) for which you want to collect traces.
Collect all the traces within an absolutedate and time range
• Select Relative Range.
• Specify the time (in minutes, hours, days, weeks, ormonths) prior to the current time for which you want tocollect traces.
Collect all the traces within a relative dateand time range
Step 9 Enter the word or phrase in the Search String field to search by phrases or words that exist in the trace file.The tool searches for an exact match to the word or phrase that you enter.
What to Do Next
Execute a query.
Cisco Unified Real-Time Monitoring Tool Administration Guide, Release 11.0(1)134
Traces and LogsCollect files

Execute a Query
• If any node in the cluster is not available, a dialog box displays with a message that indicates whichnode is not available. The unavailable node does not display in the Trace & Log Central windows.
• You can install some listed services or applications only on a particular node in the cluster. To collecttraces for those services or applications, make sure that you collect traces from the node on which youhave activated the service or application.
• The services that you have not activated also display, so you can collect traces for those services.
• After you have downloaded the trace files, you can view them by using the Local Browse option of thetrace and log central feature.
• An error message displays if the service parameter values are exceeded or if the system is in code yellow.
Procedure
Step 1 Select Run Query to execute the query.Step 2 Select Save Query to save the query and continue with the next step.Step 3 Select OK when the dialog box displays that indicates that the query execution completed.Step 4 Perform the following actions:
ResultActionIf you want to:
• You can only create a generic query if theservices that you chose exist on a single node. Ifyou chose services on more than one node, amessage displays. You can either save the queryas a regular query or select services on a singlenode.
• If you select the Single Node Query, the tracecollection tool by default selects the node onwhich you created the query when you executethe query.
• If you select the All Node Query option, the tracecollection tool by default selects all of the serversin the cluster when you execute the query.
1 Select Generic Query.2 Select either the Single
Node Query or AllNode Query.
3 Select Finish.
Create a query thatyou can run on nodesother than the one onwhich it was created
1 Select Regular Query.2 Select Finish.
Run the query on thatnode or cluster onwhich you created thequery
Step 5 Browse to the location to store the query, enter a name for the query in the File Name field.Step 6 Select Save.Step 7 Perform one of the following actions:
Cisco Unified Real-Time Monitoring Tool Administration Guide, Release 11.0(1) 135
Traces and LogsCollect files

ActionIf you want to:
• Select Run Query.Run the query that you have just saved
Select Cancel.Exit the query wizard without running thequery that you created
Step 8 Perform one of the following actions after the query execution completes:ActionIf you want to:
Follow these steps to navigate the file:
1 Double-select Query Results.
2 Double-select the <node> folder, where <node> equals theIP address or hostname for the node that you specified inthe wizard.
3 Double-select the folder that contains the file that you wantto view.
4 After you have located the file, double-select that file.
View a file that you collected
1 Select the files that you want to download.2 Select Download.3 Specify the criteria for the download.4 Select Finish.
Download the trace files and the result filethat contains a list of the trace files that yourquery collected
1 Select Browse next to the Download all files field.2 Navigate to the directory.3 Select Open.
Specify the directory in which you want todownload the trace files and the results file
Select Zip File.Create a zip file of the trace files that youcollected
Check Delete Collected Log Files from Server.Delete collected log files from the server
• Select Save Query.Save the query
Cisco Unified Real-Time Monitoring Tool Administration Guide, Release 11.0(1)136
Traces and LogsCollect files

Schedule Trace Collection in Cisco Unified Communications ManagerYou can use the Schedule Collection option of the trace and log central feature to schedule up to six concurrenttrace collections and to download the trace files to a SFTP or FTP server on your network, run another savedquery, or generate a syslog file. To change a scheduled collection after you have entered it in the system, youmust delete the scheduled collection and add a new collection event. To schedule trace collection, performthe following procedure.
You can schedule up ten trace collection jobs, but only six trace collection can be concurrent. That is, onlysix jobs can be in a running state at the same time.
Note
Before You Begin
Perform one or more of the following actions:
• Configure the information that you want to include in the trace files for the various services from theTrace Configuration window of Cisco Unified Serviceability. For more information, see the CiscoUnified Serviceability Administration Guide.
• If you want alarms to be sent to a trace file, choose an SDI or SDL trace file as the alarm destination inthe Alarm Configuration window. For more information, see the Cisco Unified ServiceabilityAdministration Guide.
Procedure
Step 1 Open the Trace and Log Central options.Step 2 In the Trace and Log Central tree hierarchy, double-click Schedule Collection.
The Schedule Collection wizard appears.
The services that you have not activated also appear, so you can collect traces for those services.Note
If any node in the cluster is not available, a dialog box appears with a message that indicates whichnode is not available. The unavailable node will not appear in the Trace and Log Central windows.
Note
You can install some listed services and applications on a particular node in the cluster. To collecttraces for those services and applications, make sure that you collect traces from the node on whichyou have activated the service or application.
Note
Step 3 Perform one of the following actions in the Select CCM Services/Application tab:If you have a standalone node and check the Select All Services on All Servers check box, thesystem collects traces for all service and applications for your standalone node.
Note
• To collect traces for all services and applications for all nodes, check the Select All Services on AllServers check box and click Next.
• To collect traces for all services and applications on a particular node, check the check box next to thenode and click Next.
• To collect traces for particular services or applications on particular nodes, check the check boxes thatapply and click Next.
Cisco Unified Real-Time Monitoring Tool Administration Guide, Release 11.0(1) 137
Traces and LogsCollect files

• To continue the schedule collection wizard without collecting traces for services or applications, clickNext.
Step 4 In the Select System Services/Application tab, perform one of the following actions:If you have a standalone node and check the Select All Services on All Servers check box, thesystem collects traces for your standalone node.
Note
• To collect all system logs for all nodes, check the Select All Services on all Servers check box andclick Next.
• To collect traces for all system logs on a particular node, check the check box next to the node and clickNext.
• To collect traces for particular system logs on particular nodes, check the check boxes that apply andclick Next.
• To continue the schedule collection wizard without collecting traces for system logs, click Next.
Step 5 Specify the node time zone and the time range for which you want to collect traces.The time zone of the client machine provides the default setting for the Select Reference Server Time Zonefield. All the standard time zones, along with a separate set of entries for all time zones that have DaylightSaving settings, appear in the Select Time Zone drop-down list box.
Step 6 To specify the date and time that you want to start the trace collection, click the down arrow button next tothe Schedule Start Date/Time field. In the Date tab, choose the appropriate date. In the Time tab, choose theappropriate time.
Step 7 To specify the date and time that you want to end the trace collection, click the down arrow button next tothe Schedule End Date/Time field. In the Date tab, choose the appropriate date. In the Time tab, choose theappropriate time.
The trace collection completes, even if the collection goes beyond the configured end time; however,the trace and log central feature deletes this collection from the schedule.
Note
Step 8 From the Scheduler Frequency drop-down list box, choose how often you want to run the configured tracecollection.
Step 9 From the Collect Files that are generated in the last drop-down list boxes, specify the time (in minutes,hours, days, weeks, or months) prior to the current time for which you want to collect traces.
Step 10 To search by phrases or words that exist in the trace file, enter the word or phrase in the Search String field.The tool searches for a match to the word or phrase that you enter and collects those files that match the searchcriteria. If you want to search for an exact match to the word or phrase that you entered, check the CaseSensitive check box
Step 11 To create a zip file of the trace files that you collect, check the Zip File check box.Step 12 To delete collected log files from the node, check the Delete Collected Log Files from the Server check
box.Step 13 Choose one or more of the following actions:
• Download Files and go to Step 14.
• Run Another Query and go to Step 15.
Cisco Unified Real-Time Monitoring Tool Administration Guide, Release 11.0(1)138
Traces and LogsCollect files

• Generate Syslog. If you chose Generate Syslog, go to Step 16.
Step 14 In the SFTP/FTP Server Parameters group box, enter the node credentials for the node where the trace andlog central feature downloads the results and click Test Connection. After the trace and log central featureverifies the connection to the SFTP or FTP server, click OK.The Download Directory Path field specifies the directory in which the trace and log central feature storescollected files. By default, the trace collection stores the files in the home directory of the user whose user IDyou specify in the SFTP or FTP parameters fields: /home/<user>/Trace.
You can chooseLocalhost download option when downloading traces. This option is available only for CiscoIntercompany Media Engine servers.
If you download trace files to the local host directories on the Cisco Intercompany Media Engine server, youcan offload the files to a remote SFTP server by using the file get CLI command.
FTP is not supported for Cisco Intercompany MediaEngine.
Note
Step 15 If you chose the Run Another Query Option, click the Browse button to locate the query that you want to run,and click OK.
The trace and log central feature only executes the specified query if the first query generates results.Note
Step 16 Click Finish.A message indicates that the system added the scheduled trace successfully.
If the real-time monitoring tool cannot access the SFTP or FTP server, a message appears. Verifythat you entered the correct IP address, username, and password.
Note
Step 17 Click OK.Step 18 To view a list of scheduled collections, click the Job Status icon in the Trace portion of the Quick Launch
Channel.To delete a scheduled collection, choose the collection event and clickDelete. A confirmationmessageappears. Click OK.
Tip
Schedule Trace Collection in Cisco Unity ConnectionYou can use the Schedule Collection option of the trace and log central feature to schedule up to six concurrenttrace collections and to download the trace files to a SFTP or FTP server on your network, run another savedquery, or generate a syslog file. To change a scheduled collection after you have entered it in the system, youmust delete the scheduled collection and add a new collection event. To schedule trace collection, performthe following procedure.
You can schedule up ten trace collection jobs, but only six trace collection can be concurrent. That is, onlysix jobs can be in a running state at the same time.
Note
Before You Begin
Perform one or more of the following actions:
Cisco Unified Real-Time Monitoring Tool Administration Guide, Release 11.0(1) 139
Traces and LogsCollect files

• Configure the information that you want to include in the trace files for the various services from theTrace Configuration window of Cisco Unified Serviceability. For more information, see the CiscoUnified Serviceability Administration Guide.
• If you want alarms to be sent to a trace file, choose an SDI or SDL trace file as the alarm destination inthe Alarm Configuration window. For more information, see the Cisco Unified ServiceabilityAdministration Guide.
Procedure
Step 1 Open the Trace and Log Central options.Step 2 In the Trace & Log Central tree hierarchy, double-click Schedule Collection.
The Schedule Collection wizard appears.
The services that you have not activated also appear, so you can collect traces for those services.Note
Cisco Unity Connection: If any node in the cluster is not available, a dialog box appears with amessage that indicates which node is not available. The unavailable node will not appear in the Traceand Log Central windows.
Note
Cisco Unity Connection: You can install some listed services and applications on a particular nodein the cluster. To collect traces for those services and applications, make sure that you collect tracesfrom the node on which you have activated the service or application.
Note
Step 3 In the Select CUC Services/Application tab, perform one of the following actions:
• To collect all system logs for the node, check the Select All Services on all Servers check box or checkthe check box next to the node and click Next.
• To collect traces for particular system logs on the node, check the check boxes that apply and clickNext.
• To continue the schedule collection wizard without collecting traces for system logs, click Next.
Step 4 In the Select System Services/Application tab, perform one of the following actions:If you have a standalone node and check the Select All Services on All Servers check box, thesystem collects traces for your standalone node.
Note
• To collect all system logs for all nodes, check the Select All Services on all Servers check box andclick Next.
• To collect traces for all system logs on a particular node, check the check box next to the node and clickNext.
• To collect traces for particular system logs on particular nodes, check the check boxes that apply andclick Next.
• To continue the schedule collection wizard without collecting traces for system logs, click Next.
Step 5 Specify the node time zone and the time range for which you want to collect traces.The time zone of the client machine provides the default setting for the Select Reference Server Time Zonefield. All the standard time zones, along with a separate set of entries for all time zones that have DaylightSaving settings, appear in the Select Time Zone drop-down list box.
Cisco Unified Real-Time Monitoring Tool Administration Guide, Release 11.0(1)140
Traces and LogsCollect files

Step 6 To specify the date and time that you want to start the trace collection, click the down arrow button next tothe Schedule Start Date/Time field. In the Date tab, choose the appropriate date. In the Time tab, choose theappropriate time.
Step 7 To specify the date and time that you want to end the trace collection, click the down arrow button next tothe Schedule End Date/Time field. In the Date tab, choose the appropriate date. In the Time tab, choose theappropriate time.
The trace collection completes, even if the collection goes beyond the configured end time; however,the trace and log central feature deletes this collection from the schedule.
Note
Step 8 From the Scheduler Frequency drop-down list box, choose how often you want to run the configured tracecollection.
Step 9 From the Collect Files that are generated in the last drop-down list boxes, specify the time (in minutes,hours, days, weeks, or months) prior to the current time for which you want to collect traces.
Step 10 To search by phrases or words that exist in the trace file, enter the word or phrase in the Search String field.The tool searches for a match to the word or phrase that you enter and collects those files that match the searchcriteria. If you want to search for an exact match to the word or phrase that you entered, check the CaseSensitive check box
Step 11 To create a zip file of the trace files that you collect, check the Zip File check box.Step 12 To delete collected log files from the node, check the Delete Collected Log Files from the Server check
box.Step 13 Choose one or more of the following actions:
• Download Files. If you chose Download Files or Run Another Query, continue with Step 15.
• Run Another Query.
• Generate Syslog. If you chose Generate Syslog, go to Step 17.
Step 14 In the SFTP/FTP Server Parameters group box, enter the node credentials for the node where the trace andlog central feature downloads the results and click Test Connection. After the trace and log central featureverifies the connection to the SFTP or FTP server, click OK.The Download Directory Path field specifies the directory in which the trace and log central feature storescollected files. By default, the trace collection stores the files in the home directory of the user whose user IDyou specify in the SFTP or FTP parameters fields: /home/<user>/Trace.
You can chooseLocalhost download option when downloading traces. This option is available only for CiscoIntercompany Media Engine servers.
If you download trace files to the local host directories on the Cisco Intercompany Media Engine server, youcan offload the files to a remote SFTP server by using the file get CLI command.
FTP is not supported for Cisco Intercompany MediaEngine.
Note
Step 15 If you chose the Run Another Query Option, click the Browse button to locate the query that you want to run,and click OK.
The trace and log central feature only executes the specified query if the first query generates results.Note
Step 16 Click Finish.A message indicates that the system added the scheduled trace successfully.
If the real-time monitoring tool cannot access the SFTP or FTP server, a message appears. Verifythat you entered the correct IP address, username, and password.
Note
Cisco Unified Real-Time Monitoring Tool Administration Guide, Release 11.0(1) 141
Traces and LogsCollect files

Step 17 Click OK.Step 18 To view a list of scheduled collections, click the Job Status icon in the Trace portion of the Quick Launch
Channel.To delete a scheduled collection, choose the collection event and clickDelete. A confirmationmessageappears. Click OK.
Tip
Start a schedule
Before You Begin
• Configure the information that you want to include in the trace files for the various services from theTrace Configuration window.
• If you want alarms to be sent to a trace file, select an SDI trace file as the alarm destination in the AlarmConfiguration window.
Procedure
Step 1 Open Trace & Log Central.Step 2 Double-select Schedule Collection in the tree hierarchy.Step 3 Perform one of the following actions to collect trace on node logs:
ActionIf you want to:
• Check Select All Services on All Servers.
• Select Next.
Collect traces for all services andapplications for all nodes in the cluster
• Check the name of the node.
• Select Next.
Collect traces for all services andapplications on a particular node
• Check the traces that apply.
• Select Next.
Collect traces for particular services orapplications on particular nodes
Select Next.Continue the trace collection wizardwithout collecting traces for services orapplications
Step 4 Perform one of the following actions to collect traces on system logs:
Cisco Unified Real-Time Monitoring Tool Administration Guide, Release 11.0(1)142
Traces and LogsCollect files

ActionIf you want to:
• Check Select All Services on All Servers.
• Select Next.
Collect all system logs for all nodes in thecluster
• Check the name of the node.
• Select Next.
Collect traces for all system logs on aparticular node
Check the traces that apply.
For example, to collect CSA logs, check Cisco Security Agent.To access user logs that provide information about users that aresigning in and out, check Security Logs.
Collect traces for particular system logson particular nodes
Select Next.Continue the trace collection wizardwithout collecting traces for system logs
Step 5 Specify the node time zone and the time range for which you want to collect traces.Step 6 Perform the following actions to specify the date and time that you want to start the trace collection:
a) Select the down arrow button next to the Schedule Start Date/Time field.b) From the Date tab, select the appropriate date.c) From the Time tab, select the appropriate time.
Step 7 To specify the date and time that you want to end the trace collection, perform the following actions:a) Select the down arrow button next to the Schedule End Date/Time field.b) From the Date tab, select the appropriate date.c) From the Time tab, select the appropriate time.
Troubleshooting Tips
• The time zone of the client computer provides the default setting for the Select Reference ServerTime Zone field. All the standard time zones, along with a separate set of entries for all time zonesthat have Daylight Saving settings, display in the Select Time Zone drop-down list box.
• Trace collection completes, even if the collection goes beyond the configured end time; however,the Trace and Log Central feature deletes this collection from the schedule.
What to Do Next
Execute a schedule, on page 144
Cisco Unified Real-Time Monitoring Tool Administration Guide, Release 11.0(1) 143
Traces and LogsCollect files

Execute a schedule
Procedure
Step 1 Select how often you want to run the configured trace collection from the Scheduler Frequency list box.Step 2 Specify the time (in minutes, hours, days, weeks, or months) prior to the current time for which you want to
collect traces.Step 3 Enter the word or phrase in the Search String field to search by phrases or words that exist in the trace file.
The tool searches for an exact match to the word or phrase that you enter and only collects those files thatmatch the search criteria.
Step 4 Check Zip All Files to create a zip file of the trace files that you collect.Step 5 Check Delete Collected Log Files from the Server to delete collected log files from the server.Step 6 Perform one or more of the following actions:
• To download files:
1 Select Download Files.
2 In the SFTP Server Parameters group box, enter the node credentials for the node where the traceand log central feature downloads the results.
3 Select Test Connection.
4 After the trace and log central feature verifies the connection to the SFTP server, select OK.
• To run another query:
1 Select Run Another Query.
2 Select Browse to locate the query that you want to run.
3 Select OK.
• To generate a Syslog, select Generate Syslog.
Step 7 Select Finish.Troubleshooting Tips
• If any node in the cluster is not available, a dialog box appears with a message that indicates which nodeis not available. The unavailable node does not appear in the Trace & Log Central windows.
• If Unified RTMT cannot access the SFTP server, a message appears. Verify that you entered the correctIP address, username, and password.
• You can install some of the listed services/applications only on a particular node in the cluster. To collecttraces for those services/applications, make sure that you collect traces from the node on which you haveactivated the service/application.
• The services that you have not activated also appear, so you can collect traces for those services.
• The trace collection completes, even if the collection goes beyond the configured end time; however,the trace and log central feature deletes this collection from the schedule.
Cisco Unified Real-Time Monitoring Tool Administration Guide, Release 11.0(1)144
Traces and LogsCollect files

• The Download Directory Path field specifies the directory in which the trace and log central featurestores collected files. By default, the trace collection stores the files in the home directory of the userwhose user ID you specify in the SFTP parameters fields: /home/<user>/Trace.
• The trace and log central feature only executes the specified query if the first query generates results.
View Trace Collection StatusFollow this procedure to view the trace collection event status and to delete scheduled trace collections.
Procedure
Step 1 Open the Trace & Log Central tree hierarchy.Step 2 Double-click Job Status.
The Job Status window appears.
Step 3 From the Select a Node drop-down list box, choose the server for which you want to view or delete tracecollection events.This list of scheduled trace collections appears.
Possible job types include the following:
• Scheduled Job
• OnDemand
• RealTimeFileMon
• RealTimeFileSearch
Possible statuses include the following:
• Pending
• Running
• Cancel
• Terminated
Step 4 To delete a scheduled collection, choose the event that you want to delete and click Delete.You can delete jobs with a status of “Pending” or “Running” and a job type of “Schedule Task” or jobtype of “RealTimeFileSearch.”
Note
Real-Time TraceThe real-time trace option of the Trace and Log Central feature allows you to view the current trace file thatis being written on the server for each application. If the system has begun writing a trace file, the real-time
Cisco Unified Real-Time Monitoring Tool Administration Guide, Release 11.0(1) 145
Traces and LogsCollect files

trace starts reading the file from the point where you began monitoring rather than at the beginning of thetrace file. You cannot read the previous content.
The real-time trace provides the option to view real-time data and monitor user events.
View Real-Time Data
The view real-time data option of the trace and log central feature allows you to view a trace file as the systemwrites data to that file. You can view real-time trace data in the generic log viewer for up to ten services, witha limit of three concurrent sessions on a single node. The log viewer refreshes every 5 seconds. As the tracesare rolled into a new file, the generic log viewer appends the content in the viewer.
Depending on the frequency of the traces that a service writes, the View Real Time Data option mayexperience a delay before being able to display the data in the generic log viewer.
Note
Procedure
Step 1 Open the Trace & Log Central tree hierarchy.Step 2 Double-click Real Time Trace.
Unified Communications Manager clusters and Cisco Unity Connection clusters only: If any nodein the cluster is not available, a dialog box appears with a message that indicates which node is notavailable. The unavailable node will not display in the Trace and Log Central windows.
Note
Step 3 Double-click View Real Time Data.The View Real Time Data wizard appears.
Step 4 From the Nodes drop-down list box, choose the node for which you want to view real-time data and clickNext.
Step 5 Choose the product, service, and the trace file type for which you want to view real-time data.The services that you have not activated also display, so you can collect traces for those services.Note
The following message appears at the bottom of this window: If trace compression is enabled,
the data seen in this window can be bursty due to buffering of data.
Note
Step 6 Click Finish. The real-time data for the chosen service displays in the generic log viewer.Step 7 Perform one of the following actions:
• Check the Show New Data check box to keep the cursor at the end of the window to display new tracesas they appear.
• Uncheck the Show New Data check box if you do not want the cursor to move to the bottom of thewindow as new traces display.
Step 8 Repeat this procedure to view data for additional services.A message appears if you attempt to view data for too many services or too many services on a single node.
Step 9 After you finish with viewing the real-time data, click Close on the generic log viewer.To search by phrases or words in the Log Viewer, enter the word or phrase in the Search String field.If you want to do a case-sensitive search for a word or phrase, check theMatch Case check box.
Tip
Cisco Unified Real-Time Monitoring Tool Administration Guide, Release 11.0(1)146
Traces and LogsCollect files

Monitor User Event
The monitor user event option of the trace and log central feature monitors real-time trace files and performsa specified action when a search string appears in the trace file. The system polls the trace file every 5 seconds.If the search string occurs more than once in one polling interval, the system performs the action only once.
Before You Begin
If you want to generate an alarm when the specified search string exists in a monitored trace file, enable theLogFileSearchStringFound alert.
Procedure
Step 1 Open the Trace & Log Central tree hierarchy.Step 2 Double-click Real Time Trace.
Unified Communications Manager clusters and Cisco Unity Connection clusters only: If any nodein the cluster is not available, a dialog box appears with a message that indicates which node is notavailable. The unavailable node does not display in the Trace and Log Central windows.
Note
Step 3 Double-clickMonitor User Event.The Monitor User Event wizard appears.
Step 4 Perform one of the following actions:ActionIf you want to:
• Click View Configured Events
• Select a node from the drop-down list box.
• Click Finish.
To delete an event, choose the event and clickDelete.
Note
View the monitoring events that you havealready set up
• Select Create Events.
• Select Next.
• Continue with Step 5.
Configure new monitoring events
Step 5 Choose the node that you want the system to monitor from the Nodes drop-down list box and click Next.Step 6 Choose the product, service, and the trace file type that you want the system to monitor and click Next.
The services that you have not activated also appear, so you can collect traces for those services.Note
Step 7 In the Search String field, specify the phrases or words that you want the system to locate in the trace files.The tool searches for an exact match to the word or phrase that you enter.
Step 8 Specify the node time zone and the time range (start and end date and time) for which you want the systemto monitor trace files.
Cisco Unified Real-Time Monitoring Tool Administration Guide, Release 11.0(1) 147
Traces and LogsCollect files

The time zone of the client machine provides the default setting for the Select Reference Server Time Zonefield. All the standard time zones, along with a separate set of entries for all time zones that have DaylightSaving settings, display in the Select Time Zone drop-down list box.
Trace and Log Central downloads the files with a time range that is based on your Selected Reference ServerTime Zone field. If you have nodes in a cluster in a different time zone, TLC adjusts for the time change andget files for the same period of time. For example, if you specify files from 9:00 a.m. to 10:00 a.m. and youhave a second node (node x) that is in a time zone that is one hour ahead, TLC downloads files from 10:00a.m. to 11:00 a.m. from node x.
To set the date range for which you want to monitor traces, choose the drop-down list box in the FromDate/Time and To Date/Time fields.
Step 9 Choose one or more of the following actions that you want the system to perform when it encounters thesearch string that you specified in the Search String field:
ActionIf you want the system to:
Check Alert.
For the system to generate the alarm, you must enable the enablethe TraceCollectionToolEvent alert.
Note
Generate an alarm when thesystem encounters the specifiedsearch string
Check Local Syslog.
The system provides a description of the alarm and a recommendedaction. You can access the SysLog Viewer from Unified RTMT.
Note
Log the errors in the applicationlogs area in the SysLog Viewer
Check Remote Syslog.
Enter the syslog node name in the Server Name field.
By default, audit events are not sent to the remote syslog node,unless the severity is lowered toWarning, Notice, or Informational.
Note
Store the syslog messages on asyslog node
Check Download File.
Enter the node credentials for the node where you want to download thetrace files in the SFTP Server Parameters group box.
Select Test Connection.
Select OK after the Trace and Log Central feature verifies the connectionto the SFTP server.
The Download Directory Path field specifies the directory in which thetrace and log central feature stores collected files. By default, the tracecollection stores the files in the home directory of the user whose user IDyou specify in the SFTP/FTP parameters fields: /home/<user>/Trace.
You can choose Localhost download option when downloading traces.This option is available only for Cisco IntercompanyMedia Engine servers.
If you download trace files to the local host directories on the CiscoIntercompany Media Engine server, you can offload the files to a remoteSFTP server by using the file get CLI command.
FTP is not supported for Cisco Intercompany MediaEngine.
Note
Download the trace files thatcontain the specified searchstring
Cisco Unified Real-Time Monitoring Tool Administration Guide, Release 11.0(1)148
Traces and LogsCollect files

The system polls the trace files every 5 seconds and performs the specified actions when it encounters thesearch string. If more than one occurrence of the search string occurs in a polling interval, the system performsthe action only once.
The following message appears: If trace compression is enabled, there might be a delay in
catching the event after it occurs, due to buffering of data.
Step 10 Click Finish.
Collect Crash Dump in Cisco Unified Communications ManagerFollow this procedure to collect a core dump of trace files.
Procedure
Step 1 Open the Trace & Log Central tree hierarchy.Step 2 Double-click Collect Crash Dump.
The Collect Crash Dump wizard appears.
The services that you have not activated also appear, so you can collect traces for those services.Note
If any node in the cluster is not available, a dialog box appears with a message that indicates whichnode is not available. The unavailable node will not appear in the Trace and Log Central windows.
Note
You can install some of the listed services or applications on a particular node in the cluster. Tocollect traces for those services or applications, make sure that you collect traces from the node onwhich you have activated the service or application.
Note
Step 3 Perform one of the following actions in the Select CCM Services/Application tab:If you have a standalone node and check the Select All Services on All Servers check box, thesystem collects traces for all service and applications for your standalone node.
Note
• To collect traces for all services and applications for all nodes, check the Select All Services on AllServers check box and click Next.
• To collect traces for all services and applications on a particular node, check the check box next to thenode and click Next.
• To collect traces for particular services or applications on particular nodes, check the check boxes thatapply and click Next.
• To continue the collect crash dump wizard without collecting traces for services or applications, clickNext.
Step 4 In the Select System Services/Application tab, perform one of the following actions:If you have a standalone node and check the Select All Services on All Servers check box, thesystem collects traces for your standalone node.
Note
• To collect all system logs for all nodes, check the Select All Services on all Servers check box andclick Next.
• To collect traces for all system logs on a particular node, check the check box next to the node and clickNext.
Cisco Unified Real-Time Monitoring Tool Administration Guide, Release 11.0(1) 149
Traces and LogsCollect files

• To collect traces for particular system logs on particular nodes, check the check boxes that apply andclick Next.
• To continue the collect crash dump wizard without collecting traces for system logs, click Next.
Step 5 In the Collection Time group box, specify the time range for which you want to collect traces. Choose one ofthe following options:
• Absolute Range: Specify the node time zone and the time range (start and end date and time) for whichyou want to collect traces.
The time zone of the client machine provides the default setting for the Select Reference Server TimeZone field. All the standard time zones, along with a separate set of entries for all time zones that haveDaylight Saving settings, appear in the Select Time Zone drop-down list box.
Trace Log Central downloads the files with a time range that is based on your Selected Reference ServerTime Zone field. If you have nodes in a cluster in a different time zone, TLC adjusts for the time changeand gets files for the same period of time. For example, if you specify files from 9:00 a.m. to 10:00 a.mand you have a second node (node x) that is in a time zone that is one hour ahead, TLC downloads filesfrom 10:00 a.m. to 11:00 a.m. from node x.
To set the date range for which you want to collect crash files, choose the drop-down list box in theFrom Date/Time and To Date/Time fields.
• Relative Range: Specify the length of time (in minutes, hours, days, weeks, or months) prior to thecurrent time for which you want to collect crash files.
Step 6 From the Select Partition drop-down list box, choose the partition that contains the logs for which you wantto collect traces.Cisco Unified Serviceability stores the logs for the version of application that you are logged in to in the activepartition and stores the logs for the other version (if installed) in the inactive directory.
When you upgrade from one version of your product that is running on the Linux platform to another version,and you restart the node with the new version, Cisco Unified Serviceability moves the logs of the previousversion to the inactive partition and stores logs for the newer version in the active partition. If you log in tothe older version, Cisco Unified Serviceability moves the logs for the newer version to the inactive partitionand stores the logs for the older version in the active directory.
Cisco Unified Serviceability does not retain logs from Cisco Unified Communications Manager, IMand Presence Service, and Cisco Unity Connection versions that ran on the Windows platform.
Note
Step 7 To specify the directory in which you want to download the trace files, click the Browse button next to theDownload File Directory field, navigate to the directory, and click Open. The default specifies<rtmt_users_directory>\<server name or server IP address>\<download time>.
Step 8 To create a zip file of the crash dump files that you collect, choose the Zip File radio button. To downloadthe crash dump files without zipping the files, choose the Do Not Zip Files radio button.
You cannot download a zipped crash dump file that exceeds 2 gigabytes.Note
Step 9 To delete collected crash dump files from the node, check theDelete Collected Log Files from Server checkbox.
Step 10 Click Finish.A message appears that states that you want to collect core dumps. To continue, click Yes.
If you chose theZip File radio button and the crash dump files exceed 2 gigabytes, the system displaysa message that indicates that you cannot collect the crash dump file of that size with theZip Fileradiobutton that you chose. Choose the Do Not Zip Files radio button and try the collection again.
Note
Cisco Unified Real-Time Monitoring Tool Administration Guide, Release 11.0(1)150
Traces and LogsCollect files

Collect Crash Dump in Cisco Unity ConnectionFollow this procedure to collect a core dump of trace files.
Procedure
Step 1 Open the Trace & Log Central tree hierarchy.Step 2 Double-click Collect Crash Dump.
The Collect Crash Dump wizard appears.
The services that you have not activated also appear, so you can collect traces for those services.Note
Cisco Unity Connection: If any node in the cluster is not available, a dialog box appears with amessage that indicates which node is not available. The unavailable node will not appear in the Traceand Log Central windows.
Note
Cisco Unity Connection: You can install some of the listed services or applications on a particularnode in the cluster. To collect traces for those services or applications, make sure that you collecttraces from the node on which you have activated the service or application.
Note
Step 3 In the Select CUC Services/Application tab, perform one of the following actions:
• To collect all system logs for the node, check the Select All Services on all Servers check box or checkthe check box next to the node and click Next.
• To collect traces for particular system logs on the nodes, check the check boxes that apply and clickNext.
• To continue the collect crash dump wizard without collecting traces for system logs, click Next.
Step 4 In the Select System Services/Application tab, perform one of the following actions:If you have a standalone node and check the Select All Services on All Servers check box, thesystem collects traces for your standalone node.
Note
• To collect all system logs for all nodes, check the Select All Services on all Servers check box andclick Next.
• To collect traces for all system logs on a particular node, check the check box next to the node and clickNext.
• To collect traces for particular system logs on particular nodes, check the check boxes that apply andclick Next.
• To continue the collect crash dump wizard without collecting traces for system logs, click Next.
Step 5 In the Collection Time group box, specify the time range for which you want to collect traces. Choose one ofthe following options:
• Absolute Range: Specify the node time zone and the time range (start and end date and time) for whichyou want to collect traces.
Cisco Unified Real-Time Monitoring Tool Administration Guide, Release 11.0(1) 151
Traces and LogsCollect files

The time zone of the client machine provides the default setting for the Select Reference Server TimeZone field. All the standard time zones, along with a separate set of entries for all time zones that haveDaylight Saving settings, appear in the Select Time Zone drop-down list box.
Trace Log Central downloads the files with a time range that is based on your Selected Reference ServerTime Zone field. If you have nodes in a cluster in a different time zone, TLC adjusts for the time changeand gets files for the same period of time. For example, if you specify files from 9:00 a.m. to 10:00 a.mand you have a second node (node x) that is in a time zone that is one hour ahead, TLC downloads filesfrom 10:00 a.m. to 11:00 a.m. from node x.
To set the date range for which you want to collect crash files, choose the drop-down list box in theFrom Date/Time and To Date/Time fields.
• Relative Range: Specify the length of time (in minutes, hours, days, weeks, or months) prior to thecurrent time for which you want to collect crash files.
Step 6 From the Select Partition drop-down list box, choose the partition that contains the logs for which you wantto collect traces.Cisco Unified Serviceability stores the logs for the version of application that you are logged in to in the activepartition and stores the logs for the other version (if installed) in the inactive directory.
When you upgrade from one version of your product that is running on the Linux platform to another version,and you restart the node with the new version, Cisco Unified Serviceability moves the logs of the previousversion to the inactive partition and stores logs for the newer version in the active partition. If you log in tothe older version, Cisco Unified Serviceability moves the logs for the newer version to the inactive partitionand stores the logs for the older version in the active directory.
Cisco Unified Serviceability does not retain logs from Cisco Unified Communications Manager, IMand Presence Service, and Cisco Unity Connection versions that ran on the Windows platform.
Note
Step 7 To specify the directory in which you want to download the trace files, click the Browse button next to theDownload File Directory field, navigate to the directory, and click Open. The default specifies<rtmt_user_directory>\<server name or server IP address>\<download time>where <rtmt_user_directory> specifies the directory where RTMT is installed.
Step 8 To create a zip file of the crash dump files that you collect, choose the Zip File radio button. To downloadthe crash dump files without zipping the files, choose the Do Not Zip Files radio button.
You cannot download a zipped crash dump file that exceeds 2 gigabytes.Note
Step 9 To delete collected crash dump files from the node, check theDelete Collected Log Files from Server checkbox.
Step 10 Click Finish.A message appears that states that you want to collect core dumps. To continue, click Yes.
If you chose theZip File radio button and the crash dump files exceed 2 gigabytes, the system displaysa message that indicates that you cannot collect the crash dump file of that size with theZip Fileradiobutton that you chose. Choose the Do Not Zip Files radio button and try the collection again.
Note
Collect Installation LogsFollow this procedure to collect installation and upgrade logs.
Cisco Unified Real-Time Monitoring Tool Administration Guide, Release 11.0(1)152
Traces and LogsCollect files

Procedure
Step 1 Choose Tools > Trace > Trace & Log Central.The Trace & Log Central window appears.
Step 2 In the Trace & Log Central tree hierarchy, double-click Collect Install Logs.The Collect Install Logs wizard appears.
Step 3 In the Select Servers Options box, specify from which server you would like to collect the install logs.
• To collect the install logs for a particular server, check the check box next to the server.
• To collect the install logs for all servers, check the Select All Servers check box.
Step 4 In the Download File Options, specify the directory where you want to download the log file. To specify thedirectory in which you want to download the log files, click Browse next to the Download File Directoryfield, navigate to the directory, and click Open. The default specifies <rtmt_users_directory>.
Step 5 Click Finish.
Collect audit logs
Browse Audit Logs
Procedure
Step 1 Open the Trace & Log Central tree hierarchy.Step 2 Double-click Collect Audit Logs.
The Collect Audit Logs Action Options wizard appears.
Step 3 Check the Browse Audit Logs check box.Step 4 Click Next.
The Nodes Selection Options wizard appears.
Step 5 Perform one of the following actions in the Action Options window:If you have a standalone server and check the Select All Servers check box, the system browses allaudit logs for your standalone server.
Note
a) To browse audit logs for all servers, check the Select All Servers check box.b) To browse audit logs on a particular server, check the check box next to the server.
Step 6 Click Finish.Step 7 The Remote Browse is Ready window appears. Click Close.
Cisco Unified Real-Time Monitoring Tool Administration Guide, Release 11.0(1) 153
Traces and LogsCollect files

The Nodes pane appears.
Step 8 On the left side of the Nodes pane, double-click the Nodes folder. Navigate through the tree hierarchy untilthe Audit App folder appears.
Step 9 After the audit log file names display in the pane on the right side of the window, you can either right-clickthe mouse to select the type of program that you want to use to view each file or double-click the selected fileto display the file in the default viewer.
Step 10 Select an audit log file and perform one of the following actions:
• To create a zip file of the audit log files that you collect, click the Zip File radio button.You cannot download a zipped audit log file that exceeds 2gigabytes.
Note
• To delete collected audit log files from the server, check the Delete Files on Server check box.
• To delete the selected audit log file, click Delete.
• To refresh the selected audit log file, click Refresh.
• To refresh all of the audit log files, click Refresh All.
Cisco Unified Serviceability does not retain audit logs from Cisco Unified CommunicationsManageror CiscoUnified CommunicationsManager IM and Presence Service versions that run on theWindowsplatform.
Note
You have completed the steps for Browse Audit Logs.
Download Audit Logs
Procedure
Step 1 Open the Trace & Log Central tree hierarchy.Step 2 Double-click Collect Audit Logs.
The Collect Audit Logs Action Options wizard appears.
Step 3 Check the Download Audit Logs check box.Step 4 Click Next.
The Nodes Selection Options wizard appears.
Step 5 Perform one of the following actions in the Action Options window:If you have a standalone server and check the Select All Servers check box, the system downloadsall audit logs for your standalone server.
Note
a) To download audit logs for all servers, check the Select All Servers check box.b) To download audit logs on a particular server, check the check box next to the server.
Step 6 Click Finish.Step 7 To download audit logs, click Next.
The Download Audit Logs window appears.
Step 8 In the Nodes Selection Options pane, perform one of the following actions:
Cisco Unified Real-Time Monitoring Tool Administration Guide, Release 11.0(1)154
Traces and LogsCollect files

• Check the Select All Servers check box.
• Check a specific node check box.
Step 9 In the Collection Time pane, click one of the following radio buttons:
• Absolute Range: Specify the server time zone and the time range (start and end date and time) for whichyou want to audit logs.
The time zone of the client machine provides the default setting for the Select Reference Server TimeZone field. All the standard time zones, along with a separate set of entries for all time zones that haveDaylight Saving settings, appear in the Select Time Zone drop-down list box.
Trace Log Central downloads the files with a time range that is based on your Selected Reference ServerTime Zone field. If you have servers in a cluster in a different time zone, TLC adjusts for the time changeand retrieves files for the same period of time. For example, if you specify files from 9:00 a.m. to 10:00a.m. and you have a second server (server x) that is in a time zone that is one hour ahead, TLC downloadsfiles from 10:00 a.m. to 11:00 a.m. from server x.
• Relative Range: Specify the length of time (in minutes, hours, days, weeks, or months) prior to thecurrent time for which you want to collect audit logs based on the values from the following table:
RangePeriod of Time
5 - 60Minutes
2 - 24Hours
1 - 31Days
1 - 4Weeks
1 -12Months
Step 10 In the Download File Options pane, select one of the following options:a) To specify the directory in which you want to download the audit log file, click the Browse button next
to the Download File Directory field, navigate to the directory, and click Open. The default specifies<\Program Files\Cisco\Unified RTMT\JRtmt>.
b) To create a zip file of the audit log files that you collect, choose the Zip File radio button.You cannot download a zipped audit log file that exceeds 2 gigabytes.Note
c) To delete collected audit log files from the server, check the Delete Collected Log Files from Servercheck box.
Step 11 Click Finish.You have completed the steps for the download of audit logs.
Cisco Unified Real-Time Monitoring Tool Administration Guide, Release 11.0(1) 155
Traces and LogsCollect files

Schedule Audit Log Download
Procedure
Step 1 Open the Trace & Log Central tree hierarchy.Step 2 Double-click Collect Audit Logs.
The Collect Audit Logs Action Options wizard appears.
Step 3 Check the Schedule Download of Audit Logs check box.Step 4 Click Next.
The Nodes Selection Options wizard appears.
Step 5 Perform one of the following actions in the Action Options window:If you have a standalone node and check the Select All Servers check box, the system browses,downloads, or schedules a download of all audit logs for your standalone node.
Note
a) To schedule a download of audit logs for all nodes, check the Select All Servers check box.b) To schedule a download of audit logs on a particular node, check the check box next to the node.
Step 6 Click Finish.The Schedule Download of Audit Logs window appears.
Step 7 In the Nodes Selection Options pane, perform one of the following actions:
• Check the Select All Servers check box.
• Check a specific node check box.
Step 8 In the Schedule Time pane, perform the following actions:a) Highlight the Select Reference Server Time Zone.b) Use the calendar and highlight a Start Date/Time.c) Use the calendar and highlight an End Date/Time.d) Select the Scheduler Frequency. You may choose Hourly, Daily, Weekly, or Monthly.e) Check the Zip All Files check box to zip the audit log files.f) Check the Delete Collected Log Files From Server check box to delete the collected audit log files from
the node.
Step 9 In the Action Options pane, check the Download Files check box.The Trace Download Configuration Dialog window appears.
Step 10 Enter the following information:
• Protocol: Select FTP (default) or SFTP.
• Host IP Address: Enter the IP address of the host node.
• User Name: Enter your username.
• Password: Enter your password.
• Port: Enter the FTP or SFTP port information.
• Download Directory Path: Enter the complete directory path where the files get downloaded.
• Click Test Connection. When the connection has been tested, the files are downloaded.
Cisco Unified Real-Time Monitoring Tool Administration Guide, Release 11.0(1)156
Traces and LogsCollect files

You can choose Localhost download option when downloading traces. This option is available onlyfor Cisco Intercompany Media Engine servers.
If you download trace files to the local host directories on the Cisco Intercompany Media Engineserver, you can offload the files to a remote SFTP server by using the file get CLI command.
Note
FTP is not supported for Cisco Intercompany MediaEngine.
Note
You have completed the steps to schedule the download of audit logs.
Display Downloaded Trace Files Using Local BrowseAfter you collect trace files and download them to your PC, you can view them with a text editor that canhandle UNIX variant line terminators such asWordPad on your PC, or you can view them by using the viewerswithin Unified RTMT.
Do not use NotePad to view collected trace files.Tip
Follow this procedure to display the log files that you collected with the Trace and Log Central feature. If youzipped the trace files when you downloaded them to your PC, you need to unzip the files to view them byusing the viewers within Unified RTMT.
You can open a maximum of five concurrent files for viewing within Trace and Log Central, whichincludes using the Query Wizard, Local Browse, and Remote Browse features.
Note
Before You Begin
Collect the required traces files. See topics related to collecting trace files, downloading trace files using QueryWizard, and scheduling trace collection for instructions.
Procedure
Step 1 Open Trace and Log Central.Step 2 Double-click Local Browse.Step 3 Browse to the directory where you stored the log file and choose the file that you want to view.Step 4 To display the results, double-click the file.
If the file type has a viewer that is already associated with it, the file opens in that viewer. Otherwise, theOpen With dialog box appears.
Step 5 Click the program that want to use to view the file. If your preferred program is not on the list, choose anotherprogram by clicking Other.If you want to use this program as your default viewer, check the Always use this program to open thesefiles check box.
Unified RTMT displays the file in the appropriate viewer for the file type. If no other appropriate viewerapplies, Unified RTMT opens files in the Generic Log Viewer.
Cisco Unified Real-Time Monitoring Tool Administration Guide, Release 11.0(1) 157
Traces and LogsDisplay Downloaded Trace Files Using Local Browse

Display and Download Trace Files in Cisco Unified Communications ManagerAfter the system generates trace files, you can view them on the node by using the viewers within UnifiedRTMT. You can also use the remote browse feature to download the traces to your PC.
Follow this procedure to display and download the log files on the node with the Trace and Log Centralfeature.
You can open a maximum of five concurrent files for viewing within Trace and Log Central. This includesusing the Query Wizard, Local Browse, and Remote Browse features.
Note
Before You Begin
Collect the required traces files. See topics related to collecting trace files, downloading trace files using QueryWizard, and scheduling trace collection.
Procedure
Step 1 Open the Trace and Log Central options.Step 2 Double-click Remote Browse.Step 3 Choose the appropriate radio button, and click Next.
• If you choose Trace Files, go to Step 4.
• If you choose Crash Dump, go to Step 7.
The services that you have not activated also appear, so you can choose traces for those services.Note
If you choose Crash Dump, the wizard displays only the services that may cause a crash dump. Ifyou do not see the service in which you are interested, click Back and choose Trace Files.
Note
You can install some of the listed services/applications only on a particular node in the cluster. Tochoose traces for those services/applications, make sure that you choose traces from the node onwhich you have activated the service/application.
Note
Step 4 Perform one of the following actions in the Select CCM Services/Application tab:If you have a standalone node and check the Select All Services on All Servers check box, thesystem collects traces for all service and applications for your standalone node.
Note
• To collect traces for all services and applications for all nodes, check the Select All Services on AllServers check box and click Next.
• To collect traces for all services and applications on a particular node, check the check box next to thenode and click Next.
• To collect traces for particular services or applications on particular nodes, check the check boxes thatapply and click Next.
Cisco Unified Real-Time Monitoring Tool Administration Guide, Release 11.0(1)158
Traces and LogsDisplay and Download Trace Files in Cisco Unified Communications Manager

• To continue the Remote Browse wizard without collecting traces for services or applications, clickNext.
Step 5 In the Select System Services/Application tab, perform one of the following actions:If you have a standalone node and check the Select All Services on All Servers check box, thesystem collects system logs for your standalone node.
Note
a) To collect all system logs for all nodes, check the Select All Services on all Servers check box and clickNext.
b) To collect traces for all system logs on a particular node, check the check box next to the node and clickNext.
c) To collect traces for particular system logs on particular nodes, check the check boxes that apply and clickNext.
d) To continue the Remote Browse wizard without collecting traces for system logs, click Next.e) Go to Step 10.
Step 6 Perform one of the following actions in the Select CCM Services/Application tab:If you have a standalone node and check the Select All Services on All Servers check box, thesystem collects crash dump files for your standalone node.
Note
a) To choose crash dump files for all services and applications for all nodes, check the Select All Serviceson All Servers check box and click Next.
b) To choose crash dump files for all services and applications on a particular node, check the check boxnext to the node and click Next.
c) To choose crash dump files for particular services or applications on particular nodes, check the checkboxes that apply and click Next.
d) To continue the Remote Browse wizard without collecting crash dump files, click Next.Go to Step 8 for Cisco Business Edition or go to Step 9 for Unified Communications Manager.
Step 7 In the Select System Services/Application tab, perform one of the following tasks:If you have a standalone node and check the Select All Services on All Servers check box, thesystem collects crash dump files for your standalone node.
Note
a) To choose crash dump files for all nodes, check the Select All Services on all Servers check box.b) To choose crash dump files for all system logs on a particular node, check the check box next to the node.c) To choose crash dump files for particular system logs on particular nodes, check the check boxes that
apply.d) To continue the Remote Browse wizard without collecting crash dump files, go to the next step.
Step 8 Click Finish.Step 9 After the traces become available, a message appears. Click Close.Step 10 Perform one of the following actions:
• To display the results, navigate to the file through the tree hierarchy. After the log filename appears inthe pane on the right side of the window, you can either right-click the mouse to select the type ofprogram that you would like to use to view the file or double-click the file to display the file in the defaultviewer.
To sort the files that appear in the pane, click a column header; for example, to sort the files byname, click the Name column header.
Tip
The real-time monitoring tool displays the file in the appropriate viewer for the file type. If no otherappropriate viewer applies, the real-time monitoring tool opens files in the Generic Log Viewer.
• To download the trace files, choose the files that you want to download, click Download, specify thecriteria for the download, and click Finish.
Cisco Unified Real-Time Monitoring Tool Administration Guide, Release 11.0(1) 159
Traces and LogsDisplay and Download Trace Files in Cisco Unified Communications Manager

To specify the directory in which you want to download the trace files, click Browse next to theDownload all files field, navigate to the directory, and click Open. The default specifies
◦
<rtmt_users_directory>\<server name or server IP address>\<downloadtime>.
◦To create a zip file of the trace files that you collect, check the Zip File check box.
◦To delete collected log files from the node, check the Delete Files on server check box.
• To delete trace files from the node, click the file that appears in the pane on the right side of the window;then, click Delete.
• To refresh a specific service or a specific node in a cluster, click the service or node name; then, clickRefresh. After a message states that the remote browse is ready, click Close.
• To refresh all services or all nodes in a cluster that appear in the tree hierarchy, click Refresh All. Aftera message states that the remote browse is ready, click Close.
After you download the trace files, you can view them in Local Browse.Tip
Display And Download Trace Files in Cisco Unity ConnectionAfter the system generates trace files, you can view them on the node by using the viewers within UnifiedRTMT. You can also use the remote browse feature to download the traces to your PC.
Follow this procedure to display and download the log files on the node with the Trace and Log Centralfeature.
You can open a maximum of five concurrent files for viewing within Trace and Log Central. This includesusing the Query Wizard, Local Browse, and Remote Browse features.
Note
Before You Begin
Collect the required traces files. See topics related to collecting trace files, downloading trace files using QueryWizard, and scheduling trace collection.
Procedure
Step 1 Open the Trace and Log Central options.Step 2 Double-click Remote Browse.Step 3 Choose the appropriate radio button, and click Next.
The services that you have not activated also appear, so you can choose traces for those services.Note
If you choose Crash Dump, the wizard displays only the services that may cause a crash dump. Ifyou do not see the service in which you are interested, click Back and choose Trace Files.
Note
Cisco Unity Connection clusters: You can install some of the listed services on applications on aparticular node in the cluster. To choose traces for those services or applications, make sure that youchoose traces from the node on which you have activated the service or application.
Note
Cisco Unified Real-Time Monitoring Tool Administration Guide, Release 11.0(1)160
Traces and LogsDisplay And Download Trace Files in Cisco Unity Connection

Step 4 In the Select CUC Services/Application tab, perform one of the following actions:
• To collect all system logs for the node, check the Select All Services on all Servers check box or checkthe check box next to the node and click Next.
• To collect traces for particular system logs on the node, check the check boxes that apply and clickNext.
• To continue the Remote Browse wizard without collecting traces for system logs, click Next.
Step 5 In the Select System Services/Application tab, perform one of the following actions:If you have a standalone node and check the Select All Services on All Servers check box, thesystem collects system logs for your standalone node.
Note
• To collect all system logs for all nodes, check the Select All Services on all Servers check box andclick Next.
• To collect traces for all system logs on a particular node, check the check box next to the node and clickNext.
• To collect traces for particular system logs on particular nodes, check the check boxes that apply andclick Next.
• To continue the Remote Browse wizard without collecting traces for system logs, click Next.
Step 6 In the Select CUC Services/Application tab, perform one of the following tasks:
• To choose crash dump files for the node, check the Select All Services on all Servers check box orcheck the check box next to the node and click Next.
• To choose crash dump files for particular system logs on the node, check the check boxes that applyand click Next.
• To continue the Remote Browse wizard without collecting crash dump files, click Next.
Step 7 In the Select System Services/Application tab, perform one of the following tasks:If you have a standalone node and check the Select All Services on All Servers check box, thesystem collects crash dump files for your standalone node.
Note
• To choose crash dump files for all nodes, check the Select All Services on all Servers check box.
• To choose crash dump files for all system logs on a particular node, check the check box next to thenode.
• To choose crash dump files for particular system logs on particular nodes, check the check boxes thatapply.
• To continue the Remote Browse wizard without collecting crash dump files, go to the next step.
Step 8 Click Finish.Step 9 After the traces become available, a message appears. Click Close.Step 10 Perform one of the following actions:
• To display the results, navigate to the file through the tree hierarchy. After the log filename appears inthe pane on the right side of the window, you can either right-click the mouse to select the type ofprogram that you would like to use to view the file or double-click the file to display the file in the defaultviewer.
Cisco Unified Real-Time Monitoring Tool Administration Guide, Release 11.0(1) 161
Traces and LogsDisplay And Download Trace Files in Cisco Unity Connection

To sort the files that appear in the pane, click a column header; for example, to sort the files byname, click the Name column header.
Tip
The real-time monitoring tool displays the file in the appropriate viewer for the file type. If no otherappropriate viewer applies, the real-time monitoring tool opens files in the Generic Log Viewer.
• To download the trace files, choose the files that you want to download, click Download, specify thecriteria for the download, and click Finish.
◦To specify the directory in which you want to download the trace files, click Browse next to theDownload all files field, navigate to the directory, and click Open. The default specifies<rtmt_user_directory>\<server name or server IP address>\<downloadtime> where <rtmt_user_directory> specifies the directory where Unified RTMT isinstalled.
◦To create a zip file of the trace files that you collect, check the Zip File check box.
◦To delete collected log files from the node, check the Delete Files on server check box.
• To delete trace files from the node, click the file that appears in the pane on the right side of the window;then, click Delete.
• To refresh a specific service or a specific node in a cluster, click the service or node name; then, clickRefresh. After a message states that the remote browse is ready, click Close.
• To refresh all services or all nodes in a cluster that appear in the tree hierarchy, click Refresh All. Aftera message states that the remote browse is ready, click Close.
After you download the trace files, you can view them in Local Browse.Tip
Set Trace Collection Attributes
Before You Begin
Collect traces files.
Procedure
Step 1 Open Trace & Log Central.Step 2 Double-select Remote Browse.Step 3 Select the appropriate radio button, Trace Files or Crash Dump.Step 4 Select Next.Step 5 Perform one of the following actions:
a) If you select Trace Files, go to step 6.b) If you select Crash Dump, go to step 8.
Step 6 Perform one of the following actions in the Voice/Video or IM and Presence Applications/Services tab:
Cisco Unified Real-Time Monitoring Tool Administration Guide, Release 11.0(1)162
Traces and LogsSet Trace Collection Attributes

ActionIf you want to:
• Select All Services on All Servers
• Select Next.
Collect traces for all services andapplications for all servers in thecluster
• Check the name of the server.
• Select Next.
Collect traces for all services andapplications on a particular server
• Check the traces that apply.
• Select Next.
Collect traces for particular servicesor applications on particular servers
Select Next.Continue the trace collection wizardwithout collecting traces for servicesor applications
Step 7 Perform one of the following actions in the Select System Services/Application tab:ActionIf you want to:
• Check Select All Services on all Servers.
• Select Next
Collect all system logs for all serversin the cluster
• Check the name of the server.
• Select Next.
Collect traces for all system logs ona particular server
• Check the traces that apply.For example, to collect CSA logs, checkCisco SecurityAgent. To access user logs that provide informationabout users that are signing in and out, check SecurityLogs.
Note
• Select Next.
Collect traces for particular systemlogs on particular servers
Go to Select finish.Continue the remote browse wizardwithout collecting traces for systemlogs
Step 8 Perform one of the following actions in the Voice/Video or IM and Presence Applications/Services tab:.
Cisco Unified Real-Time Monitoring Tool Administration Guide, Release 11.0(1) 163
Traces and LogsSet Trace Collection Attributes

ActionIf you want to:
• Check Select All Services on All Servers.
• Select Next.
Collect crash dump files for allservices and applications for allservers in the cluster
• Check the name of the server.
• Select Next.
Collect crash dump files for allservices and applications on aparticular server
• Check the traces that apply.
• Select Next.
Collect crash dump files forparticular services or applications onparticular servers
Step 9 Perform one of the following actions in the Select System Services/Application tab:.ActionIf you want to:
• Check Select All Services on All Servers.
• Select Next.
Collect crash dump files for allservices and applications for allservers in the cluster
• Check the name of the server.
• Select Next.
Collect crash dump files for allservices and applications on aparticular server
• Check the traces that apply.
• Select Next.
Collect crash dump files for particularservices or applications on particularservers.
Go to Step 10.Continue the collect crash dumpwizard without collecting crash dumpfiles
Step 10 Select Finish.
What to Do Next
View trace results.
Cisco Unified Real-Time Monitoring Tool Administration Guide, Release 11.0(1)164
Traces and LogsSet Trace Collection Attributes

View Trace Results• You can install some listed services/applications only on a particular node in the cluster. To select tracesfor those services/applications, make sure that you select traces from the server on which you haveactivated the service/application.
• The services that you have not activated also display, so you can select traces for those services.
• After you have downloaded the trace files, you can view them by using the Local Browse option of thetrace and log central feature.
• To sort the files that displays in the pane, select a column header; for example, to sort the files by name,select the Name column header.
• The Real-Time Monitoring Tool displays the file in the appropriate viewer for the file type. If no otherappropriate viewer applies, the Real-Time Monitoring Tool opens files in the Generic Log Viewer.
• The IM and Presence service does not support the Q931 Translator. IM and Presence does not supportQRT report information.
Before You Begin
Set your trace collection attributes.
Procedure
Step 1 Select Close when a message states that the trace results are available.Step 2 Perform one of the following actions:
ActionIf you want to:
Perform one of the following actions to navigate to the file:
Right-select the mouse to select the type of program that youwould like to use to view the file.Double-select the file to displaythe file in the default viewer.
To display the results
• Select the files that you want to download.
• Select Download.
• Specify the criteria for the download.
• Select Finish.
Download the trace files and the result filethat contains a list of the trace files thatyour query collected
• Select Browse next to the Download all files field.
• Navigate to the directory.
• Select Open. The default specifies C:\ProgramFiles\Cisco\Presence Serviceability\jrtmt\<server IPaddress>\<download time>
Specify the directory in which you wantto download the trace files and the resultsfile
Cisco Unified Real-Time Monitoring Tool Administration Guide, Release 11.0(1) 165
Traces and LogsView Trace Results

ActionIf you want to:
Check Zip File.Create a zip file of the trace files that youcollected
Check Delete Collected Log Files from Server.Delete collected log files from the server
• Select the file that displays in the pane on the right side ofthe window.
• Select Delete.
Delete trace files from the node
• Select the server name or service.
• Select Refresh.
• SelectClosewhen a message states that the remote browseis ready.
Refresh a specific service or node
• Select Refresh All.
• SelectClosewhen a message states that the remote browseis ready.
Refresh all services and nodes that displayin the tree hierarchy
Display Report InformationYou can view the QRT log files by either viewing the files on the server or by downloading the files ontoyour computer.
This section applies only to Cisco Unified Communications Manager.Note
You can view the IP phone problem reports that the Quality Report Tool generates by using the QRT viewer.QRT serves as a voice-quality and general problem-reporting tool for Cisco Unified IP Phones. After youcollect the QRT log files, you can use the following procedure to list and view Cisco Unified CommunicationsManager IP Phone problem reports by using the QRT viewer. The QRT viewer allows you to filter, format,and view phone problem reports that are generated. For more information about how to configure and useQRT, see the System Configuration Guide for Cisco Unified Communications Manager .
Before You Begin
Collect or view the Quality Report Tool (QRT) log files. See topics related to collecting trace files, schedulingtrace collection, and downloading trace files using either Query Wizard or the Remote Browser.
Cisco Unified Real-Time Monitoring Tool Administration Guide, Release 11.0(1)166
Traces and LogsDisplay Report Information

Procedure
Step 1 Display the log file entries by using the Query Wizard, the Remote Browse, or the Local Browse option inTrace and Log Central.The QRT Viewer window appears.
Only log files from the Cisco Extended Functions service contain QRT information. The followingformat for the log filename that contains QRT data applies: qrtXXX.xml.
Note
The QRT viewer allows only the .xml files with a specific structure (having phone details), not thedefault one. If you open generic log files, you may see the following error message:
Fail to Open Cisco QRT Viewer, No Records Available!
Note
Step 2 From theExtension drop-down list box, choose the extension or extensions that you want the report to include.Step 3 From the Device drop-down list box, choose the device or devices that you want the report to include.Step 4 From the Category drop-down list box, choose the problem category that you want the report to include.Step 5 From the Select Fields drop-down list box, choose the fields that you want the report to include.
The order in which you choose the fields determines the order in which they appear in the QRTReport Result pane.
Note
Step 6 To view the report in the QRT Report Result pane, click Display Records.
Log CompressionIn Unified CommunicationsManager 8.0 onward, the log compression feature only compresses the followinglog files:
• cm/trace/cti/sdl
• cm/trace/cti/sdi
• cm/trace/ccm/sdl
• cm/trace/ccm/sdi
The other log files are not compressed and are written directly to the hard disk.
The compressed files have a .gz extension. The file that is being actively written to the disk will have a .gzoextension.
All the CLI commands used to view and tail the files will work on the compressed files and will automaticallyuncompress them for viewing or tailing. The only difference is in specifying file names with the .gz and .gzoextension.
The following option is available with the file tail command:
file tail activelog cm/trace/cti/sdl recent
The recent option, when used with a compressed directory, continually tails the most recent log file. You donot need to switch to a newer log file when the currently written-to log file is closed, so it is an infinite andongoing tail. This option is only available with the compressed log files.
The log files are compressed in the gzip format. For uncompressing the log files, the open source program7-Zip is available at http://www.7-zip.org, and works on all Windows platforms. You can use 7-Zip
Cisco Unified Real-Time Monitoring Tool Administration Guide, Release 11.0(1) 167
Traces and LogsLog Compression
on any computer, including a computer in a commercial organization. You do not need to register or pay for7-Zip. On a Linux platform, you can use the gzip or gunzip commands.
Edit Trace SettingsFollow this procedure to edit trace settings for Unified RTMT.
The Error radio button is the default setting.Note
Procedure
Step 1 Choose Edit > Trace SettingStep 2 Click the radio button that applies.
The system stores the rtmt.log file in the Documents and Settings directory for the user; for example, on aWindows machine, the log is stored in C:\Documents and Settings\<userid>\.jrtmt\log.
Log Viewers
Messages in AuditLog ViewerYou can display the following messages in AuditLog Viewer:
• AuditApp Logs: These logs are related to Unified Communications Manager application audit logs.
• Vos Logs: These logs are related to platform (terminal, port or network address of the system) activities.
The following table describes the AuditLog Viewer buttons.
Table 19: AuditLog Viewer Buttons
FunctionButton
Updates the contents of the current log on the Auditlog Viewer.
You can enable the Auditlog Viewer to automaticallyupdate the current log file every 5 seconds by checkingthe Auto Refresh check box.
Tip
Refresh
Clears the display of the current log.Clear
Cisco Unified Real-Time Monitoring Tool Administration Guide, Release 11.0(1)168
Traces and LogsEdit Trace Settings

FunctionButton
For auditapp logs, limits the logs displayed based on the UserIDyou select.
For vos logs, limits the logs displayed based on the set of options(Address, Terminal, and Type) that you select.
You can display logs other than the set of options youselected by checking the Filter Inverse check box.
Tip
Filter
Removes the filter that limits the type of logs that appear.Clear Filter
Allows you to search for a particular string in the current log.Find
Saves the currently selected log on your PC.Save
To make a column larger or smaller when viewing an auditlog message, drag the arrow that displays whenyour mouse hovers between two column headings.
You can order the displayed auditlog messages by clicking a column heading. The first time that you click acolumn heading, the logs display in ascending order. A small triangle pointing up indicates ascending order.If you click the column heading again, the logs display in descending order. A small triangle pointing downindicates descending order. If you click the column heading one more time, the logs display in the unsortedstate.
Display AuditApp Logs
Procedure
Step 1 Choose System > Tools > AuditLog Viewer.Step 2 From the Select a Node drop-down list, choose the server on which the logs that you want to view are stored.Step 3 Double-click the AuditApp Logs folder.Step 4 Click the .log file located outside the Archive folder to view the current logs. The AuditApp Logs for the
selected node are displayed in a tabular form.If you want see the old logs, double-click the Archive folder and click the correspondingfile.
Note
Step 5 Double-click the entry that you want to view. The auditlog message for that particular entry appears in a newwindow.
You can filter the auditlog message display results by choosing an option in the Filter By drop-downlist box. To remove the filter, click Clear Filter. All logs appear after you clear the filter.
Tip
Cisco Unified Real-Time Monitoring Tool Administration Guide, Release 11.0(1) 169
Traces and LogsMessages in AuditLog Viewer

Display Cisco Unified OS Logs
Procedure
Step 1 Choose System > Tools > AuditLog ViewerStep 2 From the Select a Node drop-down list, choose the node where the logs that you want to view are stored.Step 3 Double-click the Cisco Unified OS Logs folder.Step 4 Click the vos-audit.log file located outside the Archive folder to view the current logs. The Cisco Unified
OS Logs for the selected node appear in a tabular form.If you want see the old logs, double-click the Archive folder and click the correspondingfile.
Note
Step 5 Double-click the entry that you want to view. The Cisco Unified OS log message for that particular entry isdisplayed in a new window.
You can filter the Cisco Unified OS log message display results by choosing the set of options in apop up window that appears after you click Filter. To remove the filter, click Clear Filter. All logsappear after you clear the filter.
Tip
Display Messages in SysLog ViewerYou can display messages in SysLog Viewer.
CiscoSyslog messages also display the syslog definition, which includes recommended actions, in anadjacent pane when you double-click the syslog message. You do not have to access the AlarmDefinitionsin Cisco Unified Serviceability for this information.
Tip
The following table describes the SysLog Viewer buttons.
Table 20: Syslog Viewer Buttons
FunctionButton
Updates the contents of the current log on the syslog viewer.
You can enable the syslog viewer to automatically updatethe syslog messages every 5 seconds by checking theAuto Refresh check box.
Tip
Refresh
Clears the display of the current log.Clear
Limits the messages that appear based on the set of options thatyou select.
Filter
Removes the filter that limits the type of messages that appear.Clear Filter
Allows you to search for a particular string in the current log.Find
Cisco Unified Real-Time Monitoring Tool Administration Guide, Release 11.0(1)170
Traces and LogsDisplay Messages in SysLog Viewer

FunctionButton
Saves the currently selected log on your PC.Save
When you view the syslog message, drag the arrow that appears when your mouse hovers between two columnheadings to make the column larger or smaller.
You can order the displayed syslog messages by clicking a column heading. The first time that you click acolumn heading, the records display in ascending order. A small triangle pointing up indicates ascendingorder. If you click the column heading again, the records display in descending order. A small triangle pointingdown indicates descending order. If you click the column heading one more time, the records display in theunsorted state.
Procedure
Step 1 Choose System > Tools > SysLog Viewer > Open SysLog Viewer.Step 2 From the Select a Node drop-down list box, choose the server where the logs that you want to view are stored.Step 3 Click the tab for the logs that you want to view.Step 4 After the log appears, double-click the log icon to list the filenames in the same window.
If some syslog messages do not appear in the window, scrolling the mouse pointer over the missingsyslog messages refreshes the display.
Tip
Step 5 To view the contents of the file at the bottom of the window, click the filename.Step 6 Click the entry that you want to view.
To view the complete syslog message, double-click the syslog message. You can also use the buttons describedin the SysLog Viewer Buttons table to view the syslog messages.
You can filter the syslog message display results by choosing an option in the Filter By drop-downlist box. To remove the filter, click Clear Filter. All logs appear after you clear the filter.
Tip
Plugins
Download and Install Application Plug-InsYou can expand the functionality of Unified RTMT by installing application plug-ins, such as the Voice LogTranslator (VLT) application. You can download the latest plug-ins for Unified RTMT from Cisco.com. Afterinstalling the plug-in, you can access the application in Unifed RTMT.
To download and install the plug-in, perform the following procedure:
Procedure
Step 1 Choose Application > CCO Voice Tools Download.
Cisco Unified Real-Time Monitoring Tool Administration Guide, Release 11.0(1) 171
Traces and LogsPlugins

The Login Prompt appears.
Step 2 Enter your Cisco.com username and password and click OK.Step 3 Download the file to your PC.Step 4 To begin the installation, double-click the download file.Step 5 Follow the installation instructions.
Launch Application Plug-InsAfter downloading and installing the plug-in, you can access the application in the RTMT viewer.
Procedure
Under System > Tools > Plugin, choose the plug-in that you want to launch.The application appears in the plugin window. See the application document for usage information.
Cisco Unified Real-Time Monitoring Tool Administration Guide, Release 11.0(1)172
Traces and LogsLaunch Application Plug-Ins
A P P E N D I X APerformance Counters and Alerts
• System Counters, page 173
• Voice and Video Counters, page 192
• IM and Presence Service Counters, page 273
• Cisco Unity Connection Counters, page 295
• System Alerts, page 319
• Voice and Video Alerts, page 337
• IM and Presence Service Alerts, page 375
• Intercompany Media Engine Alerts, page 401
• Cisco Unity Connection Alerts, page 409
System Counters
Cisco Tomcat ConnectorThe Tomcat Hypertext Transport Protocol (HTTP) and HTTP Secure (HTTPS) Connector object providesinformation about Tomcat connectors.
A Tomcat HTTP connector represents an endpoint that receives requests and sends responses. The connectorhandles HTTP/HTTPS requests and sends HTTP/HTTPS responses that occur when application web pagesare accessed. The Secure Socket Layer (SSL) status of web application URLs provides the basis for the instancename for each Tomcat HTTP Connector. For example, https://<IP Address>:8443 for SSL orhttp://<IP Address>:8080 for non-SSL.
The following table contains information about the Tomcat HTTP connector counters.
Cisco Unified Real-Time Monitoring Tool Administration Guide, Release 11.0(1) 173

Table 21: Cisco Tomcat Connector
Counter DescriptionCounters
The total number of HTTP errors (for example, 401 Unauthorized)that the connector encountered.
Errors
The amount of data that the connector received.MBytesReceived
The amount of data that the connector sent.MBytesSent
The total number of request that the connector handled.Requests
The current total number of request processing threads, includingavailable and in-use threads, for the connector.
ThreadsTotal
Themaximum number of request processing threads for the connector.
Each incoming request on a web application window requires a threadfor the duration of that request. If more simultaneous requests arereceived than the currently available request processing threads canhandle, additional threads are created up to the configured maximumshown in this counter. If still more simultaneous requests are received,they accumulate within the server socket that the connector created,up to an internally specified maximum number. Any furthersimultaneous requests receive connection refused messages untilresources are available to process them.
ThreadsMax
This counter represents the current number of busy/in-use requestprocessing threads for the connector.
ThreadsBusy
Cisco Tomcat JVMThe Cisco Tomcat Java Virtual Machine (JVM) object provides information about the pool of commonresource memory used by web applications such as Cisco Unified Communications Manager Administration,Cisco Unified Serviceability, and Cisco Unity Connection Administration. The dynamic memory block storesall objects that Tomcat and its web applications create.
The following table contains information about the Tomcat JVM counters.
Cisco Unified Real-Time Monitoring Tool Administration Guide, Release 11.0(1)174
Performance Counters and AlertsCisco Tomcat JVM

Table 22: Tomcat JVM
Counter DescriptionCounters
The amount of free dynamic memory block (heap memory) in theTomcat Java Virtual Machine.
When the amount of free dynamic memory is low, more memory isautomatically allocated, and total memory size (represented by theKbytesMemoryTotal counter) increases but only up to the maximum(represented by the KbytesMemoryMax counter).
You can determine the amount of memory in use by subtractingKBytesMemoryFree from KbytesMemoryTotal.
KBytesMemoryFree
The amount of free dynamic memory block (heap memory) in theTomcat Java Virtual Machine.
KBytesMemoryMax
The current total dynamicmemory block size, including free and in-usememory, of Tomcat Java Virtual Machine.
KBytesMemoryTotal
Cisco Tomcat Web ApplicationThe Cisco Tomcat Web Application object provides information about how to run web applications.
The URLs for the web application provide the basis for the instance name for each Tomcat Web Application,as explained in the following examples:
• Cisco Unified Communications Manager Administration (https://<IPAddress>:8443/ccmadmin) is identified by ccmadmin.
• Cisco Unified Serviceability (https://<IP Address>:8443/ccmservice) is identified byccmservice.
• CiscoUnifiedCommunicationsManagerUserOptions (https://<IP Address>:8443/ccmuser)is identified by ccmuser.
• Cisco Unity Connection Administration (https://<IP Address>:8443/cuadmin) is identifiedby cuadmin.
• URLs that do not have an extension, such as https://<IP Address>:8443 or http://<IPAddress>:8080), are identified by _root.
The following table contains information on the Tomcat Web Application counters.
Table 23: Tomcat Web Application
Counter DescriptionCounters
The total number of HTTP errors (for example, 401 Unauthorized)that a Cisco Unified CommunicationsManager-related or Cisco UnityConnection-related web application encounters.
Errors
Cisco Unified Real-Time Monitoring Tool Administration Guide, Release 11.0(1) 175
Performance Counters and AlertsCisco Tomcat Web Application

Counter DescriptionCounters
The total number of requests that the web application handles. Eachtime that a web application is accessed, its Requests counter incrementsaccordingly.
Requests
The number of active or in use sessions in the web application.SessionsActive
Database Change Notification ClientThe Database Change Notification Client object provides information about change notification clients. Thefollowing table contains information about the Database Change Notification Client counters.
Table 24: Database Change Notification Client
Counter DescriptionsCounters
The number of database change notifications that have been processed.This counter refreshes every 15 seconds.
MessagesProcessed
The number of change notification messages that are currently beingprocessed or are waiting to be processed in the change notificationqueue for this client. This counter refreshes every 15 seconds.
MessagesProcessing
The head pointer to the change notification queue. The head pointeracts as the starting point in the change notification queue. To determinethe number of notifications in the queue, subtract the head pointer valuefrom the tail pointer value. By default, this counter refreshes every 15seconds.
QueueHeadPointer
The largest number of change notification messages that will beprocessed for this client. This counter remains cumulative since thelast restart of the Cisco Database Layer Monitor service.
QueueMax
The tail pointer to the change notification queue. The tail pointerrepresents the ending point in the change notification queue. Todetermine the number of notifications in the queue, subtract the headpointer value from the tail pointer value. By default, this counterrefreshes every 15 seconds
QueueTailPointer
The number of tables in which this client has subscribed.TablesSubscribed
Database Change Notification ServerTheDatabase ChangeNotification Server object provides information about different change-notification-relatedstatistics. The following table contains information about the Database Change Notification Server counters.
Cisco Unified Real-Time Monitoring Tool Administration Guide, Release 11.0(1)176
Performance Counters and AlertsDatabase Change Notification Client
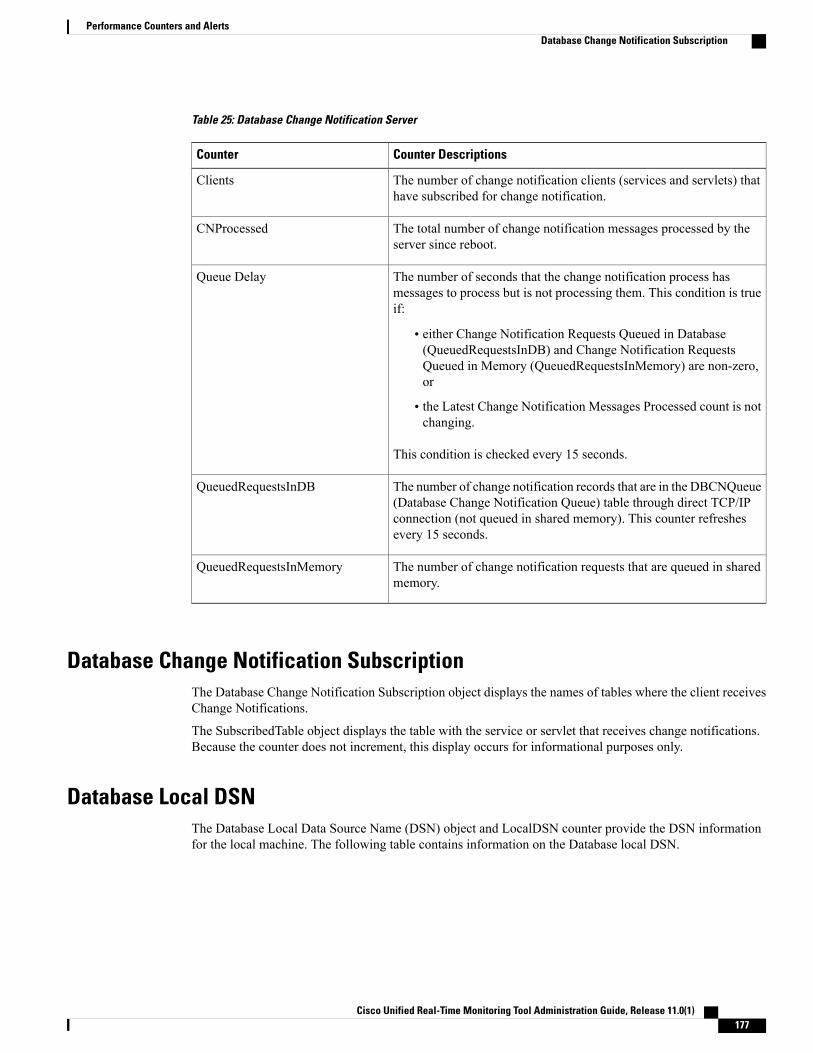
Table 25: Database Change Notification Server
Counter DescriptionsCounter
The number of change notification clients (services and servlets) thathave subscribed for change notification.
Clients
The total number of change notification messages processed by theserver since reboot.
CNProcessed
The number of seconds that the change notification process hasmessages to process but is not processing them. This condition is trueif:
• either Change Notification Requests Queued in Database(QueuedRequestsInDB) and Change Notification RequestsQueued in Memory (QueuedRequestsInMemory) are non-zero,or
• the Latest Change Notification Messages Processed count is notchanging.
This condition is checked every 15 seconds.
Queue Delay
The number of change notification records that are in the DBCNQueue(Database Change Notification Queue) table through direct TCP/IPconnection (not queued in shared memory). This counter refreshesevery 15 seconds.
QueuedRequestsInDB
The number of change notification requests that are queued in sharedmemory.
QueuedRequestsInMemory
Database Change Notification SubscriptionThe Database Change Notification Subscription object displays the names of tables where the client receivesChange Notifications.
The SubscribedTable object displays the table with the service or servlet that receives change notifications.Because the counter does not increment, this display occurs for informational purposes only.
Database Local DSNThe Database Local Data Source Name (DSN) object and LocalDSN counter provide the DSN informationfor the local machine. The following table contains information on the Database local DSN.
Cisco Unified Real-Time Monitoring Tool Administration Guide, Release 11.0(1) 177
Performance Counters and AlertsDatabase Change Notification Subscription

Table 26: Database Local Data Source Name
Counter DescriptionsCounters
The amount of Ccm DbSpace that is consumedCcmDbSpace_Used
The amount of Ccmtemp DbSpace that is consumed.CcmtempDbSpace_Used
The percentage of CN DbSpace that is consumed.CNDbSpace_Used
The DSN that is being referenced from the local machine.LocalDSN
The total shared memory that is free.SharedMemory_Free
The total shared memory that is used.SharedMemory_Used
The amount of RootDbSpace that is consumed.RootDbSpace_Used
DB User Host Information CountersThe DB User Host Information object provides information about DB User Host.
The DB:User:Host Instance object displays the number of connections that are present for each instance ofDB:User:Host.
Enterprise Replication DBSpace MonitorsThe enterprise replication DBSpacemonitors object displays the usage of various ERDbSpaces. The followingtable contains information about the enterprise replication DB monitors.
Table 27: Enterprise Replication DBSpace Monitors
Counter DescriptionsCounters
The amount of enterprise replication DbSpace that was consumed.ERDbSpace_Used
The amount of ERDbSpace that was consumed.ERSBDbSpace_Used
Enterprise Replication Perfmon CountersThe Enterprise Replication Perfmon Counter object provides information about the various replication counters.
The ServerName:ReplicationQueueDepth counter displays the server name followed by the replication queuedepth.
Cisco Unified Real-Time Monitoring Tool Administration Guide, Release 11.0(1)178
Performance Counters and AlertsDB User Host Information Counters

IPThe IP object provides information on the IPv4-related statistics on your system. The following table containsinformation about the IP counters.
These counters are also part of the IP6 object, which supports Cisco Unified CommunicationsManagerand provides information about the IPv6-related statistics on your system.
Note
Table 28: IP Counters
Counter DescriptionsCounters
The number of IP datagrams fragments that are generated at this entity.Frag Creates
The number of IP datagrams that are discarded at this entity becausethe datagrams cannot be fragmented, such as datagrams where the Donot Fragment flag is set.
Frag Fails
The number of IP datagrams that are successfully fragmented at thisentity.
Frag OKs
The number of input datagrams that are delivered to IP user protocols.This counter includes Internet Control Message Protocol (ICMP).
In Delivers
The number of input IP datagrams where no issues are encountered,but which are discarded. One possible reason is a lack of buffer space.This counter does not include any datagrams that are discarded whileawaiting reassembly.
In Discards
The number of input datagrams that are discarded with header errors.This counter includes bad checksums, version number mismatch, otherformat errors, time-to-live exceeded, and other errors that are discoveredin processing their IP options.
In HdrErrors
The number of input datagrams that are received from all networkinterfaces. This counter includes datagrams that were received witherrors
In Receives
The number of locally addressed datagrams that are receivedsuccessfully but discarded because of an unknown or unsupportedprotocol.
In UnknownProtos
The number of incoming IP datagrams that are received and the numberof outgoing IP datagrams that are sent.
InOut Requests
The number of output IP datagrams that are not transmitted and arediscarded. One possible reason is a lack of buffer space.
Out Discards
Cisco Unified Real-Time Monitoring Tool Administration Guide, Release 11.0(1) 179
Performance Counters and AlertsIP

Counter DescriptionsCounters
This counter represents the total number of IP datagrams that local IPuser-protocols (including ICMP) supply to IP in requests transmission.This counter does not include any datagrams that were counted inForwDatagrams.
Out Requests
The number of IP reassembly failures that the IP reassembly algorithmdetected, including time outs and errors.
This counter does not represent the discarded IP fragments becausesome algorithms, such as the algorithm in RFC 815, can lose track ofthe number of fragments because these algorithms combine fragmentsas they are received.
Reasm Fails
The number of IP datagrams that are successfully reassembled.Reasm OKs
The number of IP fragments that are received that require reassemblyat this entity.
Reasm Reqds
MemoryThememory object provides information about the usage of physical memory and swapmemory on the server.The following table contains information about memory counters.
Table 29: Memory
Counter DescriptionsCounters
Displays the system physical memory utilization as a percentage. Thevalue of this counter is calculated as follows:
Total KBytes - Free KBytes - Buffers KBytes -Cached KBytes + Shared KBytes) / Total KBytes
This value also corresponds to the Used KBytes/Total KBytes
% Mem Used
The percentage of active pages.% Page Usage
Displays the system virtual memory utilization as a percentage. Thevalue of this counter is calculated as follows:
Total KBytes - Free KBytes - Buffers KBytes -Cached KBytes + Shared KBytes + Used SwapKBytes) / (Total KBytes + Total Swap KBytes)
This value also corresponds to Used VM KBytes/Total VM KBytes.
% VM Used
The capacity of buffers in your system in kilobytes.Buffers KBytes
The amount of cached memory in kilobytes.Cached KBytes
Cisco Unified Real-Time Monitoring Tool Administration Guide, Release 11.0(1)180
Performance Counters and AlertsMemory

Counter DescriptionsCounters
The total amount of memory that is available in your system inkilobytes.
Free KBytes
The amount of free swap space that is available in your system inkilobytes.
Free Swap KBytes
The amount of free memory in the high region.
The Linux kernel splits the virtual memory address space into memoryregions. The high memory is memory above a certain physical address,and its amount depends on the total memory and the type of kernel onthe system.
For the Cisco Unified Communications Manager system with 4 GBmemory, the highmemory is roughly in the address of 896M to 4096M.
HighFree
The total amount of memory in the high region.
The Linux kernel splits the virtual memory address space into memoryregions. The high memory is memory above a certain physical address,and its amount depends on the total memory and the type of kernel onthe system.
For the Cisco Unified Communications Manager system with 4 GBmemory, the highmemory is roughly in the address of 896M to 4096M.
HighTotal
The number of page faults (both major and minor) that the systemmakes per second (post 2.5 kernels only). This reading does notnecessarily represent a count of page faults that generate input andoutput (I/O) because some page faults can get resolved without I/O.
Page Faults Per Sec
The total low (non-paged) memory for kernel.Low Total
The total free low (non-paged) memory for kernel.Low Free
The number of major faults that the system makes per second thatrequire a memory page from the disk (post 2.5 kernels only).
Page Major Faults Per Sec
The number of pages that the system pages in from the disk, plus thenumber of pages that the system pages out to the disk.
Pages
The number of pages that the system pages in from the disk.Pages Input
The total number of kilobytes that the system pages in from the diskper second.
Pages Input Per Sec
The number of pages that the system pages out to the disk.Pages Output
The total number of kilobytes that the system pages out to the disk persecond.
Pages Output Per Sec
Cisco Unified Real-Time Monitoring Tool Administration Guide, Release 11.0(1) 181
Performance Counters and AlertsMemory

Counter DescriptionsCounters
The amount of shared memory in your system in kilobytes.Shared KBytes
Thememory used by created slabcaches by various kernel components,as a macroscopic counter representing the sum of all the individualentries in the proc's slabinfo.
SlabCache
The amount of Swap used as cache memory. Memory that once wasswapped out, is swapped back in, but is still in the swapfile.
SwapCached
The total amount of memory in your system in kilobytes.Total KBytes
The total amount of swap space in your system in kilobytes.Total Swap KBytes
The total amount of system physical and memory and swap space(Total Kbytes + Total Swap Kbytes) that is in use in your system inkilobytes.
Total VM KBytes
The amount of in-use physical memory. The value of the Used KBytescounter is calculated as follows:
Total KBytes - Free KBytes - Buffers KBytes -Cached KBytes + Shared KBytes.
The Used KBytes value differs from the Linux term that displays inthe top or free command output. The Used value that displays in thetop or free command output equals the difference in Total KBytes -Free KBytes and also includes the sum of Buffers KBytes and CachedKBytes.
Used KBytes
This counter represents the amount of swap space that is in use on yoursystem in kilobytes.
Used Swap KBytes
This counter represents the system physical memory and the amountof swap space that is in use on your system in kilobytes. The value iscalculated as follows:
Total KBytes - Free KBytes - Buffers KBytes -Cached KBytes + Shared KBytes + Used Swap KBytes
This value corresponds to Used Mem KBytes + Used Swap KBytes.
Used VM KBytes
Network InterfaceThe network interface object provides information about the network interfaces on the system. The followingtable contains information about network interface counters.
Cisco Unified Real-Time Monitoring Tool Administration Guide, Release 11.0(1)182
Performance Counters and AlertsNetwork Interface

Table 30: Network Interface
Counter DescriptionsCounters
The number of bytes, including framing characters, that are receivedon this interface.
Rx Bytes
The number of inbound packets that are chosen to be discarded eventhough no errors have been detected. This action prevents the packetfrom being delivered to a higher-layer protocol. Discarding packetsalso frees up buffer space.
Rx Dropped
The number of inbound packets (packet-oriented interfaces) and thenumber of inbound transmission units (character-oriented orfixed-length interfaces) that contain errors that prevented them frombeing delivered to a higher-layer protocol.
Rx Errors
The number of multicast packets that are received on this interface.Rx Multicast
The number of packets that this sublayer delivered to a higher sublayer.This situation does not include the packets that are addressed to amulticast or broadcast address at this sublayer.
Rx Packets
The total number of received (Rx) bytes and transmitted (Tx) bytes.Total Bytes
The total number of Rx packets and Tx packets.Total Packets
The total number of octets, including framing characters, that aretransmitted out from the interface.
Tx Bytes
The number of outbound packets that are chosen to be discarded eventhough no errors are detected. This action prevents the packet frombeing delivered to a higher layer protocol. Discarding a packet alsofrees up buffer space.
Tx Dropped
The number of outbound packets (packet-oriented interfaces) and thenumber of outbound transmission units (character-oriented orfixed-length interfaces) that are transmitted because of errors.
Tx Errors
The total number of packets that the higher-level protocols requestedfor transmission, including those that are discarded or not sent. Thissituation does not include packets that are addressed to a multicast orbroadcast address at this sublayer.
Tx Packets
The length of the output packet queue (in packets).Tx QueueLen
Cisco Unified Real-Time Monitoring Tool Administration Guide, Release 11.0(1) 183
Performance Counters and AlertsNetwork Interface

Number of Replicates Created and State of ReplicationThe Number of Replicates Created and State of Replication object provides real-time replication informationfor the system. The following table contains information about replication counters.
Table 31: Number of Replicates Created and State of Replication
Counter DescriptionsCounters
The number of replicates that are created by Informix for the DB tables.This counter displays information during Replication Setup.
Number of Replicates Created
The state of replication. The following list provides possible values:
0
Initializing. The counter equals 0 when the server is not definedor when the server is defined but realizes the template has notcompleted.
1
Replication setup script fired from this node. Cisco recommendsthat you run utils dbreplication status on the CLI to determinethe location and cause of the failure.
2
Good Replication.
3
Bad Replication. A counter value of 3 indicates replication inthe cluster is bad. It does not mean that replication failed on aparticular server in the cluster. Cisco recommends that you runutils dbreplication status on the CLI to determine the locationand cause of the failure.
4
Replication setup did not succeed.
Replicate_State
PartitionThe partition object provides information about the file system and its usage in the system. The followingtable contains information about partition counters. These counters are also available for the spare partition,if present.
Cisco Unified Real-Time Monitoring Tool Administration Guide, Release 11.0(1)184
Performance Counters and AlertsNumber of Replicates Created and State of Replication
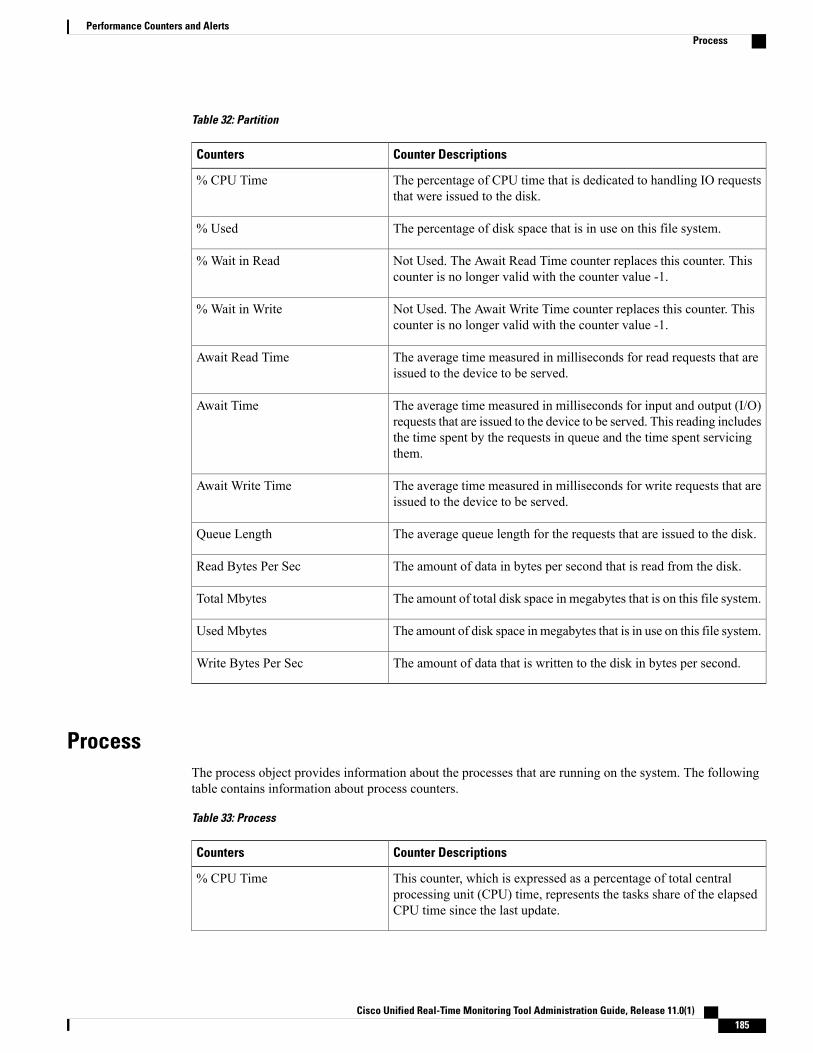
Table 32: Partition
Counter DescriptionsCounters
The percentage of CPU time that is dedicated to handling IO requeststhat were issued to the disk.
% CPU Time
The percentage of disk space that is in use on this file system.% Used
Not Used. The Await Read Time counter replaces this counter. Thiscounter is no longer valid with the counter value -1.
% Wait in Read
Not Used. The Await Write Time counter replaces this counter. Thiscounter is no longer valid with the counter value -1.
% Wait in Write
The average time measured in milliseconds for read requests that areissued to the device to be served.
Await Read Time
The average time measured in milliseconds for input and output (I/O)requests that are issued to the device to be served. This reading includesthe time spent by the requests in queue and the time spent servicingthem.
Await Time
The average time measured in milliseconds for write requests that areissued to the device to be served.
Await Write Time
The average queue length for the requests that are issued to the disk.Queue Length
The amount of data in bytes per second that is read from the disk.Read Bytes Per Sec
The amount of total disk space in megabytes that is on this file system.Total Mbytes
The amount of disk space in megabytes that is in use on this file system.Used Mbytes
The amount of data that is written to the disk in bytes per second.Write Bytes Per Sec
ProcessThe process object provides information about the processes that are running on the system. The followingtable contains information about process counters.
Table 33: Process
Counter DescriptionsCounters
This counter, which is expressed as a percentage of total centralprocessing unit (CPU) time, represents the tasks share of the elapsedCPU time since the last update.
% CPU Time
Cisco Unified Real-Time Monitoring Tool Administration Guide, Release 11.0(1) 185
Performance Counters and AlertsProcess

Counter DescriptionsCounters
This counter represents the percentage of physical memory that a taskis currently using.
% MemoryUsage
This counter represents the stack size for task memory status.Data Stack Size
This counter represents the nice value of the task.
• A negative nice value indicates that the process has a higherpriority.
• A positive nice value indicates that the process has a lowerpriority.
If the nice value equals zero, do not adjust the priority whenyou are determining the dispatchability of a task.
Note
Nice
This counter represents the number of major page faults that a taskencounters that requires the data to be loaded into memory.
Page Fault Count
This counter displays the task-unique process ID. The ID periodicallywraps, but the value never equals zero.
PID
This counter displays the process status:
0
Running
1
Sleeping
2
Uninterruptible disk sleep
3
Zombie
4
Stopped
5
Paging
6
Unknown
Process Status
Cisco Unified Real-Time Monitoring Tool Administration Guide, Release 11.0(1)186
Performance Counters and AlertsProcess

Counter DescriptionsCounters
This counter displays the amount of shared memory in kilobytes (KB)that a task is using. Other processes could potentially share the samememory.
Shared Memory Size
This counter displays the system time (STime), measured in jiffies,that this process has scheduled in kernel mode. A jiffy corresponds toa unit of CPU time and is used as a base of measurement. One secondcomprises 100 jiffies.
STime
This counter displays the number of threads that are currently groupedwith a task. A negative value (-1) indicates that this counter is currentlynot available. This situation happens when thread statistics (whichinclude all performance counters in the Thread object as well as theThread Count counter in the Process object) are turned off because thesystem total processes and threads exceed the default threshold value.
Thread Count
This counter displays the total CPU time in jiffies that the task used inuser mode and kernel mode since the task started.
Total CPU Time Used
This counter displays the time, measured in jiffies, that a task hasscheduled in user mode.
UTime
This counter displays the virtual memory usage of the heap for the taskin KB.
VmData
This counter displays the virtual memory (Vm) resident set size (RSS)that is currently in physical memory in KB. This reading includes thecode, data, and stack.
VmRSS
This counter displays the total virtual memory usage for a task in KB.This reading includes all code, data, shared libraries, and pages thathave been swapped out.
Virtual Image = swapped size + resident size
VmSize
This counter displays the channel (system call) in which the processis waiting.
Wchan
ProcessorThe processor object provides information about different processor time usage in percentages. The followingtable contains information about processor counters.
Cisco Unified Real-Time Monitoring Tool Administration Guide, Release 11.0(1) 187
Performance Counters and AlertsProcessor

Table 34: Processor
Counter DescriptionsCounters
This counter displays the processors share of the elapsed centralprocessing unit (CPU) time, excluding idle time, since the last update.This share is expressed as a percentage of total CPU time.
% CPU Time
This counter displays the percentage of time that the processor is inthe idle state and does not have an outstanding disk input and output(I/O) request.
Idle Percentage
This counter represents the percentage of time that the processor is inthe idle state while the system had an outstanding disk I/O request.
IOwait Percentage
This counter represents the percentage of time that the processor spendsexecuting the interrupt request that is assigned to devices, includingthe time that the processor spends sending a signal to the computer.
Irq Percentage
This counter displays the percentage of time that the processor spendsexecuting at the user level with nice priority.
Nice Percentage
This counter represents the percentage of time that the processor spendsexecuting the soft IRQ and deferring task switching to get better CPUperformance.
Softirq Percentage
This counter displays the percentage of time that the processor isexecuting processes at the system (kernel) level.
System Percentage
This counter displays the percentage of time that the processor isexecuting normal processes at the user (application) level.
User Percentage
SystemThe System object provides information about file descriptors on your system.
The following table contains information about system counters.
Table 35: System
Counter DescriptionsCounters
The number of allocated file descriptors.Allocated FDs
The number of file descriptors that are currently in use in the system.Being Used FDs
The number of allocated file descriptors on the system that are freed.Freed FDs
Cisco Unified Real-Time Monitoring Tool Administration Guide, Release 11.0(1)188
Performance Counters and AlertsSystem

Counter DescriptionsCounters
The number of input and output (I/O) operations on all disk partitionsper second on this server. If you experience a system performanceissue, use the information in this counter to measure the impact of theaggregate I/O operations on this server.
IOPerSecond
The number of read requests merged per second that are queued to alldevices on this server.
IOReadReqMergedPerSecond
The number of write requests merged per second that are queued toall devices on this server.
IOWriteReqMergedPerSecond
The number of read requests per second that are issued to all deviceson this server.
IOReadReqPerSecond
The number of write requests per second that are issued to all deviceson this server.
IOWriteReqPerSecond
The number of sectors read per second from all devices on this server.IOSectorsReadPerSecond
The number of sectors written per second to all devices on this server.IOSectorsWrittenPerSecond
The number of KBytes read per second from all devices on this server.IOKBytesReadPerSecond
The number of KBytes written per second to all devices on this server.IOKBytesWrittenPerSecond
The average size in sectors of the requests that are issued to all deviceson this server.
IOSectorsReqSizeAvg
The average queue length of the requests that are issued to all deviceson this server.
IOReqQueueSizeAvg
The average time in milliseconds for I/O requests that are issued to alldevices to be served. This reading includes the time spent by therequests in queue and the time spent servicing the requests.
IOAwait
The average service time in milliseconds for I/O requests that are issuedto all devices on this server.
IOServiceTime
The percentage of CPU time during which I/O requests are issued tothe device (bandwidth utilization for the device) on this server.
IOCpuUtil
The maximum number of file descriptors that are allowed on thesystem.
Max FDs
The total time in jiffies that the system has been up and running.Total CPU Time
The number of processes on the system.Total Processes
The number of threads on the system.Total Threads
Cisco Unified Real-Time Monitoring Tool Administration Guide, Release 11.0(1) 189
Performance Counters and AlertsSystem

TCPThe TCP object provides information on the TCP statistics on your system.
The following table contains information about the TCP counters.
Table 36: TCP
Counter DescriptionCounters
This counter displays the number of times that the TCP connectionsmake a direct transition to the SYN-SENT state from the CLOSEDstate.
Active Opens
This counter displays the number of times that the TCP connectionsmake a direct transition to the CLOSED state from either theSYN-RCVD state or the SYN-RCVD state. The counter also displaysthe number of times TCP connections make a direct transition to theLISTEN state from the SYS-RCVD state.
Attempt Fails
This counter displays the number of TCP connections with a currentstate of ESTABLISHED or CLOSE- WAIT.
Curr Estab
This counter displays the number of times that the TCP connectionsmake a direct transition to the CLOSED state from the ESTABLISHEDstate or the CLOSE-WAIT state.
Estab Resets
This counter displays the total number of segments that are received,including those that are received in error. This count only includessegments that are received on currently established connections.
In Segs
This counter displays the total number of segments that are sent andthe total number of segments that are received.
InOut Segs
This counter displays the total number of segments that are sent. Thiscount only includes segments that are sent on currently establishedconnections, but excludes retransmitted octets.
Out Segs
This counter displays the number of times that TCP connections makea direct transition to the SYN-RCVD state from the LISTEN state.
Passive Opens
This counter displays the total number of segments that areretransmitted because the segment contains one or more previouslytransmitted octets.
RetransSegs
Cisco Unified Real-Time Monitoring Tool Administration Guide, Release 11.0(1)190
Performance Counters and AlertsTCP

ThreadThe Thread object provides a list of running threads on your system.
The following table contains information about the Thread counters.
Table 37: Thread
Counter DescriptionCounters
This counter displays the threads share of the elapsed CPU time sincethe last update. This counter expresses the share as a percentage of thetotal CPU time.
% CPU Time
This counter displays the threads leader process ID.PID
AXL Web ServiceThe AXL Web Service object provides information about the AXL Web Service running on your system.The following table contains information about the AXL Web Service counters.
Table 38: AXL Web Service
Counter DescriptionCounters
This counter represents the number of times Administrative XML Layer(AXL) throttling has been engaged since the last restart of the Cisco AXLWeb Service. Throttling occurs when the AXL service receives morechange requests than it is able to process.
ThrottleCount
This counter represents whether Administrative XML Layer (AXL)throttling is currently active (throttling is engaged). A value of 1 in thiscounter indicates that throttling is currently engaged, which means thatany application attempting to send a write request to Cisco UnifiedCommunications Manager through AXL will be denied due to AXLthrottling. Read requests will continue to be allowed and processed whileAXL throttling is engaged. A value of zero indicates that throttling is notoccurring at this time and all read and write requests will be processed.
ThrottleState
RamfsThe Ramfs object provides information about the ram file system. The following table contains informationon the Ramfs counters.
Cisco Unified Real-Time Monitoring Tool Administration Guide, Release 11.0(1) 191
Performance Counters and AlertsThread

Table 39: Ramfs
Counter DescriptionCounters
This counter represents the total number of files in the ram-based file system(ramfs).
FilesTotal
This counter represents the amount of free data blocks in the ram-based filesystem (ramfs). A block is a uniformly sized unit of data storage for a filesystem.The block size specifies the size that the file system will use to read and writedata. On the Cisco Unified Communications Manager system, the block size is4096 bytes.
SpaceFree
This counter represents the amount of used data blocks in the ram-basedfilesystem (ramfs). A block is a uniformly sized unit of data storage for a filesystem. The block size specifies the size that the file system will use to read andwrite data. On the Cisco Unified Communications Manager system, the blocksize is 4096 bytes.
SpaceUsed
Voice and Video Counters
Cisco Analog AccessThe Cisco Analog Access object provides information about registered Cisco Analog Access gateways. Thefollowing table contains information about Cisco Analog Access counters.
Table 40: Cisco Analog Access
Counter DescriptionCounters
This counter represents the total number of times that Cisco UnifiedCommunications Manager attempts a call through the analog accessgateway when all ports were busy.
OutboundBusyAttempts
This counter represents the number of ports that are currently in use(active). A port appears active when a call is in progress on that port.
PortsActive
This counter represents the number of ports that are currently out ofservice. Counter applies only to loop-start and ground-start trunks.
PortsOutOfService
Cisco Annunciator DeviceThe Cisco Annunciator Device object provides information about registered Cisco annunciator devices. Thefollowing table contains information about Cisco Annunciator counters.
Cisco Unified Real-Time Monitoring Tool Administration Guide, Release 11.0(1)192
Performance Counters and AlertsVoice and Video Counters

Table 41: Cisco Annunciator Device
Counter DescriptionCounters
This counter represents the total number of times that Cisco UnifiedCommunicationsManager attempted to allocate an annunciator resourcefrom an annunciator device and failed; for example, because allresources were already in use.
OutOfResources
This counter represents the total number of annunciator resources thatare currently active (in use) for an annunciator device.
ResourceActive
This counter represents the total number of resources that are not activeand are still available to be used at the current time for the annunciatordevice.
ResourceAvailable
This counter represents the total number of annunciator resources thatare configured for an annunciator device.
ResourceTotal
Cisco Call RestrictionThe Cisco Call Restriction object provides information about the number of failures that result due to logicalpartitioning policy restrictions. The following table contains information about Cisco Call Restriction counters.
Table 42: Cisco Call Restriction
Counter DescriptionCounters
This counter represents the number of attempts that failed to add aparticipant to an Ad Hoc Conference because the call path betweenthe geolocation of the devices already in conference and the devicebeing invited to the conference was restricted due to a logical partitionpolicy.
AdHocConferenceFailures
This counter represents the number of basic calls that have failedbecause of logical partition policy restrictions between the geolocationsof the called and calling parties. A basic call is any call that does notutilize supplementary services such as transfer, forward, and so on.
BasicCallFailures
This counter represents the number of attempts to forward an incomingcall which failed because of a logical partition policy restrictionbetween the geolocations of the two parties involved.
ForwardingFailures
This counter represents the total number of call attempts that havefailed because of a restriction of calls between geolocations of thecalling and called parties. This includes the number of failures forTransfer, Ad Hoc Conference, Meet-Me Conference, PickUp, CallPark, Shared Lines and Basic Calls.
LogicalPartitionFailuresTotal
Cisco Unified Real-Time Monitoring Tool Administration Guide, Release 11.0(1) 193
Performance Counters and AlertsCisco Call Restriction

Counter DescriptionCounters
This counter represents the number of attempts that failed to add aparticipant to a Meet-Me conference because the call path between thegeolocation of the devices already in conference and the deviceattempting to join the conference was restricted due to a logical partitionpolicy.
MeetMeConferenceFailures
This counter represents the number of calls that have failed becauseof a restriction between the geolocations of the called or connectedparties after the initial policy check.
MidCallFailures
This counter represents the number of attempts to perform a Call Parkoperation that failed because the device that was attempting to retrievethe call had a logical partition policy restriction with the geolocationof the parked party.
ParkRetrievalFailures
This counter represents the number of attempts to perform a PickUpoperation that failed because the device on which the pickup was beingattempted had a logical partition policy restriction with the geolocationof the calling device.
PickUpFailures
This counter represents the number of attempts to use a shared linewhich failed because the caller or callee has a logical partition policyrestriction with the geolocation of the devices having the shared lines.
SharedLineFailures
This counter represents the number of call transfer attempts that faileddue to restriction of calls between the geolocation of the transferredparty and the transferred destination.
TransferFailures
Cisco CallManagerThe Cisco CallManager object provides information about calls, applications, and devices that are registeredwith the Cisco Unified Communications Manager. The following table contains information aboutCisco CallManager counters.
Table 43: Cisco CallManager
Counter DescriptionCounters
This counter represents the total number of times that Cisco UnifiedCommunications Manager attempted to allocate an annunciatorresource from those that are registered to a Cisco UnifiedCommunications Manager when none were available.
AnnunciatorOutOfResources
This counter represents the total number of annunciator resources thatare currently in use on all annunciator devices that are registered witha Cisco Unified Communications Manager.
AnnunciatorResourceActive
Cisco Unified Real-Time Monitoring Tool Administration Guide, Release 11.0(1)194
Performance Counters and AlertsCisco CallManager

Counter DescriptionCounters
This counter represents the total number of annunciator resources thatare not active and are currently available.
AnnunciatorResourceAvailable
This counter represents the total number of annunciator resources thatare provided by all annunciator devices that are currently registeredwith Cisco Unified Communications Manager.
AnnunciatorResourceTotal
This counter represents the number of authenticated calls that arecurrently active (in use) on Cisco Unified Communications Manager.An authenticated call designates one in which all the endpoints thatare participating in the call are authenticated. An authenticated phoneuses the Transport Layer Security (TLS) authenticated Skinny protocolsignaling with Cisco Unified Communications Manager.
AuthenticatedCallsActive
This counter represents the number of authenticated calls thatconnected and subsequently disconnected through Cisco UnifiedCommunications Manager. An authenticated call designates one inwhich all the endpoints that are participating in the call areauthenticated. An authenticated phone uses the TLS authenticatedSkinny protocol signaling with Cisco Unified CommunicationsManager.
AuthenticatedCallsCompleted
This counter represents the number of partially registered, authenticatedSIP phones.
AuthenticatedPartiallyRegisteredPhone
This counter represents the total number of authenticated phones thatare registered to Cisco Unified Communications Manager. Anauthenticated phone uses the TLS authenticated Skinny protocolsignaling with Cisco Unified Communications Manager.
AuthenticatedRegisteredPhones
This counter represents the number of BRI voice channels that arecurrently in an active call on this Cisco Unified CommunicationsManager.
BRIChannelsActive
This counter represents the number of BRI spans that are currentlyavailable for use.
BRISpansInService
This counter represents the heartbeat of CiscoUnified CommunicationsManager. This incremental count indicates that Cisco UnifiedCommunications Manager is up and running. If the count does notincrement, that indicates that Cisco Unified CommunicationsManageris down.
CallManagerHeartBeat
This counter represents the number of voice or video streamingconnections that are currently in use (active); in other words, thenumber of calls that actually have a voice path that is connected onCisco Unified Communications Manager.
CallsActive
Cisco Unified Real-Time Monitoring Tool Administration Guide, Release 11.0(1) 195
Performance Counters and AlertsCisco CallManager

Counter DescriptionCounters
This counter represents the total number of attempted calls. Anattempted call occurs any time that a phone goes off hook and backon hook, regardless of whether any digits were dialed, or whether itconnected to a destination. The system considers some call attemptsduring feature operations (such as transfer and conference) to beattempted calls.
CallsAttempted
This counter represents the number of calls that were actuallyconnected (a voice path or video stream was established) throughCiscoUnified CommunicationsManager. This number increases whenthe call terminates.
CallsCompleted
This counter represents the number of voice or video calls that arecurrently in progress on Cisco Unified Communications Manager,including all active calls.
When a phone that is registered with Skinny Client Control Protocol(SCCP) goes off hook, the CallsInProgress progress counterincrements. until it goes back on hook.
For Cisco Unified IP Phones 7902, 7905, 7912, 7940, and 7960 thatregister with SIP, the CallsInProgress counter increments when thedial softkey is pressed.
For all other phones that are running SIP, the CallsInProgress counterincrements when the first digit is pressed.
When all voice or video calls that are in progress are connected, thenumber of CallsInProgress represents the number of CallsActive. Thecounter decreases by one when a phone goes back on hook.
CallsInProgress
This counter represents the total number of media termination point(MTP) resource requests that have been denied due to throttling (aresource from this MTP was not allocated because, as specified bythe Cisco CallManager service parameter, MTP and TranscoderResource Throttling Percentage, the MTP was being utilized beyondthe configured throttle percentage). This counter increments each timea request for anMTP on this Cisco Unified CommunicationsManagernode is requested and denied due to MTP throttling and reflects arunning total since the start of the Cisco CallManager Service.
CM_MediaTermPointsRequestsThrottled
This counter represents the total number of transcoder resource requeststhat have been denied due to throttling (a resource from this transcoderwas not allocated because, as specified by the Cisco CallManagerservice parameter MTP and Transcoder Resource ThrottlingPercentage, the transcoder was being utilized beyond the configuredthrottle percentage). This counter increments each time a request fora transcoder on this Cisco Unified Communications Manager node isrequested and denied due to transcoder throttling and reflects a runningtotal since the start of the Cisco CallManager Service
CM_TranscoderRequestsThrottled
Cisco Unified Real-Time Monitoring Tool Administration Guide, Release 11.0(1)196
Performance Counters and AlertsCisco CallManager

Counter DescriptionCounters
This counter represents the number of encrypted calls that are currentlyactive (in use) on this Cisco Unified Communications Manager. Anencrypted call represents one in which all the endpoints that areparticipating in the call are encrypted.
EncryptedCallsActive
This counter represents the number of encrypted calls that wereconnected and subsequently disconnected through this Cisco UnifiedCommunicationsManager. An encrypted call represents one in whichall the endpoints that are participating in the call are encrypted.
EncryptedCallsCompleted
This counter represents the number of partially registered, encryptedSIP phones.
EncryptedPartiallyRegisteredPhones
This counter represents the total number of encrypted phones that areregistered on this Cisco Unified Communications Manager.
EncryptedRegisteredPhones
This counter represents the number of FXO ports that are currently inuse (active) on a Cisco Unified Communications Manager.
FXOPortsActive
This counter represents the number of FXO ports that are currentlyavailable for use in the system.
FXOPortsInService
This counter represents the number of FXS ports that are currently inuse (active) on a Cisco Unified Communications Manager.
FXSPortsActive
This counter represents the number of FXS ports that are currentlyavailable for use in the system.
FXSPortsInService
This counter represents the number of hunt lists that are currently inservice on Cisco Unified Communications Manager.
HuntListsInService
This counter represents the total number of hardware conferenceresources that are provided by all hardware conference bridge devicesthat are currently registered with Cisco Unified CommunicationsManager.
HWConferenceActive
This counter represents the total number of conferences that used ahardware conference bridge (hardware-based conference devices suchas Cisco Catalyst 6000, Cisco Catalyst 4000, Cisco VG200, Ciscoseries 26xx and 36xx) that is allocated from Cisco UnifiedCommunicationsManager and that have completed, which means thatthe conference bridge has been allocated and released. A conferenceactivates when the first call connects to the bridge. The conferencecompletes when the last call disconnects from the bridge.
HWConferenceCompleted
This counter represents the total number of times that Cisco UnifiedCommunicationsManager attempted to allocate a hardware conferenceresource from those that are registered to a Cisco UnifiedCommunications Manager when none was available.
HWConferenceOutOfResources
Cisco Unified Real-Time Monitoring Tool Administration Guide, Release 11.0(1) 197
Performance Counters and AlertsCisco CallManager

Counter DescriptionCounters
This counter represents the total number of conference resources thatare in use on all hardware conference devices (such as Cisco Catalyst6000, Catalyst 4000, Cisco VG200, Cisco series 26xx and 36xx) thatare registered with Cisco Unified Communications Manager. Systemconsiders conference to be active when one or more calls are connectedto a bridge.
HWConferenceResourceActive
This counter represents the number of hardware conference resourcesthat are not in use and that are available to be allocated on all hardwareconference devices (such as Cisco Catalyst 6000, Cisco Catalyst 4000,Cisco VG200, Cisco series 26xx and 36xx) that are allocatedfromCisco Unified Communications Manager and that have beencompleted, which means that the conference bridge has been allocatedand released. A conference activates when the first call connects tothe bridge. The conference completes when the last call disconnectsfrom the bridge.
HWConferenceResourceAvailable
This counter represents the number of active conferences on allhardware conference devices that are registered with Cisco UnifiedCommunications Manager.
HWConferenceResourceTotal
This counter represents the current initialization state of Cisco UnifiedCommunications Manager. Cisco Unified Communications Managerincludes the following initialization state values:
1-Database, 2-Regions, 3-Locations, 4-QoS Policy, 5-Time Of Day,6-AARNeighborhoods, 7-Digit Analysis, 8-Route Plan, 9-Call Control,10-RSVP SessionManager, 11-Supplementary Services, 12-Directory,13-SDL Link, 14-Device, 100-Initialization Complete.
Not all states display when this counter is used. This display does notindicate that an error occurred; this display simply indicates that thestates initialized and completed within the refresh period of theperformance monitor.
InitializationState
This represents the total number of IVR resources that are currentlyin use on all IVR devices registered with Cisco UnifiedCommunications Manager .
IVRResourceActive
This represents the total number of times Cisco UnifiedCommunicationsManager attempted to allocate an IVR resource fromthose that are registered to Cisco Unified Communications Managerwhen none were available.
IVROutOfResources
This represents the total number of IVR resources provided by all IVRdevices that are currently registered with Cisco UnifiedCommunications Manager.
IVRResourceAvailable
Cisco Unified Real-Time Monitoring Tool Administration Guide, Release 11.0(1)198
Performance Counters and AlertsCisco CallManager

Counter DescriptionCounters
This represents the total number of IVR resources provided by all IVRdevices that are currently registered with Cisco UnifiedCommunications Manager.
IVRResourceTotal
This counter represents the total number of times that a call throughLocations failed due to the lack of bandwidth.
LocationOutOfResources
This counter represents the total number of active conferences on allCisco TelePresenceMCU conference bridge devices that are registeredwith Cisco Unified Communications Manager.
MCUConferencesActive
This counter represents the total number of conferences that used aCisco TelePresence MCU conference bridge allocated from CiscoUnified Communications Manager and completed, implying that theconference bridge was allocated and released. A conference is activatedwhen the first call is connected to the bridge. The conference iscompleted when the last call is disconnected from the bridge.
MCUConferencesCompleted
This counter represents the total number of times Cisco UnifiedCommunications Manager attempted to create HTTP connections toCisco TelePresence MCU conference bridge device, and failed dueto connection errors on the Cisco TelePresence MCU conferencebridge side.
MCUHttpConnectionErrors
This counter represents the total number of times Cisco UnifiedCommunications Manager received a non 200 OK HTTP Responsefrom Cisco TelePresence MCU conference bridge, for any HTTPquery sent.
MCUHttpNon200OKResponse
This counter represents the total number of times Cisco UnifiedCommunicationsManager attempted to allocate a conference resourcefrom Cisco TelePresence MCU conference bridge device and failed.For example, the attempt to allocate a conference resource fails, if allthe resources are already in use.
MCUOutOfResources
This counter represents the total number of multicast Music On Hold(MOH) resources that are currently in use (active) on all MOH serversthat are registered with a Cisco Unified Communications Manager.
MOHMulticastResourceActive
This counter represents the total number of active multicast MOHconnections that are not being used on all MOH servers that areregistered with a Cisco Unified Communications Manager.
MOHMulticastResourceAvailable
This counter represents the total number of times that the MediaResource Manager attempted to allocate an MOH resource when allavailable resources on all MOH servers that are registered with a CiscoUnified Communications Manager were already active.
MOHOutOfResources
Cisco Unified Real-Time Monitoring Tool Administration Guide, Release 11.0(1) 199
Performance Counters and AlertsCisco CallManager
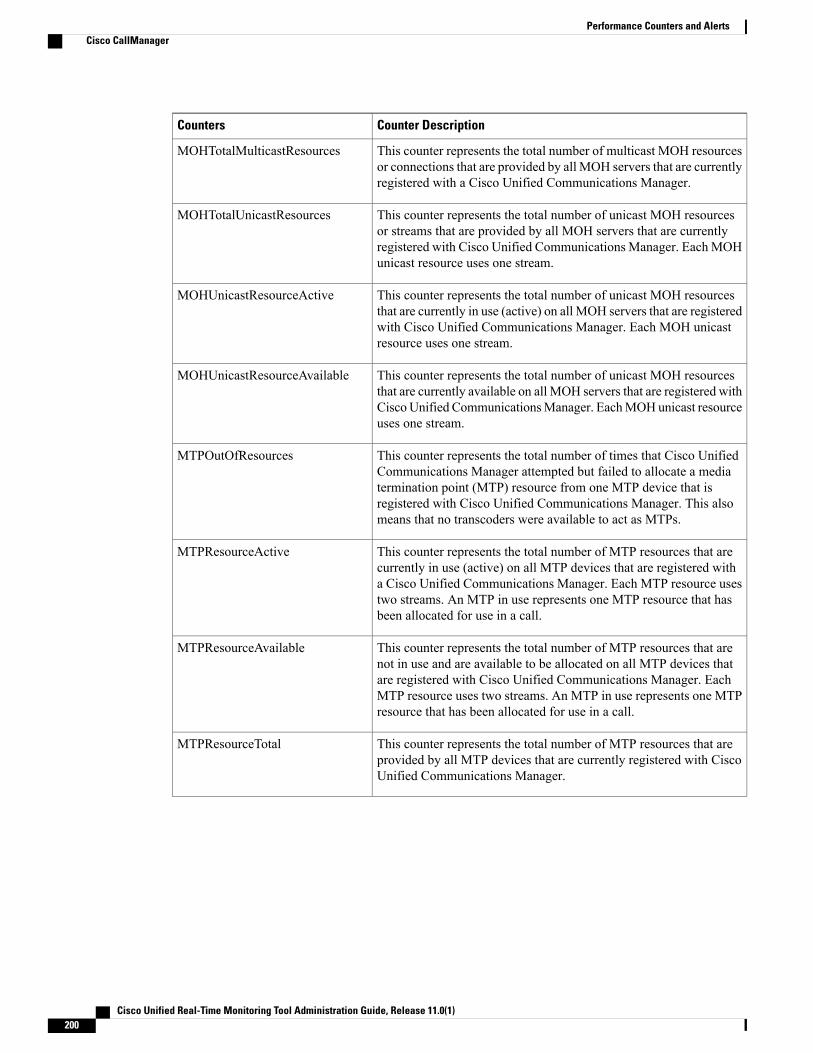
Counter DescriptionCounters
This counter represents the total number of multicast MOH resourcesor connections that are provided by all MOH servers that are currentlyregistered with a Cisco Unified Communications Manager.
MOHTotalMulticastResources
This counter represents the total number of unicast MOH resourcesor streams that are provided by all MOH servers that are currentlyregistered with Cisco Unified Communications Manager. Each MOHunicast resource uses one stream.
MOHTotalUnicastResources
This counter represents the total number of unicast MOH resourcesthat are currently in use (active) on all MOH servers that are registeredwith Cisco Unified Communications Manager. Each MOH unicastresource uses one stream.
MOHUnicastResourceActive
This counter represents the total number of unicast MOH resourcesthat are currently available on all MOH servers that are registered withCisco Unified CommunicationsManager. EachMOHunicast resourceuses one stream.
MOHUnicastResourceAvailable
This counter represents the total number of times that Cisco UnifiedCommunications Manager attempted but failed to allocate a mediatermination point (MTP) resource from one MTP device that isregistered with Cisco Unified Communications Manager. This alsomeans that no transcoders were available to act as MTPs.
MTPOutOfResources
This counter represents the total number of MTP resources that arecurrently in use (active) on all MTP devices that are registered witha Cisco Unified Communications Manager. Each MTP resource usestwo streams. An MTP in use represents one MTP resource that hasbeen allocated for use in a call.
MTPResourceActive
This counter represents the total number of MTP resources that arenot in use and are available to be allocated on all MTP devices thatare registered with Cisco Unified Communications Manager. EachMTP resource uses two streams. An MTP in use represents one MTPresource that has been allocated for use in a call.
MTPResourceAvailable
This counter represents the total number of MTP resources that areprovided by all MTP devices that are currently registered with CiscoUnified Communications Manager.
MTPResourceTotal
Cisco Unified Real-Time Monitoring Tool Administration Guide, Release 11.0(1)200
Performance Counters and AlertsCisco CallManager

Counter DescriptionCounters
This counter represents the total number of MTP resource requeststhat have been denied due to throttling (a resource from this MTP wasnot allocated because, as specified by the Cisco CallManager serviceparameter MTP and Transcoder Resource Throttling Percentage, theMTP was being utilized beyond the configured throttle percentage).This counter increments each time a resource is requested from thisMTP and is denied due to throttling. This counter reflects a runningtotal since the MTP device registered with the Cisco CallManagerService.
MTP_RequestsThrottled
This counter represents the number of partially registered phones thatare running SIP.
PartiallyRegisteredPhone
This counter represents the number of PRI voice channels that are inan active call on a Cisco Unified Communications Manager.
PRIChannelsActive
This counter represents the number of PRI spans that are currentlyavailable for use.
PRISpansInService
This counter represents the number of registered Cisco analog accessgateways that are registered with system. The count does not includethe number of Cisco analog access ports.
RegisteredAnalogAccess
This counter represents the number of Cisco hardware IP phones (forexample, Cisco Unified IP Phones 7960, 7940, 7910, and so on.) thatare currently registered in the system.
RegisteredHardwarePhones
This counter represents the number of MGCP gateways that arecurrently registered in the system.
RegisteredMGCPGateway
This counter represents the number of station devices other than Ciscohardware IP phones that are currently registered in the system (forexample, Cisco IP SoftPhone, CTI port, CTI route point, Ciscovoicemail port).
RegisteredOtherStationDevices
This counter represents the number of authentication challenges forincoming SIP requests that the Cisco Unified CommunicationsManager server issued to phones that are running SIP. Anauthentication challenge occurs when a phone that is running SIP withDigest Authentication enabled sends a SIP line request to CiscoUnifiedCommunications Manager.
SIPLineServerAuthorizationChallenges
This counter represents the number of authentication challenge failuresfor incoming SIP requests from SIP phones to the Cisco UnifiedCommunications Manager server. An authentication failure occurswhen a SIP phone with Digest Authentication enabled sends a SIPline request with bad credentials to Cisco Unified CommunicationsManager.
SIPLineServerAuthorizationFailures
Cisco Unified Real-Time Monitoring Tool Administration Guide, Release 11.0(1) 201
Performance Counters and AlertsCisco CallManager

Counter DescriptionCounters
This counter represents the number of application-level authorizationchecks for incoming SIP requests that Cisco Unified CommunicationsManager has issued to SIP trunks. An application-level authorizationcheck occurs when CiscoUnified CommunicationsManager comparesan incoming SIP request to the application-level settings on the SIPTrunk Security Profile Configuration window in Cisco UnifiedCommunications Manager Administration.
SIPTrunkAuthorization
This counter represents the number of application-level authorizationfailures for incoming SIP requests that have occurred on Cisco UnifiedCommunications Manager SIP trunks. An application-levelauthorization failure occurs when Cisco Unified CommunicationsManager compares an incoming SIP request to the application-levelauthorization settings on the SIP Trunk Security Profile Configurationwindow in Cisco Unified Communications Manager Administrationand finds that authorization for one or more of the SIP features on thatwindow is not allowed.
SIPTrunkAuthorizationFailures
This counter represents the number of authentication challenges forincoming SIP requests that Cisco Unified Communications Managerissued to SIP trunks. An authentication challenge occurs when a SIPtrunk with Digest Authentication enabled sends a SIP request to CiscoUnified Communications Manager.
SIPTrunkServerAuthenticationChallenges
This counter represents the number of authentication challenge failuresthat occurred for incoming SIP requests from SIP trunks to CiscoUnified Communications Manager. An authentication failure occurswhen a SIP trunk with Digest Authentication enabled sends a SIPrequest with bad credentials to Cisco Unified CommunicationsManager.
SIPTrunkServerAuthenticationFailures
This counter represents the number of active conferences on allsoftware conference devices that are registered with Cisco UnifiedCommunications Manager.
SWConferenceActive
This counter represents the total number of conferences that used asoftware conference bridge that was allocated from a Cisco UnifiedCommunicationsManager and that have been completed, whichmeansthat the conference bridge has been allocated and released. Aconference activates when the first call connects to the bridge. Theconference completes when the last call disconnects from the bridge.
SWConferenceCompleted
This counter represents the total number of times that Cisco UnifiedCommunicationsManager attempted to allocate a software conferenceresource from those that are registered to Cisco UnifiedCommunicationsManager when nonewere available. Counter includesfailed attempts to add a new participant to an existing conference.
SWConferenceOutOfResources
Cisco Unified Real-Time Monitoring Tool Administration Guide, Release 11.0(1)202
Performance Counters and AlertsCisco CallManager

Counter DescriptionCounters
This counter represents the total number of conference resources thatare in use on all software conference devices that are registered withCisco Unified Communications Manager. The system considers aconference to be active when one or more calls connect to a bridge.One resource equals one stream.
SWConferenceResourceActive
This counter represents the number of new software-based conferencesthat can be started at the same time, for Cisco Unified CommunicationsManager. You must have a minimum of three streams available foreach new conference. One resource equals one stream.
SWConferenceResourceAvailable
This counter represents the total number of software conferenceresources that are provided by all software conference bridge devicesthat are currently registered with Cisco Unified CommunicationsManager.
SWConferenceResourceTotal
This counter represents the total number of server-originated calls andattempted calls to the Unity message waiting indicator (MWI).
SystemCallsAttempted
This counter represents the number of T1 CAS voice channels thatare in an active call on a Cisco Unified Communications Manager.
T1ChannelsActive
This counter represents the number of T1 CAS spans that are currentlyavailable for use.
T1SpansInService
This counter represents the number of SIP trunks that are configuredand connected through Transport Layer Security (TLS).
TLSConnectedSIPTrunks
This counter represents the number of WSM Connectors that isconfigured and connected toMotorolaWSM through Transport LayerSecurity (TLS).
TLSConnectedWSM
This counter represents the total number of times that Cisco UnifiedCommunicationsManager attempted to allocate a transcoder resourcefrom a transcoder device that is registered to a Cisco UnifiedCommunications Manager when none was available.
TranscoderOutOfResources
This counter represents the total number of transcoders that are in useon all transcoder devices that are registered with Cisco UnifiedCommunications Manager. A transcoder in use represents onetranscoder resource that has been allocated for use in a call. Eachtranscoder resource uses two streams.
TranscoderResourceActive
This counter represents the total number of transcoders that are not inuse and that are available to be allocated on all transcoder devices thatare registered with Cisco Unified Communications Manager. Eachtranscoder resource uses two streams.
TranscoderResourceAvailable
Cisco Unified Real-Time Monitoring Tool Administration Guide, Release 11.0(1) 203
Performance Counters and AlertsCisco CallManager

Counter DescriptionCounters
This counter represents the total number of transcoder resources thatare provided by all transcoder devices that are currently registeredwith Cisco Unified Communications Manager.
TranscoderResourceTotal
This counter represents the total number of active video conferenceson all video conference bridge devices that are registered with CiscoUnified Communications Manager.
VCBConferenceActive
This counter represents the total number of new video conferences onall video conference bridge devices that are registered with CiscoUnified Communications Manager.
VCBConferenceAvailable
This counter represents the total number of video conferences thatused a video conference bridge that are allocated from Cisco UnifiedCommunicationsManager and that have been completed, whichmeansthat the conference bridge has been allocated and released. Aconference activates when the first call connects to the bridge. Theconference completes when the last call disconnects from the bridge.
VCBConferenceCompleted
This counter represents the total number of video conferences that aresupported on all video conference bridge devices that are registeredwith Cisco Unified Communications Manager.
VCBConferenceTotal
This counter represents the total number of times that Cisco UnifiedCommunications Manager attempted to allocate a video conferenceresource from those that are registered to Cisco UnifiedCommunications Manager when none was available.
VCBOutOfConferences
This counter represents the total number of failed new video conferencerequests. A conference request can fail because, for example, theconfigured number of conferences is already in use.
VCBOutOfResources
This counter represents the total number of video conference resourcesthat are currently in use on all video conference devices that areregistered with Cisco Unified Communications Manager.
VCBResourceActive
This counter represents the total number of video conference resourcesthat are not active and are currently available.
VCBResourceAvailable
This counter represents the total number of video conference resourcesthat are provided by all video conference bridge devices that arecurrently registered with Cisco Unified Communications Manager.
VCBResourceTotal
This counter represents the number of active video calls with activevideo streaming connections on all video conference bridge devicesthat are registered with Cisco Unified Communications Manager.
VideoCallsActive
This counter represents the number of video calls that were actuallyconnected with video streams and then released.
VideoCallsCompleted
Cisco Unified Real-Time Monitoring Tool Administration Guide, Release 11.0(1)204
Performance Counters and AlertsCisco CallManager
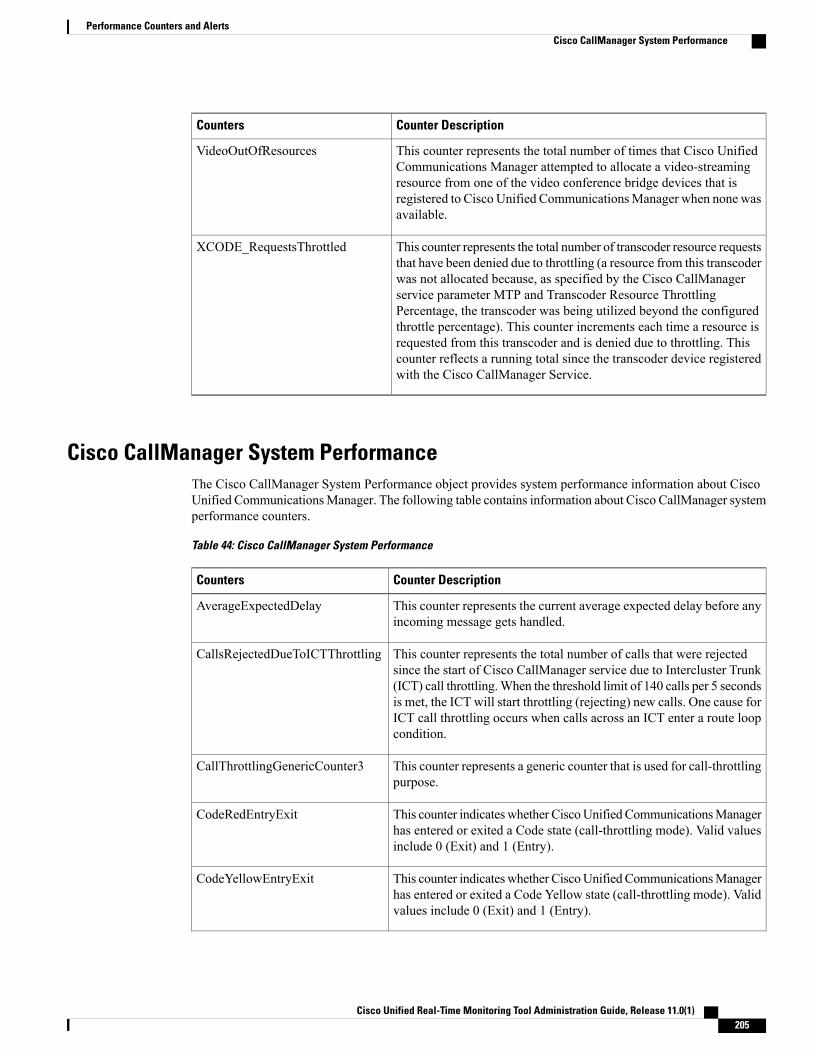
Counter DescriptionCounters
This counter represents the total number of times that Cisco UnifiedCommunications Manager attempted to allocate a video-streamingresource from one of the video conference bridge devices that isregistered to Cisco Unified CommunicationsManager when none wasavailable.
VideoOutOfResources
This counter represents the total number of transcoder resource requeststhat have been denied due to throttling (a resource from this transcoderwas not allocated because, as specified by the Cisco CallManagerservice parameter MTP and Transcoder Resource ThrottlingPercentage, the transcoder was being utilized beyond the configuredthrottle percentage). This counter increments each time a resource isrequested from this transcoder and is denied due to throttling. Thiscounter reflects a running total since the transcoder device registeredwith the Cisco CallManager Service.
XCODE_RequestsThrottled
Cisco CallManager System PerformanceThe Cisco CallManager System Performance object provides system performance information about CiscoUnified CommunicationsManager. The following table contains information about Cisco CallManager systemperformance counters.
Table 44: Cisco CallManager System Performance
Counter DescriptionCounters
This counter represents the current average expected delay before anyincoming message gets handled.
AverageExpectedDelay
This counter represents the total number of calls that were rejectedsince the start of Cisco CallManager service due to Intercluster Trunk(ICT) call throttling.When the threshold limit of 140 calls per 5 secondsis met, the ICT will start throttling (rejecting) new calls. One cause forICT call throttling occurs when calls across an ICT enter a route loopcondition.
CallsRejectedDueToICTThrottling
This counter represents a generic counter that is used for call-throttlingpurpose.
CallThrottlingGenericCounter3
This counter indicateswhether CiscoUnified CommunicationsManagerhas entered or exited a Code state (call-throttling mode). Valid valuesinclude 0 (Exit) and 1 (Entry).
CodeRedEntryExit
This counter indicateswhether CiscoUnified CommunicationsManagerhas entered or exited a Code Yellow state (call-throttling mode). Validvalues include 0 (Exit) and 1 (Entry).
CodeYellowEntryExit
Cisco Unified Real-Time Monitoring Tool Administration Guide, Release 11.0(1) 205
Performance Counters and AlertsCisco CallManager System Performance

Counter DescriptionCounters
Do not use this counter unless directed by a Cisco Engineering Specialbuild. Cisco uses information in this counter for diagnostic purposes.
EngineeringCounter1
Do not use this counter unless directed by a Cisco Engineering Specialbuild. Cisco uses information in this counter for diagnostic purposes.
EngineeringCounter2
Do not use this counter unless directed by a Cisco Engineering Specialbuild. Cisco uses information in this counter for diagnostic purposes.
EngineeringCounter3
Do not use this counter unless directed by a Cisco Engineering Specialbuild. Cisco uses information in this counter for diagnostic purposes.
EngineeringCounter4
Do not use this counter unless directed by a Cisco Engineering Specialbuild. Cisco uses information in this counter for diagnostic purposes.
EngineeringCounter5
Do not use this counter unless directed by a Cisco Engineering Specialbuild. Cisco uses information in this counter for diagnostic purposes.
EngineeringCounter6
Do not use this counter unless directed by a Cisco Engineering Specialbuild. Cisco uses information in this counter for diagnostic purposes.
EngineeringCounter7
Do not use this counter unless directed by a Cisco Engineering Specialbuild. Cisco uses information in this counter for diagnostic purposes.
EngineeringCounter8
This counter indicates the number of high-priority signals in the CiscoUnified CommunicationsManager queue. High-priority signals includetimeout events, internal Cisco Unified Communications Managerkeepalives, certain gatekeeper events, and internal process creation,among other events. A large number of high-priority events will causedegraded performance on Cisco Unified Communications Managerand result in slow call connection or loss of dial tone. Use this counterin conjunction with the QueueSignalsProcessed 1-High counter todetermine the processing delay on Cisco Unified CommunicationsManager.
QueueSignalsPresent 1-High
This counter indicates the number of normal-priority signals in theCiscoUnifiedCommunicationsManager queue. Normal-priority signalsinclude call-processing functions, key presses, on-hook and off-hooknotifications, among other events. A large number of normal-priorityevents will cause degraded performance on Cisco UnifiedCommunications Manager, sometimes resulting in delayed dial tone,slow call connection, or loss of dial tone. Use this counter inconjunction with the QueueSignalsProcessed 2-Normal counter todetermine the call-processing delay on Cisco Unified CommunicationsManager. Remember that high-priority signals must complete beforenormal-priority signals begin to process, so check the high-prioritycounters as well to get an accurate picture of the potential delay.
QueueSignalsPresent 2-Normal
Cisco Unified Real-Time Monitoring Tool Administration Guide, Release 11.0(1)206
Performance Counters and AlertsCisco CallManager System Performance

Counter DescriptionCounters
This counter indicates the number of low-priority signals in the CiscoUnified CommunicationsManager queue. Low-priority signals includestation device registration (except the initial station registration requestmessage), among other events. A large number of signals in this queuecould result in delayed device registration, among other events.
QueueSignalsPresent 3-Low
This counter indicates the number of lowest priority signals in theCiscoUnified CommunicationsManager queue. Lowest priority signalsinclude the initial station registration request message during deviceregistration, among other events. A large number of signals in thisqueue could result in delayed device registration, among other events.
QueueSignalsPresent 4-Lowest
This counter indicates the number of high-priority signals that CiscoUnified CommunicationsManager processes for each 1-second interval.Use this counter in conjunction with the QueueSignalsPresent 1-Highcounter to determine the processing delay on this queue.
QueueSignalsProcessed 1-High
This counter indicates the number of normal-priority signals that CiscoUnified CommunicationsManager processes for each 1-second interval.Use this counter in conjunctionwith the QueueSignalsPresent 2-Normalcounter to determine the processing delay on this queue. Rememberthat high-priority signals get processed before normal-priority signals.
QueueSignalsProcessed 2-Normal
This counter indicates the number of low-priority signals that CiscoUnified CommunicationsManager processes for each 1-second interval.Use this counter in conjunction with the QueueSignalsPresent 3-Lowcounter to determine the processing delay on this queue. The numberof signals processed gives an indication of howmuch device registrationactivity is being processed in this time interval.
QueueSignalsProcessed 3-Low
This counter indicates the number of lowest priority signals that CiscoUnified CommunicationsManager processes for each 1-second interval.Use this counter in conjunctionwith the QueueSignalsPresent 4-Lowestcounter to determine the processing delay on this queue. The numberof signals that are processed gives an indication of how many devicesbegan the Cisco Unified CommunicationsManager registration processin this time interval.
QueueSignalsProcessed 4-Lowest
This counter provides a sum total of all queue signals that Cisco UnifiedCommunications Manager processes for each 1-second period for allqueue levels: high, normal, low, and lowest.
QueueSignalsProcessed Total
This counter represents the total number of Skinny devices that arebeing throttled. A Skinny device gets throttled (asked to shut downand reregister) when the total number of events that the Skinny devicegenerated exceeds the configured maximum threshold value (defaultvalue specifies 2000 events) within a 5-second interval.
SkinnyDevicesThrottled
Cisco Unified Real-Time Monitoring Tool Administration Guide, Release 11.0(1) 207
Performance Counters and AlertsCisco CallManager System Performance

Counter DescriptionCounters
This counter indicates howmany samples, out of the configured samplesize, have non-zero averageExpectedDelay values. This counter resetswhen any sample has an averageExpectedDelay value of zero. Thisprocess repeats for each batch of samples. A batch represents theconfigured sample size.
ThrottlingSampleActivity
This counter indicates the number of times that Cisco UnifiedCommunicationsManager call processing enters the code yellow state.This counter remains cumulative from the start of the Cisco UnifiedCommunications Manager process.
TotalCodeYellowEntry
Cisco CTIManagerThe Cisco CTI Manager object provides information about Cisco CTI Manager. The following table containsinformation about Cisco CTIManager counters.
Table 45: Cisco CTI Manager
Counter DescriptionCounters
This counter represents the total number of active Cisco UnifiedCommunications Manager links. CTI Manager maintains links to allactive servers in a cluster, if applicable.
CcmLinkActive
This counter represents the total number of CTI clients that are currentlyconnected to the CTIManager. This counter increases by one whennew connection is established and decreases by one when a connectionis released. The CTIManager service parameter MaxCTIConnectionsdetermines the maximum number of active connections.
CTIConnectionActive
This counter represents the total number of devices that are configuredin Cisco Unified Communications Manager that CTI applicationscontrol and/or monitor. Devices include hardware IP phones, CTI ports,CTI route points, and so on.
DevicesOpen
This counter represents the total number of lines that are configuredin Cisco Unified CommunicationsManager that control and/or monitorCTI applications.
LinesOpen
This counter represents the version number of the Quick BufferEncoding (QBE) interface that the CTIManager uses.
QbeVersion
Cisco Unified Real-Time Monitoring Tool Administration Guide, Release 11.0(1)208
Performance Counters and AlertsCisco CTIManager
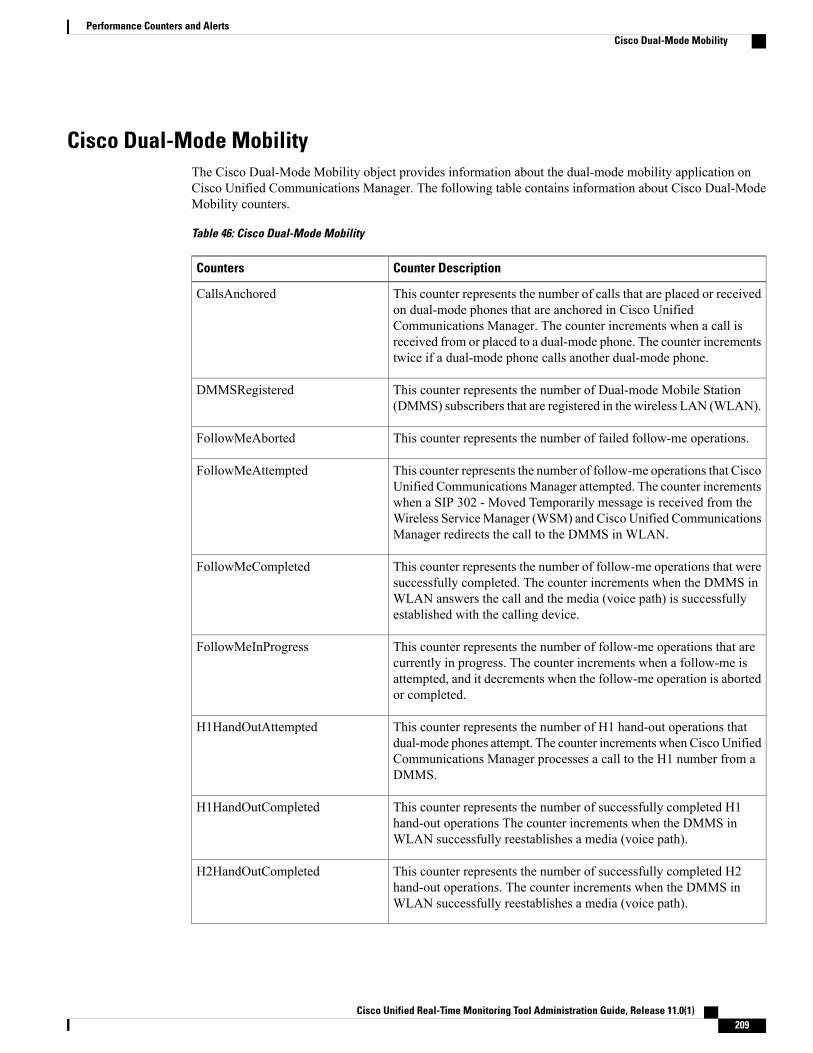
Cisco Dual-Mode MobilityThe Cisco Dual-Mode Mobility object provides information about the dual-mode mobility application onCisco Unified Communications Manager. The following table contains information about Cisco Dual-ModeMobility counters.
Table 46: Cisco Dual-Mode Mobility
Counter DescriptionCounters
This counter represents the number of calls that are placed or receivedon dual-mode phones that are anchored in Cisco UnifiedCommunications Manager. The counter increments when a call isreceived from or placed to a dual-mode phone. The counter incrementstwice if a dual-mode phone calls another dual-mode phone.
CallsAnchored
This counter represents the number of Dual-mode Mobile Station(DMMS) subscribers that are registered in the wireless LAN (WLAN).
DMMSRegistered
This counter represents the number of failed follow-me operations.FollowMeAborted
This counter represents the number of follow-me operations that CiscoUnified CommunicationsManager attempted. The counter incrementswhen a SIP 302 - Moved Temporarily message is received from theWireless ServiceManager (WSM) and Cisco Unified CommunicationsManager redirects the call to the DMMS in WLAN.
FollowMeAttempted
This counter represents the number of follow-me operations that weresuccessfully completed. The counter increments when the DMMS inWLAN answers the call and the media (voice path) is successfullyestablished with the calling device.
FollowMeCompleted
This counter represents the number of follow-me operations that arecurrently in progress. The counter increments when a follow-me isattempted, and it decrements when the follow-me operation is abortedor completed.
FollowMeInProgress
This counter represents the number of H1 hand-out operations thatdual-mode phones attempt. The counter increments when CiscoUnifiedCommunications Manager processes a call to the H1 number from aDMMS.
H1HandOutAttempted
This counter represents the number of successfully completed H1hand-out operations The counter increments when the DMMS inWLAN successfully reestablishes a media (voice path).
H1HandOutCompleted
This counter represents the number of successfully completed H2hand-out operations. The counter increments when the DMMS inWLAN successfully reestablishes a media (voice path).
H2HandOutCompleted
Cisco Unified Real-Time Monitoring Tool Administration Guide, Release 11.0(1) 209
Performance Counters and AlertsCisco Dual-Mode Mobility

Counter DescriptionCounters
This counter represents the number of H2 hand-out operations thatdual-mode phones attempt. The counter increments when CiscoUnifiedCommunications Manager receives a call to the H2 number from aDMMS.
H2HandOutsAttempted
This counter represents the number of hand-in operations that failed.HandInAborted
This counter represents the number of hand-in operations thatdual-mode phones attempt.
HandInAttempted
This counter represents the number of successfully completed hand-inoperations. The counter increments when the DMMS in WLANsuccessfully reestablishes a media (voice path).
HandInCompleted
This counter represents the number of hand-in operations that arecurrently in progress. The counter increments when a hand-in isattempted, and the counter decrements when the hand-in is aborted orcompleted.
HandInInProgress
This counter represents the number of hand-out operations that failed.HandOutAborted
This counter represents the number of H1 and H2 hand-out operationsthat are currently in progress. The counter increments when a H1 orH2 hand-out is attempted, and it decrements when the hand-out isaborted or completed.
HandOutInProgress
Cisco Extension MobilityThe Cisco Extension Mobility object provides information about the extension mobility application. Thefollowing table contains information about Cisco Extension Mobility counters.
Table 47: Cisco Extension Mobility Application
Counter DescriptionCounters
This counter represents the total number of HTTP requests that theextension mobility application handled since the last restart of theCisco CallManager service. A typical login would constitute twoHTTPrequests: one to query the initial login state of the device and anotherto log in the user on a device. Similarly, a typical logout also resultsin two HTTP requests.
RequestsHandled
Cisco Unified Real-Time Monitoring Tool Administration Guide, Release 11.0(1)210
Performance Counters and AlertsCisco Extension Mobility

Counter DescriptionCounters
This counter represents the number of HTTP requests that the extensionmobility application currently is handling. A typical login wouldconstitute two HTTP requests: one to query the initial login state ofthe device and another to log in the user on a device. Similarly, a typicallogout also results in two HTTP requests.
RequestsInProgress
This counter represents the total number of Login/Logout Requeststhat failed due to throttling.
RequestsThrottled
This counter represents the total number of successful login requeststhat were completed through EM Service.
LoginsSuccessful
This counter represents the total number of successful logout requeststhat were completed through EM Service
LogoutsSuccessful
This counter represents the total number of Login and Logout requeststhat were attempted through this EM Service. This number includesboth successful and unsuccessful attempts.
TotalLogin/LogoutRequestsAttempted
Cisco GatekeeperThe Cisco Gatekeeper object provides information about registered Cisco gatekeeper devices. The followingtable contains information about Cisco gatekeeper device counters.
Table 48: Cisco Gatekeeper
Counter DescriptionCounters
This counter represents the total number of RAS Admission Confirmmessages that are received from the configured gatekeeper and itsalternate gatekeepers.
ACFsReceived
This counter represents the total number of RAS Admission Requestmessages that are attempted by using the configured gatekeeper andits alternate gatekeepers.
ARQsAttempted
This counter represents the number of retries due to loss or delay ofall RAS acknowledgement messages on the configured gatekeeper andits alternate gatekeepers.
RasRetries
This counter represents the total number of video-stream requests tothe configured gatekeeper or its alternate gatekeepers that failed, mostlikely due to lack of bandwidth.
VideoOutOfResources
Cisco Unified Real-Time Monitoring Tool Administration Guide, Release 11.0(1) 211
Performance Counters and AlertsCisco Gatekeeper

Cisco H.323The Cisco H.323 object provides information about registered Cisco H.323 devices. The following tablecontains information about Cisco H.323 device counters.
Table 49: Cisco H.323
Counter DescriptionCounters
This counter represents the number of streaming connections that arecurrently active (in use) on the configured H.323 device; in other words,the number of calls that actually have a voice path that is connected.
CallsActive
This counter represents the total number of calls that have beenattempted on a device, including both successful and unsuccessful callattempts.
CallsAttempted
This counter represents the total number of successful calls that weremade from a device.
CallsCompleted
This counter represents the number of calls that are currently in progresson a device.
CallsInProgress
This counter represents the total number of calls rejected due toIntercluster Trunk (ICT) call throttling since the start of theCisco CallManager service.When the system reaches a threshold limitof 140 calls per 5 seconds, ICT will start throttling (rejecting) newcalls. One cause for ICT call throttling occurs when calls across anICT enter a route loop condition.
CallsRejectedDueToICTCallThrottling
This counter represents the number of video calls with video streamingconnections that are currently active (in use) on all H.323 trunks thatare registered with a Cisco Unified CommunicationsManager; in otherwords, the number of calls that actually have video-streamingconnections on a Cisco Unified Communications Manager.
VideoCallsActive
This counter represents the number of video calls that were actuallyconnected with video streams for all H.323 trunks that were registeredwith a CiscoUnified CommunicationsManager. This number increaseswhen the call terminates.
VideoCallsCompleted
Cisco Hunt ListsThe Cisco Hunt Lists object provides information about the hunt lists that are defined in Cisco UnifiedCommunications Manager Administration. The following table contains information about Cisco hunt listcounters.
Cisco Unified Real-Time Monitoring Tool Administration Guide, Release 11.0(1)212
Performance Counters and AlertsCisco H.323

Table 50: Cisco Hunt Lists
Counter DescriptionCounters
This counter represents the number of abandoned calls that occurredthrough a hunt list. An abandoned call represents one in which a callerhangs up before the call is answered.
CallsAbandoned
This counter represents the number of calls that are currently active(in use) that occurred through a hunt list. An active call represents onethat gets distributed and answered, and to which a voice path connects.
CallsActive
This counter represents the number of times that calls through a huntlist were attempted when all members of the line and/or route groupswere busy.
CallsBusyAttempts
This counter represents the number of calls that are currently in progressthrough a hunt list. A call in progress represents one that the calldistributor is attempting to extend to a member of a line or route groupand that has not yet been answered. Examples of a hunt list memberinclude a line, a station device, a trunk device, or a port/channel of atrunk device.
CallsInProgress
This counter represents the total number of calls through a hunt listthat rang but that called parties did not answer.
CallsRingNoAnswer
This counter specifies whether the particular hunt list is currently inservice. A value of 0 indicates that the hunt list is out of service; avalue of 1 indicates that the hunt list is in service. Reasons that a huntlist could be out of service include the hunt list is not running on aprimary Cisco Unified Communications Manager based on its CiscoUnified Communications Manager Group or the hunt list has beendisabled in Cisco Unified Communications Manager Administration.
HuntListInService
This counter represents the total number of available or idle membersof line and route groups that belong to an in-service hunt list. Anavailable member currently handles a call and will accept a new call.An idle member does not handle any call and will accept a new call.A hunt list member can comprise a route group, line group, or acombination. A member of a line group represents a directory numberof a line on an IP phone or a voice-mail port. A member of a routegroup represents a station gateway, a trunk gateway, or port/channelof a trunk gateway.
MembersAvailable
Cisco HW Conference Bridge DeviceThe Cisco HW Conference Bridge Device object provides information about registered Cisco hardwareconference bridge devices. The following table contains information about Cisco hardware conference bridgedevice counters.
Cisco Unified Real-Time Monitoring Tool Administration Guide, Release 11.0(1) 213
Performance Counters and AlertsCisco HW Conference Bridge Device

Table 51: Cisco HW Conference Bridge Device
Counter DescriptionCounters
This counter represents the number of conferences that are currentlyactive (in use) on a HW conference bridge device. One resourcerepresents one stream.
HWConferenceActive
This counter represents the total number of conferences that have beenallocated and released on a HW conference device. A conference startswhen the first call connects to the bridge. The conference completeswhen the last call disconnects from the bridge.
HWConferenceCompleted
This counter represents the total number of times that an attempt wasmade to allocate a conference resource from a HW conference deviceand failed, for example, because all resources were already in use.
OutOfResources
This counter represents the number of resources that are currently inuse (active) for this HW conference device. One resource representsone stream.
ResourceActive
This counter represents the total number of resources that are not activeand are still available to be used now for a HW conference device. Oneresource represents one stream.
ResourceAvailable
This counter represents the total number of resources for a HWconference bridge device. This counter equals the sum of the countersResourceAvailable and ResourceActive. One resource represents onestream.
ResourceTotal
Cisco IP Manager AssistantThe Cisco IP Manager Assistant (IPMA) Service object provides information about the Cisco UnifiedCommunications Manager Assistant application. The following table contains information on Cisco IPMAcounters.
Table 52: Cisco IP Manager Assistant Service
Counter DescriptionCounters
This counter represents the number of assistant consoles that arecurrently active. An active assistant console exists when an assistantis logged in from the assistant console desktop application.
AssistantsActive
This counter represents the number of phone lines that the CiscoUnifiedCommunications Manager Assistant application opened. An openphone line exists when the application assumes line control from CTI.
LinesOpen
Cisco Unified Real-Time Monitoring Tool Administration Guide, Release 11.0(1)214
Performance Counters and AlertsCisco IP Manager Assistant

Counter DescriptionCounters
This counter represents the current number of managers that the CiscoIPMA is servicing.
ManagersActive
This counter represents the total number of managers assistants thatare currently using the Cisco Unified Communications ManagerAssistant application. Each manager and each assistant constitute anactive session; so, for one manager/assistant pair, this counter wouldreflect two sessions.
SessionsCurrent
Cisco LBM serviceThe Cisco LBM service object provides information about LBM service that is defined in Cisco UnifiedCommunications Manager. The following table contains information on Cisco LBM service counters.
Table 53: Cisco LBM service
Counter DescriptionCounters
This counter represents the state of Location BandwidthManager.Spoke state is represented by 0 and hub state with a value of 1.
Is Hub[1] or Spoke[0]
This counter represents the number of local hub nodes connected.LocalHubNodesConnected
This counter represents the number of local spoke nodesconnected.
LocalSpokesNodesConnected
This counter represents the number of insecure remote hub nodesconnected.
RemoteHubNodesConnectedInsecure
This counter represents the number of secure remote hub nodesconnected.
RemoteHubNodesConnectedSecure
Cisco LinesThe Cisco Lines object represents the number of Cisco lines (directory numbers) that can dial and connect toa device. Lines represent all directory numbers that terminate on an endpoint. The directory number that isassigned to it identifies the line. The Cisco Lines object does not include directory numbers that includewildcards such as a pattern for a Digital or Analog Access gateway.
The Active counter represents the state of the line, either active or not active. A zero indicates that the line isnot in use.When the number is greater than zero, this indicates that the line is active, and the number representsthe number of calls that are currently in progress on that line. If more than one call is active, this indicatesthat the call is on hold either because of being placed on hold specifically (user hold) or because of a networkhold operation (for example, a transfer is in progress, and it is on transfer hold). This applies to all directorynumbers that are assigned to any device.
Cisco Unified Real-Time Monitoring Tool Administration Guide, Release 11.0(1) 215
Performance Counters and AlertsCisco LBM service

Cisco Locations LBMThe Cisco Location LBM object provides information about locations that are defined in Cisco UnifiedCommunications Manager clusters. The following table contains information on Cisco location counters.
Table 54: Cisco Locations LBM
Counter DescriptionCounters
This counter represents the current audio bandwidth ina location or a link between two locations. A value of 0indicates that no audio bandwidth is available.
BandwidthAvailable
This counter represents the maximum audio bandwidththat is available in a location or a link between twolocations. A value of 0 indicates that no audio bandwidthis available.
BandwidthMaximum
This represents the current oversubscribed audiobandwidth in a location or link between two locations.A value of zero indicates no bandwidth oversubscription.
BandwidthOversubscription
This counter represents the number of calls that arecurrently in progress on a particular Cisco LocationBandwidth Manager.
CallsInProgress
This represents the total number of failed immersivevideo call bandwidth reservations associated with alocation or a link between two locations due to lack ofimmersive video bandwidth.
ImmersiveOutOfResources
This counter represents the maximum bandwidth that isavailable for video in a location or a link between twolocations. A value of 0 indicates that no bandwidth isallocated for video.
ImmersiveVideoBandwidthAvailable
This counter represents the bandwidth that is currentlyavailable for video in a location or a link between twolocations. A value of 0 indicates that no bandwidth isavailable.
ImmersiveVideoBandwidthMaximum
This represents the current immersive videooversubscribed bandwidth in a location or link betweentwo locations. A value of zero indicates no bandwidthoversubscription.
ImmersiveVideoBandwidthOversubscription
This counter represents the total number of failed audiocall bandwidth reservations associated with a givenlocation or a link between two locations due to lack ofaudio bandwidth.
OutOfResources
Cisco Unified Real-Time Monitoring Tool Administration Guide, Release 11.0(1)216
Performance Counters and AlertsCisco Locations LBM

Counter DescriptionCounters
This counter represents the bandwidth that is currentlyavailable for video in a location or a link between twolocations. A value of 0 indicates that no bandwidth isavailable.
VideoBandwidthAvailable
This counter represents the maximum bandwidth that isavailable for video in a location and a link between twolocations. A value of 0 indicates that no bandwidth isallocated for video.
VideoBandwidthMaximum
This represents the current video oversubscribedbandwidth amount in a location and a link between twolocations. A value of zero indicates no bandwidthoversubscription.
VideoOversubscription
This counter represents the total number of failed videocall bandwidth reservations associated with a givenlocation or a link between two locations due to lack ofvideo bandwidth.
VideoOutOfResources
Cisco Locations RSVPThe Cisco Location RSVP object provides information about RSVP that is defined in Cisco UnifiedCommunications Manager. The following table contains information on Cisco location RSVP counters.
Table 55: Cisco Locations RSVP
Counter DescriptionCounters
This counter represents the number of RSVP reservation errors in theaudio stream.
RSVPAudioReservationErrorCounts
This counter represents the number of connections with mandatoryRSVP that are in progress.
RSVPMandatoryConnectionsInProgress
This counter represents the number of connections with optional RSVPthat are in progress.
RSVPOptionalConnectionsInProgress
This counter represents the number of total calls that failed due to aRSVP reservation failure.
RSVP TotalCallsFailed
This counter represents the number of video calls that failed due to aRSVP reservation failure.
RSVP VideoCallsFailed
This counter represents the number of RSVP reservation errors in thevideo stream
RSVPVideoReservationErrorCounts
Cisco Unified Real-Time Monitoring Tool Administration Guide, Release 11.0(1) 217
Performance Counters and AlertsCisco Locations RSVP

Cisco Media Streaming ApplicationThe Cisco IP Voice Media Streaming Application object provides information about the registered MTPs,MOH servers, conference bridge servers, and annunciators. The following table contains information on CiscoIP Voice Media Streaming Application counters.
One object exists for each Cisco Unified CommunicationsManager in the Cisco Unified CommunicationsManager group that is associated with the device pool that the annunciator device is configured to use.
Note
Table 56: Cisco Media Streaming Application
Counter DescriptionCounter
This counter represents the total number of times since the last restartof the Cisco IP VoiceMedia StreamingApplication that a Cisco UnifiedCommunications Manager connection was lost.
ANNConnectionsLost
For each Cisco Unified Communications Manager that is associatedwith an annunciator, this counter represents the current registrationstate to Cisco Unified Communications Manager; 0 indicates noregistration to Cisco Unified Communications Manager; 1 indicatesregistration to the primary Cisco Unified Communications Manager;2 indicates connection to the secondary Cisco Unified CommunicationsManager (connected to Cisco Unified Communications Manager butnot registered until the primary Cisco Unified CommunicationsManager connection fails).
ANNConnectionState
This counter represents the total number of annunciator instances thathave been started since the Cisco IP Voice Media StreamingApplication service started.
ANNConnectionsTotal
This counter represents the number of actively playing (currently inuse) announcements.
ANNInstancesActive
This counter represents the total number of currently active simplex(one direction) streams for all connections. Each stream direction countsas one stream. One internal stream provides the audio input and anotheroutput stream to the endpoint device.
ANNStreamsActive
This counter represents the remaining number of streams that areallocated for the annunciator device that are available for use. Thiscounter starts as 2 multiplied by the number of configured connections(defined in the Cisco IP VoiceMedia Streaming App service parameterfor the Annunciator, Call Count) and is reduced by one for each activestream that started.
ANNStreamsAvailable
Cisco Unified Real-Time Monitoring Tool Administration Guide, Release 11.0(1)218
Performance Counters and AlertsCisco Media Streaming Application

Counter DescriptionCounter
This counter represents the total number of simplex (one direction)streams that connected to the annunciator device since the Cisco IPVoice Media Streaming Application service started.
ANNStreamsTotal
This counter represents the number of active (currently in use)conferences.
CFBConferencesActive
This counter represents the total number of conferences that startedsince the Cisco IP Voice Media Streaming Application service started.
CFBConferencesTotal
This counter represents the total number of times since the last restartof the Cisco IP VoiceMedia StreamingApplication that a Cisco UnifiedCommunications Manager connection was lost.
CFBConnectionsLost
For each Cisco Unified Communications Manager that is associatedwith a SW Conference Bridge, this counter represents the currentregistration state to Cisco Unified Communications Manager; 0indicates no registration to Cisco Unified Communications Manager;1 indicates registration to the primary Cisco Unified CommunicationsManager; 2 indicates connection to the secondary Cisco UnifiedCommunications Manager (connected to Cisco UnifiedCommunications Manager but not registered until the primary CiscoUnified Communications Manager connection fails).
CFBConnectionState
This counter represents the total number of currently active simplex(one direction) streams for all conferences. Each stream direction countsas one stream. In a three-party conference, the number of active streamsequals 6.
CFBStreamsActive
This counter represents the remaining number of streams that areallocated for the conference bridge that are available for use. Thiscounter starts as 2 multiplied by the number of configured connections(defined in the Cisco IP VoiceMedia Streaming App service parameterfor Conference Bridge, Call Count) and is reduced by one for eachactive stream started.
CFBStreamsAvailable
This counter represents the total number of simplex (one direction)streams that connected to the conference bridge since the Cisco IPVoice Media Streaming Application service started.
CFBStreamsTotal
Cisco Unified Real-Time Monitoring Tool Administration Guide, Release 11.0(1) 219
Performance Counters and AlertsCisco Media Streaming Application

Counter DescriptionCounter
This counter represents the number of active (currently in use) audiosources for this MOH server. Some of these audio sources may not beactively streaming audio data if no devices are listening. The exceptionexists for multicast audio sources, which will always be streamingaudio.
When an audio source is in use, even after the listener has disconnected,this counter will always have one input stream for each configuredMOH codec. For unicast streams, the stream may exist in a suspendedstate where no audio data is received until a device connects to listento the stream. Each MOH multicast resource uses one stream for eachaudio source and codec combination. For example, if the default audiosource is configured for multicast, G.711mu-law andwideband codecs,then two streams get used (default audio source + G.711 mu-law anddefault audio source + wideband).
MOHAudioSourcesActive
This counter represents the total number of times since the last restartof the Cisco IP VoiceMedia StreamingApplication that a Cisco UnifiedCommunications Manager connection was lost.
MOHConnectionsLost
For each Cisco Unified Communications Manager that is associatedwith an MOH, this counter represents the current registration state toCisco Unified Communications Manager; 0 indicates no registrationto Cisco Unified Communications Manager; 1 indicates registrationto the primary Cisco Unified Communications Manager; 2 indicatesconnection to the secondary Cisco Unified Communications Manager(connected to Cisco Unified Communications Manager but notregistered until the primary Cisco Unified Communications Managerconnection fails).
MOHConnectionState
This counter represents the total number of active (currently in use)simplex (one direction) streams for all connections. One output streamexists for each device that is listening to a unicast audio source, andone input stream exists for each active audio source, multiplied by thenumber of MOH codecs.
When an audio source has been used once, it will always have oneinput stream for each configuredMOH codec. For unicast streams, thestream may exist in a suspended state where no audio data is receiveduntil a device connects to listen to the stream. Each MOH multicastresource uses one stream for each audio source and codec combination.For example, if the default audio source is configured for multicast,G.711mu-law andwideband codecs, then two streams get used (defaultaudio source + G.711 mu-law and default audio source + wideband).
MOHStreamsActive
Cisco Unified Real-Time Monitoring Tool Administration Guide, Release 11.0(1)220
Performance Counters and AlertsCisco Media Streaming Application

Counter DescriptionCounter
This counter represents the remaining number of streams that areallocated for the MOH device that are available for use. This counterstarts as 408 plus the number of configured half-duplex unicastconnections and is reduced by 1 for each active stream that started.The counter gets reduced by 2 for each multicast audio source,multiplied by the number of MOH codecs that are configured. Thecounter gets reduced by 1 for each unicast audio source, multiplied bythe number of MOH codecs configured.
MOHStreamsAvailable
This counter represents the total number of simplex (one direction)streams that have connected to the MOH server since the Cisco IPVoice Media Streaming Application service started.
MOHStreamsTotal
This counter represents the total number of times since the last restartof the Cisco IP Voice Streaming Application that a Cisco UnifiedCommunications Manager connection was lost.
MTPConnectionsLost
For each Cisco Unified Communications Manager that is associatedwith an MTP, this counter represents the current registration state toCisco Unified Communications Manager; 0 indicates no registrationto Cisco Unified Communications Manager; 1 indicates registrationto the primary Cisco Unified Communications Manager; 2 indicatesconnection to the secondary Cisco Unified Communications Manager(connected to Cisco Unified Communications Manager but notregistered until the primary Cisco Unified Communications Managerconnection fails).
MTPConnectionState
This counter represents the total number of MTP instances that havebeen started since the Cisco IP Voice Media Streaming Applicationservice started.
MTPConnectionsTotal
This counter represents the number of active (currently in use) instancesof MTP.
MTPInstancesActive
This counter represents the total number of currently active simplex(one direction) streams for all connections. Each stream direction countsas one stream.
MTPStreamsActive
This counter represents the remaining number of streams that areallocated for the MTP device that are available for use. This counterstarts as 2 multiplied by the number of configured connections (definedin the Cisco IP Voice Media Streaming App service parameter forMTP, Call Count) and is reduced by one for each active stream started.
MTPStreamsAvailable
This counter represents the total number of simplex (one direction)streams that connected to the MTP device since the Cisco IP VoiceMedia Streaming Application service started.
MTPStreamsTotal
This represents the number of current active interactive voice responses.IVRInstancesActive
Cisco Unified Real-Time Monitoring Tool Administration Guide, Release 11.0(1) 221
Performance Counters and AlertsCisco Media Streaming Application

Counter DescriptionCounter
This represents the total number of current active simplex (onedirection) stream for all connections. Each stream direction counts asone stream. There is one internal stream providing the audio input andanother output stream to the endpoint device.
IVRStreamsActive
This represents the remaining number of streams allocated for the IVRdevice that are available for use. This counter starts as 3 multiplied bythe number of configured connections (defined in the Cisco IP VoiceMedia Streaming App service parameter for the IVR, Call Count) andis reduced by one for each active stream started.
IVRStreamsAvailable
This represents the total number of IVR instances that have been startedsince the Cisco IP Voice Media Streaming Application service started.
IVRConnectionsTotal
This represents the total number of simplex (one direction) streamsthat have been connected to the IVR device since the Cisco IP VoiceMedia Streaming Application service started.
IVRStreamsTotal
This represents the total number of times the Cisco UnifiedCommunications Manager connection was lost, since the last restartof the Cisco IP Voice Media Streaming Application.
IVRConnectionsLost
This represents the total number of times the IVR failed to play, sincethe last restart of the Cisco IP Voice Media Streaming Application.
IVRErrors
Cisco Messaging InterfaceThe Cisco Messaging Interface object provides information about the Cisco Messaging Interface (CMI)service. The following table contains information on Cisco Messaging Interface (CMI) counters.
Table 57: Cisco Messaging Interface
Counter DescriptionCounters
This counter represents the heartbeat of the CMI service. Thisincremental count indicates that the CMI service is up and running. Ifthe count does not increase (increment), the CMI service is down.
HeartBeat
This counter represents the running count of inbound SMDI messagessince the last restart of the CMI service.
SMDIMessageCountInbound
This counter represents the rolling count of inbound SMDI messagesin the last 24 hours.
SMDIMessageCountInbound24Hour
This counter represents the running count of outbound SMDImessagessince the last restart of the CMI service.
SMDIMessageCountOutbound
Cisco Unified Real-Time Monitoring Tool Administration Guide, Release 11.0(1)222
Performance Counters and AlertsCisco Messaging Interface

Counter DescriptionCounters
This counter represents the rolling count of outbound SMDI messagesin the last 24 hours.
SMDIMessageCountOutbound24Hour
This counter represents the time in milliseconds when the CMI servicestarted. The real-time clock in the computer, which simply acts as areference point that indicates the current time and the time that haselapsed, in milliseconds, since the service started, provides the basisfor this time. The reference point specifies midnight, January 1, 1970.
StartTime
Cisco MGCP BRI DeviceThe CiscoMedia Gateway Control Protocol (MGCP) Foreign Exchange Office (FXO)Device object providesinformation about registered Cisco MGCP BRI devices. The following table contains information onCisco MGCP BRI device counters.
Table 58: Cisco MGCP BRI Device
Counter DescriptionCounters
This counter represents the total number of successful calls that weremade from this MGCP Basic Rate Interface (BRI) device
CallsCompleted
This counter represents the status of the indicated B-Channel that isassociated with the MGCP BRI device. Possible values: 0 (Unknown)indicates the status of the channel could not be determined; 1 (Out ofservice) indicates that this channel is not available for use; 2 (Idle)indicates that this channel has no active call and is ready for use; 3(Busy) indicates an active call on this channel; 4 (Reserved) indicatesthat this channel has been reserved for use as a D-channel or for useas a Synch-Channel for BRI.
Channel 1 Status
This counter represents the status of the indicated B-Channel that isassociated with the MGCP BRI device. Possible values: 0 (Unknown)indicates the status of the channel could not be determined; 1 (Out ofservice) indicates that this channel is not available for use; 2 (Idle)indicates that this channel has no active call and is ready for use; 3(Busy) indicates an active call on this channel; 4 (Reserved) indicatesthat this channel has been reserved for use as a D-channel or for useas a Synch-Channel for BRI.
Channel 2 Status
This counter represents the state of the Data Link (D-Channel) on thecorresponding digital access gateway. This value will get set to 1 (one)if the Data Link is up (in service) or 0 (zero) if the Data Link is down(out of service).
DatalinkInService
Cisco Unified Real-Time Monitoring Tool Administration Guide, Release 11.0(1) 223
Performance Counters and AlertsCisco MGCP BRI Device

Counter DescriptionCounters
This counter represents the total number of times that a call throughthis MGCP BRI device was attempted when no voice channels areavailable.
OutboundBusyAttempts
Cisco MGCP FXO DeviceThe CiscoMedia Gateway Control Protocol (MGCP) Foreign Exchange Office (FXO)Device object providesinformation about registered Cisco MGCP FXO devices. The following table contains information onCisco MGCP FXO device counters.
Table 59: Cisco MGCP FXO Device
Counter DescriptionCounters
This counter represents the total number of successful calls that weremade from the port on an MGCP FXO device.
CallsCompleted
This counter represents the total number of times that a call throughthe port on this MGCP FXO device was attempted when no voicechannels were available.
OutboundBusyAttempts
This counter represents the status of the FXO port associated with thisMGCP FXO device.
PortStatus
Cisco MGCP FXS DeviceThe CiscoMGCP Foreign Exchange Station (FXS) Device object provides information about registered CiscoMGCP FXS devices. One instance of this object gets created for each port on a Cisco Catalyst 6000 24 portFXS Analog Interface Module gateway. For example, a fully configured Catalyst 6000 Analog InterfaceModule would represent 24 separate instances of this object. The following table contains information onCisco MGCP FXS device counters.
Table 60: Cisco MGCP FXS Device
Counter DescriptionCounters
This counter represents the total number of successful calls that weremade from this port on the MGCP FXS device.
CallsCompleted
This counter represents the total number of times that a call throughthis port on the MGCP FXS device was attempted when no voicechannels were available.
OutboundBusyAttempts
Cisco Unified Real-Time Monitoring Tool Administration Guide, Release 11.0(1)224
Performance Counters and AlertsCisco MGCP FXO Device

Counter DescriptionCounters
This counter represents the status of the FXS port that is associatedwith a MGCP FXS device.
PortStatus
Cisco MGCP GatewaysThe Cisco MGCP Gateways object provides information about registered MGCP gateways. The followingtable contains information on Cisco MGCP gateway counters.
Table 61: Cisco MGCP Gateways
Counter DescriptionCounters
This counter represents the number of BRI voice channels that arecurrently active in a call in the gateway
BRIChannelsActive
This counter represents the number of BRI spans that are currentlyavailable for use in the gateway.
BRISpansInService
This counter represents the number of FXO ports that are currentlyactive in a call in the gateway.
FXOPortsActive
This counter represents the number of FXO ports that are currentlyavailable for use in the gateway.
FXOPortsInService
This counter represents the number of FXS ports that are currentlyactive in a call in the gateway.
FXSPortsActive
This counter represents the number of FXS ports that are currentlyavailable for use in the gateway.
FXSPortsInService
This counter represents the number of PRI voice channels that arecurrently active in a call in the gateway.
PRIChannelsActive
This counter represents the number of PRI spans that are currentlyavailable for use in the gateway.
PRISpansInService
This counter represents the number of T1 CAS voice channels that arecurrently active in a call in the gateway.
T1ChannelsActive
This counter represents the number of T1 CAS spans that are currentlyavailable for use in the gateway.
T1SpansInService
Cisco Unified Real-Time Monitoring Tool Administration Guide, Release 11.0(1) 225
Performance Counters and AlertsCisco MGCP Gateways

Cisco MGCP PRI DeviceThe Cisco MGCP Primary Rate Interface (PRI) Device object provides information about registered CiscoMGCP PRI devices. The following table contains information on Cisco MGCP PRI device counters.
Table 62: Cisco MGCP PRI Device
Counter DescriptionCounters
This counter represents the number of calls that are currently active(in use) on this MGCP PRI device.
CallsActive
This counter represents the total number of successful calls that weremade from this MGCP PRI device.
CallsCompleted
This counter represents the status of the indicated B-Channel that isassociated with a MGCP PRI device. Possible values: 0 (Unknown)indicates that the status of the channel could not be determined; 1 (Outof service) indicates that this channel is not available for use; 2 (Idle)indicates that this channel has no active call and is ready for use; 3(Busy) indicates that an active call exists on this channel; 4 (Reserved)indicates that this channel has been reserved for use as a D-Channelor for use as a Synch-Channel for E-1.
Channel 1 Status through Channel15 Status (consecutively numbered)
This counter represents the status of the indicated B-Channel that isassociated with a MGCP PRI Device. Possible values: 0-Unknown,1-Out of service, 2-Idle, 3-Busy, 4-Reserved, for an E1 PRI Interface,this channel is reserved for use as a D-Channel.
Channel 16 Status
This counter represents the status of the indicated B-Channel that isassociated with the MGCP PRI Device. 0-Unknown, 1-Out of service,2-Idle, 3-Busy, 4-Reserved.
Channel 17 Status through Channel31 Status (consecutively numbered)
This counter represents the state of the Data Link (D-Channel) on thecorresponding digital access gateway. This value will be set to 1 (one)if the Data Link is up (in service) or 0 (zero) if the Data Link is down(out of service).
DatalinkInService
This counter represents the total number of times that a call throughan MGCP PRI device was attempted when no voice channels wereavailable.
OutboundBusyAttempts
Cisco MGCP T1 CAS DeviceThe CiscoMGCPT1Channel Associated Signaling (CAS) Device object provides information about registeredCisco MGCP T1 CAS devices. The following table contains information on Cisco MGCP TI CAS devicecounters.
Cisco Unified Real-Time Monitoring Tool Administration Guide, Release 11.0(1)226
Performance Counters and AlertsCisco MGCP PRI Device
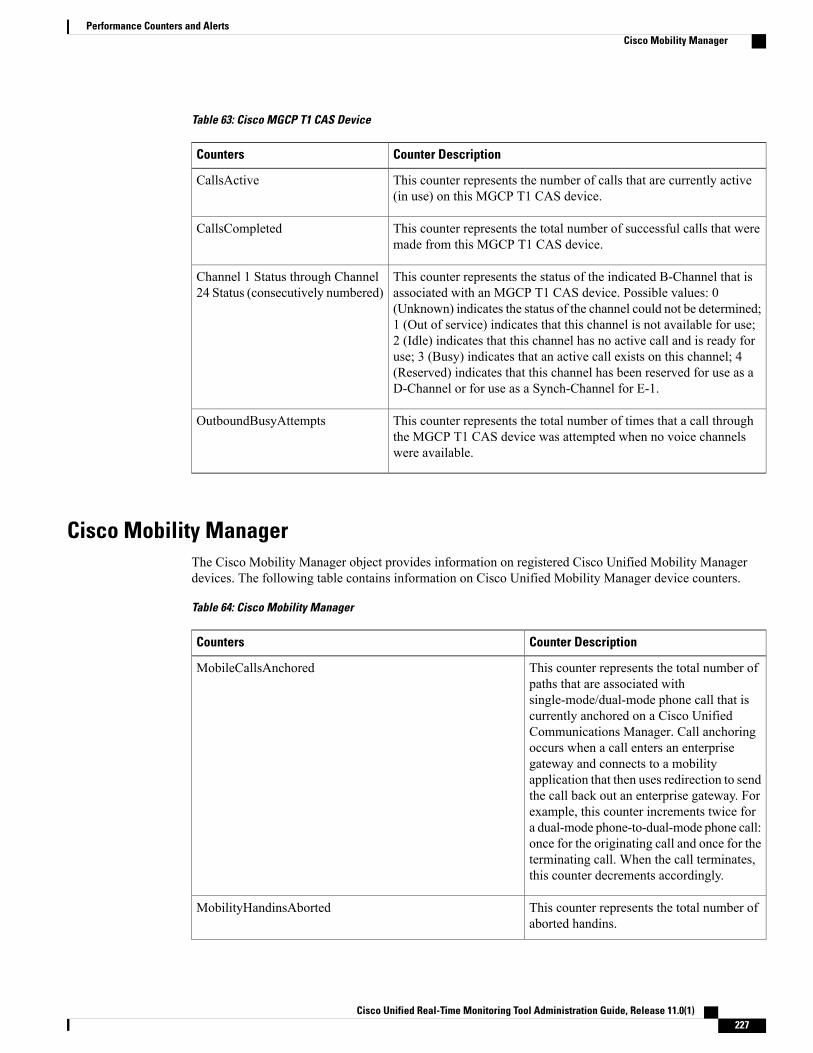
Table 63: Cisco MGCP T1 CAS Device
Counter DescriptionCounters
This counter represents the number of calls that are currently active(in use) on this MGCP T1 CAS device.
CallsActive
This counter represents the total number of successful calls that weremade from this MGCP T1 CAS device.
CallsCompleted
This counter represents the status of the indicated B-Channel that isassociated with an MGCP T1 CAS device. Possible values: 0(Unknown) indicates the status of the channel could not be determined;1 (Out of service) indicates that this channel is not available for use;2 (Idle) indicates that this channel has no active call and is ready foruse; 3 (Busy) indicates that an active call exists on this channel; 4(Reserved) indicates that this channel has been reserved for use as aD-Channel or for use as a Synch-Channel for E-1.
Channel 1 Status through Channel24 Status (consecutively numbered)
This counter represents the total number of times that a call throughthe MGCP T1 CAS device was attempted when no voice channelswere available.
OutboundBusyAttempts
Cisco Mobility ManagerThe Cisco Mobility Manager object provides information on registered Cisco Unified Mobility Managerdevices. The following table contains information on Cisco Unified Mobility Manager device counters.
Table 64: Cisco Mobility Manager
Counter DescriptionCounters
This counter represents the total number ofpaths that are associated withsingle-mode/dual-mode phone call that iscurrently anchored on a Cisco UnifiedCommunications Manager. Call anchoringoccurs when a call enters an enterprisegateway and connects to a mobilityapplication that then uses redirection to sendthe call back out an enterprise gateway. Forexample, this counter increments twice fora dual-mode phone-to-dual-mode phone call:once for the originating call and once for theterminating call. When the call terminates,this counter decrements accordingly.
MobileCallsAnchored
This counter represents the total number ofaborted handins.
MobilityHandinsAborted
Cisco Unified Real-Time Monitoring Tool Administration Guide, Release 11.0(1) 227
Performance Counters and AlertsCisco Mobility Manager

Counter DescriptionCounters
This counter represents the total number ofhandins that were completed by dual-modephones. A completed handin occurs whenthe call successfully connects in theenterprise network and the phone movesfrom WAN to WLAN.
MobileHandinsCompleted
This counter represents the total number ofhandins (calls on mobile devices that movefrom cellular to the wireless network) thatfailed.
MobilityHandinsFailed
This counter represents the total number ofaborted handouts.
MobilityHandoutsAborted
This counter represents the total number ofhandouts (calls on mobile devices that movefrom the enterprise WLAN network to thecellular network) that were completed. Acompleted handout occurs when the callsuccessfully connects.
MobileHandoutsCompleted
This counter represents the total number ofhandouts (calls on mobile devices that movefrom cellular to the wireless network) thatfailed.
MobileHandoutsFailed
This counter represents the total number offollow-me calls that were attempted.
MobilityFollowMeCallsAttempted
This counter represents the total number offollow-me calls that were ignored before theAnswerTooSoon timer went off.
MobilityFollowMeCallsIgnoredDueToAnswerTooSoon
This counter represents the total number ofattempted IVR calls.
MobilityIVRCallsAttempted
This counter represents the total number offailed IVR calls.
MobilityIVRCallsFailed
This counter represents the total number ofsuccessful IVR calls.
MobilityIVRCallsSucceeded
This counter represents the total number ofdual-mode SCCP devices that are registered.
MobilitySCCPDualModeRegistered
This counter represents the total number ofdual-mode SIP devices that are registered.
MobilitySIPDualModeRegistered
Cisco Unified Real-Time Monitoring Tool Administration Guide, Release 11.0(1)228
Performance Counters and AlertsCisco Mobility Manager

Cisco Music On Hold (MOH) DeviceThe Cisco Music On Hold (MOH) Device object provides information about registered Cisco MOH devices.The following table contains information on Cisco MOH device counters.
Table 65: Cisco MOH Device
Counter DescriptionCounters
This counter represents the largest number of simultaneously activeMOH connections for an MOH server. This number includes bothmulticast and unicast connections.
MOHHighestActiveResources
This counter represents the number of currently active multicastconnections to multicast addresses that are served by an MOH server.
Each MOH multicast resource uses one stream for each audio sourceand codec combination. For example, if the default audio source isconfigured for multicast, G.711 mu-law and wideband codecs, twostreams get used (default audio source + G.711 mu-law and defaultaudio source + wideband).
MOHMulticastResourceActive
This counter represents the number of multicast MOH connections tomulticast addresses that are served by an MOH server that are notactive and are still available to be used now for the MOH server.
Each MOH multicast resource uses one stream for each audio sourceand codec combination. For example, if the default audio source isconfigured for multicast, G.711 mu-law and wideband codecs, twostreams get used (default audio source + G.711 mu-law and defaultaudio source + wideband).
MOHMulticastResourceAvailable
This counter represents the total number of times that the MediaResource Manager attempted to allocate an MOH resource when allavailable resources on all MOH servers that are registered with a CiscoUnified Communications Manager were already active.
MOHOutOfResources
This counter represents the total number of multicastMOH connectionsthat are allowed to multicast addresses that are served by an MOHserver.
Each MOH multicast resource uses one stream for each audio sourceand codec combination. For example, if the default audio source isconfigured for multicast, G.711 mu-law and wideband codecs, twostreams get used (default audio source + G.711 mu-law and defaultaudio source + wideband).
MOHTotalMulticastResources
Cisco Unified Real-Time Monitoring Tool Administration Guide, Release 11.0(1) 229
Performance Counters and AlertsCisco Music On Hold (MOH) Device

Counter DescriptionCounters
This counter represents the total number of unicast MOH connectionsthat are allowed by an MOH server.
Each MOH unicast resource uses one stream.
MOHTotalUnicastResources
This counter represents the number of active unicastMOH connectionsto an MOH server.
Each MOH unicast resource uses one stream.
MOHUnicastResourceActive
This counter represents the number of unicast MOH connections thatare not active and are still available to be used now for anMOH server.
Each MOH unicast resource uses one stream.
MOHUnicastResourceAvailable
Cisco MTP DeviceThe Cisco Media Termination Point (MTP) Device object provides information about registered Cisco MTPdevices. The following table contains information on Cisco MTP device counters.
Table 66: Cisco MTP Device
Counter DescriptionCounters
This counter represents the total number of times that an attempt wasmade to allocate an MTP resource from an MTP device and failed; forexample, because all resources were already in use.
OutOfResources
This counter represents the number ofMTP resources that are currentlyin use (active) for an MTP device.
Each MTP resource uses two streams. An MTP in use represents oneMTP resource that has been allocated for use in a call.
ResourceActive
This counter represents the total number of MTP resources that are notactive and are still available to be used now for an MTP device.
Each MTP resource uses two streams. An MTP in use represents oneMTP resource that has been allocated for use in a call.
ResourceAvailable
This counter represents the total number of MTP resources that anMTP device provides. This counter equals the sum of the countersResourceAvailable and ResourceActive.
ResourceTotal
Cisco Unified Real-Time Monitoring Tool Administration Guide, Release 11.0(1)230
Performance Counters and AlertsCisco MTP Device

Cisco PhonesThe Cisco Phones object provides information about the number of registered Cisco Unified IP Phones,including both hardware-based and other station devices.
The CallsAttempted counter represents the number of calls that have been attempted from this phone. Thisnumber increases each time that the phone goes off hook and on hook.
Cisco Presence FeatureThe Cisco Presence object provides information about presence subscriptions, such as statistics that are relatedto the speed dial or call list Busy Lamp Field (BLF) subscriptions. The following table contains informationon Cisco Presence feature.
Table 67: Cisco Presence
Counter DescriptionCounters
This counter represents the active presence subscriptions for the calllist feature as well as presence subscriptions through SIP trunk.
ActiveCallListAndTrunkSubscriptions
This counter represents all active incoming and outgoing presencesubscriptions.
ActiveSubscriptions
This counter represents the cumulative number of rejected call list andtrunk side presence subscriptions due to throttling for the call listfeature.
CallListAndTrunkSubscriptionsThrottled
This counter represents the cumulative number of presencesubscriptions that were received on the line side.
IncomingLineSideSubscriptions
This counter represents the cumulative number of presencesubscriptions that were received on the trunk side.
IncomingTrunkSideSubscriptions
This counter represents the cumulative number of presencesubscriptions that were sent on the trunk side.
OutgoingTrunkSideSubscriptions
Cisco QSIG FeatureThe Cisco QSIG Feature object provides information about the operation of various QSIG features, such ascall diversion and path replacement. The following table contains information about the Cisco QSIG featurecounters.
Cisco Unified Real-Time Monitoring Tool Administration Guide, Release 11.0(1) 231
Performance Counters and AlertsCisco Phones

Table 68: Cisco QSIG Feature
Counter DescriptionCounters
This counter represents the number of successful calls that has beenforwarded by rerouting. Call forward by rerouting enables the path fora forwarded call to be optimized (minimizes the number of B-Channelsin use) from the originator perspective. This counter resets when theCisco CallManager service parameter Call Forward by Reroute Enabledis enabled or disabled, or when the Cisco CallManager Service restarts.
CallForwardByRerouteCompleted
This counter represents the number of successful path replacementsthat have occurred. Path replacement in a QSIG network optimizes thepath between two edge PINX (PBXs) that are involved in a call. Thiscounter resets when the Cisco CallManager service parameter PathReplacement Enabled is enabled or disabled, or when the CiscoCallManager Service restarts.
PathReplacementCompleted
Cisco Signaling PerformanceThe Cisco Signaling Performance object provides call-signaling data on transport communications on CiscoUnified Communications Manager. The following table contains information about the Cisco SignalingPerformance counter.
Table 69: Cisco Signaling Performance
Counter DescriptionCounters
This counter represents the total number of incoming UDP packetsthat were throttled (dropped) because they exceeded the threshold forthe number of incoming packets per second that is allowed from asingle IP address. Configure the threshold via the SIP Station UDPPort Throttle Threshold and SIP Trunk UDP Port Throttle Thresholdservice parameters in Cisco Unified Communications ManagerAdministration. This counter increments for every throttled UDP packetthat was received since the last restart of the Cisco CallManagerService.
UDPPacketsThrottled
Cisco SIPThe Cisco Session Initiation Protocol (SIP) object provides information about configured SIP devices. Thefollowing table contains information on the Cisco SIP counters.
Cisco Unified Real-Time Monitoring Tool Administration Guide, Release 11.0(1)232
Performance Counters and AlertsCisco Signaling Performance

Table 70: Cisco SIP
Counter DescriptionCounters
This counter represents the number of calls that are currently active(in use) on this SIP device.
CallsActive
This counter represents the number of calls that have been attemptedon this SIP device, including the successful and unsuccessful callattempts.
CallsAttempted
This counter represents the number of calls that were actually connected(a voice path was established) from a SIP device. This numberincrements when the call is terminated.
CallsCompleted
This counter represents the number of calls that are currently in progresson a SIP device, including all active calls. When all calls that are inprogress are connected, the number of CallsInProgress equals thenumber of CallsActive.
CallsInProgress
This counter represents the number of video calls with streaming videoconnections that are currently active (in use) on this SIP device.
VideoCallsActive
This counter represents the number of video calls that were actuallyconnected with video streams for this SIP device. This numberincrements when the call is terminated.
VideoCallsCompleted
Cisco SIP Line NormalizationThe Cisco SIP line normalization performance object contains counters that allow you to monitor aspects ofthe normalization script for SIP lines, including initialization errors, runtime errors, and script status. For SIPlines, each script has only one set of performance counters. This is true even if two endpoints share the samescript. The following table contains information about the Cisco SIP line normalization counters.
DescriptionDisplay Names
This counter indicates the number of times that Cisco Unified CommunicationsManager automatically resets the device (SIP phone). Automatic resets occuronly if the value specified in Script Execution Error Recovery Action or SystemResource Error Recovery Action field is set to Reset Device. This counterincrements each time Unified Communications Manager automatically resetsa device (SIP phone) due to an error. The count is restarted when the script isreset following a change to the script configuration.
DeviceResetAutomatically
Cisco Unified Real-Time Monitoring Tool Administration Guide, Release 11.0(1) 233
Performance Counters and AlertsCisco SIP Line Normalization

DescriptionDisplay Names
This counter indicates the number of execution errors that occur while thescript executes. Execution errors can occur while a message handler executes.Execution errors can be caused by problems such as resource errors or anargument mismatch in a function call.
When an execution error occurs, Unified CommunicationsManager performsthe following actions:
• Automatically restores themessage to the original content before applyingadditional error-handling actions.
• Increments the value of the counter.
• Takes appropriate action based on the configuration of the ScriptExecution Error Recovery Action and System Resource Error RecoveryAction fields in CiscoUnified CommunicationsManager Administration.
Check the SIPNormalizationScriptError alarm for details, including the linenumber in the script that failed. Correct the script problem, upload the correctedscript as needed, and reset the script by clicking the Reset button at the top ofthe script configuration page. The counter increments for each execution errorsince the last time the script was reset following a change to the scriptconfiguration. Both a script configuration change and a script reset must occurto restart the counter.
If the counter continues to increment after you fix the script problem, examinethe script again.
ErrorExecution
This counter indicates the number of times a script error occurred after thescript was successfully loaded into memory but failed to initialize in UnifiedCommunicationsManager. A script can fail to initialize due to resource errors,an argument mismatch in a function call, and so on.
Check the SIPNormalizationScriptError alarm for details, including the linenumber in the script that failed. Correct the script problem, upload the correctedscript if needed, and reset the script by clicking the Reset button at the top ofthe script configuration page. The counter for the script instance incrementsevery time an initialization error occurs. This counter provides a count fromthe most recent script reset that was accompanied by a change to the scriptconfiguration. Both a script configuration change and a script reset must occurto restart the counter. If the counter continues to increment after you fix thescript problem, examine the script again. When the error occurs duringinitialization, Unified Communications Manager automatically disables thescript.
ErrorInit
This counter indicates the number of internal errors that have occurred whilethe script executed. Internal errors are extremely rare. If the value in thiscounter is higher than zero, there is a defect in the system not related to thescript content or execution. Collect SDI traces and contact the TechnicalAssistance Center (TAC).
ErrorInternal
Cisco Unified Real-Time Monitoring Tool Administration Guide, Release 11.0(1)234
Performance Counters and AlertsCisco SIP Line Normalization

DescriptionDisplay Names
This counter indicates the number of times that a script error occurred whilethe script loaded into memory in Unified Communications Manager.
A script can fail to load due to memory issues or syntax errors; check theSIPNormalizationScriptError alarm for details such as the script line numberwhere the syntax error exists, check the script for syntax errors, upload acorrected script if needed and reset the script by clicking the Reset button atthe top of the script configuration page.
The counter for the script instance increments for each load error since thelast time the script was reset following a change to the script configuration.Both a script configuration change and a script reset must have occurred torestart the counter. If the counter continues to increment after you believe youhave fixed the script problem, examine the script again.
ErrorLoad
This counter indicates whether or not the script encountered a resource error.
There are two kinds of resource errors: exceeding the value configured in theMemory Threshold field or exceeding the value configured in the LuaInstruction Threshold field. Both fields display in the SIP Normalization ScriptConfiguration window in Cisco Unified Communications ManagerAdministration. If either condition occurs, Unified CommunicationsManagerimmediately closes the script and issues the SIPNormalizationScriptErroralarm.
If a resource error occurs while the script loads or initializes, the script isdisabled. If a resource error occurs during execution, the configured systemresource error recovery action is taken as configured in the System ResourceError Recovery Action field on the SIP Normalization Script Configurationwindow in Cisco Unified Communications Manager Administration.
ErrorResource
This counter indicates the amount of memory, in bytes, that the script consumesbased on the accumulation for all SIP phones using this script. This counterincreases and decreases to match the amount of memory being utilized by thescript. The count gets cleared when the script is closed (because a closed scriptconsumes no memory) and restarts when the script is opened (enabled). Ahigh number in this counter could indicate a resource problem. Check theMemoryUsagePercentage counter and check for aSIPNormalizationResourceWarning alarm, which occurs when the resourceconsumption exceeds an internally set threshold.
MemoryUsage
Cisco Unified Real-Time Monitoring Tool Administration Guide, Release 11.0(1) 235
Performance Counters and AlertsCisco SIP Line Normalization

DescriptionDisplay Names
This counter indicates the percentage of the total amount of memory the scriptconsumes based on the accumulation for all SIP phones using this script.
The value in this counter is derived by dividing the value in theMemoryUsagecounter by the value in theMemory Threshold field (in the SIP NormalizationScript Configuration window) and multiplying that result by 100 to arrive ata percentage value.
This counter increases and decreases in accordance with the MemoryUsagecounter. This count is cleared when the script is closed (because closed scriptsconsume no memory) and restarts when the script is opened (enabled). Whenthis counter reaches the internally controlled resource threshold, theSIPNormalizationResourceWarning alarm is issued.
MemoryUsagePercentage
This counter indicates the number of times a message was not modified bythe script due to an error while the script executes. This can occur only if thevalue in the Script Execution Error Recovery Action field is set to MessageRollback Only.
When an execution error occurs, Unified Communications Managerautomatically restores the message to the original contents prior to applyingadditional error-handling actions. If error handling specifies Rollback Only,no further action is taken beyond rolling back to the original message prior tothe normalization attempt. For the other possible Script Execution ErrorRecovery Action settings, the action specified occurs after the message restoresto the original contents.
MessageRollback
This counter indicates the number of times that the script adds a content bodyto the message. Assuming your message variable name is “msg”, if you areusing the msg:addContentBody API in the script, this counter increases eachtime this API successfully executes. If the counter behavior is unexpected,examine the script logic for errors.
msgAddContentBody
This counter indicates the number of times that the script adds a SIP headerto the message. Assuming your message variable name is “msg”, if you areusing the msg:addHeader API in the script, this counter increases each timethis API executes successfully. If the counter behavior is unexpected, examinethe script logic for errors.
msgAddHeader
This counter indicates the number of times that the script adds a SIP headerURI parameter to a SIP header in themessage. Assuming yourmessage variablename is “msg”, if you are using the msg:addHeaderUriParameter API in thescript, this counter increases each time this API successfully executes. If thecounter behavior is unexpected, examine the script logic for errors.
msgAddHeaderUriParameter
This counter indicates the number of times that the script adds a SIP headervalue parameter to a SIP header in the message. Assuming your messagevariable name is “msg”, if you are using the msg:addHeaderValueParameterAPI in the script, this counter increases each time this API successfullyexecutes. If the counter behavior is unexpected, examine the script logic forerrors.
msgAddHeaderValueParameter
Cisco Unified Real-Time Monitoring Tool Administration Guide, Release 11.0(1)236
Performance Counters and AlertsCisco SIP Line Normalization

DescriptionDisplay Names
This counter indicates the number of times that the script applies a numbermask to a SIP header in the message. Assuming your message variable nameis “msg”, if you are using the msg:applyNumberMask API in the script, thiscounter increases each time this API successfully executes. If the counterbehavior is unexpected, examine the script logic for errors.
msgApplyNumberMask
This counter indicates the number of times that the script blocks a message.Assuming your message variable name is “msg”, if you are using the msg:blockAPI in the script, this counter increases each time this API successfullyexecutes. If the counter behavior is unexpected, examine the script logic forerrors.
msgBlock
This counter indicates the number of times that the script converts Diversionheaders into History-Info headers in the message. Assuming your messagevariable name is “msg”, if you are using the msg:convertDiversionToHI APIin the script, this counter increases each time this API successfully executes.If the counter behavior is unexpected, examine the script logic for errors.
msgConvertDiversiontoHl
This counter indicates the number of times that the script converts History-Infoheaders into Diversion headers in the message. Assuming your messagevariable name is “msg”, if you are using the msg:convertHIToDiversion APIin the script, this counter increases each time this API successfully executes.If the counter behavior is unexpected, examine the script logic for errors.
msgConvertHlToDiverion
This counter indicates the number of times that the script modifies a SIP headerin the message. Assuming your message variable name is “msg”, if you areusing the msg:modifyHeader API in the script, this counter increases eachtime this API successfully executes. If the counter behavior is unexpected,examine the script logic for errors.
msgModifyHeader
This counter indicates the number of times that the script removes a contentbody from the message. Assuming your message variable name is “msg”, ifyou are using the msg:removeContentBody API in the script, this counterincreases each time this API successfully executed. If the counter behavior isunexpected, examine the script logic for errors.
msgRemoveContentBody
This counter indicates the number of times that the script removes a SIP headerfrom the message. Assuming your message variable name is “msg”, if you areusing the msg:removeHeader API in the script, this counter increases eachtime this API is successfully executed. If the counter behavior is unexpected,examine the script logic for errors.
msgRemoveHeader
This counter indicates the number of times that the script removes a SIP headervalue from the message. Assuming your message variable name is “msg”, ifyou are using the msg:removeHeaderValue API in the script, this counterincreases each time this API successfully executes. If the counter behavior isunexpected, examine the script logic for errors.
msgRemoveHeaderValue
Cisco Unified Real-Time Monitoring Tool Administration Guide, Release 11.0(1) 237
Performance Counters and AlertsCisco SIP Line Normalization

DescriptionDisplay Names
This counter indicates the number of times that the script removes SDP bodyfrom an unreliable 18x SIP message. Assuming your message variable nameis “msg”, if you are using the msg:removeUnreliableSDP API in the script,this counter increases each time this API successfully executes. If the counterbehavior is unexpected, examine the script logic for errors.
msgRemoveUnreliableSdp
This counter indicates the number of times that the script modifies the requestURI in the message. Assuming your message variable name is “msg”, if youare using the msg:setRequestUri API in the script, this counter increases eachtime this API successfully executes. If the counter behavior is unexpected,examine the script logic for errors.
msgSetRequestUri
This counter indicates the number of times that the script modifies the responsecode or response phrase in the message. Assuming your message variablename is “msg”, if you are using the msg:setResponseCode API in the script,this counter increases each time this API successfully executes. If the counterbehavior is unexpected, examine the script logic for errors.
msgSetResponseCode
This counter indicates the number of times that the script sets the SDP in themessage. Assuming your message variable name is “msg”, if you are usingthe msg:setSdp API in the script, this counter increases each time this APIsuccessfully executes. If the counter behavior is unexpected, examine the scriptlogic for errors.
msgSetSdp
This counter indicates the number of times that the script adds a content bodyto the PassThrough object. Assuming your PassThrough object name is “pt”,if you are using the pt:addContentBodyAPI in the script, this counter increaseseach time this API successfully executes. If the counter behavior is unexpected,examine the script logic for errors.
ptAddContentBody
This counter indicates the number of times that the script adds a SIP headerto the PassThrough object. Assuming your PassThrough object name is “pt”,if you are using the pt:addHeader API in the script, this counter increases eachtime this API successfully executes. If the counter behavior is unexpected,examine the script logic for errors.
ptAddHeader
This counter indicates the number of times that the script adds a SIP headerURI parameter to the PassThrough object. Assuming your PassThrough objectname is “pt”, if you are using the pt:addHeaderUriParameter API in the script,this counter increases each time this API successfully executes. If the counterbehavior is unexpected, examine the script logic for errors.
ptAddHeaderUriParameter
This counter indicates the number of times that the script adds a SIP headervalue parameter to the PassThrough object. Assuming your PassThroughobject name is “pt”, if you are using the pt:addHeaderValueParameter API inthe script, this counter increases each time this API successfully executes. Ifthe counter behavior is unexpected, examine the script logic for errors.
ptAddHeaderValueParameter
Cisco Unified Real-Time Monitoring Tool Administration Guide, Release 11.0(1)238
Performance Counters and AlertsCisco SIP Line Normalization

DescriptionDisplay Names
This counter indicates the number of times that the script adds a request URIparameter to the PassThrough object. Assuming your PassThrough objectname is “pt”, if you are using the pt:addRequestUriParameter API in the script,this counter increases each time this API successfully executes. If the counterbehavior is unexpected, examine the script logic for errors.
ptAddRequestUriParameter
This counter indicates whether the script is currently active (running on SIPphones). A value of 0 indicates that the script is closed (disabled). A value of1 indicates that the script is open and operational.To open the script that should be running, check for any alarms that mightindicate why the script is not open, correct any errors, upload a new script ifnecessary, and reset the script.
ScriptActive
This counter indicates the number of times that Unified CommunicationsManager closes the script. When the script closes on one SIP phone, it canstill be enabled on other SIP phones. Unified CommunicationsManager closesthe script because the last SIP phone using this script was either reset manually,reset automatically (due to an error), or deleted. This count restarts when thescript resets following a change to the script configuration and when CiscoCallManager restarts.
ScriptClosed
This counter indicates the number of times that the system automaticallydisables the script. The values that are specified in the Execution ErrorRecovery Action or System Resource Error Recovery Action field in the SIPNormalization Script Configurationwindow in CiscoUnified CommunicationsManager Administration determine whether the script is disabled. Automaticscript disable occurs if either of these fields are set to Disable Script. The scriptalso gets disabled as a result of script error conditions that are encounteredduring loading and initialization.
This counter provides a count from the most recent manual device reset thatinvolves a script configuration change (a device reset alone does not restartthe count; the script must also have changed before the reset occurs). Thecounter increments each timeUnified CommunicationsManager automaticallydisables a script due because of script errors.
If the number in this counter is higher than expected, perform the followingsteps:
• Check for a SIPNormalizationScriptError alarm andSIPNormalizationAutoResetDisabled alarm.
• Check for any resource-related alarms and counters in RTMT todetermine whether a resource issue is occurring.
• Check for any unexpected SIP normalization events in the SDI tracefiles.
ScriptDisabledAutomatically
Cisco Unified Real-Time Monitoring Tool Administration Guide, Release 11.0(1) 239
Performance Counters and AlertsCisco SIP Line Normalization

DescriptionDisplay Names
This counter indicates the number of times that Unified CommunicationsManager attempts to open the script. For the script to open, it must load intomemory in Unified Communications Manager, initialize, and be operational.A number greater than 1 in this counter means that Unified CommunicationsManager has made more than one attempt to open this script either for anexpected reason or due to an error during loading or initialization. The errorcan occur due to execution errors or resource errors or invalid syntax in thescript. Expect this counter to be greater than 1 if the ScriptResetAutomaticallycounter increments.
If the number in this counter is higher than expected, perform the followingsteps:
• Check for alarms such as the SIPNormalizationScriptClosed,SIPNormalizationScriptError, or SIPNormalizationResourceWarning.
• Check resource-related alarms and counters in RTMT to determinewhether a resource issue is occurring.
• Check for any unexpected SIP normalization events in the SDI tracefiles.
This count restarts when the script resets after a script configuration changeand when Unified Communications Manager restarts.
ScriptOpened
This counter indicates the number of times that the system automatically resetsthe script. The script resets based on the values that are specified in the ScriptExecution Error Recovery Action and SystemResource Error Recovery Actionfields in the SIP Normalization Script Configuration window in Cisco UnifiedCommunications Manager Administration. Automatic resets can occur if thevalue in either of these fields is Reset Script.
This counter specifies the number of times that the system automatically resetsthe script following the last time the script is reset after a change to the scriptconfiguration. The counter increments each time Unified CommunicationsManager automatically resets a script because of script errors.
If the number in this counter is higher than expected, perform the followingsteps:
• Check for a SIPNormalizationScriptError alarm.
• Check for any resource-related alarms and counters in RTMT todetermine whether a resource issue is occurring.
• Check for any unexpected SIP normalization events in the SDI tracefiles.
ScriptResetAutomatically
This counter indicates the number of times that the script manually resets inCisco Unified CommunicationsManager Administration or by other methods,such as AXL, or a reset on the last SIP phone that used the script. This counterincrements when a script is reset due to configuration changes. This counterrestarts when the script is deleted, or when Cisco CallManager restarts.
ScriptResetManually
Cisco Unified Real-Time Monitoring Tool Administration Guide, Release 11.0(1)240
Performance Counters and AlertsCisco SIP Line Normalization

Cisco SIP NormalizationThe Cisco SIP Normalization performance object contains counters that allow you to monitor aspects of thenormalization script, including initialization errors, runtime errors, and script status. Each device that has anassociated script causes a new instance of these counters to be created. The following table contains UnifiedCommunications Manager the Cisco SIP Normalization counters.
Table 71: Cisco SIP Normalization
DescriptionDisplay Name
This counter indicates the number of times that Cisco UnifiedCommunicationsManager automatically resets the device (SIP trunk). Thedevice reset is based on the values that are specified in the Script ExecutionError Recovery Action and SystemResource Error Recovery Action fieldson the SIP Normalization Script Configuration window in Cisco UnifiedCommunications Manager Administration. When the device (SIP trunk)is reset due to script errors, the counter value increments. This count restartswhen the device is reset manually.
DeviceResetAutomatically
This counter indicates the number of times that the device (SIP trunk) isreset manually in Cisco Unified CommunicationsManager Administrationor by other methods, such as AXL. When the device associated with ascript is reset due to configuration changes, the counter value increments.
The counter restarts in the following situations:
• The SIP trunk is deleted.
• The script on the trunk gets changed or deleted.
• Cisco Unified Communications Manager restarts.
DeviceResetManually
Cisco Unified Real-Time Monitoring Tool Administration Guide, Release 11.0(1) 241
Performance Counters and AlertsCisco SIP Normalization

DescriptionDisplay Name
This counter represents the number of execution errors that occurred whilethe script executed. Execution errors can occur while a message handlerexecutes. Execution errors can be caused by resource errors, an argumentmismatch in a function call, and so on.
When an execution error occurs, Unified Communications Managerperforms the following actions:
• Automatically restores the message to the original content beforeapplying additional error handling actions.
• Increments the value of the counter.
• Takes appropriate action based on the configuration of the ScriptExecution Error Recovery Action and System Resource ErrorRecovery Action fields in Cisco Unified Communications ManagerAdministration.
Check the SIPNormalizationScriptError alarm for details, including theline number in the script that failed. Correct the script problem, upload thecorrected script as needed, and reset the trunk. This counter incrementsevery time an execution error occurs. This counter provides a count fromthe most recent trunk reset that involved a script configuration change. (Adevice reset alone does not restart the count; the script configuration mustalso change before the reset occurs.)
If the counter continues to increment after you fix the script problem,examine the script again.
ErrorExecution
This counter represents the number of times a script error occurred afterthe script successfully loaded into memory, but failed to initialize in UnifiedCommunications Manager. A script can fail to initialize due to resourceerrors, an argument mismatch in a function call, the expected table wasnot returned, and so on.
Check the SIPNormalizationScriptError alarm for details, including theline number in the script that failed. Correct the script problem, upload thecorrected script as needed, and reset the trunk. This counter incrementsevery time an initialization error occurs. This counter provides a countfrom the most recent trunk reset that was accompanied by a scriptconfiguration change. (A device reset alone does not restart the count; thescript configurationmust also change before the reset occurs.) If the countercontinues to increment after you fix the script problem, examine the scriptagain.When the error occurs during initialization, Unified CommunicationsManager automatically disables the script.
ErrorInit
This counter indicates the number of internal errors that occurred whilethe script executed. Internal errors are very rare. If the value in this counteris higher than zero, a defect exists in the system that is not related to thescript content or execution. Collect SDI traces and contact the TechnicalAssistance Center (TAC).
ErrorInternal
Cisco Unified Real-Time Monitoring Tool Administration Guide, Release 11.0(1)242
Performance Counters and AlertsCisco SIP Normalization

DescriptionDisplay Name
This counter represents the number of times a script error occurred whenthe script loaded into memory in Cisco Unified CommunicationsManager.A script can fail to load due to memory issues or syntax errors.
Check the SIPNormalizationScriptError alarm for details. Check the scriptsyntax for errors, upload the corrected script as needed, and reset the trunk.This counter increments every time a load error occurs. This counterprovides a count from the most recent trunk reset that was accompaniedby a script configuration change. (A device reset alone will not restart thecount; the script configuration must also change before the reset occurs.)If the counter continues to increment even after you fix the script problem,examine the script again.
ErrorLoad
This counter indicates whether the script encountered a resource error.
Two kinds of resource errors exist: exceeding the value in the MemoryThreshold field and exceeding the value in the Lua Instruction Thresholdfield. (Both fields display on the SIP Normalization Script Configurationwindow in Cisco Unified Communications Manager Administration.) Ifeither condition occurs, Cisco Unified Communications Managerimmediately closes the script and issues the SIPNormalizationScriptErroralarm.
If a resource error occurs while the script loads or initializes, the script isdisabled. If a resource error occurs during execution, the configured systemresource error recovery action is taken. (The setting of the SystemResourceError Recovery Action field on the SIP Normalization Script Configurationwindow in CiscoUnified CommunicationsManager Administration definesthis action.)
ErrorResource
This counter specifies the amount of memory, in bytes, that the scriptconsumes. This counter increases and decreases to match the amount ofmemory that the script uses. This count gets cleared when the script closes(because a closed script does not consume memory) and restarts when thescript opens (gets enabled). A high number in this counter indicates aresource problem. Check the MemoryUsagePercentage counter and theSIPNormalizationResourceWarning alarm, which occur when the resourceconsumption exceeds an internally set threshold.
MemoryUsage
This counter specifies the percentage of the total amount of memory thatthe script consumes.
The value in this counter is derived by dividing the value in theMemoryUsage counter by the value in the Memory Threshold field (in theSIP Normalization Script Configuration window) andmultiplying the resultby 100 to arrive at a percentage.
This counter increases and decreases in accordance with theMemoryUsagecounter. This count gets cleared when the script closes (because closedscripts do not consume memory) and restarts when the script opens (getsenabled). When this counter reaches the internally controlled resourcethreshold, the SIPNormalizationResourceWarning alarm is issued.
MemoryUsagePercentage
Cisco Unified Real-Time Monitoring Tool Administration Guide, Release 11.0(1) 243
Performance Counters and AlertsCisco SIP Normalization

DescriptionDisplay Name
This counter indicates the number of times that the system automaticallyrolled back a message. The system rolls back the message by using theerror handling that is specified in the Script Execution Error RecoveryAction field in the SIP Normalization Script Configuration window inCisco Cisco Unified Communications Manager Administration.
When an execution error occurs, Unified Communications Managerautomatically restores the message to the original content before applyingadditional error handling actions. If error handling specifies Rollback only,no further action is taken beyond rolling back to the original message beforethe normalization attempt. For the other possible Script Execution ErrorRecovery Actions, message rollback always occurs first, followed by thespecified action, such as disabling the script, resetting the scriptautomatically, or resetting the trunk automatically.
MessageRollback
This counter represents the number of times that the script added a contentbody to the message. If you are using the msg:addContentBody API in thescript, this counter increases each time that the msg:addContentBody APIexecutes successfully. If the counter behavior is not as expected, examinethe script logic for errors.
msgAddContentBody
This counter represents the number of times that the script added a SIPheader to the message. If you are using the msg:addHeader API in thescript, this counter increases each time that themsg:addHeader API executessuccessfully. If the counter behavior is not as expected, examine the scriptlogic for errors.
msgAddHeader
This counter represents the number of times that the script added a SIPheader URI parameter to a SIP header in the message. If you are using themsg:addHeaderUriParameter API in the script, this counter increases eachtime that the msg:addHeaderUriParameter API executes successfully. Ifthe counter behavior is not as expected, examine the script logic for errors.
msgAddHeaderUriParameter
This counter represents the number of times that the script added a SIPheader value parameter to a SIP header in the message. If you are usingthe msg:addHeaderValueParameter API in the script, this counter increaseseach time that the msg:addHeaderValueParameter API executessuccessfully. If the counter behavior is not as expected, examine the scriptlogic for errors.
msgAddHeaderValueParameter
This counter represents the number of times that the script applied a numbermask to a SIP header in the message. If you are using themsg:applyNumberMask API in the script, this counter increases each timethat the msg:applyNumberMask API executes successfully. If the counterbehavior is not as expected, examine the script logic for errors.
msgApplyNumberMask
Cisco Unified Real-Time Monitoring Tool Administration Guide, Release 11.0(1)244
Performance Counters and AlertsCisco SIP Normalization

DescriptionDisplay Name
This counter represents the number of times that the script blocked amessage. If you are using the msg:block API in the script, this counterincreases each time that the msg:block API executes successfully. If thecounter behavior is not as expected, examine the script logic for errors.
msgBlock
This counter represents the number of times that the script convertedDiversion headers into History-Info headers in the message. If you areusing the msg:convertDiversionToHI API in the script, this counterincreases each time that the msg:convertDiversionToHI API executessuccessfully. If the counter behavior is not as expected, examine the scriptlogic for errors.
msgConvertDiversionToHI
This counter represents the number of times that the script convertedDiversion headers into History-Info headers in the message. If you areusing the msg:convertDiversionToHI API in the script, this counterincreases each time that the msg:convertDiversionToHI API executessuccessfully. If the counter behavior is not as expected, examine the scriptlogic for errors.
msgConvertHIToDiversion
This counter represents the number of times that the script modified a SIPheader in the message. If you are using the msg:modifyHeader API in thescript, this counter increases each time that the msg:modifyHeader APIexecutes successfully. If the counter behavior is not as expected, examinethe script logic for errors.
msgModifyHeader
This counter represents the number of times that the script removed acontent body from the message. If you are using themsg:removeContentBody API in the script, this counter increases eachtime that the msg:removeContentBody API executes successfully. If thecounter behavior is not as expected, examine the script logic for errors.
msgRemoveContentBody
This counter represents the number of times that the script removed a SIPheader from the message. If you are using the msg:removeHeader API inthe script, this counter increases each time that the msg:removeHeader APIexecutes successfully. If the counter behavior is not as expected, examinethe script logic for errors.
msgRemoveHeader
This counter represents the number of times that the script removed a SIPheader value from the message. If you are using themsg:removeHeaderValue API in the script, this counter increases eachtime that the msg:removeHeaderValue API executes successfully. If thecounter behavior is not as expected, examine the script logic for errors.
msgRemoveHeaderValue
This counter represents the number of times that the script modified therequest URI in the message. If you are using the msg:setRequestUri APIin the script, this counter increases each time that the msg:setRequestUriAPI executes successfully. If the counter behavior is not as expected,examine the script logic for errors.
msgSetRequestUri
Cisco Unified Real-Time Monitoring Tool Administration Guide, Release 11.0(1) 245
Performance Counters and AlertsCisco SIP Normalization

DescriptionDisplay Name
This counter represents the number of times that the script modified theresponse code and/or response phrase in the message. If you are using themsg:setResponseCode API in the script, this counter increases each timethat the msg:setResponseCode API executes successfully. If the counterbehavior is not as expected, examine the script logic for errors.
msgSetResponseCode
This counter represents the number of times that the script set the SDP inthe message. If you are using the msg:setSdp API in the script, this counterincreases each time that the msg:setSdp API executes successfully. If thecounter behavior is not as expected, examine the script logic for errors.
msgSetSdp
This counter represents the number of times that the script added a contentbody to the PassThrough (pt) object. If you are using the pt:addContentBodyAPI in the script, this counter increases each time that thept:addContentBody API executes successfully. If the counter behavior isnot as expected, examine the script logic for errors.
ptAddContentBody
This counter represents the number of times that the script added a SIPheader to the PassThrough (pt) object. If you are using the pt:addHeaderAPI in the script, this counter increases each time that the pt:addHeaderAPI executes successfully. If the counter behavior is not as expected,examine the script logic for errors.
ptAddHeader
This counter represents the number of times that the script added a SIPheader URI parameter to the PassThrough (pt) object. If you are using thept:addHeaderUriParameter API in the script, this counter increases eachtime that the pt:addHeaderUriParameter API executes successfully. If thecounter behavior is not as expected, examine the script logic for errors.
ptAddHeaderUriParameter
This counter represents the number of times that the script added a SIPheader value parameter to the PassThrough (pt) object. If you are usingthe pt:addHeaderValueParameter API in the script, this counter increaseseach time that the pt:addHeaderValueParameter API executes successfully.If the counter behavior is not as expected, examine the script logic forerrors.
ptAddHeaderValueParameter
This counter represents the number of times that the script added a requestURI parameter to the PassThrough (pt) object. If you are using thept:addRequestUriParameter API in the script, this counter increases eachtime that the pt:addRequestUriParameter API executes successfully. If thecounter behavior is not as expected, examine the script logic for errors.
ptAddRequestUriParameter
Cisco Unified Real-Time Monitoring Tool Administration Guide, Release 11.0(1)246
Performance Counters and AlertsCisco SIP Normalization

DescriptionDisplay Name
This counter indicates whether the script is currently active (running onthe trunk). The following values display for the counter:
• 0—Indicates that the script is closed (disabled).
• 1—Indicates that the script is open and operational.
To open the script that should be running on this trunk, perform thefollowing actions:
1 Check for any alarms that might indicate why the script is not open.
2 Correct any errors.
3 Upload a new script if necessary.
4 Reset the trunk.
ScriptActive
This counter indicates the number of times that Cisco UnifiedCommunications Manager has closed the script.
When the script is closed, it is not enabled on this device.
Unified Communications Manager closes the script under one of thefollowing conditions:
• The device was reset manually.
• The device was reset automatically (due to an error).
• The device was deleted.
This count restarts when the SIP trunk is reset after a change to the scriptconfiguration and when Unified Communications Manager restarts.
ScriptClosed
Cisco Unified Real-Time Monitoring Tool Administration Guide, Release 11.0(1) 247
Performance Counters and AlertsCisco SIP Normalization

DescriptionDisplay Name
This counter indicates the number of times that the system automaticallydisabled the script. The values that are specified in the Script ExecutionError Recovery Action and SystemResource Error Recovery Action fieldsin the SIP Normalization Script Configuration window in Cisco CiscoUnified Communications Manager Administration determine whether thescript is disabled. The script also gets disabled as a result of script errorconditions that are encountered during loading and initialization. Thiscounter provides a count from the most recent manual device reset thatinvolved a script configuration change (a device reset alone does not restartthe count; the script must also have changed before the reset occurs). Thiscounter increments every time Unified Communications Managerautomatically disables a script due to script errors.
If the number in this counter is higher than expected, perform the followingactions:
• Check for SIPNormalizationScriptError alarm andSIPNormalizationAutoResetDisabled alarm.
• Check for any resource-related alarms and counters in RTMT todetermine whether a resource issue is occurring.
• Check for any unexpected SIP normalization events in the SDI tracefiles.
ScriptDisabledAutomatically
This counter indicates the number of times that the Unified CommunicationsManager attempted to open the script. For the a script to open, it must loadinto memory in Unified Communications Manager, initialize, and beoperational. A number greater than one in this counter means that UnifiedCommunications Manager has made more than one attempt to open thescript on this SIP trunk, either for an expected reason or due to an errorduring loading or initialization. The error can occur due to execution errorsor resource errors or invalid syntax in the script. Expect this counter to begreater than one if any of these counters increment: DeviceResetManually,DeviceResetAutomatically, or ScriptResetAutomatically. TheDeviceResetManually counter increments when an expected event, suchas a maintenance window on the SIP trunk, causes the script to close.
If the number in this counter is high for an unexpected reason, perform thefollowing actions:
• Check for alarms, such as the SIPNormalizationScriptClosed,SIPNormalizationScriptError, or SIPNormalizationResourceWarning.
• Check resource-related alarms and counters in RTMT to determinewhether a resource issue is occurring.
• Check for any unexpected SIP normalization events in the SDI tracefiles.
This count restarts when the SIP trunk resets after a script configurationchange and when Unified Communications Manager restarts.
ScriptOpened
Cisco Unified Real-Time Monitoring Tool Administration Guide, Release 11.0(1)248
Performance Counters and AlertsCisco SIP Normalization

DescriptionDisplay Name
This counter indicates the number of times that the system automaticallyreset the script. The script resets based on the values that are specified inthe Script Execution Error Recovery Action and System Resource ErrorRecovery Action fields in the SIP Normalization Script Configurationwindow in Cisco Cisco Unified CommunicationsManager Administration.This counter specifies a count of the number of automatic script resets afterthe last manual device reset; this counter increments every time the UnifiedCommunicationsManager automatically resets a script due to script errors.
If the number in this counter is higher than expected, perform the followingactions:
• Check for a SIPNormalizationScriptError alarm.
• Check for any resource-related alarms and counters in RTMT todetermine whether a resource issue is occurring.
• Check for any unexpected SIP normalization events in the SDI tracefiles.
ScriptResetAutomatically
Cisco SIP StackThe Cisco SIP Stack object provides information about Session Initiation Protocol (SIP) stack statistics thatare generated or used by SIP devices such as SIP Proxy, SIP Redirect Server, SIP Registrar, and SIP UserAgent. The following table contains information on Cisco SIP Stack counters.
Table 72: Cisco SIP Stack
Counter DescriptionCounters
This counter represents the total number of ACK requests that the SIPdevice received.
AckIns
This counter represents the total number of ACK requests that the SIPdevice sent.
AckOuts
This counter represents the total number of BYE requests that the SIPdevice received. This number includes retransmission.
ByeIns
This counter represents the total number of BYE requests that the SIPdevice sent. This number includes retransmission.
ByeOuts
This counter represents the total number of CANCEL requests that theSIP device received. This number includes retransmission.
CancelIns
This counter represents the total number of CANCEL requests that theSIP device sent. This number includes retransmission.
CancelOuts
Cisco Unified Real-Time Monitoring Tool Administration Guide, Release 11.0(1) 249
Performance Counters and AlertsCisco SIP Stack

Counter DescriptionCounters
This counter represents the number of Call Control Blocks (CCB) thatare currently in use by the SIP stack. Each active SIP dialog uses oneCCB.
CCBsAllocated
This counter represents the total number of 6xx class SIP responsesthat the SIP device has received. This number includes retransmission.This class of responses indicates that a SIP device, that is providing aclient function, received a failure response message. Generally, theresponses indicate that a server had definitive information on aparticular called party and not just the particular instance in theRequest-URI.
GlobalFailedClassIns
This counter represents the total number of 6xx class SIP responsesthat the SIP device sent. This number includes retransmission. Thisclass of responses indicates that a SIP device, that is providing a serverfunction, received a failure response message. Generally, the responsesindicate that a server had definitive information on a particular calledparty and not just the particular instance in the Request-URI.
GlobalFailedClassOuts
This counter represents the total number of 1xx class SIP responsesthat the SIP device received. This includes retransmission. This classof responses provides information on the progress of a SIP request.
InfoClassIns
This counter represents the total number of 1xx class SIP responsesthat the SIP device sent. This includes retransmission. This class ofresponses provides information on the progress of processing a SIPrequest.
InfoClassOuts
This counter represents the total number of INFO requests that the SIPdevice has received. This number includes retransmission.
InfoIns
This counter represents the total number of INFO requests that the SIPdevice has sent. This number includes retransmission.
InfoOuts
This counter represents the total number of INVITE requests that theSIP device received. This number includes retransmission.
InviteIns
This counter represents the total number of INVITE requests that theSIP device has sent. This number includes retransmission.
InviteOuts
This counter represents the total number of NOTIFY requests that theSIP device has received. This number includes retransmission.
NotifyIns
This counter represents the total number of NOTIFY requests that theSIP device has sent. This number includes retransmission.
NotifyOuts
This counter represents the total number of OPTIONS requests thatthe SIP device received. This number includes retransmission.
OptionsIns
Cisco Unified Real-Time Monitoring Tool Administration Guide, Release 11.0(1)250
Performance Counters and AlertsCisco SIP Stack

Counter DescriptionCounters
This counter represents the total number of OPTIONS requests thatthe SIP device has sent. This number includes retransmission.
OptionsOuts
This counter represents the total number of PRACK requests that theSIP device has received. This number includes retransmission.
PRAckIns
This counter represents the total number of PRACK requests that theSIP device has sent. This number includes retransmission.
PRAckOuts
This counter represents the total number of PUBLISH requests thatthe SIP device received. This number includes retransmissions.
PublishIns
This counter represents the total number of PUBLISH requests thatthe SIP device has sent. This number includes retransmission
PublishOuts
This counter represents the total number of 3xx class SIP responsesthat the SIP device has received. This number includes retransmission.This class of responses provides information about redirections toaddresses where the callee may be reachable.
RedirClassIns
This counter represents the total number of 3xx class SIP responsesthat the SIP device has sent. This number includes retransmission. Thisclass of responses provides information about redirections to addresseswhere the callee may be reachable.
RedirClassOuts
This counter represents the total number of REFER requests that theSIP device has received. This number includes retransmission.
ReferIns
This counter represents the total number of REFER requests that theSIP device has sent. This number includes retransmission.
ReferOuts
This counter represents the total number of REGISTER requests thatthe SIP device has received. This number includes retransmission.
RegisterIns
This counter represents the total number of REGISTER requests thatthe SIP device has sent. This number includes retransmission.
RegisterOuts
This counter represents the total number of 4xx class SIP responsesthat the SIP device has received. This number includes retransmission.This class of responses indicates a request failure by a SIP device thatis providing a client function.
RequestsFailedClassIns
This counter represents the total number of 4xx class SIP responsesthat the SIP device has sent. This number includes retransmission. Thisclass of responses indicates a request failure by a SIP device that isproviding a server function.
RequestsFailedClassOuts
Cisco Unified Real-Time Monitoring Tool Administration Guide, Release 11.0(1) 251
Performance Counters and AlertsCisco SIP Stack

Counter DescriptionCounters
This counter represents the total number of BYE retries that the SIPdevice has sent. To determine the number of first BYE attempts,subtract the value of this counter from the value of the sipStatsByeOutscounter.
RetryByes
This counter represents the total number of CANCEL retries that theSIP device has sent. To determine the number of first CANCELattempts, subtract the value of this counter from the value of thesipStatsCancelOuts counter.
RetryCancels
This counter represents the total number of INFO retries that the SIPdevice has sent. To determine the number of first INFO attempts,subtract the value of this counter from the value of the sipStatsInfoOutscounter.
RetryInfo
This counter represents the total number of INVITE retries that theSIP device has sent. To determine the number of first INVITE attempts,subtract the value of this counter from the value of thesipStatsInviteOuts counter.
RetryInvites
This counter represents the total number of NOTIFY retries that theSIP device has sent. To determine the number of first NOTIFYattempts, subtract the value of this counter from the value of thesipStatsNotifyOuts counter.
RetryNotify
This counter represents the total number of PRACK retries that theSIP device has sent. To determine the number of first PRACK attempts,subtract the value of this counter from the value of thesipStatsPRAckOuts counter.
RetryPRAck
This counter represents the total number of PUBLISH retries that theSIP device has been sent. To determine the number of first PUBLISHsattempts, subtract the value of this counter from the value of thesipStatsPublishOuts counter.
RetryPublish
This counter represents the total number of REFER retries that the SIPdevice has sent. To determine the number of first REFER attempts,subtract the value of this counter from the value of thesipStatsReferOuts counter.
RetryRefer
This counter represents the total number of REGISTER retries that theSIP device has sent. To determine the number of first REGISTERattempts, subtract the value of this counter from the value of thesipStatsRegisterOuts counter.
RetryRegisters
This counter represents the total number of Reliable 1xx retries thatthe SIP device has sent.
RetryRel1xx
Cisco Unified Real-Time Monitoring Tool Administration Guide, Release 11.0(1)252
Performance Counters and AlertsCisco SIP Stack

Counter DescriptionCounters
This counter represents the total number of Request retries that the SIPdevice has sent.
RetryRequestsOut
This counter represents the total number of Final Response retries thatthe SIP device has sent.
RetryResponsesFinal
This counter represents the total number of non-Final Response retriesthat the SIP device has sent.
RetryResponsesNonFinal
This counter represents the total number of SUBSCRIBE retries thatthe SIP device has sent. To determine the number of first SUBSCRIBEattempts, subtract the value of this counter from the value of thesipStatsSubscribeOuts counter.
RetrySubscribe
This counter represents the total number of UPDATE retries that theSIP device has sent. To determine the number of first UPDATEattempts, subtract the value of this counter from the value of thesipStatsUpdateOuts counter.
RetryUpdate
This counter represents the number of Subscription Control Blocks(SCB) that are currently in use by the SIP stack. Each subscriptionuses one SCB.
SCBsAllocated
This counter represents the total number of 5xx class SIP responsesthat the SIP device has received. This number includes retransmission.This class of responses indicates that failure responses were receivedby a SIP device that is providing a client function.
ServerFailedClassIns
This counter represents the total number of 5xx class SIP responsesthat the SIP device has sent. This number includes retransmission. Thisclass of responses indicates that failure responses were received by aSIP device that is providing a server function.
ServerFailedClassOuts
Do not use this counter unless directed to do so by a Cisco EngineeringSpecial build. Cisco uses information in this counter for diagnosticpurposes.
SIPGenericCounter1
Do not use this counter unless directed to do so by a Cisco EngineeringSpecial build. Cisco uses information in this counter for diagnosticpurposes.
SIPGenericCounter2
Do not use this counter unless directed to do so by a Cisco EngineeringSpecial build. Cisco uses information in this counter for diagnosticpurposes.
SIPGenericCounter3
Do not use this counter unless directed to do so by a Cisco EngineeringSpecial build. Cisco uses information in this counter for diagnosticpurposes.
SIPGenericCounter4
Cisco Unified Real-Time Monitoring Tool Administration Guide, Release 11.0(1) 253
Performance Counters and AlertsCisco SIP Stack

Counter DescriptionCounters
This counter represents the number of SDL signals that are currentlyon the four SDL priority queues of the SIPHandler component. TheSIPHandler component contains the SIP stack.
SIPHandlerSDLQueueSignalsPresent
This counter represents the total number of 1xx response messages,including retransmission, that the SIP device has received. This countincludes the following 1xx responses:
• 100 Trying
• 180 Ringing
• 181 Call is being forwarded
• 182 Queued
• 183 Session Progress
StatusCode1xxIns
This counter represents the total number of 1xx response messages,including retransmission, that the SIP device has sent. This countincludes the following 1xx responses:
• 100 Trying
• 180 Ringing
• 181 Call is being forwarded
• 182 Queued
• 183 Session Progress
StatusCode1xxOuts
This counter represents the total number of 2xx response messages,including retransmission, that the SIP device has received. This countincludes the following 2xx responses:
• 200 OK
• 202 Success Accepted
StatusCode2xxIns
This counter represents the total number of 2xx response messages,including retransmission, that the SIP device has sent. This countincludes the following 2xx responses:
• 200 OK
• 202 Success Accepted
StatusCode2xxOuts
Cisco Unified Real-Time Monitoring Tool Administration Guide, Release 11.0(1)254
Performance Counters and AlertsCisco SIP Stack
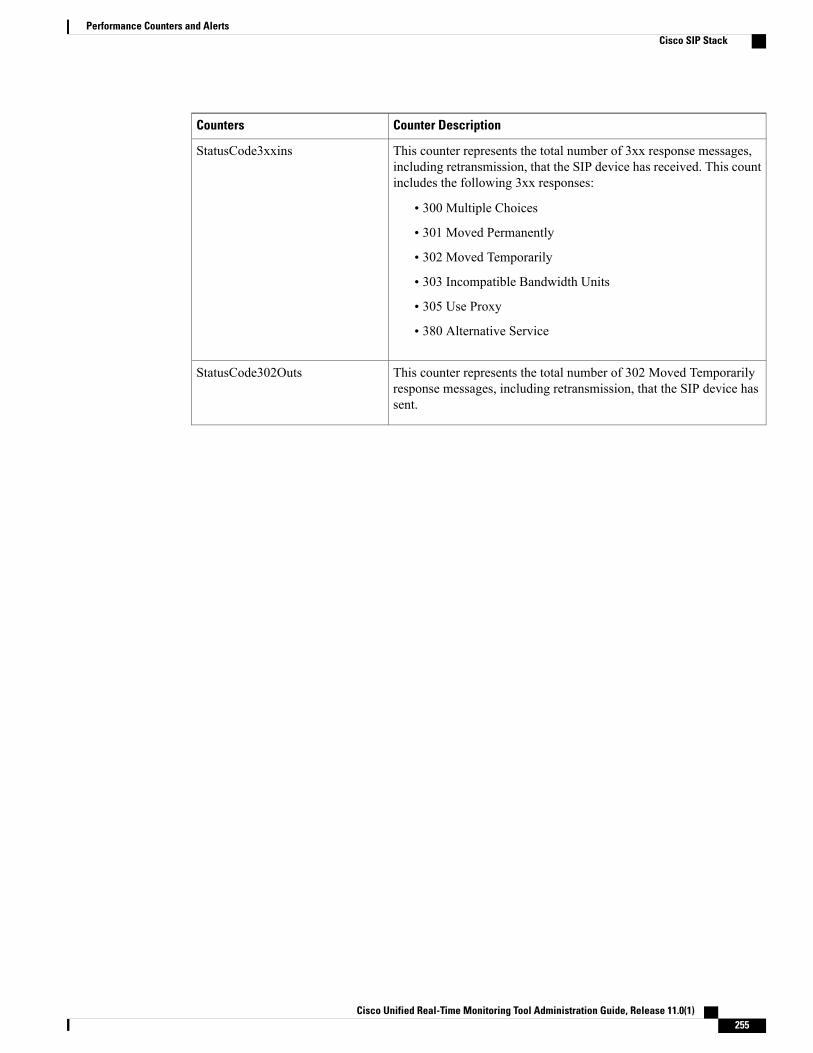
Counter DescriptionCounters
This counter represents the total number of 3xx response messages,including retransmission, that the SIP device has received. This countincludes the following 3xx responses:
• 300 Multiple Choices
• 301 Moved Permanently
• 302 Moved Temporarily
• 303 Incompatible Bandwidth Units
• 305 Use Proxy
• 380 Alternative Service
StatusCode3xxins
This counter represents the total number of 302 Moved Temporarilyresponse messages, including retransmission, that the SIP device hassent.
StatusCode302Outs
Cisco Unified Real-Time Monitoring Tool Administration Guide, Release 11.0(1) 255
Performance Counters and AlertsCisco SIP Stack

Counter DescriptionCounters
This counter represents the total number of 4xx response messages,including retransmission, that the SIP device has received. This countincludes the following 4xx responses:
• 400 Bad Request
• 401 Unauthorized
• 402 Payment Required
• 403 Forbidden
• 404 Not Found
• 405 Method Not Allowed
• 406 Not Acceptable
• 407 Proxy Authentication Required
• 408 Request Timeout
• 409 Conflict
• 410 Gone
• 413 Request Entity Too Large
• 414 Request-URI Too Long
• 415 Unsupported Media Type
• 416 Unsupported URI Scheme
• 417 Unknown Resource Priority
• 420 Bad Extension
• 422 Session Expires Value Too Small
• 423 Interval Too Brief
• 480 Temporarily Unavailable
• 481 Call/Transaction Does Not Exist
• 482 Loop Detected
• 483 Too Many Hops
• 484 Address Incomplete
• 485 Ambiguous
• 486 Busy Here
• 487 Request Terminated
• 488 Not Acceptable Here
• 489 Bad Subscription Event
• 491 Request Pending
StatusCode4xxIns
Cisco Unified Real-Time Monitoring Tool Administration Guide, Release 11.0(1)256
Performance Counters and AlertsCisco SIP Stack

Counter DescriptionCounters
This counter represents the total number of 4xx response messages,including retransmission, that the SIP device has sent. This countincludes the following 4xx responses:
• 400 Bad Request
• 401 Unauthorized
• 402 Payment Required
• 403 Forbidden
• 404 Not Found
• 405 Method Not Allowed
• 406 Not Acceptable
• 407 Proxy Authentication Required
• 408 Request Timeout
• 409 Conflict
• 410 Gone
• 413 Request Entity Too Large
• 414 Request-URI Too Long
• 415 Unsupported Media Type
• 416 Unsupported URI Scheme
• 417 Unknown Resource Priority
• 420 Bad Extension
• 422 Session Expires Value Too Small
• 423 Interval Too Brief
• 480 Temporarily Unavailable
• 481 Call/Transaction Does Not Exist
• 482 Loop Detected
• 483 Too Many Hops
• 484 Address Incomplete
• 485 Ambiguous
• 486 Busy Here
• 487 Request Terminated
• 488 Not Acceptable Here
• 489 Bad Subscription Event
• 491 Request Pending
StatusCode4xxOuts
Cisco Unified Real-Time Monitoring Tool Administration Guide, Release 11.0(1) 257
Performance Counters and AlertsCisco SIP Stack

Counter DescriptionCounters
This counter represents the total number of 5xx response messages,including retransmission, that the SIP device has received. This countincludes the following 5xx responses:
• 500 Server Internal Error
• 501 Not Implemented
• 502 Bad Gateway
• 503 Service Unavailable
• 504 Server Timeout
• 505 Version Not Supported
• 580 Precondition Failed
StatusCode5xxIns
This counter represents the total number of 5xx response messages,including retransmission, that the SIP device has sent. This countincludes the following 5xx responses:
• 500 Server Internal Error
• 501 Not Implemented
• 502 Bad Gateway
• 503 Service Unavailable
• 504 Server Timeout
• 505 Version Not Supported
• 580 Precondition Failed
StatusCode5xxOuts
This counter represents the total number of 6xx response messages,including retransmission, that the SIP device has received. This countincludes the following 6xx responses:
• 600 Busy Everywhere
• 603 Decline
• 604 Does Not Exist Anywhere
• 606 Not Acceptable
StatusCode6xxIns
Cisco Unified Real-Time Monitoring Tool Administration Guide, Release 11.0(1)258
Performance Counters and AlertsCisco SIP Stack

Counter DescriptionCounters
This counter represents the total number of 6xx response messages,including retransmission, that the SIP device has sent. This countincludes the following 6xx responses:
• 600 Busy Everywhere
• 603 Decline
• 604 Does Not Exist Anywhere
• 606 Not Acceptable
StatusCode6xxOuts
This counter represents the total number of SUBSCRIBE requests thatthe SIP device has received. This number includes retransmission.
SubscribeIns
This counter represents the total number of SUBSCRIBE requests thatthe SIP device has sent. This number includes retransmission.
SubscribeOuts
This counter represents the total number of 2xx class SIP responsesthat the SIP device has received. This includes retransmission. Thisclass of responses provides information on the successful completionof a SIP request.
SuccessClassIns
This counter represents the total number of 2xx class SIP responsesthat the SIP device has sent. This includes retransmission. This classof responses provides information on the successful completion of aSIP request.
SuccessClassOuts
This counter represents the total number of SIP request messages thathave been received by the SIP device. This number includesretransmissions.
SummaryRequestsIn
This counter represents the total number of SIP request messages thatthe device sent. This number includes messages that originate on thedevice and messages that are being relayed by the device. When aparticular message gets sent more than once, each transmission getscounted separately; for example, a message that is re-sent as aretransmission or as a result of forking.
SummaryRequestsOut
This counter represents the total number of SIP response messages thatthe SIP device received. This number includes retransmission.
SummaryResponsesIn
This counter represents the total number of SIP response messages thatthe SIP device sent (originated and relayed). This number includesretransmission.
SummaryResponsesOut
This counter represents the total number of UPDATE requests that theSIP device has received. This number includes retransmission.
UpdateIns
Cisco Unified Real-Time Monitoring Tool Administration Guide, Release 11.0(1) 259
Performance Counters and AlertsCisco SIP Stack

Counter DescriptionCounters
This counter represents the total number of UPDATE requests that theSIP device has sent. This number includes retransmission.
UpdateOuts
Cisco SIP StationThe Cisco SIP Station object provides information about SIP line-side devices. The following table containsinformation about the Cisco SIP Station counters.
Table 73: Cisco SIP Station
Counter DescriptionCounters
This counter represents the number of times that a phone that is runningSIP was persistently unable to register due to a configuration versionmismatch between the TFTP server and CiscoUnified CommunicationsManager since the last restart of the Cisco Unified CommunicationsManager. This counter increments each time that Cisco UnifiedCommunications Manager cannot resolve the mismatch and manualintervention is required (such as a configuration update or device reset).
ConfigMismatchesPersistent
This counter represents the number of times that a phone that is runningSIP was temporarily unable to register due to a configuration versionmismatch between the TFTP server and CiscoUnified CommunicationsManager since the last restart of the Cisco CallManager Service. Thiscounter increments each time Cisco Unified CommunicationsManageris able to resolve the mismatch automatically.
ConfigMismatchesTemporary
This counter represents the number of new registrations that failedbecause a timeout occurred while the systemwas attempting to retrievethe device configuration from the database.
DBTimeouts
This counter represents the total number of new REGISTRATIONrequests that have been removed from the NewRegistration queue andprocessed since the last restart of the Cisco CallManager Service.
NewRegAccepted
This counter represents the number of REGISTRATION requests thatare currently on the NewRegistration queue. The system placesREGISTRATION requests that are received from devices that are notcurrently registered on this queue before they are processed.
NewRegQueueSize
This counter represents the total number of new REGISTRATIONrequests that were rejected with a 486 Busy Here response and notplaced on the NewRegistration queue since the last restart of the CiscoCallManager Service. The system rejects REGISTRATION requestsif the NewRegistration queue exceeds a programmed size.
NewRegRejected
Cisco Unified Real-Time Monitoring Tool Administration Guide, Release 11.0(1)260
Performance Counters and AlertsCisco SIP Station

Counter DescriptionCounters
This counter represents the total number of token requests that havebeen granted since the last Cisco Communications Manager restart.Cisco Unified Communications Manager grants tokens as long as thenumber of outstanding tokens remains below the number that isspecified in the Cisco CallManager service parameterMaximumPhoneFallback Queue Depth.
TokensAccepted
This counter represents the number of devices that have been granteda token but have not yet registered. The system requires that devicesthat are reconnecting to a higher priority CiscoUnified CommunicationsManager server be granted a token before registering. Tokens protectCisco Unified Communications Manager from being overloaded withregistration requests when it comes back online after a failover situation.
TokensOutstanding
This counter represents the total number of token requests that havebeen rejected since the last Cisco Unified Communications Managerrestart. Cisco Unified Communications Manager will reject tokenrequest if the number of outstanding tokens is greater than the numberthat is specified in the Cisco CallManager service parameterMaximumPhone Fallback Queue Depth.
TokensRejected
Cisco SW Conf Bridge DeviceThe Cisco SW Conference Bridge Device object provides information about registered Cisco softwareconference bridge devices. The following table contains information on the Cisco software conference bridgedevice counters.
Table 74: Cisco SW Conf Bridge Device
Counter DescriptionCounters
This counter represents the total number of times that an attempt wasmade to allocate a conference resource from a SW conference deviceand failed because all resources were already in use.
OutOfResources
This counter represents the number of resources that are currently inuse (active) for a SW conference device. One resource represents onestream.
ResourceActive
This counter represents the total number of resources that are not activeand are still available to be used now for a SW conference device. Oneresource represents one stream.
ResourceAvailable
Cisco Unified Real-Time Monitoring Tool Administration Guide, Release 11.0(1) 261
Performance Counters and AlertsCisco SW Conf Bridge Device

Counter DescriptionCounters
This counter represents the total number of conference resources thata SW conference device provides. One resource represents onestream.This counter equals the sum of the ResourceAvailable andResourceActive counters.
ResourceTotal
This counter represents the number of software-based conferences thatare currently active (in use) on a SW conference device.
SWConferenceActive
This counter represents the total number of conferences that have beenallocated and released on a SW conference device. A conference startswhen the first call connects to the bridge. The conference completeswhen the last call disconnects from the bridge.
SWConferenceCompleted
Cisco Telepresence MCU Conference Bridge DeviceThe Cisco Telepresence MCU Conference Bridge Device provides information about registered MCUconference bridge devices. The following table contains information about the Cisco Telepresence MCUConference Bridge Device counters.
Table 75: Cisco Telepresence MCU Conference Bridge Device
Counter DescriptionCounters
This counter represents the total number of active conferences on allCisco TelepresenceMCU conference bridge devices that are registeredwith Cisco Unified Communications Manager.
ConferencesActive
This counter represents the total number of conferences that used aCisco Telepresence MCU conference bridge allocated from CiscoUnified Communications Manager and completed, implying that theconference bridge was allocated and released. A conference is activatedwhen the first call is connected to the bridge. The conference iscompleted when the last call is disconnected from the bridge.
ConferencesCompleted
This counter represents the total number of times Cisco UnifiedCommunications Manager attempted to create HTTP connections toCisco Telepresence MCU conference bridge device, and failed due toconnection errors on the Cisco Telepresence MCU conference bridgeside.
HttpConnectionErrors
This counter represents the total number of times Cisco UnifiedCommunications Manager received a non 200 OK HTTP ResponsefromCisco TelepresenceMCU conference bridge, for any HTTP querysent.
HttpNon200OKResponse
Cisco Unified Real-Time Monitoring Tool Administration Guide, Release 11.0(1)262
Performance Counters and AlertsCisco Telepresence MCU Conference Bridge Device

Counter DescriptionCounters
This counter represents the total number of times Cisco UnifiedCommunicationsManager attempted to allocate a conference resourcefrom Cisco Telepresence MCU conference bridge device and failed.For example, the attempt to allocate a conference resource fails, if allthe resources are already in use.
OutOfResources
Cisco TFTP ServerThe Cisco Trivial File Transfer Protocol (TFTP) Server object provides information about the Cisco TFTPserver. The following table contains information about Cisco TFTP server counters.
Table 76: Cisco TFTP Server
Counter DescriptionCounters
This counter represents the number of times that the build processaborted when it received a Build all request. This counter increaseswhen building of device/unit/softkey/dial rules gets aborted as a resultof group level change notifications.
BuildAbortCount
This counter represents the number of times since the TFTP servicestarted that the TFTP server has built all the configuration files inresponse to a database change notification that affects all devices. Thiscounter increases by one every time the TFTP server performs a newbuild of all the configuration files.
BuildCount
This counter represents the number of devices that were processed inthe last build of all the configuration files. This counter also updateswhile processing device change notifications. The counter increaseswhen a new device is added and decreases when an existing device isdeleted.
BuildDeviceCount
This counter represents the number of dial rules that were processedin the last build of the configuration files. This counter also updateswhile processing dial rule change notifications. The counter increaseswhen a new dial rule is added and decreases when an existing dial ruleis deleted.
BuildDialruleCount
This counter represents the time in seconds that it took to build the lastconfiguration files.
BuildDuration
This counter represents the number of security-enabled phone devicesfor which the configuration file was digitally signed with the CiscoUnified Communications Manager server key in the last build of allthe configuration files. This counter also updates while processingsecurity-enabled phone device change notifications.
BuildSignCount
Cisco Unified Real-Time Monitoring Tool Administration Guide, Release 11.0(1) 263
Performance Counters and AlertsCisco TFTP Server
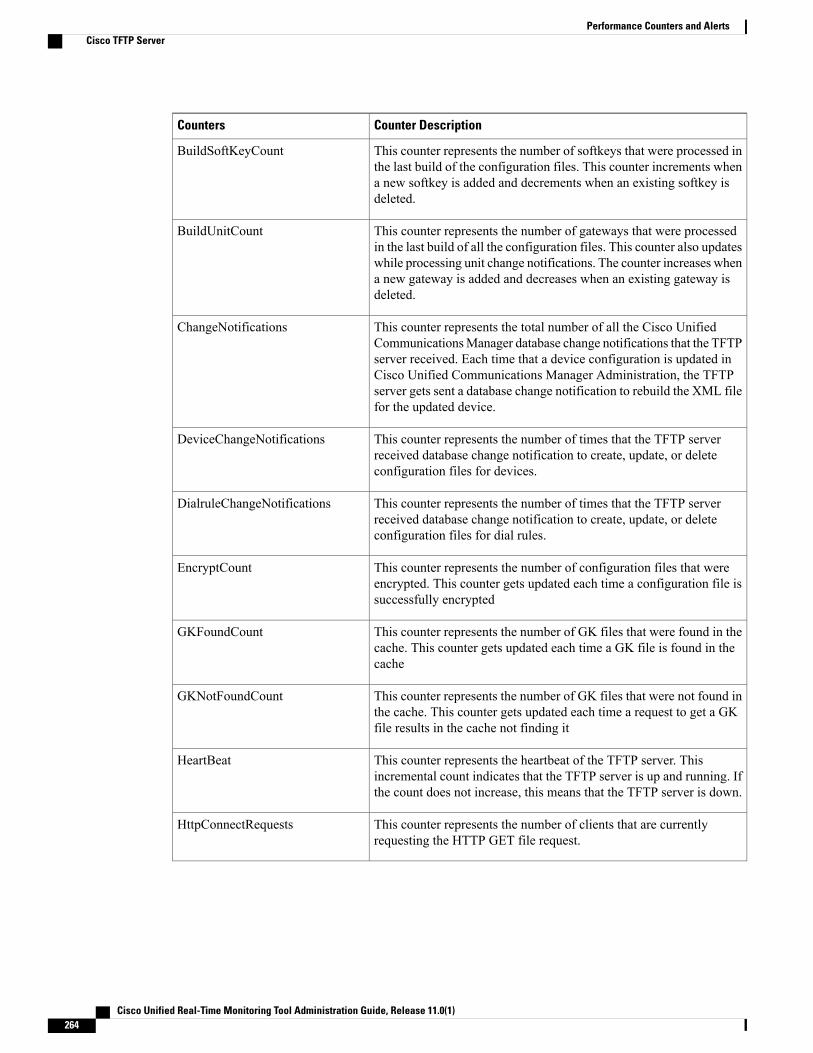
Counter DescriptionCounters
This counter represents the number of softkeys that were processed inthe last build of the configuration files. This counter increments whena new softkey is added and decrements when an existing softkey isdeleted.
BuildSoftKeyCount
This counter represents the number of gateways that were processedin the last build of all the configuration files. This counter also updateswhile processing unit change notifications. The counter increases whena new gateway is added and decreases when an existing gateway isdeleted.
BuildUnitCount
This counter represents the total number of all the Cisco UnifiedCommunicationsManager database change notifications that the TFTPserver received. Each time that a device configuration is updated inCisco Unified Communications Manager Administration, the TFTPserver gets sent a database change notification to rebuild the XML filefor the updated device.
ChangeNotifications
This counter represents the number of times that the TFTP serverreceived database change notification to create, update, or deleteconfiguration files for devices.
DeviceChangeNotifications
This counter represents the number of times that the TFTP serverreceived database change notification to create, update, or deleteconfiguration files for dial rules.
DialruleChangeNotifications
This counter represents the number of configuration files that wereencrypted. This counter gets updated each time a configuration file issuccessfully encrypted
EncryptCount
This counter represents the number of GK files that were found in thecache. This counter gets updated each time a GK file is found in thecache
GKFoundCount
This counter represents the number of GK files that were not found inthe cache. This counter gets updated each time a request to get a GKfile results in the cache not finding it
GKNotFoundCount
This counter represents the heartbeat of the TFTP server. Thisincremental count indicates that the TFTP server is up and running. Ifthe count does not increase, this means that the TFTP server is down.
HeartBeat
This counter represents the number of clients that are currentlyrequesting the HTTP GET file request.
HttpConnectRequests
Cisco Unified Real-Time Monitoring Tool Administration Guide, Release 11.0(1)264
Performance Counters and AlertsCisco TFTP Server

Counter DescriptionCounters
This counter represents the total number of file requests (such asrequests for XML configuration files, phone firmware files, audio files,and so on.) that the HTTP server handled. This counter represents thesum total of the following counters since the HTTP service started:RequestsProcessed, RequestsNotFound, RequestsOverflow,RequestsAborted, and RequestsInProgress.
HttpRequests
This counter represents the total number of HTTP requests that theHTTP server. canceled (aborted) unexpectedly. Requests could getaborted if the requesting device cannot be reached (for instance, thedevice lost power) or if the file transfer was interrupted due to networkconnectivity problems.
HttpRequestsAborted
This counter represents the total number of HTTP requests where therequested file was not found. When the HTTP server does not find therequested file, a message gets sent to the requesting device.
HttpRequestsNotFound
This counter represents the total number of HTTP requests that wererejected when the maximum number of allowable client connectionswas reached. The requests may have arrived while the TFTP serverwas building the configuration files or because of some other resourcelimitation. The Cisco TFTP advanced service parameter, MaximumServing Count, sets the maximum number of allowable connections.
HttpRequestsOverflow
This counter represents the total number of HTTP requests that theHTTP server. successfully processed.
HttpRequestsProcessed
This counters represents the number of requests that the HTTP servercompleted with the files that are on disk and not cached in memory.
HttpServedFromDisk
This counter represents the number of LD files that were found in thecache. This counter gets updated each time a LD file is found in cachememory.
LDFoundCount
This counter represents the number of LD files that were not found incache memory. This counter gets updated each time a request to getan LD file results in the cache not finding it.
LDNotFoundCount
This counter represents the maximum number of client connectionsthat the TFTP can serve simultaneously. The Cisco TFTP advancedservice parameter, Maximum Serving Count, sets this value.
MaxServingCount
This counter represents the total number of file requests (such asrequests for XML configuration files, phone firmware files, audio files,and so on.) that the TFTP server handles. This counter represents thesum total of the following counters since the TFTP service started:RequestsProcessed, RequestsNotFound, RequestsOverflow,RequestsAborted, and RequestsInProgress.
Requests
Cisco Unified Real-Time Monitoring Tool Administration Guide, Release 11.0(1) 265
Performance Counters and AlertsCisco TFTP Server

Counter DescriptionCounters
This counter represents the total number of TFTP requests that theTFTP server canceled (aborted) unexpectedly. Requests could beaborted if the requesting device cannot be reached (for instance, thedevice lost power) or if the file transfer was interrupted due to networkconnectivity problems.
RequestsAborted
This counter represents the number of file requests that the TFTP servercurrently is processing. This counter increases for each new file requestand decreases for each file request that is completed. This counterindicates the current load of the TFTP server.
RequestsInProgress
This counter represents the total number of TFTP requests for whichthe requested file was not found. When the TFTP server does not findthe requested file, a message gets sent to the requesting device. If thiscounter increments in a cluster that is configured as secure, this eventusually indicates an error condition. If, however, the cluster isconfigured as non-secure, it is normal for the CTL file to be absent(not found), which results in a message being sent to the requestingdevice and a corresponding increment in this counter. For non-secureclusters, then, this normal occurrence does not represent an errorcondition.
RequestsNotFound
This counter represents the total number of TFTP requests that wererejected because the maximum number of allowable client connectionswas exceeded, because requests arrived while the TFTP server wasbuilding the configuration files, or because of some other resourcelimitation. The Cisco TFTP advanced service parameter, MaximumServing Count, sets the maximum number of allowable connections.
RequestsOverflow
This counter represents the total number of TFTP requests that theTFTP server successfully processed.
RequestsProcessed
This counter represents the total number of data segments that the clientdevices acknowledged. Files get sent to the requesting device in datasegments of 512 bytes, and for each 512-byte segment, the device sendsthe TFTP server an acknowledgment message. Each additional datasegment gets sent upon receipt of the acknowledgment for the previousdata segment until the complete file successfully gets transmitted tothe requesting device.
SegmentsAcknowledged
This counter represents the number of data segments that the TFTPserver reads from the files on disk, while serving files.
SegmentsFromDisk
This counter represents the total number of data segments that theTFTP server sent. Files get sent to the requesting device in datasegments of 512 bytes.
SegmentSent
Cisco Unified Real-Time Monitoring Tool Administration Guide, Release 11.0(1)266
Performance Counters and AlertsCisco TFTP Server

Counter DescriptionCounters
This counter represents the number of SEP files that were successfullyfound in the cache. This counter gets updated each time that a SEP fileis found in the cache.
SEPFoundCount
This counter represents the number of SEP files that were not foundin the cache. This counter gets updated each time that a request to geta SEP file produces a not found in cache memory result.
SEPNotFoundCount
This counter represents the number of SIP files that were successfullyfound in the cache. This counter gets updated each time that a SIP fileis found in the cache
SIPFoundCount
This counter represents the number of SIP files that were not found inthe cache. This counter gets updated each time that a request to get aSIP file produces a not found in cache memory result.
SIPNotFoundCount
This counter represents the number of times that the TFTP serverreceived database change notification to create, update, or deleteconfiguration files for softkeys.
SoftkeyChangeNotifications
This counter represents the number of times that the TFTP serverreceived database change notification to create, update, or deletegateway-related configuration files.
UnitChangeNotifications
Cisco Transcode DeviceThe Cisco Transcode Device object provides information about registered Cisco transcoding devices. Thefollowing table contains information on Cisco transcoder device counters.
Table 77: Cisco Transcode Device
Counter DescriptionCounters
This counter represents the total number of times that an attempt wasmade to allocate a transcoder resource from a transcoder device andfailed; for example, because all resources were already in use.
OutOfResources
This counter represents the number of transcoder resources that arecurrently in use (active) for a transcoder device.
Each transcoder resource uses two streams.
ResourceActive
This counter represents the total number of resources that are not activeand are still available to be used now for a transcoder device.
Each transcoder resource uses two streams.
ResourceAvailable
Cisco Unified Real-Time Monitoring Tool Administration Guide, Release 11.0(1) 267
Performance Counters and AlertsCisco Transcode Device

Counter DescriptionCounters
This counter represents the total number of transcoder resources thata transcoder device provided. This counter equals the sum of thecounters ResourceActive and ResourceAvailable.
ResourceTotal
Cisco Video Conference BridgeThe Cisco Video Conference Bridge object provides information about registered Cisco video conferencebridge devices. The following table contains information on Cisco video conference bridge device counters.
Table 78: Cisco Video Conference Bridge
Counter DescriptionCounters
This counter represents the total number of video conferences that arecurrently active (in use) on a video conference bridge device. Thesystem specifies a conference as active when the first call connects tothe bridge.
ConferencesActive
This counter represents the number of video conferences that are notactive and are still available on a video conference device.
ConferencesAvailable
This counter represents the total number of video conferences that havebeen allocated and released on a video conference device. A conferencestarts when the first call connects to the bridge. The conferencecompletes when the last call disconnects from the bridge.
ConferencesCompleted
This counter represents the total number of video conferences that areconfigured for a video conference device.
ConferencesTotal
This counter represents the total number of times that an attempt wasmade to initiate a video conference from a video conference deviceand failed because the device already had the maximum number ofactive conferences that is allowed (as specified by the TotalConferencescounter).
OutOfConferences
This counter represents the total number of times that an attempt wasmade to allocate a conference resource from a video conference deviceand failed, for example, because all resources were already in use.
OutOfResources
This counter represents the total number of resources that are currentlyactive (in use) on a video conference bridge device. One resource getsused per participant.
ResourceActive
This counter represents the total number of resources that are not activeand are still available on a device to handle additional participants fora video conference bridge device.
ResourceAvailable
Cisco Unified Real-Time Monitoring Tool Administration Guide, Release 11.0(1)268
Performance Counters and AlertsCisco Video Conference Bridge

Counter DescriptionCounters
This counter represents the total number of resources that are configuredon a video conference bridge device. One resource gets used perparticipant.
ResourceTotal
Cisco Web DialerThe CiscoWeb Dialer object provides information about the CiscoWeb Dialer application and the Redirectorservlet. The following table contains information on the Cisco Web Dialer counters.
Table 79: Cisco Web Dialer
Counter DescriptionCounters
This counter represents the number ofMake Call and End Call requeststhat the Cisco Web Dialer application successfully completed.
CallsCompleted
This counter represents the number ofMake Call and End Call requeststhat were unsuccessful.
CallsFailed
This counter represents the total number of HTTP sessions that theRedirector servlet handled since the last service startup.
RedirectorSessionsHandled
This counter represents the number of HTTP sessions that are currentlybeing serviced by the Redirector servlet.
RedirectorSessionsInProgress
This counter represents the number ofMake Call and End Call requeststhat the Web Dialer servlet has successfully completed.
RequestsCompleted
This counter represents the number ofMake Call and End Call requeststhat failed.
RequestsFailed
This counter represents the total number of CTI sessions that the CiscoWeb Dialer servlet handled since the last service startup.
SessionsHandled
This counter represents the number of CTI sessions that the CiscoWebDialer servlet is currently servicing.
SessionsInProgress
Cisco WSM ConnectorThe WSM object provides information on WSMConnectors that are configured on Cisco UnifiedCommunicationsManager. EachWSMConnector represents a physicalMotorolaWSMdevice. The followingtable contains information on the Cisco WSM Connector counters.
Cisco Unified Real-Time Monitoring Tool Administration Guide, Release 11.0(1) 269
Performance Counters and AlertsCisco Web Dialer

Table 80: Cisco WSM Connector
Counter DescriptionCounters
This counter represents the number of calls that are currently active(in use) on the WSMConnector device.
CallsActive
This counter represents the number of calls that have been attemptedon the WSMConnector device, including both successful andunsuccessful call attempts.
CallsAttempted
This counter represents the number of calls that are connected (a voicepath was established) through theWSMConnector device. The counterincrements when the call terminates.
CallsCompleted
This counter represents the number of calls that are currently in progresson the WSMConnector device. This includes all active calls. Whenthe number of CallsInProgress equals the number of CallsActive, thisindicates that all calls are connected.
CallsInProgress
This counter represents the number of DMMS subscribers that areregistered to the WSM.
DMMSRegistered
IME ClientThe IMEClient object provides information about the Cisco IME client on the Cisco Unified CommunicationsManager server. The following table contains information on the Cisco IME client counters.
Table 81: Cisco IME Client
Counter DescriptionCounters
This counter indicates the number of Cisco IME calls that the CiscoUnified Communications Manager received successfully and that thecalled party answered, resulting in an IP call.
CallsAccepted
This counter indicates the number of calls that the Cisco UnifiedCommunications Manager received through Cisco IME. This numberincludes accepted calls, failed calls, and busy, no-answer calls. Thecounter increments each time that Cisco Unified CommunicationsManager receives a call through Cisco IME.
CallsAttempted
This counter indicates the number of calls that Cisco UnifiedCommunications Manager receives through Cisco IME. This numberincludes accepted calls, failed calls, and busy, no-answer calls. Thecounter increments on call initiation.
CallsReceived
Cisco Unified Real-Time Monitoring Tool Administration Guide, Release 11.0(1)270
Performance Counters and AlertsIME Client

Counter DescriptionCounters
This counter indicates the number of Cisco IME calls that Cisco UnifiedCommunications Manager placed successfully and that the remoteparty answered, resulting in an IP call.
CallsSetup
This counter indicates the number of unique domain names of peerenterprises that the Cisco IME client discovered. The counter servesas an indicator of overall system usage.
DomainsUnique
This counter indicates the total number of failed fallback attempts.FallbackCallsFailed
This counter indicates the total number of Cisco IME calls that havefallen back to the PSTNmid-call due to a quality problem. The counterincludes calls initiated and calls received by this Cisco UnifiedCommunications Manager.
FallbackCallsSuccessful
This counter indicates the total number of call attempts for which aCisco IME route was available but that were set up through the PSTNdue to a failure to connect to the target over the IP network.
IMESetupsFailed
This counter indicates the total number of distinct phone numbers thatthe Cisco IME has learned and that are present as routes in the CiscoUnified CommunicationsManager routing tables. If this number growstoo large, the server may exceed the per-cluster limit, and you mayneed to add additional servers to your cluster.
RoutesLearned
This counter indicates the total number of DIDs that were publishedsuccessfully into the IME distributed cache across all Cisco IME clientinstances. The counter provides a dynamic measurement that givesyou an indication of your own provisioned usage and a sense of howsuccessful the system has been in storing the DIDs in the network.
RoutesPublished
This counter indicates the number of learned routes that were rejectedbecause the the administrator blacklisted the number or domain. Thiscounter provides an indication of the number of cases where a VoIPcall cannot happen in the future because of the blocked validation.
RoutesRejected
This counter indicates the number of voice call record (VCR) uploadrequests that the Cisco Unified Communications Manager has sent tothe Cisco IME server to be stored in the IME distributed cache.
VCRUploadRequests
IME Client InstanceThe IMEClient Instance object provides information about the Cisco IME client instance on the Cisco UnifiedCommunications Manager server. The following table contains information on the Cisco IME client instancecounters.
Cisco Unified Real-Time Monitoring Tool Administration Guide, Release 11.0(1) 271
Performance Counters and AlertsIME Client Instance

Table 82: IME Client
Counter DescriptionCounters
This counter indicates the overall health of the connection to the CiscoIME services for a particular Cisco IME client instance (Cisco UnifiedCommunications Manager). The following values may display for thecounter:
• 0—Indicates an unknown state (which may mean that the CiscoIME service is not active).If the value specifies 0, an alert gets generated once per hourwhile the connection remains in the unknown state.
• 1—Indicates a healthy state; that is, the Cisco IME service isactive, and the Cisco Unified Communications Manager hassuccessfully established a connection to its primary and backupservers for the Cisco IME client instance, if configured.
• 2—Indicates an unhealthy state; that is, the Cisco IME serviceis active, but the Cisco Unified Communications Manager hasnot successfully established a connection to its primary andbackup servers for the Cisco IME client instance, if configured.
IMEServiceStatus
SAML Single Sign-OnThe following table contains information about SAML Single Sign-On counters.
Table 83: SAML Single Sign-On Counters
Counter descriptionCounter
This counter represents the total number of SAMLrequests sent to the configured Identity Provider.
SAML_REQUESTS
This counter represents the total number of SAMLresponses received from the configured IdentityProvider.
SAML_RESPONSES
Additionally, the following SAML SSO counters are also displayed in the Unified RTMT but they are notfunctional in Cisco Unified Communications Manager 10.0(1):
• OAUTH_TOKENS_ISSUED
• OAUTH_TOKENS_ACTIVE
• OAUTH_TOKENS_VALIDATED
• OAUTH_TOKENS_EXPIRED
Cisco Unified Real-Time Monitoring Tool Administration Guide, Release 11.0(1)272
Performance Counters and AlertsSAML Single Sign-On
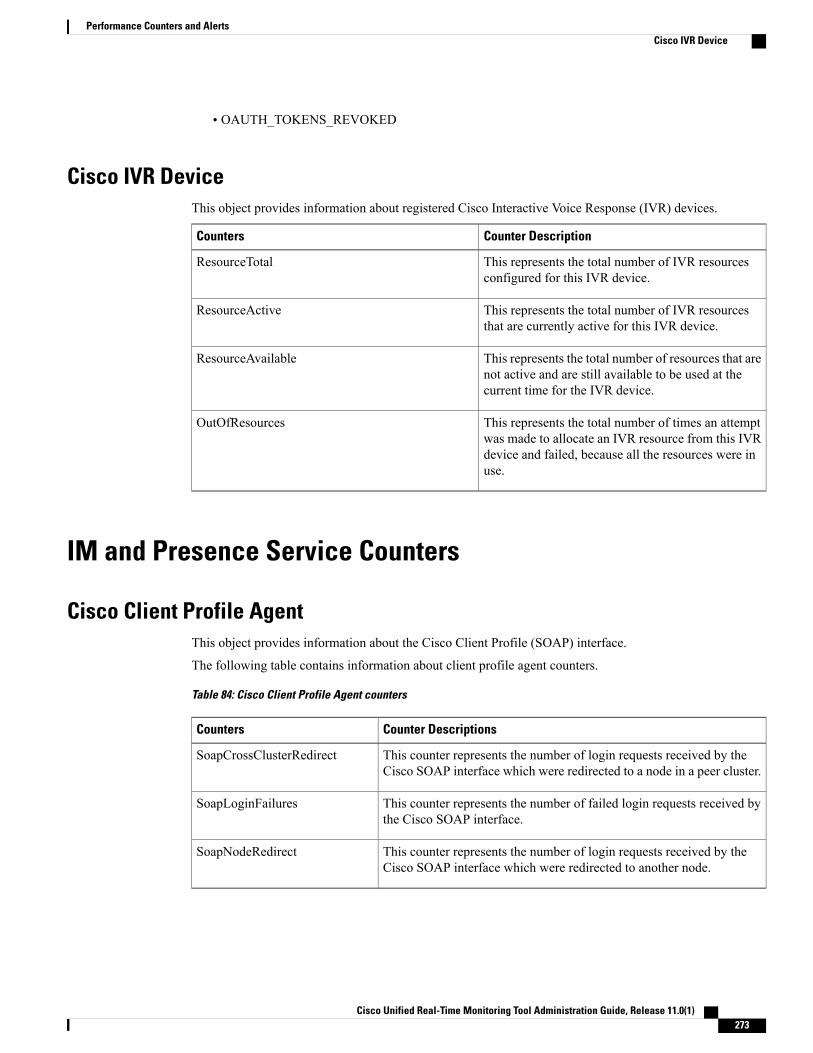
• OAUTH_TOKENS_REVOKED
Cisco IVR DeviceThis object provides information about registered Cisco Interactive Voice Response (IVR) devices.
Counter DescriptionCounters
This represents the total number of IVR resourcesconfigured for this IVR device.
ResourceTotal
This represents the total number of IVR resourcesthat are currently active for this IVR device.
ResourceActive
This represents the total number of resources that arenot active and are still available to be used at thecurrent time for the IVR device.
ResourceAvailable
This represents the total number of times an attemptwas made to allocate an IVR resource from this IVRdevice and failed, because all the resources were inuse.
OutOfResources
IM and Presence Service Counters
Cisco Client Profile AgentThis object provides information about the Cisco Client Profile (SOAP) interface.
The following table contains information about client profile agent counters.
Table 84: Cisco Client Profile Agent counters
Counter DescriptionsCounters
This counter represents the number of login requests received by theCisco SOAP interface which were redirected to a node in a peer cluster.
SoapCrossClusterRedirect
This counter represents the number of failed login requests received bythe Cisco SOAP interface.
SoapLoginFailures
This counter represents the number of login requests received by theCisco SOAP interface which were redirected to another node.
SoapNodeRedirect
Cisco Unified Real-Time Monitoring Tool Administration Guide, Release 11.0(1) 273
Performance Counters and AlertsCisco IVR Device

Cisco Presence EngineThe Cisco Presence Engine object provides information about the SIP messages that the Presence Enginereceives and sends.
The following table contains information about Cisco Presence Engine performance counters.
Table 85: Cisco Presence Engine counters
Counter DescriptionCounters
Subscribe
This counter represents the number of SUBSCRIBE messages receivedby the Presence Engine, including initial subscribes, refreshes, fetches &unsubscribes.
SubscribesReceived
This counter represents the total number of SUBSCRIBE messages sentfrom the Presence Engine.
SubscribesSent
This counter represents the number of SUBSCRIBE messages receivedby the Presence Engine with an event type of presence.
SubscribesReceivedPresence
This counter represents the number of SUBSCRIBE messages receivedby the Presence Engine with an event type of profileconfig.
SubscribesReceivedProfileConfig
This counter represents the number of initial non-calendar SUBSCRIBEmessages received.
SubscribesInitial
This counter represents the number of non-calendar refresh SUBSCRIBEmessages received.
SubscribesRefresh
This counter represents the number of non-calendar fetch SUBSCRIBEmessages received.
SubscribesFetch
This counter represents the number of non-calendar remove SUBSCRIBEmessages received.
SubscribesRemove
This counter represents the number of non-calendar subscriptions that arecurrently active.
ActiveSubscriptions
This counter represents the number of SUBSCRIBE messages redirectedwith a 3xx response.
SubscribesRedirect3xx
This counter represents the number of SUBSCRIBE messages rejectedwith a 4xx response.
SubscribesRejected4xx
This counter represents the number of SUBSCRIBE messages rejectedwith a 5xx response.
SubscibesRejected5xx
Cisco Unified Real-Time Monitoring Tool Administration Guide, Release 11.0(1)274
Performance Counters and AlertsCisco Presence Engine

Counter DescriptionCounters
This counter represents the number of SUBSCRIBE messages rejectedwith a 6xx response.
SubscibesRejected6xx
This counter represents the number of SUBSCRIBE messages rejectedwith a 503 responses.
SubcribesRejectedWith503
This counter represents the number of active subscriptions sent by thePresence Engine to a foreign domain.
SubscriptionActiveSentForeign
This counter represents the number of active subscriptions received by thePresence Engine from a foreign domain.
SubscriptionActiveReceivedFromForeign
This counter represents the number of watcher-info presence subscriptions.WatcherInfoPresenceSubscriptions
Calendar
This counter represents the n.umber of calendar subscriptions that arecurrently active.
ActiveCalendarSubscriptions
This counter represents the number of initial SUBSCRIBE messages sentby the Presence Engine to the calendar server.
SubscribesSentCalendarInitial
This counter represents the number of refresh SUBSCRIBEmessages sentby the Presence Engine to the calendar server.
SubscribesSentCalendarRefresh
This counter represents the number of retry SUBSCRIBE messages sentby the Presence Engine to the calendar server.
SubscribesSentCalendarRetry
This counter represents the number of SUBSCRIBE messages receivedby the Presence Engine with an event type of calendar.
SubscribesReceivedCalendar
This counter represents the number of NOTIFYmessages by the PresenceEngine with an event type of calendar.
NotifiesReceivedCalendar
This counter represents the number of NOTIFY messages sent from thePresence Engine with an event type of calendar.
NotifiesSentCalendar
This counter represents the number of meetings that were started throughcalendar integration.
MeetingsStarted
This counter represents the number of meetings that were ended throughcalendar integration.
MeetingsEnded
Publish
This counter represents the number of successful publications processedby the Presence Engine.
PublicationsProcessed
This counter represents the number of initial PUBLISHmessages received.PublishInitial
Cisco Unified Real-Time Monitoring Tool Administration Guide, Release 11.0(1) 275
Performance Counters and AlertsCisco Presence Engine

Counter DescriptionCounters
This counter represents the number of refresh PUBLISHmessages received.PublishRefresh
This counter represents the number ofmodify PUBLISHmessages received.PublishModify
This counter represents the number of remove PUBLISH messagesreceived.
PublishRemove
Notify
This counter represents the number of the existing number of outgoingNOTIFY messages queued by the Presence Engine.
NotificationsInQueue
This counter represents the number of successful NOTIFY messages sentout by the Presence Engine.
NotifiesSent
This counter represents the number of NOTIFY messages received by thePresence Engine from backend subscriptions.
NotifiesReceived
This counter represents the number of NOTIFY messages sent from thePresence Engine with an event type of presence.
NotifiesSentPresence
This counter represents the number of NOTIFY messages sent from thePresence Engine with an event type of profileconfig.
NotifiesSentProfileConfig
This counter represents the number of NOTIFY messages sent that wereretried.
NotifiesRetried
This counter represents the number of NOTIFY messages that timed out.NotifiesTimedouts
This counter represents the number of NOTIFY messages rejected with a3xx response.
NotifiesRejected3xx
This counter represents the number of NOTIFY messages rejected with a4xx response.
NotifiesRejected4xx
This counter represents the number of NOTIFY messages rejected with a5xx response.
NotiffiesRejected5xx
This counter represents the number of NOTIFY messages rejected with a503 response.
NotifiesRejected503
This counter represents the number of NOTIFY messages rejected with a6xx response.
NotifiesRejected6xx
This counter represents the number of watcher-info presence notifications.WatcherInfoPresenceNotifications
This counter represents the number of watcher-info presence subscriptions.WatcherInfoPresenceSubscriptions
HighWaterMark
Cisco Unified Real-Time Monitoring Tool Administration Guide, Release 11.0(1)276
Performance Counters and AlertsCisco Presence Engine

Counter DescriptionCounters
This counter represents the number of times the load high water mark hasbeen reached.
HighWaterMark
Active Views
This counter represents the number of Active Views in the Presence Engine.ActiveViews
Active Resources
This counter represents the number of active resources in the PresenceEngine.
ActiveResources
JSM
This counter represents the number of client emulation sessions betweenthe Presence Engine and JSM.
ActiveJsmSessions
XMPP
This counter represents the number of XMPP presence packets received.XMPPPresenceReceived
This counter represents the number of XMPP presence packets receivedthat were filtered.
XMPPPresenceFiltered
This counter represents the number of composed presence updates sent toJSM.
XMPPPresenceNotificationsSent
This counter represents the number of XMPP Instant Message packetsreceived by the Presence Engine.
XMPPIMReceived
This counter represents the number of XMPP InstantMessage packets sentby the Presence Engine.
XMPPIMSent
This counter represents the number of XMPP TC Invites rejected by thePresence Engine.
XMPPIMTcInviteErrors
This counter represents the number of XMPP Instant Message packetsreceived for unregistered SIP resources.
XMPPIMResourceNotFoundErrors
This counter represents the number of XMPP Instant Message packetsdropped by the Presence Engine.
XMPPIMIgnored
This counter represents the number of gone messages sent to the RFI onpresence events.
XMPPIMGoneGenerated
This counter represents the number of errors when sendingXMPPmessagesto the RFI layer.
RFIErrors
Cisco Unified Real-Time Monitoring Tool Administration Guide, Release 11.0(1) 277
Performance Counters and AlertsCisco Presence Engine

Counter DescriptionCounters
This counter represents the current number of XMPP Messages that arequeued as the RFI is PAUSED.
RFIMessageQueueSize
SIP
This counter represents the number of SIP InstantMessage packets receivedby the Presence Engine.
SIPIMReceived
This counter represents the number of SIP Instant Message packets sentby the Presence Engine.
SIPIMSent
This counter represents the number of gone messages sent to the Proxy onpresence events.
SIPIMGoneGenerated
This counter represents the number of SIP Instant Message resent to theProxy.
SIPIMRetry
This counter represents the number of SIP Instant Message packets thattimed out when sending to the Proxy.
SIPIMTimeout
This counter represents the number of 3xx errors when attempting to sendSIP Instant Message packets to the Proxy.
SIPIMReject3xx
This counter represents the number of 4xx errors when attempting to sendSIP Instant Message packets to the Proxy.
SIPIMReject4xx
This counter represents the number of 5xx errors when attempting to sendSIP Instant Message packets to the Proxy.
SIPIMReject5xx
This counter represents the number of 6xx errors when attempting to sendSIP Instant Message packets to the Proxy.
SIPIMReject6xx
This counter represents the number of Active Instant Message sessionsbetween SIP and XMPP.
ActiveIMSessions
Roster Sync
This counter represents the number of successful add buddy requestsprocessed by the Roster Sync Agent.
RosterSyncAddBuddySuccess
This counter represents the number of failed add buddy requests processedby the Roster Sync Agent.
RosterSyncAddBuddyFailure
This counter represents the number of successful update buddy requestsprocessed by the Roster Sync Agent.
RosterSyncUpdateBuddySuccess
This counter represents the number of failed update buddy requestsprocessed by the Roster Sync Agent.
RosterSyncUpdateBuddyFailure
Cisco Unified Real-Time Monitoring Tool Administration Guide, Release 11.0(1)278
Performance Counters and AlertsCisco Presence Engine

Counter DescriptionCounters
This counter represents the number of successful delete buddy requestsprocessed by the Roster Sync Agent.
RosterSyncDeleteBuddySuccess
This counter represents the number of failed delete buddy requestsprocessed by the Roster Sync Agent.
RosterSyncDeleteBuddyFailure
This counter represents the number of successful subscribe requestsprocessed by the Roster Sync Agent.
RosterSyncSubscribeSuccess
This counter represents the number of failed subscribe requests processedby the Roster Sync Agent.
RosterSyncSubscribeFailure
This counter represents the number of successful unsubscribe requestsprocessed by the Roster Sync Agent.
RosterSyncUnSubscribeSuccess
This counter represents the number of failed unsubscribe requests processedby the Roster Sync Agent.
RosterSyncUnSubscribeFailure
This counter represents the number of privacy policy update sent to XCP.PolicyUpdateSent
This counter represents the number of privacy policy update received fromXCP.
PolicyUpdateReceived
This counter represents the number of successful unsubscribed requestsprocessed by the Roster Sync Agent.
RosterSyncUnSubscribedSuccess
This counter represents the number of failed unsubscribed requestsprocessed by the Roster Sync Agent.
RosterSyncUnSubscribedFailure
Cisco Server Recovery ManagerThis object provides information about the Cisco Server Recovery Manager (SRM) state. The following tablecontains information about SRM counters.
Cisco Unified Real-Time Monitoring Tool Administration Guide, Release 11.0(1) 279
Performance Counters and AlertsCisco Server Recovery Manager

Table 86: Cisco Server Recovery Manager Counters
Counter DescriptionsCounters
This counter represents the state of the SRM.
• 0 = Unknown
• 1 = Initializing
• 2 = Idle
• 3 = Active Normal
• 4 = Backup Activated
• 5 = Taking Over
• 6 = Taking Back
• 7 = Failing Over
• 8 = Failed Over
• 9 = Failed Over Affected Service
• 10 = Falling Back
• 11 = Failed
• 12 = Down State
SRMState
Cisco SIP ProxyThe following table contains information about Cisco SIP Proxy counters.
Table 87: Proxy counters
Counter DescriptionsCounters
This counter represents the number of conference call requests receivedby CTIGW.
CTIGWConferenceReq
This counter represents the number of inbound calls received by CTIGW.CTIGWInboundCalls
This counter represents the number of LineOpen requests received byCTIGW.
CTIGWLineOpenRequest
This counter represents the number of MakeCall requests received byCTIGW.
CTIGWMakeCallRequest
This counter represents the number of INVITE Refreshes received by theIM and Presence server that are sent from the MOC client.
CTIGWRefreshCount
Cisco Unified Real-Time Monitoring Tool Administration Guide, Release 11.0(1)280
Performance Counters and AlertsCisco SIP Proxy

Counter DescriptionsCounters
This counter represents the number of retrieve call requests received byCTIGW.
CTIGWRetrieveReq
This counter represents the number of SIP 4XX response sent by CTIGW.CTIGWSip4XXRes
This counter represents the number of SIP 5XX response sent by CTIGW.CTIGWSip5XXRes
This counter represents the number of single step transfer call requestsreceived by CTIGW.
CTIGWSSXrefReq
This counter represents the number of users authorized by CTIGW.CTIGWUsersAuthorized
This counter represents the number of users currently logged into MOCclient for Remote Call Control.
CTIGWUsersCurrentlyAuthorized
This counter represents the number of transfer call requests received byCTIGW.
CTIGWXrefReq
This counter represents the number of HTTP requests processed.HttpRequests
This counter represents the current number of active federated IM sessions.IMCTRLActiveSessions
This counter represents the current number of active SIP XMPP IMgateway sessions being maintained by the proxy.
IMGWActiveSessions
This counter represents the current number of SIP Messages sent to SIPclient from the XMPP IM gateway.
IMGWClientMessageSent
This counter represents the current number of SIP Messages receivedfrom the local PE by the XMPP IM gateway.
IMGWPeMessageReceived
This counter represents the current number of SIP Messages sent to thelocal PE for the XMPP IM gateway.
IMGWPeMessageSent
This counter represents the number of IPC requests from the TCP process.Ipc_Requests
This counter represents the number of idle sipd worker processes at acurrent instance.
NumIdleSipdWorkers
This counter represents the number of sipd worker processes at a currentinstance.
NumSipdWorker
This counter represents the number of past-due timer events that werequeued.
Proxy_Due_Timer_Events
This counter represents the number of expired timer events.Proxy_Timer_Events
This counter represents the number of Application User login requestsreceived by the Presence Web Service Module.
PWSAppUserLoginRequest
Cisco Unified Real-Time Monitoring Tool Administration Guide, Release 11.0(1) 281
Performance Counters and AlertsCisco SIP Proxy

Counter DescriptionsCounters
This counter represents the number of Application User logout requestsreceived by the Presence Web Service Module.
PWSAppUserLogoutRequest
This counter represents the number of subscriptions that expire beforebeen refreshed.
PWSEndpointExpired
This counter represents the number of Endpoint refresh requests receivedby the Presence Web Service Module.
PWSEndpointRefreshRequest
This counter represents the number of End User login requests receivedby the Presence Web Service Module.
PWSEndUserLoginRequest
This counter represents the number of End User logout requests receivedby the Presence Web Service Module.
PWSEndUserLogoutRequest
This counter represents the number of GetPolledPresence requests receivedby the Presence Web Service Module.
PWSGetPolledPresenceRequest
This counter represents the number of GetSubscribedPresence requestsreceived by the Presence Web Service Module.
PWSGetSubscribedPresenceRequest
This counter represents the number of Presence Notifications sent by thePresence Web Service Module.
PWSPresenceNotifies
This counter represents the number of Register Endpoint requests receivedby the Presence Web Service Module.
PWSRegisterEndpointRequest
This counter represents the number of SetPresence requests received bythe Presence Web Service Module.
PWSSetPresenceRequest
This counter represents the number of SIP Notifies received by thePresence Web Service Module.
PWSSipNotifies
This counter represents the number of SIP Publish requests sent by thePresence Web Service Module.
PWSSipPublishRequests
This counter represents the number of SIP Subscribe requests sent by thePresence Web Service Module.
PWSSipSubscribeRequests
This counter represents the number of SIP Unpublish requests sent by thePresence Web Service Module.
PWSSipUnpublishRequests
This counter represents the number of SIP Unsubscribe requests sent bythe Presence Web Service Module.
PWSSipUnsubscribeRequests
This counter represents the number of endpoint registrations that expirebefore been refreshed.
PWSSubscribeExpired
Cisco Unified Real-Time Monitoring Tool Administration Guide, Release 11.0(1)282
Performance Counters and AlertsCisco SIP Proxy

Counter DescriptionsCounters
This counter represents the number of Subscribe refresh requests receivedby the Presence Web Service Module.
PWSSubscribeRefreshRequest
This counter represents the number of Subscribe requests received by thePresence Web Service Module.
PWSSubscribeRequest
This counter represents the number of Unregister Endpoint requestsreceived by the Presence Web Service Module.
PWSUnregisterEndpointRequest
This counter represents the number of Unsubscribe requests received bythe Presence Web Service Module.
PWSUnsubscribeRequest
This counter represents the Server load status on scale of 0 (idle) to 3(swamped).
ServerLoadStatus
This counter represents the number of SIP Client InstantMessages receivedby the proxy.
SIPClientImMessage
This counter represents the number of SIP Client REGISTER requestsreceived by the proxy.
SIPClientRegistered
This counter represents the number of failed SIP Client REGISTERrequests received by the proxy.
SIPClientRegisterFailed
This counter represents the number of sip requests received over tcptransport.
Sip_Tcp_Requests
This counter represents the number of sip requests received over udptransport.
Sip_Udp_Requests
This counter represents the number of INVITE requests received by theproxy.
SIPInviteRequestIn
This counter represents the current number of INVITE requests receivedby the proxy across the enterprise boundary.
SIPInviteRequestInForeign
This counter represents the number of INVITE requests sent by the proxy.SIPInviteRequestOut
This counter represents the current number of INVITE requests sent bythe proxy across the enterprise boundary.
SIPInviteRequestOutForeign
This counter represents the number of MESSAGE requests received byproxy.
SIPMessageRequestIn
This counter represents the current number ofMESSAGE requests receivedby the proxy across the enterprise boundary.
SIPMessageRequestInForeign
This counter represents the current number of MESSAGE requests sentby the proxy across the enterprise boundary.
SIPMessageRequestOutForeign
Cisco Unified Real-Time Monitoring Tool Administration Guide, Release 11.0(1) 283
Performance Counters and AlertsCisco SIP Proxy

Counter DescriptionsCounters
This counter represents the number of NOTIFY requests received by theproxy.
SIPNotifyRequestIn
This counter represents the current number of NOTIFY requests receivedby the proxy across the enterprise boundary.
SIPNotifyRequestInForeign
This counter represents the current number of NOTIFY requests sent bythe proxy across the enterprise boundary.
SIPNotifyRequestOutForeign
This counter represents the number of REGISTER requests received bythe proxy.
SIPRegisterRequestIn
This counter represents the current number of requests received directlyby the proxy across the enterprise boundary.
SIPRequestInForeign
This counter represents the current number of requests sent directly byproxy across the enterprise boundary.
SIPRequestOutForeign
This counter represents the number of retransmits executed by the proxy.SIPRetransmits
This counter represents the number of SUBSCRIBE requests received bythe proxy.
SIPSubscribeRequestIn
This counter represents the current number of SUBSCRIBE requestsreceived by the proxy across the enterprise boundary.
SIPSubscribeRequestInForeign
This counter represents the current number of SUBSCRIBE requests sentby the proxy across the enterprise boundary.
SIPSubscribeRequestOutForeign
Cisco Sync AgentThis object provides information about the number of errors that occur during synchronization. The followingtable contains information about the Cisco Sync Agent counter.
Table 88: Cisco Sync Agent Counter
Counter DescriptionCounter
This counter displays the number of errors that occurduring synchronization. The counter resets to 0 whenthe Cisco sync agent is restarted.
This counter is always 0 on the subscriber node.
NumberOfSyncErrors
Cisco Unified Real-Time Monitoring Tool Administration Guide, Release 11.0(1)284
Performance Counters and AlertsCisco Sync Agent

Cisco XCP Auth ComponentThe following table contains information about Cisco XCP Authentication performance counters.
Table 89: Cisco XCP Auth Component Counters
Counter descriptionCounter
This counter represents the total number of successfulSASL plain authentication attempts.
SASLPlainSuccess
This counter represents the total number of failedSASL plain authentication attempts.
SASLPlainFailed
This counter represents the number of successfulvtg-token authentication attempts.
VtgTokenSuccess
This counter represents the number of failed vtg-tokenauthentication attempts.
VtgTokenFailed
This counter represents the total number of failedauthentication attempts due to no license.
FailedLicense
This counter represents the total failed SASL plainauthentication attempts due to invalid username andpassword.
FailedSASLCredentials
This counter represents the total failed vtg-tokenauthentication attempts due to invalid username andpassword.
FailedTokenCredentials
Cisco XCP CMThe following table contains information about Cisco XCPConnectionManager (CM) performance counters.
Table 90: Cisco XCP CM Counters
Counter DescriptionCounter
This counter represents the number of connectedsockets in the Web Connection Manager component.
CmConnectedSockets
This counter represents the total number of failedconnection requests.
CmFailedRequests
Cisco Unified Real-Time Monitoring Tool Administration Guide, Release 11.0(1) 285
Performance Counters and AlertsCisco XCP Auth Component

Cisco XCP Component Stanza TrafficThe following table provides information about Cisco XCP Component Stanza Traffic performance counters.
Table 91: Cisco XCP Component Stanza Traffic Counters
Counter descriptionCounter
This counter represents the number of bytes sent ona per-component basis.
CompStanzaBytesSent
This counter represents the number of bytes receivedon a per-component basis.
CompStanzaBytesRecv
This counter represents the number of errors sent ona per-component basis.
CompStanzaErrorsRecv
This counter represents the number of errors receivedon a per-component basis.
CompStanzaErrorsSent
This counter represents the number of packetsdropped on a per-component basis.
CompStanzaPacketsDropped
This counter represents the number of stanzas senton a per-component basis.
CompStanzaStanzasSent
This counter represents the number of stanzasreceived on a per-component basis.
CompStanzaStanzasRecv
This counter represents the number of messagepackets sent on a per-component basis.
CompStanzaMessagePacketsSent
This counter represents the number of messagepackets received on a per-component basis.
CompStanzaMessagePacketsRecv
This counter represents the number of presencepackets sent on a per-component basis.
CompStanzaPresencePacketsSent
This counter represents the number of presencepackets received on a per-component basis.
CompStanzaPresencePacketsRecv
This counter represents the number of IQ packetsreceived on a per-component basis.
CompStanzaIQPacketsRecv
This counter represents the number of IQ packets senton a per-component basis.
CompStanzaIQPacketsSent
Cisco Unified Real-Time Monitoring Tool Administration Guide, Release 11.0(1)286
Performance Counters and AlertsCisco XCP Component Stanza Traffic

Cisco XCP JDSThe following table contains information about the Cisco XCP JDS performance counters.
Table 92: Cisco XCP JDS Counters
Counter descriptionCounter
This counter represents the total number of successfulLDAP searches.
JdsLDAPSuccess
This counter represents the total number of failedLDAP searches.
JdsLDAPFailed
This counter represents the number of invalid LDAPsearch requests rejected by Cisco XCP JDS and notsent to LDAP.
JdsInvalidRequests
Cisco XCP JSMThe following table contains information about the XCP JSM performance counters.
Table 93: Cisco XCP JSM Counters
Counter descriptionCounter
This counter represents the number of messagestanzas received by the JSM component.
JsmMessagesIn
This counter represents the number of messagestanzas sent by the JSM component.
JsmMessagesOut
This component represents the number of presencestanzas received by the JSM component.
JsmPresenceIn
This component represents the number of presencestanzas sent by the JSM component.
JsmPresenceOut
This counter represents the total number of activeJSM sessions on the IM and Presence service. On IMand Presence, the Presence Engine creates a JSMclient emulation session for every licensed user atstartup time. Additional JSM sessions are also createdwhile users are signed in on their clients. Users maybe signed in on multiple clients simultaneouslyresulting in multiple additional JSM sessions per user.
JsmIMSessions
Cisco Unified Real-Time Monitoring Tool Administration Guide, Release 11.0(1) 287
Performance Counters and AlertsCisco XCP JDS

Counter descriptionCounter
This counter represents the number of users with oneor more JSM sessions. On IM and Presence, thePresence Engine creates a JSM client emulationsession for every licensed user. The value of thiscounter should therefore match the value of thePresence Engine ActiveJsmSessions counter.
JsmOnlineUsers
This counter represents the current login rate beingtracked by the JSM component.
JsmLoginRate
This counter represents the total number of successfullogins.
JsmSuccessfulLogins
This counter is always 0 on IM and Presence. Fordetails on failed login attempts, see the Cisco XCPAuth Component counters.
JsmFailedLogins
This counter represents the total message packetsprocessed by the JSM component.
JsmTotalMessagePackets
This counter represents the total presence packetsprocessed by the JSM component.
JsmTotalPresencePackets
This counter represents the total number of IQ packetsprocessed by the JSM.
JsmTotalIQPackets
This counter represents the total messages processedby the JSM component in last time slice.
JsmMsgsInLastSlice
This counter represents the average message sizeprocessed by the JSM component.
JsmAverageMessageSize
This counter is always set to 0 on IM and Presenceand is reserved for future use.
JsmTotalStateChangePackets
This counter is always set to 0 on IM and Presenceand is reserved for future use.
JsmStateChangePacketsInSlice
This counter is always set to 0 on IM and Presenceand is reserved for future use.
JsmAverageStateChangeSize
Cisco XCP JSM IQ NamespacesThe following table contains information about the Cisco XCP JSM IQ Namespaces performance counters.
Cisco Unified Real-Time Monitoring Tool Administration Guide, Release 11.0(1)288
Performance Counters and AlertsCisco XCP JSM IQ Namespaces

Table 94: Cisco XCP JSM IQ Namespaces
Counter descriptionCounter
This counter represents the number of IQ packetshandles on a per-namespace basis.
JSM IQ Namespace
Cisco XCP JSM SessionThe following table contains information about the Cisco XCP JSM Session performance counters.
Table 95: Cisco XCP JSM Session Counters
Counter descriptionCounter
This counter represents IQ packets received by JSMon a per-session basis.
JsmSessionIQIn
This counter represents IQ packets sent by JSM on aper-session basis.
JsmSessionIQOut
This counter represents message packets received byJSM on a per-session basis.
JsmSessionMessagesIn
This counter represents message packets sent by JSMon a per-session basis.
JsmSessionMessagesOut
This counter represents presence packets received byJSM on a per-session basis.
JsmSessionPresenceIn
This counter represents presence packets sent by JSMon a per-session basis.
JsmSessionPresenceOut
This counter represents the size of the user’s rosteron a per-session basis.
JsmSessionRosterSize
Cisco XCP MA BasicThe following table contains information about the Cisco XCPMessage Archiver Basic performance counters.
Cisco Unified Real-Time Monitoring Tool Administration Guide, Release 11.0(1) 289
Performance Counters and AlertsCisco XCP JSM Session

Table 96: Cisco XCP MA Basic Counters
Counter descriptionCounter
This counter represents the total number of packetsreceived by IM and Presence and archived by theMessage Archiver component.
ReceivedPackets
This counter represents the total number of packetssent from IM and Presence and archived by theMessage Archiver component.
SentPackets
This counter represents the confirmed IMs recordswritten to the Database.
SuccessfulDBWriters
This counter represents the failed attempts to writeto the Database.
FailedDBWriters
This counter represents the number of packetsMessage Archiver receives but are not written to theDatabase, for example, isTyping packets.
PacketsDropped
This counter represents the number of packets thatMessage Archiver has queued pending write toDatabase.
DBQueueSize
Cisco XCP Managed File TransferThe following table contains information about the Cisco XCPManaged File Transfer performance counters.
Table 97: Managed File Transfer Counters
Counter descriptionCounter
This counter represents the number of bytes downloaded during thelast reporting interval (typically 60 seconds).
MFTBytesDownloadedLastTimeslice
This counter represents the number of bytes uploaded during the lastreporting interval (typically 60 seconds).
MFTBytesUpoadedLastTimeslice
This counter represents the total number of files downloaded.MFTFilesDownloaded
This counter represents the number of files downloaded during thelast reporting interval (typically 60 seconds).
MFTFilesDownloadedLastTimeslice
This counter represents the total number of files uploaded.MFTFilesUploaded
Cisco Unified Real-Time Monitoring Tool Administration Guide, Release 11.0(1)290
Performance Counters and AlertsCisco XCP Managed File Transfer

Counter descriptionCounter
This counter represents the number of files uploaded during the lastreporting interval (typically 60 seconds).
MFTFilesUploadedLastTimeslice
Cisco XCP RouterThe following table contains information about the Cisco XCP Router performance counters.
Table 98: Cisco XCP Router Counters
Counter descriptionCounter
This counter represents the total number of normalpackets handled by the Cisco XCP router.
RouterNormalPackets
This counter represents the total number of xdbpackets handled by the Cisco XCP router.
RouterXdbPackets
This counter represents the total number of routepackets handled by the Cisco XCP router.
RouterRoutePackets
This counter represents the total number of logpackets handled by the Cisco XCP router.
RouterLogPackets
Cisco XCP SIP S2SThe following table contains information about Cisco XCP SIP Server-to-Server (S2S) performance counters.
Table 99: Cisco SIP S2S counters
Counter descriptionCounter
This counter represents the total foreign domains withincoming subscriptions.
SIPS2SIncomingDomains
This counter represents the total foreign domains withoutgoing subscriptions.
SIPS2SOutgoingDomains
This counter represents the total active SIP outgoingsubscriptions.
SIPS2SSubscriptionsOut
This counter represents the total active SIP incomingsubscriptions.
SIPS2SSubscriptionsIn
Cisco Unified Real-Time Monitoring Tool Administration Guide, Release 11.0(1) 291
Performance Counters and AlertsCisco XCP Router

Counter descriptionCounter
This counter represents the total pending SIP outgoingsubscriptions.
SIPS2SSubscriptionsPending
This counter represents the total SIP NOTIFYmessages received.
SIPS2SNotifyIn
This counter represents the total SIP NOTIFYmessages sent.
SIPS2SNotifyOut
This counter represents the total SIP MESSAGEmessages received.
SIPS2SMessageIn
This counter represents the total SIP MESSAGEmessages sent.
SIPS2SMessageOut
This counter represents the SIP BYE messagesreceived.
SIPS2SByeIn
This counter represents the SIP INVITE messagesreceived.
SIPS2SInviteIn
This counter represents the SIP INVITE messagessent.
SIPS2SInviteOut
Cisco XCP S2SThe following table contains information about Cisco XCP Server-to-Server (S2S) performance counters.
Table 100: Cisco XCP S2S Counters
Counter descriptionCounters
This counter represents the total foreign domains withincoming subscriptions.
S2SIncomingDomains
This counter represents the total foreign domains withoutgoing subscriptions.
S2SOutgoingDomains
This counter represents the total failed incomingdialback attempts.
S2SFailedDialbackIn
This counter represents the total failed outgoingdialback attempts.
S2SFailedDialbackOut
Cisco Unified Real-Time Monitoring Tool Administration Guide, Release 11.0(1)292
Performance Counters and AlertsCisco XCP S2S

Cisco XCP TCThe following table contains information about Cisco XCP Text Conferencing (TC) performance counters.
Table 101: Cisco XCP TC Counters
Counter descriptionCounter
This counter represents the total number of all typesof text chat rooms.
TcTotalRooms
This counter represents the total number of ad hoctext chat rooms.
TcAdhocRooms
This counter represents the total number of permanenttext chat rooms.
TcPersistentRooms
This counter represents the total number of createdtext chat rooms.
TcCreatedRooms
This counter represents the total number of deletedtext chat rooms.
TcDeletedRooms
This counter represents the total number of group chatmessages received.
TcMessagesIn
This counter represents the total number of group chatmessages sent.
TcMessagesOut
This counter represents the total number of privateand invite messages received.
TcDirectedMessagesIn
This counter represents the total number of messagesarchived to the external database.
TcMessagesPersisted
This counter represents the total number of messagesnot archived to the external database.
TcMessagesIgnored
Cisco XCP TC RoomThe following table contains information about the Cisco XCP TC Room performance counters.
Cisco Unified Real-Time Monitoring Tool Administration Guide, Release 11.0(1) 293
Performance Counters and AlertsCisco XCP TC

Table 102: Cisco XCP TC Room Counters
Counter descriptionCounter
This counter represents the number of occupants ona per-chat room basis.
TCRoomNumOccupants
This counter represents the number of bytes sent ona per-chat room basis.
TCRoomBytesSent
This counter represents the number of bytes receivedon a per-chat room basis.
TCRoomBytesRecv
This counter represents the number of stanzas senton a per-chat room basis
TCRoomStanzasSent
This counter represents the number of stanzasreceived on a per-chat room basis.
TCRoomStanzasRecv
This counter represents the number of messages senton a per-chat room basis.
TCRoomMsgPacketSent
This counter represents the number of messagesreceived on a per-chat room basis.
TCRoomMsgPacketsRecv
This counter represents the number of presencepackets sent on a per-chat room basis.
TCRoomPresencePacketsSent
This counter represents the number of presencepackets received on a per-chat room basis.
TCRoomPresencePacketsRecv
This counter represents the number of IQ packets senton a per-chat room basis.
TCRoomIQPacketsSent
This counter represents the number of iq packetsreceived on a per-chat room basis.
TCRoomIQPacketsRecv
Cisco XCP WebCMThe following table contains information about the Cisco XCP Web Connection Manager performancecounters.
Table 103: Cisco XCP WebCM Counters
Counter descriptionCounter
This counter represents the cumulative total numberof connected XMPP client sessions.
WebCMConnectedSockets
Cisco Unified Real-Time Monitoring Tool Administration Guide, Release 11.0(1)294
Performance Counters and AlertsCisco XCP WebCM

Counter descriptionCounter
This counter represents the total number of failedconnection requests.
WebCMFailedRequests
Cisco Unity Connection Counters
CUC Data StoreThe CUCData Store object provides information about registered database usage by Cisco Unity Connection.The following table contains information about CUC Data Store counters.
Table 104: CUC Data Store
Counter DescriptionsCounters
Amount of database server virtual-address space [in kilobytes].Allocated Memory [kb]
Total number of connections to the database server.Database Connections
The percentage of free space available in all chunks.Disk Free (percentage)
Total number of disk read operations for all data chunks (rows) in thelast 30 seconds.
Disk Reads
Number of read operations from the disk per second.Disk Reads/second
Number of write operations to the disk in the last 30 seconds.Disk Writes
Number of write operations to the disk per second.Disk Writes/second
Amount of database server shared memory used [in kilobytes].Shared Memory [kb]
CUC Data Store: DatabasesThe CUCData: Databases object provides information about the databases that Cisco Unity Connection uses.
Table 105: CUC Data Store: Databases
Counter DescriptionsCounters
The amount of free space available [in kilobytes] in the selected datachunk.
Disk Free/chunk [kb]
Cisco Unified Real-Time Monitoring Tool Administration Guide, Release 11.0(1) 295
Performance Counters and AlertsCisco Unity Connection Counters

Counter DescriptionsCounters
Number of read operations for the selected data chunk.Disk Reads/chunk
Number of write operations for the selected data chunk.Disk Writes/chunk
CUC Digital NotificationsThe CUC Digital Notifications object provides information about the total number of SMS and SMTPnotifications. The following table contains information about CUC Digital Notification counters.
Table 106: CUC Digital Notifications
Counter DescriptionsCounters
The total number of SMS notifications failing to connect.SMS Notifications Failed
The total number of SMS notifications sent to subscribers by CiscoUnity Connection.
SMS Notifications Total
The total number of SMTP notifications that Cisco Unity Connectionsent to subscribers.
SMTP Notifications Total
The counter to maintain count of summary notifications.HTMLNotificationswith Summaryof voice messages
The counter to maintain count of summary notifications sent in lastone minute.
HTMLNotificationswith Summaryof voice messages in Last OneMinute
The counter to maintain count of scheduled summary notificationssent.
Scheduled Notifications Total
The counter to maintain count of scheduled summary notifications sentin last minute.
Scheduled Notifications in Last OneMinute
The counter to maintain count of scheduled summary notificationsdropped (not sent) because the parent schedule was turned off.
Scheduled Notifications droppeddue to Parent Schedule off
The counter to maintain count of scheduled summary notificationsdropped (not sent) in last one minute because the parent schedule wasturned off.
Scheduled Notifications droppeddue to Parent Schedule off in LastOne Minute
The total number of missed call notifications sent fromCisco UnityConnection.
Missed Call Notifications Total
Cisco Unified Real-Time Monitoring Tool Administration Guide, Release 11.0(1)296
Performance Counters and AlertsCUC Digital Notifications
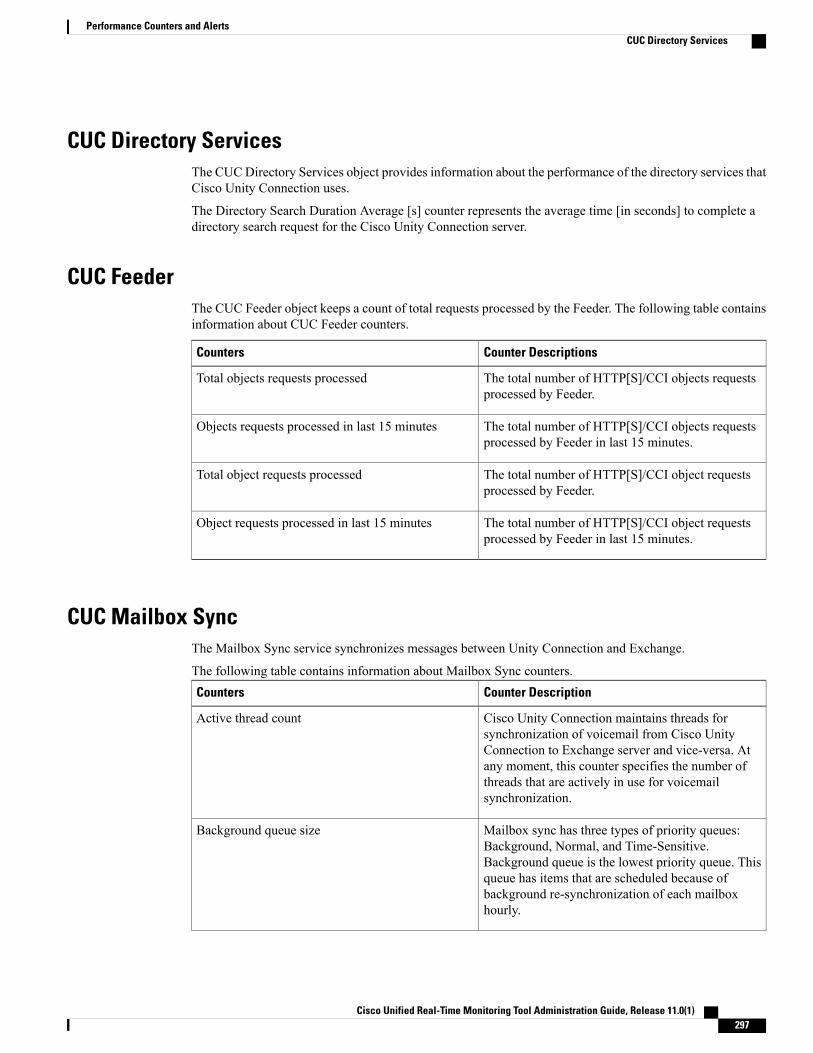
CUC Directory ServicesThe CUCDirectory Services object provides information about the performance of the directory services thatCisco Unity Connection uses.
The Directory Search Duration Average [s] counter represents the average time [in seconds] to complete adirectory search request for the Cisco Unity Connection server.
CUC FeederThe CUC Feeder object keeps a count of total requests processed by the Feeder. The following table containsinformation about CUC Feeder counters.
Counter DescriptionsCounters
The total number of HTTP[S]/CCI objects requestsprocessed by Feeder.
Total objects requests processed
The total number of HTTP[S]/CCI objects requestsprocessed by Feeder in last 15 minutes.
Objects requests processed in last 15 minutes
The total number of HTTP[S]/CCI object requestsprocessed by Feeder.
Total object requests processed
The total number of HTTP[S]/CCI object requestsprocessed by Feeder in last 15 minutes.
Object requests processed in last 15 minutes
CUC Mailbox SyncThe Mailbox Sync service synchronizes messages between Unity Connection and Exchange.
The following table contains information about Mailbox Sync counters.Counter DescriptionCounters
Cisco Unity Connection maintains threads forsynchronization of voicemail from Cisco UnityConnection to Exchange server and vice-versa. Atany moment, this counter specifies the number ofthreads that are actively in use for voicemailsynchronization.
Active thread count
Mailbox sync has three types of priority queues:Background, Normal, and Time-Sensitive.Background queue is the lowest priority queue. Thisqueue has items that are scheduled because ofbackground re-synchronization of each mailboxhourly.
Background queue size
Cisco Unified Real-Time Monitoring Tool Administration Guide, Release 11.0(1) 297
Performance Counters and AlertsCUC Directory Services

Counter DescriptionCounters
Normal queue has moderate priority. This queue hasitems that are scheduled because of messagingoperation (such as message CREATE, READ,UNREAD, DELETE) performed by user or anyconfiguration update by administrator on UnifiedMessaging page on Cisco Unity ConnectionAdministration.
Normal queue size
Time sensitive queue has highest priority. This queuehas such items that are scheduled because ofkeep-alive message sent by Cisco Unity Connectionto Exchange server to keep subscription alive. Thisis applicable for 2003 Exchange server only.
Time sensitive queue size
It specifies the number of times the CuMbxSyncprocess fails to retrieve or update some data fromdatabase.
Total connection errors
It specifies the number of times a user mailbox hasbeen setup for subscription. Any communication errorbetween Unity Connection and Exchange, results inuser mailbox remove and re-add.
Total Mailbox Adds
It specifies the number of times a user mailbox hasbeen setup for un-subscription. Any communicationerror betweenUnity Connection and Exchange, resultsin user mailbox remove and re-add.
Total Mailbox Removes
It specifies the total number of times user mailbox isresynchronized with Exchange server. Cisco UnityConnection does background resynchronization forall the user mailboxes hourly.
Total Resyncs
Whenever there is a communication failure betweenCisco Unity connection and Exchange server, UnityConnection does mailbox synchronization retry forparticular user mailbox. This counter specifies thecount of such occurrences.
Total Retries
It specifies number of times anymessaging operation,such as CREATE, READ, UNREAD, and DELETE,has been performed on any user mailbox.
Total Work Items
Cisco Unified Real-Time Monitoring Tool Administration Guide, Release 11.0(1)298
Performance Counters and AlertsCUC Mailbox Sync

CUC Message StoreThe CUC Message Store object provides information about the performance of the Cisco Unity Connectionmessage store. The following table contains information about CUC Message Store counters.
Table 107: CUC Message Store
Counter DescriptionsCounters
Total number of messages sent to the Bad Mail folder since the lastrestart of the MTA server.
Bad Mail Total
Total number of delivery receipts since the last restart of the MTAserver.
Delivery Receipts Total
Number of incoming requests to recall local copies of messages initiatedby remote senders on other network locations.
Incoming Recalls
Number of intersite messages delivered in the last minute.Intersite Messages Delivered PerMinute
Total number of intersite messages delivered since the last restart ofthe MTA server.
Intersite Messages Delivered Total
Number of intersite messages received in the last minute.Intersite Messages Received PerMinute
Total number of intersite messages received since the last restart ofthe MTA server.
Intersite Messages Received Total
Total number of intersite messages that have been delivered andreceived since the last restart of the MTA server.
Intersite Messages Total
Number of message recalls initiated by local senders on this server.Local Recalls
The average size of the MTA at each sample in kilobytes.Message Size Average [kb]
Total number of messages delivered since the last restart of the MTAserver.
Messages Delivered Total
Total number of messages received Per Minute by MTA.Messages Received Per Minute
Total number of messages received since the last restart of the MTAserver.
Messages Received Total
Total number of non-delivery receipts since the last restart of the MTAserver.
Non-delivery Receipts Total
Cisco Unified Real-Time Monitoring Tool Administration Guide, Release 11.0(1) 299
Performance Counters and AlertsCUC Message Store

Counter DescriptionsCounters
Total number of message recalls. This number includes each individualcopy of a message that was sent to multiple recipients, so this numbercould be much larger than the Total Recalls, Local and Remoteperformance counter.
Number of Items Recalled
The number of messages currently queued in the MTA.Queued Messages Current
Total number of read receipts since the last restart of the MTA server.Read Receipts Total
Total number of retries since the last restart of the MTA server.Retries Total
Total number of dispatch messages that have been delivered toindividual user mailboxes since theMTA started. This number includesa count of each individual copy of a message sent to multiple recipients.
Total dispatch message folder itemsdelivered
Total number of dispatch messages that have been accepted since thelast restart of the MTA server
Total dispatch messages accepted
Total number of dispatch messages that have been delivered since theMTA started. This number includes each message just once, regardlessof the number of recipients.
Total dispatch messages delivered
Total number of individual copies of dispatch messages that have beendeclined since the last restart of the MTA server.
Total dispatch message itemsrejected
Total number of dispatch messages that have been removed from usermailboxes due to the message being accepted by another user sincethe last restart of the MTA server
Total dispatch messages removeddue to acceptance
Total number of message recalls initiated by local and remote senders.This number should be equal to the total of Incoming Recalls and LocalRecalls performance counters.
Total recalls, local and remote
The average time [in seconds] to decode voice messages in MIMEformat to the original format.
VPIM Message Decode DurationAverage [s]
The average time [in seconds] to encode voice messages to MIMEformat.
VPIM Message Encode DurationAverage [s]
The number of VPIM messages that the Cisco Unity ConnectionMessages Store delivered within a minute.
VPIM Messages Delivered PerMinute
The total number of VPIM messages that the Cisco Unity ConnectionMessages Store delivered.
VPIM Messages Delivered Total
The number of VPIM messages that the Cisco Unity ConnectionMessages Store received per minute.
VPIM Messages Received PerMinute
Cisco Unified Real-Time Monitoring Tool Administration Guide, Release 11.0(1)300
Performance Counters and AlertsCUC Message Store
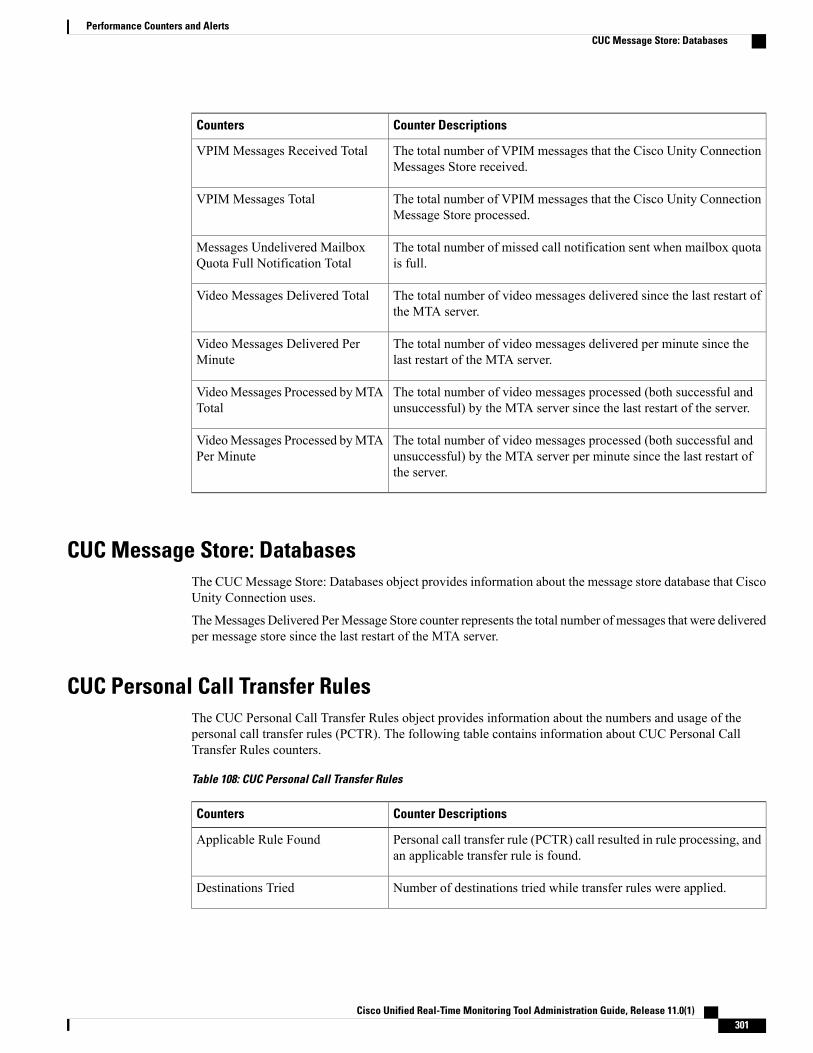
Counter DescriptionsCounters
The total number of VPIM messages that the Cisco Unity ConnectionMessages Store received.
VPIM Messages Received Total
The total number of VPIM messages that the Cisco Unity ConnectionMessage Store processed.
VPIM Messages Total
The total number of missed call notification sent when mailbox quotais full.
Messages Undelivered MailboxQuota Full Notification Total
The total number of video messages delivered since the last restart ofthe MTA server.
Video Messages Delivered Total
The total number of video messages delivered per minute since thelast restart of the MTA server.
Video Messages Delivered PerMinute
The total number of video messages processed (both successful andunsuccessful) by the MTA server since the last restart of the server.
VideoMessages Processed byMTATotal
The total number of video messages processed (both successful andunsuccessful) by the MTA server per minute since the last restart ofthe server.
VideoMessages Processed byMTAPer Minute
CUC Message Store: DatabasesThe CUCMessage Store: Databases object provides information about the message store database that CiscoUnity Connection uses.
TheMessages Delivered PerMessage Store counter represents the total number of messages that were deliveredper message store since the last restart of the MTA server.
CUC Personal Call Transfer RulesThe CUC Personal Call Transfer Rules object provides information about the numbers and usage of thepersonal call transfer rules (PCTR). The following table contains information about CUC Personal CallTransfer Rules counters.
Table 108: CUC Personal Call Transfer Rules
Counter DescriptionsCounters
Personal call transfer rule (PCTR) call resulted in rule processing, andan applicable transfer rule is found.
Applicable Rule Found
Number of destinations tried while transfer rules were applied.Destinations Tried
Cisco Unified Real-Time Monitoring Tool Administration Guide, Release 11.0(1) 301
Performance Counters and AlertsCUC Message Store: Databases

Counter DescriptionsCounters
Calls that are subject to personal call transfer rule (PCTR) processing:user assigned COS is enabled for PCTR, user is a Cisco UnifiedCommunications Manager user, user has not disabled PCTR.
PCTR Calls
Number of rules that are evaluated during rule processing in a personalcall transfer rule (PCTR) call.
Rules Evaluated
Number of times that a subscriber was reached while transfer ruleswere applied.
Subscriber Reached
Number of times that Cisco Unity Connection fails to transfer a callto a destination while personal call transfer rules were applied. Transferfailures include all conditions except when the called destination isconnected, busy, or RNA or times out. A caller hanging up during atransfer gets considered a transfer failure.
Transfer Failed
Number of times that voice mail was reached while transfer rules wereapplied.
Voicemail Reached
CUC Phone SystemThe CUC Phone System object provides information about the performance of the phone system integration.The following table contains information about CUC Phone System counters.
Table 109: CUC Phone System
Counter DescriptionsCounters
The current number of incoming and outgoing calls to the Cisco UnityConnection server.
Call Count Current
The total number of incoming and outgoing calls to the Cisco UnityConnection server.
Call Count Total
The average duration [in seconds] of incoming and outgoing calls fromthe Cisco Unity Connection server.
Call Duration Average [s]
The total duration [in seconds] of incoming and outgoing calls fromthe Cisco Unity Connection server.
Call Duration Total [s]
The total number of unanswered calls on the Cisco Unity Connectionserver.
Calls Unanswered Total
The current number of incoming calls that were received as CallForward Busy.
Incoming Calls CFB Current
Cisco Unified Real-Time Monitoring Tool Administration Guide, Release 11.0(1)302
Performance Counters and AlertsCUC Phone System

Counter DescriptionsCounters
The total number of incoming calls that were received as Call ForwardBusy.
Incoming Calls CFB Total
The current number of incoming calls that were received as CallForward No Answer.
Incoming Calls CFNA Current
The total number of incoming calls that were received as Call ForwardNo Answer.
Incoming Calls CFNA Total
The current number of incoming calls.Incoming Calls Current
The current number of incoming calls that were received as direct calls.Incoming Calls Direct Current
The total number of incoming calls that were received as direct calls.Incoming Calls Direct Total
The average duration [in seconds] of all incoming calls to the CiscoUnity Connection server.
Incoming Calls Duration Average[s]
The total duration [in seconds] of all incoming calls to the Cisco UnityConnection server.
Incoming Calls Duration Total [s]
The total number of incoming calls without integration information.Incoming Calls No Info Total
The total number of incoming calls.Incoming Calls Total
The average time [in seconds] to complete all message notificationsfrom the Cisco Unity Connection server.
Message Notification DurationAverage [s]
The total time [in seconds] to complete all message notifications fromthe Cisco Unity Connection server.
MessageNotificationDuration Total[s]
The total number of message notifications that failed to connect to adestination number.
Message Notifications Failed
The total number of message notifications that Cisco Unity Connectionsent to subscribers.
Message Notifications Total
The average duration [in milliseconds] of all MWI requests from theCisco Unity Connection server.
MWI Request Duration Average[ms]
The total duration [in milliseconds] of all MWI requests from the CiscoUnity Connection server.
MWI Request Duration Total [ms]
The total number ofMWI requests that failed to connect to a destinationnumber or complete MWI operation.
MWI Requests Failed Total
The total number of MWI requests that Cisco Unity Connection sent.MWI Requests Total
Cisco Unified Real-Time Monitoring Tool Administration Guide, Release 11.0(1) 303
Performance Counters and AlertsCUC Phone System

Counter DescriptionsCounters
The average duration [in seconds] of all outgoing calls from the CiscoUnity Connection server.
Outgoing Calls Duration Average[s]
The total duration [in seconds] of all outgoing calls from the CiscoUnity Connection server.
Outgoing Calls Duration Total [s]
The number of completed release transfers from the Cisco UnityConnection server.
Outgoing Calls Release TransfersCompleted
The number of release transfers from the Cisco Unity Connectionserver that failed to connect to a destination number.
Outgoing Calls Release TransfersFailed
The total number of release transfers that were attempted from theCisco Unity Connection server.
Outgoing Calls Release TransfersTotal
The number of completed supervised transfers from the Cisco UnityConnection server.
Outgoing Calls SupervisedTransfers Completed
The number of supervised transfers from the Cisco Unity Connectionserver that were dropped while in progress.
Outgoing Calls SupervisedTransfers Dropped
The number of supervised transfers from the Cisco Unity Connectionserver that failed to connect to a destination number.
Outgoing Calls SupervisedTransfers Failed
The total number of supervised transfers from the Cisco UnityConnection server.
Outgoing Calls SupervisedTransfers Total
The total number of release and supervised transfers that Cisco UnityConnection attempted.
Outgoing Calls Transfers Total
The average time [in seconds] to complete all pager notifications fromthe Cisco Unity Connection server.
Pager Notifications DurationAverage [s]
The total time [in seconds] to complete all pager notifications from theCisco Unity Connection server.
Pager Notifications Duration Total[s]
The total number of pager notifications that failed to connect to adestination number.
Pager Notifications Failed
The total number of pager notifications that Cisco Unity Connectionsent to subscribers.
Pager Notifications Total
The total time [in seconds] that any port remains idle between incomingcalls to the Cisco Unity Connection server.
Port Idle Duration [s]
The average time [in seconds] that any port remains idle betweenincoming calls to the Cisco Unity Connection server.
Port Idle Duration Average [s]
Cisco Unified Real-Time Monitoring Tool Administration Guide, Release 11.0(1)304
Performance Counters and AlertsCUC Phone System

Counter DescriptionsCounters
The current number of integration ports that are not in use by the CiscoUnity Connection server.
Ports Idle Current
The current number of integration ports that are in use by the CiscoUnity Connection server.
Ports In Use Current
The current count of the ports that no longer respond or are otherwiseunusable by Cisco Unity Connection.
Ports Locked
The total number of missed call notifications triggered by theCiscoUnity Connection server.
Missed Call Total
CUC Phone System: PortsThe CUC Phone System: Ports object provides information about the voice messaging ports on Cisco UnityConnection. The following table contains information about CUC Phone System: Ports counters.
Table 110: CUC Phone System: Ports
Counter DescriptionsCounters
The total number of calls that were received on this port since the CiscoUnity Connection server was last restarted. This includes all types ofcalls: Incoming calls, MWI dialouts, Notification dialouts, TRAPdialouts, and VPIM dialouts.
Port Calls
The distribution percentage of idle ports on the Cisco Unity Connectionserver.
Port Idle Percent
The average time [in seconds] that a port has been actively processingcalls.
Port Usage Duration Average [s]
The total time [in seconds] that a port has been actively processingcalls.
Port Usage Duration Total [s]
The distribution percentage of calls into ports on the Cisco UnityConnection server.
Port Usage Percent
CUC ReplicationThe CUCReplication object provides information about the replication for CiscoUnity Connection redundancy.The following table contains information about CUC Replication counters.
Cisco Unified Real-Time Monitoring Tool Administration Guide, Release 11.0(1) 305
Performance Counters and AlertsCUC Phone System: Ports

Table 111: CUC Replication
Counter DescriptionsCounters
How long file exists before replication starts.File Replication Latency [s]
Maximum file replication latency since the service started.File Replication Latency Max [s]
Transfer rate for each replicated file.File Transfer Rate [kbytes/s]
Number of files replicated since the service started.Files Replicated Total
Number of bytes transferred each second.Transfer Rate [bytes/s]
CUC Replicator: Remote Connection LocationsThe CUCReplicator: Remote Connection Locations object provides information about replication with remoteConnection locations. The following table contains information about CUC Replicator: Remote ConnectionLocations counters.
Table 112: CUC Replicator: Remote Connection Locations
Counter DescriptionsCounters
The number of replication dependencies requested received from theConnection location.
Dependencies Requests Received
The number of replication dependencies requests sent to the Connectionlocation.
Dependencies Requests Sent
The number of replication messages from this Connection locationthat were not received because of failures.
Message Receive Failures
The number of replication messages to the Connection location thatwere not sent because of failures.
Message Send Failures
The number of replication messages received from the Connectionlocation.
Messages Received
The number of replication messages sent to the Connection location.Messages Sent
The number of replicationNDRmessages received from the Connectionlocation.
NDR Messages Received
The number of USN request received from the Connection location.This usually indicates that a USN timeout occurred on the remote node.
USN Requests Received
Cisco Unified Real-Time Monitoring Tool Administration Guide, Release 11.0(1)306
Performance Counters and AlertsCUC Replicator: Remote Connection Locations

CUC Sessions: Calendar AccessThe CUC Sessions: Calendar Access object provides information about the Cisco Unity Connection calendarintegration. The following contains information about CUC Sessions: Calendar Access counters.
Table 113: CUC Sessions: Calendar Access
Counter DescriptionsCounters
Total number of Exchange connection failures.Connections To Exchange Failure -Total
Total number of MeetingPlace connection failures.Connections To MP Failure - Total
Total number of Exchange calendar requests.Exchange Requests - Total
Current Exchange Response Time in milliseconds.Exchange Response Time [ms] -Current
Total number of requests to join the meeting.Meeting Join Request - Total
Total number of MeetingPlace calendar requests.MP Request - Total
Current MeetingPlace Response Time in milliseconds.MP Response Time [ms] - Current
CUC Sessions: E-Mail AccessThe CUC Sessions: E-mail Access object provides information about e-mail voice sessions. The followingtable contains information about CUC Sessions: E-mail Access counters.
Table 114: CUC Sessions: E-Mail Access
Counter DescriptionsCounters
The total number of e-mail messages that were read since the last restartof Cisco Unity Connection.
Messages Read - Total
The average duration [in milliseconds] of all e-mail sessions asmeasured on a per-call basis.
Session Duration Average [ms]
The total duration [in milliseconds] of all e-mail sessions as measuredon a per-call basis.
Session Duration Total [ms]
The number of active e-mail voice sessions.Sessions - Current
The total number of e-mail voice sessions since the last restart of CiscoUnity Connection.
Sessions - Total
Cisco Unified Real-Time Monitoring Tool Administration Guide, Release 11.0(1) 307
Performance Counters and AlertsCUC Sessions: Calendar Access

CUC Sessions: IMAP ServerThe CUC Sessions: IMAP Server object provides information about the IMAP server. The following tablecontains information about CUC Sessions: IMAP Server counters.
Table 115: CUC Sessions: IMAP Server
Counter DescriptionsCounters
The number of IMAP commands per minute.Commands per minute
The average duration [in seconds] of the connections to the IMAPserver in the previous minute.
Connection Length Average [s]
The number of idle sessions on the IMAP server.Current IDLE Sessions
The total number of IMAP errors that the IMAP server returned sincethe last restart of the IMAP server.
Errors Total
The total number of EXAMINE requests to the IMAP server since thelast restart of the IMAP server.
EXAMINE Requests Total
The total number of failed LOGIN requests to the IMAP server sincethe last restart of the IMAP server.
Failed Login Requests Total
The total number of FETCH requests to the IMAP server since the lastrestart of the IMAP server.
FETCH Requests Total
The total number of LOGIN requests to the IMAP server since the lastrestart of the IMAP server.
Login Requests Total
The total number of LOGOUT requests to the IMAP server since thelast restart of the IMAP server.
Logout Requests Total
The total number of IMAP FETCH commands that have returned thebody of the a message since the IMAP was last restarted.
Messages Read Total
The number of IMAP FETCH commands in the previous hour thatreturned the body of a message.
Messages Read/hour
Average number of messages that the IMAP FETCH commandreturned.
Messages/fetch Average
The total number of NOOP requests to the IMAP server since the lastrestart of the IMAP server.
NOOP Requests Total
The response time [in milliseconds] for IMAP commands.Response Time [ms]
Cisco Unified Real-Time Monitoring Tool Administration Guide, Release 11.0(1)308
Performance Counters and AlertsCUC Sessions: IMAP Server

Counter DescriptionsCounters
The total number of SEARCH requests to the IMAP server since thelast restart of the IMAP server.
SEARCH Requests Total
The number of active socket connections to the IMAP server.Socket Connections Current
The total number of socket connections that have been made to theIMAP server since it was last restarted.
Socket Connections Total
The total number of STARTTLS requests to the IMAP server sincethe last restart of the IMAP server. This counter also increments whenclients connect to the IMAP SSL port directly.
STARTTLS Requests Total
The total number of STATUS requests to the IMAP server since thelast restart of the IMAP server.
STATUS Requests Total
The number of active Transport Layer Security connections to theIMAP server.
TLS Connections Current
The total number of failed TLS connections to the IMAP server sincethe last restart of the IMAP server.
TLS Errors Total
Average Unsolicited Notify Response Time [in milliseconds] for theIMAP server.
Unsolicited Notify Response TimeAverage [ms]
Total number of Unsolicited Notify Responses that the IMAP servermade since it was last restarted.
Unsolicited Notify Responses Total
CUC Sessions: RSSThe CUC Sessions: RSS object provides information about RSS sessions. The following table containsinformation about CUC Sessions: RSS counters.
Table 116: CUC Sessions: RSS
Counter DescriptionsCounters
The total number of RSS messages that were offered for streaming.RSS Messages Offered Total
The total number of RSS messages that the Cisco Unity Connectionserver streamed.
RSS Messages Streamed Total
The current number of RSS sessions.RSS Sessions Current
The total number of RSS sessions.RSS Sessions Total
Cisco Unified Real-Time Monitoring Tool Administration Guide, Release 11.0(1) 309
Performance Counters and AlertsCUC Sessions: RSS

CUC Sessions: SMTP ServerThe CUC Sessions: SMTP Server object provides information about SMTP server sessions. The followingtable contains information about CUC Sessions: SMTP Server counters.
Table 117: CUC Sessions: SMTP Server
Counter DescriptionsCounters
The number of SMTP messages that were delivered since the start ofthe system.
Total Delivered Messages
The number of SMTP messages delivered or received since the startof the system.
Total Messages
The number of SMTP messages that were received since the start ofthe system.
Total Received Messages
CUC Sessions: SpeechView ProcessorThe CUC Sessions: SpeechView Processor object provides information about the SpeechView Processorservice. The following table contains information about CUC Sessions: SpeechView Processor counters.
Table 118: CUC Sessions: SpeechView Processor
Counter DescriptionsCounters
The average time it takes to receive successful transcriptions from theexternal service.
Average wait time
The total number of failed transcriptions since the last restart of theSpeechView Processor service.
Total failures
The total number transcriptions that timed out since the last restart ofthe SpeechView Processor service.
Total timeouts
The total number successful transcriptions since the last restart of theSpeechView Processor service.
Transcribed messages
CUC Sessions: TRaPThe CUC Sessions: TRaP object provides information about telephone record and playback (TRaP) sessions.The following table contains information about CUC Sessions: TRaP counters.
Cisco Unified Real-Time Monitoring Tool Administration Guide, Release 11.0(1)310
Performance Counters and AlertsCUC Sessions: SMTP Server

Table 119: CUC Sessions: TRaP
Counter DescriptionsCounters
The average duration [in seconds] of all reverse TRaP sessions.Reverse TRaP Session DurationAverage [s]
The total duration [in seconds] of all reverse TRaP sessions.Reverse TRaP Session DurationTotal [s]
The current number of active reverse TRaP sessions.Reverse TRaP Sessions Current
The total number of reverse TRaP sessions since the last start of CiscoUnity Connection.
Reverse TRaP Sessions Total
The average duration [in seconds] of all TRaP sessions.TRaP Session Duration Average [s]
The total duration [in seconds] of all TRaP sessions.TRaP Session Duration Total [s]
The current number of active TRaP sessions.TRaP Sessions Current
The total number of TRaP sessions since the last start of Cisco UnityConnection.
TRaP Sessions Total
CUC Sessions: TTSThe CUC Sessions: TTS object provides information about text-to-speech (TTS) sessions. The followingtable contains information about CUC Sessions: TTS counters.
Table 120: CUC Sessions: TTS
Counter DescriptionsCounters
The average duration [in seconds] of all TTS sessions.Session Duration Average [s]
The total duration [in seconds] of all TTS sessions.Session Duration Total [s]
The current number of active TTS voice sessions.Sessions Current
The total number of TTS voice sessions since the last start of CiscoUnity Connection.
Sessions Total
CUC Sessions: Unified ClientThe CUC Sessions: Unified Client object provides information about the Unified Client for Cisco UnityConnection.
Cisco Unified Real-Time Monitoring Tool Administration Guide, Release 11.0(1) 311
Performance Counters and AlertsCUC Sessions: TTS

The Connections Total counter represents the total number of Unified Client IMAP requests.
CUC Sessions: VideoCUC Sessions Video: Video session object provides information about video sessions with video server. Thefollowing table contains information about CUC Sessions: Video
Table 121: CUC Sessions: Video
Counter DescriptionsCounters
The total number of Audio calls negotiated despitevideo offer.
Audio calls Negotiated Total
The total number of audio calls negotiated despitevideo offer in last one minute.
Audio Calls Negotiated In Last One Minute
The total number of outgoing video calls transferredas Release to Switch.
Outgoing Video calls Release Transfer
The total number of Supervise transfers initiated fromvideo calls since the last restart of Cisco UnityConnection.
Supervise Transfer Calls Total
The total number of video calls downgraded to audiosince the last restart of Unity Connection.
Video calls downgraded to Audio Total
The total number of video calls downgraded to audioin last one minute.
Video calls downgraded to Audio In Last OneMinute
Total number of video calls downgraded with prompt"Video services are not available using audio onlyfor duration of this call".
Video calls downgraded with prompt total
Total number of video calls downgraded with prompt"Video services are not available using audio onlyfor duration of this call" in last minute.
Video calls downgraded with prompt in Last OneMinute
The total number of video session requests sent fromUnity Connection to Video Server.
Video Sessions Total
The total number of current video session requestssent from Unity Connection to Video Server.
Video Sessions Current
The total number of video session playbacks sincethe last restart of Cisco Unity Connection.
Video Session Playbacks Total
The total number of current video session playbacks.Video Session Playbacks Current
Cisco Unified Real-Time Monitoring Tool Administration Guide, Release 11.0(1)312
Performance Counters and AlertsCUC Sessions: Video

Counter DescriptionsCounters
The total number of image playbacks from videoserver since the last restart of Unity Connection.
Video Media File Playbacks Total
The current number of Video Media File playbacksfrom video server.
Video Media File Playbacks Current
The total number of Video Recordings saved at videoserver since the last restart of Unity Connection.
Video Recordings Total
The current number of Video Recordings saved atvideo server.
Video Recordings Current
The total number of Video Playback completed eventsfrom video server since the last restart of UnityConnection.
Video Playback Completed Events from MS Total
The total number of Video Playback completed eventsfrom video server since last one minute.
Video Playback Completed Events from MS In LastOne Minute
The total number of Keep Alive sent by UnityConnection to video server since the last restart ofUnity Connection.
Video Keep Alive Total
The total number of Keep Alive sent by UnityConnection to video server since last one minute.
Video Keep Alive In Last One Minute
The total number of GetMediaCapabilities sent byUnity Connection to video server since the last restartof Unity Connection.
Video Get Media Capabilities Total
The total number of GetMediaCapabilities sent byUnity Connection to video server since last oneminute.
Video Get Media Capabilities In Last One Minute
The total number of SignIn request sent by UnityConnection to video server since the last restart ofUnity Connection.
Video SignIn Total
The total number of SignIn sent by Unity Connectionto video server since last one minute.
Video SignIn Total In Last One Minute
The total number of KeyFrame requests sent duringvideo recording to EndPoint since the last restart ofCisco Unity Connection.
KeyFrame Request sent Total
The total number of KeyFrame requests sent duringvideo recording to EndPoint since the last restart ofCisco Unity Connection.
KeyFrame Request sent In Last One Minute
Cisco Unified Real-Time Monitoring Tool Administration Guide, Release 11.0(1) 313
Performance Counters and AlertsCUC Sessions: Video

Counter DescriptionsCounters
The total number of successful Video Recordingssince the last restart of Cisco Unity Connection.
Video Record Successful Total
The total number of video sessions failed since thelast restart of Cisco Unity Connection.
Video Sessions Failed Total
The total number of video sessions failed in last oneminute.
Video Session Failed In Last One Minute
The total number of connection timeout errors whileconnecting toMediaSense server since the last restartof Cisco Unity Connection. This counter is applicablefor the following events:
• During a video call
• At the time of sign in
• During exchange of media capabilities with theMediaSense server.
Media Sense Timeout Total
The total number of video messages that are playedas audio messages since the last restart of Cisco UnityConnection.
Video Play Failed Total
CUC Sessions: VoiceThe CUC Sessions: Voice object provides information about voice sessions. The following table containsinformation on CUC Sessions: Voice counters.
Table 122: CUC Sessions: Voice
Counter DescriptionsCounters
The delay [in milliseconds] that a caller experienced when the callerattempted to search through the directory. This counter measures thetime between the entered search criteria and the return results.
Delay - Directory Search [ms]
The delay [in milliseconds] that a caller experienced before any audiowas received. This counter measures the time between the systemreceiving a call and the time audio begins streaming to the caller.
Delay - Opening Greeting [ms]
The delay [in milliseconds] that a Cisco Unity Connection subscriberexperienced when the subscriber attempted to delete a message. Thiscounter measures the time between the last delete message prompt andthe confirmation of the deletion.
Delay - Subscriber Delete Message[ms]
Cisco Unified Real-Time Monitoring Tool Administration Guide, Release 11.0(1)314
Performance Counters and AlertsCUC Sessions: Voice
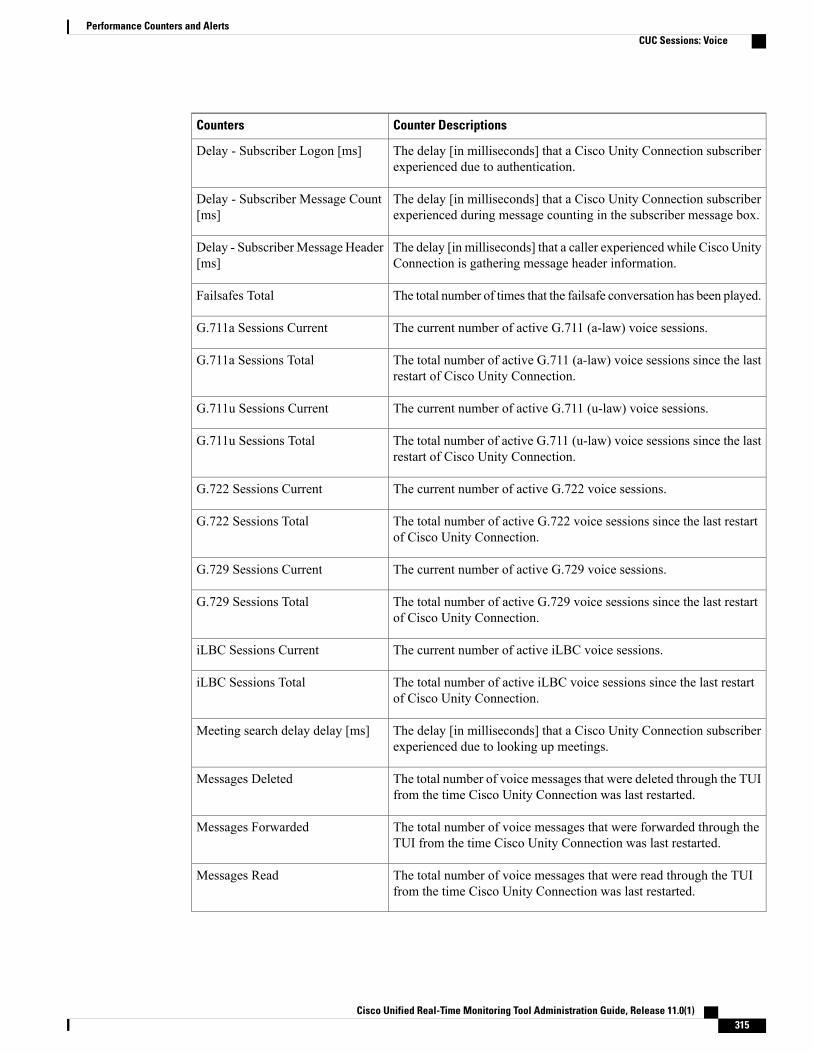
Counter DescriptionsCounters
The delay [in milliseconds] that a Cisco Unity Connection subscriberexperienced due to authentication.
Delay - Subscriber Logon [ms]
The delay [in milliseconds] that a Cisco Unity Connection subscriberexperienced during message counting in the subscriber message box.
Delay - Subscriber Message Count[ms]
The delay [in milliseconds] that a caller experienced while Cisco UnityConnection is gathering message header information.
Delay - SubscriberMessage Header[ms]
The total number of times that the failsafe conversation has been played.Failsafes Total
The current number of active G.711 (a-law) voice sessions.G.711a Sessions Current
The total number of active G.711 (a-law) voice sessions since the lastrestart of Cisco Unity Connection.
G.711a Sessions Total
The current number of active G.711 (u-law) voice sessions.G.711u Sessions Current
The total number of active G.711 (u-law) voice sessions since the lastrestart of Cisco Unity Connection.
G.711u Sessions Total
The current number of active G.722 voice sessions.G.722 Sessions Current
The total number of active G.722 voice sessions since the last restartof Cisco Unity Connection.
G.722 Sessions Total
The current number of active G.729 voice sessions.G.729 Sessions Current
The total number of active G.729 voice sessions since the last restartof Cisco Unity Connection.
G.729 Sessions Total
The current number of active iLBC voice sessions.iLBC Sessions Current
The total number of active iLBC voice sessions since the last restartof Cisco Unity Connection.
iLBC Sessions Total
The delay [in milliseconds] that a Cisco Unity Connection subscriberexperienced due to looking up meetings.
Meeting search delay delay [ms]
The total number of voice messages that were deleted through the TUIfrom the time Cisco Unity Connection was last restarted.
Messages Deleted
The total number of voice messages that were forwarded through theTUI from the time Cisco Unity Connection was last restarted.
Messages Forwarded
The total number of voice messages that were read through the TUIfrom the time Cisco Unity Connection was last restarted.
Messages Read
Cisco Unified Real-Time Monitoring Tool Administration Guide, Release 11.0(1) 315
Performance Counters and AlertsCUC Sessions: Voice

Counter DescriptionsCounters
The total number of voice messages that received replies through theTUI from the time Cisco Unity Connection was last restarted.
Messages Replied
The total number of voice messages that were sent through the TUIfrom the time Cisco Unity Connection was last restarted.
Messages Sent
The delay [in milliseconds] between anMRCP define-grammar requestand its response.
MRCPDefineGrammarDelay [ms]
The average delay [inmilliseconds] between anMRCP define-grammarrequest and its response.
MRCP Define Grammar DelayAverage [ms]
The maximum delay [in milliseconds] between an MRCPdefine-grammar request and its response.
MRCPDefineGrammarDelayMax[ms]
The delay [in milliseconds] between anMRCP request and its response.MRCP Delay [ms]
The average delay [in milliseconds] between anMRCP request and itsresponse.
MRCP Delay Average [ms]
The maximum delay [in milliseconds] between an MRCP request andits response.
MRCP Delay Max [ms]
The current number of all active voice sessions for any codec.Sessions Current
The total number of voice sessions for any codec - G.711 mu-law andG.729 - since the last restart of Cisco Unity Connection.
Sessions Total
The delay [in milliseconds] that a Cisco Unity Connection subscriberexperienced due to finding and loading a subscriber by DTMF ID.
Subscriber Lookup Delay [ms]
CUC Sessions: VUIThe CUC Sessions: VUI object provides information about the voice user interface (VUI). The followingtable contains information on CUC Sessions: VUI counters.
Table 123: CUC Sessions: VUI
Counter DescriptionsCounter
The delay [in milliseconds] that a user when experienced when theuser attempted to access a message. This counter measures the timebetween the voice command of intending to listen to a message andthe actual playback of the message.
Delay - SubscriberMessage Access[ms]
The total number of matches in the VUI conversation.Matches Total
Cisco Unified Real-Time Monitoring Tool Administration Guide, Release 11.0(1)316
Performance Counters and AlertsCUC Sessions: VUI

Counter DescriptionsCounter
The total number of messages that were read through the VUI fromthe time that Cisco Unity Connection was last restarted.
Messages Read
The total number of no-matches in the VUI conversation.No-matches Total
The average duration [in seconds] of a VUI session as measured on aper-call basis.
Session Duration Average/call [s]
The duration [in seconds] of all VUI sessions.Session Duration Total [s]
The current number of active VUI sessions for any codec.Sessions Current
The total number of VUI and voice sessions for any codec.Sessions Total
CUC Sessions: WebThe CUC Sessions: Web object provides information about the Cisco Personal Communications Assistant(Cisco PCA) and Cisco Unity Connection Administration sessions. The following table contains informationon CUC Sessions: Web counters.
Table 124: CUC Sessions: Web
Counter DescriptionsCounters
The maximum delay [in seconds] in authentication to a user Inbox orAssistant.
CPCA Authentication Delay Max[s]
The number of failed authentications.CPCA Failed Authentications Total
The total number of CPCA pages that the Cisco Unity Connectionserver served.
CPCA Pages Served Total
The number of requests in CPCA queue waiting to be processed.CPCA Requests In Queue Current
The total number of server busy pages that the Cisco Unity Connectionserver returned.
CPCA Server Busy Pages Total
The current number of CPCA sessions.CPCA Sessions Current
The total number of CPCA sessions.CPCA Sessions Total
The maximum delay [in seconds] in authentication to the SystemAdministrator window.
CUCA Authentication Delay Max[s]
The maximum time [in milliseconds] for the Tomcat server to respondto any given request.
CUCA Response Time Max [ms]
Cisco Unified Real-Time Monitoring Tool Administration Guide, Release 11.0(1) 317
Performance Counters and AlertsCUC Sessions: Web

CUC Sessions: Web E-Mail AccessThe CUC Sessions:Web E-mail Access object provides information about web e-mail access sessions (IMAP).The following table contains information about CUC Sessions: Web E-mail Access counters.
Table 125: CUC Sessions: Web E-Mail Access
Counter DescriptionsCounters
The total number of e-mail messages that were read since the last restartof Cisco Unity Connection.
Messages Read - Total
The average duration [in milliseconds] of all e-mail sessions asmeasured on a per-call basis.
Session Duration Average [ms]
The total duration [in milliseconds] of all e-mail sessions as measuredon a per-call basis.
Session Duration Total [ms]
The number of active e-mail voice sessions.Sessions - Current
The total number of e-mail voice sessions since the last restart of CiscoUnity Connection.
Sessions - Total
CUC System AgentThe CUC System Agent object records the information about the periodic system tasks. The following tablecontains information about CUC System Agent counters.
Counter DescriptionsCounters
The total number of messaging related files that havebeen shredded.
Message Related Files Shredded Total
The total number of messaging related files that havefailed to shred.
Message Related Files Shredded Failed
The cumulative number of HTTP(S) requests sent bythe Reader.
Total Number of Requests sent by HTTP[S]/CCI Link
The cumulative number of HTTP(S) requests thatwere successfully processed by the Feeder.
Total Number of successful response of HTTP[S]/CCIRequests
The cumulative number of HTTP(S) requests thatwere not successfully processed by the Feeder.
Total Number of failure response of HTTP[S]/CCIRequests
Cisco Unified Real-Time Monitoring Tool Administration Guide, Release 11.0(1)318
Performance Counters and AlertsCUC Sessions: Web E-Mail Access

Counter DescriptionsCounters
The cumulative number of Directory Objects thatwere successfully processed.
Total Number of Directory Objects SuccessfullyProcessed
Directory objects successfully processed per minute.Directory Objects Processed Successfully In Last OneMinute
The total number of delete requests sent toMediaSense server since the last restart of UnityConnection.
Delete Request sent to Media Sense Total
The total number of connection timeouts in responseto the delete requests sent toMediaSense server sincethe last restart of Unity Connection.
Media Sense Timeout While Delete Total
System Alerts
AuthenticationFailedAuthentication validates the user ID and password that are submitted during log in. An alarm gets raised whenan invalid user ID and/or the password gets used.
Default Configuration
Table 126: Default Configuration for the AuthenticationFailed RTMT Alert
Default ConfigurationValue
SelectedEnable Alert
CriticalSeverity
Enabled on listed serversEnable/Disable thisalert on the followingservers
Number of AuthenticationFailed events exceeds:
1 time in the last 1 minute
Threshold
Trigger alert immediatelyDuration
Trigger alert on every pollFrequency
24 hours dailySchedule
Cisco Unified Real-Time Monitoring Tool Administration Guide, Release 11.0(1) 319
Performance Counters and AlertsSystem Alerts

Default ConfigurationValue
SelectedEnable Email
DefaultTrigger Alert Action
CiscoDRFFailureThis alert occurs when the DRF backup or restore process encounters errors.
Default Configuration
Table 127: Default Configuration for the CiscoDRFFailure RTMT Alert
Default ConfigurationValue
SelectedEnable Alert
CriticalSeverity
Enabled on listed serversEnable/Disable thisalert on the followingservers
Trigger alert when following condition met:
CiscoDRFFailure event generated
Threshold
Trigger alert immediatelyDuration
Trigger alert on every pollFrequency
24 hours dailySchedule
SelectedEnable Email
DefaultTrigger Alert Action
CoreDumpFileFoundThis alert occurs when the CoreDumpFileFound event gets generated. This indicates that a core dump fileexists in the system.
Cisco Unified Real-Time Monitoring Tool Administration Guide, Release 11.0(1)320
Performance Counters and AlertsCiscoDRFFailure

Default Configuration
Table 128: Default Configuration for the CoreDumpFileFound RTMT Alert
Default ConfigurationValue
SelectedEnable Alert
CriticalSeverity
Enabled on listed serversEnable/Disable thisalert on the followingservers
Trigger alert when following condition met:
CoreDumpFileFound event generated
Threshold
Trigger alert immediatelyDuration
Trigger alert on every pollFrequency
24 hours dailySchedule
Not SelectedTrace downloadParameters
SelectedEnable Email
DefaultTrigger Alert Action
CpuPeggingCPU usage gets monitored based on configured thresholds. If the usage goes above the configured threshold,this alert gets generated.
Default Configuration
Table 129: Default Configuration for the CpuPegging RTMT Alert
Default ConfigurationValue
SelectedEnable Alert
CriticalSeverity
Enabled on listed serversEnable/Disable thisalert on the followingservers
Cisco Unified Real-Time Monitoring Tool Administration Guide, Release 11.0(1) 321
Performance Counters and AlertsCpuPegging

Default ConfigurationValue
Trigger alert when following condition met:
99%
Threshold
Trigger alert only when value constantly below or over threshold for 60 secondsDuration
Trigger up to 3 alerts within 30 minutesFrequency
24 hours dailySchedule
SelectedEnable Email
DefaultTrigger Alert Action
CriticalServiceDownThe CriticalServiceDown alert gets generated when the service status equals down (not for other states).
Default Configuration
Table 130: Default Configuration for the CriticalServiceDown RTMT Alert
Default ConfigurationValue
SelectedEnable Alert
CriticalSeverity
Enabled on listed serversEnable/Disable thisalert on the followingservers
Trigger alert when following condition met:
Service status is DOWN
Threshold
Trigger alert immediatelyDuration
Trigger alert on every pollFrequency
24 hours dailySchedule
Enable Trace Download not selectedTrace downloadParameters
SelectedEnable Email
Cisco Unified Real-Time Monitoring Tool Administration Guide, Release 11.0(1)322
Performance Counters and AlertsCriticalServiceDown

Default ConfigurationValue
DefaultTrigger Alert Action
DBChangeNotifyFailureThis alert occurs when the Cisco Database Notification Service experiences problems and might stop. Thiscondition indicates change notification requests that are queued in the database got stuck and changes madeto the system will not take effect. Ensure that the Cisco Database Layer Monitor is running on the node wherethe alert exists. If it is, restart the service. If that does not return this alert to safe range, collect the output ofshow tech notify and show tech dbstateinfo and contact TAC for information about how to proceed.
Default Configuration
Table 131: Default Configuration for the DBChangeNotifyFailure RTMT Alert
Default ConfigurationValue
SelectedEnable Alert
CriticalSeverity
Enabled on listed serversEnable/Disable thisalert on the followingservers
Trigger alert when following condition met:
DBChangeNotify queue delay over 2 minutes
Threshold
Trigger alert immediatelyDuration
Trigger up to 1 alert within 30 minutesFrequency
24 hours dailySchedule
SelectedEnable Email
DefaultTrigger Alert Action
DBReplicationFailureThis alarm indicates a failure in IDS replication and requires database administrator intervention.
Cisco Unified Real-Time Monitoring Tool Administration Guide, Release 11.0(1) 323
Performance Counters and AlertsDBChangeNotifyFailure

Be aware that DBReplicationFailure is based on the replication status perfmon counter (instead ofDBReplicationFailure alarm as was previously the case). This alert gets triggered whenever thecorresponding replication status perfmon counter specifies a value of 3 (Bad Replication) or 4 (ReplicationSetup Not Successful).
Note
Default Configuration
Table 132: Default Configuration for the DBReplicationFailure RTMT Alert
Default ConfigurationValue
SelectedEnable Alert
CriticalSeverity
Enabled on listed serversEnable/Disable thisalert on the followingservers
Trigger alert when following condition met:
DBReplicationFailure occurred
Threshold
Trigger alert immediatelyDuration
Trigger up to 1 alert within 60 minutesFrequency
24 hours dailySchedule
SelectedEnable Email
DefaultTrigger Alert Action
DBReplicationTableOutOfSync
Default Configuration
Table 133: Default Configuration for the DBReplicationTableOutOfSync RTMT Alert
Default ConfigurationValue
SelectedEnable Alert
CriticalSeverity
Cisco Unified Real-Time Monitoring Tool Administration Guide, Release 11.0(1)324
Performance Counters and AlertsDBReplicationTableOutOfSync

Default ConfigurationValue
Enabled on listed serversEnable/Disable thisalert on the followingservers
Trigger alert when following condition met:
IDSReplicationFailure event with alarm number 888 generated.
Threshold
Trigger alert immediatelyDuration
Trigger up to 1 alert within 60 minutesFrequency
24 hours dailySchedule
SelectedEnable Email
DefaultTrigger Alert Action
HardwareFailureThis alert occurs when a hardware failure event (disk drive failure, power supply failure, and others) hasoccurred.
Default Configuration
Table 134: Default Configuration for the HardwareFailure RTMT Alert
Default ConfigurationValue
SelectedEnable Alert
CriticalSeverity
Enabled on listed serversEnable/Disable thisalert on the followingservers
Trigger alert when following condition met:
HardwareFailure event generated
Threshold
Trigger alert immediatelyDuration
Trigger alert on every pollFrequency
24 hours dailySchedule
Cisco Unified Real-Time Monitoring Tool Administration Guide, Release 11.0(1) 325
Performance Counters and AlertsHardwareFailure

Default ConfigurationValue
SelectedEnable Email
DefaultTrigger Alert Action
LogFileSearchStringFoundThis alert occurs when the LogFileSearchStringFound event gets generated. This indicates that the searchstring was found in the log file.
Default Configuration
Table 135: Default Configuration for the LogFileSearchStringFound RTMT Alert
Default ConfigurationValue
SelectedEnable Alert
WarningSeverity
Enabled on listed serversEnable/Disable thisalert on the followingservers
Trigger alert when following condition met:
LogFileSearchStringFound event generated
Threshold
Trigger alert immediatelyDuration
Trigger alert on every pollFrequency
24 hours dailySchedule
SelectedEnable Email
DefaultTrigger Alert Action
LogPartitionHighWaterMarkExceededThis alert occurs when the percentage of used disk space in the log partition exceeds the configured high watermark. When this alert gets generated, LPM deletes files in the log partition (down to low water mark) to avoidrunning out of disk space.
Cisco Unified Real-Time Monitoring Tool Administration Guide, Release 11.0(1)326
Performance Counters and AlertsLogFileSearchStringFound

LPM may delete files that you want to keep. You should act immediately when you receive theLogPartitionLowWaterMarkExceeded alert.
Note
Default Configuration
Table 136: Default Configuration for the LogPartitionHighWaterMarkExceeded RTMT Alert
Default ConfigurationValue
SelectedEnable Alert
CriticalSeverity
Enabled on listed serversEnable/Disable thisalert on the followingservers
Trigger alert when following condition met:
Log Partition Used Disk Space Exceeds High Water Mark (95%)
Threshold
Trigger alert immediatelyDuration
Trigger alert on every pollFrequency
24 hours dailySchedule
SelectedEnable Email
DefaultTrigger Alert Action
LogPartitionLowWaterMarkExceededThis alert occurs when the LogPartitionLowWaterMarkExceeded event gets generated. This indicates thatthe percentage of used disk space in the log partition has exceeded the configured low water mark.
Be aware that this alert is an early warning. The administrator should start freeing up disk space. UsingRTMT/TLC, you can collect trace/log files and delete them from the server. The administrator shouldadjust the number of trace files that are kept to avoid hitting the low water mark again.
Note
Cisco Unified Real-Time Monitoring Tool Administration Guide, Release 11.0(1) 327
Performance Counters and AlertsLogPartitionLowWaterMarkExceeded

Default Configuration
Table 137: Default Configuration for the LogPartitionLowWaterMarkExceeded RTMT Alert
Default ConfigurationValue
SelectedEnable Alert
CriticalSeverity
Enabled on listed serversEnable/Disable thisalert on the followingservers
Trigger alert when following condition met:
Log Partition Used Disk Space Exceeds Low Water Mark (90%)
Threshold
Trigger alert immediatelyDuration
Trigger alert on every pollFrequency
24 hours dailySchedule
SelectedEnable Email
DefaultTrigger Alert Action
LowActivePartitionAvailableDiskSpaceThis alert occurs when the percentage of available disk space on the active partition is lower than the configuredvalue.
Default Configuration
Table 138: Default Configuration for the LowActivePartitionAvailableDiskSpace RTMT Alert
Default ConfigurationValue
SelectedEnable Alert
CriticalSeverity
Enabled on listed serversEnable/Disable thisalert on the followingservers
Trigger alert when following condition met:
Active Partition available diskspace below (4%)
Threshold
Cisco Unified Real-Time Monitoring Tool Administration Guide, Release 11.0(1)328
Performance Counters and AlertsLowActivePartitionAvailableDiskSpace

Default ConfigurationValue
Trigger alert immediatelyDuration
Trigger up to 3 alerts within 30 minutesFrequency
24 hours dailySchedule
SelectedEnable Email
DefaultTrigger Alert Action
LowAvailableVirtualMemoryRTMT monitors virtual memory usage. When memory runs low, a LowAvailableVirtualMemory alert isgenerated.
Default Configuration
Table 139: Default Configuration for the LowAvailableVirtualMemory RTMT Alert
Default ConfigurationValue
SelectedEnable Alert
CriticalSeverity
Enabled on listed serversEnable/Disable thisalert on the followingservers
Trigger alert when following condition met:
Available virtual memory below (30%)
Threshold
Trigger alert immediatelyDuration
Trigger up to 3 alerts within 30 minutesFrequency
24 hours dailySchedule
SelectedEnable Email
DefaultTrigger Alert Action
Cisco Unified Real-Time Monitoring Tool Administration Guide, Release 11.0(1) 329
Performance Counters and AlertsLowAvailableVirtualMemory

LowInactivePartitionAvailableDiskSpaceThis alert occurs when the percentage of available disk space of the inactive partition equals less than theconfigured value.
Default Configuration
Table 140: Default Configuration for the LowInactivePartitionAvailableDiskSpace RTMT Alert
Default ConfigurationValue
SelectedEnable Alert
CriticalSeverity
Enabled on listed serversEnable/Disable thisalert on the followingservers
Trigger alert when following condition met:
Inactive Partition available disk space below (4%)
Threshold
Trigger alert immediatelyDuration
Trigger up to 3 alerts within 30 minutesFrequency
24 hours dailySchedule
SelectedEnable Email
DefaultTrigger Alert Action
LowSwapPartitionAvailableDiskSpaceThis alert indicates that the available disk space on the swap partition is low.
The swap partition is part of virtual memory, so low available swap partition disk space means low virtualmemory as well.
Note
Cisco Unified Real-Time Monitoring Tool Administration Guide, Release 11.0(1)330
Performance Counters and AlertsLowInactivePartitionAvailableDiskSpace

Default Configuration
Table 141: Default Configuration for the LowSwapPartitionAvailableDiskSpace RTMT Alert
Default ConfigurationValue
SelectedEnable Alert
CriticalSeverity
Enabled on listed serversEnable/Disable thisalert on the followingservers
Trigger alert when following condition met:
Swap Partition available disk space below (10%)
Threshold
Trigger alert immediatelyDuration
Trigger up to 3 alerts within 30 minutesFrequency
24 hours dailySchedule
SelectedEnable Email
DefaultTrigger Alert Action
ServerDownThis alert occurs when a remote node cannot be reached.
Unified CommunicationsManager and IM and Presence Service: The ServerDown alert is generated whenthe currently active AMC (primary AMC or the backup AMC, if the primary is not available) cannot reachanother server in a cluster. This alert identifies network connectivity issues in addition to a server downcondition.
Note
Default Configuration
Table 142: Default Configuration for the ServerDown RTMT Alert
Default ConfigurationValue
SelectedEnable Alert
CriticalSeverity
Cisco Unified Real-Time Monitoring Tool Administration Guide, Release 11.0(1) 331
Performance Counters and AlertsServerDown

Default ConfigurationValue
Enabled on listed serversEnable/Disable thisalert on the followingservers
Trigger alert when following condition met:
ServerDown occurred
Threshold
Trigger alert immediatelyDuration
Trigger up to 1 alert within 60 minutesFrequency
24 hours dailySchedule
SelectedEnable Email
DefaultTrigger Alert Action
SparePartitionHighWaterMarkExceededThis alert occurs when the SparePartitionHighWaterMarkExceeded event gets generated. This indicates thatthe percentage of used disk space in the spare partition exceeds the configured high water mark.
Default Configuration
Table 143: Default Configuration for the SparePartitionHighWaterMarkExceeded RTMT Alert
Default ConfigurationValue
SelectedEnable Alert
CriticalSeverity
Enabled on listed serversEnable/Disable thisalert on the followingservers
Trigger alert when following condition met:
Spare Partition Used Disk Space Exceeds High Water Mark (95%)
Threshold
Trigger alert immediatelyDuration
Trigger alert on every pollFrequency
24 hours dailySchedule
Cisco Unified Real-Time Monitoring Tool Administration Guide, Release 11.0(1)332
Performance Counters and AlertsSparePartitionHighWaterMarkExceeded

Default ConfigurationValue
SelectedEnable Email
DefaultTrigger Alert Action
SparePartitionLowWaterMarkExceededThis alert occurs when the SparePartitionLowWaterMarkExceeded event gets generated. This indicates thatthe percentage of used disk space in the spare partition has exceeded the low water mark threshold.
Default Configuration
Table 144: Default Configuration for the SparePartitionLowWaterMarkExceeded RTMT Alert
Default ConfigurationValue
SelectedEnable Alert
CriticalSeverity
Enabled on listed serversEnable/Disable thisalert on the followingservers
Trigger alert when following condition met:
Spare Partition Used Disk Space Exceeds Low Water Mark (90%)
Threshold
Trigger alert immediatelyDuration
Trigger alert on every pollFrequency
24 hours dailySchedule
SelectedEnable Email
DefaultTrigger Alert Action
SyslogSeverityMatchFoundThis alert occurs when the SyslogSeverityMatchFound event gets generated. This indicates that a syslogmessage with the matching severity level exists.
Cisco Unified Real-Time Monitoring Tool Administration Guide, Release 11.0(1) 333
Performance Counters and AlertsSparePartitionLowWaterMarkExceeded

Default Configuration
Table 145: Default Configuration for the SyslogSeverityMatchFound RTMT Alert
Default ConfigurationValue
SelectedEnable Alert
CriticalSeverity
Enabled on listed serversEnable/Disable thisalert on the followingservers
Trigger alert when following condition met:
SyslogSeverityMatchFound event generated
Threshold
Trigger alert immediatelyDuration
Trigger alert on every pollFrequency
24 hours dailySchedule
CriticalSyslog SeverityParameters
SelectedEnable Email
DefaultTrigger Alert Action
SyslogStringMatchFoundThis alert occurs when the SyslogStringMatchFound event gets generated. The alert indicates that a syslogmessage with the matching search string exists.
Default Configuration
Table 146: Default Configuration for the SyslogStringMatchFound RTMT Alert
Default ConfigurationValue
SelectedEnable Alert
CriticalSeverity
Enabled on listed serversEnable/Disable thisalert on the followingservers
Cisco Unified Real-Time Monitoring Tool Administration Guide, Release 11.0(1)334
Performance Counters and AlertsSyslogStringMatchFound
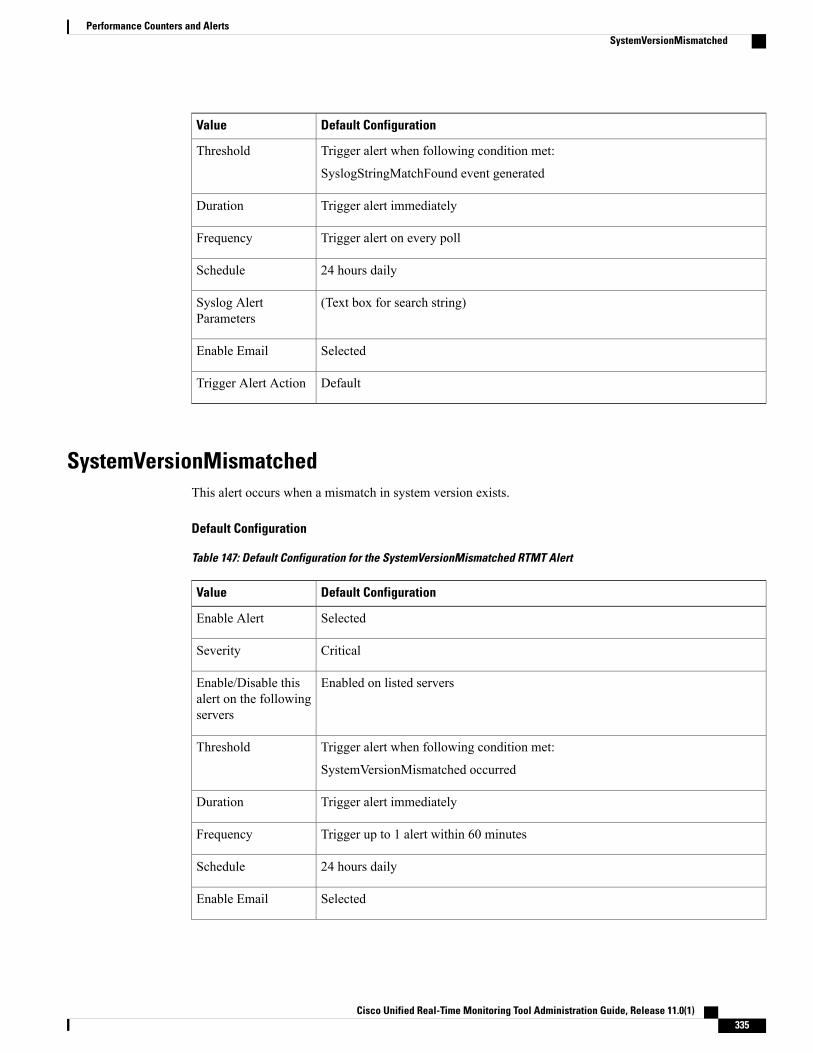
Default ConfigurationValue
Trigger alert when following condition met:
SyslogStringMatchFound event generated
Threshold
Trigger alert immediatelyDuration
Trigger alert on every pollFrequency
24 hours dailySchedule
(Text box for search string)Syslog AlertParameters
SelectedEnable Email
DefaultTrigger Alert Action
SystemVersionMismatchedThis alert occurs when a mismatch in system version exists.
Default Configuration
Table 147: Default Configuration for the SystemVersionMismatched RTMT Alert
Default ConfigurationValue
SelectedEnable Alert
CriticalSeverity
Enabled on listed serversEnable/Disable thisalert on the followingservers
Trigger alert when following condition met:
SystemVersionMismatched occurred
Threshold
Trigger alert immediatelyDuration
Trigger up to 1 alert within 60 minutesFrequency
24 hours dailySchedule
SelectedEnable Email
Cisco Unified Real-Time Monitoring Tool Administration Guide, Release 11.0(1) 335
Performance Counters and AlertsSystemVersionMismatched

Default ConfigurationValue
DefaultTrigger Alert Action
TotalProcessesAndThreadsExceededThresholdThis alert occurs when the TotalProcessesAndThreadsExceededThreshold event gets generated. The alertindicates that the current total number of processes and threads exceeds the maximum number of tasks thatare configured for the Cisco RIS Data Collector Service Parameter. This situation could indicate that a processis leaking or that a process has thread leaking.
Default Configuration
Table 148: Default Configuration for the TotalProcessesAndThreadsExceededThreshold RTMT Alert
Default ConfigurationValue
SelectedEnable Alert
CriticalSeverity
Enabled on listed serversEnable/Disable thisalert on the followingservers
Trigger alert when following condition met:
TotalProcessesAndThreadsExceededThreshold event generated
Threshold
Trigger alert immediatelyDuration
Trigger alert on every pollFrequency
24 hours dailySchedule
SelectedEnable Email
DefaultTrigger Alert Action
Cisco Unified Real-Time Monitoring Tool Administration Guide, Release 11.0(1)336
Performance Counters and AlertsTotalProcessesAndThreadsExceededThreshold

Voice and Video Alerts
BeginThrottlingCallListBLFSubscriptionsThis alert occurs when the BeginThrottlingCallListBLFSubscriptions event gets generated. This indicates thatthe Cisco Unified CommunicationsManager initiated a throttling of the CallList BLF Subscriptions to preventa system overload.
Default Configuration
Table 149: Default Configuration for the BeginThrottlingCallListBLFSubscriptions RTMT Alert
Default ConfigurationValue
SelectedEnable Alert
CriticalSeverity
Enabled on listed serversEnable/Disable thisalert on the followingservers
Trigger alert when following condition met:
BeginThrottlingCallListBLFSubscriptions event generated
Threshold
Trigger alert immediatelyDuration
Trigger alert on every pollFrequency
24 hours dailySchedule
SelectedEnable Email
DefaultTrigger Alert Action
CallAttemptBlockedByPolicy
Default Configuration
Table 150: Default Configuration for the CallAttemptBlockedByPolicy RTMT Alert
Default ConfigurationValue
SelectedEnable Alert
Cisco Unified Real-Time Monitoring Tool Administration Guide, Release 11.0(1) 337
Performance Counters and AlertsVoice and Video Alerts

Default ConfigurationValue
WarningSeverity
Enabled on listed serversEnable/Disable thisalert on the followingservers
Trigger alert when following condition met:
CallAttemptBlockedByPolicy event(s) generated.
Threshold
Trigger alert immediatelyDuration
Trigger up to 3 alerts every 30 minutesFrequency
24 hours dailySchedule
SelectedEnable Email
DefaultTrigger Alert Action
CallProcessingNodeCpuPeggingThis alert occurs when the percentage of CPU load on a call processing server exceeds the configured percentagefor the configured time.
If the administrator takes no action, high CPU pegging can lead to a Cisco Unified Communications Managercrash, especially in CallManager service. The CallProcessingNodeCpuPegging alert gives you time to workproactively to avoid a crash.
During CPU usage spikes, other alarms that may be issued in addition to the CallProcessingNodeCpuPeggingalert include: CoreDumpFound, CriticalServiceDown, SDLLinkOutOfService, andNumberOfRegisteredPhonesDropped alarms.
Cisco Unified Communications Manager VMware installations can experience high CPU usage spikeswhile performing tasks such as DRF backups and Bulk Administration Tool exports. The processes thatare commonly responsible for CPU usage spikes are gzip and DRFLocal.
If your system is generating CallProcessingNodeCpuPegging alarms, add an additional vCPU for thesupport of 7500 Cisco Unified CommunicationsManager users following the Open Virtualization Archives(OVA) template specifications for your system.
Note
Cisco Unified Real-Time Monitoring Tool Administration Guide, Release 11.0(1)338
Performance Counters and AlertsCallProcessingNodeCpuPegging

Default Configuration
Table 151: Default Configuration for the CallProcessingNodeCpuPegging RTMT Alert
Default ConfigurationValue
SelectedEnable Alert
CriticalSeverity
Enabled on listed serversEnable/Disable thisalert on the followingservers
Trigger alert when following condition met:
Processor load over (90%)
Threshold
Trigger alert only when value constantly below or over threshold for 60 secondsDuration
Trigger up to 3 alerts within 30 minutesFrequency
24 hours dailySchedule
SelectedEnable Email
DefaultTrigger Alert Action
CARSchedulerJobFailed
Default Configuration
Table 152: Default Configuration for the CARSchedulerJobFailed RTMT Alert
Default ConfigurationValue
SelectedEnable Alert
ErrorSeverity
Enabled on listed serversEnable/Disable thisalert on the followingservers
Trigger alert when following condition met:
CARSchedulerJobFailed event generated.
Threshold
Trigger alert immediatelyDuration
Cisco Unified Real-Time Monitoring Tool Administration Guide, Release 11.0(1) 339
Performance Counters and AlertsCARSchedulerJobFailed

Default ConfigurationValue
Trigger alert on every pollFrequency
24 hours dailySchedule
SelectedEnable Email
DefaultTrigger Alert Action
CARIDSEngineCritical
Default Configuration
Table 153: Default Configuration for the CARIDSEngineCritical RTMT Alert
Default ConfigurationValue
SelectedEnable Alert
CriticalSeverity
Enabled on listed serversEnable/Disable thisalert on the followingservers
Trigger alert when following condition met:
CARIDSEngineCritical event generated.
Threshold
Trigger alert immediatelyDuration
Trigger alert on every pollFrequency
24 hours dailySchedule
SelectedEnable Email
DefaultTrigger Alert Action
Cisco Unified Real-Time Monitoring Tool Administration Guide, Release 11.0(1)340
Performance Counters and AlertsCARIDSEngineCritical

CARIDSEngineFailure
Default Configuration
Table 154: Default Configuration for the CARIDSEngineFailure RTMT Alert
Default ConfigurationValue
SelectedEnable Alert
ErrorSeverity
Enabled on listed serversEnable/Disable thisalert on the followingservers
Trigger alert when following condition met:
CARIDSEngineFailure event generated.
Threshold
Trigger alert immediatelyDuration
Trigger alert on every pollFrequency
24 hours dailySchedule
SelectedEnable Email
DefaultTrigger Alert Action
CDRAgentSendFileFailedThis alert gets raised when the CDR Agent cannot send CDR files from a Cisco Unified CommunicationsManager node to a CDR repository node within the Cisco Unified Communications Manager cluster.
Default Configuration
Table 155: Default Configuration for the CDRAgentSendFileFailed RTMT Alert
Default ConfigurationValue
SelectedEnable Alert
CriticalSeverity
Cisco Unified Real-Time Monitoring Tool Administration Guide, Release 11.0(1) 341
Performance Counters and AlertsCARIDSEngineFailure

Default ConfigurationValue
Enabled on listed serversEnable/Disable thisalert on the followingservers
Trigger alert when following condition met:
CDRAgentSendFileFailed event generated
Threshold
Trigger alert immediatelyDuration
Trigger alert on every pollFrequency
24 hours dailySchedule
SelectedEnable Email
DefaultTrigger Alert Action
CDRFileDeliveryFailedThis alert gets raised when FTP delivery of CDR files to the outside billing server fails.
Default Configuration
Table 156: Default Configuration for the CDRFileDeliveryFailed RTMT Alert
Default ConfigurationValue
SelectedEnable Alert
CriticalSeverity
Enabled on listed serversEnable/Disable thisalert on the followingservers
Trigger alert when following condition met:
CDRFileDeliveryFailed event generated
Threshold
Trigger alert immediatelyDuration
Trigger alert on every pollFrequency
24 hours dailySchedule
SelectedEnable Email
Cisco Unified Real-Time Monitoring Tool Administration Guide, Release 11.0(1)342
Performance Counters and AlertsCDRFileDeliveryFailed

Default ConfigurationValue
DefaultTrigger Alert Action
CDRHighWaterMarkExceededThis alert gets raised when the high water mark for CDR files gets exceeded. It also indicates that somesuccessfully delivered CDR files got deleted.
Default Configuration
Table 157: Default Configuration for the CDRHighWaterMarkExceeded RTMT Alert
Default ConfigurationValue
SelectedEnable Alert
CriticalSeverity
Enabled on listed serversEnable/Disable thisalert on the followingservers
Trigger alert when following condition met:
CDRHighWaterMarkExceeded event generated
Threshold
Trigger alert immediatelyDuration
Trigger alert on every pollFrequency
24 hours dailySchedule
SelectedEnable Email
DefaultTrigger Alert Action
CDRMaximumDiskSpaceExceededThis alarm gets raised when the CDR files disk usage exceeds the maximum disk allocation. It also indicatesthat some undelivered files got deleted.
Cisco Unified Real-Time Monitoring Tool Administration Guide, Release 11.0(1) 343
Performance Counters and AlertsCDRHighWaterMarkExceeded

Default Configuration
Table 158: Default Configuration for the CDRMaximumDiskSpaceExceeded RTMT Alert
Default ConfigurationValue
SelectedEnable Alert
CriticalSeverity
Enabled on listed serversEnable/Disable thisalert on the followingservers
Trigger alert when following condition met:
CDRMaximumDiskSpaceExceeded event generated
Threshold
Trigger alert immediatelyDuration
Trigger alert on every pollFrequency
24 hours dailySchedule
SelectedEnable Email
DefaultTrigger Alert Action
CiscoElmNotConnected
Default Configuration
Table 159: Default Configuration for the CiscoElmNotConnected RTMT Alert
Default ConfigurationValue
SelectedEnable Alert
WarningSeverity
Enabled on listed serversEnable/Disable thisalert on the followingservers
Trigger alert when following condition met:
CiscoElmNotConnected event generated.
Threshold
Trigger alert immediatelyDuration
Cisco Unified Real-Time Monitoring Tool Administration Guide, Release 11.0(1)344
Performance Counters and AlertsCiscoElmNotConnected

Default ConfigurationValue
Trigger alert on every pollFrequency
24 hours dailySchedule
SelectedEnable Email
DefaultTrigger Alert Action
CiscoGraceTimeLeft
Default Configuration
Table 160: Default Configuration for the CiscoGraceTimeLeft RTMT Alert
Default ConfigurationValue
SelectedEnable Alert
InformationalSeverity
Enabled on listed serversEnable/Disable thisalert on the followingservers
Trigger alert when following condition met:
CiscoGraceTimeLeft event generated.
Threshold
Trigger alert immediatelyDuration
Trigger alert on every pollFrequency
24 hours dailySchedule
SelectedEnable Email
DefaultTrigger Alert Action
Cisco Unified Real-Time Monitoring Tool Administration Guide, Release 11.0(1) 345
Performance Counters and AlertsCiscoGraceTimeLeft

CiscoNoProvisionTimeout
Default Configuration
Table 161: Default Configuration for the CiscoNoProvisionTimeout RTMT Alert
Default ConfigurationValue
SelectedEnable Alert
ErrorSeverity
Enabled on listed serversEnable/Disable thisalert on the followingservers
Trigger alert when following condition met:
CiscoNoProvisionTimeout event generated.
Threshold
Trigger alert immediatelyDuration
Trigger alert on every pollFrequency
24 hours dailySchedule
SelectedEnable Email
DefaultTrigger Alert Action
CiscoSystemInDemo
Default Configuration
Table 162: Default Configuration for the CiscoSystemInDemo RTMT Alert
Default ConfigurationValue
SelectedEnable Alert
WarningSeverity
Enabled on listed serversEnable/Disable thisalert on the followingservers
Cisco Unified Real-Time Monitoring Tool Administration Guide, Release 11.0(1)346
Performance Counters and AlertsCiscoNoProvisionTimeout

Default ConfigurationValue
Trigger alert when following condition met:
CiscoSystemInDemo event generated.
Threshold
Trigger alert immediatelyDuration
Trigger alert on every pollFrequency
24 hours dailySchedule
SelectedEnable Email
DefaultTrigger Alert Action
CiscoSystemInOverage
Default Configuration
Table 163: Default Configuration for the CiscoSystemInOverage RTMT Alert
Default ConfigurationValue
SelectedEnable Alert
WarningSeverity
Enabled on listed serversEnable/Disable thisalert on the followingservers
Trigger alert when following condition met:
CiscoSystemInOverage event generated.
Threshold
Trigger alert immediatelyDuration
Trigger alert on every pollFrequency
24 hours dailySchedule
SelectedEnable Email
DefaultTrigger Alert Action
Cisco Unified Real-Time Monitoring Tool Administration Guide, Release 11.0(1) 347
Performance Counters and AlertsCiscoSystemInOverage

CiscoSystemSecurityMismatch
Default Configuration
Table 164: Default Configuration for the CiscoSystemSecurityMismatch RTMT Alert
Default ConfigurationValue
SelectedEnable Alert
WarningSeverity
Enabled on listed serversEnable/Disable thisalert on the followingservers
Trigger alert when following condition met:
CiscoSystemSecurityMismatch event generated.
Threshold
Trigger alert immediatelyDuration
Trigger alert on every pollFrequency
24 hours dailySchedule
SelectedEnable Email
DefaultTrigger Alert Action
CodeYellowThe AverageExpectedDelay counter represents the current average expected delay to handle any incomingmessage. If the value exceeds the value that is specified in Code Yellow Entry Latency service parameter, theCodeYellow alarm gets generated. You can configure the CodeYellow alert to download trace files fortroubleshooting purposes.
Default Configuration
Table 165: Default Configuration for the CodeYellow RTMT Alert
Default ConfigurationValue
SelectedEnable Alert
CriticalSeverity
Cisco Unified Real-Time Monitoring Tool Administration Guide, Release 11.0(1)348
Performance Counters and AlertsCiscoSystemSecurityMismatch

Default ConfigurationValue
Enabled on listed serversEnable/Disable thisalert on the followingservers
Trigger alert when following condition met:
Cisco CallManager CodeYellowEntry event generated
Threshold
Trigger alert immediatelyDuration
Trigger alert on every pollFrequency
24 hours dailySchedule
Enable Trace Download not selectedTrace DownloadParameters
SelectedEnable Email
DefaultTrigger Alert Action
DDRBlockPreventionThis alert gets triggered when the IDSReplicationFailure alarm with alarm number 31 occurs, which invokesa proactive procedure to avoid denial of service. This procedure does not impact call processing; you canignore replication alarms during this process.
The procedure takes up to 60 minutes to finish. Check that RTMT replication status equals 2 on each node tomake sure that the procedure is complete. Do not perform a system reboot during this process.
Default Configuration
Table 166: Default Configuration for the DDRBlockPrevention RTMT Alert
Default ConfigurationValue
SelectedEnable Alert
CriticalSeverity
Enabled on listed serversEnable/Disable thisalert on the followingservers
Trigger alert when following condition met:
IDSReplicationFailure alarm with alarm number 31 generated
Threshold
Cisco Unified Real-Time Monitoring Tool Administration Guide, Release 11.0(1) 349
Performance Counters and AlertsDDRBlockPrevention

Default ConfigurationValue
Trigger alert immediatelyDuration
Trigger up to 1 alert within 60 minutesFrequency
24 hours dailySchedule
SelectedEnable Email
DefaultTrigger Alert Action
DDRDownThis alert gets triggered when the IDSReplicationFailure alarmwith alarm number 32 occurs. An auto recoverprocedure runs in the background and no action is needed.
The procedure takes about 15 minutes to finish. Check that RTMT replication status equals 2 on each nodeto make sure the procedure is complete.
Default Configuration
Table 167: Default Configuration for the DDRDown RTMT Alert
Default ConfigurationValue
SelectedEnable Alert
CriticalSeverity
Enabled on listed serversEnable/Disable thisalert on the followingservers
Trigger alert when following condition met:
IDSReplicationFailure alarm with alarm number 32 generated
Threshold
Trigger alert immediatelyDuration
Trigger up to 1 alert within 60 minutesFrequency
24 hours dailySchedule
SelectedEnable Email
DefaultTrigger Alert Action
Cisco Unified Real-Time Monitoring Tool Administration Guide, Release 11.0(1)350
Performance Counters and AlertsDDRDown
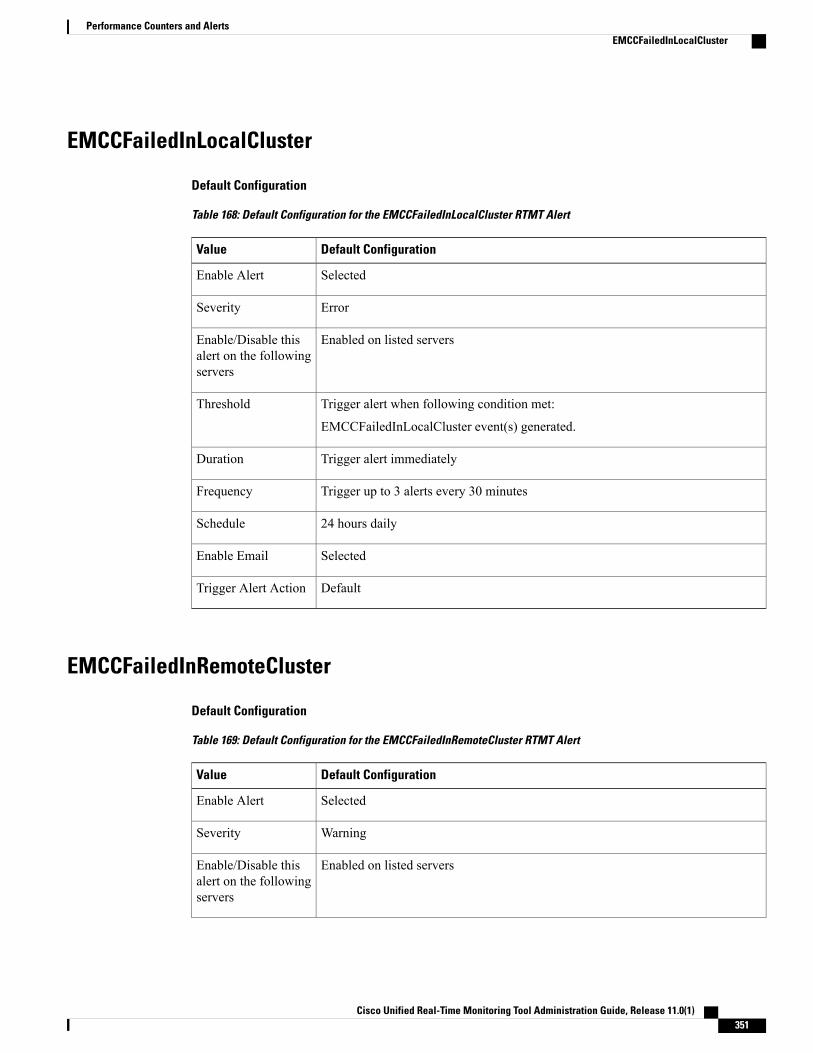
EMCCFailedInLocalCluster
Default Configuration
Table 168: Default Configuration for the EMCCFailedInLocalCluster RTMT Alert
Default ConfigurationValue
SelectedEnable Alert
ErrorSeverity
Enabled on listed serversEnable/Disable thisalert on the followingservers
Trigger alert when following condition met:
EMCCFailedInLocalCluster event(s) generated.
Threshold
Trigger alert immediatelyDuration
Trigger up to 3 alerts every 30 minutesFrequency
24 hours dailySchedule
SelectedEnable Email
DefaultTrigger Alert Action
EMCCFailedInRemoteCluster
Default Configuration
Table 169: Default Configuration for the EMCCFailedInRemoteCluster RTMT Alert
Default ConfigurationValue
SelectedEnable Alert
WarningSeverity
Enabled on listed serversEnable/Disable thisalert on the followingservers
Cisco Unified Real-Time Monitoring Tool Administration Guide, Release 11.0(1) 351
Performance Counters and AlertsEMCCFailedInLocalCluster

Default ConfigurationValue
Trigger alert when following condition met:
EMCCFailedInRemoteCluster event(s) generated.
Threshold
Trigger alert immediatelyDuration
Trigger up to 3 alerts every 30 minutesFrequency
24 hours dailySchedule
SelectedEnable Email
DefaultTrigger Alert Action
ExcessiveVoiceQualityReportsThis alert gets generated when the number of QRT problems that are reported during the configured timeinterval exceed the configured value. The default threshold specifies 0 within 60 minutes.
Default Configuration
Table 170: Default Configuration for the ExcessiveVoiceQualityReports RTMT Alert
Default ConfigurationValue
SelectedEnable Alert
CriticalSeverity
Enabled on listed serversEnable/Disable thisalert on the followingservers
Trigger alert when following condition met:
Number of quality reports exceeds 0 times within the last 60 minutes
Threshold
Trigger alert immediatelyDuration
Trigger alert on every pollFrequency
24 hours dailySchedule
SelectedEnable Email
DefaultTrigger Alert Action
Cisco Unified Real-Time Monitoring Tool Administration Guide, Release 11.0(1)352
Performance Counters and AlertsExcessiveVoiceQualityReports

ILSHubClusterUnreachable
Default Configuration
Table 171: Default Configuration for the ILSHubClusterUnreachable RTMT Alert
Default ConfigurationValue
SelectedEnable Alert
AlertSeverity
Enabled on listed serversEnable/Disable thisalert on the followingservers
Trigger alert when following condition met:
A connection to the remote ILS server could not be established.
Threshold
Trigger alert immediatelyDuration
Trigger alert on every pollFrequency
24 hours dailySchedule
SelectedEnable Email
DefaultTrigger Alert Action
ILSPwdAuthenticationFailed
Default Configuration
Table 172: Default Configuration for the ILSPwdAuthenticationFailed RTMT Alert
Default ConfigurationValue
SelectedEnable Alert
AlertSeverity
Enabled on listed serversEnable/Disable thisalert on the followingservers
Cisco Unified Real-Time Monitoring Tool Administration Guide, Release 11.0(1) 353
Performance Counters and AlertsILSHubClusterUnreachable

Default ConfigurationValue
Trigger alert when following condition met:
Password Authentication Failure with ILS at remote cluster.
Threshold
Trigger alert immediatelyDuration
Trigger alert on every pollFrequency
24 hours dailySchedule
SelectedEnable Email
DefaultTrigger Alert Action
ILSTLSAuthenticationFailed
Default Configuration
Table 173: Default Configuration for the ILSTLSAuthenticationFailed RTMT Alert
Default ConfigurationValue
SelectedEnable Alert
AlertSeverity
Enabled on listed serversEnable/Disable thisalert on the followingservers
Trigger alert when following condition met:
TLS Failure to ILS at remote cluster.
Threshold
Trigger alert immediatelyDuration
Trigger alert on every pollFrequency
24 hours dailySchedule
SelectedEnable Email
DefaultTrigger Alert Action
Cisco Unified Real-Time Monitoring Tool Administration Guide, Release 11.0(1)354
Performance Counters and AlertsILSTLSAuthenticationFailed

IMEDistributedCacheInactiveThis alarm gets generated when a Cisco Unified Communications Manager attempts to connect to the CiscoIME server, but the IME distributed cache is not currently active.
Ensure that the certificate for the Cisco IME server is provisioned and that the IME distributed cache has beenactivated through the CLI.
Default Configuration
Table 174: Default Configuration for the IMEDistributedCacheInactive Alert
Default ConfigurationValue
SelectedEnable Alert
ErrorSeverity
Enabled on listed serversEnable/Disable thisalert on the followingservers
Trigger alert when following condition met:
Inactive IME Distributed Cache
Threshold
Trigger alert immediatelyDuration
Trigger alert on every pollFrequency
24 hours dailySchedule
SelectedEnable Email
DefaultTrigger Alert Action
IMEOverQuotaThis alert indicates that the Cisco Unified Communications Manager servers that use this Cisco IME servicehave exceed the quota for published direct inward dialing numbers (DIDs) to the IME distributed cache. Thealert includes the name of the Cisco IME server as well as the current and target quota values.
Ensure that you have correctly provisioned the DID prefixes on all of the Cisco Unified CommunicationsManager servers that use this Cisco IME service.
If you have provisioned the prefixes correctly, you have exceeded the capacity of your Cisco IME service,and you need to configure another service and divide the DID prefixes across the Cisco IME client instances(Cisco Unified Communications Managers) on different Cisco IME services.
Cisco Unified Real-Time Monitoring Tool Administration Guide, Release 11.0(1) 355
Performance Counters and AlertsIMEDistributedCacheInactive

Default Configuration
Table 175: Default Configuration for the IMEOverQuota Alert
Default ConfigurationValue
SelectedEnable Alert
AlertSeverity
Enabled on listed serversEnable/Disable thisalert on the followingservers
Trigger alert when following condition met:
VAP over quota
Threshold
Trigger alert immediatelyDuration
Trigger alert on every pollFrequency
24 hours dailySchedule
SelectedEnable Email
DefaultTrigger Alert Action
IMEQualityAlertThis alert gets generated when Cisco Unified CommunicationsManager determines that a substantial numberof Cisco IME calls fail back to PSTN or fail to be set up due to IP network quality problems. Two types ofevents trigger this alert:
• A large number of the currently active Cisco IME calls have all requested fallback or have fallen backto the PSTN.
• A large number of the recent call attempts have gone to the PSTN and not been made over IP.
When you receive this alert, check your IP connectivity. If no problems exist with the IP connectivity, youmay need to review the CDRs, CMRs, and logs from the firewalls to determine why calls have fallen back tothe PSTN or have not been made over IP.
Default Configuration
Table 176: Default Configuration for the IMEQualityAlert Alert
Default ConfigurationValue
SelectedEnable Alert
Cisco Unified Real-Time Monitoring Tool Administration Guide, Release 11.0(1)356
Performance Counters and AlertsIMEQualityAlert
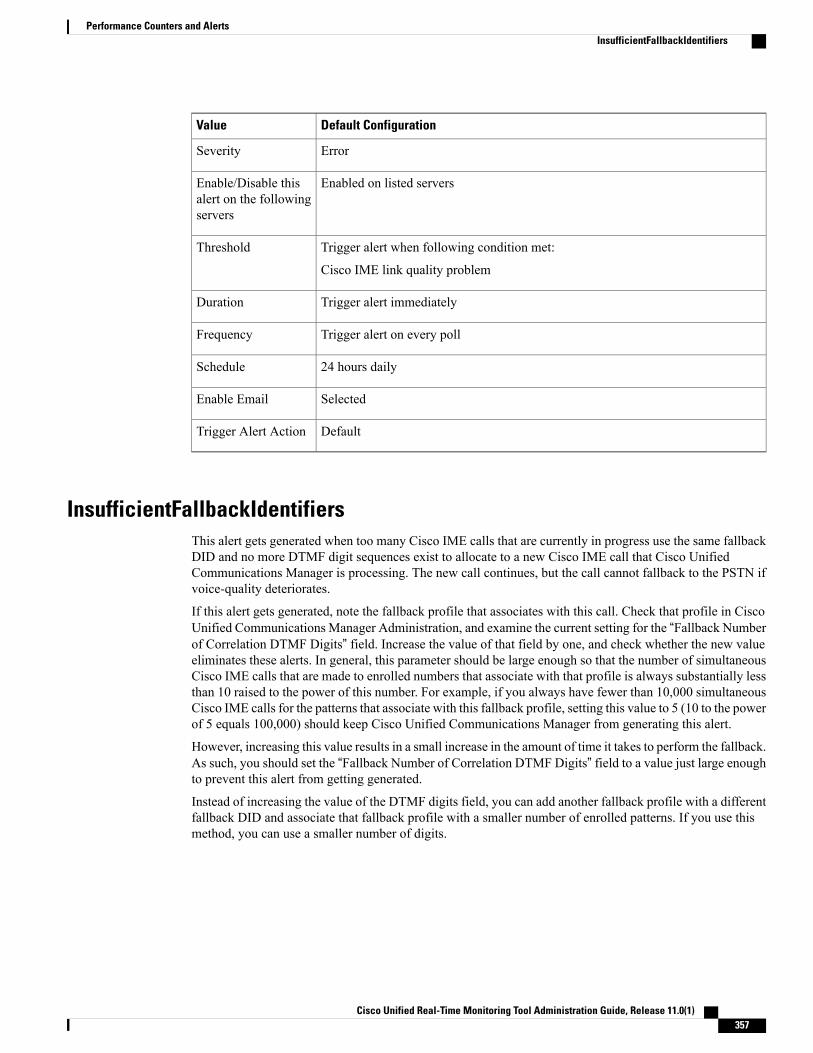
Default ConfigurationValue
ErrorSeverity
Enabled on listed serversEnable/Disable thisalert on the followingservers
Trigger alert when following condition met:
Cisco IME link quality problem
Threshold
Trigger alert immediatelyDuration
Trigger alert on every pollFrequency
24 hours dailySchedule
SelectedEnable Email
DefaultTrigger Alert Action
InsufficientFallbackIdentifiersThis alert gets generated when too many Cisco IME calls that are currently in progress use the same fallbackDID and no more DTMF digit sequences exist to allocate to a new Cisco IME call that Cisco UnifiedCommunications Manager is processing. The new call continues, but the call cannot fallback to the PSTN ifvoice-quality deteriorates.
If this alert gets generated, note the fallback profile that associates with this call. Check that profile in CiscoUnified Communications Manager Administration, and examine the current setting for the “Fallback Numberof Correlation DTMF Digits” field. Increase the value of that field by one, and check whether the new valueeliminates these alerts. In general, this parameter should be large enough so that the number of simultaneousCisco IME calls that are made to enrolled numbers that associate with that profile is always substantially lessthan 10 raised to the power of this number. For example, if you always have fewer than 10,000 simultaneousCisco IME calls for the patterns that associate with this fallback profile, setting this value to 5 (10 to the powerof 5 equals 100,000) should keep Cisco Unified Communications Manager from generating this alert.
However, increasing this value results in a small increase in the amount of time it takes to perform the fallback.As such, you should set the “Fallback Number of Correlation DTMF Digits” field to a value just large enoughto prevent this alert from getting generated.
Instead of increasing the value of the DTMF digits field, you can add another fallback profile with a differentfallback DID and associate that fallback profile with a smaller number of enrolled patterns. If you use thismethod, you can use a smaller number of digits.
Cisco Unified Real-Time Monitoring Tool Administration Guide, Release 11.0(1) 357
Performance Counters and AlertsInsufficientFallbackIdentifiers

Default Configuration
Table 177: Default Configuration for the InsufficientFallbackIdentifiers Alert
Default ConfigurationValue
SelectedEnable Alert
ErrorSeverity
Enabled on listed serversEnable/Disable thisalert on the followingservers
Trigger alert when following condition met:
Cannot allocate fallback identifier
Threshold
Trigger alert immediatelyDuration
Trigger up to 1 alerts within one minuteFrequency
24 hours dailySchedule
SelectedEnable Email
DefaultTrigger Alert Action
IMEServiceStatusThis alert indicates the overall health of the connection to the Cisco IME services for a particular Cisco IMEclient instance (Cisco Unified Communications Manager). The alert indicates the following states:
• 0—Unknown. Likely indicates that the Cisco IME service has not been activated.
• 1—Healthy. Indicates that the Cisco Unified Communications Manager has successfully established aconnection to its primary and backup servers for the Cisco IME client instance, if configured.
• 2—Unhealthy. Indicates that the Cisco IME has been activated but has not successfully completedhandshake procedures with the Cisco IME server. Note that this counter reflects the handshake statusof both the primary and the secondary IME servers.
Default Configuration
Table 178: Default Configuration for the IMEServiceStatus Alert
Default ConfigurationValue
SelectedEnable Alert
Cisco Unified Real-Time Monitoring Tool Administration Guide, Release 11.0(1)358
Performance Counters and AlertsIMEServiceStatus
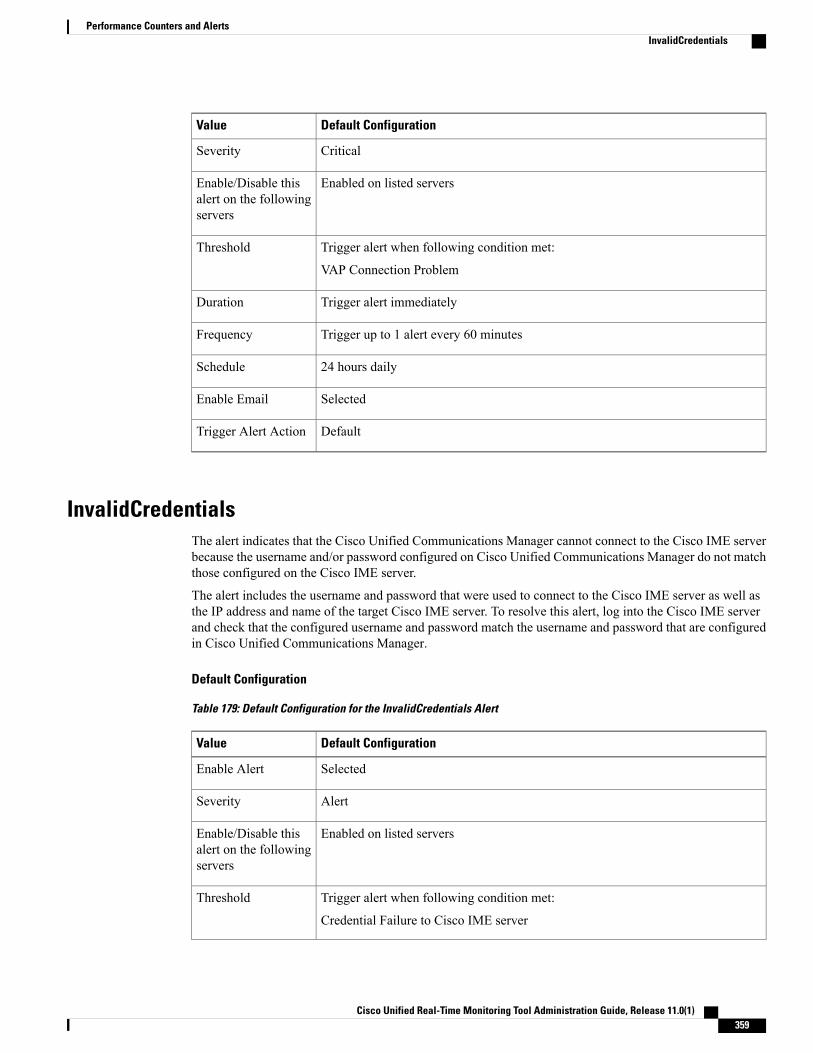
Default ConfigurationValue
CriticalSeverity
Enabled on listed serversEnable/Disable thisalert on the followingservers
Trigger alert when following condition met:
VAP Connection Problem
Threshold
Trigger alert immediatelyDuration
Trigger up to 1 alert every 60 minutesFrequency
24 hours dailySchedule
SelectedEnable Email
DefaultTrigger Alert Action
InvalidCredentialsThe alert indicates that the Cisco Unified Communications Manager cannot connect to the Cisco IME serverbecause the username and/or password configured on Cisco Unified Communications Manager do not matchthose configured on the Cisco IME server.
The alert includes the username and password that were used to connect to the Cisco IME server as well asthe IP address and name of the target Cisco IME server. To resolve this alert, log into the Cisco IME serverand check that the configured username and password match the username and password that are configuredin Cisco Unified Communications Manager.
Default Configuration
Table 179: Default Configuration for the InvalidCredentials Alert
Default ConfigurationValue
SelectedEnable Alert
AlertSeverity
Enabled on listed serversEnable/Disable thisalert on the followingservers
Trigger alert when following condition met:
Credential Failure to Cisco IME server
Threshold
Cisco Unified Real-Time Monitoring Tool Administration Guide, Release 11.0(1) 359
Performance Counters and AlertsInvalidCredentials

Default ConfigurationValue
Trigger alert immediatelyDuration
Trigger alert on every pollFrequency
24 hours dailySchedule
SelectedEnable Email
DefaultTrigger Alert Action
LocationOutOfResourceThis alert occurs when the number of LocationOutOfResource events exceeds the configure threshold duringthe configured time interval. This indicates that one or all of audio or video or immersive bandwidth for alocation or link is used up.
Default Configuration
Table 180: Default Configuration for the LocationOutOfResource Alert
Default ConfigurationValue
SelectedEnable Alert
WarningSeverity
Enabled on listed serversEnable/Disable thisalert on the followingservers
Trigger alert when following conditionmet: LocationOutOfResource event generated5 times within 60 seconds
Threshold
Trigger alert immediatelyDuration
Trigger alert on every pollFrequency
24 hours dailySchedule
SelectedEnable Email
DefaultTrigger Alert Action
Cisco Unified Real-Time Monitoring Tool Administration Guide, Release 11.0(1)360
Performance Counters and AlertsLocationOutOfResource

MaliciousCallTraceThis indicates that a malicious call exists in Cisco Unified Communications Manager. The malicious callidentification (MCID) feature gets invoked.
Default Configuration
Table 181: Default Configuration for the MaliciousCallTrace RTMT Alert
Default ConfigurationValue
SelectedEnable Alert
CriticalSeverity
Enabled on listed serversEnable/Disable thisalert on the followingservers
Trigger alert when following condition met:
Malicious call trace generated
Threshold
Trigger alert immediatelyDuration
Trigger alert on every pollFrequency
24 hours dailySchedule
SelectedEnable Email
DefaultTrigger Alert Action
MediaListExhaustedThis alert occurs when the number of MediaListExhausted events exceeds the configured threshold duringthe configured time interval. This indicates that all available media resources that are defined in the medialist are busy. The default specifies 0 within 60 minutes.
Default Configuration
Table 182: Default Configuration for the MediaListExhausted RTMT Alert
Default ConfigurationValue
SelectedEnable Alert
Cisco Unified Real-Time Monitoring Tool Administration Guide, Release 11.0(1) 361
Performance Counters and AlertsMaliciousCallTrace

Default ConfigurationValue
WarningSeverity
Enabled on listed serversEnable/Disable thisalert on the followingservers
Trigger alert when following condition met:
Number of MediaListExhausted events exceeds 0 times within the last 60 minutes
Threshold
Trigger alert immediatelyDuration
Trigger alert on every pollFrequency
24 hours dailySchedule
SelectedEnable Email
DefaultTrigger Alert Action
MgcpDChannelOutOfServiceThis alert gets triggered when the BRI D-Channel remains out of service.
Default Configuration
Table 183: Default Configuration for the MgcpDChannelOutOfService RTMT Alert
Default ConfigurationValue
SelectedEnable Alert
CriticalSeverity
Enabled on listed serversEnable/Disable thisalert on the followingservers
Trigger alert when following condition met:
MGCP DChannel is out-of-service
Threshold
Trigger alert immediatelyDuration
Trigger alert on every pollFrequency
24 hours dailySchedule
Cisco Unified Real-Time Monitoring Tool Administration Guide, Release 11.0(1)362
Performance Counters and AlertsMgcpDChannelOutOfService

Default ConfigurationValue
SelectedEnable Email
DefaultTrigger Alert Action
NumberOfRegisteredDevicesExceededThis alert occurs when the NumberOfRegisteredDevicesExceeded event gets generated.
Default Configuration
Table 184: Default Configuration for the NumberOfRegisteredDevicesExceeded RTMT Alert
Default ConfigurationValue
SelectedEnable Alert
CriticalSeverity
Enabled on listed serversEnable/Disable thisalert on the followingservers
Trigger alert when following condition met:
NumberOfRegisteredDevicesExceeded event generated
Threshold
Trigger alert immediatelyDuration
Trigger alert on every pollFrequency
24 hours dailySchedule
SelectedEnable Email
DefaultTrigger Alert Action
NumberOfRegisteredGatewaysDecreasedThis alert occurs when the number of registered gateways in a cluster decreases between consecutive polls.
Cisco Unified Real-Time Monitoring Tool Administration Guide, Release 11.0(1) 363
Performance Counters and AlertsNumberOfRegisteredDevicesExceeded

Default Configuration
Table 185: Default Configuration for the NumberOfRegisteredGatewaysDecreased RTMT Alert
Default ConfigurationValue
SelectedEnable Alert
CriticalSeverity
Enabled on listed serversEnable/Disable thisalert on the followingservers
Trigger alert when following condition met:
Number of registered gateway decreased
Threshold
Trigger alert immediatelyDuration
Trigger alert on every pollFrequency
24 hours dailySchedule
SelectedEnable Email
DefaultTrigger Alert Action
NumberOfRegisteredGatewaysIncreasedThis alert occurs when the number of registered gateways in the cluster increased between consecutive polls.
Default Configuration
Table 186: Default Configuration for the NumberOfRegisteredGatewaysIncreased RTMT Alert
Default ConfigurationValue
SelectedEnable Alert
CriticalSeverity
Trigger alert when following condition met:
Number of registered gateways increased
Threshold
Trigger alert immediatelyDuration
Trigger alert on every pollFrequency
Cisco Unified Real-Time Monitoring Tool Administration Guide, Release 11.0(1)364
Performance Counters and AlertsNumberOfRegisteredGatewaysIncreased

Default ConfigurationValue
24 hours dailySchedule
SelectedEnable Email
DefaultTrigger Alert Action
NumberOfRegisteredMediaDevicesDecreasedThis alert occurs when the number of registered media devices in a cluster decreases between consecutivepolls.
Default Configuration
Table 187: Default Configuration for the NumberOfRegisteredMediaDevicesDecreased RTMT Alert
Default ConfigurationValue
SelectedEnable Alert
CriticalSeverity
Trigger alert when following condition met:
Number of registered media devices decreased
Threshold
Trigger alert immediatelyDuration
Trigger alert on every pollFrequency
24 hours dailySchedule
SelectedEnable Email
DefaultTrigger Alert Action
NumberOfRegisteredMediaDevicesIncreasedThis alert occurs when the number of registered media devices in a cluster increases between consecutivepolls.
Cisco Unified Real-Time Monitoring Tool Administration Guide, Release 11.0(1) 365
Performance Counters and AlertsNumberOfRegisteredMediaDevicesDecreased

Default Configuration
Table 188: Default Configuration for the NumberOfRegisteredMediaDevicesIncreased RTMT Alert
Default ConfigurationValue
SelectedEnable Alert
CriticalSeverity
Trigger alert when following condition met:
Number of registered media devices increased
Threshold
Trigger alert immediatelyDuration
Trigger alert on every pollFrequency
24 hours dailySchedule
SelectedEnable Email
DefaultTrigger Alert Action
NumberOfRegisteredPhonesDroppedThis alert occurs when the number of registered phones in a cluster drops more than the configured percentagebetween consecutive polls.
Default Configuration
Table 189: Default Configuration for the NumberOfRegisteredPhonesDropped RTMT Alert
Default ConfigurationValue
SelectedEnable Alert
CriticalSeverity
Trigger alert when following condition met:
Number of registered phones in the cluster drops (10%)
Threshold
Trigger alert immediatelyDuration
Trigger alert on every pollFrequency
24 hours dailySchedule
SelectedEnable Email
Cisco Unified Real-Time Monitoring Tool Administration Guide, Release 11.0(1)366
Performance Counters and AlertsNumberOfRegisteredPhonesDropped

Default ConfigurationValue
DefaultTrigger Alert Action
RecordingCallSetupFail
Default Configuration
Table 190: Default Configuration for the RecordingCallSetupFail RTMT Alert
Default ConfigurationValue
SelectedEnable Alert
ErrorSeverity
Enabled on listed serversEnable/Disable thisalert on the followingservers
Trigger alert when following condition met:
RecordingCallSetupFail event(s) generated
Threshold
Trigger alert immediatelyDuration
Trigger up to 3 alerts every 30 minutesFrequency
24 hours dailySchedule
SelectedEnable Email
DefaultTrigger Alert Action
RecordingGatewayRegistrationRejected
Default Configuration
Table 191: Default Configuration for the RecordingGatewayRegistrationRejected RTMT Alert
Default ConfigurationValue
SelectedEnable Alert
ErrorSeverity
Cisco Unified Real-Time Monitoring Tool Administration Guide, Release 11.0(1) 367
Performance Counters and AlertsRecordingCallSetupFail

Default ConfigurationValue
Enabled on listed serversEnable/Disable thisalert on the followingservers
Trigger alert when following condition met:
RecordingGatewayRegistrationRejected event(s) generated.
Threshold
Trigger alert immediatelyDuration
Trigger up to 3 alerts every 30 minutesFrequency
24 hours dailySchedule
SelectedEnable Email
DefaultTrigger Alert Action
RecordingGatewayRegistrationTimeout
Default Configuration
Table 192: Default Configuration for the RecordingGatewayRegistratioNTimeout RTMT Alert
Default ConfigurationValue
SelectedEnable Alert
ErrorSeverity
Enabled on listed serversEnable/Disable thisalert on the followingservers
Trigger alert when following condition met:
RecordingGatewayRegistrationTimeout event(s) generated.
Threshold
Trigger alert immediatelyDuration
Trigger up to 3 alerts every 30 minutesFrequency
24 hours dailySchedule
SelectedEnable Email
DefaultTrigger Alert Action
Cisco Unified Real-Time Monitoring Tool Administration Guide, Release 11.0(1)368
Performance Counters and AlertsRecordingGatewayRegistrationTimeout

RecordingGatewaySessionFailed
Default Configuration
Table 193: Default Configuration for the RecordingGatewaySessionFailed RTMT Alert
Default ConfigurationValue
SelectedEnable Alert
ErrorSeverity
Enabled on listed serversEnable/Disable thisalert on the followingservers
Trigger alert when following condition met:
RecordingGatewaySessionFailed event(s) generated.
Threshold
Trigger alert immediatelyDuration
Trigger up to 3 alerts every 30 minutesFrequency
24 hours dailySchedule
SelectedEnable Email
DefaultTrigger Alert Action
RecordingResourcesNotAvailable
Default Configuration
Table 194: Default Configuration for the RecordingResourcesNotAvailable RTMT Alert
Default ConfigurationValue
SelectedEnable Alert
WarningSeverity
Cisco Unified Real-Time Monitoring Tool Administration Guide, Release 11.0(1) 369
Performance Counters and AlertsRecordingGatewaySessionFailed

Default ConfigurationValue
Enabled on listed serversEnable/Disable thisalert on the followingservers
Trigger alert when following condition met:
RecordingGatewayRegistrationTimeout event(s) generated.
Threshold
Trigger alert immediatelyDuration
Trigger up to 3 alerts every 30 minutesFrequency
24 hours dailySchedule
SelectedEnable Email
DefaultTrigger Alert Action
RecordingSessionTerminatedUnexpectedly
Default Configuration
Table 195: Default Configuration for the RecordingSessionTerminatedUnexpectedly RTMT Alert
Default ConfigurationValue
SelectedEnable Alert
ErrorSeverity
Enabled on listed serversEnable/Disable thisalert on the followingservers
Trigger alert when following condition met:
RecordingCallSetupFail event(s) generated.
Threshold
Trigger alert immediatelyDuration
Trigger up to 3 alerts every 30 minutesFrequency
24 hours dailySchedule
SelectedEnable Email
DefaultTrigger Alert Action
Cisco Unified Real-Time Monitoring Tool Administration Guide, Release 11.0(1)370
Performance Counters and AlertsRecordingSessionTerminatedUnexpectedly

RTMTSessionsExceedsThreshold
Default Configuration
Table 196: Default Configuration for the RTMTSessionsExceedsThreshold RTMT Alert
Default ConfigurationValue
SelectedEnable Alert
AlertSeverity
Enabled on listed serversEnable/Disable thisalert on the followingservers
Trigger alert when following condition met:
When number of ast session is more than 250.
Threshold
Trigger alert immediatelyDuration
Trigger alert on every pollFrequency
24 hours dailySchedule
SelectedEnable Email
DefaultTrigger Alert Action
RouteListExhaustedThis alert occurs when the number of RouteListExhausted events exceeds the configured threshold duringthe configured time interval. This indicates that all available channels that are defined in the route list arebusy. The default specifies 0 within 60 minutes.
Default Configuration
Table 197: Default Configuration for the RouteListExhausted RTMT Alert
Default ConfigurationValue
SelectedEnable Alert
WarningSeverity
Cisco Unified Real-Time Monitoring Tool Administration Guide, Release 11.0(1) 371
Performance Counters and AlertsRTMTSessionsExceedsThreshold

Default ConfigurationValue
Enabled on listed serversEnable/Disable thisalert on the followingservers
Trigger alert when following condition met:
Number of RouteListExhausted exceeds 0 times within the last 60 minutes
Threshold
Trigger alert immediatelyDuration
Trigger alert on every pollFrequency
24 hours dailySchedule
SelectedEnable Email
DefaultTrigger Alert Action
SDLLinkOutOfServiceThis alert occurs when the SDLLinkOutOfService event gets generated. This event indicates that the localCisco Unified CommunicationsManager cannot communicate with the remote Cisco Unified CommunicationsManager This event usually indicates network errors or a non-running remote Cisco Unified CommunicationsManager.
Default Configuration
Table 198: Default Configuration for the SDLLinkOutOfService RTMT Alert
Default ConfigurationValue
SelectedEnable Alert
CriticalSeverity
Enabled on listed serversEnable/Disable thisalert on the followingservers
Trigger alert when following condition met:
SDLLinkOutOfService event generated
Threshold
Trigger alert immediatelyDuration
Trigger alert on every pollFrequency
Cisco Unified Real-Time Monitoring Tool Administration Guide, Release 11.0(1)372
Performance Counters and AlertsSDLLinkOutOfService

Default ConfigurationValue
24 hours dailySchedule
SelectedEnable Email
DefaultTrigger Alert Action
TCPSetupToIMEFailedThis alert occurs when Cisco Unified CommunicationsManager cannot establish a TCP connection to a CiscoIME server. This alert typically occurs when the IP address and port of the Cisco IME server are misconfiguredin Cisco Unified Communications Manager Administration or when an Intranet connectivity problem existsand prevents the connection from being set up.
Ensure that the IP address and port of the Cisco IME server in the alert are valid. If the problem persists, testthe connectivity between the Cisco Unified Communications Manager servers and the Cisco IME server.
Default Configuration
Table 199: Default Configuration for the TCPSetupToIMEFailed Alert
Default ConfigurationValue
SelectedEnable Alert
CriticalSeverity
Enabled on listed serversEnable/Disable thisalert on the followingservers
Trigger alert when following condition met:
Connection Failure to Cisco IME server
Threshold
Trigger alert immediatelyDuration
Trigger alert on every pollFrequency
24 hours dailySchedule
SelectedEnable Email
DefaultTrigger Alert Action
Cisco Unified Real-Time Monitoring Tool Administration Guide, Release 11.0(1) 373
Performance Counters and AlertsTCPSetupToIMEFailed

TLSConnectionToIMEFailedThis alert occurs when a TLS connection to the Cisco IME service could not be established because thecertificate presented by the Cisco IME service has expired or is not in the Cisco Unified CommunicationsManager CTL.
Ensure that the Cisco IME service certificate has been configured into the Cisco Unified CommunicationsManager.
Default Configuration
Table 200: Default Configuration for the TLSConnectionToIMEFailed Alert
Default ConfigurationValue
SelectedEnable Alert
AlertSeverity
Enabled on listed serversEnable/Disable thisalert on the followingservers
Trigger alert when following condition met:
TLS Failure to Cisco IME service
Threshold
Trigger alert immediatelyDuration
Trigger alert on every pollFrequency
24 hours dailySchedule
SelectedEnable Email
DefaultTrigger Alert Action
UserInputFailure
Default Configuration
Table 201: Default Configuration for the UserInputFailure RTMT Alert
Default ConfigurationValue
SelectedEnable Alert
Cisco Unified Real-Time Monitoring Tool Administration Guide, Release 11.0(1)374
Performance Counters and AlertsTLSConnectionToIMEFailed

Default ConfigurationValue
WarningSeverity
Enabled on listed serversEnable/Disable thisalert on the followingservers
Trigger alert when following condition met:
UserInputFailure event(s) generated.
Threshold
Trigger alert immediatelyDuration
Trigger up to 3 alerts every 30 minutesFrequency
24 hours dailySchedule
SelectedEnable Email
DefaultTrigger Alert Action
IM and Presence Service Alerts
CTIGWUserNotLicencedAlert Description
This alert indicates that the user failed to authorize due to no license available.
Unified RTMT Default Threshold
Not applicable.
Recommended Actions
Check the Cisco CTI Gateway application license and user configuration.
CTIGWQBEFailedRequestAlert Description
This alert indicates that the Cisco CTI Gateway application received a failed response to a request.
Unified RTMT Default Threshold
Not applicable.
Cisco Unified Real-Time Monitoring Tool Administration Guide, Release 11.0(1) 375
Performance Counters and AlertsIM and Presence Service Alerts

Recommended Actions
Use Cisco RTMT to check the Cisco SIP Proxy service trace log file for any detailed error messages.
CTIGWModuleNotEnabledAlert Description
This alert indicates that the Cisco CTI Gateway application is either not fully configured or enabled.
Unified RTMT Default Threshold
Not applicable.
Recommended Actions
Configure and enable the Cisco CTIGateway application using the Cisco CiscoUnified CommunicationsManager IM and Presence CTI Gateway Settings page.
CTIGWSystemErrorAlert Description
This alert indicates Cisco CTI Gateway application system errors.
Unified RTMT Default Threshold
Not applicable.
Recommended Actions
Use Cisco RTMT to check the Cisco SIP Proxy service trace log file for any detailed error messages.
CTIGWUserNotAuthorizedAlert Description
This alert indicates that the user failed to authorized due to wrong device or line DN.
Unified RTMT Default Threshold
Not applicable.
Recommended Actions
Verify user device configuration and MOC settings.
CTIGWProviderFailedtoOpenType
IM and Presence Service
Cisco Unified Real-Time Monitoring Tool Administration Guide, Release 11.0(1)376
Performance Counters and AlertsCTIGWModuleNotEnabled

Alert Description
This alert indicates that the CTI Provider failed to open due to a configuration error.
Unified RTMT Default Threshold
Not Applicable.
Recommended Actions
Verify the Cisco Unified Communications Manager addresses and application user credentials on theAdministration GUI CTI Settings page.
DuplicateDirectoryURIAlert Description
This alert indicates that there are multiple users within the intercluster deployment that are assignedthe same directory URI value when the Directory URI IM Address scheme is configured.
Unified RTMT Default Threshold
Not applicable.
Recommended Actions
Take immediate action to correct the issue. Each user must be assigned a unique directory URI. Affectedusers may be homed on an intercluster peer.
DuplicateUseridAlert Description
This alert indicates that there are duplicate user IDs assigned to one or more users on different clusterswithin the intercluster deployment.
Unified RTMT Default Threshold
Not applicable.
Recommended Actions
Take immediate action to correct the issue. Each user must be assigned a unique user ID. The affectedusers may be homed on an intercluster peer.
ESPSocketErrorAlert Description
This alert indicates network socket errors that could be caused by binding errors such as get socketaddress failures.
Unified RTMT Default Threshold
Not applicable.
Cisco Unified Real-Time Monitoring Tool Administration Guide, Release 11.0(1) 377
Performance Counters and AlertsDuplicateDirectoryURI

Recommended Actions
Use Cisco RTMT to check the Cisco SIP Proxy service trace log file for any detailed error messages.
ESPCreateLockFailedAlert Description
This alert indicates that lock file has not been created.
Unified RTMT Default Threshold
Not applicable.
Recommended Actions
Use Cisco RTMT to check the Cisco SIP Proxy service trace log file for any detailed error messages.
ESPConfigErrorAlert Description
This alert indicates Cisco SIP Proxy service configuration file error.
Unified RTMT Default Threshold
Not applicable.
Recommended Actions
Verify that the Cisco Config Agent service is running. This service is responsible for writing the proxyconfiguration file.
ESPSharedMemAllocFailedAlert Description
This alert indicates that the Cisco SIP Proxy service failed to allocate shared memory segments whiletrying to initialize tables.
Unified RTMT Default Threshold
Not Applicable
Recommended Actions
Use Unified RTMT to check system shared memory, check the Cisco SIP Proxy service trace log filefor any detailed error messages and contact Cisco TAC for assistance.
Cisco Unified Real-Time Monitoring Tool Administration Guide, Release 11.0(1)378
Performance Counters and AlertsESPCreateLockFailed

ESPSharedMemSetPermFailedAlert Description
This alert indicates that the Cisco SIP Proxy service failed to set permissions on sharedmemory segmentswhile trying to initialize tables.
Unified RTMT Default Threshold
Not Applicable
Recommended Actions
Use Unified RTMT to check system shared memory, check the Cisco SIP Proxy service trace log filefor any detailed error messages, and contact Cisco TAC for assistance.
EspConfigAgentHighCPUUtilizationAlert Description
This alert indicates that CPU utilization has exceeded the configured threshold.
Unified RTMT Default Threshold
Not applicable.
Recommended Actions
Use Unified RTMT to check the Cisco SIP Proxy service trace log file for any detailed error messages.
ESPMallocFailureAlert Description
This alert indicates that memory allocation has failed. This may indicate a low or no memory issuewith the server.
Unified RTMT Default Threshold
Not applicable.
Recommended Actions
Use Unified RTMT to check the Cisco SIP Proxy service trace log file for any detailed error messages.
ESPRegistryErrorAlert Description
This alert indicates that it is not possible to add registration to the SIP Registry because a resource limitwas exceeded.
Cisco Unified Real-Time Monitoring Tool Administration Guide, Release 11.0(1) 379
Performance Counters and AlertsESPSharedMemSetPermFailed

Unified RTMT Default Threshold
Not applicable.
Recommended Actions
Use Cisco RTMT to check the Cisco SIP Proxy service trace log file for any detailed error messages.
EspConfigAgentSharedMemoryStaticRouteErrorAlert Description
This alert indicates that the Cisco Config Agent service failed to access static routes in shared memory.This may indicate that the system is out of memory.
Unified RTMT Default Threshold
Not applicable.
Recommended Actions
Using Cisco RTMT, verify if the system shared memory is low or exhausted. This alarm may indicatethe system is overloaded which may require reassigning users to other nodes in the IM and PresenceService cluster. You can reassign users to other nodes using the Topology page on the AdministrationGUI.
ESPStatsLogFileOpenFailedAlert Description
This alert indicates that the Cisco SIP Proxy service stats log file has failed to open.
Unified RTMT Default Threshold
Not applicable.
Recommended Actions
Use Cisco RTMT to check the Cisco SIP Proxy service trace log file for any detailed error messages.
ESPLoginErrorAlert Description
This alert indicates that an error occurred while communicating with the login datastore.
Unified RTMT Default Threshold
Not applicable.
Recommended Actions
Use Cisco RTMT to check the Cisco SIP Proxy service trace log file for any detailed error messages.
Cisco Unified Real-Time Monitoring Tool Administration Guide, Release 11.0(1)380
Performance Counters and AlertsEspConfigAgentSharedMemoryStaticRouteError

EspConfigAgentProxyDomainNotConfiguredAlert Description
This alert indicates that the Cisco Config Agent service is not configured. Cisco Config Agent serviceuses the proxy domain to properly generate ACLs. If not configured it could lead to routing failures.
Unified RTMT Default Threshold
Not applicable.
Recommended Actions
Go to the Service Parameters drop-down menu on the IM and Presence Service publisher. Select theCisco SIP Proxy service. Enter the IM and Presence Service domain into the Proxy Domain serviceparameter and save.
EspConfigAgentNetworkRestoredAlert Description
This alert indicates that Cisco Config Agent network is restored.
Unified RTMT Default Threshold
Not applicable.
Recommended Actions
Verify system health and network connectivity using Cisco RTMT.
EspConfigAgentLocalDBAccessErrorAlert Description
This alert indicates that the Cisco Config Agent service failed to read or write to the local IM andPresence Service database.
Unified RTMT Default Threshold
Not applicable.
Recommended Actions
Verify the system health using Cisco RTMT. Verify that the service A Cisco DB is running.
ESPConfigNotFoundAlert Description
This alert indicates that Cisco SIP Proxy service configuration file is not found.
Cisco Unified Real-Time Monitoring Tool Administration Guide, Release 11.0(1) 381
Performance Counters and AlertsEspConfigAgentProxyDomainNotConfigured

Unified RTMT Default Threshold
Not applicable.
Recommended Actions
Verify that the configuration files /usr/local/sip/conf/sipd.conf and/usr/local/sip/conf/dynamic.sipd.conf exist on the IM and Presence server.
EspConfigAgentRemoteDBAccessErrorAlert Description
This alert indicates that the Cisco Config Agent service cannot access a remote IM and Presence Servicedatabase.
Unified RTMT Default Threshold
Not applicable.
Recommended Actions
Verify that the service A Cisco DB is running on the node specified in the alert. Sometimes these errorscan be transient. In some cases the Config Agent may be accessing remote nodes that are not availablefor some reason. If that is the case, then this error is expected. This result would happen in a userreassignment to a node that is not installed or available.
ESPPassedParamInvalidAlert Description
This alert indicates that invalid parameters were specified. This could be because the parameters wereNULL.
Unified RTMT Default Threshold
Not applicable.
Recommended Actions
Use Unified RTMT to check the Cisco SIP Proxy service trace log file for any detailed error messages.
ESPSharedMemCreateFailedAlert Description
This alert indicates that the Cisco SIP Proxy service failed to create shared memory segments whiletrying to initialize tables.
Unified RTMT Default Threshold
Not Applicable
Cisco Unified Real-Time Monitoring Tool Administration Guide, Release 11.0(1)382
Performance Counters and AlertsEspConfigAgentRemoteDBAccessError

Recommended Actions
Use Unified RTMT to check system shared memory, check the Cisco SIP Proxy service trace log filefor any detailed error messages, and contact Cisco TAC for assistance.
EspConfigAgentHighMemoryUtilizationAlert Description
This alert indicates that the virtual memory utilization has exceeded the configured threshold.
Unified RTMT Default Threshold
Not applicable.
Recommended Actions
Use Unified RTMT to monitor memory utilization and reduce system load to improve performance ifnecessary.
ESPNAPTRInvalidRecordAlert Description
This alert indicates that NAPTR record format error.
Unified RTMT Default Threshold
Not applicable.
Recommended Actions
Use Cisco RTMT to check the Cisco SIP Proxy service trace log file for any detailed error messages.
ESPWrongIPAddressAlert Description
This alert indicates that an invalid IP address has been provided.
Unified RTMT Default Threshold
Not applicable.
Recommended Actions
Use Cisco RTMT to check the Cisco SIP Proxy service trace log file for any detailed error messages.
EspConfigAgentNetworkOutageAlert Description
This alert indicates Cisco Config Agent network outage.
Cisco Unified Real-Time Monitoring Tool Administration Guide, Release 11.0(1) 383
Performance Counters and AlertsEspConfigAgentHighMemoryUtilization

Unified RTMT Default Threshold
Not applicable.
Recommended Actions
Verify system health and network connectivity using Cisco RTMT.
EspConfigAgentMemAllocErrorAlert Description
This alert indicates that the Cisco Config Agent service cannot allocate memory.
Unified RTMT Default Threshold
Not applicable.
Recommended Actions
Using Unified RTMT, verify if the system memory is low or exhausted. This alarm may indicate thatthe system is overloaded which may require reassigning users to other nodes in the IM and PresenceService cluster. You can reassign users to other nodes using the Topology page on the IM and PresenceService Administration GUI.
EspConfigAgentFileWriteErrorAlert Description
This alert indicates that the Cisco Config Agent service cannot write to the file system.
Unified RTMT Default Threshold
Not applicable.
Recommended Actions
Using Unified RTMT, verify whether the disk space is low or exhausted. This alarm may indicate thatthe system is overloaded, which may require reassigning users to other nodes in the IM and PresenceService cluster. You can reassign users to other nodes using the Topology page on the IM and PresenceService Administration GUI.
ESPVirtualProxyErrorAlert Description
This alert indicates Virtual_Proxy_Domain related error.
Unified RTMT Default Threshold
Not applicable.
Recommended Actions
Use Cisco RTMT to check the Cisco SIP Proxy service trace log file for any detailed error messages.
Cisco Unified Real-Time Monitoring Tool Administration Guide, Release 11.0(1)384
Performance Counters and AlertsEspConfigAgentMemAllocError

ESPStoppedAlert Description
This alert indicates that the Cisco SIP Proxy service child process has stopped.
Unified RTMT Default Threshold
Not Applicable
Recommended Actions
If the administrator has not manually stopped the Proxy service, this may indicate a problem. UseUnified RTMT to check for any related alarms and contact Cisco TAC for assistance.
ESPWrongHostNameAlert Description
This alert indicates an invalid IP address or an unresolvable hostname.
Unified RTMT Default Threshold
Not applicable.
Recommended Actions
Use Cisco RTMT to check the Cisco SIP Proxy service trace log file for any detailed error messages.
ESPRoutingErrorAlert Description
This alert indicates SIP Route Interface resource limit exceeded error.
Unified RTMT Default Threshold
Not applicable.
Recommended Actions
Use Cisco RTMT to check the Cisco SIP Proxy service trace log file for any detailed error messages.
InterclusterSyncAgentAXLConnectionFailedAlert Description
This alert indicates that the Cisco Intercluster Sync Agent service failed authentication to the remoteIM and Presence Service cluster and therefore cannot connect.
Unified RTMT Default Threshold
Not Applicable.
Cisco Unified Real-Time Monitoring Tool Administration Guide, Release 11.0(1) 385
Performance Counters and AlertsESPStopped

Recommended Actions
Verify that the AXL credentials are correct and whether the Cisco AXL Web service is running on theremote IM and Presence Service cluster.
InterclusterSyncAgentPeerDuplicateAlert Description
This alert indicates that the Cisco Intercluster Sync Agent service failed to sync user location data froma remote peer. The remote peer is from an IM and Presence Service cluster that already has a peer inthe local cluster.
Unified RTMT Default Threshold
Not Applicable.
Recommended Actions
Verify that the hostname of the remote peer is not a secondary node from the identified existing peer.If the new peer is a secondary node, then remove this peer from the IM and Presence ServiceAdministration GUI Inter-cluster details page. You can also run the System Troubleshooter for moredetails.
ICSACertificateFingerPrintMisMatchAlert Description
This alert indicates that the Cisco Intercluster Sync Agent service detected a fingerprint mismatch onthe certificate being processed.
Unified RTMT Default Threshold
Not Applicable
Recommended Actions
Use the IM and Presence Service OS Administration GUI to compare the certificates that are loadedon this server with the certificates on the source server. You might need to delete the problem certificatesand reload them.
ICSACertificateCASignedTrustCertFoundAlert Description
This alert indicates that the Cisco Intercluster Sync Agent service has detected a signed CA trustcertificate.
Unified RTMT Default Threshold
Not applicable.
Cisco Unified Real-Time Monitoring Tool Administration Guide, Release 11.0(1)386
Performance Counters and AlertsInterclusterSyncAgentPeerDuplicate

Recommended Actions
Allow only unsigned CA trust certificates.
ICSACertificateValidationFailureAlert Description
This alert indicates that the Cisco Intercluster Sync Agent service detected a validation error on thecertificate being processed.
Unified RTMT Default Threshold
Not Applicable
Recommended Actions
Use the IM and Presence OS Administration GUI to compare the certificates that are loaded on thisserver with the certificates on the source server. You might need to delete the problem certificates andreload them.
InvalidDirectoryURIAlert Description
This alert indicates that one or more users within the deployment are assigned an empty or invaliddirectory URI value when the Directory URI IM Address scheme is configured.
Unified RTMT Default Threshold
Not applicable.
Recommended Actions
Take immediate action to correct the issue. Affected users may be homed on an intercluster peer.
LegacyCUPCLoginAlert Description
This alert indicates that a legacy Cisco Unified Personal Communicator client has attempted to loginto the Cisco Client Profile Agent service.
Unified RTMT Default Threshold
Not applicable.
Recommended Actions
Upgrade the legacy Cisco Unified Personal Communicator client as it is currently not supported.
Cisco Unified Real-Time Monitoring Tool Administration Guide, Release 11.0(1) 387
Performance Counters and AlertsICSACertificateValidationFailure

NotInCucmServerListErrorAlert Description
This alert indicates that the Cisco Sync Agent failed to start because the IM and Presence node is notin the server list on the Cisco Unified Communications Manager publisher.
Unified RTMT Default Threshold
Not applicable.
Recommended Actions
Add the IM and Presence node to the server list on the Cisco Unified Communications Manager serverand start the Cisco Sync Agent service.
PEStateLockedAlert Description
This alert indicates that the Cisco Presence Engine service is administratively prohibited from processingtraffic.
Unified RTMT Default Threshold
Not applicable.
Recommended Actions
This alert is only for notification purpose. No action is required.
PWSAboveCPULimitAlert Description
This alert indicates that the Presence Web Service module running in the Cisco SIP Proxy service hasdetected that the CPU utilization has exceeded the configured threshold. During this time, new requestsare blocked until the CPU utilization drops below the configured threshold.
Unified RTMT Default Threshold
Not applicable.
Recommended Actions
Using Unified RTMT, inspect the Cisco SIP Proxy service logs for more details.
PWSRequestLimitReachedAlert Description
This alert indicates that the Cisco SIP Proxy service request per second limit has been reached.
Cisco Unified Real-Time Monitoring Tool Administration Guide, Release 11.0(1)388
Performance Counters and AlertsNotInCucmServerListError

Unified RTMT Default Threshold
Not applicable.
Recommended Actions
You may need to throttle back the incoming request rate.
PEIDSQueryErrorAlert Description
This alert indicates that the Cisco Presence Engine service has detected an error while querying the IMand Presence Service database.
Unified RTMT Default Threshold
Not Applicable
Recommended Actions
Restart the Cisco Presence Engine service when convenient. See the associated error message and logfiles and consult Cisco TAC if the problem persists.
PEStateDisabledAlert Description
This alert indicates that the Cisco Presence Engine service is inoperable and cannot process traffic.
Unified RTMT Default Threshold
Not applicable.
Recommended Actions
Check the log files and monitor the Cisco Presence Engine service with Unified RTMT.
PELoadHighWaterMarkAlert Description
This alert indicates that the Cisco Presence Engine service has exceeded CPU utilization threshold.
Unified RTMT Default Threshold
Not applicable.
Recommended Actions
Inspect the number of active subscription counters using Cisco RTMT: ActiveSubscriptions,ActiveViews, SubscriptionActiveReceivedFromForeign, and SubscriptionActiveSentForeign. If thiscondition persists, you may consider moving users to a different IM and Presence Service node in thecluster.
Cisco Unified Real-Time Monitoring Tool Administration Guide, Release 11.0(1) 389
Performance Counters and AlertsPEIDSQueryError

PWSAboveSipSubscriptionLimitAlert Description
This alert indicates that the Presence Web Service running in the Cisco SIP Proxy service has detectedthat the subscription count has exceeded the configured limit. During this time the PresenceWeb Servicewill block new incoming SIP subscriptions until the subscription count drops below the configuredlimit.
Unified RTMT Default Threshold
Not applicable.
Recommended Actions
Using Cisco RTMT, inspect the Cisco SIP Proxy service logs for more details.
PEMemoryHighConditionAlert Description
This alert indicates that the Cisco Presence Engine service has hit a high memory threshold.
Unified RTMT Default Threshold
Not applicable.
Recommended Actions
Check the number of active subscription counters: ActiveSubscriptions, ActiveViews,SubscriptionActiveReceivedFromForeign, and SubscriptionActiveSentForeign using Unified RTMT.If this condition persists, offload some users to a different IM and Presence node in the cluster.
PESipSocketBindFailureAlert Description
This alert indicates that the Cisco Presence Engine service cannot connect to the indicated configuredinterface. No SIP traffic can be processed on this interface.
Unified RTMT Default Threshold
Not applicable.
Recommended Actions
Verify that the Cisco Presence Engine service listen interface is configured correctly on the IM andPresence Service Administration GUI Application Listener page. Verify that no other process is listeningon the same port using netstat.
Cisco Unified Real-Time Monitoring Tool Administration Guide, Release 11.0(1)390
Performance Counters and AlertsPWSAboveSipSubscriptionLimit

PEIDStoIMDBDatabaseSyncErrorAlert Description
This alert indicates that synchronization between the IM and Presence database and the Cisco PresenceEngine and a database service has failed (Cisco Login Datastore, Cisco Route Datastore, Cisco PresenceDatastore, and Cisco SIP Registration Datastore).
Unified RTMT Default Threshold
Not Applicable
Recommended Actions
Restart the Cisco Presence Engine service when convenient. See associated error message and log filesand consult Cisco TAC if the problem persists.
PEIDSSubscribeErrorAlert Description
This alert indicates that the Cisco Presence Engine service was unable to subscribe for IM and PresenceService database change notifications.
Unified RTMT Default Threshold
Not Applicable
Recommended Actions
Restart the Cisco Presence Engine service when convenient. See the associated error message and logfiles and consult Cisco TAC if the problem persists.
PWSSCBFindFailedAlert Description
This alert indicates that a call to find_scb() returned NULL which indicates the SCB lookup failed.
Unified RTMT Default Threshold
Not applicable.
Recommended Actions
Use Cisco RTMT to check the Cisco SIP Proxy service trace log file for any detailed error messages.
Cisco Unified Real-Time Monitoring Tool Administration Guide, Release 11.0(1) 391
Performance Counters and AlertsPEIDStoIMDBDatabaseSyncError

PEDatabaseErrorAlert Description
This alert indicates that the Cisco Presence Engine service encountered an error while retrievinginformation from the database. This may indicate a problem with the Cisco DB service.
Unified RTMT Default Threshold
Not Applicable
Recommended Actions
Verify that the Cisco DB service is running. Use Unified RTMT to check the Cisco Presence Engineservice logs for errors. Consult Cisco TAC for guidance.
PWSSCBInitFailedAlert Description
This alert indicates that SCB init has failed.
Unified RTMT Default Threshold
Not applicable.
Recommended Actions
Restart the Cisco SIP Proxy service.
PEWebDAVInitializationFailureAlert Description
This alert indicates that the Cisco Presence Engine service has failed to initialize the WebDAV library.
Unified RTMT Default Threshold
Not applicable.
Recommended Actions
Restart the Cisco Presence Engine service.
PEPeerNodeFailureAlert Description
This alert indicates that Cisco Presence Engine service on the peer node of a subcluster has failed.
Unified RTMT Default Threshold
Not Applicable
Cisco Unified Real-Time Monitoring Tool Administration Guide, Release 11.0(1)392
Performance Counters and AlertsPEDatabaseError

Recommended Actions
Use Cisco Unified Serviceability to verify that the Cisco Presence Engine service is running. ConsultCisco TAC for further assistance.
PEAutoRecoveryFailedAlert Description
This alert indicates that an error occurred during the startup sequence of the Cisco Presence Engineservice.
Unified RTMT Default Threshold
Not applicable.
Recommended Actions
This error may indicate a possible configuration issue. Correct the problem identified in the failuremessage.
SRMFailoverType
IM and Presence Service
Alert Description
This alert indicates that the Server Recovery Manager is performing an automatic failover.
Unified RTMT Default Threshold
Not Applicable
Recommended Actions
Verify that the failed node is up and that critical services are running.
SRMFailedAlert Description
This alert indicates that the Server Recovery Manager is in the Failed state.
Unified RTMT Default Threshold
Not Applicable
Recommended Actions
When it is convenient restart the Server Recovery Manager.
Cisco Unified Real-Time Monitoring Tool Administration Guide, Release 11.0(1) 393
Performance Counters and AlertsPEAutoRecoveryFailed

UASCBFindFailedAlert Description
This alert indicates that a call to find_scb() returned NULL which indicates the SCB lookup failed.
Unified RTMT Default Threshold
Not applicable.
Recommended Actions
Use Cisco RTMT to check the Cisco SIP Proxy service trace log file for any detailed error messages.
UASCBGetFailedAlert Description
This alert indicates that a call to tcbtable_acquire_tcb() returned NULLwhich indicates a SCB get/createfailure.
Unified RTMT Default Threshold
Not applicable.
Recommended Actions
Use Cisco RTMT to check the Cisco SIP Proxy service trace log file for any detailed error messages.
XcpMFTDBConnectErrorAlert Description
This alert indicates that the Cisco XCP data access layer was unable to connect to the external database.
Unified RTMT Default Threshold
Not Applicable
Recommended Actions
Check the System Troubleshooter for more information. Also check that the external database is runninghealthy and if there is a problem with the network connectivity to the external database server.
XcpMFTExtFsMountErrorAlert Description
This alert indicates that the Cisco XCP File Transfer Manager has lost its connection to the externalfile server.
Cisco Unified Real-Time Monitoring Tool Administration Guide, Release 11.0(1)394
Performance Counters and AlertsUASCBFindFailed

Unified RTMT Default Threshold
Not Applicable
Recommended Actions
Check the External File Server Troubleshooter for more information. Also check that the external fileserver is running correctly or if there is a problem with the network connectivity to the external fileserver.
XcpMFTExtFsFreeSpaceWarnAlert Description
This alert indicates that the Cisco XCP File Transfer Manager has detected that the available disk spaceon the external file server is low.
Unified RTMT Default Threshold
Less than 10% of the file server disk space remains.
Recommended Actions
The alert is cleared by increasing disk space to greater than 15%. Free up space on the external fileserver by deleting unwanted files from the partition used for file transfers.
XcpDBConnectErrorAlert Description
Cisco XCP data access layer was unable to connect to the DB. This may indicate that the local orexternal database is down or the network connectivity to the external database is lost.
Unified RTMT Default Threshold
Not applicable.
Recommended Actions
Check the System Troubleshooter for more information. Also check that the external database is runninghealthy and if there is any problem with the network connectivity to the external database server.
XcpCmStartupErrorAlert Description
This alert indicates that the XCP Connection Manager service failed to startup.
Unified RTMT Default Threshold
Not applicable.
Cisco Unified Real-Time Monitoring Tool Administration Guide, Release 11.0(1) 395
Performance Counters and AlertsXcpMFTExtFsFreeSpaceWarn

Recommended Actions
Check the CM log file for more details.
XcpSIPFedCmComponentConnectErrorAlert Description
This alert indicates that the Cisco XCP SIP Federation ConnectionManager is shutting down as it failedto connect to the Cisco XCP Router.
Unified RTMT Default Threshold
Not applicable.
Recommended Actions
Check the Cisco XCP SIP Federation Connection Manager log file for more details.
XcpTxtConfGearErrorAlert Description
This alert indicates that the XCP Text ConferenceManager (TC) Service has failed to load a configuredcomponent. This can prevent the service to start or behave as expected.
Unified RTMT Default Threshold
Not applicable.
Recommended Actions
Check the XCP Text Conference log file for more details.
XCPConfigMgrConfigurationFailureAlert Description
This alert indicates that the Cisco XCPConfigManager failed to successfully update XCP configuration.
Unified RTMT Default Threshold
Not Applicable
Recommended Actions
See the Cisco XCP Config Manager logs for the root cause. Contact Cisco TAC for assistance.
Cisco Unified Real-Time Monitoring Tool Administration Guide, Release 11.0(1)396
Performance Counters and AlertsXcpSIPFedCmComponentConnectError
XcpWebCmComponentConnectErrorAlert Description
This alert indicates that the Cisco XCPWeb ConnectionManager is shutting down as it failed to connectto the Cisco XCP Router.
Unified RTMT Default Threshold
Not applicable.
Recommended Actions
Check the Cisco XCP Web Connection Manager log file for more details.
XcpXMPPFedCmStartupError
XcpXMPPFedCmComponentConnectErrorAlert Description
This alert indicates that the Cisco XCPXMPP Federation ConnectionManager is shutting down becauseit failed to connect to the Cisco XCP Router.
Unified RTMT Default Threshold
Not applicable.
Recommended Actions
Check the Cisco XCP XMPP Federation Connection Manager log file for more details.
XcpSIPFedCmStartupErrorAlert Description
This alert indicates that the Cisco XCP SIP Federation Connection Manager service has failed to start.
Unified RTMT Default Threshold
Not applicable.
Recommended Actions
Check the Cisco XCP SIP Federation Connection Manager log file for more details.
XcpCmXmppdErrorAlert Description
This alert indicates that the XCP Connection Manager (CM) service has errors in the XMPP interface.
Cisco Unified Real-Time Monitoring Tool Administration Guide, Release 11.0(1) 397
Performance Counters and AlertsXcpWebCmComponentConnectError

Unified RTMT Default Threshold
Not applicable.
Recommended Actions
Check the CM log file for more details.
XcpCmPauseSocketsAlert Description
This alert indicates that the outstandingXCP internal packet or database requests have reached configuredlimit. Client connections will be paused until pending requests have dropped back below threshold.Users will experience lag until issue is resolved. Users may be disconnected if configured timeout isreached before resolution.
Unified RTMT Default Threshold
Not applicable.
Recommended Actions
Check the XCP Router log file for more details. Monitor client disconnecting due to timeout from theXCP Connection Managers.
XcpThirdPartyComplianceConnectErrorAlert Description
This alert indicates that Cisco XCP Router is unable to connect to the Third Party Compliance Server.This may be because of a network problem or a Third Party Compliance Server configuration or licensingproblem.
Unified RTMT Default Threshold
Not applicable.
Recommended Actions
This is a serious error that breaks IM on the IM and Presence Service. Check network connection toand configuration(including licensing) on Third Party Compliance Server. To restore IM services setthe Compliance Settings option in the Administration GUI to Not Configured until the connectionfailure cause is identified.
XCPConfigMgrJabberRestartRequiredAlert Description
This alert indicates that the Cisco XCP Config Manager has regenerated XCP XML files after systemhalt due to buffer size. The Cisco XCP Router must now be restarted to apply changes.
Cisco Unified Real-Time Monitoring Tool Administration Guide, Release 11.0(1)398
Performance Counters and AlertsXcpCmPauseSockets

Unified RTMT Default Threshold
Not Applicable
Recommended Actions
When it is convenient to do so, restart the Cisco XCP Router.
XcpTxtConfDBConnectErrorAlert Description
This alert indicates that the Cisco XCP Text Conferencing data access layer was unable to connect tothe external database.
Unified RTMT Default Threshold
Not applicable.
Recommended Actions
Check the system troubleshooter for more information. Also check if the external database is runningproperly and if there is any problem with the network connectivity to the external database server.
XcpMdnsStartErrorAlert Description
This alert indicates that the XCP Router failed to startup theMulticast Domain Name Service (MDNS).This can cause connectivity failures to other routers in the cluster.
Unified RTMT Default Threshold
Not applicable.
Recommended Actions
Check the XCP Router log file for more details.
XCPConfigMgrR2RPasswordEncryptionFailedAlert Description
This alert indicates that the Cisco XCP Config Manager was unable to encrypt the password that isassociated with an Inter-cluster Router-to-Router configuration.
Unified RTMT Default Threshold
Not Applicable
Recommended Actions
When it is convenient to do so, restart the Cisco XCP Config Manager and then restart the Cisco XCPRouter.
Cisco Unified Real-Time Monitoring Tool Administration Guide, Release 11.0(1) 399
Performance Counters and AlertsXcpTxtConfDBConnectError

XcpCmComponentConnectErrorAlert Description
This alert indicates that the Cisco XCP Connection Manager is shutting down because it failed toconnect to the Cisco XCP Router.
Unified RTMT Default Threshold
Not applicable.
Recommended Actions
Check the Cisco XCP Connection Manager log file for more details.
XcpWebCmStartupErrorAlert Description
This alert indicates that the Cisco XCP Web Connection Manager service has failed to start.
Unified RTMT Default Threshold
Not applicable.
Recommended Actions
Check the Cisco XCP Web Connection Manager log file for more details.
XCPConfigMgrR2RRequestTimedOutAlert Description
This alert indicates that Cisco XCP Config Manager sent an R2R configuration request to the XCPRouter, but the XCP Router did not acknowledge the request in the time allowed.
Unified RTMT Default Threshold
Not applicable.
Recommended Actions
Restart the Cisco XCP Config Manager and then restart the XCP Router.
XcpWebCmHttpdErrorAlert Description
This alert indicates that the Cisco XCP Web Connection Manager service has errors in the HTTPinterface.
Unified RTMT Default Threshold
Not applicable.
Cisco Unified Real-Time Monitoring Tool Administration Guide, Release 11.0(1)400
Performance Counters and AlertsXcpCmComponentConnectError

Recommended Actions
Check the Cisco XCP Web Connection Manager log file for more details.
XCPConfigMgrHostNameResolutionFailedAlert Description
This alert indicates that the Cisco XCP Config Manager could not resolve a DNS name to allow CiscoXCP Routers to connect to that node.
Unified RTMT Default Threshold
Not Applicable
Recommended Actions
Verify DNS resolvability of all hostnames and FQDNs in both local and remote clusters. Restart theCisco XCP Config Manager and then restart the Cisco XCP Router after DNS is resolvable.
XcpSIPGWStackResourceErrorAlert Description
This alert indicates that the maximum supported concurrent SIP Federation subscriptions or SIPFederation IM sessions has been reached, and the Cisco XCP SIP Federation ConnectionManager doesnot have the resources that are required to handle any addition subscriptions or IM sessions.
Unified RTMT Default Threshold
Not Applicable
Recommended Actions
Increase the Pre-allocated SIP stack memory Service Parameter for the Cisco XCP SIP FederationConnection Manager. Note: If you are changing this setting, make sure that you have the memoryavailable. If you do not have enough memory, you may have reached the limit of your hardwarecapability.
Intercompany Media Engine Alerts
BannedFromNetworkThis alert indicates that network administrators have banned this Cisco IME server from the network (IMEdistributed cache ring), making this Cisco IME service fully or partly inoperative. Network administratorsrarely ban servers but do so if they detect that the server is being used to launch malicious attacks into thenetwork. If you receive this alert in error, contact TAC immediately.
Cisco Unified Real-Time Monitoring Tool Administration Guide, Release 11.0(1) 401
Performance Counters and AlertsXCPConfigMgrHostNameResolutionFailed

Default Configuration
Table 202: Default Configuration for the BannedFromNetwork Alert
Default ConfigurationValue
SelectedEnable Alert
AlertSeverity
Enabled on listed serversEnable/Disable thisalert on the followingservers
Trigger alert when following condition met:
Cisco IME service banned from network
Threshold
Trigger alert immediatelyDuration
Trigger alert on every pollFrequency
24 hours dailySchedule
SelectedEnable Email
DefaultTrigger Alert Action
IMEDistributedCacheCertificateExpiringThis alert indicates the number of days that remain until the certificate that is used for the IME distributedcache expires. You must replace the certificate prior to expiration.
Default Configuration
Table 203: Default Configuration for the IMEDistributedCacheCertificateExpiring Alert
Default ConfigurationValue
SelectedEnable Alert
WarningSeverity
Enabled on listed serversEnable/Disable thisalert on the followingservers
Trigger alert when following condition met:
Cisco IME distributed cache certificate about to expire. 14 days.
Threshold
Cisco Unified Real-Time Monitoring Tool Administration Guide, Release 11.0(1)402
Performance Counters and AlertsIMEDistributedCacheCertificateExpiring

Default ConfigurationValue
Trigger alert immediatelyDuration
Trigger up to 1 alerts within 1440 minutesFrequency
24 hours dailySchedule
SelectedEnable Email
DefaultTrigger Alert Action
IMEDistributedCacheFailureThis alert indicates the health of the IME distributed cache. A value of zero (red) means that the IME distributedcache is suffering from a significant problem such as one of the following conditions:
• The Cisco IME cannot resolve issues after the network was partitioned. In this case, validation attemptsmay fail.
• The Cisco IME service is not connected to the network at all and is unable to reach the bootstrap servers.
A value of one (yellow) indicates that the Cisco IME network is experiencingminor issues, such as connectivitybetween bootstrap servers or other Cisco IME network issues. Check for any alarms that may indicate whythis counter is 1. A value of two indicates that IME distributed cache is functioning normally and the systemis considered healthy.
Default Configuration
Table 204: Default Configuration for the IMEDistributedCacheFailure Alert
Default ConfigurationValue
SelectedEnable Alert
AlertSeverity
Enabled on listed serversEnable/Disable thisalert on the followingservers
Trigger alert when following condition met:
IME distributed cache failure in states
1: network experience minor issues
0: network in trouble
Threshold
Trigger alert immediatelyDuration
Cisco Unified Real-Time Monitoring Tool Administration Guide, Release 11.0(1) 403
Performance Counters and AlertsIMEDistributedCacheFailure

Default ConfigurationValue
Trigger 1 alert within 60 minutesFrequency
24 hours dailySchedule
SelectedEnable Email
DefaultTrigger Alert Action
IMESdlLinkOutOfServiceThis alert indicates that the Cisco IME service has lost communication with Cisco IME Config Managerservices, such as the Cisco AMC Service or the Cisco CallManager Service.
This alert usually indicates that one of these services has gone down (either intentionally, for maintenance;or unintentionally, due to a service failure or connectivity failure).
Default Configuration
Table 205: Default Configuration for the IMESdlLinkOutOfService Alert
Default ConfigurationValue
SelectedEnable Alert
CriticalSeverity
Enabled on listed serversEnable/Disable thisalert on the followingservers
Trigger alert when following condition met:
SDLLinkOOS event generated
Threshold
Trigger alert immediatelyDuration
Trigger alert on every pollFrequency
24 hours dailySchedule
SelectedEnable Email
DefaultTrigger Alert Action
Cisco Unified Real-Time Monitoring Tool Administration Guide, Release 11.0(1)404
Performance Counters and AlertsIMESdlLinkOutOfService

InvalidCertificateThis alert indicates that the administrator enabled the IME distributed cache on the Cisco IME server butomitted the configuration of a valid certificate or configured an incorrect certificate.
Default Configuration
Table 206: Default Configuration for the InvalidCertificate Alert
Default ConfigurationValue
SelectedEnable Alert
AlertSeverity
Enabled on listed serversEnable/Disable thisalert on the followingservers
Trigger alert when following condition met:
Invalid certificate configured
Threshold
Trigger alert immediatelyDuration
Trigger alert on every pollFrequency
24 hours dailySchedule
SelectedEnable Email
DefaultTrigger Alert Action
InvalidCredentialsThe alert indicates that the Cisco Unified Communications Manager cannot connect to the Cisco IME server,because the username and password that are configured on Cisco Unified Communications Manager do notmatch those configured on the Cisco IME server.
The alert includes the username and password that were used to connect to the Cisco IME server as well asthe IP address and name of the target Cisco IME server. To resolve this alert, log into the Cisco IME serverand check that the username and password that are configured match those configured in Cisco UnifiedCommunications Manager.
Cisco Unified Real-Time Monitoring Tool Administration Guide, Release 11.0(1) 405
Performance Counters and AlertsInvalidCertificate

Default Configuration
Table 207: Default Configuration for the InvalidCredentials Alert
Default ConfigurationValue
SelectedEnable Alert
ErrorSeverity
Enabled on listed serversEnable/Disable thisalert on the followingservers
Trigger alert when following condition met:
Invalid or mismatched credentials.
Threshold
Trigger alert immediatelyDuration
Trigger alert on every pollFrequency
24 hours dailySchedule
SelectedEnable Email
DefaultTrigger Alert Action
MessageOfTheDayThe Cisco IME service generates this alert when the administrators of the Cisco IME network have a messagefor you.
Default Configuration
Table 208: Default Configuration for the MessageOfTheDay Alert
Default ConfigurationValue
SelectedEnable Alert
NoticeSeverity
Enabled on listed serversEnable/Disable thisalert on the followingservers
Trigger alert when following condition met:
Message from network administrators
Threshold
Cisco Unified Real-Time Monitoring Tool Administration Guide, Release 11.0(1)406
Performance Counters and AlertsMessageOfTheDay

Default ConfigurationValue
Trigger alert immediatelyDuration
Trigger up to 1 alert within 1440 minutesFrequency
24 hours dailySchedule
SelectedEnable Email
DefaultTrigger Alert Action
SWUpdateRequiredThe Cisco IME server generates this alert when a new version of the Cisco IME server software is required.This alert repeats until you perform the upgrade. To obtain more information about the software update, goto the Cisco website. You should install critical updates within days of receiving this alert.
These upgrades address security vulnerabilities or key functional outages. In some cases, if you do not applya critical upgrade immediately, the Cisco IME server may become unable to connect to the network.
Default Configuration
Table 209: Default Configuration for the SWUpdateRequired Alert
Default ConfigurationValue
SelectedEnable Alert
WarningSeverity
Enabled on listed serversEnable/Disable thisalert on the followingservers
Trigger alert when following condition met:
Software update required
Threshold
Trigger alert immediatelyDuration
Trigger up to 1 alerts within 60 minutesFrequency
24 hours dailySchedule
SelectedEnable Email
DefaultTrigger Alert Action
Cisco Unified Real-Time Monitoring Tool Administration Guide, Release 11.0(1) 407
Performance Counters and AlertsSWUpdateRequired

TicketPasswordChangedThe Cisco IME server generates this alert when the administrator changes the password that is used to generatethe validation tickets.
Verify that an authorized administrator changed the password. Unauthorized changes may indicate compromiseto the administrative interfaces on the Cisco IME service. If you determine that unauthorized changes havebeen made, change the administrative passwords on the Cisco IME server immediately to prevent furtherunauthorized access. To change the administrative password, type set password admin in the Cisco IMEserver CLI.
Default Configuration
Table 210: Default Configuration for the TicketPasswordChanged Alert
Default ConfigurationValue
SelectedEnable Alert
NoticeSeverity
Enabled on listed serversEnable/Disable thisalert on the followingservers
Trigger alert when following condition met:
Ticket password changed
Threshold
Trigger alert immediatelyDuration
Trigger on every pollFrequency
24 hours dailySchedule
SelectedEnable Email
DefaultTrigger Alert Action
ValidationsPendingExceededThis alert indicates the number of pending validations on the Cisco IME server. This number provides anindicator of the backlog of work on the Cisco IME server.
Cisco Unified Real-Time Monitoring Tool Administration Guide, Release 11.0(1)408
Performance Counters and AlertsTicketPasswordChanged

Default Configuration
Table 211: Default Configuration for the ValidationsPendingExceeded Alert
Default ConfigurationValue
SelectedEnable Alert
CriticalSeverity
Enabled on listed serversEnable/Disable thisalert on the followingservers
Trigger alert when following condition met:
Cisco IME pending validations exceeded 100
Threshold
Trigger alert immediatelyDuration
Trigger up to 1 alerts within 60 minutesFrequency
24 hours dailySchedule
SelectedEnable Email
DefaultTrigger Alert Action
Cisco Unity Connection Alerts
NoConnectionToPeer(Cisco Unity Connection cluster configuration) This alert is generated when the servers of a Cisco UnityConnection cluster cannot communicate with each other (for example, when the network connection is lost).
Default Configuration
Table 212: Default Configuration for the NoConnectionToPeer RTMT Alert
Default ConfigurationValue
SelectedEnable Alert
CriticalSeverity
Cisco Unified Real-Time Monitoring Tool Administration Guide, Release 11.0(1) 409
Performance Counters and AlertsCisco Unity Connection Alerts

Default ConfigurationValue
EnabledEnable/Disable thisalert on followingserver(s)
Trigger alert when following condition met:
NoConnectionToPeer event generated
Threshold
Trigger alert immediatelyDuration
Trigger alert on every pollFrequency
24 hours dailySchedule
SelectedEnable Email
DefaultTrigger Alert Action
AutoFailoverSucceeded(Cisco Unity Connection cluster configuration) This alert is generated in the following conditions:
•When the server with the Secondary status automatically changes its status to Primary (for example,when a critical failure occurs on the server with the Primary status) and assumes responsibility forhandling the voice messaging functions and database for the cluster. This alert signals that the followingevents occurred:
◦The server that originally had the Primary status experienced a serious failure.
◦The server that originally had the Secondary status now has the Primary status and is handling allcalls successfully.
•When the server that stopped functioning (described above) is brought back online and the server statusautomatically changes so that both servers resume sharing responsibility for handling the voice messagingfunctions and replication.
Default Configuration
Table 213: Default Configuration for the AutoFailoverSucceeded RTMT Alert
Default ConfigurationValue
SelectedEnable Alert
InformationalSeverity
Cisco Unified Real-Time Monitoring Tool Administration Guide, Release 11.0(1)410
Performance Counters and AlertsAutoFailoverSucceeded

Default ConfigurationValue
EnabledEnable/Disable thisalert on followingserver(s)
Trigger alert when following condition met:
AutoFailoverSucceeded event generated
Threshold
Trigger alert immediatelyDuration
Trigger alert on every pollFrequency
24 hours dailySchedule
SelectedEnable Email
DefaultTrigger Alert Action
AutoFailoverFailed(Cisco Unity Connection cluster configuration) This alert is generated in the following conditions:
•When the server with the Secondary status attempts to automatically change its status to Primary (forexample, when a critical failure occurs on the server with the Primary status), but the automatic serverstatus change fails so that the server with the Secondary status keeps the Secondary status.
•When a server that has stopped functioning (for example, a critical failure occurred) is not brought backonline. Only one server in the cluster is functioning.
Default Configuration
Table 214: Default Configuration for the AutoFailoverFailed RTMT Alert
Default ConfigurationValue
SelectedEnable Alert
ErrorSeverity
EnabledEnable/Disable thisalert on followingserver(s)
Trigger alert when following condition met:
AutoFailoverFailed event generated
Threshold
Trigger alert immediatelyDuration
Cisco Unified Real-Time Monitoring Tool Administration Guide, Release 11.0(1) 411
Performance Counters and AlertsAutoFailoverFailed

Default ConfigurationValue
Trigger alert on every pollFrequency
24 hours dailySchedule
SelectedEnable Email
DefaultTrigger Alert Action
AutoFailbackSucceeded(Cisco Unity Connection cluster configuration) This alert is generated when the problem that caused the serverwith the Primary status to stop functioning (causing the server with the Secondary status to change its statusto Primary) is resolved and both servers are again online. Then, the servers automatically change status sothat the server that had stopped functioning has the Primary status and the other server has the Secondarystatus.
Default Configuration
Table 215: Default Configuration for the AutoFailbackSucceeded RTMT Alert
Default ConfigurationValue
SelectedEnable Alert
InformationalSeverity
EnabledEnable/Disable thisalert on followingserver(s)
Trigger alert when following condition met:
AutoFailbackSucceeded event generated
Threshold
Trigger alert immediatelyDuration
Trigger alert on every pollFrequency
24 hours dailySchedule
SelectedEnable Email
DefaultTrigger Alert Action
Cisco Unified Real-Time Monitoring Tool Administration Guide, Release 11.0(1)412
Performance Counters and AlertsAutoFailbackSucceeded

AutoFailbackFailed(Cisco Unity Connection cluster configuration): This alert occurs when the publisher node is not online andthe server with the Primary status fails to automatically change status.
Default Configuration
Table 216: Default Configuration for the AutoFailbackFailed RTMT Alert
Default ConfigurationValue
SelectedEnable Alert
ErrorSeverity
EnabledEnable/Disable thisalert on followingserver(s)
Trigger alert when following condition met:
AutoFailbackFailed event generated
Threshold
Trigger alert immediatelyDuration
Trigger alert on every pollFrequency
24 hours dailySchedule
SelectedEnable Email
DefaultTrigger Alert Action
SbrFailed (Split Brain Resolution Failed)When a Cisco Unity Connection cluster is configured, if two servers cannot communicate with each other,they will both have the Primary status at the same time (a “split brain” condition), handle voice messagingfunctions, save messages to their ownmessage stores, but not perform any replication. Users can retrieve theirmessages, but only one server knows that these messages have been retrieved.
When both servers are able to communicate with each other, they resolve this split brain condition bydetermining the correct contents and state of each user mailbox:
•Whether new messages that have been received.
•Whether MWIs for new messages have already been sent.
•Which messages have been listened to.
•Which messages have been deleted.
Cisco Unified Real-Time Monitoring Tool Administration Guide, Release 11.0(1) 413
Performance Counters and AlertsAutoFailbackFailed

If the resolution of the split brain condition fails, this alert occurs.
Default Configuration
Table 217: Default Configuration for the SbrFailed RTMT Alert
Default ConfigurationValue
SelectedEnable Alert
InformationalSeverity
Trigger alert when following condition met:
SbrFailed event generated
Threshold
Trigger alert immediatelyDuration
Trigger alert on every pollFrequency
24 hours dailySchedule
SelectedEnable Email
DefaultTrigger Alert Action
DiskConsumptionCloseToCapacityThresholdThis alert is generated when the hard disk usage on the Cisco Unity Connection server reaches ten percentbelow the percentage limit that the System Settings > Advanced > Disk Capacity window in Cisco UnityConnection Administration specifies. For example, with a capacity threshold limit of 95 percent, the alert getstriggered when usage reaches at least 85 percent.
Default Configuration
Table 218: Default Configuration for the DiskConsumptionCloseToCapacityThreshold RTMT Alert
Default ConfigurationValue
SelectedEnable Alert
ErrorSeverity
EnabledEnable/Disable thisalert on followingserver(s)
Cisco Unified Real-Time Monitoring Tool Administration Guide, Release 11.0(1)414
Performance Counters and AlertsDiskConsumptionCloseToCapacityThreshold
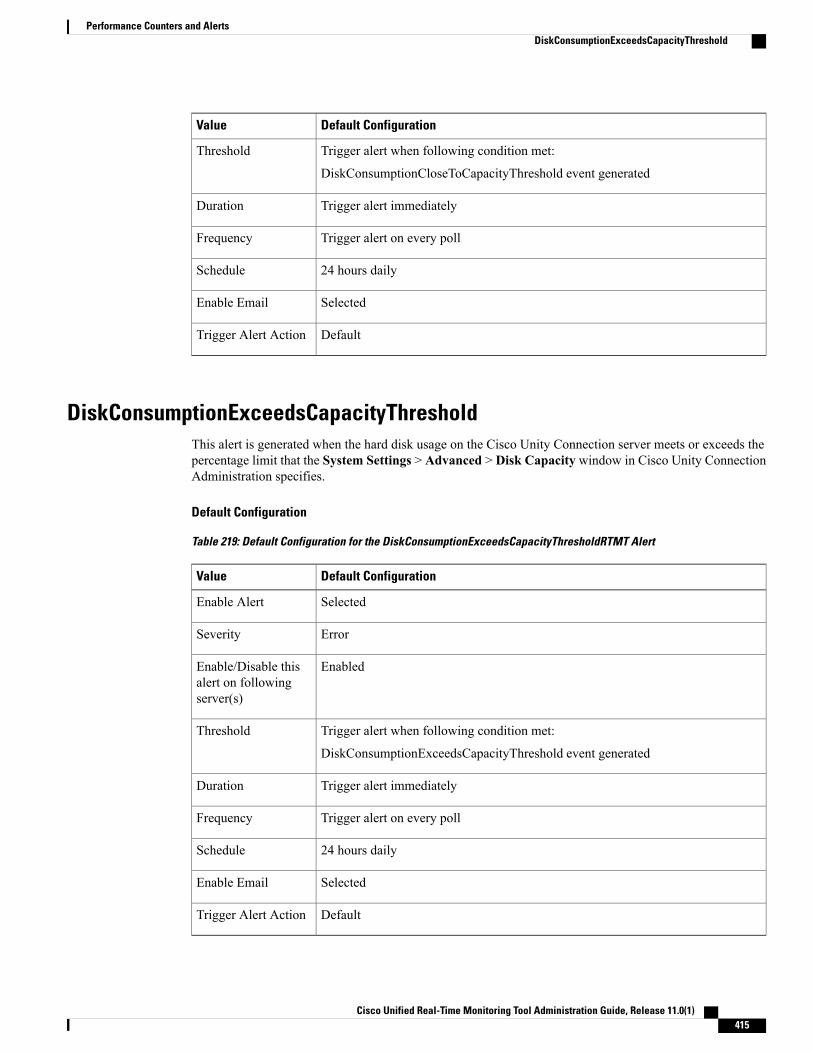
Default ConfigurationValue
Trigger alert when following condition met:
DiskConsumptionCloseToCapacityThreshold event generated
Threshold
Trigger alert immediatelyDuration
Trigger alert on every pollFrequency
24 hours dailySchedule
SelectedEnable Email
DefaultTrigger Alert Action
DiskConsumptionExceedsCapacityThresholdThis alert is generated when the hard disk usage on the Cisco Unity Connection server meets or exceeds thepercentage limit that the System Settings > Advanced > Disk Capacity window in Cisco Unity ConnectionAdministration specifies.
Default Configuration
Table 219: Default Configuration for the DiskConsumptionExceedsCapacityThresholdRTMT Alert
Default ConfigurationValue
SelectedEnable Alert
ErrorSeverity
EnabledEnable/Disable thisalert on followingserver(s)
Trigger alert when following condition met:
DiskConsumptionExceedsCapacityThreshold event generated
Threshold
Trigger alert immediatelyDuration
Trigger alert on every pollFrequency
24 hours dailySchedule
SelectedEnable Email
DefaultTrigger Alert Action
Cisco Unified Real-Time Monitoring Tool Administration Guide, Release 11.0(1) 415
Performance Counters and AlertsDiskConsumptionExceedsCapacityThreshold

LicenseExpirationWarningCisco Unity Connection licenses several features, including users and ports. The system enforces these licenses.If a customer uses a time-limited license to sample a feature, this license includes an expiration date. Beforethe license expiration date is reached, the system sends a message, and this alert occurs. The log indicateshow many days remain until the license expires.
Default Configuration
Table 220: Default Configuration for the LicenseExpirationWarning RTMT Alert
Default ConfigurationValue
SelectedEnable Alert
CriticalSeverity
EnabledEnable/Disable thisalert on followingserver(s)
Trigger alert when following condition met:
LicenseExpirationWarning event generated
Threshold
Trigger alert immediatelyDuration
Trigger alert on every pollFrequency
24 hours dailySchedule
SelectedEnable Email
DefaultTrigger Alert Action
LicenseExpiredCisco Unity Connection licenses several features, including users and ports. The system enforces these licenses.If a customer uses a time-limited license to sample a feature, this license includes an expiration date. Whenthe license expiration date is reached, the license becomes invalid, and this alert occurs.
Cisco Unified Real-Time Monitoring Tool Administration Guide, Release 11.0(1)416
Performance Counters and AlertsLicenseExpirationWarning

Default Configuration
Table 221: Default Configuration for the LicenseExpired RTMT Alert
Default ConfigurationValue
SelectedEnable Alert
InformationalSeverity
EnabledEnable/Disable thisalert on followingserver(s)
Trigger alert when following condition met:
LicenseExpired event generated
Threshold
Trigger alert immediatelyDuration
Trigger alert on every pollFrequency
24 hours dailySchedule
SelectedEnable Email
DefaultTrigger Alert Action
Cisco Unified Real-Time Monitoring Tool Administration Guide, Release 11.0(1) 417
Performance Counters and AlertsLicenseExpired

Cisco Unified Real-Time Monitoring Tool Administration Guide, Release 11.0(1)418
Performance Counters and AlertsLicenseExpired